ethnicity and the swing vote in africa’s emerging ... gitobu imanyara meru major ccu odm 12/5/2012...
TRANSCRIPT

Ethnicity and the Swing Vote in Africa’s Emerging
Democracies: Evidence from Kenya
Online Appendix
1
1. Survey Measures and Variable Definitions Initial Attitudes and Beliefs (Figure 1): Feel close to party: “Do you feel close to any particular political party?” If yes: “Which party is that?” Undecided: “If the election were between only Raila Odinga and Uhuru Kenyatta, which candidate would you vote for?” Coded as 1 for respondent who said “Don’t Know.” Disparity between candidates: “How well do you think each of the following candidates would represent the interest of your ethnic group if elected: very well, somewhat well, not well, or not at all?” Models of Preference Change (Table 2): Vote choice: “If the election were between only Raila Odinga and Uhuru Kenyatta, which candidate would you vote for?” Mixed parentage: Constructed from questions that asked about the ethnic identity of respondents’ mother and father. Spouse from different ethnic group: Constructed by asking whether respondents were married, and if so, the ethnicity of their spouse. Non-co-ethnics in network: Constructed by first asking respondents to list up to four individuals with whom they discuss politics (“Is there anyone you talk with about politics and elections?”) and then asking about the ethnicity of each individual mentioned. This measure is a count ranging from 0 to 4 of the number of non-co-ethnics mentioned. Non-co-ethnics in EA sample: Constructed as the share of non-co-ethnic respondents in each respondent’s sample cluster. Political interest: “How much interest do you have in politics: a lot, some, a little, or very little?” Education: “What is the highest level of education you have completed?” Radio news consumption: “During a typical week, how many days do you listen to the radio?” Newspaper consumption: “How many days do you read a newspaper?” TV news consumption: “How many days do you watch TV?”

2
Vernacular radio source: To create this variable, the round 1 survey recorded the name of the radio station from which respondents obtained radio news most frequently. All stations were coded as either primarily English/Swahili or vernacular by a Kenyan research assistant. Among the 73 stations mentioned, we were unable to find information on 11. Wealth: Measured by an asset index constructed using principal components analysis based on a series of seven questions that asked about household ownership of the following items: radio, television, bicycle, motorcycle, car, fridge, computer. Age: “How old are you?” Female: Recorded by interviewers. Days between interviews: constructed as the number of days between the round 1 and round 2 interviews. Additional Variables in Models of Direction of Change (Table 3 and Figure 2): Beliefs about Kenyatta and Odinga’s ethnic intentions: Constructed from questions on both surveys that asked, “How well do you think each of the following candidates would represent the interests of your ethnic group if elected: very well, somewhat well, not well, or not at all?” Changes in beliefs about each candidate are defined as the round 2 response minus the round 1 answer. Overall evaluation of Kenyatta and Odinga: Constructed from questions on both surveys that asked, “For each of the following politicians, please tell me whether you like the candidate very much, like him somewhat, neither like him nor dislike him, dislike him somewhat, or dislike him very much.” Changes in beliefs about each candidate are defined as the round 2 response minus the round 1 answer. Additional Variables in Tests of Alternative Explanations: Campaign exposure:
Ø Contacted in home: “Has a candidate or agent of any political party come to your home since the campaigns began?” If yes, “Which party or parties have come to your home?”
Ø Received SMS: “Have you received text messages encouraging you to vote for any particular party?” If yes, “For which party or parties did the messages encourage you to vote?”
Ø Offered money: “Since the beginning of the campaigns, how many times has a candidate or someone from a political party offered you or someone in this household money or a gift in return for you vote?” If >0, “Which party or parties have offered money or gifts?” [Up to three mentions].

3
Ø Attended rally: “Have you attended any campaign rallies since the campaigns began?” If yes, “Which parties’ rallies have you attended?
Fear of social reprisal / fear of violence: The survey first asked, “Thinking about the upcoming presidential election, which candidate do you think most people in this area support?” To probe perceptions about social reprisal, it then asked, “Now imagine that you voted against [INSERT NAME]. How afraid would you be that others would exclude you from social gatherings like wedding and funerals because of your vote?” To probe fear of violent retribution, it asked, “If others in the area knew that you voted against [INSERT NAME], how afraid would you be that others would attack or harm you because of your vote?” Additional Variables in Robustness Tests: Beliefs about Mudavadi’s ethnic intentions: Constructed from questions on both surveys that asked, “How well do you think each of the following candidates would represent the interests of your ethnic group if elected: very well, somewhat well, not well, or not at all?” Overall evaluation of Mudavadi: Constructed from questions on both surveys that asked, “For each of the following politicians, please tell me whether you like the candidate very much, like him somewhat, neither like him nor dislike him, dislike him somewhat, or dislike him very much.”

4
2. Attrition Weights
All analysis employs weights to reduce bias stemming from attrition between
survey rounds. Following Fitzgerald, Gottschalk, and Moffitt (1998), I estimated inverse
propensity weights (IPW) using a three-step procedure.
The first step was to identify factors that predict attrition. Feedback from the local
survey company that conducted the interviews suggested that a primary source of attrition
was variability in the quality of the seven teams (one per province) that conducted the
second-round interviews. I therefore included province dummies. I also explored three
other types of variable. First, I explored the individual-level covariates used in the models
of preference change (measured in the first round): ethnicity dummies; whether
respondents had a different spouse or partner; the diversity of social networks; the
diversity of enumeration areas; political interest; education; the frequency of obtaining
news from radio, newspapers, and TV; age; and gender. Second, I included measures of
initial electoral preferences with dummy variables for Kenyatta supporters, Odinga
supporters, those who were undecided between the two major candidates in the first
round, and whether respondents reported feeling close to any party. Third, I included
first-round variables that indicated a respondent might be disinclined to participate in a
follow-up survey and/or might be difficult to reach. These included whether the
respondent had a phone, the distance of his/her dwelling from the nearest major road,
whether he/she was married, whether he/she was unemployed, and dummies for whether
the interviewer rated the respondent as hostile, bored, or impatient during the first
interview. I used bivariate logit models to test whether each of these 42 factors was
significantly related to attrition, and retained all variables with a p-value less than .2.

5
Second, I estimated a logit model of attrition that included the 22 variables identified in
the first step and generated predicted attrition probabilities for all respondents. Finally, I
created inverse propensity weights by taking the inverse of 1 minus the predicted
probability of attrition.
6
3. Additional Descriptive Statistics
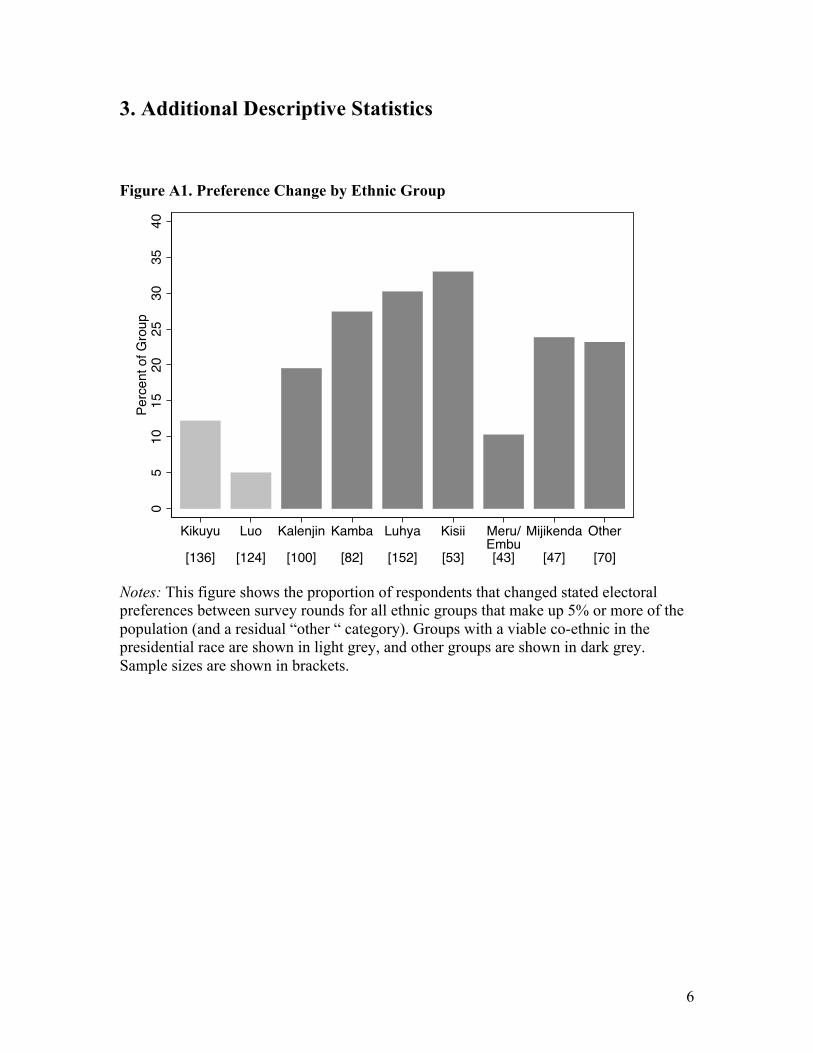
Figure A1. Preference Change by Ethnic Group
Notes: This figure shows the proportion of respondents that changed stated electoral preferences between survey rounds for all ethnic groups that make up 5% or more of the population (and a residual “other “ category). Groups with a viable co-ethnic in the presidential race are shown in light grey, and other groups are shown in dark grey. Sample sizes are shown in brackets.
05
1015
2025
3035
40Pe
rcen
t of G
roup
Kikuyu
[136]
Luo
[124]
Kalenjin
[100]
Kamba
[82]
Luhya
[152]
Kisii
[53]
Meru/Embu[43]
Mijikenda
[47]
Other
[70]
7
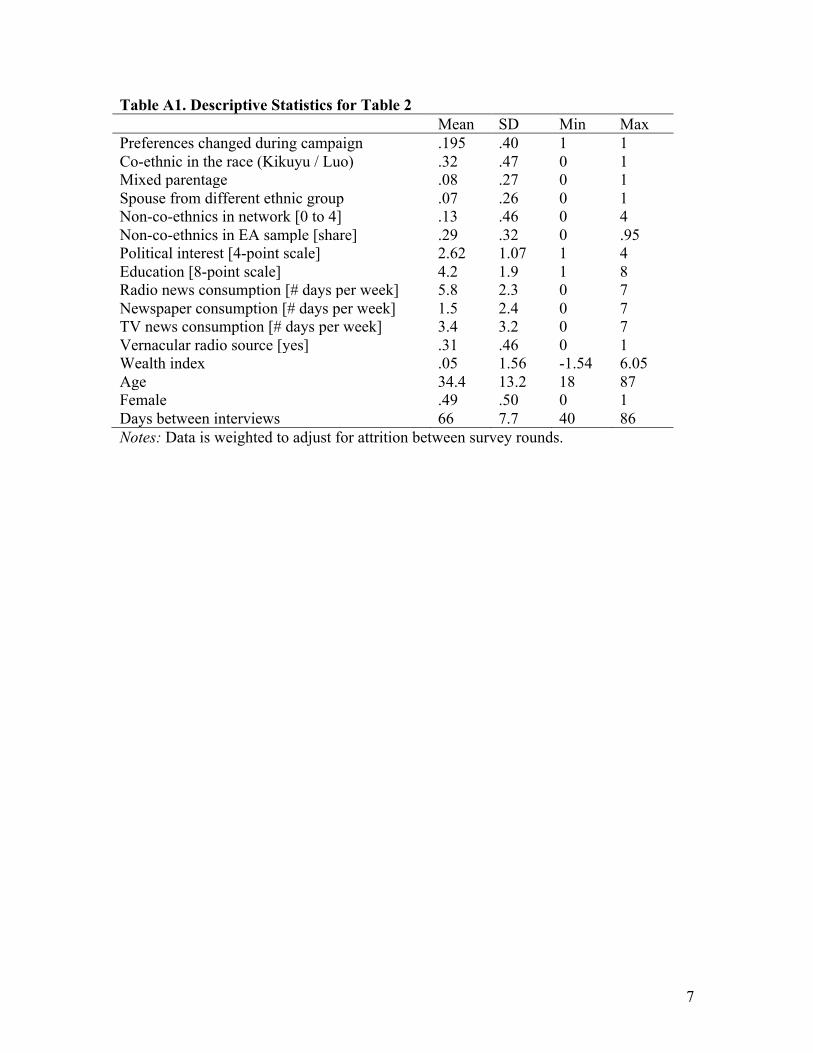
Table A1. Descriptive Statistics for Table 2 Mean SD Min Max Preferences changed during campaign .195 .40 1 1 Co-ethnic in the race (Kikuyu / Luo) .32 .47 0 1 Mixed parentage .08 .27 0 1 Spouse from different ethnic group .07 .26 0 1 Non-co-ethnics in network [0 to 4] .13 .46 0 4 Non-co-ethnics in EA sample [share] .29 .32 0 .95 Political interest [4-point scale] 2.62 1.07 1 4 Education [8-point scale] 4.2 1.9 1 8 Radio news consumption [# days per week] 5.8 2.3 0 7 Newspaper consumption [# days per week] 1.5 2.4 0 7 TV news consumption [# days per week] 3.4 3.2 0 7 Vernacular radio source [yes] .31 .46 0 1 Wealth index .05 1.56 -1.54 6.05 Age 34.4 13.2 18 87 Female .49 .50 0 1 Days between interviews 66 7.7 40 86 Notes: Data is weighted to adjust for attrition between survey rounds.

8
4. Alternative Explanations 4.1 Party Switching Table A2. List of Party Switchers Date Name Ethnic
group Prominence Former
party New party
11/21/2012 Beatrice Kones Kalenjin Minor ODM URP 11/21/2012 Alex Mbui Muiru Meru Minor PNU URP 11/31/2012 James Nyoro Kikuyu Minor TNA GNU 12/1/2012 Wilfred Machage Kuria Major DP ODM 12/2/2012 James Rotich Kalenjin Minor ODM URP 12/2/2012 Kiptum Binott Kalenjin Minor ODM URP 12/4/2012 Gitobu Imanyara Meru Major CCU ODM 12/5/2012 Alexander Ngeno Kalenjin Minor URP Kanu 12/5/2012 Emmanuel Imana Turkana Minor ODM Kanu 12/6/2012 Bishop Godfrey
Shiundu Luhya Minor New Ford-K ODM
12/6/2012 Bishop Robert Makona Luhya Minor New Ford-K ODM 12/6/2012 Bishop Maurice Maelo Luhya Minor New Ford-K ODM 12/10/2012 Charity Ngilu Kamba Major Cord Jubilee 12/13/2012 Daniel Karaba Kikuyu Minor Narc-K TNA 12/15/2012 Joseph Nyagah Kikuyu Major ODM TNA 12/18/2012 Zachary Ogongo Kisii Minor Narc ODM 12/18/2012 Robert Masese Kisii Minor Narc ODM 12/18/2012 Jackson Mjagi Meru Minor PNU ODM 12/22/2012 Aden Sugow Somali Minor TNA ODM 12/26/2012 Chachu Ganya Gabra Minor N/A URP 12/26/2012 Jeremiah Kioni Kikuyu Minor N/A UDF 12/26/2012 Soita Shitanda Luhya Major N/A UDF 12/26/2012 George Khaniri Luhya Minor N/A UDF 12/26/2012 Yusuf Chanzu Luhya Minor N/A UDF 12/26/2012 Justus Kizito Luhya Minor N/A UDF 12/26/2012 Samuel Poghisio Maasai Major N/A URP 12/26/2012 Gideon Konchellah Maasai Major N/A URP 12/26/2012 Chirau Mwakwere Mijikenda Major N/A URP 12/26/2012 Aden Duale Somali Major N/A URP 12/26/2012 Kanzungu Kambi Taita Major N/A URP 12/26/2012 Ekwe Ethuro (MP) Turkana Major N/A URP 12/30/2012 David Koros Kalenjin Minor ODM URP 12/30/2012 Cyrus Jirongo Luhya Major Pambazuka
alliance Cord
1/1/2013 Njagi Kumantha Embu Minor Democratic TNA

9
Party 1/1/2013 Martin Nyaga
Wambora Embu Minor APK TNA
1/1/2013 Sylvester Gakumu Embu Minor TNA Narc-Kenya 1/8/2013 Peter ole Mositet Maasai Minor ODM TNA 1/9/2013 Catherine Wanjiku
Irungu Luhya Minor TNA Mazingira Green
Party 1/15/2013 Nderitu Mureithi Kikuyu Minor PNU UDF 1/15/2013 George Nyamweya Kisii Minor PNU UDF 1/15/2013 Stanley Livondo Luhya Minor PNU UDF 1/17/2013 Simon Lilan Kalenjin Minor ODM Wiper 1/17/2013 Laban Matelong Kalenjin Minor ODM Wiper 1/17/2013 Hassan Omar Sarai Somali Minor ODM Wiper 1/18/2013 Geoffrey Muturi Embu Minor TNA APK 1/19/2013 John Mututho Kikuyu Major TNA Narc 1/20/2013 Peter Ondieki Kisii Minor ODM PDM 1/20/2013 Mwakwazi Mtongolo Taita Minor ODM Wiper 1/21/2013 Hellen Sambili Kalenjin Minor URP Kanu 1/22/2013 Callen Orwaru Kisii Minor TNA The Independent
Party 1/22/2013 Alfrida Gisairo Kisii Minor ODM Federal Party of
Kenya 1/22/2013 Mary Orwenyo Kisii Minor ODM Progressive Party
of Kenya 1/23/2013 Moses Changwony Kalenjin Minor URP Kanu 1/23/2013 Mark Chesegon Kalenjin Minor URP Kanu 1/23/2013 Irene Masit Kalenjin Minor URP Kanu 1/23/2013 Tabitha Seii Kalenjin Major ODM Wiper 1/24/2013 Mutua Katuku Kamba Minor Wiper CCU 1/26/2013 Adipo Akuome Luo Minor ODM Wiper 1/26/2013 Polynce Ochieng Luo Minor ODM Wiper 1/27/2013 Manyala Keya Luhya Minor UDF New Ford-K 1/27/2013 Soita Shitanda Luhya Major UDF New Ford-K 1/27/2013 George Munji Luhya Minor UDF Kanu 1/27/2013 John Shimaka Luhya Minor UDF Wiper 1/27/2013 Jared Okello Luo Minor N/A Ford-K 1/27/2013 Badi Twalib Swahili Minor ODM Wiper 2/4/2013 Zachary Obado Luo Minor ODM PDP

10
Table A3. Party Switching by Ethnicity
Major Minor Total
Kikuyu 2 4 6 Luo 0 4 4 Kalenjin 1 11 12 Kamba 1 1 2 Luhya 3 11 14 Kisii 0 7 7 Meru/Embu 1 6 7 Mijikenda 1 0 1 Other 6 7 13 TOTAL 15 51 66 Figure A2. Party Switchers and Preference Change
Kikuyu
Luo
Kalenjin
Kamba
Luhya
Kisii
Meru/Embu
Mijikenda
05
1015
2025
3035
40Pr
efer
ence
Cha
nge
(Per
cent
of G
roup
)
0 5 10 15Number of Party Switchers

11
Table A4. Logit Models of Preference Change – Accounting for Mudavadi’s Departure from Jubilee (1) (2) (3) Co-ethnic candidate in race -0.89** -0.94** -0.90** (0.00) (0.00) (0.00) Overall evaluation of Mudavadi 0.03 (0.79) Beliefs about Mudavadi’s ethnic intentions 0.14 (0.24) Luhya respondents excluded Yes No No Controls from Table 2 Yes Yes Yes Observations 583 660 696 Pseudo R-squared 0.08 0.08 0.08 Notes: Data is weighed to account for attrition. p-value in parentheses; ** p<0.01, * p<0.05, + p<0.1

12
4.2 Campaign Exposure Table A5. Campaign Exposure (percentages) (1)
Groups with a
co-ethnic in the race
(2) Groups without
a co-ethnic in the race
Difference (1-2)
Contacted by Cord 7.7 4.7 2.9 Contacted by Jubilee 3.5 3.1 0.4 Received Cord SMS 4.4 0.5 3.9** Received Jubilee SMS 3.4 0.9 2.4* Offered money by Cord 7.8 5.0 2.8 Offered money by Jubilee 3.4 2.7 0.7 Attended Cord rally 24.9 23.1 1.8 Attended Jubilee rally 16.4 20.4 -4.0
Notes: Data is weighed to account for attrition. *p<.05; **p<.01

13
4.3 Social Sanction Table A6. Perceived Threat of Social Sanction (1)
Groups with a
coethnic in the race
(2) Groups without
a coethnic
in the race
Difference (1-2)
Fear of social reprisal (four-point scale) 1.91 1.76 0.15 Fear of violence (four-point scale) 1.79 1.72 0.07
Notes: Data is weighed to account for attrition. *p<.05; **p<.01
14
5. Robustness tests
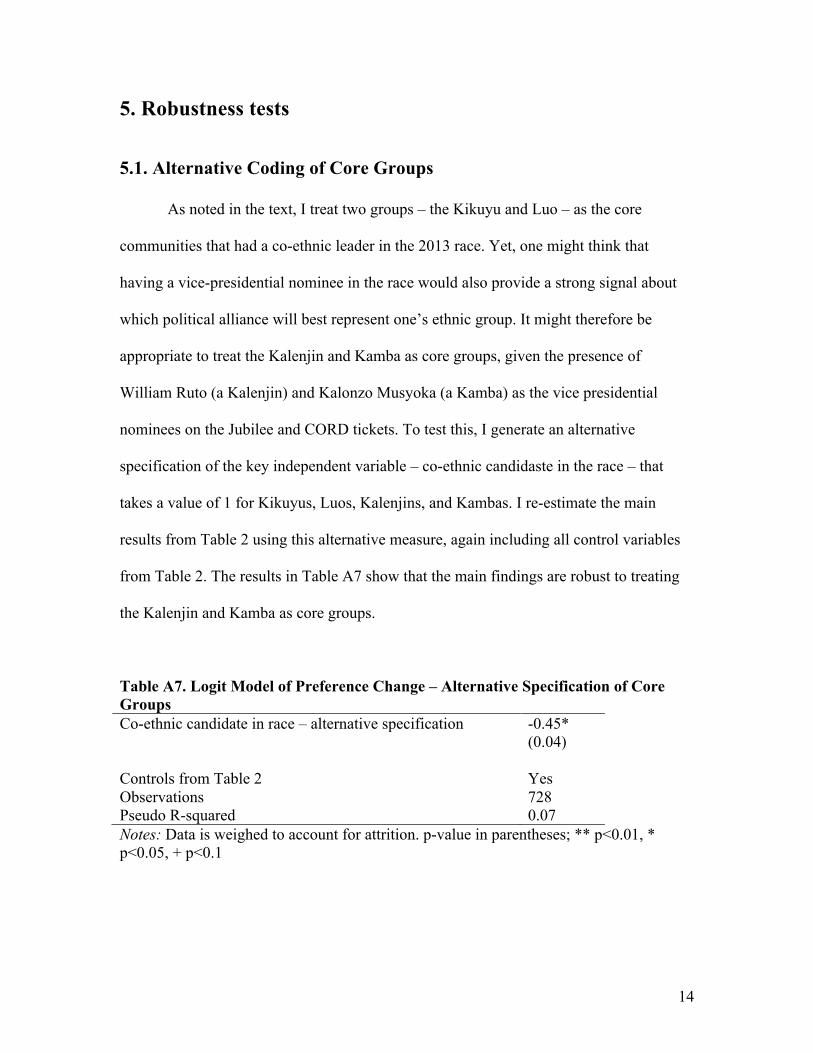
5.1. Alternative Coding of Core Groups
As noted in the text, I treat two groups – the Kikuyu and Luo – as the core
communities that had a co-ethnic leader in the 2013 race. Yet, one might think that
having a vice-presidential nominee in the race would also provide a strong signal about
which political alliance will best represent one’s ethnic group. It might therefore be
appropriate to treat the Kalenjin and Kamba as core groups, given the presence of
William Ruto (a Kalenjin) and Kalonzo Musyoka (a Kamba) as the vice presidential
nominees on the Jubilee and CORD tickets. To test this, I generate an alternative
specification of the key independent variable – co-ethnic candidaste in the race – that
takes a value of 1 for Kikuyus, Luos, Kalenjins, and Kambas. I re-estimate the main
results from Table 2 using this alternative measure, again including all control variables
from Table 2. The results in Table A7 show that the main findings are robust to treating
the Kalenjin and Kamba as core groups.
Table A7. Logit Model of Preference Change – Alternative Specification of Core Groups Co-ethnic candidate in race – alternative specification -0.45* (0.04) Controls from Table 2 Yes Observations 728 Pseudo R-squared 0.07 Notes: Data is weighed to account for attrition. p-value in parentheses; ** p<0.01, * p<0.05, + p<0.1

15
5.2. Attrition
The data would be biased in favor of confirming the prediction that those without
a co-ethnic in the race will be more likely to change their preferences during the
campaign period if: 1) among core groups, those more likely to change their preferences
were more likely to drop out of the panel; 2) among swing groups, those more likely to
change their preferences were less likely to drop out; or both. The data suggest, however,
that attrition biased the sample in the opposite direction.
The best predictor of preference change (other than having a co-ethnic in the race)
identified in the analysis of preference change (Table 2) is political interest. However,
among those with a co-ethnic in the race, attrition was substantially higher for the more
politically interested while being nearly identical among those without a co-ethnic in the
race. Among those with a co-ethnic in the race, the attrition rate was 40.8% for those
more interested in politics and 26.8% for those less interested. For those without a co-
ethnic in the race, the attrition rates were 32.4% and 33.1% among those with more and
less political interest.
Second, the results showed that respondents who primarily obtained news from
vernacular radio stations were less likely to update their preferences. However,
vernacular listeners were slightly more likely to drop out among those with a co-ethnic in
the race, and slightly less likely to drop out among those without a co-ethnic, biasing
against the main hypothesis. Among those with a co-ethnic in the race, the attrition rate
among vernacular listeners was 35.9% compared to 33.5% for others. Among those
without a co-ethnic in the race, the dropout rate for vernacular listeners was 31.0%
compared to 33.3% for others.

16
Finally, as noted, all analysis is weighted to adjust for attrition on observables
following Fitzgerald, Gottschalk, and Moffitt (1998).

17
5.3. Interviewer Effects Could the observed patterns of preference change be driven by interviewer
effects? This would be a particular concern if many respondents were interviewed by a
co-ethnic in one round and a non-co-ethnic in the other round. Another concern is that
probability of being interviewed by a non-co-ethnic in one or both rounds could be higher
for members of “swing” groups, accounting for the increase in preference change relative
to “core” groups.
Table A8 provides details on interviewer-respondent co-ethnic matching. The
table shows that in both rounds, the share of respondents interviewed by non-co-ethnic
enumerator was similar across groups that did and did not have a co-ethnic in the race. I
also re-estimate the main logit model of preference change from Table 2 including
dummy variables for respondents who were interviewed by non-co-ethnics in round 1 and
round 2. I also include an interaction term, which accounts for respondents who were
interviewed by a non-co-ethnic in one round and a co-ethnic in the other (the inclusion of
the interaction terms means that the coefficients for each of the dummy variables for
round 1 and round 2 represent the effect of having been interviewed by a non-co-ethnic in
that round and a co-ethnic in the other round). Caution should be exercised in interpreting
the results because interviewer ethnicity was not randomly assigned, and the interviewer
ethnicity variables could be confounded by other factors (for example, members of some
groups were more likely to be interviewed by non-co-ethnics than members of others).
Nonetheless, the results in Table A9 show that the main finding is robust to the inclusion
of interviewer effects.

18
Table A8. Interviewer-Respondent Ethnicity Match (percentages) (1)
Groups without a coethnic in the race
(2) Groups with a coethnic in the race
Diff. (1-2)
p-value
Non-co-ethnic interviewer, round 1 59.0 55.7 3.3 .39 Non-co-ethnic interviewer, round 2 61.1 54.3 6.7 .08 Non-co-ethnic interviewer in both rounds
52.6 48.9 3.7 .35
Notes: Data is weighed to account for attrition. Table A9. Logit Model of Preference Change Co-ethnic in the race -0.98** (0.00) Non-co-interviewer in round 1 (NCO_r1) -0.41 (0.37) Non-co-interviewer in round 2 (NCO_r2) -1.62* (0.03) NCO_r1 * NCO_r2 2.05* (0.02) Controls from Table 2 Yes Observations 728 Pseudo R-squared 0.09 Notes: Data is weighed to account for attrition. p-values in parentheses; ** p<0.01, * p<0.05, + p<0.1

19
6. Aggregate Gains and Losses
Table A10 provides details on aggregate movement by ethnic group across the
campaign period for all communities that make up 5% or more of the population (these
groups collectively account for roughly 86% of the Kenyan population). Though the
small group samples mean that most of the observed changes are not statistically
significant, the data suggests that with only one exception (the Kisii) each candidate
gained support (or held steady) with groups in which the candidate was the more popular
choice at the start of the race. Kenyatta’s support among co-ethnic Kikuyus rose by
approximately 5.2% and by a similar margin (4.8%) among the co-ethnic group of his
Kalenjin running mate, Ruto. These gains strengthened Jubilee’s position as a “Kikuyu-
Kalenjin” alliance that drew nearly-universal support from these two core communities.
Kenyatta also increased vote share among Meru/Embu voters (+7.4%), a group closely
aligned to the Kikuyu. Likewise, Odinga’s support remained high among co-ethnic Luos,
nearly all of whom expressed an intention to support Odinga at the start of the race, and
increased among voters from the Kamba (+5.9) ethnic group of his running mate,
Musyoka, further cementing CORD as a “Luo-Kamba” coalition. Odinga also increased
vote share among the Luhya (+21.4) and Mikikenda (+8.3) – groups that favored Odinga
at the start of the race. In sum, these aggregate movements served to increase the extent
of ethnic bloc voting. One plausible explanation for these trends is that the ethnic identity
of the key leaders at the top of the ticket is important not only in shaping voters’ initial
preferences at the start of the race but also affects the success of parties’ effort at
persuasion during the campaign.

20
Table A10. Aggregate Gains/Loses by Ethnic Group Kenyatta Odinga Don’t know R1 R2 Diff. R1 R2 Diff. R1 R2 Diff.
Kikuyu 88.9 94.1 +5.2+ 8.2 5.1 -3.1 2.9 0.8 -2.1 Meru/Embu 83.5 91.0 +7.4 15.2 6.3 -8.9 1.3 2.7 +1.4 Kalenjin 81.5 86.2 +4.8 10.6 11.6 +1.0 7.9 2.2 -5.8* Kisii 24.7 30.8 +6.1 64.9 67.6 +2.7 10.4 1.6 -8.8* Kamba 18.0 15.1 -2.9 76.6 82.5 +5.9 5.5 2.4 -3.0 Luhya 12.0 9.8 -2.2 64.5 85.9 +21.4** 23.5 4.4 -19.1** Mijikenda 10.0 4.5 -5.5 78.3 86.7 +8.3 11.7 8.8 -2.9 Luo 2.7 2.3 -0.4 94.5 94.6 +0.1 2.7 3.1 +0.3 Other 40.3 44.5 +4.2 52.4 54.3 +1.9 7.3 1.2 -6.1* TOTAL 44.0 46.7 +2.8 47.6 50.7 +3.1 8.4 2.6 -5.8**
Notes: Groups are ordered by strength of support for Kenyatta in Round 1. Round 2 figures are weighted to account for attrition. ** p<0.01, * p<0.05, + p<0.1