ethno-scientific teaching hiwatig
TRANSCRIPT

Ethno-Scientific Teaching Hiwatig
2
Ethno-Scientific Teaching Hiwatig
3
Ethno-Scientific Teaching Approach,
Student Proficiency, and Attitude Toward Science
and Ethnic Culture
April Daphne F. Hiwatig University of the Philippines Integrated School
University of the Philippines, Diliman
Abstract
This study aimed to determine the effect of ethno-scientific teaching approach on first
year high school students’ learning in science. Such approach was applied to a class
of 40 students while the conventional teaching approach was used in another class of
40 students. The results indicated that students from ethno-scientific and conventional
teaching groups did not differ in their performance in science proficiency test. It was
found that the students’ attitude towards science, ethnic culture, and their proficiency
in science were significantly and positively correlated. This study is intended to make
teaching in multicultural communities more effective and meaningful. Aside from
getting the students to develop a positive attitude toward science and ethnic culture,
the infusion of aspects of the practices, beliefs, and artifacts of various cultures in
teaching science concepts is expected to help improve students’ proficiency in the
subject.
Keywords: science attitudes, proficiency in science, ethnic culture 1
Ethnic diversity is a social reality here and abroad (Hettne, 1993). “Ethnicity” has been
used in various contexts to mean culture, economic and political strategy, or social relation.
For Abuso (1981), one of the common conceptions of ethnicity is that it is an identity
phenomenon. As an identity, ethnicity is tied to distinctive traditions or cultural heritage such
as language, regional/geographical location, and religion (Abuso, 1981). He emphasized that
the purpose of identity definition is to structure interaction.
For a country with plural societies and no particular ethnicity like the Philippines,
ethnicity is also known as a form of collectivism (Reyes-Boquiren, 2003). To have mutual
Correspondence should be sent to April Daphne Hiwatig. Email: [email protected]
EDUCATION QUARTERLY, December 2008, Vol. 66 (1), 3-21
U.P. College of Education

Ethno-Scientific Teaching Hiwatig
4
respect for other group identities and to celebrate diversity are believed to be noble ends.
Reyes-Boquiren (2003) said that the common aspect of a group’s ethnicity may be based on
their cultural heritage such as language and geographical location—not biological or physical
differences. It may thus be said that a positive attitude toward one’s own ethnic culture and
respect for other peoples’ cultural identities form the real concept of ethnicity. This is the
same notion celebrated by e pluribus unum, which promotes a society of diverse people bound
by common democratic values (Carreon, 2003).
Research shows that ethnicity is among the most powerful predictors of proficiency in
learning (McDougall, 2003). To tell whether students are becoming more and more proficient
in school, one must know whether they can successfully accomplish class tasks, if given all
the instructional demands (Tikunoff, 1985). With regard to achieving science proficiency,
UNESCO (1991) encouraged that demands in instruction be geared toward understanding
other peoples’ cultures. Science instruction should also focus on global concerns and in
helping students increase their concept understanding and science process skills. This may be
manifested in their habits of cooperation and teamwork.
Concerning ethnicity and student proficiency, several researchers found that the former
affects the latter (IAEP, 1992; NAEP, 1994; IAEEA, 2000; and APA, 2005). In an
international study on science proficiency, the highest-performing 13-year-old pupils came
from Taiwan, Korea, and Switzerland (IAEP, 1992). Studies conducted by NAEP (1994),
IAEEA (2000), and APA (2005) reported that white students performed better than
Asian/Pacific Islanders, Hispanic, and black students. On the other hand, Neathery (1997) said
that ethnicity might not be a predictor of proficiency in science; even minorities performed
with as much success as non-minorities in the science subtests of the Science Research
Associates standardized achievement test for grades four to 11.
In the Philippines, the results of the study conducted by Carreon (2003) showed that
students from a private school in Isabela who were exposed to Multicultural Physics Teaching
Approach (MPTA) and Non-Multicultural Physics Teaching Approach (NMTA) have
comparable mean scores in the concept understanding test after the treatment. Peralta (2000)
suggested that recent times saw structural changes that influenced gradual gravitation toward
cultural convergence; this may be a possible explanation for the findings of Carreon’s study.
Thus, Carreon (2003) and Neathery (1997) had similar findings about the relationship between
ethnicity and science proficiency.
In 2006, Sabo-O emphasized that attitude towards learning is greatly influenced by
sound methodology, procedures, and techniques that reflect one’s personal experiences and
interests. These factors make learning more meaningful and relevant to students. The National
Science Education Standards of the Unites States likewise supports this view on motivation
and learning (NSES, 1999). Locally, the Culture-Responsive Curriculum for Indigenous
People (CCIP) responded by developing and implementing the Third Elementary Education
Project (TEEO). This project emphasized that curriculum should be indigenized; learning
should relate to the comprehension of the local environment and culture (CCIP, 2002).
Ethno-Scientific Teaching Hiwatig
5
Neathery (1997) reported that, using multiple correlations, science proficiency
correlates with attitude toward science. On the other hand, Penwell (2004), Neathery (1997),
and Carreon (1993) concluded that ethnicity is not an indicator of attitudes toward science
since their studies showed that minorities and non-minorities had comparable ratings. It is
therefore implied that the students had neither positive attitude change, which was associated
with motivated behavior, nor negative attitude change which was linked to less motivation as
stated by Berg (2005).
The consolidation of the perspectives mentioned about ethnicity and science proficiency
and ethnicity and attitudes toward science led to the conceptualization of this study. This
work sought to test whether science proficiency, attitude toward science, and attitude toward
ethnic culture are correlated, since no studies have mentioned the correlations that might exist
among these variables.
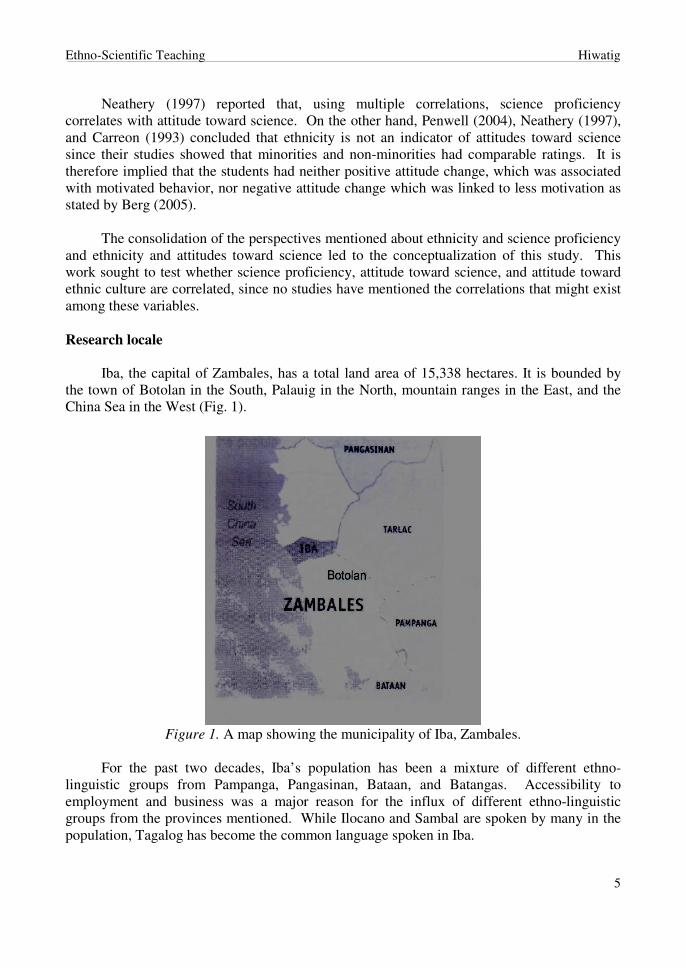
Research locale
Iba, the capital of Zambales, has a total land area of 15,338 hectares. It is bounded by
the town of Botolan in the South, Palauig in the North, mountain ranges in the East, and the
China Sea in the West (Fig. 1).
Figure 1. A map showing the municipality of Iba, Zambales.
For the past two decades, Iba’s population has been a mixture of different ethno-
linguistic groups from Pampanga, Pangasinan, Bataan, and Batangas. Accessibility to
employment and business was a major reason for the influx of different ethno-linguistic
groups from the provinces mentioned. While Ilocano and Sambal are spoken by many in the
population, Tagalog has become the common language spoken in Iba.

Ethno-Scientific Teaching Hiwatig
6
Participants
Two freshmen classes from the Zambales National, both composed of 40 students, were
involved in this study. The students, predominantly female in both classes, were between 11
and 13 years old. One class was randomly selected and exposed to ethno-scientific teaching
approach; the other was taught using the conventional way of teaching science or the non-
ethno-scientific teaching approach. Both classes had the same science teacher. Students from
the ethno-scientific class were organized into groups based on their ethno-linguistic
background (Fig. 2).
Figure 2. Percentage composition of the ethno-scientific class.
Figure 2 shows that students were more or less distributed equally to the following
ethno-linguistic groups: Sambal, Tagalog, Tagalog-Sambal A, Tagalog-Sambal B, Mixed A,
and Mixed B. Seven Sambal students were classified as the Sambal group; seven were named
as the Tagalog group. Those who identified themselves as Tagalog-Sambals were divided into
two groups. Three Ilocano-Tagalog-Sambal students were assigned to Mixed A together with
an Ilocano-Sambal, and two Ilocano students. Two Tagalog students, together with two
Sambals, an Ilocano-Tagalog, a Tagalaog-Sambal-Kapampangan, and a Sambal-Bulakeño
were assigned to Mixed B.
The average grade of the students in science during the first quarter was also considered
when assigning student groupings for both the ethno-scientific class and the conventional
class. The latter was composed of 40 students, 26 females and 14 males. The ethno-scientific
class also had 23 females and 17 males. The conventional class or the control group, with 40

Ethno-Scientific Teaching Hiwatig
7
students, 26 females and 14 males, was also divided into their respective groups according to
their average in science in the previous quarter. The conventional class had 5 males and 16
males under the age 13. On the other hand, in the ethno-scientific class, there were more
females than males in the age-group between 11 and 12. However, there was an equal
distribution of males and females at age 13.
Instruments
Four instruments were used in the study: (1) ethnicity survey-inventory; (2) science
proficiency test; (3) attitude scale toward science; and (4) attitude scale toward ethnic culture.
All of these researcher-made instruments were examined and validated by a panel of experts.
The instruments underwent revisions based on the panel members’ suggestions. Prior to the
experimentation phase, the instruments were pilot-tested on 41 freshmen from the special
science section of a school in the same locality. The students were also from various ethno-
linguistic groups. The internal reliability of the science proficiency test and the attitudinal
scales were calculated using Cronbach alpha. After establishing a relatively high reliability,
the instruments were used as the pretests and posttests in the study.
Ethnicity survey-inventory. This researcher-made survey-inventory has two parts. The
first part of the instrument consisted of three items and was used to determine the ethno-
linguistic group of the students and their parents. The second part of the instrument, which
included a sample answer after the pilot-test, surveyed the ethnic practices and beliefs of the
students in terms of preparation and cooking of food, planting, fishing, celebrating festivals,
health care and personal hygiene, care for the environment, animal reproduction, and pest-
control. The responses of the students were arranged according to their ethno-linguistic
groups and were used as database of ethnic culture.
Science proficiency test. The purpose of this test is to assess student proficiency in
terms of understanding and applying concepts as well as the processing skills required in
general science. The distracters in the test items are the common misconceptions of general
science students. The test consisted of 30 multiple-choice items and covered the following
topics: Natural Phenomenon (1 item); Properties, Classification, and Composition of Matter (3
items); Physical and Chemical Changes (3 items); Energy in Changes (2 items); Highly
Organized Structure of Living Things (9 items); Interactions Between Living Things and
Their Environment (5 items); Cycling of Matter (4 items); and Balance of an Ecosystem (3
items). The Cronbach alpha reliability of the test was 0.736.
Attitude scale toward science. A Likert-type instrument consisting of 20 items was a
40-item test prior to validation. The items in this instrument considered the factors that affect
learning as compiled by Pintrich and as mentioned in the study of Berg (2005). Each item was
rated based on this five-point scale: 5 for strongly agree (SA); 4 for agree (A); 3 for undecided
(U); 2 for disagree (D); and 1 for strongly disagree (SD). However, scoring was reversed for
negatively constructed statements. The obtained reliability coefficient (Cronbach alpha) of the
test was 0.814.

Ethno-Scientific Teaching Hiwatig
8
Attitude scale toward ethnic culture. A Likert-type instrument consisting of 20 items
originally drawn from a 40-item test was used to measure the attitude of students toward their
ethnic culture. The test was deemed appropriate by the researcher to represent ethnicity, as
described by Reyes-Boquiren (2003). Reyes-Boquiren (2003) mentioned that ethnicity is
ultimately the sense of having mutual respect for other identities or communalism, living, and
celebrating diversity organically.
The questionnaire covered the common features of attitude toward ethnic culture such as
sense of belonging, sense of achievement, appreciation of ethnic practices, beliefs, and
artifacts. Each item was rated based on this five-point scale: 5 for strongly agree (SA); 4 for
agree (A); 3 for undecided (U); 2 for disagree (D); and 1 for strongly disagree (SD).
However, scoring was reversed for negatively constructed statements. The obtained reliability
coefficient (Cronbach alpha) of the test was 0.805, which means that the instrument accurately
measured the attitude of the students toward their ethnic culture.
Teaching approaches
The ethno-scientific class and the conventional class were taught the same topics for the
second quarter. The content of evaluation materials was parallel in both classes. The medium
of instruction was English. Both classes were taught consecutively for 75 minutes, five times
each week, for eight weeks. The time spent in each class, which was 16 % of each school day,
was the time allotted for a special science class in one grading period of a regular academic
year. The treatment, which was conducted in each class for 40 meetings, was implemented in
the presence of the cooperating science teacher.
Each class was divided into six groups. The ethno-scientific class was divided based on
two factors: the students’ ethno-linguistic groups and their average grade in science from the
previous quarter. The latter was the sole basis for the groupings in the conventional class.
Each group was asked to create its own name and to elect a leader, an assistant leader, a
secretary, a runner or keeper of materials, a timer, and a monitor. Each was also given points
for every trivia question answered correctly, for complete materials brought for
activities/experiments, and for tasks accomplished correctly.
A. Ethno-scientific teaching approach
The implementation of the ethno-scientific teaching approach was based on the
recommendations for teaching science of the CCIP (2002) and the Science for All movement
(UNESCO, 1991) which are: (1) the content, language, symbols, designs, and purpose of the
curriculum should be linked to day-to-day experiences and goals of the children; (2) theory
should be linked to practice, human purpose, the quality of life, and in-school experience to
out-of-school experience; and (3) teaching and learning should begin from the beliefs,
interests, and learning skills that students bring to the classroom and should help each of them
extend and revise their ability and understanding.

Ethno-Scientific Teaching Hiwatig
9
The approach included strategies gathered by the researcher through survey,
observation, and interview to implement cooperation among ethno-linguistic groups, relevance
to ethnic culture, and sensitivity to the learning needs of each ethno-linguistic group. To foster
cooperation within an ethno-linguistic group, respect toward contributions of each member
was encouraged. It lessened the problem of low student motivation under usual classroom
situations. Experience showed that more adept members of the group often become motivated
to tutor the less able students. For instance, during one weekend, each group was asked to
observe an organism in any of the following areas near their chosen locality: bay, river, pond,
grassland, rice field, and/or forest. This is for an activity about the characteristics of living
things. The data obtained were checked by the leader and the assistant leader. The secretary
wrote the report on Manila paper, and the runner and monitor reported the output to the class.
To develop respect to other ethno-linguistic groups, other members of the class were
encouraged to ask questions and share relevant information regarding the output of the
reporter. To ensure the relevance of the lessons to the ethnic culture of the students, aspects
like beliefs, practices, and artifacts/objects were integrated. For example, the sample output
below (Table 1) included the organism’s local names, the delicacies their ethno-linguistic
groups made out of it, and some other beliefs. The topic was about the characteristics of
living things.
Table 1
Sample output from the ethno-scientific lass (Activity: It’s Alive!)
Seahorse
Tagalog: Kabayong-dagat
Sambal: Kabayong-ambay
Characteristics How it happens?
Growth Usually, it grows up to 5 inches
Development Egg > baby seahorse > mature seahorse (adult)
Adaptation It is well adapted to marine environment
Response to stimuli It is naturally afraid of crabs, which are its predators. Storms can tear it from
its holding place and cast it ashore until it dies of exhaustion
Reproduction
A female seahorse lays her eggs in a pouch on the belly of a male seahorse.
The male seahorse carries the eggs until they hatch and are ready to leave his
pouch.
*Trivia There are some Sambals who include dried seahorses in their native delicacy
Sinigang.
The ethno-scientific teaching approach also practiced sensitivity to the learning needs of
the ethno-linguistic groups, which were collected through the survey given to the class. In
school, more members of each ethno-linguistic group preferred group activities to individual
ones, written to oral tests, games to making written report of experiments, and laboratory
activities to lectures.

Ethno-Scientific Teaching Hiwatig
10
B. Conventional teaching approach
The conventional class was different from the ethno-scientific class because the aspects
of ethnic culture were never integrated in the lessons and activities. Conventional strategies
such as lectures, discussions, take-home worksheets, and science activities used by the school
in teaching science to first-year students were applied to the class. Table 2 shows the
comparison between the ethno-scientific and conventional activities. Highlighted are the
activities that involved aspects of the students’ ethnic culture.
Table 2
Comparison of ethno-scientific and conventional activities Topics Ethno-scientific activities Conventional activities
Natural phenomena
concept mapping on lanum/danum;
learning stations; creative output related to
ethnic practices; discussion; quiz
concept mapping on water;
learning stations; creative output;
discussion; quiz
Substances and mixtures
inside our ethnic kitchen (listing 5 artifacts
and 5 delicacies of each ethno-linguistic
group); kitch-ethno-mics (preparing ethnic
substances and mixtures); discussion; quiz
inside our kitchen; food party;
discussion; quiz
Physical and chemical
changes
magic tricks; learning station 1: Rosel
leaves (alas-dose plant as used by the
mixed group) and dried Kamias fruit
(Sambal group); 2: wooden displays; 3:
bagoong isda (Tagalog-Sambal group); 4:
window blinds made by aetas (Mixed
group); charades of ethnic practices;
discussion; quiz
magic tricks; learning stations on
everyday changes; charades on
everyday changes; discussion;
quiz
Energy involved in
changes
discussion using tables that summarize
ethnic practices; duiz discussion; quiz
Characteristics of living
things
Biag ni Lam-ang (Life of Lam-ang); It’s
Alive! (observation of an organism in their
community); drawing of characteristics of
ethnic plant and/or animal; discussion;
quiz
concept mapping; table
completion; reporting a plant/and
or an animal and its
characteristics; drawing
characteristics of a living thing;
discussion; quiz
Cells
analogy about the parts of a cell using the
people and establishments in Zambales;
plates of animal and plant cells;
discussion; quiz
identification of parts; research
work; plates of animal and plant
cells; discussion; quiz
Ecological systems
ethno-henyo (ethno-genius; memory game
which included ethnic species discussed in
the lesson on characteristics of living
things); bio-ethno-rama (diaroma
depicting ecosystems, food chains, and
food webs in Zambales); discussion; quiz
diorama; identifying food chains
and food webs in each diaroma;
discussion; quiz
Maintaining balance in an
ecosystem (follow-up
lesson of ecological
systems)
making a newspaper showcasing the
diverse ethnic culture of their ethno-
linguistic group and how their practices
and beliefs contribute to the balance in the
different ecological systems in their
province; discussion; quiz
slogan making; discussion; quiz

Ethno-Scientific Teaching Hiwatig
11
Results and discussion
Science proficiency
Prior to the treatment, the mean pretest scores obtained by both classes were
comparable. Before instruction, the ethno-scientific class had higher proficiency in science, as
indicated by the mean pretest score of 61% in the science proficiency test. The conventional
class obtained a lower mean pretest score of 59%.
The mean posttest score obtained (p=0.123) by the ethno-scientific class in the science
proficiency test was higher at 77% than that of the conventional class (74%). This implies that
the results of the science proficiency test of both classes were comparable after the treatment
(Table 3).
Table 3
Comparison of mean posttest scores in the science proficiency test
Class Number of
cases Mean* SD t-value
Significance
level (one-
tailed)
Ethno-
scientific
Conventional
40
23.00 (77%)
22.10 (74%)
3.623
3.264
1.167
.123
40
Note. Perfect score = 30; percent mean score in parentheses
An important factor that would explain the results would be the nature of classes
involved in the study. Both classes belonged to the special sciences classes. The students
were asked to study well and to strive to have good grades in science regardless of the
approaches implemented in their classes.
A comparison of both classes’ performance per item (Table 4) indicates that the ethno-
scientific class and the conventional class significantly differed in terms of their proficiency in
the science posttest in four out of six items. The highlighted items show where the ethno-
scientific class had a higher mean score than the conventional class.

Ethno-Scientific Teaching Hiwatig
12
Table 4
Items in the science proficiency posttest where the means of the ethno-scientific class and the
conventional class significantly differ
Item
number Topic/Concept
Ethno-scientific
class mean
score
Conventional
class mean score
Significance level
(one-tailed)
5
Physical and chemical
changes (identifying the
type of change taking place
in the situation)
.75 .93 .017
10
Characteristics of living
things (inferring the
characteristics of living
things exemplified in the
situation/diagram)
.68 .10 .0000
16
Parts of a cell (identifying
which parts of a cell
perform the function)
.53 .73 .033
20
Ecological systems
(inferring the
environment where the
species can be found)
1.0 .88 .0105
22
Ecological systems
(inferring the role/type of
organism shown in the
diagram)
.83 .55 .004
24
Cycling of matter
(inferring the fate of
carbon compounds)
.98 .88 .046
Students in the ethno-scientific scored higher than the conventional class in an item on
living things. The class learned the characteristics of living things by reporting to the class
about an ethnic plant or animal near their vicinity and by making illustrations that show how
their selected plant or animal species grows, develops, responds to stimuli, reproduces, and
adapts to its environment. The report included: (1) picture of actual species; (2) ethno-
linguistic name for selected species; (3) information on species’ growth, development,
response to stimuli, reproduce, and adaptation to their environment; and (4) importance of
species to certain ethno-linguistic groups.
Another topic where the ethno-scientific class scored higher than the conventional class
was on ecological systems (2 items). During the instructional phase, each group in the ethno-
scientific class was asked to identify the organisms found in the area assigned to them.
Afterwards, they were asked to take pictures of an ecosystem which may be a pond, river,
grassland, rice field, beach, or forest.
After this, each group constructed a bio-ethno-rama (a diorama) showing the ecosystem.
The students were also asked to put arrows using yarns or construction paper to show inter-

Ethno-Scientific Teaching Hiwatig
13
specific relationships in terms of food chains and food webs. According to the students,
although the activity was hard, they were able to see more closely how organisms were
intricately related. This might give an insight why the ethno-scientific class scored higher
than the conventional class in an item on ecological interactions.
The ethno-scientific class also scored higher than the conventional class in an item on
cycling of matter. The information on the bio-ethno-rama was used in their reporting and
discussion.
In this regard, it can be stated that, on a general note, the ethno-scientific teaching
approach had no positive effect on the science proficiency of students from both classes.
However, it had succeeded in improving the proficiency of the ethno-scientific class about the
characteristics of living things, how organisms interact with abiotic factors in ecological
systems, and how some abiotic factors are used again in the cycling of matter.
Being able to observe actual objects and/or artifacts of their culture in their actual
settings and using them in their activities could have significantly improved the concepts of
students on ecology.
The conventional class had higher significant mean posttest scores on items where they
were asked to identify the type of change being exemplified in the situation and the part of the
cell being described. It was revealed in the survey of learning needs, as well as in the
interview that there were students who were unable to adjust to the strategies implemented in
their class, like infusing ethnic practices to physical and chemical changes and using the
“Zambales’ analogy” to discuss the parts and functions of a cell. This is because they prefer
to use the methods that are already common to them (e.g. take home written activities that
would require the students to derive answers from the reference book).
Attitude toward science
The mean pretest ratings of both classes were comparable prior to the treatment. Before
instruction, both classes had a very positive attitude toward science as indicated by mean
attitude rating of 75.95 (76%) for the ethno-scientific class and 75.80 (76%) for the
conventional class.
After the treatment, the ethno-scientific class had a significantly (p=0.031) higher
positive mean rating in their attitude toward science (83.35 or 83%) than the conventional
class (79.55 or 80%). This is shown in Table 5.

Ethno-Scientific Teaching Hiwatig
14
Table 5
Comparison of mean posttest scores in the attitude scale toward science
Class Number of
cases Mean SD t-value
Significance
level (one-
tailed)
Ethno-scientific
Conventional
40
83.35 (83%)
79.55 (80%)
8.347
9.559
1.894
.031
40
Note. Perfect score = 20; percent mean score in parentheses
A comparison of the ratings of both classes per item (Table 6) revealed that there were
items where the ethno-scientific class and the conventional class significantly differ in terms
of their mean posttest attitude ratings in the attitude scale toward science.
Table 6
Items in the attitude scale toward science posttest in which the means of the ethno-scientific
class and the conventional class significantly differ
The table shows that the ethno-scientific class had higher mean posttest ratings in all six
items. Since the statements were negatively stated, the scoring for each item was reversed.
The ethno-scientific teaching approach significantly affected the attitude of students
toward science. It also succeeded in helping the students in the ethno-scientific class realize
that: 1) They can be good in science; 2) They can pass science tests; 3) Their teacher believes
they are highly capable of getting high scores in science; 4) Science is relevant to their future
Item
number Item
Ethno-scientific
class mean score
Conventional
class mean score
Significance level
(one-tailed)
2
I am not the type of
student who can be good
in science.
3.40 2.93 .02
4 I always think that I will
fail in my science tests. 4.05 3.65 .047
13
My teacher believes that I
cannot get a high score in
science.
4.05 3.55 .018
14 I have not been good in
science. 4.18 3.83 .036
16
I will not be able to use
any of the concepts I
learn in science in order
to find a better job in the
future.
4.65 4.15 .0015
17
I always do leisure
activities before I do
science tasks at home.
4.18 3.80 .0385

Ethno-Scientific Teaching Hiwatig
15
job-related undertakings; and, more importantly 5) Prioritizing science-related tasks at home is
an important indicator of being highly and positively inclined to science.
It can be stated that the ethno-scientific students were motivated in terms of internal
factors (expectancy, affective, and value components) of motivation as summarized by the
Pintrich model in the study of Berg (2005). Internal factors refer to beliefs and emotions that
are assumed to mediate between the nature (the reward system of the tasks) and the behavior
of the student. Furthermore, the expectancy component under the internal factors of
motivation is about attributions (item 13). The affective component refers to self worth or
confidence (item 2 and 4) and test anxiety (item 14) that a student feels during a learning task.
Item 16, which indicates being able to see that there are science concepts relevant to
future job-related undertakings, falls under the value component of the internal factors of
motivation where interests or intrinsic and extrinsic goals of students lie. In addition, evidence
in motivated behavior of students in the ethno-scientific class is also presented in item 17.
This is the choice-behavior factor, one of the three indicators in motivated behavior of
students (Berg, 2005).
Attitude toward ethnic culture
The mean attitude ratings of both classes toward ethnic culture were not comparable
prior to the treatment. A One-way Analysis of Variance (ANOVA), with pretest as a covariate,
showed no significant difference in the mean posttest ratings of the two classes.
Before instruction, both classes had a very positive attitude toward their ethnic culture,
as indicated by the mean attitude rating of 74.48 (78%) for the conventional class and 83.05
(83%) for the ethno-scientific class.
The mean posttest attitude ratings toward ethnic culture (Table 7) indicate that the
ethno-scientific class (84.55 or 85%) had a significantly (p=0.033) more positive attitude
toward their ethnic culture than the conventional class (81.15 03 81%).
Table 7
Comparison of mean posttest scores in the attitude scale toward ethnic culture
Class Number of
cases Mean SD t-value
Significance
level (one-
tailed)
Ethno-scientific
Conventional
40
84.55 (85%)
81.15 (81%)
7.394
8.836
1.866
.033
40
Note. Perfect score = 20; percent mean score in parentheses

Ethno-Scientific Teaching Hiwatig
16
A comparison of the both classes’ ratings per item (Table 8) revealed that there were six
items in which the ethno-scientific class and the conventional class significantly differed in
terms of their posttest attitude ratings in the attitude scale toward ethnic culture.
Table 8
Items in the attitude scale toward ethnic culture posttest in which the means of the ethno-
scientific class and the conventional class significantly differ
Item
number Item
Ethno-
scientific class
mean score
Conventional
class mean score
Significance
level (one-tailed)
1
I cannot learn anything about
the beliefs of other ethno-
linguistic groups through
listening.
3.68 3.23 .025
4 Aetas/Ilocanos/Sambals/others
give up easily in their studies. 4.65 4.30 .0135
5 Aetas/Ilocanos/Sambals/others
are impatient learners. 4.63 4.23 .0145
9
This school does not give
importance to our ethno-
linguistic group’s culture.
4.45 4.05 .017
10
I cannot learn about the
feelings of other ethno-
linguistic groups through
observing their actions.
3.73 3.30 .017
15
I do not feel happy whenever
the traditions, beliefs, and
practices of my group are
mentioned in the things we
study.
4.48 4.23 .0495
The ethno-scientific teaching approach significantly affected the attitude of students
toward their ethnic culture. It also succeeded in helping the students in the ethno-scientific
class realize that: 1) Their ethno-linguistic group is patient when it comes to studying and
learning new things; 2) Their school gives importance to their ethno-linguistic group’s
traditions; 3) They are capable of learning about the beliefs of other groups by listening; and
4) They are capable of learning the deep feelings of other groups by observing their actions.
More importantly, they feel happy whenever insights into their group’s culture are mentioned
in their studies.
Since the students in the ethno-scientific class believed that the school is giving
importance to their traditions (item 9), the expectancy component of the internal factor of
motivation has improved. The students’ ratings in the contextual factors, which normally
influence students’ motivation, also improved. Even though the task would give them
opportunities to listen or observe other group’s traditions and deep feelings, they strongly
believed that they could still cope with the challenge of the activity (items 1 and 10). Judging
from the result of the significance of item 15, which assessed the affective component of the

Ethno-Scientific Teaching Hiwatig
17
internal factor of motivation, it can be noted that the students in the ethno-scientific class felt
happy and proud whenever their ethnic culture became part of the learning process.
Most importantly, it can be stated that the students in the ethno-scientific class were
highly motivated in terms of their level of activity and involvement (motivated behavior factor
in student motivation) as mentioned by Berg (2005), because they opted to participate and to
be patient while learning (items 4 and 5).
Correlation between variables
Table 9 indicates positive and significant relationships between attitude toward ethnic
culture and attitude toward science, and between attitude toward science and science
proficiency. Highlighted items show relationships between variables that were found to be
significant.
Table 9
Summary of correlations of the posttest proficiency scores and attitude ratings toward science
and ethnic culture
Correlations Pearson Significance (one-tailed)*
Attitude toward ethnic culture
and science proficiency -.029 .401
Attitude toward ethnic culture
and attitude toward science .415 .000
Attitude toward science and
science proficiency .364 .000
Note. Correlation is significant at 0.01 level.
The result of the study was similar to that of Neathery (1997), which stated that
ethnicity did not affect the proficiency of students in the science test.
Several factors could give insights into the result mentioned above. One factor could be
that the subject (science) itself is inherently neutral in terms of cultural differences (Kitano
and Morey, 1997 and Carreon, 2003). Another factor could be that the municipality where
most students reside is already highly urbanized. The effects of the structural changes are
apparent. These changes, as Peralta (2000) mentioned, indicated gravitation toward cultural
convergence. For instance, the types of architecture and clothing that were distinct to their
ethnic culture were no longer distinguishable. It could also be a factor that the language used
in class discussions was mostly English while Tagalog was the most common language
spoken by students after classes. Thus, keen ethnic competition was not observed. Last factor
could be that both classes were special science sections and, therefore, students were expected
to be proficient in science.
The study of Neathery (1997) and Penwell (2004) on ethnicity and attitude toward
science revealed non-significance between these variables. The results of the study indicate a
significantly positive correlation between these variables. Their sense of respect toward other
ethnic cultures, as well as their sense of communalism, or ethnicity (Reyes-Boquiren, 2003),

Ethno-Scientific Teaching Hiwatig
18
would improve as their ethno-linguistic group’s beliefs, practices, and artifacts are integrated
to science concepts, or vice versa.
Perhaps, the activities implemented, which infused the ethnic culture of students were
effective in helping the students develop positive attitude toward science. However, during
the experimentation phase, there were some students who were not highly aware of their own
ethnic practices and beliefs; others could not appreciate the ethnic culture of their classmates.
Thus, reactions of students in class discussions varied from amazement to ridicule. In
addition, majority of the students in both classes were 12 year olds. This age is the critical
stage in the formation of stereotyped information and biased views regarding ethnicity and
ethno-linguistic groups (Chinen and Tucker, 2005). A Tagalog student, who obtained the
lowest rating in the attitude scale toward science and the attitude scale toward ethnic culture
said that, “Ayoko ‘yun ‘pag tumatawa ‘yung mga kaklase ko sa ibang shini-share
(ibinabahagi) ng mga kaklase ko tungkol sa ethnic culture ng iba (I do not find it amusing
how my classmates would laugh about some aspects of the ethnic cultures being shared to the
class).”
Like the recent researches of NSES (1999), the results of the study also showed that
science proficiency significantly and positively correlated with attitude toward science.
According to Eagly and Chaiken (1993), thoughts are stored when positive attitudes are
developed toward a stimulus. In addition, they mentioned that these thoughts are then
regarded as cognitive structures, which as a result, organize prior knowledge and facilitate
higher order thinking skills and information processing. These statements may help elucidate
why the ethno-scientific class became proficient in science as well.
Conclusions and recommendations
The following findings were established after the treatment. (1) There is no significance
difference between the mean posttest scores in the science proficiency test of the ethno-
scientific class and the conventional class. (2) There were four out of six items in which the
ethno-scientific class and the conventional class significantly differed in terms of their
proficiency in the science posttest. (3) The ethno-scientific class had higher mean ratings in
the attitude scales toward science than the conventional class. (4) The ethno-scientific class
scored higher than the conventional class on all six items where the two classes significantly
differ in their attitude toward science. (5) The ethno-scientific class had higher mean ratings in
the attitude scale toward ethnic culture than the conventional class. (6) The ethno-scientific
class scored higher than the conventional class on all six items where the two classes
significantly differ in their attitude toward science. (7) The relationship between attitude
toward science and attitude toward ethnic culture are significantly and positively correlated.
And (8) the relationship between attitude toward science and science proficiency were also
found to be significantly and positively correlated.
The following conclusions were drawn from the findings of the study. First, the ethno-
scientific class and the conventional class were comparable in the science proficiency test
since their mean scores did not significantly differ from that of the conventional class. Second,

Ethno-Scientific Teaching Hiwatig
19
the ethno-scientific class’ mean scores on topics about the characteristics of living things, how
organisms interact with abiotic factors in ecological systems, and how some abiotic factors are
used again in the cycling of matter had significantly improved. Third, the ethno-scientific class
developed a higher positive attitude toward science than the conventional class after the
treatment. Fourth, the ethno-scientific teaching approach had succeeded in helping the
students in the ethno-scientific class realize that they can be good in science, they can pass
science tests, their teacher believes that they are highly capable of getting high scores in
science, and science is relevant to their future job-related undertakings. More importantly,
prioritizing science-related tasks at home, which is an important indicator of being highly and
positively inclined in science, was also realized by most students in the ethno-scientific class.
Fifth, the ethno-scientific teaching approach had significantly and positively affected the
attitude of students toward their ethnic culture. Sixth, it also had succeeded in helping the
students in the ethno-scientific class realize that: their ethno-linguistic group has a virtue on
being patient when it comes to studying and learning new things, their school gives
importance to their ethno-linguistic group’s traditions, they are capable of learning about the
beliefs of other groups by listening, they are capable of learning the deep feelings of other
groups by observing their actions. More importantly, the ethno-scientific teaching approach
made them feel happy whenever insights about group’s culture are mentioned in their studies.
Seventh, the positive and significant correlation between attitude toward ethnic culture and
attitude toward science reveals that the students felt positively inclined toward science as they
realize that their ethnic culture can be relevant in learning concepts. Eight, the positive and
significant correlation between attitude toward science and science proficiency of students
show that positive inclination toward science helped improved their proficiency in science.
Because the students became motivated in learning science after the treatment, their scores in
the science proficiency test got better.
Based on the findings and conclusions of the study, the following recommendations are
given:
1. Conduct the study in a regular class, which may not be as science-proficient as the
samples in the study. The nature of the class was considered as an important factor
why students in both classes were comparable in the science proficiency test. Since
the ethno-scientific class and the conventional class belonged to special science
classes, they were intrinsically motivated to do well in the subject.
2. Increase the extent of students’ observation of aspects of ethnic culture in their
actual settings. For instance, being able to observe actual objects and/or artifacts of
culture in their actual settings and including them in science activities and
discussions could significantly improve the concepts of students on ecology. Not
only does the strategy make the students see the relevance of their culture in
learning, it could also help the students develop a positive inclination in science and
their ethnic culture.
3. Encourage the teachers to promote cultural sensitivity among students, especially
for unique ethnic practices, beliefs, and artifacts. In addition, age may pose as an

Ethno-Scientific Teaching Hiwatig
20
underlying factor for the development of biased views regarding ethnic culture.
Thus, teachers should set good examples and help students realize the essence of
ethnicity, which is being able to celebrate and live diversity by promoting positive
interactions among different ethno-linguistic groups.
4. Explore other variables like students’ participative competency and interactional
competency that may correlate with science proficiency, attitude toward science,
and/or attitude toward ethnic culture. The study of Tikunoff (1985) in teaching
English as a second language revealed that participative competency and
interactional competency are correlated. However, no studies are available in
science. In addition, the said competencies may also be correlated to science
proficiency, attitude toward science, and attitude toward ethnic culture.
References
Alternate proficiency assessment: Executive summary. (2005). NJ: APA Education Assessment.
Abuso, J. A. (1981). Symbolic strategies in the organization of ethnic study programs international and
development education. University of Pittsburgh, School of Education.
Berg, C. A. R. (2005). Factors related to observed attitude change toward learning chemistry among
university students. Chemistry Education Research and Practice – 2005, 6 (1), 1-18. Retrieved on
January 12, 2005, from http://www.rsc.org/Education/CERP/issues/2005_factors.asp.
Carreon, S.M. (2003). Effects of multicultural physics teaching approach on student concept
understanding and attitude toward physics. Unpublished master’s thesis, University of the
Phippines, Diliman, Quezon City.
Chinen, K. & Tucker, G. R. (2005). Heritage language development: Understanding the roles of ethnic
identity and Saturday school participation. Retrieved on August 23, 2005, from
http://[email protected].
Department of Education (Third Elementary Education Project, TEEP) and UP College of Education.
(2002). Culture-responsive curriculum for indigenous peoples (CCIP).
Eagly, A. A. & Chaiken, S. (1993). The Psychology of attitudes. New York: Harcourt Brace Jovanovich
College.
Hettne, B. (1996). Ethnicity and development: An elusive relationship. In Dwyer, D. & Drakakis-Smith,
D. (Eds.), Ethnicity and development geographical perspectives. England: John Wiley and Sons.
International Assessment of Educational Progress (IAEP). (1992). Learning Science. NJ: Educational
Testing Service.
International Association to the Evaluation of Educational Achievement (IAEAA). (2001). Benchmark
report on trends in mathematics and science study 1999. Boston: TIMSS & PIRLS International
Study Center, Lynch School of Education, Boston College.
McDougall, S. C. (2003). Review of making choices for multicultural education: Five approaches to
race, class, and gender by Sleeter, C. E. & Grant, C. A. Retrieved on November 5, 2003, from
http://edrev.asu.edu/reviews/rev237.
Morey, A. I. & Kitano, M. K. (Eds.). (1997). Multicultural course transformation in higher education:
A broader truth. MA: Allyn and Bacon.
National Assessment of Educational Progress (NAEP). (1994). Trends in academic progress. NJ:
Educational Testing Service.
National Science Education Standards (NSES). (1999). Washington, DC: National Academy Press.