etrgb tr may 2014 - rit-mcsl.org ·...
TRANSCRIPT

Technical Report
A New Encoding System for
Image Archiving of Cultural Heritage: ETRGB
Roy S. Berns and Maxim Derhak
May 2014

2
Executive Summary A recent analysis was performed to determine if any current encoding systems are appropriate for cultural heritage image archiving. For conventional absorbing and scattering materials, ProPhotoRGB, ProStarRGB, and Lab with 16-‐bit encoding all are appropriate. Once fluorescent and goniochromatic materials are included, none of the current systems are appropriate because all these systems are limited to a luminance factor of 1.0 (i.e., L* of 100) and colors produced using interference colorants may exceed these rendering gamuts. Accordingly, a new encoding system was developed with a maximum luminance factor of 2.0 (L* of 130). The primaries are the apices of the 1931 chromaticity diagram. The white point is illuminant D50. The new system is called ETRGB where E and T stand for “extended” and “tristimulus,” respectively. Using a dataset of glossy artist paints, ETRGB was found to be equivalent to ProPhotoRGB, ProStarRGB, and Lab for 16-‐bit encoding. For fluorescent and goniochromatic materials, ETRGB was superior. Thus, ETRGB has the advantages of extending the range of white-‐point normalized tristimulus values from 1.0 to 2.0 and without clipping when converted to RGB.
Introduction Artwork, such a paintings, can have a large range of colors depending on choice of colorants, working method, and the application of a picture varnish. The term “color gamut” is often used to define any range of colors, in particular when the colors are defined by colorimetry. (Any system that produces color can be defined by its color gamut.) A digital camera is a measurement device where, ideally, its signals can be converted to colorimetry with high precision and accuracy enabling the quantification of the artwork’s or coloration system’s color gamut. That is, the measurement device does not, in itself, have a color gamut; it measures the color gamut of coloration systems and colored artwork. Rather than encode images as floating-‐point CIE XYZ or CIE L*a*b* data, images are usually encoded in integer RGB where RGB can be transformed to XYZ with a known set of mathematical operations. Examples include sRGB, AdobeRGB(1998), ProPhotoRGB, ProStarRGB, and eciRGBv2. It is also possible to encode in Lab. The image data can be stored as either 8-‐ or 16-‐bit per channel per pixel. A recent computational experiment was performed1 to evaluate color-‐encoding accuracy, also called “color gamut rendering.”2 The main conclusion was that sRGB, AdobeRGB(1998), and eciRGBv2 all have an insufficient encoding space for conventional absorbing and scattering materials. Only ProPhotoRGB, ProStarRGB, and Lab were appropriate systems for archiving artwork. A set of fluorescent paints was also evaluated. Yellows and oranges could not be encoded accurately using ProPhotoRGB or ProStarRGB. One sample, a yellow, had an L* of 104; it could not be encoded accurately by any of the profiles, though it was very unusual to have any fluorescent material have an L* exceeding 100 (despite total radiance factors exceeding 200%). Metals have been used by artists since Egyptian times and are a part of many current artists’ palettes, though rather than beaten metals, they are produced in flake form 1 Berns, R.S., Camera Encoding Evaluation for Image Archiving of Cultural Heritage, POCS/MCSL technical report, May 2014. 2 Berns, R.S, Let’s call it “color gamut rendering,” Color Research and Application, 32, 334-‐335 (2007).

3
and dispersed in paint media. A distinguishing feature of metals is their color is revealed at specular angles. As such, their tristimulus values exceed white or medium-‐gray colors used to set camera exposure. The result is that colored highlights appear white. Goniochromatic materials change their color with illumination and viewing geometry. In cases where principles of interference are used to produce such materials, tristimulus values can also exceed white and the rendering gamuts of current “wide-‐gamut” encoding schemes. As artists continue to increase their palettes with materials that produce color beyond conventional absorption and scattering, these types of limitations will only increase. Accordingly, a new encoding system is required, one appropriate for today’s and tomorrow’s coloration materials. This technical report describes such an encoding system, ETRGB, where E and T represent, “extended,” and “tristimulus,” respectively.
Bit Depth The new encoding system is considered a “wide-‐gamut” system and accordingly, images should only be stored using 16 bits per channel.
RGB or Lab Encoding can be in either an RGB-‐ or Lab-‐type space. The advantage of RGB is its familiarity with imaging personnel. This becomes evident when visual editing. Image adjustments have a different outcome using Lab rather than RGB, demonstrated in Figure 1 using the brightness and contrast adjustments of Photoshop. For this reason, an RGB space was selected.
Figure 1. sRGB image (left), following a reduction of brightness and contrast (middle), and
converting image to Lab followed by a reduction of brightness and contrast (right).

4
RGB primaries Any RGB encoding system is defined, in part, by each channel’s chromaticities (i.e., x,y or u’,v’). Their definition can be based on display standards, e.g., eciRGB and sRGB, or more empirically, e.g., ProPhotoRGB and WideGamutRGB. In the past, one of the key considerations is minimizing the chromaticity area where values exceed some set of chromatic stimuli, usually determined and plotted in the x,y diagram, e.g., Figure 2. This figure is suggestive that AdobeRGB(1998) is sufficient for color printing, for example. Comparing AdobeRGB with a generic CMYK profile in CIELAB would be a better way to compare gamuts, e.g., Figure 3. In this case, dark colors of the CMYK gamut cannot be encoded without error. However, minimizing chromaticity area loses its relevancy once bit depth is defined at 16 bits. That is, the only criterion is insuring that all colors of interest are within the area defined by the primary chromaticities. The only primaries guaranteed to encompass all chromatic stimuli are the apices of the 1931 chromaticity diagram: (0,0), (0,1), (1,0), forming a right triangle. These primaries were selected for the new encoding system. The SMPTE arrived at the same conclusion in their 2006 standard for encoding digital cinema distribution masters.3
Figure 2. Color and color-‐rendering gamuts.
http://en.wikipedia.org/wiki/ProPhoto_RGB_color_space
3 SMPTE 428-‐1:2006, D-‐Cinema Distribution Master (DCDM) – Image Characteristics, Society of Motion Picture and Television Engineers (2006).

5
Figure 3. AdobeRGB(1998) (gray color) and generic CMYK (colored) plotted in CIELAB.
(ColorSync Utility used to generate plot.)
White Point This encoding system will be used for color management as an ICC profile. The ICC profile connection space (PCS) defines CIE Illuminant D50 and the 1931 standard observer as its white point. This white point was selected for the new encoding system. This leads to the following matrix converting from RGB to XYZ:
R G B White
X 0.964 0 0 0.964 Y 0 1 0 1 Z 0 0 0.825 0.825
Extending Input Range The input range for existing encoding systems is 0 – 1 where X/Xn, Y/Yn, and Z/Zn equal 1.0 (white-‐point normalization where subscript n indicates the tristimulus values used for the normalization). This limit is reasonable for most colors. However, metallics and goniochromatic colors can easily exceed this limit. It was decided to extend the range of white-‐point normalized tristimulus values from 1.0 to 2.0, the maximum encoding range for tristimulus values within ICC profiles. Thus the range is 0 to 65535.0/32786.0 (1.999969482421875).

6
Non-‐Linear Encoding Even with 16 bits, it is advantageous to encode data nonlinearly. For very dark colors, linear encoding can lead to quantization errors.4 One option is to use CIEDE2000 to develop a nonlinear function where there is equal color differences between each of the 65,536 values. However, the SL function of CIEDE2000 had the least consistent agreement between datasets used to develop CIEDE2000;5 thus this option was rejected. The CIE L* function is still the most reliable function relating luminance factor with lightness. Furthermore, its use is increasing for image encoding, e.g., ProStarRGB and eciRGBv2. Although a 2.4 gamma is similar to L*, L* is still a better fit by a factor of over five when comparing performance using the original visual data.6 Another advantage of L* is it’s explicit slope term for near-‐black colors. Although this was developed to avoid negative L* values, it also serves as a linear term to avoid an infinite slope at 0. Thus the L* function was selected. The L* constants of 116, 16, and 903.3, were rescaled such that normalized tristimulus data ranging from 0 to 2 would map to L* values of 0 to 100. The resulting constants are 89.13, 12.29, and 694.04 based on a scaling of 0.7683. 16-‐bit has an encoding range of 0 – 65,535. The scalar was further adjusted so that a luminance factor of 1.0 was as close as possible to an integer value before rounding (0.7683383). The numerical data are listed in Table I for normalized tristimulus data between 0 and 2. At 1.0 and 2.0, the 16-‐bit floating-‐point values are 50,353.05 and 65,534.92, both numbers quite close to integers and not a source of round-‐off error. Extending the range has a small effect compared with the usual range of 0 – 1. For a perfect reflecting diffuser (1.0), the encoding range is 77% of the full range. This corresponds to 15.6 bit encoding (2^15.62 – 1 = 50353.05).
4 Berns, R.S., Camera Encoding Evaluation for Image Archiving of Cultural Heritage, POCS/MCSL technical report, May 2014. 5 Melgosa, M., Huertas, R., Berns, R.S., Relative significance of the terms in the CIEDE2000 and CIE94 color-‐difference formulas, JOSA A, Vol. 21, Issue 12, pp. 2269-‐2275 (2004). 6 Berns, R.S. Unpublished data.

7
Table I. Non-‐linear encoding of normalized tristimulus values. Normalized tristimulus values
Encoding floating point 0-‐1
Encoding floating point 0-‐65535
Percentage of full range
0 0.00 0.00 0% 0.001 0.01 454.84 1% 0.01 0.07 4527.47 7% 0.1 0.29 19054.82 29% 0.2 0.40 26101.62 40% 0.3 0.47 31044.78 47% 0.4 0.53 34980.03 53% 0.5 0.58 38303.19 58% 0.6 0.63 41208.02 63% 0.7 0.67 43805.57 67% 0.8 0.70 46166.12 70% 0.9 0.74 48337.30 74% 1.0 0.77 50353.05 77% 1.1 0.80 52238.52 80% 1.2 0.82 54012.91 82% 1.3 0.85 55691.27 85% 1.4 0.87 57285.62 87% 1.5 0.90 58805.74 90% 1.6 0.92 60259.72 92% 1.7 0.94 61654.31 94% 1.8 0.96 62995.23 96% 1.9 0.98 64287.37 98% 2 1.00 65534.92 100%
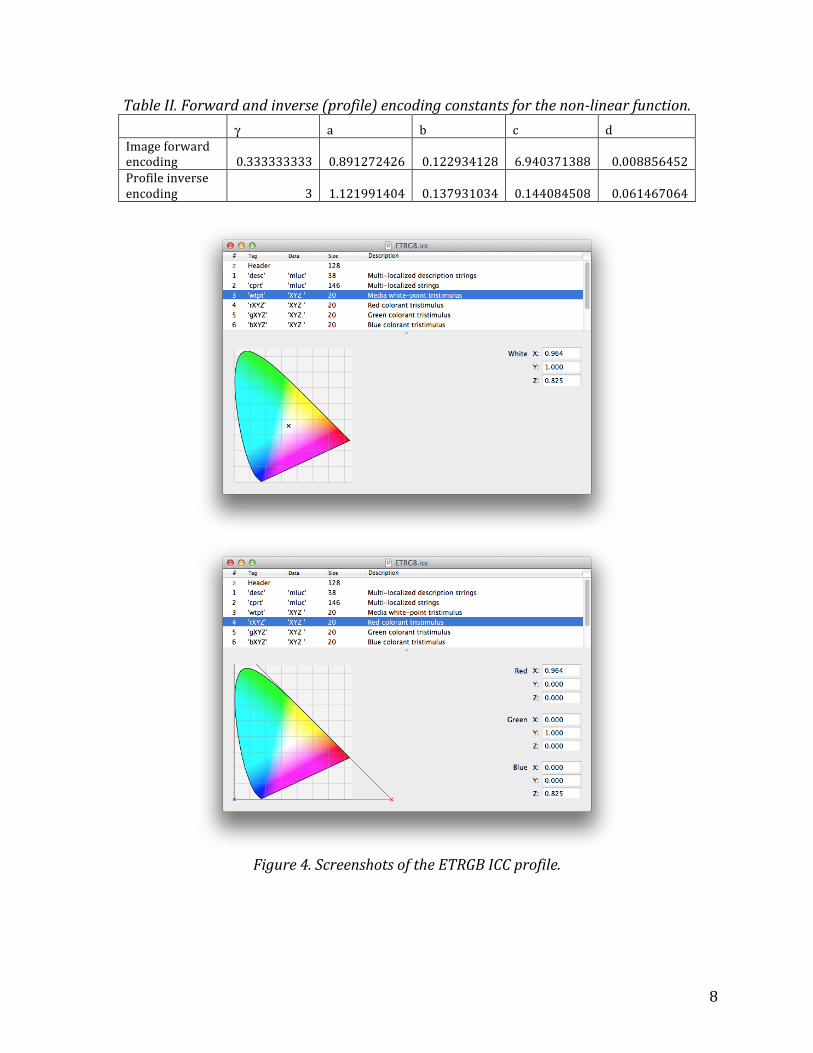
ETRGB This new encoding system is called ETRGB, where E refers to “extended” and T refers to “tristimulus.” Although this is a nonlinear encoding of XYZ tristimulus values, it remains an RGB-‐type color space from an imaging perspective. The forward and inverse encoding constants for the non-‐linear function are listed in Table II. A parametric curve was used rather than a 1,024 entry LUT to avoid quantization errors. The image encoding constants are the scaled (L*/100) function values. The inverse constants are the reciprocals of the forward encoding except for d (0.061467064). This value corresponds to the forward encoded value at an input of 0.00885. Screenshots of the ICC version 4 profile are shown in Figure 4. The constants were rounded to four places past the decimal point. The same non-‐linear function is used for all three channels.
8
Table II. Forward and inverse (profile) encoding constants for the non-‐linear function.
γ a b c d
Image forward encoding 0.333333333 0.891272426 0.122934128 6.940371388 0.008856452 Profile inverse encoding 3 1.121991404 0.137931034 0.144084508 0.061467064
Figure 4. Screenshots of the ETRGB ICC profile.

9
Figure 4 (continued). Screenshots of the ETRGB ICC profile.
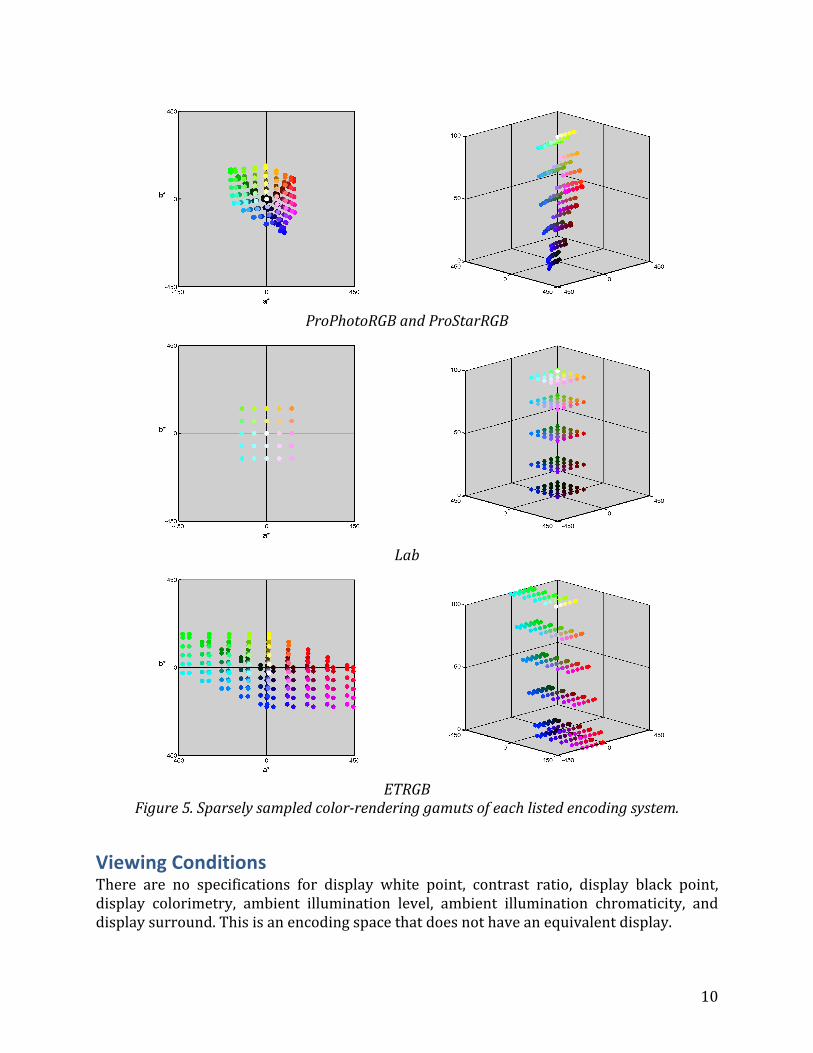
Comparisons with ProPhotoRGB, ProStarRGB, and Lab ProPhotoRGB, ProStarRGB, and Lab are all “wide-‐gamut.” The color-‐rendering gamuts of these encoding systems and ETRGB are plotted in Figure 5. Without question, ETRGB has the largest encoding volume, a result of using the apices of the x,y diagram as primaries.
10
ProPhotoRGB and ProStarRGB
Lab
ETRGB
Figure 5. Sparsely sampled color-‐rendering gamuts of each listed encoding system.
Viewing Conditions There are no specifications for display white point, contrast ratio, display black point, display colorimetry, ambient illumination level, ambient illumination chromaticity, and display surround. This is an encoding space that does not have an equivalent display.

11
Testing – Numerical One of the datasets from recent research was used for this analysis, the “extended paint gamut.” A set of Golden matte acrylic-‐dispersion artist paints, rutile titanium dioxide white (PW 6), cobalt blue (PB 28), ultramarine blue (PB 29), phthalocyanine blue (PB 15:4 green shade), phthalocyanine green (PG 7), pyrrole orange (PO 73), arylide yellow (PY 74), pyrrole red (PR 254), dioxazine purple (PV 23), and quinacridone magenta (PR 122), were used to make computational mixtures of three chromatic paints plus white, based on Kubelka-‐Munk theory,7 where the three paints were adjacent in a hue circle. These spectra had a glossy varnish applied, also computationally.8 CIELAB coordinates were calculated for D50 and the 1931 standard observer. A line segment was defined from L* = 50, C*ab = 0 to each coordinate defined by L* and C*ab. The line length was extended by 10%. This is a common type of color-‐gamut expansion. The reasoning was that this extended-‐paint gamut would represent more chromatic paints not included in the first dataset. Any colors with negative tristimulus values or luminance factor greater than 1.0 were excluded, resulting in 1,723 coordinates. The colors are plotted in CIELAB, shown in Figure 5.
Figure 5. Paint samples plotted in CIELAB.
Comparisons were made between the floating-‐point data and data rounded to 16 bits, and 16-‐bit data and 1 count added to R and B and 1 count subtracted from G. The ±1 count represented quantization uncertainty. CIEDE2000 color differences were calculated between the floating point and encoded data. Three encodings were evaluated: ProPhotoRGB, TRGB (x,y apices primaries and L* encoding), and ETRGB. The results are listed in Table III. The new encoding system does not add noticeable quantization error, either from extending the range of normalized tristimulus values from 1.0 to 2.0 (by comparing ETRGB with TRGB), or from defining the primaries as the apices of a chromaticity diagram (by comparing TRGB with ProPhotoRGB). We often find the 90th
7 Berns, R. S. and Mohammadi, M., Evaluating single-‐ and two-‐constant Kubelka-‐Munk turbid media theory for instrumental-‐based inpainting, Studies in Conservation 52 (4), 299-‐314, 2007. 8 F. Moghareh Abed, F.H, Berns, R.S., Masaoka K., Geometry-‐independent target-‐based camera colorimetric characterization, Journal of Imaging Science and Technology, 57 1050503-‐1,050503-‐15 (2013).

12
percentile the most important metric because it avoids outliers and color differences are not normally distributed, reducing the usefulness of the mean.
Table III. CIEDE2000 values for the extended glossy paint dataset.
16 bit encoding ±1 count uncertainty
Mean 90th percentile Maximum Mean 90th percentile Maximum
ProPhotoRGB 0.02 0.00 1.92 0.03 0.01 1.92 TRGB 0.00 0.00 0.01 0.01 0.01 0.03 ETRGB 0.03 0.08 0.87 0.04 0.08 0.85 A second comparison was made that included camera exposure. In order to take advantage of the extended range, the target white would be at a lower exposure. The simulated camera had a color-‐filter array and 14-‐bit encoding. The camera taking illuminant was pulsed Xenon. Using an Xrite ColorChecker Classic, a matrix transformation was derived between white-‐normalized floating point RGB data and XYZ based on minimizing average DE2000. The matrix was normalized such that R = G = B = 1.0 mapped to the D50 white point. The extended paint tristimulus values were transformed to RGB using the inverse matrix, scaled to match digital count differences for each channel, scaled to represent exposure changes where the ColorChecker white had specific maximum digital counts, and converted to 14-‐bits. Next, the camera data were converted to floating point, white balanced, and multiplied by the color calibration matrix resulting in camera-‐based tristimulus values. Because the same matrix was used to convert from XYZ to RGB and from RGB to XYZ, the camera was a perfect colorimeter. Finally, these data were encoded using ProPhotoRGB, TRGB, and ETRGB. Two different exposures were evaluated: the green channel having a signal of 15,000 for the ColorChecker white, and having a signal of 8,000, equivalent to 13-‐bit encoding. Reducing the exposure had a negligible effect on the mean quantization errors. At the 90th percentile, color differences increase by about 0.06CIEDE2000.
13
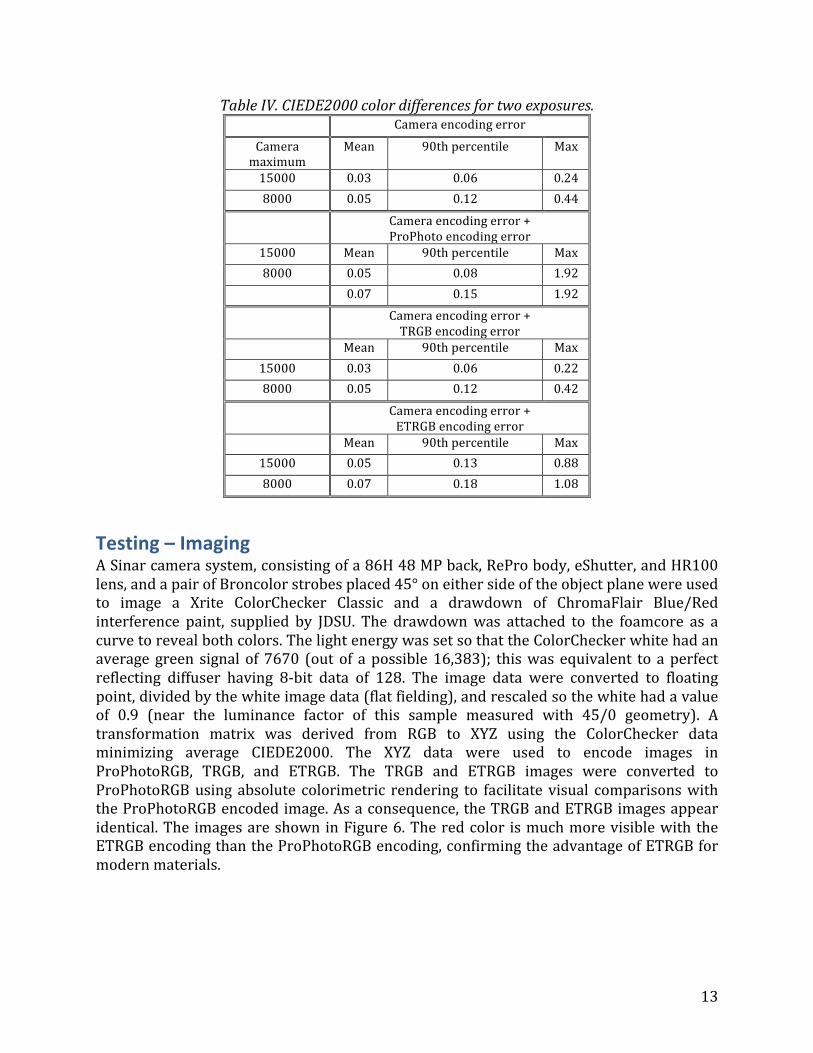
Table IV. CIEDE2000 color differences for two exposures. Camera encoding error
Camera maximum
Mean 90th percentile Max
15000 0.03 0.06 0.24 8000 0.05 0.12 0.44
Camera encoding error + ProPhoto encoding error
15000 Mean 90th percentile Max 8000 0.05 0.08 1.92 0.07 0.15 1.92 Camera encoding error +
TRGB encoding error Mean 90th percentile Max
15000 0.03 0.06 0.22 8000 0.05 0.12 0.42
Camera encoding error + ETRGB encoding error
Mean 90th percentile Max 15000 0.05 0.13 0.88 8000 0.07 0.18 1.08
Testing – Imaging A Sinar camera system, consisting of a 86H 48 MP back, RePro body, eShutter, and HR100 lens, and a pair of Broncolor strobes placed 45° on either side of the object plane were used to image a Xrite ColorChecker Classic and a drawdown of ChromaFlair Blue/Red interference paint, supplied by JDSU. The drawdown was attached to the foamcore as a curve to reveal both colors. The light energy was set so that the ColorChecker white had an average green signal of 7670 (out of a possible 16,383); this was equivalent to a perfect reflecting diffuser having 8-‐bit data of 128. The image data were converted to floating point, divided by the white image data (flat fielding), and rescaled so the white had a value of 0.9 (near the luminance factor of this sample measured with 45/0 geometry). A transformation matrix was derived from RGB to XYZ using the ColorChecker data minimizing average CIEDE2000. The XYZ data were used to encode images in ProPhotoRGB, TRGB, and ETRGB. The TRGB and ETRGB images were converted to ProPhotoRGB using absolute colorimetric rendering to facilitate visual comparisons with the ProPhotoRGB encoded image. As a consequence, the TRGB and ETRGB images appear identical. The images are shown in Figure 6. The red color is much more visible with the ETRGB encoding than the ProPhotoRGB encoding, confirming the advantage of ETRGB for modern materials.

14
Figure 6. Chromaflair interference coating rendered using ETRGB (left) and ProPhotoRGB
(right). (Images are rotated 90° counterclockwise relative to lighting.)
Conclusions A new encoding has been developed for image archiving of cultural heritage. The new scheme, ETRGB uses the apices of the 1931 chromaticity diagram as its RGB primaries, a D50 white point, and L* type nonlinear encoding where white-‐point normalized tristimulus values between 0 and 2 map to between 0 and 1. ETRGB can encode all colorants and their mixtures used by artists including fluorescent and goniochromatic colors. Preliminary testing imaging a ChromaFlair paint drawdown revealed that the new encoding scheme was superior to ProPhotoRGB. ETRGB looks promising and further testing is necessary.