eu audit in brief - introducing the 2015 annual reports … audit in brief introducing the 2016...
TRANSCRIPT
EN
2016EU audit in brief
Introducing the 2016 annual reports of the European Court of Auditors
EN
1977 - 2017

EUROPEAN COURT OF AUDITORS 12, rue Alcide De Gasperi 1615 Luxembourg LUXEMBOURG
Tel. +352 4398-1Enquiries: eca.europa.eu/en/Pages/ContactForm.aspxWebsite: eca.europa.euTwitter: @EUAuditorsECA
More information on the European Union is available on the internet (http://europa.eu).
Luxembourg: Publications Office of the European Union, 2017
Print ISBN 978-92-872-7502-8 doi:10.2865/67000 QJ-04-17-451-EN-CPDF ISBN 978-92-872-7532-5 doi:10.2865/08432 QJ-04-17-451-EN-NHTML ISBN 978-92-872-7508-0 doi:10.2865/425682 QJ-04-17-451-EN-Q

EU audit in brief
Introducing the 2016 annual reports of the European Court of Auditors
EN
2016

02Contents
Page
03 President’s foreword
04 Overall results
04 Key findings
06 Who we are
06 What we audited
08 What we found
08 EU accounts present a true and fair view
08 EU expenditure is legal and regular, except for cost reimbursement payments
15 Budgetary and financial management faces challenges
18 Focus on performance should be increased
21 A closer look at revenue and spending areas
22 Revenue
23 Competitiveness for growth and jobs
26 Economic, social and territorial cohesion
30 Natural resources
34 Security and citizenship
36 Global Europe
39 Administration
41 European Development Funds
44 Background information

03President’s foreword
This year marks the European Court of Auditors’ 40th anniversary. For more than 20 years, we have been issuing our statement of assurance on the reliability of the EU accounts and the legality and regularity of the underlying transactions.
For the first time since 1994, we issue a qualified (rather than an adverse) opinion on the regularity of the transactions underlying the 2016 accounts. This reflects an important improvement in the management of EU finances. A significant part of the 2016 expenditure audited was not affected by a material level of error and there has been a sustained improvement in the estimated level of error in payments made from the EU budget over the last three years: from 4.4 % in 2014, to 3.8 % in 2015 and 3.1 % in 2016. Finally, as in previous years, we conclude that the 2016 EU accounts present a true and fair view of the EU’s financial position.
Going forward, as set out in our strategy for the 2018-2020 period, we have decided to take a fresh look at how we audit the EU budget. In particular, we intend to take greater account of the different layers of internal controls at the European Commission and in Member State administrations for managing EU spending. This will make more transparent where shortcomings remain and also help us to promote accountability and further improve the management of EU finances.
Klaus-Heiner LEHNEPresident of the European Court of Auditors

04Overall results
Key findings
Summary of the 2016 statement of assurance
The European Court of Auditors gives a clean opinion on the reliability of the 2016 accounts of the European Union.
Revenue for 2016, taken as a whole, was legal and regular, as in previous years.
Payments for 2016 were legal and regular, except for cost reimbursement payments.
For the full text of our statement of assurance, please refer to Chapter 1 of the 2016 annual report.
ο The 2016 accounts were prepared in accordance with international standards and present, in all material aspects, a true and fair view. Therefore, as has been the case every year since 2007, we give a clean opinion on their reliability.
ο There has been a sustained improvement in the estimated level of error in the payments made from the EU budget over the last few years: 2016: 3.1 %, 2015: 3.8 % and 2014: 4.4 %. Moreover, in 2016, a significant part of the audited expenditure - entitlement payments - was not affected by a material level of error. Therefore, for the first time since we started to provide a statement of assurance in 1994, we issue a qualified opinion on 2016 payments.
ο Entitlement payments are made to beneficiaries for meeting conditions rather than to reimburse costs. They represent about half of expenditure audited in 2016 and include direct aid to farmers, the biggest part of spending under ‘Natural Resources: Market and direct support’ (with an estimated level of error of 1.7 %) and ‘Administration’ (0.2 %). Both these areas had an estimated level of error below the 2 % materiality threshold. Other activities funded through entitlement payments are student and research fellowships and agri-environment measures.
ο Cost reimbursement payments are made to beneficiaries who have incurred costs that can be refunded with EU money. They include spending in the areas with the highest error rates: ‘Natural Resources: Rural development, the environment, climate action and fisheries’ (with an estimated level of error of 4.9 %) and ‘Economic, social and territorial cohesion’ (4.8 %). Other activities funded through cost reimbursement payments are research projects, training schemes and development programs.
ο The Commission’s reporting on regularity is for most areas broadly in line with our results. The Commission also finds a material level of error overall.

05Overall results
The full text of our 2016 annual reports on the EU budget and on the activities funded by the 8th, 9th, 10th and 11th European Development Funds can be found on our website (http://www.eca.europa.eu/en/Pages/DocItem.aspx?did=41732).
ο Corrective action by authorities in the Member States and by the Commission had a positive impact on the estimated level of error. Without this action, our overall estimated level of error would have been 1.2 % higher. Sufficient information was available to prevent, or to detect and correct, a significant proportion of errors. Had this information been used to correct errors, the estimated level of error for the overall spending on ‘Economic, social and territorial cohesion’ and ‘Global Europe’ would have been below the 2 % materiality threshold in 2016.
ο This year, the total amount of payments the EU committed itself to making from future budgets was higher than ever before. This amount is projected to continue to rise through to 2020. Clearing this backlog and preventing a new one from forming should be priorities when planning the Multiannual Financial Framework (MFF) for the period starting in 2020.
ο We compared the Commission’s performance reporting framework against good practices in other administrations. We conclude that the Commission should simplify performance measurement, for instance by drastically reducing the number of objectives and indicators.

06Overall results
Who we areAs the EU’s external auditor, our mission is to contribute to improving EU financial management, promote accountability and transparency and act as the independent guardian of the financial interests of EU citizens.
We warn of risks, provide assurance, indicate shortcomings and successes and offer guidance to EU policymakers and legislators on how to improve the management of EU policies and programmes. Through our work, we ensure that Europe’s citizens know how their money is being spent.
What we audited
Our statement of assurance on the EU budget
The EU budget is agreed annually by the European Parliament and the Council within the context of multi-annual financial frameworks (MFF). Ensuring that the budget is properly spent is primarily the responsibility of the Commission.
Every year, we audit the revenue and expenditure of the EU budget and examine whether the annual accounts are reliable, and whether income and spending transactions comply with the applicable rules and regulations at EU and Member State level.
This forms the basis for our statement of assurance, which we are required to provide to the European Parliament and the Council under Article 287 of the Treaty on the Functioning of the European Union (TFEU).
2016 EU budget in figures
Budgetary spending is a significant instrument for achieving the EU’s policy objectives.
In 2016, spending totalled €136.4 billion, or around €267 for every citizen. On average, EU spending represented 2.0 % of the total general government spending of EU Member States.
Where does the money come from?
The EU budget is financed by various means. The largest share (€95.6 billion) is paid by Member States, in proportion to their gross national income. Other sources include customs duties (€20.1 billion), as well as value added tax collected by Member States (€15.9 billion).
07Overall results
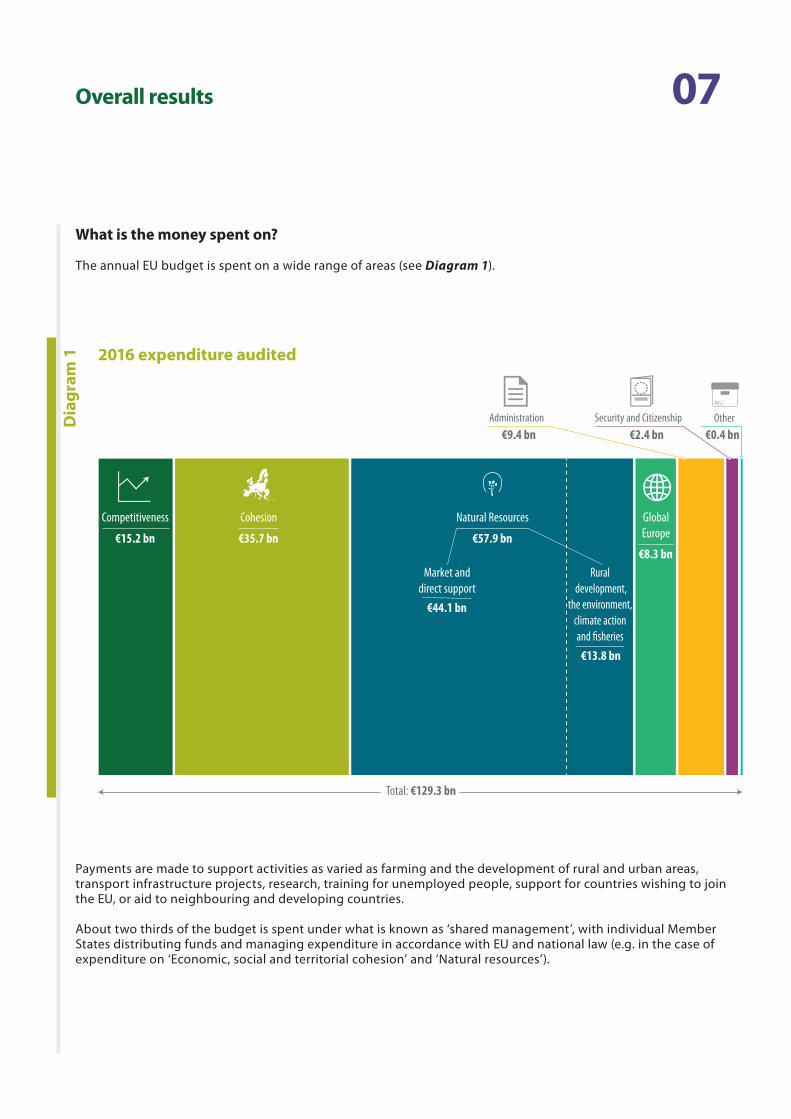
What is the money spent on?
The annual EU budget is spent on a wide range of areas (see Diagram 1).
Dia
gram
1 2016 expenditure audited
Total: €129.3 bn
Rural development,
the environment,climate action and �sheries
Market and direct support
Misc.
Other€0.4 bn
Administration€9.4 bn
Security and Citizenship€2.4 bn
€13.8 bn
€44.1 bn
€57.9 bn
Natural Resources GlobalEurope
€8.3 bn€35.7 bn
Cohesion
€15.2 bn
Competitiveness
Payments are made to support activities as varied as farming and the development of rural and urban areas, transport infrastructure projects, research, training for unemployed people, support for countries wishing to join the EU, or aid to neighbouring and developing countries.
About two thirds of the budget is spent under what is known as ‘shared management’, with individual Member States distributing funds and managing expenditure in accordance with EU and national law (e.g. in the case of expenditure on ‘Economic, social and territorial cohesion’ and ‘Natural resources’).
08Overall results
What we found
EU accounts present a true and fair view
The EU accounts for 2016 were prepared in accordance with international public sector accounting standards and present, in all material respects, a true and fair view of the EU’s financial results for the year and its assets and liabilities at the end of the year.
We were therefore able to give a clean opinion on the reliability of (i.e. ‘sign off’) the accounts, as we have done every year since 2007.
EU expenditure is legal and regular, except for cost reimbursement payments
We test a sample of transactions from across the EU budget to provide estimates of the extent to which revenue and the different spending areas are affected by error. For more information on our audit approach and the estimated level of error, see pages 45 and 46.
We conclude that revenue was free from material error.
For 2016, we issue a qualified opinion on payments made from the EU budget. We do so for the first time since we started providing a statement of assurance in 1994.
For expenditure, we estimate the level of error in expenditure as a whole at 3.1 % (see Diagram 2). This compares to 3.8 % in 2015 and 4.4 % in 2014.

09Overall results
Note: We use standard statistical techniques to estimate the level of error. We are 95 % confident that the level of error for the population lies in the range between the lower and upper error limits (for more details, see Chapter 1, Annex 1.1 of the 2016 annual report).
Dia
gram
2 Estimated level of error for the EU budget as a whole (2014 to 2016)
3.1 %
3.8 %
4.4 %
2 %Materiality threshold
2016201520140 %
6 %
5 %
4 %
3 %
1 %
2 %
Estimated level of errorUpper error limit Lower error limit
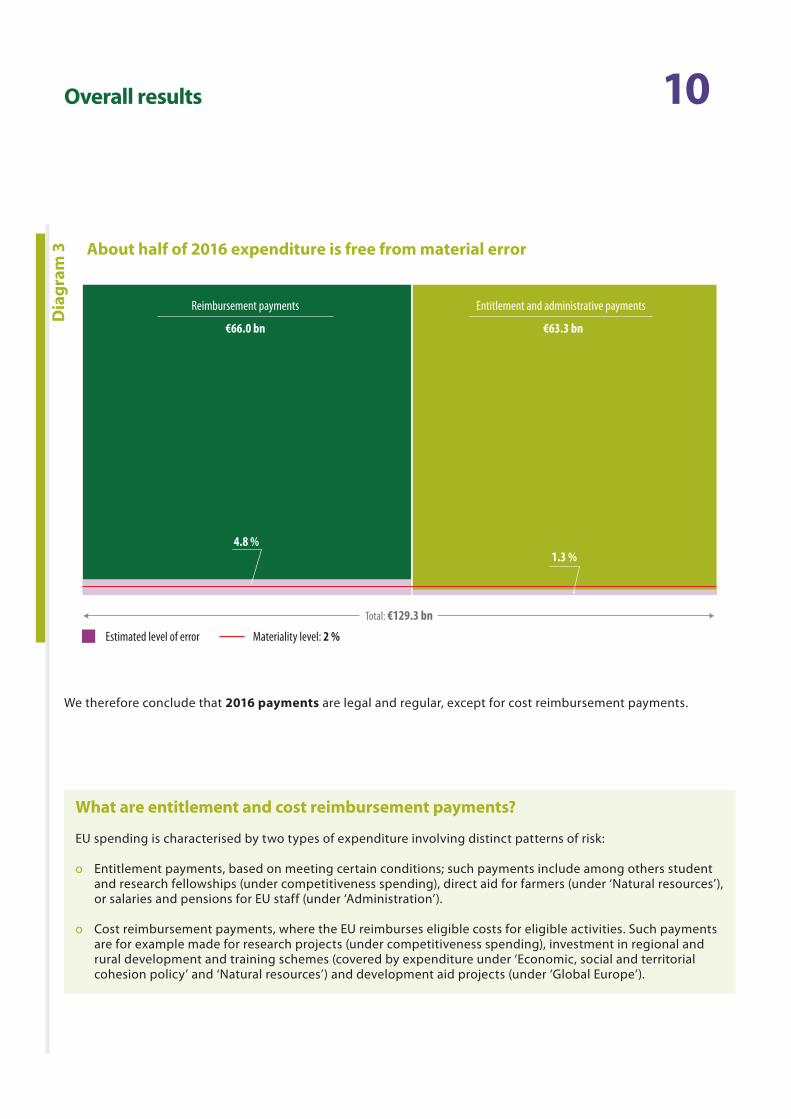
Errors were confined mainly to cost reimbursement payments, for which we estimate the level of error at 4.8 %. For entitlement payments, we estimate the level of error at 1.3 %, which is below our materiality threshold of 2 % (see Diagram 3).
10Overall results
Dia
gram
3 About half of 2016 expenditure is free from material error
What are entitlement and cost reimbursement payments?
EU spending is characterised by two types of expenditure involving distinct patterns of risk:
ο Entitlement payments, based on meeting certain conditions; such payments include among others student and research fellowships (under competitiveness spending), direct aid for farmers (under ‘Natural resources’), or salaries and pensions for EU staff (under ‘Administration’).
ο Cost reimbursement payments, where the EU reimburses eligible costs for eligible activities. Such payments are for example made for research projects (under competitiveness spending), investment in regional and rural development and training schemes (covered by expenditure under ‘Economic, social and territorial cohesion policy’ and ‘Natural resources’) and development aid projects (under ‘Global Europe’).
4.8 %1.3 %
Reimbursement payments
€66.0 bn
Entitlement and administrative payments
€63.3 bn
Total: €129.3 bn
Materiality level: 2 % Estimated level of error
We therefore conclude that 2016 payments are legal and regular, except for cost reimbursement payments.

11Overall results
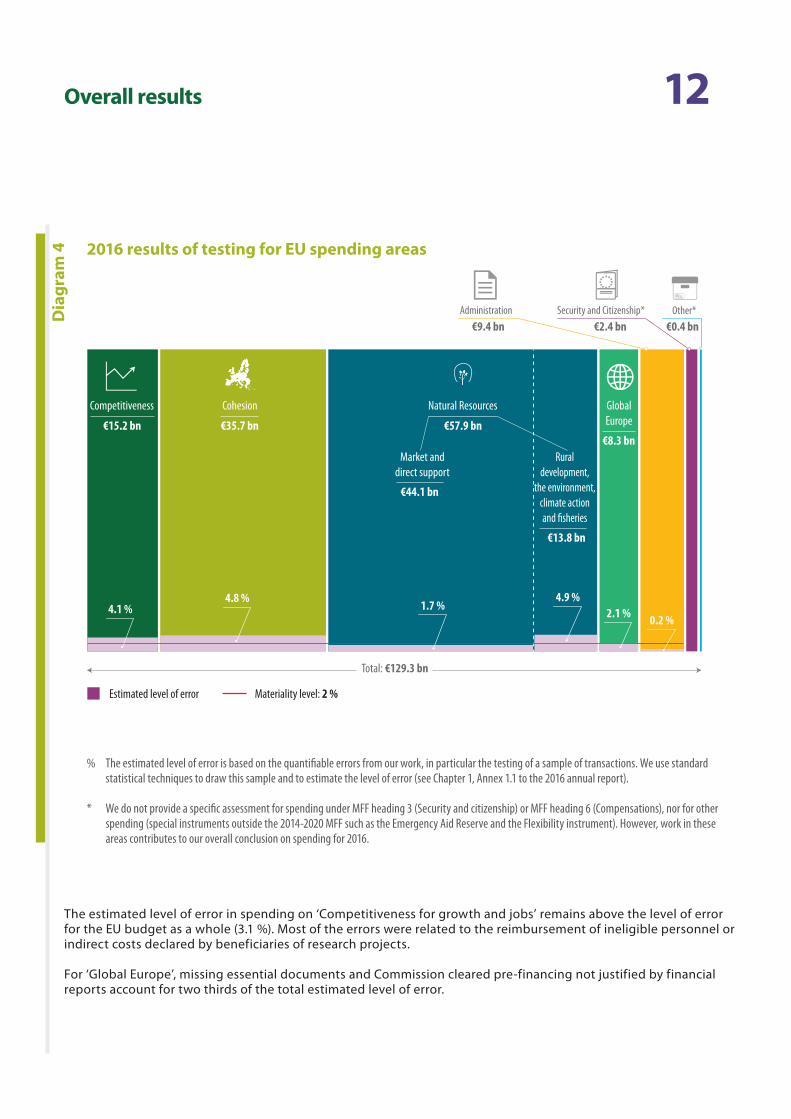
Shared management spending contributes proportionally to the overall error
The testing also provides results for each spending area, as presented in Diagram 4. The way EU expenditure is managed, directly or indirectly by the Commission or shared with Member States has limited impact on regularity. For 2016, the estimated levels of error for shared management expenditure and for all other forms of operational expenditure are almost identical.
‘Natural resources’ had the largest share of audited expenditure (45 %). ‘Market and direct support’, consisting mainly of direct aid payments to farmers, accounts for more than three quarters of this area and is free of material error (estimated level of error: 1.7 %). ‘Rural development, the environment, climate action and fisheries’ is the other component of this area and is affected by material error (estimated level of error: 4.9 %).
‘Economic, social and territorial cohesion policy’ is the second largest part of the audited expenditure (28 %). The errors in this area are mainly due to ineligible beneficiaries, activities, projects or expenditure (around 70 %). Almost all of the expenditure takes the form of cost reimbursement payments. The 2016 financial year is the last in which all expenditure audited by us is linked to the 2007-2013 MFF period. In the coming years we expect to see an increasing share of 2014-2020 MFF funds.
Overall errors in these two areas of shared management make up 79 % of our estimated level of error for 2016.
12Overall results
Dia
gram
4 2016 results of testing for EU spending areas
The estimated level of error in spending on ‘Competitiveness for growth and jobs’ remains above the level of error for the EU budget as a whole (3.1 %). Most of the errors were related to the reimbursement of ineligible personnel or indirect costs declared by beneficiaries of research projects.
For ‘Global Europe’, missing essential documents and Commission cleared pre-financing not justified by financial reports account for two thirds of the total estimated level of error.
Total: €129.3 bn
Misc.
Other*€0.4 bn
Administration€9.4 bn
Security and Citizenship*€2.4 bn
Ruraldevelopment,
the environment, climate actionand �sheries
Market and direct support
1.7 %4.9 %4.8 %
0.2 %2.1 %4.1 %
€13.8 bn
€44.1 bn
€57.9 bn
Natural Resources GlobalEurope
€8.3 bn€35.7 bn
Cohesion
€15.2 bn
Competitiveness
Estimated level of error Materiality level: 2 %
% The estimated level of error is based on the quantifiable errors from our work, in particular the testing of a sample of transactions. We use standard statistical techniques to draw this sample and to estimate the level of error (see Chapter 1, Annex 1.1 to the 2016 annual report).
* We do not provide a specific assessment for spending under MFF heading 3 (Security and citizenship) or MFF heading 6 (Compensations), nor for other spending (special instruments outside the 2014-2020 MFF such as the Emergency Aid Reserve and the Flexibility instrument). However, work in these areas contributes to our overall conclusion on spending for 2016.

13Overall resultsD
iagr
am 5 Comparison between estimated levels of error for EU spending areas (2014-2016)
Diagram 5 compares the estimated levels of error in the various spending areas between 2014 and 2016. Further information on results in revenue and each spending area is given on pages 21 to 43 and in the relevant chapters of the 2016 annual report.
4.8
5.2
0.2
0.60.5
2.1
2.82.72.5
2.9
3.6
4.14.4
5.65.7
AdministrationGlobal EuropeNatural resources*
Economic, socialand territorial
cohesion
Competitivenessfor growth
and jobs
Estimatedlevelsof error
Spendingarea
20162014 2015
% The estimated level of error is based on the quantifiable errors from our work, notably the testing of a sample of transactions. We use standard statistical techniques to draw this sample and to estimate the level of error (see Chapter 1, Annex 1.1 to the 2016 annual report).
* In 2014 we included cross-compliance in our transaction testing and such errors contributed 0.6 percentage points to the overall estimated level of error for MFF heading ‘Natural resources’. Due to a change in the legal framework of the CAP this was no longer the case for 2015 and 2016.
14Overall results
In certain circumstances, we take corrective action into account when estimating the level of error
The Member States and the Commission apply corrective measures in cases of irregular expenditure and when errors in payments have not been detected earlier in the process. We seek to take account of these measures in our audit results where they are taken prior to payment or before our examination. We then check the application of the corrections and adjust our estimated level of error whenever this is appropriate.
In 2016, if such corrective measures had not been applied to the payments audited by us, our overall estimated level of error would have been 4.3 % rather than 3.1 %.
Moreover, sufficient information was available to prevent, or to detect and correct a significant proportion of errors prior to declaring the expenditure to the Commission. Had this information been used to correct errors, the estimated level of error for the overall spending on ‘Economic, social and territorial cohesion’ and ‘Global Europe’ would have been below the 2 % materiality threshold in 2016. This means that there is no need for additional controls in EU spending, but that existing controls need to be enforced properly.
The Commission’s information on regularity of spending is broadly in line with our results
Each Commission directorate-general (DG) produces an annual activity report. This includes a declaration in which the Director-General provides assurance that the report properly presents financial information and that transactions under his/her responsibility are legal and regular. All DGs provided an estimate of the level of error and they are, for most cases, broadly in line with ours.
We report suspected fraud to OLAF
Fraud is an act of deliberate deception to gain a benefit. Our estimate of the level of error in the EU budget is therefore neither a measure of fraud nor of inefficiency or waste. It is an estimate of the money that should not have been paid out because it was not used in accordance with the applicable rules and regulations.
We report all suspected fraud cases detected during our audit work to OLAF, the European Union’s anti-fraud office. It is then up to OLAF to investigate and follow up these cases, where appropriate in co-operation with national judicial authorities. In 2016, we found eleven instances of suspected fraud in the approximately 1 000 transactions that we audited for our statement of assurance and for other performance and/or compliance audits (2015: 12).
These cases were forwarded to OLAF, along with five other cases brought to our attention by the public. The instances of suspected fraud concerned the artificial creation of conditions in order to be eligible for a subsidy, the non-delivery of goods or services, the declaration of costs not meeting the eligibility criteria, conflicts of interest and procurement irregularities.
Want to know more? Full information on the main findings can be found in Chapter 1 of the 2016 annual report on the EU budget. The full text of our annual report can be found on our website (http://www.eca.europa.eu/en/Pages/DocItem.aspx?did=41732).

15Overall results
Budgetary and financial management faces challenges
Amounts to be paid in future years have reached an all-time high
In 2016, the EU made fewer payments than initially planned. This was mainly due to significant delays in the start of disbursements from many of the 2014-2020 multi-annual Financial Framework (MFF) programmes under shared management, in particular the European Structural and Investment (ESI) funds in the areas of cohesion and rural development.
At the same time, future obligations were signed off virtually according to plan. As a result, the amounts to be paid in future years have reached an all-time high of about €238.8 billion. Clearing this backlog and avoiding a new one to form should be priorities when planning the MFF for the period beyond 2020.
The overall financial exposure of the EU budget has also grown, with significant long-term liabilities, guarantees and legal obligations. This implies that careful management needs to be applied in the future to limit the risks to the EU budget in this area.
16Overall results
Member States may have difficulty absorbing some of the available EU funds
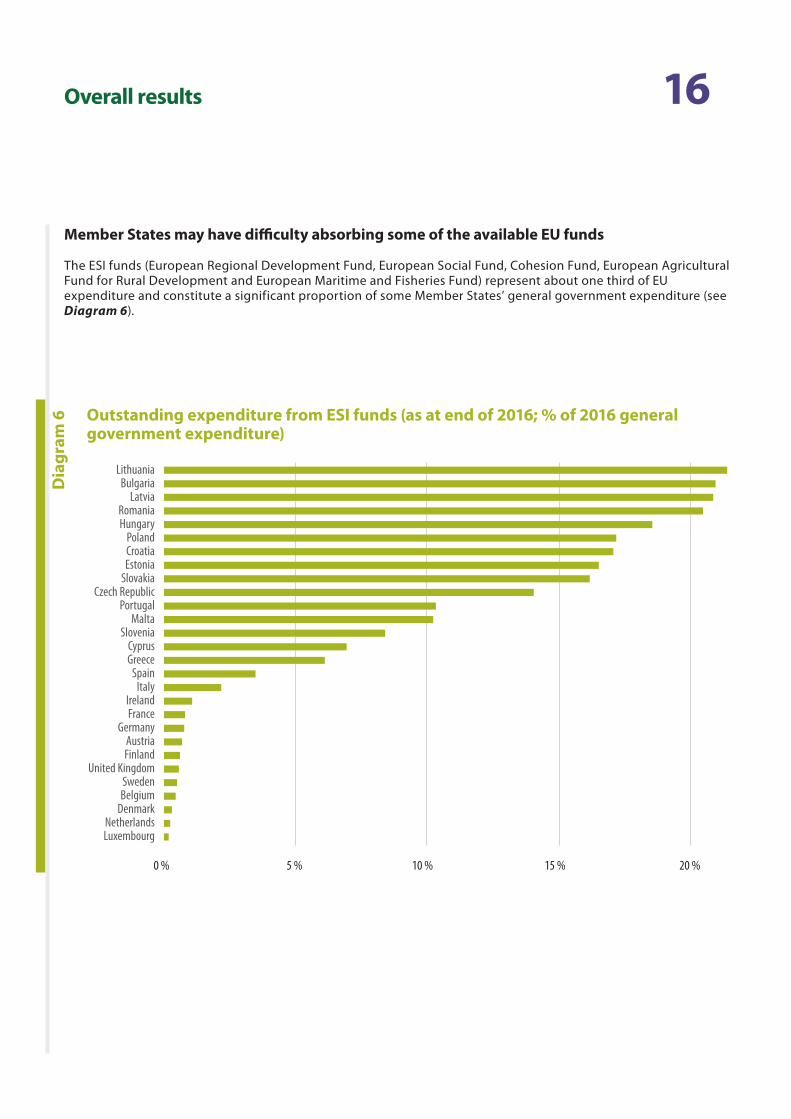
The ESI funds (European Regional Development Fund, European Social Fund, Cohesion Fund, European Agricultural Fund for Rural Development and European Maritime and Fisheries Fund) represent about one third of EU expenditure and constitute a significant proportion of some Member States’ general government expenditure (see Diagram 6).
Dia
gram
6
0 % 5 % 10 % 15 % 20 %
LithuaniaBulgaria
LatviaRomaniaHungary
PolandCroatiaEstonia
SlovakiaCzech Republic
PortugalMalta
SloveniaCyprusGreece
SpainItaly
IrelandFrance
GermanyAustriaFinland
United KingdomSwedenBelgium
DenmarkNetherlandsLuxembourg
Outstanding expenditure from ESI funds (as at end of 2016; % of 2016 general government expenditure)

17Overall results
Given the sizeable commitment appropriations still available under the 2014-2020 MFF, Member States where ESI funds represent significant percentage of general government expenditure may find it difficult to identify sufficient high-quality projects on which to spend the available EU funds or to provide co-financing.
We noted that in general, receipts from the EU budget make up a significant proportion of some Member States’ capital investment in any given year. This means that the size and timing of such receipts can have significant macro-economic effects, such as on investment, growth and jobs, which need to be sufficiently taken into account when planning future expenditure in the EU budget.
EU budget provides little flexibility to respond to unforeseen events
The EU budget system is designed to provide predictable funding to long-term EU expenditure programmes. The EU also has a number of budgetary instruments to deal flexibly with emergency situations. These instruments have been used increasingly in recent years, for instance to address the refugee crisis.
Given the payment delays for many of the 2014-2020 MFF programmes, we believe there is a risk that spending ceilings may be exhausted through normal expenditure in the coming years. This would leave less room for the much-needed flexibility in the EU budget to respond to unexpected events.
EU funding arrangements continued to increase in complexity
The EU budget is a single mechanism subject to specific rules. This helps to ensure accountability and transparency for EU citizens and their representatives.
However, driven by the need to find additional funds to tackle new challenges (such as the financial crisis, climate action, migration and refugee crisis and boosting investment in the EU), funding arrangements have evolved greatly over the years. As a result the number of entities and instruments involved in financing the implementation of EU policies and programmes has increased considerably. This makes it more difficult to manage, audit and report on EU spending effectively, or to obtain a comprehensive overview.
We note that a continuation of this trend risks undermining the accountability and transparency of the EU budget.
Want to know more? Full information on the main findings on budgetary and financial management can be found in Chapter 2 of the 2016 annual report on the EU budget.

18Overall results
Focus on performance should be increased
The performance reporting framework applied by the Commission could benefit from adopting international good practices
EU money should be spent in line with the principles of sound financial management: economy, efficiency and effectiveness. The Commission applies a complex and diverse framework for measuring performance and reporting the results achieved by the EU budget. We compared the framework applied by the Commission with international standards and the good practices of national governments and other international organisations. This enabled us to identify several areas in which the Commission could learn from others and improve the performance reporting system. We conclude for this section by recommending that the Commission:
ο simplify performance measurement, for instance by further reducing the number of objectives and indicators;
ο balance performance reporting better, for instance by clearly presenting information on the main challenges in achieving performance in the Commission’s core performance reports;
ο improve the user-friendliness of its performance reports, for instance by making greater use of visual and interactive tools for the presentation of data;
ο better demonstrate that evaluation results are well used, for instance by delivering more systematic follow-up action;
ο indicate in core performance reports whether, to the best of their knowledge, the performance information provided is of sufficient quality;
ο make performance information more easily accessible.
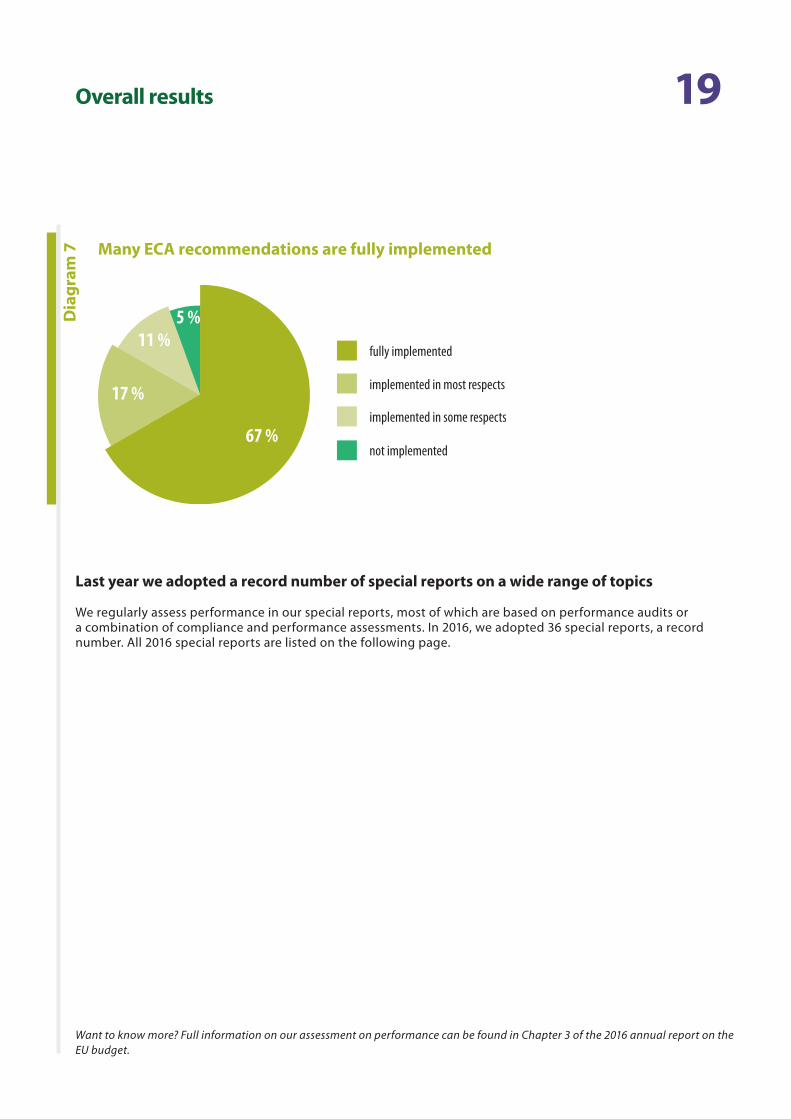
The Commission accepts and implements a high proportion of our recommendations
This year’s analysis of follow-up concluded on 108 recommendations issued to the Commission between 2010 and 2013. The Commission implemented 90 recommendations fully or in most respects. Even recommendations that the Commission initially did not accept were in most cases implemented. We found that just six recommendations had not been implemented at all (see Diagram 7).
19Overall resultsD
iagr
am 7 Many ECA recommendations are fully implemented
5 %11 %
17 %
67 %
fully implemented
implemented in most respects
implemented in some respects
not implemented
Last year we adopted a record number of special reports on a wide range of topics
We regularly assess performance in our special reports, most of which are based on performance audits or a combination of compliance and performance assessments. In 2016, we adopted 36 special reports, a record number. All 2016 special reports are listed on the following page.
Want to know more? Full information on our assessment on performance can be found in Chapter 3 of the 2016 annual report on the EU budget.

20Overall results
Dia
gram
8
Special reports
Special reports
Special reports
Special reports
Special reports
FINANCIAL AND ECONOMIC GOVERNANCE
Services DirectiveRail freight transportRoma integrationEducation objectivesFinancial instrumentsMaritime transportState aid rulesClosure of 2007-2013programmes
EEAS buildingsExternal migrationMoldovaAfrican Great Lakes regionMontenegroWestern BalkansHondurasUkraineUnion Civil Protection MechanismRevenue in sub-Saharan AfricaFormer Yugoslav Republic ofMacedonia
Follow-up of ECA’s special reportsEuropean Institute ofTechnologyAgencies’ use of grantsEU institutions’ publicprocurementEuropean Commission’sgovernance
Farmers’ incomesBaltic SeaAnimal diseasesSustainable biofuelsNuclear decommissioningLand Parcel Identi�cationCross complianceCross-border healththreatsClimate actionFood waste
ADMINISTRATION
COMPETITIVENESSFOR GROWTH AND JOBS
ECONOMIC, SOCIAL ANDTERRITORIAL COHESION
GLOBAL EUROPE SECURITY AND CITIZENSHIP
NATURAL RESOURCES2016 ECAspecial reports
Excessive de�cit procedureSingle Supervisory Mechanism
Our special reports — which are mainly performance audits — are available in 23 EU languages on our website (http://www.eca.europa.eu/en/Pages/AuditReportsOpinions.aspx?ty=Special report&tab=tab4).
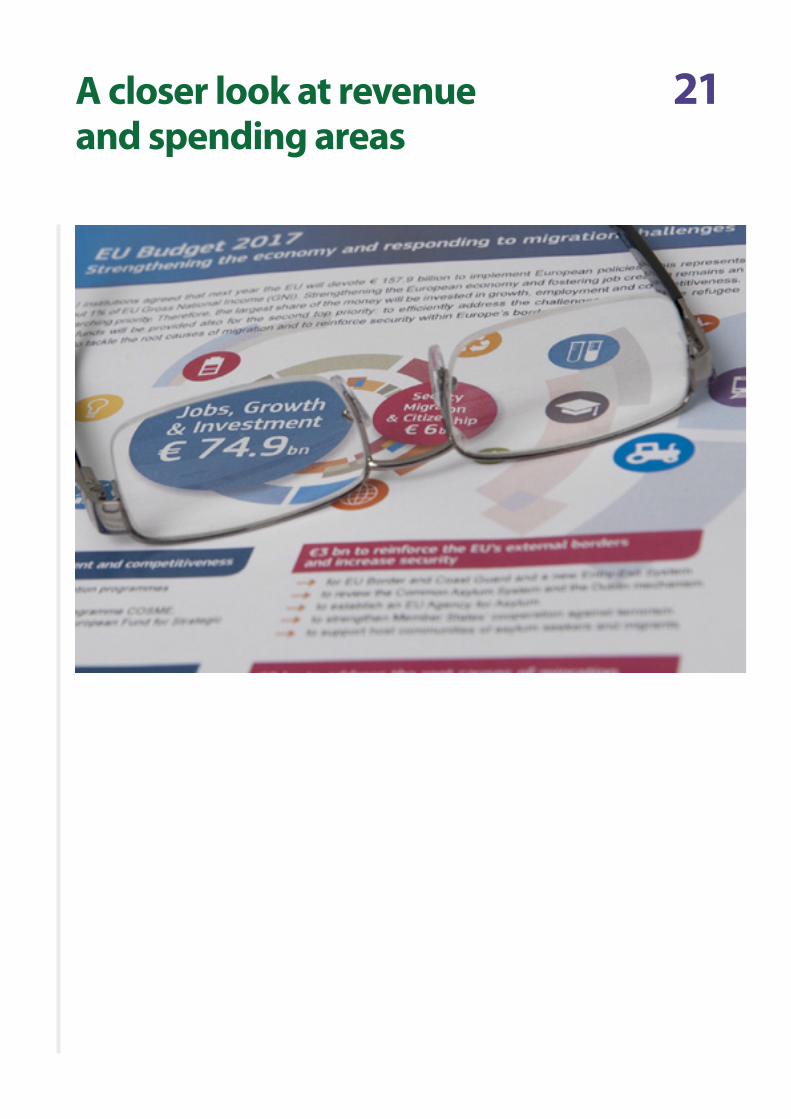
21A closer look at revenue and spending areas

22A closer look at revenue and spending areas
Want to know more? Full information on our audit of EU revenue can be found in Chapter 4 of the 2016 annual report on the EU budget.
Revenue€144.7 billion
What we audited
Our audit covered the revenue side of the EU budget, through which it finances its expenditure. We examined certain key control systems for the calculation and collection of own resources and a sample of revenue transactions.
Contributions calculated on the basis of Member States’ gross national income (GNI) and value added tax (VAT) are calculated on the basis of macroeconomic statistics and estimates provided by Member States. In 2016, GNI- and VAT-based EU revenue accounted for 66 % and 11 % respectively of the EU’s total revenue.
Traditional own resources (TOR), mainly customs duties on imports collected by Member State administrations on behalf of the EU, provided a further 14 % of the EU’s revenue. The remaining 9 % of EU revenue results from other sources (e.g. contributions and refunds arising from Union agreements and programmes, and fines imposed by the Commission for infringements of competition rules).
What we found
Affected by material error?
NoEstimated level of error:
0.0 % (2015: 0.0 %)
The revenue-related systems we examined were overall effective. As regards TOR, we considered that some controls were only partially effective. We also found some areas where there was scope for improvement by the Commission in the methods it used and in the verification process for ascertaining the implications of multinational activities on the estimation of GNI (in particular, the methods for dealing with capitalised Research and Development (R&D) assets). This may affect the calculation of Member States’ contributions to the EU budget.
What we recommend
We recommend that the Commission:
ο analyse in cooperation with Member States, all the potential implications of activities of multinational companies on the estimation of GNI, and provide guidance to them on how to deal with these activities when compiling GNI data; and
ο confirm that R&D assets have been correctly recorded in Member States’ national accounts.

23A closer look at revenue and spending areas
Competitiveness for growth and jobs€15.2 billion
What we audited
Our audit covered expenditure for research and innovation, education systems and promoting employment, a digital single market, renewable energy and energy efficiency, modernising the transport sector and improving the business environment, especially for small and medium-sized enterprises (SMEs).
In 2016, expenditure subject to audit in this area was €15.2 billion. Most spending took the form of grants to public or private beneficiaries participating in projects. The principal risk to the regularity of transactions is that beneficiaries declare ineligible costs which are neither detected nor corrected before the Commission reimburses them.
Research and innovation expenditure, which accounted in 2016 for 59 % of spending under this sub-heading, is made through the Seventh Framework Programme for Research and Development 2007-2013 (FP7) and Horizon 2020, the framework programme for 2014-2020.
What we found
Affected by material error?
YesEstimated level of error:
4.1 % (2015: 4.4 %)
Most of the errors are related to the reimbursement of ineligible personnel costs, other ineligible direct costs (e.g. travel and equipment costs not related to the project) or ineligible indirect costs declared by beneficiaries. This includes calculation errors, lack of supporting evidence for declared costs and costs incurred outside the allowed time period (see examples in box).
24A closer look at revenue and spending areas
Sufficient information was available to prevent, or to detect and correct, a significant proportion of errors. Had this information been used to correct errors, the estimated level of error for the overall spending on ‘Competitiveness for growth and jobs’ would have been 2.9 %.
In several cases we also found delays in the distribution of the EU funding by the project coordinator to the other project participants. This can have serious financial consequences for the project participants, especially for SMEs with low working capital.
Horizon 2020 has simpler funding rules than FP7, and the Commission has made considerable efforts to reduce administrative complexity. Simplification is important because it reduces the administrative burden and can decrease the risks of legal uncertainty and inconsistent treatment of beneficiaries. In 2016, the Commission put forward further simplification measures (such as targeted support for start-ups and wider use of lump-sums). However, we see opportunities and risks to further simplify the legal framework.
The annual activity reports of the Directorates-General for Research and Innovation, Education and Culture, and Mobility and Transport gave a fair assessment of the regularity of underlying transactions, and the information provided corroborated our findings and conclusions. However, we identified differences between Directorates-General in the methodologies used for the calculation of error rates and amounts at risk.
Since 2014, a Common Audit Service (CAS) has been responsible for the ex-post audits of projects under the research framework programmes. The Commission’s Internal Audit Service audited the CAS and recommended that it closes audits more rapidly and improve its internal processes for planning, monitoring and reporting on its audits for Horizon 2020 projects.
In addition to its financial checks, the Commission also assesses performance aspects for each research and innovation project before reimbursing costs. We reviewed the Commission’s performance assessment for the 60 collaborative research and innovation projects which we had sampled. The Commission considered that most of those projects had achieved the expected results, and that one fifth of them had been exceptionally successful. At the same time, 15 % of the projects were behind schedule, according to the Commission. For 7 % of the projects, the Commission considered that reported costs were not reasonable in relation to the progress achieved.
Examples: Ineligible costs
In one case, a non-EU public body participating in a project in the field of biofuels technology calculated personnel costs incorrectly and also charged costs without sufficient evidence of their relation to the project.
In another case, an SME participating in a project to develop coordinated solutions to EU health emergencies declared excessively high personnel costs and also charged amounts for personnel costs incurred outside the period of the cost statement.
25A closer look at revenue and spending areas
What we recommend
We recommend that the Commission:
ο further streamline the Horizon 2020 rules and procedures to reduce legal uncertainty, by making increased use of the simplified cost options (such as unit costs, lump sums, flat-rate financing and prizes) in the revised Financial Regulation;
ο take a consistent approach towards the calculation of error rates and the overall amounts at risk; and
ο reduce the time taken to close ex-post audits and improve internal processes for planning, monitoring and reporting of audits.
Want to know more? Full information on our audit of EU expenditure on ‘Competitiveness for growth and jobs’ can be found in Chapter 5 of the 2016 annual report on the EU budget.

26A closer look at revenue and spending areas
What we audited
This spending area aims to reduce development disparities between regions, restructure declining industrial areas and encourage cross-border, transnational and interregional cooperation.
For 2016, expenditure subject to audit in this area was €35.7 billion. 2016 was the last year for which all payments subject to our audit relate to the 2007-2013 programming period. Expenditure comprises two main parts: regional and urban policy, and employment and social affairs.
ο The EU’s regional and urban policy is mostly implemented through the European Regional Development Fund (ERDF) and the Cohesion Fund (CF), which together accounted for 76 % of Cohesion spending in 2016. The ERDF finances infrastructure projects, the creation or preservation of jobs, regional economic development initiatives and activities supporting SMEs. The CF finances investments in environmental and transport infrastructure in Member States with a per capita GNI of less than 90 % of the EU average.
ο Employment and social affairs policy, which is mainly financed by the European Social Fund (ESF), accounted for 21 % of Cohesion spending in 2016. Expenditure in this area aims to improve employment and job opportunities, encouraging a high level of employment and the creation of more and better jobs.
The management of expenditure is shared with Member States and involves the co-financing of the operational programmes through which projects are funded. Eligibility rules for the reimbursement of costs are set out at national or regional level, and vary from one Member State and/or programme to another.
Around 3 % of Cohesion spending goes through other specific instruments and funds, such as the European Neighbourhood Instrument (ENI) and the Fund for European Aid to the most Deprived (FEAD).
What we found
Economic, social and territorial cohesion€35.7 billion
Affected by material error?
YesEstimated level of error:
4.8 % (2015: 5.2 %)
27A closer look at revenue and spending areas
Examples
Ineligible costs declared: a beneficiary for an ERDF research project in Spain infringed several EU and national rules: costs were declared twice, the pre-defined method for the calculation of indirect costs was inaccurately applied and poorly justified, and recoverable VAT was wrongly declared for co-financing.
Ineligible beneficiary: the call for proposals for an ERDF project in the Czech Republic specified that only SMEs could apply. However, funding went to a beneficiary that was not an SME.
The principal sources of error in spending on ‘Economic, social and territorial cohesion’ as a whole are the inclusion of ineligible costs in beneficiaries’ declarations, the selection of ineligible projects, activities or beneficiaries (see examples in box), and the infringement of public procurement legislation.
For a significant proportion of transactions containing quantifiable errors, authorities in the Member States had sufficient information to prevent, or to detect and correct, the errors before claiming reimbursement from the Commission. Had this information been used to correct errors before the expenditure was declared to the Commission, the estimated level of error for overall spending on ‘Economic, social and territorial cohesion’ would have been 1.1 %, i.e. below the 2 % materiality threshold.
Financial instruments in ERDF and ESF
By the end of 2015, the average disbursement rate to final recipients of financial instruments was 75 %, compared to 57 % in the previous year. Financial instruments take the form of equity investments, loans or guarantees, and are used to channel funding to enterprises or urban projects. A total of 1 052 financial instruments had been set up as of the end of 2015, with a cumulative endowment of around €16.9 billion. Several Member States were finding it difficult to use their endowments in full, with Spain, Italy, the Netherlands and Slovakia being significantly below the EU average in this regard. Not disbursing all the money available means that one of the main benefits of this type of instrument – the capacity to use the funds more than once – is not fully realised.

28A closer look at revenue and spending areas
Commission assurance for the 2007-2013 period
In our Special Report No 36/2016 on preparations for the closure of 2007-2013 programmes, we observed that the Commission had made adequate arrangements for Member States to close their Cohesion OPs. In Special Report No 04/2017 on the financial corrections implemented by the Commission in Cohesion during the 2007-2013 programming period, we also concluded that the Commission had made effective use of the measures at its disposal to protect the EU budget from irregular expenditure.
The 2016 annual activity reports (AARs) give provisional information on the amounts at risk and the residual risk, both for the closure of the 2007-2013 period and for the annual assurance package developed for the 2014-2020 period. The Commission’s assessment of the closure documentation was not due until 31 August 2017. Thus, the Commission will report the outcome of its assessment of the residual risk rates communicated by audit authorities in its 2017 AARs.
Commission assurance for the 2014-2020 programming period
Three years after the start of the 2014-2020 period, the Member States have designated only 77 % of the programme authorities responsible for implementing the ESI funds. We also found that the delays in budget implementation as of mid-2017 were greater than at the same point in the 2007-2013 period.
The Commission should clarify how Member States’ audit authorities should define the audit populations of financial instruments. Defining the audit population as the initial endowment rather than the eligible expenditure disclosed in the annual accounts leads to an underestimate of the residual rate. A similar issue affects state aid advances.
Assessment of project performance
Based on our review of 168 physically completed projects, we found that only one third of the projects examined had a performance measurement system with output and result indicators linked to the objectives of the operational programme. While most projects we examined met their output objectives at least partially, 42 % had no result indicators and/or targets. This made it impossible to assess these projects’ specific contribution to the overall programme’s result objectives.
In Special Report No 02/2017, on the Commission’s negotiation of 2014-2020 partnership agreements and programmes in Cohesion, we analysed the significant differences in the use of output and, even more so, result indicators between ESI funds. Differences in this respect also exist between policy areas, which make it difficult to compare the results achieved under different EU budget headings.

29A closer look at revenue and spending areas
What we recommend
We recommend that the Commission:
ο pay particular attention to areas in which there is a higher risk of ineligible expenditure or of the disclosure of inaccurate information that may lead to an over-reimbursement when closing the 2007-2013 programmes;
ο address issues for the 2014-2020 period that may prevent a reliable calculation of the residual rate;
ο when reconsidering the design and delivery mechanism for the ESI funds post-2020, strengthen the programme focus on performance and simplify the mechanism for payments by encouraging, as appropriate, the introduction of further measures linking the level of payments to performance instead of simply reimbursing costs.
Want to know more? Full information on our audit of EU expenditure for ‘Economic, social and territorial cohesion’ can be found in Chapter 6 of the 2016 annual report on the EU budget.
30A closer look at revenue and spending areas
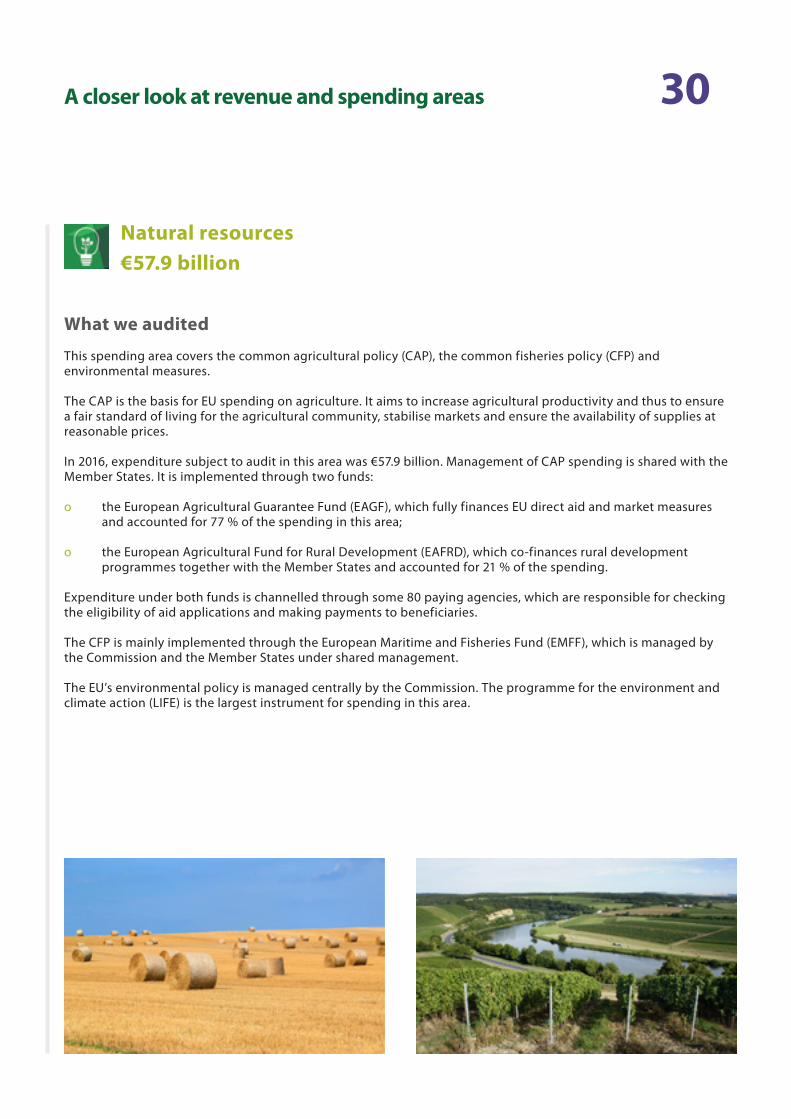
Natural resources€57.9 billion
What we audited
This spending area covers the common agricultural policy (CAP), the common fisheries policy (CFP) and environmental measures.
The CAP is the basis for EU spending on agriculture. It aims to increase agricultural productivity and thus to ensure a fair standard of living for the agricultural community, stabilise markets and ensure the availability of supplies at reasonable prices.
In 2016, expenditure subject to audit in this area was €57.9 billion. Management of CAP spending is shared with the Member States. It is implemented through two funds:
ο the European Agricultural Guarantee Fund (EAGF), which fully finances EU direct aid and market measures and accounted for 77 % of the spending in this area;
ο the European Agricultural Fund for Rural Development (EAFRD), which co-finances rural development programmes together with the Member States and accounted for 21 % of the spending.
Expenditure under both funds is channelled through some 80 paying agencies, which are responsible for checking the eligibility of aid applications and making payments to beneficiaries.
The CFP is mainly implemented through the European Maritime and Fisheries Fund (EMFF), which is managed by the Commission and the Member States under shared management.
The EU’s environmental policy is managed centrally by the Commission. The programme for the environment and climate action (LIFE) is the largest instrument for spending in this area.

31A closer look at revenue and spending areas
Affected by material error?
Agriculture — market and direct support:
NoAgriculture – market and direct support:
1.7 %(2015: 2.2 %)
Rural development, the environment, climate action and fisheries:
4.9 %(2015: 5.3 %)
Natural resources overall:
2.5 %(2015: 2.9 %)
Estimated level of error:
What we found
Market and direct support (EAGF)
Agricultural land surface is the predominant variable for direct support payments. Continuous improvements in the control systems helped to reduce the level of error for the EAGF in 2016 to below the 2 % materiality threshold for the first time. The main reasons were a revised definition of eligible permanent grassland, improvements in the land parcel identification system (LPIS) and the new geo-spatial aid application.
‘Greening payments’ are additional financial support payments made to farmers complying with environmental requirements. We examined a sample of 63 such payments and found that farmers complied with the requirements relating to crop diversification and the protection of permanent grassland. There were some errors concerning ecological focus areas. We found that several paying agencies either did not have reliable information on the categories of land in their LPIS, or failed to use it to verify claims.
Rural development, the environment, climate action and fisheries
The nature and pattern of errors varies between the EAFRD and the other spending areas under ‘Natural resources’.
In addition to ineligible beneficiaries, activities, projects and expenditure items, we found errors relating to ineligible land and overstated eligible hectares. This year, three of the largest eligibility errors involved beneficiaries who did not disclose that they were controlled by, applying jointly with or purchasing from linked companies, as required by EU or national rules (see example).
Natural resources overall:
Yes
Rural development, the environment, climate action and fisheries:
Yes

32A closer look at revenue and spending areas
For a significant proportion of transactions containing quantifiable errors, the national authorities had sufficient information to prevent, or to detect and correct, the errors before claiming reimbursement from the Commission. Had this information been used to correct errors before the expenditure was declared to the Commission, the estimated level of error for overall spending on ‘Rural development, the environment, climate action and fisheries’ would have been 3.4 %.
DG AGRI’s reporting on legality and regularity
The adjusted error rate for ‘Natural resources’ presented in DG AGRI’s 2016 annual activity report is consistent with our audit conclusion that the overall level of error for this spending area is material.
Our special report No 07/2017 welcomed the certification bodies’ new role in checking the legality and regularity of spending under the CAP. However, we identified a number of significant weaknesses and recommended improvements relating to sampling, testing and calculating error rates.
Performance assessment
Our examination of the performance of selected rural development investment projects showed that 95 % of investments had been carried out as planned.
In 34 % of cases there was, however, insufficient evidence that costs were reasonable. Where feasible, using simplified cost options effectively limits the risks of excessive prices, as long as they are set at the right level. We are currently carrying out a more detailed analysis of this issue, with a view to publishing a special report on the topic in 2018.
Our work on the performance of greening payments identified some positive changes in land use following the introduction of the scheme, in particular the establishment of ecological focus areas to safeguard and improve biodiversity. In our sample, the agricultural area on which we found positive changes amounted to around 3.5°% of arable land.
Example: Ineligible beneficiary – support for SMEs granted to cooperative belonging to large multinational company
We examined the investment support granted to a Lithuanian cooperative for the processing and marketing of agricultural produce. Under EU and national rules, such support is available only to micro, small and medium-sized enterprises, as determined by the number of employees, annual turnover and annual balance sheet total. Related enterprises, such as mother or daughter companies, have to be included in this calculation. We found that the cooperative concerned belonged to a large multinational company and did not qualify as a micro, small or medium-sized enterprise.
33A closer look at revenue and spending areas
What we recommend
We recommend that the Commission:
ο review the approach taken by paying agencies to classify and update land categories in their LPIS and to perform the required cross-checks, in order to reduce the risk of error in the greening payment;
ο provide guidance and disseminate best practices among national authorities to ensure that their checks identify links between applicants and other stakeholders involved in the supported projects.
Want to know more? Full information on our audit of EU expenditure on ‘Natural resources’ can be found in Chapter 7 of the 2016 annual report on the EU budget.

34A closer look at revenue and spending areas
What we audited
This spending area groups various policies whose common objective is to strengthen the concept of ‘EU citizenship’ by creating an area of freedom, justice and security without internal frontiers.
For 2016, the expenditure subject to audit in this area was €2.4 billion. This amount covered border protection, immigration and asylum policy, justice and home affairs, public health, consumer protection, culture, youth, information and dialogue with citizens. It is a relatively small, but increasing part of the EU budget (approximately 1.9 % in 2016).
A significant share of spending is done through twelve decentralised agencies on which we report separately in our series of specific annual reports.
‘Migration and security’, which accounts for around half (53 %) of spending, is largely implemented through shared management between the Member States and the Commission. The most important funds under this heading are:
ο the Asylum, Migration and Integration Fund (AMIF) which aims to contribute to the effective management of migration flows and bring about a common EU approach to asylum and immigration;
ο the Internal Security Fund (ISF), which aims to achieve a high level of security in the EU.
These funds began in 2014, when they replaced the SOLID programme (‘Solidarity and Management of Migration Flows’), and will run until 2020.
We also examined a small number of transactions under other headings of this spending area. Given the small size of the sample, we are not in a position to calculate a representative error rate for ‘Security and citizenship’.
Security and citizenship€2.4 billion

35A closer look at revenue and spending areas
What we found
The Commission and the Member States have made very slow progress with payments under shared management from AMIF and the ISF. By the end of the 2015 financial year, no payments at all had been cleared by the Commission for 15 Member States. Less than 5 % of the available funds had been cleared in six Member States, between 5 % and 10 % in three Member States, and between 10 % and 15 % in four Member States.
We also identified a number of weaknesses for SOLID, AMIF and the ISF that may delay the implementation of these funds, impair the Commission’s assessment of Member State systems, delay the correction of deficiencies in control systems and increase the risk to the eligibility, management and control of funded actions.
Want to know more? Full information on our audit of EU expenditure for ‘Security and citizenship’ can be found in Chapter 8 of the 2016 annual report on the EU budget.
36A closer look at revenue and spending areas
Global Europe€8.3 billion
What we audited
This spending area covers expenditure in the fields of foreign policy, support for EU candidate and potential candidate countries, and development assistance and humanitarian aid provided to developing and neighbouring countries (with the exception of the European Development Funds – see pages 41 to 43).
For 2016, expenditure subject to audit in this area was €8.3 billion, with spending disbursed across more than 150 countries. Spending is implemented either directly by a number of Directorates-General at the Commission (either from their headquarters in Brussels or by EU delegations in recipient countries), or indirectly by beneficiary countries or international organisations, using a broad range of cooperation instruments and delivery methods.
What we found
Affected by material error?
YesEstimated level of error:
2.1 % (2015: 2.8 %)
Example: Unavailability of supporting documents
We examined expenditure accepted by the Commission for a grant awarded to a non-governmental organisation working in the field of access to sexual and reproductive health services. The beneficiary was unable to provide supporting documents to justify some of the audited costs, in particular staff salaries, insurance, national income tax, and vehicle and classroom hire. These costs were therefore considered ineligible.
With EU contributions to the general budget of recipient countries, the Commission has considerable flexibility in deciding whether eligibility conditions have been met. As a result, the risk of non-compliance with the applicable rules is low. This is also the case for EU funds that are pooled with those of other international donors and not earmarked for specific items of expenditure. In these cases costs that are ineligible under EU rules can often be covered by contributions of other donors.
37 % of the estimated error is attributable to expenditure for which essential supporting documentation was not provided (see example below). Other important types of error include expenditure that either has not been incurred or is ineligible.

37A closer look at revenue and spending areas
For a significant proportion of transactions containing quantifiable errors, the Commission had sufficient information to prevent, or to detect and correct, the errors. Had the Commission made proper use of all the information at its disposal, the estimated level of error for the overall spending on ‘Global Europe’ would have been 1.4 %, i.e. below the 2 % materiality threshold.
Compliance reporting by DG Neighbourhood and Enlargement Negotiations (DG NEAR)
As in previous years, as part of its efforts to reduce errors in payments, DG NEAR commissioned a study to assess the ‘Residual Error Rate’ (RER) in expenditure in this area. We assessed the study’s methodology, finding it broadly fit-for-purpose and effective. We did, however, notice areas for improvement, such as the need for additional guidance for auditors on how to estimate the error of individual transactions.
In its annual activity report (AAR), DG NEAR estimates an amount at risk at closure taking into account the likely effect of checks in subsequent years (‘corrective capacity’). We consider it likely that the corrective capacity has been overstated since, based on our examination of a sample of recovery orders, we found some undetected errors in the population used for this estimation.
38A closer look at revenue and spending areas
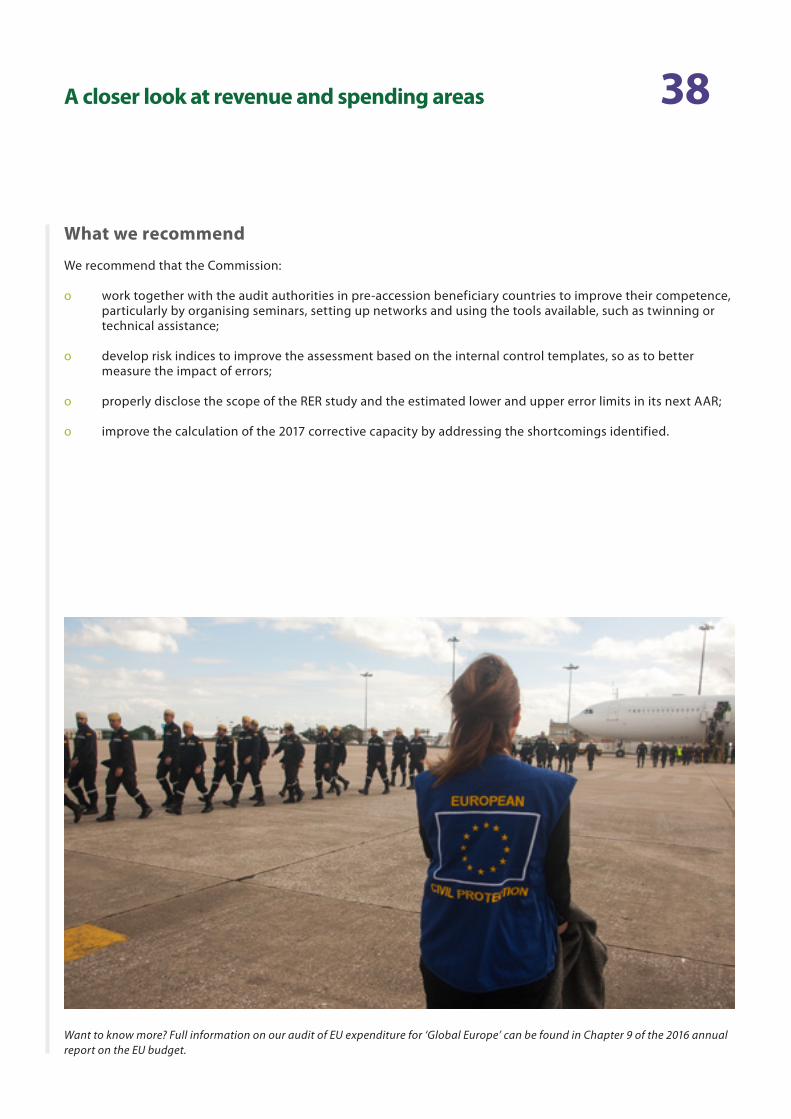
Want to know more? Full information on our audit of EU expenditure for ‘Global Europe’ can be found in Chapter 9 of the 2016 annual report on the EU budget.
What we recommend
We recommend that the Commission:
ο work together with the audit authorities in pre-accession beneficiary countries to improve their competence, particularly by organising seminars, setting up networks and using the tools available, such as twinning or technical assistance;
ο develop risk indices to improve the assessment based on the internal control templates, so as to better measure the impact of errors;
ο properly disclose the scope of the RER study and the estimated lower and upper error limits in its next AAR;
ο improve the calculation of the 2017 corrective capacity by addressing the shortcomings identified.

39A closer look at revenue and spending areas
What we audited
Our audit covered the administrative expenditure of the EU’s institutions and other bodies: the Parliament, the European Council and the Council of the European Union, the Commission, the European Court of Justice, the European Court of Auditors (ECA), the European Economic and Social Committee, the Committee of Regions, the European Ombudsman, the European Data Protection Supervisor and the European External Action Service (EEAS).
In 2016, expenditure subject to audit of all EU institutions and other bodies was €9.4 billion. Staff-related expenditure (such as salaries, pensions and allowances) accounted for about 60 % of the total. The remainder was spent on buildings, equipment, energy, communications and information technology.
The results of our audits of the EU agencies, other decentralised bodies, and the European Schools, are reported in specific annual reports which are published separately, together with a summary of the results.
The ECA’s own financial statements are audited by an external auditor, and the audit report is published in the Official Journal of the European Union and on our website.
What we found
Administration€9.4 billion
Affected by material error?
NoEstimated level of error:
0.2 % (2015: 0.6 %)
Our examination of systems did not reveal any significant weaknesses overall. However, we found an area where there was scope for improvement. This is addressed by the following recommendation.
40A closer look at revenue and spending areas
What we recommend
We recommend that the European Parliament:
ο reviews its framework for monitoring the implementation of budget appropriations allocated to political groups. It should also provide better guidance to political groups and monitor more effectively how they apply the rules for authorising and settling expenditure, and how they carry out procurement procedures.
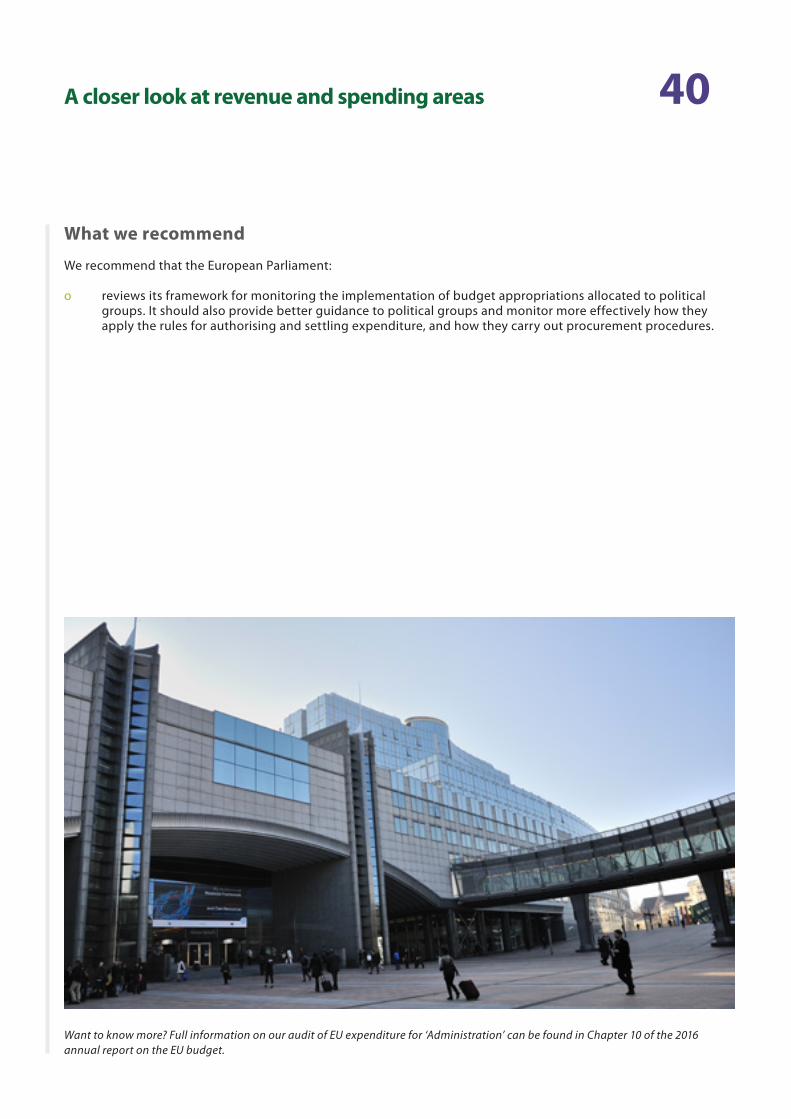
Want to know more? Full information on our audit of EU expenditure for ‘Administration’ can be found in Chapter 10 of the 2016 annual report on the EU budget.

41A closer look at revenue and spending areas
European Development Funds€2.8 billion
What we audited
The European Development Funds (EDFs) provide EU assistance for development cooperation to the African, Caribbean and Pacific (ACP) countries and overseas countries and territories (OCTs). EDF spending and cooperation instruments aim to overcome poverty, and to promote sustainable development and the integration of the ACP countries and OCTs in the world economy.
For 2016, expenditure subject to audit in this area was €2.8 billion. The EDFs are funded by the EU’s Member States and are implemented through either individual projects or budget support (a contribution to a country’s general or sector budget). Each EDF is governed by its own financial regulation.
EDFs are managed outside the framework of the EU budget by the European Commission and, for some aid, by the European Investment Bank.
What we found
Is the revenue of EDFs affected by material error?
No
Reliability of the EDF accounts:
Are the payments of the EDFs affected by material error?
YesEstimated level of error:
3.3 % (2015: 3.8 %)
The 2016 accounts present fairly the financial position of the EDFs, the results of their operations, their cash flow and changes in net assets.

42A closer look at revenue and spending areas
With EU contributions to the general budget of recipient countries, the Commission has considerable flexibility in deciding whether eligibility conditions have been met. As a result, the risk of non-compliance with the applicable rules is low. This is also the case for EU funds that are pooled with those of other international donors and not earmarked for specific items of expenditure. In these cases costs that are ineligible under EU rules can often be covered by contributions of other donors.
Non-compliance with procurement rules accounted for around one-third of the overall error in the EDFs (see example below). Other important types of error include expenditure that either has not been incurred or is ineligible.
Example: Failure to comply with procurement rules
We examined payments for advisory services on trade matters. We found that the contracts underlying these payments had not been awarded following a competitive selection procedure, as required by the grant agreement. Instead, the contracts were directly awarded to advisors who had worked on a predecessor project.
For a significant proportion of transactions containing quantifiable errors, the Commission had sufficient information to prevent, or to detect and correct, the errors. Had the Commission made proper use of all the information at its disposal, the estimated level of error for expenditure for the EDFs would have been 2.6 %.
Compliance reporting by DG International Cooperation and Development (DG DEVCO)
As in previous years, as part of its efforts to reduce errors in payments, DG DEVCO commissioned a study to assess the ‘Residual Error Rate’ (RER) in expenditure in this area.
We reviewed the 2016 RER study and found that it had been conducted in compliance with the RER methodology. All weaknesses reported in our 2013 report had been addressed, with the exception of the RER-specific estimation method, which still left too wide a margin for judgement when estimating individual error rates.
In its 2016 annual activity report (AAR), DG DEVCO extended the 2015 reservation for ‘grants under direct management’ and ‘indirect management via international organisations’ to also include ‘grants and programme estimates under indirect management’. This reservation is in line with our own recommendations and observations in both this and previous annual reports.
DG DEVCO reports an amount at risk at closure taking into account the likely effect of checks in subsequent years (‘corrective capacity’). We believe that the reliability of the 2016 corrective capacity figure is still impaired since detected errors have not been fully extrapolated to the untested population and the calculation has not been reconciled with the EDF financial statements.

43A closer look at revenue and spending areas
What we recommend
We recommend that the Commission:
ο strengthen the monitoring of open but expired EDF contracts in order to reduce their number.
ο complete the revision of the terms of reference for all its audits and expenditure verifications by the end of 2017.
ο consider reducing the extent of the RER substantive testing of low-risk budget support transactions and reallocating the saved resources to increase the substantive testing of project-related transactions.
ο extend the actions in its 2017 action plan to also cover grants and programme estimates under indirect management (since it is now part of the AAR reservation).
ο further improve the calculation of the 2017 corrective capacity by addressing the shortcomings identified.
Want to know more? Full information on our audit of the EDFs can be found in the 2016 annual report on the activities funded by the 8th, 9th, 10th and 11th European Development Funds.
44Background information
The European Court of Auditors and its work
The European Court of Auditors (ECA) is the independent external auditor of the European Union. We are based in Luxembourg and employ around 900 professional and support staff of all EU nationalities.
Our mission is to contribute to improving EU financial management, promote accountability and transparency and act as the independent guardian of the financial interests of EU citizens. We warn of risks, provide assurance, indicate shortcomings and successes and offer guidance to EU policymakers and legislators on how to improve the management of EU policies and programmes. Through our work we ensure that Europe’s citizens know how their money is being spent.
Our audit reports and opinions are an essential element of the EU accountability chain. They are used to hold to account those responsible for implementing EU policies and programmes: the Commission, other EU institutions and bodies and administrations in Member States.
Our output
We produce:
ο annual reports on the EU budget and European Development Funds, including a statement of assurance.
ο special reports on selected audit topics, published throughout the year, mainly as the result of performance audits. In 2016 we published 36 special reports.
ο opinions which are used by the European Parliament and the Council when approving EU laws and other decisions with significant financial management implications, and other review-based outputs. In 2016 we published two opinions.
ο specific annual reports setting out our financial audit opinions on each of the EU’s various agencies and bodies. In 2016 we published 52 specific annual reports and two summary reports on EU agencies and joint undertakings.
ο review-based publications such as landscape reviews and briefing papers.
ο annual activity reports providing information and insight on our activities for the year.
45Background information
Audit approach for our statement of assurance at a glanceThe opinions in our statement of assurance are based on objective evidence obtained from audit testing in accordance with international auditing standards.
Reliability of the accounts
Do the EU annual accounts provide complete and accurate information?
Hundreds of thousands of accounting entries are generated by Commission directorates-general each year, taking information from many different sources (including Member States). We check that accounting processes work properly and the resulting accounting data are complete, correctly recorded and properly presented in the EU’s financial statements.
ο We evaluate the accounting system to ensure it provides a good basis for producing reliable data.
ο We verify key accounting procedures to ensure they function correctly.
ο We make analytical checks of accounting data to ensure they are presented consistently and appear reasonable.
ο We directly check a sample of accounting entries to ensure the underlying transaction exists and is accurately recorded.
ο We check financial statements to ensure they fairly present the financial situation.
46Background information
Regularity of transactions
Do the EU income and expensed payment transactions underlying the EU accounts comply with the rules governing them?
The EU budget involves millions of payments to beneficiaries, both in the EU and in the rest of the world. The bulk of this spending is managed by Member States. To obtain the evidence we need, we test income and expensed payments (i.e. interim payments, final payments and clearing of advances) directly and assess the systems by which they are administered and checked.
ο We assess the systems for revenue and expenditure to determine their effectiveness in making sure the transactions they manage are legal and regular.
ο We take statistical samples of transactions from across the EU budget to provide a basis for detailed testing by our auditors.
ο We examine the sampled transactions in detail, usually at the premises of final recipients (e.g. a farmer, a research institute, a company providing publicly procured works or services), to obtain direct evidence that the underlying event ‘exists’, is properly recorded and complies with the rules for making payments.
ο We analyse errors and classify them as either quantifiable or not.
ο We extrapolate the quantifiable errors to obtain an estimated level of error, both overall and for each area in which we make a specific assessment.
ο We compare the estimated level of error against a materiality threshold of 2 % and form an opinion.
ο Our opinions also take account of other relevant information, such as annual activity reports and reports by other external auditors.
ο We discuss all our findings with both the authorities in the Member States and the Commission to ensure the facts are correct.
Background information
All our products are published on our website: http://www.eca.europa.eu.
More information on the audit process for the statement of assurance can be found in Annex 1.1 of the 2016 annual report on the EU budget.
Our website contains a glossary of the technical terms we use in our publications (http://www.eca.europa.eu/en/Pages/DocItem.aspx?did=41732).

COPYRIGHT DISCLAIMER©European Union, 2017.
Reproduction of content other than photos is authorised, provided the source is acknowledged.
For the following photos, reproduction is authorised provided the copyright holder, the source and the name of the photographers (were indicated) are mentioned:Photos, pp. 3, 8, 21, 29, 30 (right), 45: ©EU 2017, source: European Court of AuditorsPhoto, p. 11: ©EU 2017, source: EC, Audiovisual Service/Mauro BottaroPhoto, p. 25: ©EU 2016, source: EC, Audiovisual Service/Bruno PortelaPhoto, p. 27 (left): ©EU 2015, source: EC, Audiovisual Service/Carmen JaspersenPhotos, pp. 35 and 38: ©EU 2017, source: EC, Audiovisual Service/Bruno PortelaPhoto, p. 37: ©EU 2016, EU Delegation in HondurasPhoto, p. 40: ©EU 2012, source: EC, Audiovisual Service/Cornelia SmetPhoto, p. 43: ©EU 2017, source: EC, International cooperation and development
For any use or reproduction of the following photo, permission must be sought directly from the copyright holder and the architects/engineers:
Photo, p. 15: ©European Union 2016, source: EU Council – Photo Service. Philippe Samyn and Partners architects & engineers - lead and design partner, Studio Valle Progettazioni architects, Buro Happold engineers
For any use or reproduction of the following photos, you have to comply with the conditions and restrictions set forth in the CCO license https://creativecommons.org/publicdomain/zero/1.0/legalcode:
Photos, pp. 5, 23, 27 (right), 30 (left) and 33: Source: Pixabay, CCO 1.0 Universal, public domain
GETTING IN TOUCH WITH THE EUIn personAll over the European Union there are hundreds of Europe Direct Information Centres. You can find the address of the centre nearest you at: http://europa.eu/contact
On the phone or by e-mailEurope Direct is a service that answers your questions about the European Union. You can contact this service – by freephone: 00 800 6 7 8 9 10 11 (certain operators may charge for these calls), – at the following standard number: +32 22999696 or – by electronic mail via: http://europa.eu/contact
FINDING INFORMATION ABOUT THE EUOnlineInformation about the European Union in all the official languages of the EU is available on the Europa website at: http://europa.eu
EU PublicationsYou can download or order free and priced EU publications from EU Bookshop at: http://bookshop.europa.eu. Multiple copies of free publications may be obtained by contacting Europe Direct or your local information centre (see http://europa.eu/contact)
EU law and related documentsFor access to legal information from the EU, including all EU law since 1951 in all the official language versions, go to EUR-Lex at: http://eur-lex.europa.eu
Open data from the EUThe EU Open Data Portal (http://data.europa.eu/euodp/en/data) provides access to datasets from the EU. Data can be downloaded and reused for free, both for commercial and non-commercial purposes.
Introducing and explaining the EU auditor’s 2016 annual reports The European Court of Auditors is the EU’s independent audit institution — guardians of the EU’s finances. This publication provides a summary of the main findings and conclusions of the ECA’s 2016 annual reports on the EU budget and the European Development Funds. It covers the reliability of the accounts, the regularity of income and spending and overall performance aspects of the budget. The full texts of the reports are available on www.eca.europa.eu and in the Official Journal of the European Union.
1977 - 2017