eu biomass use in a net-zero economy
TRANSCRIPT

EU Biomass Use in a Net-Zero Economy
A course correction for EU biomass

22 3
Publication details
Copyright © 2021 Material Economics Sverige AB. Some rights reserved. The material featured in this publication is licensed under the Creative Commons Attribution-NonCommercialShareAlike License. The details of this license may be viewed in full at: https://creativecommons.org/licen-ses/by-sa/4.0/
Please refer to this report as: Material Economics (2021). EU Biomass Use In A Net-Zero Economy - A Course Correction for EU Biomass
EU Biomass Use in a Net-Zero Economy A course correction for EU biomass
Per Klevnäs Per-Anders Enkvist Karl Murray Partner Founder and Managing Partner Associate Partner

2 33
PrefaceThe EU plans for a transition to net-zero greenhouse gas emissions, which will bring profound change to how we use and produce energy, and to the materials we use. Cur-rent strategies used by policymakers and business leaders foresee a substantial increase in the reliance of biomass. This study seeks to update perspectives on this topic, ahead of key decisions in the early 2020s.
How we use biomass matters. The capacity of biomass to replace fossil fuels and feedstock in a range of exis-ting applications is undoubted. But its production and ex-traction also profoundly affect natural systems. The EU is grappling with the need to tackle climate change, but also must address a twin crisis of ongoing declines in biodi-versity. International markets for food, feed, fuel, and fibre also link EU consumption to a setting of globally ongoing deforestation and other global change in land use. And of course, with biomass as with any valuable yet limited natu-ral resource, the economic value at stake in sound policy and good stewardship is tremendous.
There is therefore strong reason to revisit the role of biomass, and through a new lens. Often forgotten, bio-materials must be considered alongside bioenergy. And analyses must be brought up to date in a rapidly evolving technology landscape, where new opportunities in electri-city generation, batteries, hydrogen, and chemistry and materials science redraw the map of possibilities for both energy and materials.
This study explores these topics. It creates a new model-ling framework to compare the economic and environme-ntal performance of different applications of biomass. Its findings show an urgent need to prioritise future biomass use, as current hopes for increased use far exceed realis-tic sustainable increases in supply. With new priorities and
rapidly shifting economics, the future of biomass use looks to differ profoundly from what was imagined even three or four years ago. As this report lays out, both policy and business strategy thus should adjust to a bigger role for biomaterials, and to a selective use of bioenergy focused on the uses that maximise the value in the context of a rapidly electrifying energy system.
We hope that this study can contribute to ongoing po-licy debates and pending business decisions. Policy al-ready shapes the use of biomass heavily, having overseen a 150% increase in bioenergy use over the last two deca-des, but – it is now clear – often not succeeding in ste-ering biomass use towards the highest-value uses. Look-ing ahead, this study finds that a value of several billion Euros per year as well as uncounted biodiversity impact is at stake in affecting a course correction.
This project has been carried out by Material Economics in collaboration with the Energy Transitions Commission and the European Forest Institute. Financial support has been provided by EIT Climate-KIC, Energy Transitions Commission, European Climate Foundation, The Finnish Innovation Fund Sitra, and Vinn-ova. The Steering Group is comprised of Thomas Legge (Eu-ropean Climate Foundation), Daniel Zimmer (EIT Climate-KIC), Faustine Delasalle (Energy Transitions Commission), and Janne Peljo (Sitra). The project team has included Karl Murray, Johan Haeger, and Mark Conrad, with support from Meera Atreya, Ita Kettleborough, and Laëtitia de Villepin. Material Economics is very grateful for all the contributions of these organisations and individuals, as well as many other researchers, policymakers, and business representatives who have contributed their know-ledge and insight to this project. Partner organisations and their constituencies do not necessarily endorse all findings or con-clusions in this report. All remaining errors and omissions are of course the responsibility of the authors.
Per Klevnäs Per-Anders Enkvist Karl Murray Partner Founder and Managing Partner Associate Partner

4
EXECUTIVE SUMMARY 8
Chapter 1.
THE GROWING GAP BETWEEN EU BIOMASS SUPPLY AND DEMAND 14CLIMATE SCENARIOS FORESEE A 70–80% INCREASE IN BIOMASS USE 16PROJECTED DEMAND FOR BIOMASS IS 40–100% HIGHER THAN AVAILABLE SUPPLY 26
Chapter 2.
PRIORITISING EU BIOMASS USE IN THE NET-ZERO TRANSITION 38APPROACH AND OBJECTIVES: A FRAMEWORK FOR PRIORITISING BIOMASS USE IN THE LOW-CARBON TRANSITION 40MATERIAL USES WILL BE PARTICULARLY HIGH-VALUE AREAS FOR FUTURE BIOMASS USE 48MANY BULK BIOENERGY APPLICATIONS ARE SET TO BECOME LESS COST-COMPETITIVE 51BIOENERGY HAS A POTENTIAL ROLE IN AVIATION, BUT IS A LESS LIKELY SOLUTION FOR SHIPPING 58CARBON MANAGEMENT AND ‘NEGATIVE EMISSIONS’ CAN ADD ADDITIONAL VALUE TO BIOMASS USE 62
Chapter 3.
COURSE CORRECTION – AN INTEGRATED PERSPECTIVE ON THE BIOECONOMY 66A HIGH-VALUE SCENARIO FOR EU BIOMASS USE 68AN AGENDA FOR A HIGH-VALUE BIOMASS FUTURE 80
ENDNOTES 90BIBLIOGRAPHY 97
table of contents

4 5

66 7
A RICH AND SUSTAINABLE BIOECONOMY...
A COURSE CORRECTION IS NEEDEDCURRENT CLIMATE SCENARIOS RISK OVER-RELIANCE ON BIOMASS, CLAIMING 40–100% MORE THAN IS SUSTAINABLY AVAILABLE
biomass supply and demand for materials and energy in the EUPrimary energy equivalents in EJ per year
Demand in current climate scenarios
Available supply
18-19
11-13
≠
Existing climate scenarios require 18-19 EJ. Scenarios for individual sectors add up to more than 25 EJ
Potentially + 100% gap
Supply beyond 11-13 EJ risks major trade-offs with key environmental objectives
energy
Forestry
recycling & waste
agriculture
materials 40-70 % gap
1.
...FOR THE EUROPEAN UNION

6 77
A COURSE CORRECTION IS NEEDEDCURRENT CLIMATE SCENARIOS RISK OVER-RELIANCE ON BIOMASS, CLAIMING 40–100% MORE THAN IS SUSTAINABLY AVAILABLE
...FOR THE EUROPEAN UNION
1. MATERIAL USES WILL BE PARTICULARLY HIGH-VALUE AREAS Uses in wood products, fibre, chemicals, textiles, etc. are set to grow 1.5–2 EJ by 2050
2. TRADITIONAL BIOENERGY APPLICATIONS ARE SET TO BECOME LESS COMPETITIVE New options based in electrification and hydrogen will outcompete many uses of bioenergy in road transport, low-temperature heat, and power generation.
THE FUTURE USE OF BIOmass LOOKS DIFFERENT WITH A FOCUS ON MATERIALS AND SELECT SPECIALISED NICHES OF ENERGY USE
A NET-ZERO TRANSITION WITH LOWER BIOMASS CLAIMS IS FEASIBLE AND MORE COST-EFFECTIVE BY ABOUT 36 BILLION EUR PER YEAR 2050
Million hectares of land not converted to
Billion EUR lower annual costs in 2050
Million tonnes of avoided biogenic CO2 Million hectares of
land not converted to energy crops
land area savingscost savings CO2 savings
Billion EUR lower annual costs in 2050
Million tonnes of CO2 avoided
3736 144
2.
3.
3. FUTURE HIGH-VALUE USES OF BIOENERGY INSTEAD ARE FOUND IN HIGHLY SPECIALISED USES Includes uses within industrial heat, power systems, and aviation.
4. CARBON MANAGEMENT CAN ADD ADDITIONAL VALUE Biomass can play an important role in carbon removals, and the use of biomass for CCS and CCU can also add value to specific niches of biomass uses

88 9
Executive SummaryThis study looks at the big picture of biomass use across the EU economy and suggests ways to realise the greatest possible value from biomass resources in a transition to net-zero greenhouse gas emissions by 2050. It quantifies the economics, resource requirements, and CO
2 impacts
of a wide range of biomass options and their alternatives, across both materials and energy uses. The conclusion is that a major course correction is needed. EU policymakers and business leaders alike need to revisit their plans for future biomass use to ensure they are sustainable and eco-nomically viable.
Biomass is scarce and valuable. It cannot viably be used, at scale, in all the applications now envisioned. Continuing current trends (a 150% increase in bioenergy since 2000) will hit limitations, as current plans use 40–100% more bio-mass than what is likely to be available. Decision makers thus need to prioritise the uses with the highest economic and societal value.
In doing so, they need to account for a rapidly evolving technology landscape, where opportunities for electrifica-tion, batteries, green hydrogen, and new chemistry rapidly expand the options available. And they need to step away from seeing biomass through a lens of bulk contributions to aggregate energy targets, focussing instead on areas where the unique properties of biomass make the greatest contri-bution to a net-zero economy.
This study develops concrete guidance on these topics. It finds that materials uses of biomass – for timber, fibre, and chemicals – which are often overlooked, will increa-se in value in a transition to net-zero emissions. Bioen-ergy, meanwhile, will be less a high-volume and drop-in replacement of fossil fuels. Instead, bioenergy will need to gravitate towards specific high-value niches – such as hybrid solutions for high-temperature industrial heat; inte-grated value propositions in waste and carbon manage-ment services; and aviation fuels, until or unless hydrogen and carbon capture costs drop to levels where synthetic fuels become cheaper. Even for these niches, the analysis suggests, there will be stiff competition from alternative solutions in the long term.
The study then puts these principles to work to craft a high-value scenario for biomass use and compare it with the current vision for the future. It reveals a world of difference: The high-value scenario reduces costs by 36 billion EUR per year. It avoids 144 million tonnes of CO
2 emissions per
year. And it makes available 30–40 million hectares of land that would otherwise be needed for bioenergy crops. The high-value scenario thus also contributes to the agenda of restoring the biodiversity of European natural systems.
Taken together, this is a major shift in perspective. Cur-rent EU policymaking and many company strategies for bio-mass use are based on expectations that, in many cases, rely on outdated knowledge from 10 to 15 years ago. Tech-nology and markets have moved quickly, as has our view of the future of natural systems. An update therefore is needed.
We provide a more extensive summary of the analysis behind these findings below, with much more detail in the report itself and its technical appendices.
A COURSE-CORRECTION IS NEEDED: CURRENT CLIMATE SCENARIOS RISK OVER-RELIANCE ON BIOMASS, CLAIMING 40–100% MORE THAN WILL BE AVAILABLE
CURRENT SCENARIOS WOULD REQUIRE A 70–150% INCREASE IN BIOMASS USE FOR ENERGY AND MATERIALS COMPARED TO CUR-RENT USE
Bioenergy use in the EU is increasing, having grown by 150% since 2000 in response to policy incentives. Biomass power generation has increased fivefold, and the use of bi-ofuels in transport up to 25-fold. Total bioenergy use now stands just over 6 exajoules (EJ). (For reference, 1 EJ corre-sponds to 55 million tonnes of wood, or the harvest on 5–7 million hectares of land used for energy crops.)
Climate scenarios envision sustained additional growth. Studies from relevant European industry associations and think-tanks propose huge increases, such as 4–5 EJ for road transportation, 5–6 EJ for biogas, 7 EJ for power generation, and more than 4 EJ for chemicals. Adding other sectors, these

8 99
claims would bring bioenergy use to more than 20 EJ. Inte-grated scenarios, such as those in the European Commission roadmaps, are better at containing this. Nonetheless, they fo-resee doubling of bioenergy use by 2050, to some 11–14 EJ.
Such existing analyses often overlook biomaterials, but the EU economy already uses 4 EJ of biomass as input to wood products, pulp, and paper, etc. New uses such as tex-tiles, chemicals, and various materials are likely to grow in importance in a net-zero economy, increasing demand by at least another 1.5–2 EJ per year by 2050 (and up to 5 EJ according to some analyses).
Altogether, this means that even in the more conservative scenarios, 17–19 EJ of biomass would be used for energy and materials by 2050, more than 70% higher than today’s 10 EJ. The more ambitious scenarios are closer to 25 EJ, an increase of 150%.
SCENARIOS FORESEE USE THAT IS ~50% HIGHER THAN CAN BE SERVED BY EU RESOURCES
It is far from clear that supply to match this demand is av-ailable. Countries globally confront an acute need to reduce pressures on natural systems, including by modifying agri-cultural and forestry practices. EU policy proposals likewise envision major changes to current practices, such as making 25% of agriculture organic, committing 30% of land to nature conservation, adopting less intensive forestry practices, and reducing the use of mineral fertiliser by at least 20%.
Moreover, expanding biomass supply is not automatically carbon neutral. Its cultivation and extraction affects the CO
2
stored in vegetation and soils. Unless carefully managed, in-creasing biomass supply therefore can lead to emissions of CO
2 from these natural systems, reducing the net climate be-
nefit of replacing fossil fuels or materials with biomass.
These considerations create a wide gap between ‘technical potential’ to increase the supply of biomass via intensive extrac-tion, and a realistic scenario for supply consistent with meeting environmental goals. What is realistic is in fact highly uncertain and contested, as shown by the enormously varied assessments in existing studies. Nonetheless, three main insights emerge:
• First, it is unlikely that the EU can import much more biomass for energy and materials. Even today, additional supply of food and feed globally comes at the expense of environmentally damaging conversion of land, and needs are growing fast. Importing fuel or feedstock easily faces the same problem.
• Second, EU forests and waste and residue streams can offer at most modest increases in supply. Going much beyond 10–15% additional supply rapidly leads to major trade-offs with environmental impacts or faces practical and economic constraints.
• Third, therefore, any major increase in EU biomass supply would need to come from the cultivation of new energy crops. This would entail a major remake of EU landscapes: The 5 EJ of supply envisioned in some scenarios would require some 30 million hectares of land, equivalent to 20% of all current EU cropland, or the size of Italy. This is a bold vision for an entirely new agricultural system, but for that reason is also highly speculative. And its full impact is very hard to deter-mine. In particular, land that may seem ‘surplus’ in the shor-ter term (such as recently abandoned agricultural land) has many other potential uses on the longer time scales relevant for climate and biodiversity targets.
Putting this together, a gap between demand and supply emerges. While some optimistic scenarios propose more, a realistic scenario for available supply in 2050 sees the EU mobilise in the region of 1–3 EJ additional biomass for ma-terials and energy, for a total of 11–13 EJ. This leaves a 40–70% gap (on average ~50%) to the more than 17–19 EJ of hoped-for use that underpins current climate scenarios, and an 80–100% gap to the more ambitious sector propo-sals for future use.
There is every reason to relieve this tension. The current direction was set with good intentions, but business leaders now must align their future plans with a new set of priorities, and policymakers must revise policies to correspond to this new agenda. The alternative – having market prices driven to high levels by scarcity, and by waiting and later making sharp reductions that risk stranded assets – is much less attractive.

1010 11
THE FUTURE USE OF BIOMASS LOOKS DIFFERENT, WITH A FOCUS ON MATERIALS AND SELECT SPECIALISED NICHES OF ENERGY USE
At 11–13 EJ, biomass for energy and materials will un-doubtedly continue to make important contributions to the European economy. But as with any scarce and valuable resource, its use must be prioritised.
This study develops a framework for such a prioritisation. It covers major materials and energy uses, from chemicals to electricity to transportation, evaluating use-cases for biomass within a scenario for net-zero greenhouse gas emissions by 2050. The core question we ask is: ‘If not using biomass, what other options are available?’ For each use-case, the analysis evaluates the relative feasibility, resource efficiency, CO
2 savings, and economics of the major bio-based options
and potential alternatives also compatible with net-zero emis-sions. This enables an environmental and economic assess-ment of different future uses of biomass, providing insight both for policymaking and long-term business decisions.
The evaluation leads to three major findings:
1. MATERIAL USES – WOOD PRODUCTS, PAPER AND BOARD, CHEMI-CALS, AND NOVEL MATERIALS – WILL BE PARTICULARLY HIGH-VALUE AREAS FOR FUTURE BIOMASS USE, GROWING BY 1.5–2 EJ BY 2050
Bio-based materials production are the applications where biomass resources typically have the highest value in a net-zero context. This conclusion spans multiple materials (wood products, paper and board, textiles, and chemicals) and end-uses (construction, packaging, etc.). We find that bio-based op-tions often are cost-effective relative to other net-zero options at feedstock prices as high as 10–12 EUR/GJ equivalent – much more than what most bioenergy applications can support.
Several factors are at play. Unless prices are distorted by poli-cy, the materials properties of wood and fibre are intrinsically more valuable than their mere energy content. Likewise, the analysis suggests that the competitiveness of bio-based materials is set to increase as other, CO
2-heavy materials (e.g., plastics and cement)
face higher production costs of 40–100% in a net-zero future.
Additionally, bio-based materials have a unique role to play in carbon management of materials. Not least, they can provide an alternative to fossil carbon as the backbone of plastics and many petrochemicals. This ‘embedded’ carbon is a major but often overlooked issue. It needs to be addres-sed first and foremost through a more circular economy, but non-fossil carbon supply (including biomass) will also be needed for 20–30% of production in a net-zero economy. Biomaterials also can provide carbon storage potential in long-lived products, such as timber in construction, with a potential of 30–40 Mt CO
2 per year.
2. IN CONTRAST, MANY TRADITIONAL BIOENERGY APPLICATIONS ARE SET TO BECOME INCREASINGLY COSTLY COMPARED TO NEW OPTIONS BASED IN ELECTRIFICATION AND HYDROGEN
While biomaterials increase in competitiveness in a net-zero transition, the opposite is now true for many energy applications. The rapid development of renewable energy, falling battery costs, and prospects for much lower-cost green hydrogen jointly mean that bioenergy looks much less attractive across major energy uses:
• For road transport, total cost of ownership of battery- electric vehicles is already starting to undercut not just bio-fuels, but even that of fossil fuels for passenger transport. By the mid- to late 2030s, the same point will be reached for battery and fuel-cell vehicles for heavy goods transpor-tation, as costs fall below 0.8 EUR/km. By 2050 costs fall towards 0.5–0.6 EUR/km, widening the gap to the point that biofuels would be uncompetitive even if biomass feedstock were provided for free.
• Similarly, biomass looks uncompetitive for low-tempe-rature heat loads where heat pumps are suitable. Biomass at 2–4 EUR/GJ could compete, but actual supplies at scale are likely to cost closer to 6–8 EUR/GJ. This means bio-mass is competitive primarily in niches where local stran-ded resources, co-benefits, or amortised infrastructure can compensate.
• For biomass power generation, the costs of gene-ration are 70–100% higher than those of solar and wind power, and competitiveness would depend on achieving very high prices for short periods.
• For shipping, biofuels would be competitive with ‘green’ ammonia only at green hydrogen costs exceeding 2.5 EUR/kg. Most projections foresee a lower hydrogen price than this, especially through imports from low-cost regions, making biofuels an unlikely option in a 2050 per-spective. Overall, this is a major change in perspective. EU countri-es have spent large sums subsidising bulk power genera-tion from wood and large-scale consumption of first-gene-ration biofuels for passenger vehicles. Neither now looks likely to have any significant long-term role. The findings of this study suggest that, absent a change of course, the same logic may very well play out in other segments, such as building heating or other parts of road transport. If continued, it risks locking in valuable and scarce biomass resources to applications that not only require very large volumes to make a dent in overall carbon impacts, but are also very low-value.

10 1111
3. FUTURE HIGH-VALUE USES OF BIOENERGY INSTEAD ARE FOUND IN HIGHLY SPECIALISED USES WITHIN INDUSTRIAL HEAT, POWER SYSTEMS, AND AVIATION
This does not mean that bioenergy has no future. It can be highly valuable in several applications where its unique attributes are effectively deployed: where the resource ef-ficiency of using electricity is low, where a near-constant energy supply is required, where liquid fuels are the only option, where flexibility is key, or where biomass can help provide negative emissions.
• Hybrid solutions for high-temperature heat in industry: Bioenergy can be competitive on its own in some industrial heat applications at around 6–8 EUR/GJ, but more likely will be part of hybrid solutions to back up electricity or hy-drogen. Pulp and paper production is a special case. The use of by-products is part and parcel of the pulp produc-tion process, but there is significant potential to ‘free up’ biomass by using electricity for lower-temperature heat in paper production.
• Liquid fuels for long-haul aviation: The continued need for liquid fuels makes aviation a major contender for future biofuel use. However, even here, there may be alter-native options. Imports to the EU of synthetic fuels powered by internationally available low-cost hydrogen at 1.3–1.6 EUR per kg could achieve cost parity with biofuels produ-ced from energy crops, at feedstock costs of 6–8 EUR/GJ. If the cost of capturing carbon dioxide directly from air falls further (to 100 instead of 200 EUR/tCO
2), synthetic
fuels look substantially cheaper for most plausible costs of biomass feedstock.
• Power system uses would be concentrated in small niches. The main high-value opportunity would be backup capacity or seasonal flexibility once wind and solar power reach very high shares. Biomass might then make a valuable contribution of 5–10% of power generation in some markets. However, the jury is out on this role. Some studies suggest other solutions for power system flexibility would in fact be cheaper, including overbuilding renewable energy supply in combination with hydrogen and energy storage. Biomass power therefore faces strong competition and an uncertain future even in this much smaller niche.
• ‘Negative emissions’ and other co-benefits. The use of biomass energy with carbon capture and storage (BECCS) looks most competitive where large-scale bioe-nergy is anyway likely, such as pulp production, waste in-cineration, and potentially facilities for biofuels production. Power sector uses of BECCS are much less certain, given high costs from 80 to as much as 160 EUR per tonne CO
2
stored. The option to store carbon may also be overtaken by the option to use it as feedstock. Long-term cheap hy-drogen at 1–1.5 EUR/kg would make CO
2 from biomass a
viable feedstock for some materials, fuels, and chemicals.
A NET-ZERO TRANSITION WITH LOWER BIOMASS CLAIMS IS FEASIBLE AND MORE COST-EFFECTIVE BY ABOUT 36 BILLION EUR PER YEAR IN 2050
Putting these findings to work, the study explores dif-ferent scenarios for biomass use by 2050. As noted, ‘bu-siness as usual’ (BAU) scenarios propose an increase in biomass use of 7.5-8.5 EJ. We compare this BAU with a ‘high-value’ scenario, constructed on the principles outlined above. The high-value scenario has several advantages:
• Costs: The capex and opex of meeting the required en-ergy services and materials production are 36 billion EUR per year lower in 2050 in the high-value scenario than in the BAU scenario. The average abatement cost is 85 EUR/t CO
2 lower across the 6.5 EJ of bioenergy use avoided.
• Land use: The total net land area required in the high-value scenario (even accounting for that required to produce electricity instead) is 90% lower. It avoids the conversion of 37 million hectares of land to the production bioenergy crops, in turn reducing long-term pressures on biodiversity loss: both through reduced direct land claims, by creating opportunities for less intensive methods in forestry and agricultural produc-tion, and by reduced competition with agricultural production.
• CO2 emissions: The high-value scenario avoids some 144 million tonnes of CO
2 that risk being released by incre-
asing supply as required in the business-as-usual scenario. Producing and extracting biomass can lead to substantial re-lease of CO
2 that would otherwise be stored in vegetation and
in soils. These emissions vary – both with how well-managed biomass production is, and with the exact types of biomass – but studies for the EU show that they can increase fast as additional biomass needs to be mobilised from energy crops and forests. The analysis suggests that the 144 Mt CO
2 could
grow as high as 370 Mt CO2 if incremental supply came from
less well-managed forests and energy crops.
For the high-value scenario to be feasible, a range of ena-blers must be put in place. Hydrogen costs must fall, and electri-city must be mobilised with zero greenhouse gas emissions. Solutions for power system flexibility are important, as are global supply chains for cost-effective ammonia and synthetic fuels for shipping and aviation. These technology platforms are thus high priorities not just for a cost-effective transition to net-zero emis-sions, but also to reduce pressure on natural systems.
Resource efficiency and a circular economy also stand out as key factors to enable a high-value scenario. Some 1100 TWh of electricity is required instead of 1800 TWh biomass, of which 500–700 TWh would need to be mobilised within the EU itself. The number could easily grow higher if buildings were less efficient, transportation grew faster, recycling were more limited, or materials efficiency opportunities not realised. This is one of many reasons to pursue a more circular economy.

1212 13
This analysis points to a clear agenda. As the EU consi-ders the revision of the key policy areas that affect biomass use, the overall policy package should be one that enables high-value uses. Past policy to promote biomass power and transport fuels is now rapidly being outrun by technology. This serves as a caution against using similar earmarked and centrally directed mandates or subsidies for biomass in the future. The analysis also suggests the importance of a level playing field for biomaterial and bioenergy uses, and for making distinctions between biomass supplies with low and high environmental impact. It also underlines the need for caution in promoting the use of imported biomass, as guaranteeing supply without effects on land-use is structu-rally very difficult.
For companies, the analysis highlights the importance of taking a very strategic view of future biomass use. As the dynamics identified above plays out, low-value uses carry the risk not only of expensive future adjustments, but also of stranded assets. The rapid pace of technological change makes any bet against current trends very risky.

12 1313

1414 15
The growing gap between EU biomass supply and demand
In this chapter, we review assessments of the biomass supply available within the EU and contrast these with pro-posed scenarios for future biomass use. A clear picture emer-ges of a gap between hoped-for levels of use in current clima-te mitigation scenarios and the levels of biomass supply that are compatible with other targets for sustainability.
Demand scenarios envision a near-doubling of bioener-gy use and a roughly 50% rise in biomaterials production, resulting in an increase from today’s 10 exajoules (EJ) of demand to as much as 18–19 EJ by 2050 (Exhibit 1). The proposed increase spans a wide range of sectors, including biofuels for heating, power, transport, and industrial heat, and increased production of timber, fibre, and chemicals.
In contrast, expanding supply to these levels is much har-der. Existing studies span a wide range, but no source of biomass can provide large increases without trade-off. Weig-hing a range of factors, we find that the EU’s biomass supply could be increased by 1–3 EJ per year, for a total of 11–13 EJ per year.
That leaves a gap between proposed future use and av-ailable supply of 5–8 EJ per year to 2050. By way of com-parison, 8 EJ is equivalent to 62% of EUs total agricultural production – a massive amount of land or energy.1
Chapter 1

14 1515

1616 17
Climate scenarios foresee a 70–80% increase in biomass use
Bioenergy use in the EU has increased by 150% since 2000, reaching 6 EJ. To this is added just over 4 EJ of bio-mass used for materials – chiefly wood, pulp, paper, and board. Climate scenarios foresee a major increase, from to-day’s 10 EJ to some 17–18 EJ by 2050. Individual sectors have proposed still higher increases, to as much as 25 EJ.
THE EU USES 10.3 EJ PER YEAR OF BIOMASS, OF WHICH 40% IS FOR MATERIALS AND 60% FOR ENERGY
The use of biomass is an essential part of our society and economy. A range of products from agriculture and fo-restry provide the food we eat and feed for animals; fibre and feedstock for biomaterials such as timber, textiles, pa-
per, board, and chemicals; and fuel for a range of bioenergy energy uses in transport, heating, electricity and more.
The different aspects of the bioeconomy – food/feed, bioenergy, and biomaterials – are seldom discussed to-gether, so projections for future production and land use for each category tend not to consider competing demands from the others. Yet ultimately, all biomass is derived from the same agriculture and forestry systems.
Even the same resource can have multiple potential and rival uses: wood can be a construction material, a fuel, or a source of fibre, and many biofuel feedstocks can also be food or animal feed. Biomaterials and bioenergy systems are tightly linked as well. For example, a large share of bioenergy is derived from by-products from the production of wood pro-ducts or pulp or from post-consumer wood resources.

16 1717
SCENARIOS FOR FUTURE BIOMASS USE EXCEED AVAILABLE SUPPLY BY 40–70% BY 2050
Exhibit 1
SOURCE: MATERIAL ECONOMICS ANALYSIS BASED ON MULTIPLE SOURCES. FOR MORE INFORMATION, SEE EXHIBIT 4 FOR DEMAND IN CURRENT CLIMATE SCENARIOS AND EXHIBIT 9 FOR AVAILABLE SUPPLY IN THE EU.
Note: 1 Primary energy equivalents have been used as the measure for both materials and energy in this study to make values comparable. Materials have been converted from mass (kg) or volume (m3) to energy by the specific energy density of the material. The energy is also measured in primary rather than final energy form, to account for conversion losses in the
production of biofuels. The values shown exclude biomass for food and feed and are for EU27 + UK.
2050 biomass supply and demand for materials and energy in the EUPrimary energy equivalents in EJ per year1
Demand in current climate scenarios
Available supply
18-19
11-13
≠12-13
7
2
2-3
6
Existing climate scenarios require 18-19 EJ. Scenarios for individual sectors add up to more than 25 EJ
Potentially 5-8 EJ gap
Supply beyond 11-13 EJ risks major trade-offs with key environmental objectives
energy
Forestry
recycling & waste
agriculture
materials 40-70 % gap
Current demand
and supply (~10)

1818 19
CURRENT BIOMASS USE IS SPLIT BETWEEN 40% MATERIALS, 60% ENERGY
The EU currently uses around 10.3 EJ per year of bio-mass primary energy equivalents for materials and energy (Exhibit 2). In energy terms, this amounts to about 2900 Terawatt-hours (TWh), which happens to be roughly the total gross electricity consumption of the EU 27 (2941 TWh in 20182). One EJ is thus a very large amount. It is equivalent to 55 million tonnes of wood, or the output of 5–7 million hectares of cropland, one-third of the total agricultural area of Germany.3 (We use EJ, an energy unit, as the common measure throughout this report, even though materials are usually measured by mass or volume. For details on our methodology, please see the box on page 45.)
Just over 40% of EU biomass are used to produce ma-terials. Of these, the largest subsector is solid wood pro-ducts, followed by pulp and paper production. Only small volumes of biomaterials are now used for textiles and che-micals, but those subsectors are expected to grow fast (Ex-hibit 5). Within bioenergy uses, electricity and heat are the largest applications, accounting for 4.4 EJ per year; the rest is mainly in road transport. In absolute terms, the largest EU bioenergy users are Germany, France, Italy, Sweden, and the UK. In per capita terms, however, the Nordic and Baltic countries and Austria are the largest users.4
BIOENERGY USE HAS GROWN BY 150% SINCE 2000, DRIVEN LARGELY BY POLICY
In the last two decades, the patterns of EU biomass use have changed quickly. Since 2000, bioenergy use has incre-ased by 150% to 6.2 EJ in 2019 (Exhibit 3 on page 18). For example, the use of biomass for power generation grew by 1.3 EJ (350 TWh) between 2000 and 2019; more than solar and wind power combined. In the transport sector, the use of biofuels grew from a negligible 0.03 EJ in 2000, to 0.73 in 2019. Material uses have had a more modest growth. The EU production of sawnwood increased 13% and wood-based panels increased 22%, while paper and board had a negative growth of 1% between 2000 and 2019.6
The growth in bioenergy use has happened largely as the result of policy. Starting in 2001 and reinforced with the adoption of renewable energy targets in 2009, the EU has had a range of subsidies and quotas to encoura-ge the use of bioenergy. In fact, a decade ago, the first Member State Renewable Energy Action Plans developed to comply with the 2009 Renewable Energy Directive fo-resaw much more aggressive increase still, adding up to as much as 10 EJ per year of energy from biomass already by 2020, of which more than 80% would have been for heat and power.7 This has not materialised, but it illustrates the extent to which policy has aimed for rapid and large-scale increases. EU Member State subsidies to bioenergy also have continued to grow, and now stand at 14 billion Euro per year.8

18 1919
10.3 EJ of biomass is used per year for materials and energy production
Exhibit 2
SOURCE: MATERIAL ECONOMICS ANALYSIS BASED ON MULTIPLE SOURCES.5
Notes: 1 Biomass use for materials is based on 2015 data (JRC) and biomass use for energy is 2019 data (Eurostat). 2 The values shown are for EU27 + UK. Primary energy equiva-lents have been used as the measure for both materials and energy in this study to make values comparable. Materials have been converted from mass (kg) or volume (m3) to energy
by the specific energy density of the material. The energy is also measured in primary rather than final energy form, to account for conversion losses in the production of biofuels.
MATERIALS AND ENERGY FOOD AND FEED
HEATING
Animal feed
POWER
Plant-basedfoods
INDUSTRY
OTHER ENERGY
WOOD PRODUCTS
PULP PRODUCTION
ROAD TRANSPORT
1.6
2.3
1.0
0.7
2.8
1.3
2.8
10.6
10.3
13.0
MATERIALSWood and fibres can be used to create paper packaging, buildings, furniture, etc. Biomass can also be used as feedstock in chemicals production.
ENERGYBioenergy is versatile and can replace fossil fuels in a range of existing applications.
FOOD AND FEEDThe agricultural and fishing sectors provide food to the more than 500 million people living in the EU.2
0.2
6.2
4.1
Biomass use in the EUEJ per year, latest available data1

20 2120
Bioenergy use has increased by 150% since 2000, driven largely by policy
Exhibit 3
SOURCE: MATERIAL ECONOMICS ANALYSIS BASED ON EU ENERGY BALANCES FROM EUROSTAT.9
Note: The pulp and paper industry consumes around 50% of the bioenergy used in industry.
heating
increase 2000-2019
industry
power
road transport
other
2000 2005 2010 2015 20190
0.5
1.0
1.5
2.0
4.5
2.5
5.0
3.0
5.5
3.5
6.0
4.0
6.5
+150%
x 3.0
x 25
x 4.7
x 1.5
x 1.9
Renewable Electricity Directive, EU starts to promote electricity produced from renewable energy
Use of Biofuels and Renewable Fuels Directive, EU promotes the use of biofuels and other renewable fuels for transport
Renewable Energy Directive (RED I), with energy targets for 2020 (including targets for renewable fuel use in transport)
Member States elaborate National Renewable Energy Action Plans to promote the use of renewable energy, including biomass
Member States elaborate National Renewable Energy Action Plans to promote the use of renewable energy, including biomass
EU Emissions Trading System launched to drive the reduction of greenhouse gas emissions across sectors
Bioenergy use over time in the EU EJ per year
20 2121
A course correction is needed: Current climate scenarios risk
over-reliance on biomass
2222 23
CLIMATE MITIGATION SCENARIOS FORESEE A +70–140% INCREASE IN FUTURE BIOENERGY useExisting scenarios for how the EU might reach its clima-te targets imply a continuation of these trends. Most assume a doubling of bioenergy use to 2050, to some 12–13 EJ (Exhibit 4). Transport, including road transport, has long been seen as a major end-use sector, but many scenarios also see a continua-tion or increase of bioenergy use in power and heat generation. Scenarios with ‘negative emissions’ likewise see higher levels of bioenergy use (as bioenergy with carbon capture and storage, or BECCS) – a pattern also seen repeated globally. While the-re is variation in proposed use patterns, the consensus is that bioenergy use needs to nearly double to meet climate targets.
These scenarios foresee a very large increase, but they are still modest compared with the increases foreseen in studies of individual sectors. For example, a 2018 study commissioned for the EU refinery industry proposed that around 4 EJ of additional biomass should be dedicated for road transport fuels.11 Another study for EU gas companies proposed that 5.5 EJ more biomethane (biogas) should be used in 2050, most of it produced from dedicated energy crops and agricultural residues.12 Similarly, a study of the EU 2050 power sector foresaw that 7 EJ of biomass would be used for power generation.13 Just adding up those es-timates amounts to 16 EJ of biomass use for bioenergy, even excluding major uses such as solid fuels used for heating, aviation, shipping, etc. that each could add seve-ral EJ if they followed the same logic.

22 2323
2050 biomass use for EU energy and materials in climate scenarios and sector studies
Exhibit 4
SOURCE: MATERIAL ECONOMICS ANALYSIS BASED ON MULTIPLE SOURCES, SEE ENDNOTES.10
Notes: 1 A sensitivity analysis of the “Circular and life change scenario” (1.5LIFE –LB) shows a way to reach net-zero emissions with 9.0 EJ of biomass. 2 Biomass use for materials is based on 2015 data (JRC) and biomass use for energy is based on 2019 data (Eurostat). 3 The values shown are for EU27 + UK. Primary energy equivalents have been used as the measure for
both materials and energy in this study to make values comparable. Materials have been converted from mass (kg) or volume (m3) to energy by the specific energy density of the material. The energy is also measured in primary rather than final energy form, to account for conversion losses in the production of biofuels (for details see our methodology). 4 A biomass use of 6.0 EJ
per year for material use has been added to the climate scenarios to estimate the total biomass use for both materials and energy.
Scenarios for sustainable biomass use in climate scenarios and sector studiesEJ per year, EU3
4.1
6.2
~11.7 12.2 ~12.8
18
7
10.3
~17.7 ~18.2~18.8
25
Material use is not included in climate scenarios
Climate scenarios foresee a doubling in bioenergy use
~71%~76% ~82%
~140%
Current(latest available data)2
International Energy Agency (IEA)
The ‘2°C Scenario’ uses 11.5 EJ of biomass and waste by 2050 and the ‘Beyond 2°C
Scenario’ use 11.8 EJ
International Renewable Energy
Agency (IRENA)The climate scenario
(REmap) uses 12.2 EJ of biomass by 2030.
EU Commission’s Long-Term Strategy
7 scenarios use 12.0-13.5 EJ of bioenergy by 2050, while one based on energy efficiency uses 10.7 EJ.1
scenariois forindividual sectors
+ high-end scenariosBy adding claims from
sector studies and high-end scenarios total demand could reach up to 25 EJ
energymaterials
Climate scenarios for a low-CO2 transition4 Bottom-up analysis + high-end scenarios

2424 25
Moreover, these analyses often do not consider biomass demand for materials production, even though, as noted above, it accounts for as much as 40% of current biomass use. That is a particularly concerning omission because se-veral current biomaterials markets are set to grow, and the transition to a net-zero economy will create demand for enti-re new uses for biomass as materials.
Demand for existing applications, such as solid wood products and pulp and paper, is expected to grow in the EU to replace more carbon-intensive materials, such as cement and steel in construction or plastics in packaging. Combined with underlying demand growth in these sectors, they could grow to 5 EJ per year. Likewise, significant demand growth is expected for biomaterials for chemicals and plastics. To reach net-zero emissions, the chemicals industry could require 1–2 EJ per
year of biomass.14 The level needed depends strongly on how successfully other options are pursued (e.g., increased plastics recycling). In one analysis which did not consider large-scale recycling, biomass needs were more than 4 EJ15 – meaning that the future chemicals sector would use more biomass than is used in all of power generation, road transport, and industry today. All in all, an increase of demand for biomaterials on the order of 50% thus needs to be accounted for, or around 6 EJ of biomass resource by 2050 (Exhibit 5).
Taken together, there thus is no shortage of proposed uses for biomass in the future. Bottom-up estimates of indi-vidual sectors add up to 25–30 EJ. Integrated scenarios try to constrain this, but still end up in the range of 17–18 EJ. The question therefore is how this view of the future compa-res to the available supply.

24 2525
Biomaterials cover a wide range of applicationsExhibit 5
SOURCE: MATERIAL ECONOMICS ANALYSIS BASED ON MULTIPLE SOURCES, SEE ENDNOTES.16
Notes: 1 Primary energy equivalents have been used as the measure for both materials and energy in this study to make values comparable. Materials have been converted from mass (kg) or volume (m3) to energy by the specific energy density of the material. For details, see our methodology. The values shown are for EU27 + UK.
Potential biomass demand 2050 EJ per year1
Pulp and paper
Solid wood products
Textiles
Chemicals
New materialS
Examples of applications
Products from pressed and dried wood pulp
New biobased materials created from fibres
Products made from sawnwood or wood-based panels (plywood, particle board)
Textiles from manmade cellulosic fibres (MMCFs) created from dissolved pulp
Chemicals produced using biomass or biogenic CO2 as a feedstock
Newsprint, graphic paper, sanitary paper, and packaging board (paper packaging and paper bags).
Bio-based graphite used for e.g., utility scale stationary storage, 3D printed biopolymer batteries, biocarbon bricks for construction, water buffers and soil conditioners, feed carbon for livestock, nanomaterials for biomedical applications (antimicrobial, etc.), novel bio-based polymers for packaging etc.
Potentially up to 4.8 EJ
Highly uncertain
Furniture (tables, chairs, bookshelves), construction (wooden walls, floors, outdoor decks), engineered wood products (such as cross-laminated timber), other wooden products (e.g. tree boats, wooden toys, EU pallets for material handling), etc.
Can replace polyester, cotton, or silk in clothing or hygiene products (wipes/tampons).
Nearly the full range of petrochemicals products can in principle be produced from basic chemicals derived from biomass feedstock, including plastics, detergents, solvents, fertilisers, pesticides, explosives, fibres, rubbers, paints, resins, etc.
1.1 - 2.0
>0.5
0.2
1.4 - 1.8
3.0 - 5.6

2626 27
CURRENT BIOMASS SUPPLY IN THE EU IS 10.2 EJ, WITH FORESTRY THE LARGEST SOURCE
The supply of biomass for materials and energy comes from three main sources: forestry, agriculture, and waste streams. In total, the European biomass supply for materials and energy stands at 10.2 EJ per year (Exhibit 6). While the EU is a major exporter and importer of food and feed, net im-ports of biomass for energy and materials are relatively small, adding 0.2 EJ per year to this.17
Projected demand for biomass is 40–100% higher than available supply
EU supply and demand of biomass largely balance to-day, with only small imports. However, increasing supply to match the large increase in demand would be very difficult. A range of constraints place limitations, including an im-perative to reverse biodiversity loss, the need to limit CO
2
effects from biomass production, and commitments to miti-gate environmental impacts such as nitrate pollution. Aga-inst this backdrop, an 8 EJ increase (as implied by demand scenarios) is very unlikely. More realistic scenarios instead would involve a much more modest increase of 1–3 EJ (see below). This leaves a 40–100% gap relative to the large increases in demand.
FORESTRY IS THE BIGGEST SUPPLY SOURCE, WITH 7.2 EJ PER YEAR OR MORE THAN HALF OF ALL BIOMASS SUPPLY
This category includes primary wood (4.4 EJ per year), used mostly for the manufacturing of solid wood products and pulp and paper, and 1.8 EJ of industrial residues and by-products from wood-processing industries (Exhibit 7 on page 26) . In addition to this, 1.0 EJ of unaccounted sources of woody biomass is used per year, which to a considerable extent is unreported harvesting of primary wood.19
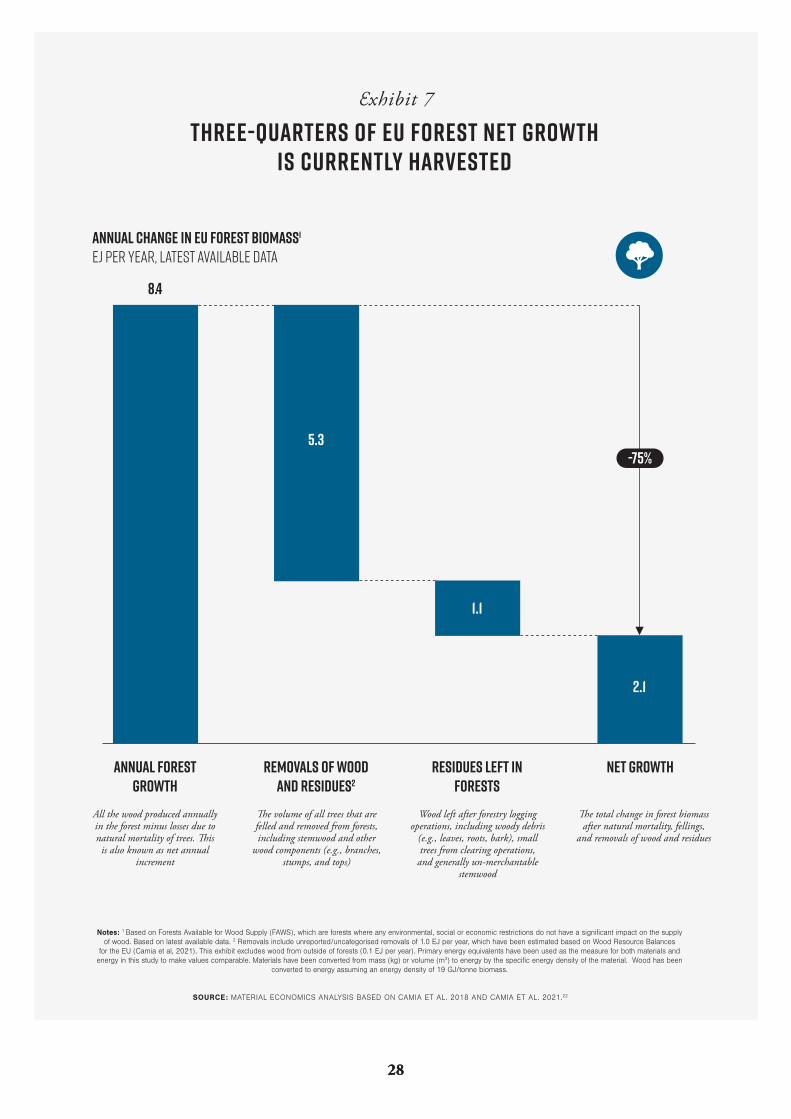
Total land use for forests in the EU-27+UK is 161 million hectares, or 38% of the total land area.20 In total, the amount of biomass in these forests grows by an amount correspon-ding to just over 8 EJ per year (after natural mortality). After fellings, new biomass equivalent to some 2.1 EJ (25%) is left as net annual growth (Exhibit 7). That is already a high rate of removals, and an important reason why it is not even higher is that the EU’s forests are relatively young, which means that they are in a stage of relative rapid growth.21

26 2727
EU biomass supply for materials and energy is 10.2 EJ, 70% of which is woody biomass
Exhibit 6
SOURCE: MATERIAL ECONOMICS ANALYSIS BASED ON MULTIPLE SOURCES.18
Notes: 1 Current supply differs from the current demand (Exhibit 2) because of net trade (0.2 EJ) as well as rounding and unit conversion. Manure is excluded as a source of biomass and assumed to be used for food and feed production. Total aquatic biomass production in the EU is 0.03 EJ per year and currently used almost
exclusively for food. 2 Based on latest available data (mostly from 2013). The values shown are for EU27 + UK.
Supply of biomass for materials and energy use generated in the EUEJ per year, latest available data2
3.8
1.0
0.6
1.8
0.8
0.7
0.6
0.3
0.5
1.41.57.2 10.21
Wood removals
unaccounted / unknown removals
Woody biomass
Agricultural biomass
Recycling and waste
Residue removals
Industrial by-products
Agricultural crops
Agricultural residues
Paper waste
Wood waste3
Other waste
Total for materialsand energy
Harvested wood from forests (3.7 EJ) and from trees outside of forests (0.1 EJ)
Wood Resource Balances show a ~13% gap between sources (primary and secondary resources) and uses of woody biomass
Harvested forestry residues (also known as primary forestry residues)
Includes industrial residues such as black liquor, sawdust, and other by-products
Agricultural crops grown for energy (Energy crops)
Harvested residues from crops, both food and non-food crops. Not including manure.
Paper and cardboard recycled to new products or incinerated for energy
Recovered wood from e.g., pallets, households, as well as demolition of buildings
Includes animal and mixed food waste, vegetal waste, household waste, and sludges
28 2928
Three-quarters of EU forest net growth is currently harvested
Exhibit 7
SOURCE: MATERIAL ECONOMICS ANALYSIS BASED ON CAMIA ET AL. 2018 AND CAMIA ET AL. 2021.22
Notes: 1 Based on Forests Available for Wood Supply (FAWS), which are forests where any environmental, social or economic restrictions do not have a significant impact on the supply of wood. Based on latest available data. 2 Removals include unreported/uncategorised removals of 1.0 EJ per year, which have been estimated based on Wood Resource Balances
for the EU (Camia et al, 2021). This exhibit excludes wood from outside of forests (0.1 EJ per year). Primary energy equivalents have been used as the measure for both materials and energy in this study to make values comparable. Materials have been converted from mass (kg) or volume (m3) to energy by the specific energy density of the material. Wood has been
converted to energy assuming an energy density of 19 GJ/tonne biomass.
Annual change in EU forest biomass1
EJ per year, latest available data
5.3
1.1
2.1
8.4
Annual forest growth
Net growthRemovals of wood and residues2
Residues left in forests
All the wood produced annually in the forest minus losses due to natural mortality of trees. This
is also known as net annual increment
The volume of all trees that are felled and removed from forests, including stemwood and other
wood components (e.g., branches, stumps, and tops)
The total change in forest biomass after natural mortality, fellings,
and removals of wood and residues
Wood left after forestry logging operations, including woody debris
(e.g., leaves, roots, bark), small trees from clearing operations,
and generally un-merchantable stemwood
-75%

28 2929
Current biomass supply in the EU is 10.2 EJ, 70% of
which is woody biomass

3030 31
AGRICULTURE PRODUCES 19 EJ PER YEAR IN TOTAL, OF WHICH 1.5 EJ ARE USED FOR MATERIALS AND ENERGY
Across the EU, 167 million hectares, or 39% of all land, is used for agriculture, producing output of 19.4 EJ per year (Exhibit 8). Crop production leads to a large amount of re-sidues, estimated at 7.1 EJ. Just under a quarter of these are extracted, mostly for bedding for animals (1 EJ) and for energy production (0.7 EJ).23
Dedicated energy crops amount to 0.8 EJ per year. This production currently uses 5.5 million ha, or 3.2% of the EU’s total cropland.24 Almost all current energy crops are food crops, such as wheat or sugar beet fermented to ethanol, or oils refined to transport fuels such as HVO (biodiesel).
In contrast, non-food or ‘second-generation’ energy crops account for only a fraction of bioenergy crop production, less than 0.1 EJ.25
WASTE AND RECYCLED BIOMASS PROVIDE 1.4 EJ PER YEAR The final major category of biomass supply is waste and recycled biomass. This amounts to an estimated 1.4 EJ, or 14% of total supply. The main categories are paper and cardboard waste, wood waste, and municipal waste.
For individual categories, recycling rates are comparati-vely high. For example, 59% of end-of-life paper and board used in packaging is recycled, a share on par with the highest recycling rates for metals (around 85% for steel, 70% for alumi-nium).28 This means that as much as 60% of the fibre used in EU paper and board production already is recycled fibre.29 In most other categories, circularity is more limited, and as much as 0.8 EJ of biomass is landfilled every year.30 Also, although data are uncertain, around 0.7 EJ are used as bioenergy and thus permanently made unavailable for further use, putting a limit to how circular biomass flows can become.31
As we discuss below, further increases in circularity and in the valorisation of waste and residue streams offer a key potential source of additional supply, as they create much less pressure on natural systems than do other potential increases in biomass supply.

30 3131
8% of agricultural production is available for materials and energy uses
Exhibit 8
SOURCE: MATERIAL ECONOMICS ANALYSIS BASED ON DATA FROM JRC.26
Note: 1 Primary energy equivalents have been used as the measure for both materials and energy in this study to make values comparable. Materials have been converted from mass (kg) or volume (m3) to energy by the specific energy density of the material. The values shown are for EU27 + UK.
Agricultural pro-duction available for materials and
energy
Current agricultural production and use of agricultural biomass in the EUEJ per year, latest available data
Grazed biomass
Crop production
Residue production
2.3
13.0
5.4
10.0
7.1
19.4
14.4
Production Residues left on field
Net trade supply Food and feed use
Material and energy use
0.4
8%
1.5
3232 33
REALISTIC SCENARIOS ENVISION ONLY MODEST INCREASES OF BIOMASS SUPPLY OF 1–3 EJ TO 2050
Compared to the demand side, the future supply of biomass contains more uncertainties and disagreements in the literature and among experts. However, reviewing exis-ting studies and research of this topic, we find little room for a massive expansion of biomass production for energy and materials.
Scenarios differ very widely for at least three major re-asons. First, there is significant uncertainty even about cur-rent supply in some categories. Added to this, there is high intrinsic uncertainty about the evolution of highly complex natural systems, especially under climate change. It is not unusual to find a tenfold difference between assessments for individual flows – whether a particular category of resi-due, or an economically viable waste stream.
Second, there are widely different views on what is re-quired to achieve sustainability goals. For most types of bio-mass, beyond some level there is a clear trade-off between increasing supply and incurring some negative effect on other sustainability goals such as biodiversity or ecosystem health. But assessments differ widely in where that level might be, depending on forest type, ecosystem characteristics and ma-nagement practices including the type of biomass extracted. To some stakeholders, current practices already lead to eco-
system degradation beyond what is acceptable, and scenari-os for the future therefore would need to consider much less biomass extraction. To others, the gains from use of biomass (including environmental benefits relative to alternatives) instead seem so valuable that they outweigh the impacts on natural systems of producing it. While there is sophisticated modelling, most studies tend to assume only minor changes on current practice, or as an alternative the implications of a major expansion of supply. There are few assessments that account for sustainability priorities as stringent as what is now being envisioned in recent EU policies and proposals to pre-serve biodiversity and to change farming methods.
Finally, high assessments tend to be for ‘potentials’ that do not consider the cost of supply which often rises steeply for hard-to-get resources. Especially for waste and residues, these are often very significant barriers.
As a result, scenarios differ between almost no increa-se beyond current levels if summing conservative assessments across all categories, to as much as an additional 10 EJ if sum-ming all the most optimistic or least constrained estimates (Exhi-bit 9).32 The analysis carried out for this study suggests a poten-tial of 1–3 EJ additional supply from forests, waste and residues, and energy crops.33 The discussion below details the reasoning behind this conclusion for each major category of supply.

32 3333
FUTURE AVAILABLE BIOMASS SUPPLY FOR ENERGY AND MATERIALS IS IN THE RANGE 11–13 EJ PER YEAR
Exhibit 9
SOURCE: MATERIAL ECONOMICS ANALYSIS BASED ON MULTIPLE SOURCES, SEE ENDNOTES.34
Future sustainable supply of biomass for materials and energy use in the EUEJ per year
Woody biomass
Agricultural biomass
Recycling and waste
wood removals4
Category commentcurrentsupply
Potentially available
supply 20501Range of values based
on existing studies2
4.9 4.9-5.1 4.8-5.6
0.6 0.6-0.7 0.4-0.8
0.6 0.8-0.9 0.5-1.0
0.5 0.8-1.0 0.5-1.2
0.3 0.4 0.3-0.5
0.8 1.0-1.80.2-5.6
0.8-3.10.7 1.0-1.5
1.8 1.7 1.6-1.7
Agriculturalresidues
Industrial by-products
Wood waste
total: 10.2 11-13 9-20
residue removals
Paper waste
Agricultural crops(Energy crops)
Other waste3
Outtakes can increase slightly by harvesting more of the forest growth. The szustainable supply is limited by environmental aspects such as biodiversity and soil health. The upper limit of 5.6 EJ is the total technical and sustainable potential without any economic considerations.
The potential from energy crops varies a lot by source and is dependent on land used for growing the crops. Currently 5-6 million hectares of land is used to grow energy crops in the EU – and the supply from this land could increase 0.2 EJ per year if switching from the current food-crops to more efficient energy crops. According to higher estimates, the potential could reach up to 5.6 EJ in a sustainable manner, but this would require 35 Mha (approximately the size of Germany).
Harvest rates of agricultural residues can sustainably increase to 30%, or even 50% according to some sources, which would mean a supply of 2.1 to 3.5 EJ. The supply for materials and energy is lower than this as some of the agricultural residues will be used for food and feed (currently this value is 0.9 EJ). It will moreover be infeasible to harvest all these residues as mobilisation often requires changes in farming practices and because of the cost of harvesting and handling the biomass.
Available paper and cardboard waste will increase as the EU tries to minimize the amount of waste sent to landfill, and instead recycle or incinerate the paper that has reached its end of life.
The supply from other waste streams will rise from better collection and better use of the waste generated. The main potential is from household and similar wastes that can potentially increase to 0.6 EJ up from current levels of 0.2 EJ per year.
Waste from wood is likely to increase modestly over time according to most sources. Lower levels of landfill will increase the share of post-consumer wood that is either recycled or incinerated for energy. Today, 0.15 EJ of wood waste is permanently disposed to landfills or incinerated without using the energy.
Supply from primary forest residues can increase with higher removal rates from forests. Currently one third of the net annual increment of residues (branches, bark, etc,) is harvested and removed from forests. Changing the removal rate to 50% would increase the supply to 0.8 EJ, but this would rapidly create risks of adverse impacts (carbon cycle, biodiversity).
The supply of biomass from industrial by-products and residues is estimated to marginally decrease over time.
Notes: 1 Material Economics estimate taking into account technical, economic, and sustainability constraints as outlined in existing studies. 2 The range is estimated by Mate-rial Economics and is a broad indication of relevant data from the main available studies. Some of these studies look only at environmental constraints and exclude economic constraints. Most studies also focus on the supply for bioenergy, excluding biomass use for materials. 3 What is included in the category ‘waste’ varies by source, complicating comparisons; for example, some include industrial by-products and residues in this categories (whereas this representation shows these in the category of woody biomass).
Primary energy equivalents have been used as the measure for both materials and energy in this study to make values comparable. Materials have been converted from mass (kg) or volume (m3) to energy by the specific energy density of the material. The values shown are for EU27 + UK

34 3534

34 3535
BIOMASS FEEDSTOCK PRODUCTION AND EXTRACTION HAVE MAJOR IMPLICATIONS FOR ENVIRONMENTAL OBJECTIVES
Assessments of the potential future supply of bioenergy are made amid significant uncertainties about how different scenarios for production and extraction could affect natural systems. There are three key factors to consider:
1) Biodiversity impacts. The first full assessment of EU ecosystems found a ‘dire picture’ for biodiversity and ecosys-tems in Europe.35 It found that biodiversity is declining rapid-ly and continuously , with natural ecosystems shrinking and losing species diversity. Only 16% of habitats are rated as having a favourable conservation status; only 40% of surface waters are in good ecological status, and up to 47% of forests are subject to three or more ‘drivers of degradation’.36 The main driver is land-use change as the result of more intensive agriculture and forestry – i.e., the production of biomass for food, feed, energy, and materials – compounded by ongoing urbanisation, climate change and resource extraction. There are now EU policy proposals to make major changes in fo-rest management and agricultural practices to address these issues, and they would directly affect the potential for sus-tainable levels of biomass supply. For example, it has been proposed that 25% of agriculture be organic and that 30% of land be committed to nature conservation – both more than a doubling of current levels.37
2) Greenhouse gas effects of biomass production. The production and extraction of biomass can result in increased CO
2 release to the atmosphere if biomass is
lost, less CO2 is absorbed by plants, and/or less carbon is
stored in soils (see Chapter 3 for a longer discussion). EU biomass policy has attempted to limit the uses of biomass with particularly large CO
2 effect, notably where there is
a risk that bioenergy use could lead to deforestation in-
ternationally through so-called indirect land-use change. However, even the effect direct in the EU can be substan-tial. This has led to vigorous debate (and disagreement) both about the size of the risk of high CO
2 emissions from
biomass produced and whether the safeguards put in pla-ce will work in practice (see Chapter 3 for a more extensi-ve discussion).
3) Pollution and other environmental impacts. Agri-culture also has several other important environmental ef-fects. It accounts for 44% of water withdrawals in the EU,38
while release of ammonia is a major source of ‘background’ air pollution in cities,39 and fertiliser use is also a cause of eutrophication, a serious problem for water ecosystems in the EU.40 Major measures are now being considered to address these problems, including a proposed reduction in the use of mineral fertiliser by as much as 20% to 2030.41
These examples of impacts have profound effects on the potentially available supply of biomass. For example, how much land is available for wood supply depends direct-ly on how much is set aside for conservation. How much land can be dedicated to energy crops depends strongly on how intensively other agricultural land is managed. And the extent to which residues can be extracted depends directly on what level of associated environmental impact (on soil carbon, nutrient balance, soil acidity, etc.) can be accepted.
Existing assessments and studies vary in the extent to which they take these factors into account – and, conver-sely, different assumptions about sustainability criteria are often why there are such different estimates of future poten-tial. In general, most studies are now 5–10 years old and therefore based on less stringent environmental constraints than are now being implemented in EU policy as proposed under the Green Deal and other initiatives.
3636 37
FORESTS: 0.3 EJ ADDITIONAL SUPPLY POTENTIAL
As noted above, current harvest levels already appropria-te the majority of net growth in EU forests, and the share will increase further as the currently relatively young forests start aging and grow more slowly. Meanwhile, a major increase in use of residues creates trade-off either with ecosystem functioning (soil carbon, acidification, biodiversity, etc.) or with rapidly increasing costs.
Set against any increases is also the ambition to set asi-de additional areas – for conservation, or to create carbon sinks. Even studies that consider sustainability constraints rarely do so with the stringency now being proposed in poli-cy (such as the 30% set-aside aspiration in the Biodiversity Strategy for 2030). Some assessments therefore have pro-posed that harvesting needs to be sharply reduced.42 Even the highest do not foresee an increase beyond around 1 EJ. The most recent major study of EU forest supply scenarios (‘S2BIOM’) gave a range of potential future supply between 0.0–0.7 EJ additional supply per year.43 The lower end of this range is for the scenario most closely aligned with tar-gets for biodiversity as now articulated in policy, and also is closer to national scenarios for major forest countries cali-brated against nature conservation targets.
The other major factor to consider is the environmental performance of incremental supply of forest biomass, and especially the CO
2 impact. As discussed in Chapter 3, stu-
dies suggest that significantly increasing EU forest biomass supply beyond current levels comes at the price of signifi-cantly reducing the forest carbon ‘sink’ – i.e., the amount of carbon that is removed by forests from the atmosphere – to the point where this risks offsetting other climate mitigation benefits.
Balancing these factors, this study uses an increase of 0.3 EJ as a central case across wood removals, residue removals, and increased use of by-products from forest in-dustries.
WASTE STREAMS: 0.5–1 EJ ADDITIONAL SUPPLY POTENTIAL
Increasing the circularity of biomass is an important agenda. While there have been many studies of a more circular economy for ‘technical’ materials (metals, plastics, and others), the potential for more circular systems for biomass resources is much less studied. As noted above, despite high recycling rates in some categories (such as paper and cardboard), there is untapped potential. Likewi-se, the biomass content of waste streams is often a costly liability today, in contrast to systems that instead manage to capture the material, carbon, and energy values. As we discuss below, biomass can be a major source of circular carbon for chemicals and plastics.
Nonetheless, waste streams offer only limited poten-tial in the aggregate. Supply can be substantially expan-ded through increased collection and treatment of waste streams such as paper and cardboard recycling, diversion from organic municipal waste in landfill towards energy and materials use, or the upgrading of sludges, manure, and other sources to more valuable bio feedstocks. However, even if the total flow today were increased by as much as 60% (an average of a range of assessments) this would result only in an additional 0.8 EJ of supply.
IMPORTS: NO OR NEGLIGIBLE SUPPLY POTENTIAL
While the EU is a major importer and exporter of food, they account for only 2% of the net supply of biomass for materials and energy today.44 A major increase in imports is unlikely to prove a viable strategy. First, the global equation for biomass supply is highly stretched.45 Unlike in the EU, global food production is increasing rapidly, driving a rapid ongoing expansion of cropland that already is a main cause of global deforestation46 – in turn one of the main drivers of global biodiversity loss.47 In this situation, imports to the EU of energy crops grown elsewhere for materials or energy are at very high risk of inducing even faster land-use change (see Chapter 3). Second, the same dynamic applies to in-creased supply of wood for energy use. Available assess-ments suggest very high greenhouse gas (GHG) emissions from such imports, and that this applies even if these come from other OECD countries.48

36 3737
ENERGY CROPS: 1–1.8 EJ AVAILABLE SUPPLY POTENTIAL
With limitations and major uncertainties about other sources, the key potential source for future additional supp-ly is that of dedicated energy crops. To date, energy crops have been highly controversial. Studies of the first expansi-on of EU use of crops for energy supply found that their cul-tivation risked significant indirect land-use change; that is, the conversion of land in other parts of the world to agricul-ture.49 This in turn risked not only obviating climate benefits by causing large releases of greenhouse gases (especially through deforestation), but also to further exacerbate the decline in biodiversity globally.50
In recent years, EU policy therefore has turned away from using food crops for energy or material uses. Instead, vario-us studies have proposed the cultivation of grasses such as switchgrass and miscanthus, or fast-growing trees such as poplar or willow. The hope is that these would compete less directly with food supply. Also, as perennial crops, they have fewer negative environmental impacts than do annual crops, not least because they can help bind carbon in soils. As noted above, however, these crops are grown on very small scale today, with just 0.1 EJ of supply per year. Expanding supply therefore would require the creation of an altogether new agricultural category in the EU landscape.
This raises the question about the availability of land for this use – and what the opportunity cost would be. The land foreseen is primarily previously agricultural land that has been abandoned for cultivation. By some estimates, some 60 million hectares of such land is available and ‘surplus’, in the sense that it is not put to productive use.51
Nonetheless, studies differ in the potential they see for this land to be used for energy crops. There are four key issues:
1) Future need for crop land. One issue is whether land has low or zero opportunity cost in terms of other crop pro-duction even in the long run. The key underlying assumption is often that that agriculture on remaining cropland conti-nues to see increasing yields, so that the abandoned land is not needed. As noted above, however, EU policy now seeks a transition to lower-intensity farming methods that pull in the other direction. In addition, the effects of climate change could reduce yields of some key EU production systems.52
2) Counterfactual land development. High scenarios often assume that there is no or little opportunity cost in terms of alternative land use. As previous farmland, aban-doned land often has low current biodiversity value and low stores of carbon in the soils. However, it is much less clear that the low potential for biodiversity will persist in the longer term. If land can revert to forest (including through active measures), the biodiversity and carbon penalties of growing monoculture energy crops instead can be substantial; if, on the other hand, land would revert to grassland or to degra-ded land, these penalties are much smaller, and carbon benefits in particular can be higher. High scenarios thus depend on a twin assessment: optimism about establishing large new plantations, but pessimism about the opportuni-ty for abandoned land to revert to a status of high natural capital.
3) Carbon implications. The case for perennial energy crops depends strongly on their contributing to an increa-se in soil carbon, or at least no net decrease relative to the status to which land would otherwise revert. While this has been demonstrated in individual cases, the size of the impact if deployed on a large scale is not yet known53 (see Chapter 3 for a longer discussion).
4) Cost of supply. High scenarios assume that yields of the new energy crops would be sufficiently high to offer att-ractive economics. Others doubt this, not least if cultivation is to be restricted to land areas that are marginal and too unproductive to have any other potential. Studies also show rapidly rising costs of supply at large scale.54
The uncertainty in these factors mean that estimates of potential supply diverge sharply. At the low end, some estimates do not see a way around major trade-offs and pro-pose no more than 0.2 EJ per year of additional supply.55 In contrast, other studies find much higher potential of 5–6 EJ per year.56 At these levels, the new energy crops would take up some 30 million hectares of land, an area corresponding to 20% of current land under cultivation in the EU, or the size of Italy.57 It thus would be a major remaking of the EU agricultural sector.
This study takes a more cautious approach, considering it unlikely that so large an area could be successfully de-ployed without trade-off against the four criteria listed above, especially for a crop category that currently is unproven at such scale. The scenario thus uses a supply potential of 1–1.8 EJ as a more prudent scenario.

3838 39
Prioritising biomass use in the net-zero
transitionThe EU economy is just starting its transition to net-zero emissions: More than 70% of gross available energy in the EU is still provided by fossil fuels.58 Biomass has been propo-sed to replace them in just about all major economic sectors. Yet even in an optimistic scenario, the supply available can only ever be a small share of the solution (Exhibit 10). For example, replacing aviation and shipping fuel with biofuels just for international transport departing from the EU in 2019 would require 8 EJ of primary biomass,59 similar to the esti-mated future resources available for bioenergy use. That rai-ses the key question: If biomass use for materials and energy can only increase by 10–30% at most, which uses should be prioritised?
For policymakers, the answer depends on which uses pro-vide the greatest value to society. As discussed in Chapter 1, much of the recent increase in bioenergy use has been driven by direct policy mandates and subsidies. Steering biomass the wrong way can increase the cost of the transition to lower emis-sions and incentivise investments that could become stranded assets. Adjustments also take time, as significant infrastructure and production capacity must be set up along the way. There also are opportunity costs if the high value that biomass can provide in important niches is lost because policy has steered the use of bioresources to lower-value uses.
For business leaders, the question is which uses will be most competitive. This matters for the strategy and invest-ments of a wide range of players: forestry companies and agricultural producers choosing what to plant and how to manage land; wood, fibre, or chemicals companies consi-dering their production pathways and feedstock supply; and a wide range of companies in energy supply chains consi-dering future input availability and market developments: from power companies to fuel producers, waste manage-ment companies, vehicle manufacturers, equipment supp-liers, and more.
This chapter examines what a prioritisation could look like, bringing together debates that to date have been kept separate. The analysis covers all major materials and ener-gy uses, from chemicals to electricity to transport. For each use-case, it evaluates the relative feasibility, resource efficien-cy, CO
2 savings, and economics of the major bio-based op-
tions and potential alternatives that are also compatible with achieving net-zero emissions by 2050.
Chapter 2

38 3939

4040 41
Approach and objectives: a framework for prioritising biomass use in the low-carbon transition
Our approach to exploring priorities for biomass use is to consider where it has the most value, in a scenario where all sectors of the economy reduce greenhouse gas emissions to net-zero emissions by 2050.
To give as full an answer as possible, we integrate an ana-lysis of all major proposed uses for biomass in current applica-tions as well as proposed future scenarios. This includes fibre production, chemicals production, passenger and freight road transport, aviation, shipping, industrial heating, building hea-ting, power, and ‘negative emissions’. As noted above, a key aim is to jointly analyse materials and energy uses of biomass.
Our starting point for the analysis is opportunity cost: ‘If not using biomass, what alternative net-zero so-
lution must be used?’ We put all use-cases on the same basis by estimating the cost of biomass input at which biomass-based options are competitive relative to alterna-tives (and thus the cost difference, positive or negative, of using biomass instead of those alternatives). This bre-ak-even biomass cost then creates a single metric that allows for comparison across a wide range of use-cases, and a highly intuitive definition of value: If biomass is only available at higher cost than the break-even level, then an alternative solution provides higher value. (Estimating the value requires detailed modelling of more than 50 different use-cases of biomass and alternative energy and materials solutions; the box on page 45 summarises the methodo-logy and analytic approach, which is further detailed in a technical annex to this report.)

40 4141
Energy demand in major sectors far outstrips the available supply of biomass
Exhibit 10
SOURCE: MATERIAL ECONOMICS ANALYSIS BASED ON MULTIPLE SOURCES.60
Notes: 1 Wood products and fibres are excluded, following the logic explained in Chapter 2. With ~6 EJ in these categories, 5–7 EJ of biomass is available for other end-uses. 2 Primary energy equivalents have been used as the measure for both materials and energy in this study to make values comparable. Materials have been converted from mass (kg) or volume (m3) to energy by the specific energy density of the material. The energy is also measured in primary rather than final energy form, to account for
conversion losses in the production of biofuels. The values shown are for EU27 + UK.
3
5
5
8
17
41
53
5-7
shipping
chemicals
aviation
Industrial heating
building heating
road transport
power
Available supply (excl. fibres1)
“What if…” – potential biomass demand per end-use EJ biomass per year, EU2
4242 43
The results are presented in aggregated form through a ‘value curve’ for biomass across the different use cases (Exhibit 11). It shows the estimated size of different propo-sed uses of biomass across the economy, and the value of biomass resource associated with each (see Exhibit 12 for a guide on how to read the value curve).
There is large variation in the value of the use-cases: the break-even levels at which biomass is cost-competitive with alternative options range from 10–12 EUR/GJ – far higher than the typical cost of most biomass feedstock to-day – to negative prices, meaning that biomass-based solu-tions would be economically viable only if feedstock can be obtained at zero cost, or via a gate fee.61 Importantly, for the large majority of uses, biomass would only be competitive if it were available at significantly lower prices than the 6–8 EUR/GJ cost of producing and processing energy crops at scale.62 Even economic terms alone, many biomass options thus look less competitive than alternatives.
In addition, the true cost of biomass can be substantially higher than its market price, if its production leads to large external costs: biodiversity impacts, pollution, or the release of CO
2 from vegetation and soils. The size of these impacts
in turn depends strongly on how biomass is sourced. The analysis handles this in two ways. First, the limits on addi-tional supply described in Chapter 1 were identified preci-sely to ensure that biomass supply can be achieved while keeping external costs as low as possible. Second, Chapter 3 dives deeper into the land requirements, electricity needs, and CO
2 impacts of different scenarios for future biomass
use. This underlines the need to use the cost analysis in the value curve jointly with a careful analysis of the supply, and of the aggregate externalities and resource claims.
The cost curve shows the aggregate assessment, but the underlying analysis also revealed a lot of nuance and complex cases. At a more granular level, the use of biomass can be more or less advantageous, depending on multiple factors that can make a use-case more economically viab-le than the averages presented in the value curve. These include access to very cheap local feedstock, the ability to provide additional valuable services or co-benefits (such as waste management or carbon storage), and local condi-tions that make alternatives costlier or less viable (such as variations in electricity or infrastructure availability).
Despite the complexity, the curve illustrates four impor-tant conclusions:
1. Material uses in wood products, fibre, and chemicals will be particularly high-value areas for future biomass use
2. Many bulk bioenergy applications are set to become less cost-competitive than new options based in electrification and hydrogen
3. Bioenergy has a potential role in aviation, but is a less likely solution for shipping
4. Carbon management and ‘negative emissions’ can add additional value to biomass use
We discuss each of these in more detail on the next page.
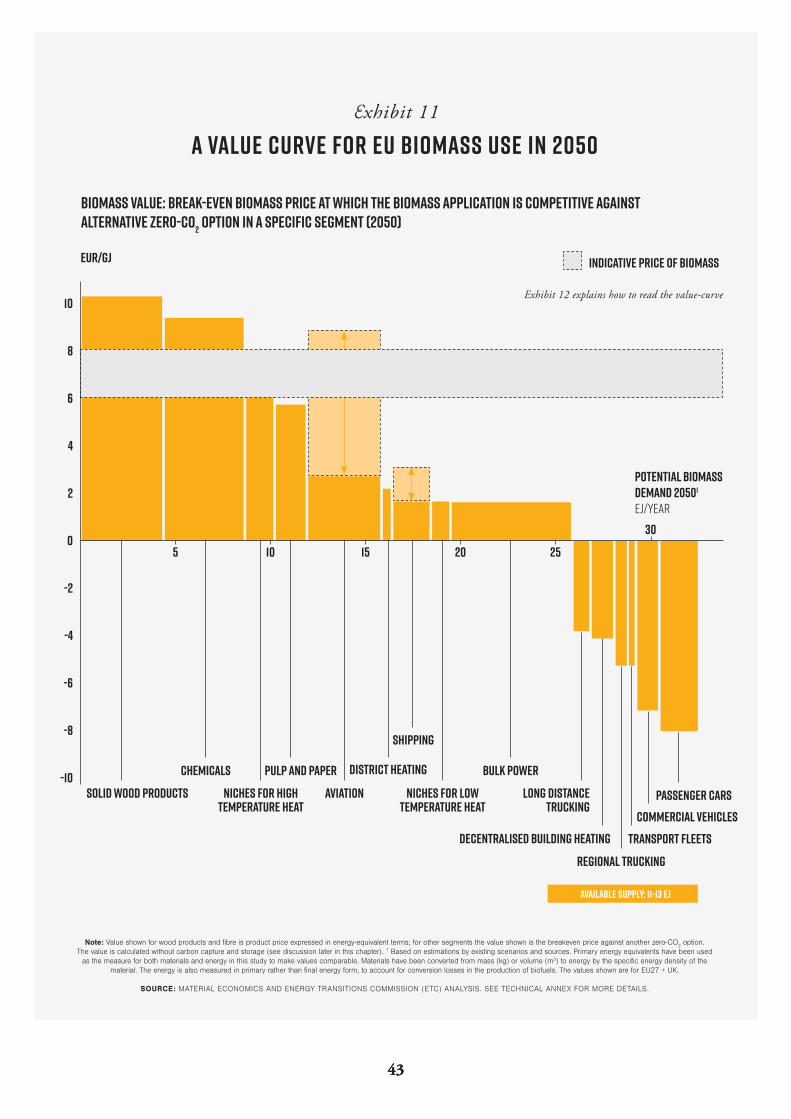
42 4343
A value curve for EU biomass use in 2050Exhibit 11
Note: Value shown for wood products and fibre is product price expressed in energy-equivalent terms; for other segments the value shown is the breakeven price against another zero-CO2 option.
The value is calculated without carbon capture and storage (see discussion later in this chapter). 1 Based on estimations by existing scenarios and sources. Primary energy equivalents have been used as the measure for both materials and energy in this study to make values comparable. Materials have been converted from mass (kg) or volume (m3) to energy by the specific energy density of the
material. The energy is also measured in primary rather than final energy form, to account for conversion losses in the production of biofuels. The values shown are for EU27 + UK.
SOURCE: MATERIAL ECONOMICS AND ENERGY TRANSITIONS COMMISSION (ETC) ANALYSIS. SEE TECHNICAL ANNEX FOR MORE DETAILS.
Biomass value: Break-even biomass price at which the biomass application is competitive against alternative zero-CO2 option in a specific segment (2050)
Available supply: 11-13 EJ
solid wood products
Decentralised building heating
chemicals
Regional truckingTransport fleets
Commercial vehiclespassenger cars
pulp and PAper bulk powerdistrict heating
Niches for hightemperature heat
Niches for lowtemperature heat
long distance trucking
aviation
shipping
05 1510 20 25
potential biomass demand 20501
EJ/YEAR
EUR/GJ
30
-10
2
-8
6
-4
4
-6
8
-2
10
Indicative price of biomass
Exhibit 12 explains how to read the value-curve
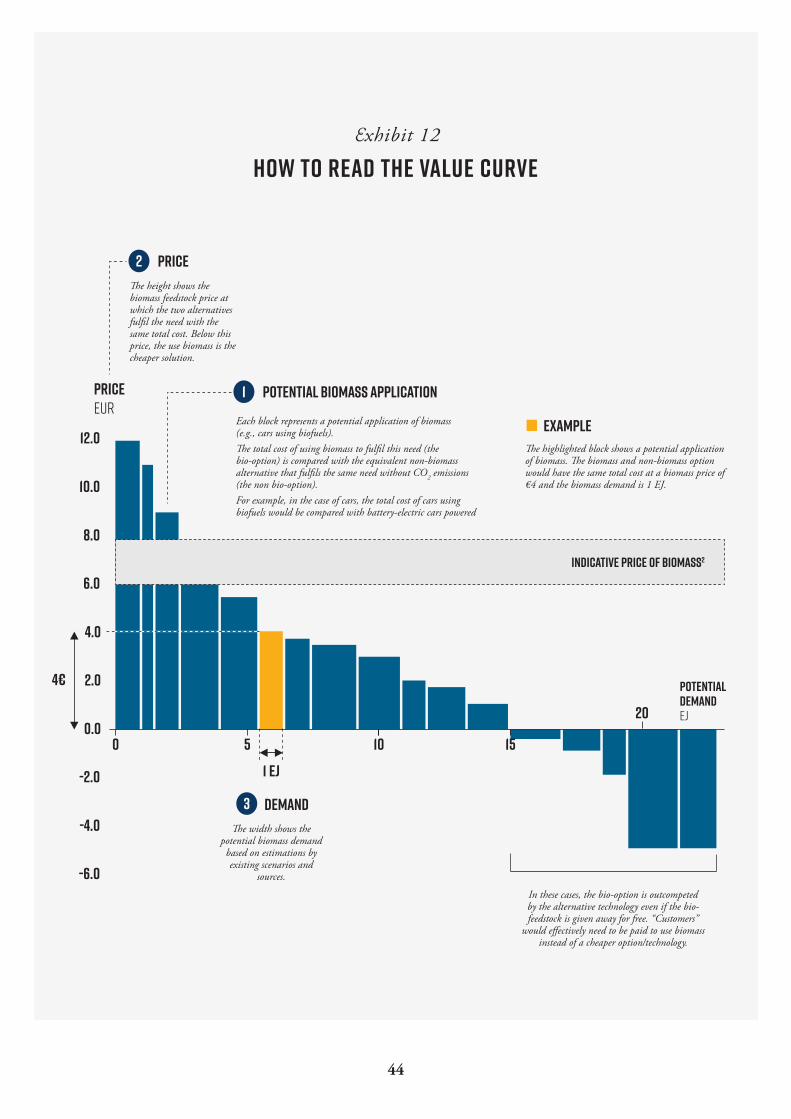
44
How to read the value curveExhibit 12
1 ej0 10
example
POTENTIAL BIOMASS APPLICATION
price
5 15
20
-6.0
2.0
-2.0
6.0
-4.0
4.0
0.0
8.0
10.0
12.0
price eur
potential demandEJ
3
1
2
The width shows the potential biomass demand
based on estimations by existing scenarios and
sources.
The highlighted block shows a potential application of biomass. The biomass and non-biomass option would have the same total cost at a biomass price of €4 and the biomass demand is 1 EJ.
Each block represents a potential application of biomass (e.g., cars using biofuels). The total cost of using biomass to fulfil this need (the bio-option) is compared with the equivalent non-biomass alternative that fulfils the same need without CO2 emissions (the non bio-option).For example, in the case of cars, the total cost of cars using biofuels would be compared with battery-electric cars powered
The height shows the biomass feedstock price at which the two alternatives fulfil the need with the same total cost. Below this price, the use biomass is the cheaper solution.
In these cases, the bio-option is outcompeted by the alternative technology even if the bio-feedstock is given away for free. “Customers”
would effectively need to be paid to use biomass instead of a cheaper option/technology.
Indicative price of biomass2
4€
demand

45
Indicative price of biomass2
BOX 1: METHODOLOGY FOR THE VALUE CURVEIn the process of creating the value curve we have applied a consistent framework to best identify which segments should be shown, at which cost, and for how much potential biomass demand.
We began by identifying each of the applications that have laid claim to biomaterial in 2050, canvassing the available sources described in our chapter on biomass demand and supply. We then analysed each of these sectors individually, using a uniform framework to provide a basis of comparison across different se-ctors.
Scope and future demand for biomass. The analysis covers the use of biomass for materials and energy production. The po-tential future uses of biomass were derived from a literature re-view. The sources (including those described in Chapter 1) were chosen for their prominence in public debate about the future use of biomass, including scenarios from the European Commission, EU Member States, international agencies, industry associations, and academic research. Each segment in the value curve shows the extent of demand proposed in recent published assessments.
Primary energy denomination. The different uses were put on a comparable volume basis by expressing them in energy terms. The energy amounts shown are the primary energy of the biomass feedstock, before biomass is converted to fuels for end-use. For materials, this required converting tonnage or volume measure-ments to their energy content, using standard conversion factors for energy density for the relevant feedstock. For energy uses, this required assessing the efficiency of conversion factor of each use-case from primary resource to finished fuel product, including the co-products where available.
End-use segmentation. The modelling next defined the different service or utility that must be met within each sector. In each sector, several different end-use segments were defined. For ex-ample, transport applications (road, air, and sea) were divided by passenger and freight applications, by distance travelled, and by weight of vehicle. Similarly, chemicals were analysed at the level of basic chemicals production; power production by bulk generation and by the provision of flexibility resources; heat by the grade of heat and pattern of load; and industrial processes for their specific requirements.
Biomass and alternative applications. For each end-use, a range of different applications was defined, drawing on a wide range of literature. Only applications that eliminate fossil CO
2 emis-
sions were included, consistent with the focus on how biomass should be used in an economy with net-zero emissions in 2050. For biomass options, the conversion pathways were matched to the likely future sources of biomass identified in Chapter 1 (wood industry by-products, waste, and residues, or perennial grasses or short-term rotation coppice). In most cases, this requires ‘se-cond-generation’ conversion pathways from woody biomass to final fuels. For alternatives to biomass, a first screening of options was first done, and the application identified that would be most likely to be considered an alternative at the margin. For example, in chemicals, a whole portfolio of options (demand reduction, sub-stitution, mechanical recycling, chemical recycling, electrification, CCS) were considered, and biomass options compared against other options (notably the use of CO
2 as feedstock) for residu-
al emissions reductions once the potential for these options had
been exhausted. Likewise, in the segment ‘long-distance heavy road transport’, lignocellulosic biodiesel from Fisher-Tropsch synthesis was compared against other major contenders (modal shifts, optimisation of logistics, battery electric vehicles, hydrogen fuel cell electric vehicles, or synthetic fuels in diesel engines), but the hydrogen fuel cell option was selected as the most likely mar-ginal comparison. Exhibit 12 summarises the main biomass and non-biomass options that underlie the cost curve at the highest le-vel (the Technical Annex to this report provides additional details).
Technology assessment and evolution. For both the bio and non-bio-options, the focus is on the technologies that are likely to be available in 2050. The technological maturity of different options included in the assessment differs: from fully commerci-alised technologies (e.g., heat pumps for space heating) to ones that have yet to be used at a commercial scale (e.g., synthetic fuels in aviation or ammonia as fuel in shipping). The assessment therefore included a view on each option’s Technology Readiness Level (TRL) from IEA, which evaluates each option on a scale from ‘basic principles are defined’ (TRL 1) to ‘commercially operation in relevant environment’ (TRL 9). With a few notable exceptions, the non-bio-options rely on no major breakthroughs, but rely on tech-nologies that are widely used in future energy scenarios. However, significant efforts remain to commercial deployment, both for se-cond-generation biofuels and for many alternatives.
Future technology cost, performance, and sensitivity analysis. The assessment also required a view on the future cost of tech-nologies. Forecasting future technology costs is notoriously tricky territory, and there is a risk that conclusions are driven strongly by assumptions far into the future. To ensure transparency, this study takes a ‘platform technology’ approach, where cost deve-lopments over time are driven principally by a small number of key inputs: 1) solar and wind power generation, 2) water electrolyser performance and cost, 3) vehicle battery density and cost, and 4) carbon capture technology. This arguably is conservative, as it leaves out potential cost reductions proposed in research (digiti-sation, autonomous vehicles, novel chemistry, etc.) The expected development of these platforms is shown in Exhibit 13. For ro-bustness we also conduct several alternative analyses to assess how sensitive our final cost results are to these cost development assumptions. Some of these are shown in the cost curve, notably for aviation, where the uncertainty about future cost of carbon capture and hydrogen production means that a very wide range of costs is possible.
Cost assessment. For each of the potential uses of bioenergy, the value curve expresses the cost of alternative solutions as a break-even price for primary bioenergy at which the biomass op-tion has the same cost as the alternative, non-biomass option. This requires that all the cost-components of each option are modelled, including capital expenditures, feedstock and ener-gy conversion efficiency, equipment lifetime, cost of capital, and various other operating expenditure. Each non-bio economic assessment is first made in its natural form (e.g., EUR per ton-ne-km) before being converted into cost per unit of bioenergy required (EUR per GJ) via a calculation of the biomass feedstock required to meet each unit of demand (e.g., GJ biomass per km). For biomaterials, the calculation was simpler, directly assessing the cost of biomass materials required for each segment, expres-sed in terms of EUR/GJ for comparison to the energy sectors.

46
Improving technologies create a wide set of alternatives to biomass use
Exhibit 13
Notes: 1 Technology Readiness Level from 1-9, with 9 being the highest level of maturity. 2 Internal Combustion Engine.
category
Renewable electricity Green hydrogen Capture and use of CO2 Batteries
See Technical Annex for more information
Main biomass optionsTRL1 in parantheses
Main alternativesTRL1 in parantheses
alternative plat-form technologies
industrial heating
Shipping
Aviation
building heating
road transport
power
chemicals
Biomass in boilers (9)The gasification and Fischer-Tropsch synthesis route can produce biofuels from lignocellulosic biomass. Moreover, the alcohol-to-jet route is a biochemical conversion of converting biomass feedstocks to alcohols. via fermentation followed by dehydration, oligomerization, and hydro-processing into hydrocarbons.
Bio-diesel and bio-methanol (6-9)Fischer-Tropsch (FT) diesel is a drop-in fuel produced from lignocellulosic biomass through gasification and catalytic synthesis. The bio-methanol production route includes gasification, fermentation, and catalytic synthesis, and its use requires some engine modifications.
Advanced biofuels (6-9)The gasification and Fischer-Tropsch synthesis route can produce biofuels from lignocellulosic biomass. Moreover, the alcohol-to-jet route is a biochemical conversion of converting biomass feedstocks to alcohols. via fermentation followed by dehydration, oligomerization, and hydro-processing into hydrocarbons.
Biomass in boilers (9)Biomass (e.g., biomethane, biowaste, or wood pellets) burnt for heat. Biomethane can be produced by anaerobic digestion and thermal gasification.
Advanced biofuels (6-9)Biofuels from woody biomass including Fischer-Tropsch fuels (diesel, gasoline) and oxygenates (ethanol, methanol) produced via gasification and fermentation.
Biomass power (9)Biomass-fired steam turbines (solid biofuels) and gas turbines (biogas) used for bulk and flexible power generation. Waste-to-energy power and combined heat and power are other options.
Bio-based feedstock (7-9)Basic petrochemicals (olefins, aromatics, methanol) produced via gasification and fermentation routes from woody biomass and waste.
Electric heat pumps (9) Air, water and ground source heat pumps for low-temperature heat
Electric boilers (9) Resistance electric heating in boilers.
Hydrogen boilers (7) Hydrogen burnt in gas boilers similarly to natural gas (Require modifications to boiler).
Other electrification technologies (5-9) Includes plasma technology, electric are furnaces, infrared heaters, induction furnaces, microwave and radio frequency heaters, and resistance furnaces.
Green ammonia (4-6) Use of ammonia in place of hydrocarbons in marine diesel engines; requires some engine adaptations.
Green Hydrogen (2-9) Hydrogen in ICE2 (long-haul) or fuel cell electric engines (short-haul only).
Battery electric Electric engines (short-haul only).
Synthetic methanol Green methanol produced from non-fossil CO2 and green hydrogen.
Synthetic aviation fuels (5-8) Synthetic hydrocarbons produced from non-fossil CO2 and green hydrogen that can be used in internal combustion engines.
Battery electric Batteries can be used for short haul flights
Hydrogen fuel cells Green hydrogen can be used for short haul flights.
Electric heat pumps (9) Air-, ground-, and water-source heat pumps for space and hot water heating.
Electric boilers (9) Boilers using direct electric resistance heating.
Battery-electric vehicles (8-9) Rechargeable batteries powered by renewable electricity.
Hydrogen fuel cell vehicles (7-9) Hydrogen cells that power electric motors.
Synthetic fuels (5-7) Synthetic hydrocarbons created from captured CO2 and green hydrogen for use in internal combustion and diesel engines.
Renewable electricity (9) Includes solar PV, onshore wind, offshore wind, in combination with a range of flexibility solutions.
Multiple options (3-9) Biomass routes considered only for residual need, after potential for a wide range of other options (reduced use, substitution, mechani-cal and chemical recycling, and carbon capture and storage, and electrification) is exhausted. The main alternative option is synthetic chemistry, using CO2 captured from air as feedstock.
SOURCE: MATERIAL ECONOMICS AND ENERGY TRANSITIONS COMMISSION (ETC) ANALYSIS. FOR MORE INFORMATION, SEE TECHNICAL ANNEX.

47
A platform technology approach to evaluating future options
Exhibit 14
SOURCE: MATERIAL ECONOMICS ANALYSIS BASED ON MULTIPLE SOURCES.63
40 6.0 6.0 535 130
15-25
1.2-1.6 1.0-1.480-200
20-35
today today today today today2050 2050 2050 2050 2050
LCOE for solar and windEUR/MWh
Green hydrogenEUR/kg
Green hydrogenEUR/kg
Green hydrogenEUR/tCO2
Batteries for transportEUR/MWh
Renewable electricity
Green hydrogen (produced in the EU)
Green hydrogen (imported)
Direct air capture Batteries
Steep learning curves for solar have made it possible for the price to plummet
over the past 10 years. Wind power has fallen in a similar
way and more and more large parks are being built
Green hydrogen will be important both in industry
and in certain transport. The cost reduction is mainly due
to cheaper electrolysers
Imported green hydrogen will likely have even lower cost than locally produced in the EU due to cheaper renewable electricity from
solar power
Non-fossil CO2 enables the production of synthetic fuels that can for example be used as a sustainable aviation fuel
Falling battery costs enable faster conversion of the
vehicle fleet - prices fall while the driving range increases
Notes: LCOE stands for levelized cost of electricty.
4848 49
Material uses will be particularly high-value areas for future biomass use
Bio-based materials production is often where biomass currently has the highest value. This conclusion spans mul-tiple materials (wood products, paper and board, textiles, and chemicals) and end-uses (construction, packaging, chemicals, and more). As shown in the value curve above, we find that bio-based options are often cost-competitive re-lative to other net-zero options at feedstock prices of 10–12 EUR/GJ equivalent – which is higher than the levels of many bioenergy applications.
THE MATERIALS PROPERTIES OF WOOD AND FIBRE ARE INTRINSICALLY MORE VALUABLE THAN TYPICAL ENERGY USES
Current market values already enforce a strong hierar-chy of use of wood first as timber, then for pulp, then for energy. For example, in energy-equivalent terms, the price (excluding transport) of timber is on the order of 6–10 EUR per GJ, and that of pulping wood 3–6 EUR per GJ.64 At these price levels, bioenergy uses will generally be far less competitive than their alternatives by 2050.
That same ‘materials first’ logic is already applied in much of the forest-based industry, and applying it more wi-dely could extract more value. For example, there is ong-oing development to free up additional fibre supply by using industrial fibre residues instead of burning them (replacing the energy with renewable electricity) – especially as new applications for low-quality wood are developed.
Nonetheless, this hierarchy does not always hold, and a number of factors can divert biomass from materials uses and towards energy uses. Primary wood (i.e., woody bio-mass extracted directly from either forests or outside fo-rests) makes up at least 37% of the wood allocated to en-ergy uses in EU, of which approximately 47% is stemwood and the remaining 53% are other wood components (tre-etops, branches, etc.). In addition to the 37%, some 14%
is uncategorised and can be primary biomass, so the total amount of primary wood used for energy could be as high as 51%.65 Some of this is due to forestry practices geared to small-scale outtake rather than industrial use (e.g., coppice forestry in the Mediterranean region) or to damaged flows unsuited to industrial use (e.g., insect-damaged wood). However, policy also drives such uses by subsidising the use of wood as fuel. There is thus a major risk of misalloca-ting valuable resources by subsidising one use (energy) but not others (materials).
THE COMPETITIVENESS OF BIO-BASED MATERIALS IS SET TO INCREASE
Most biomaterials compete with non-bio alternatives: timber in construction with steel and cement; fibre packa-ging with plastics, etc. Already today, the use of wood and wood-based products is associated with lower fossil and process-based emissions when compared to non-wood pro-ducts.66 The economic case for using bio-based materials thus depends in part on how the prices of rival materials develop.
The shifts in prices could be substantial with efforts to cut CO
2 emissions. For example, cement production costs
increase by 70–115% with the use of carbon capture and storage, the dominant option for deep emissions cuts. Simi-larly, eliminating emissions from plastics could raise produc-tion costs by 45% on current production routes.67
These high prices increase the appeal of options such as wood-based structural elements in construction, and fibre-based and other bio-derived solutions for textiles or packaging. Prioritising the use of biomass for materials can thus be valuable to avoid costly emission reduction measu-res in other parts of the economy. The use of biodegradable options in packaging and fast-moving consumer products has also been identified as crucial to reducing other environ-mental pressures, such as plastics waste in oceans.68
48 4949
BIOMASS COULD BE PARTICULARLY VALUABLE FOR CARBON-BASED MATERIALS AND CHEMICALSThere has been enormous innovation in recent decades in the production of bio-based materials, including plastics, as well as chemicals. The value of those applications is particularly evident when we consider how dependent the world has become on the fossil fuel-based products they are designed to replace, especially plastics – which are also at the centre of the world’s battle with waste.
On average, plastics contain carbon corresponding to 2.7 tonnes of CO
2 per tonne of material – even more than is
released in the production of most plastics. And the volume of plastics produced worldwide is enormous and growing – equivalent to all the fossil fuels used for aviation or for shipping globally, responsible for more than 1 billion tonnes of CO
2 equivalents per year.69
The timing of how this carbon is released as CO2 emis-
sions depends on how plastics are handled upon being discarded. The current trend in the EU is towards increased incineration, which releases the entire stock of fossil carbon immediately. If the plastics are landfilled instead, emissions could, in theory, be postponed. However, the EU has adopted a zero-landfill target for recyclable waste, including plastics, to be achieved by 2030. The options for discarded plastics are therefore either recycling or incineration. If current recycling rates hold steady and landfilling is phased out, emissions would grow to as much as 261 Mt CO
2 per year.70
The key question then is how materials built out of car-bon can fit into an EU economy that produces no net CO
2
emissions. Multiple strategies will be needed, including the use of biomaterials. In an integrated scenario for EU chemi-cals production, we find that as much as 70–80% of end-of-life emissions could potentially be addressed through
a combination of demand-side measures reducing total plastics need, substitution with other materials (including fibre-based packaging), and mechanical and chemical re-cycling (Exhibit 15). This would make plastics as circular as aluminium is today – a sea-change in how the material is managed. Nonetheless, it would still see 20–30% of plastics and other chemicals – and their embedded carbon – being lost in every use-cycle.
As many plastics products have short lifetimes, this re-quires continuous and substantial input of new feedstock – even in a highly circular economy. Just replacing them with new fossil hydrocarbons is not compatible with net-zero emissions.71 The other main alternative is to use non-fossil sources of feedstock, including biomass. On this basis, we estimate that 1–1.3 EJ per year could be used for EU plastics production.72
The same logic applies to other petrochemicals pro-ducts, such as rubbers, resins, synthetic fibres, adhesives, dyes, detergents, paints, and coatings. Indeed, replacing them with bio-based materials – or other zero-carbon al-ternatives – may be even more urgent. Most of these are poorly suited to collection for recycling, so they have greater losses in each use-cycle than plastics, requiring even more fossil feedstock to keep meeting new demand.
All in all, biomass could become an important contributor to chemicals production in a net-zero economy. The analysis suggests that even high biomass prices would make this more cost-effective than the use of air-captured CO
2, the
main alternative source of non-fossil carbon. This includes dedicated biochemical production routes (e.g., via gasifica-tion of woody biomass, or fermentation of waste streams), but also use of captured CO
2 from the combustion of bio-
mass waste. The analysis suggests scenarios where this format for waste-to-materials (instead of today’s waste-to-en-ergy) could be cost-effective, especially where low-cost hy-drogen is available.

50 5150
Biomass carbon has a unique role in achieving net-zero chemicals
Exhibit 15
SOURCE: MATERIAL ECONOMICS ANALYSIS BASED ON MATERIAL ECONOMICS, “INDUSTRIAL TRANSFORMATION 2050 – PATHWAYS TO NET-ZERO EMISSIONS FROM EU HEAVY INDUSTRY” (2019)
20-40%
40-60%
10-25%
0-25%
100%
Strategies for a low-CO2 plastic sectorShare of emissions reduced
Demand measures
Plastic recycling
Carbon capture
Non-fossil sources of carbon
total
1
2
3
4
Materials efficiency, sharing business models, increased lifetime of products and materials substitution can reduce the overall amount of plastics in circulation. Examples include reducing over-use in packaging and car-sharing to increase the intensity of plastic use.
The second step is to achieve very high recycling rates from end-of-life plastics. Jointly with mechanical recycling, chemical recycling technologies can be used to increase the recycling rate of plastics from today’s very low levels of 10-15%, to perhaps as much as 70-80% in a stretch case (for reference, this is as high as today’s recycling rates for aluminium). Achieving this would require a major reorganisation of the waste sector.
Realistically, some 20-30% of plastics would therefore be incinerated after an average residence time in the economy of 5 years, if landfill is not an option. Some new feedstock is therefore required to replace the carbon that is lost, as well as any net growth in the amount of plastics. If new fossil carbon is used, an equivalent amount of carbon must be captured permanently and stored. CCS on end-of-life incineration can achieve this. Another option would be to permanently store solid plastics.
However, universal coverage of CCS will be difficult to achieve. In the case of plastics, three separate emissions sources at different points in the value chain would have to be addressed (petroleum refining, steam cracking, and waste incineration). Waste incineration is also typically small-scale, with more than 500 waste-to-energy plants across the EU. If, on the other hand, the new feedstock is derived entirely from biomass or carbon captured directly from the air, the total plastic stock will eventually consist of non-fossil carbon, and end-of-life emissions are taken care of.

50 5151
Many bulk bioenergy applications are set to become less cost-competitive
While biomaterials increase in competitiveness in a net-zero transition, the opposite is now true for bioenergy app-lications. Many already look far less attractive than just four to five years ago.
A strong appeal of biofuels for power, heating, and trans-port has been to keep as much as possible of the current industrial logic and capital equipment. ‘Drop-in’ biofuels can be used in existing boilers for heat, thermal plants for power, internal combustion engines for vehicles, etc. This enables rapid replacement of fossil fuels with limited need for new technology, infrastructure, or capital equipment. Countries and companies alike have thus found bioenergy alluring as the easiest near-term solution.
The EU and Member States embraced this logic, en-visioning large-scale bioenergy use not only in the near term but also in the long term, particularly in the power sector and in road transport.73 This vision led to subsidies and mandates that, as noted in Chapter 1, have driven a fivefold increase in bioenergy used for power generation since 2000, and up to a 25-fold increase in transport over the same period.
Yet not only is the reality of biomass supply constraints calling that vision into question, but options on the demand side also are shifting rapidly. Across sectors, solutions based in electrification and leveraging cheaper electricity supply such as batteries, hydrogen, and heat pumps are poised to provide both more cost-effective paths ahead and deeper emissions reductions. Policy frameworks need to be updated.
For example, EU countries have spent large sums subsidi-sing bulk power generation from wood and building up the supply of first-generation biofuels for passenger vehicles.74 Neither now seems likely to have any substantial long-term role, and related assets could be stranded as soon as 2030. Research for this study suggests the same could happen in building heat, low-temperature industrial heat, and heavy goods road transport. Below we delve deeper into some of the trends.
ROAD TRANSPORT: A VERY LIMITED LONG-TERM ROLE FOR BIOFUELSThe EU’s 2009 Directives on Renewable Energy and on Fuel Quality, which drive Member State policies to 2030, set out to build a major industry replacing fossil fuels with biofuels in vehicles. They assume that alternatives have limited viability, and biofuels will be used in the long term. That reflects the common view at the time: Even 10 years ago, major energy scenarios envisioned nearly no electric vehicles for passenger transport within two or three decades.75 Even five years ago, analyses of trucking saw a much bigger long-term role for bi-ofuels than for battery-electric and hydrogen fuel-cell vehicles combined, even as far ahead as 2050.76
The outlook has now shifted. Even setting aside the long and acrimonious debates over social and environmental sus-tainability, transport biofuels are simply becoming less com-petitive as alternatives improve. Electric vehicles are starting to out-compete not just biofuels, but in many niches, even con-ventional petrol and diesel vehicles (Exhibit 16). The reasons include improving battery technology, lower-cost renewable energy, lower-cost green hydrogen production, and strong energy system synergies between variable electricity produc-tion and both battery storage and hydrogen production. The prospect of disruptive changes brought by driverless trucks or cars and new business models based on car-sharing only add to the competitiveness of capital-intensive electric and hydrogen options.77
Overall, the long-term role for biofuels in EU road transport is therefore very limited. There is still some debate about the roughly 10% longest road freight journeys, but better infra-structure could make electric vehicles viable even for them. Meanwhile, more specialised niches (such as forestry machi-nes) make up very little total volume in the total energy sys-tem.

5252 53

52 5353
Biofuels have a very limited long-term role in road transport
Exhibit 16
SOURCE: MATERIAL ECONOMICS ANALYSIS BASED ON MCKINSEY CENTER FOR FUTURE MOBILITY AND HYDROGEN COUNCIL.78
Note: Total cost of ownership (TCO) for the internal combustion engine (ICE) in 2020 is based on conventional fossil fuels, while 2035/2050 ICE TCO estimates assume biofuels. All 2020 TCO and 2035 Battery Electric Vehicles (BEV)/Fuel Cell Electric Vehicles (FCEV) TCO are taken from Hydrogen Council’s Report on the Path to Hydrogen Competitiveness, with trucking assuming an
average load of 25 tonnes to convert from cost per ton km to km. There is significant uncertainty in the 2050 TCO of BEV and FCEV heavy duty trucking, depending largely on the development of battery technology (both energy density and charge time) and the development of hydrogen infrastructure.
FCEV (Fuel Cell Electric Vehicles) FCEV (Fuel Cell Electric Vehicles)
BEV (Battery Electric Vehicles) BEV (Battery Electric Vehicles)
ICE (Internal Combustion Engine) ICE (Internal Combustion Engine)
2020 20200 0
0.10
0.10 0.40
0.50
0.251.00
1.10
0.05 0.20
0.30
0.200.80
0.90
0.150.60
0.70
0.301.20
1.300.35
2025 20252030 20302035 20352040 20402045 20452050 2050
Cost trajectory of passenger carsTotal cost of ownership in EUR/km
Cost trajectory of heavy duty trucksTotal cost of ownership in EUR/km
FCEV
BEV
FCEV
BEV
ice
ice

5454 55
A net-zero transition with lower biomass claims is feasible and more cost-effective by about
36 billion EUROS per year

54 5555
A net-zero transition with lower biomass claims is feasible and more cost-effective by about
POWER SECTOR: BIOENERGY LIMITED TO SELECT NICHES PROVIDING CO-BENEFITSThe prospects for bulk power generation from biomass have also changed dramatically. Recent scenarios continue to foresee more bioenergy use in the power sector in 2050 – often more than doubling today’s level, which already has increased fivefold since 2000.79 However, other analyses have shown the EU power sector could reach decarbonisa-tion objectives with almost no use of biomass.80 Some see biomass as a viable option only with large-scale deploy-ment of CCS.81
Our analysis suggests a middle ground. The use of bio-mass for bulk power generation (including co-firing with fos-sil fuels) struggles to be cost-effective. Without subsidies, it would likely be phased out for economic reasons. Future use, in turn, depends on how three select niches evolve.
First, flexible biofuel power generation for seasonal balan-cing can have a role in some power systems, with better economics than other zero-CO
2 options (such as gas plants
with carbon capture and storage).
Second, the co-generation of electricity and heat can conti-nue to play a role where it makes use of existing infrastructu-res for district heating, and especially where coupled with providing other co-benefits (notably, waste disposal).
Third, there is still an open question about the potential for biomass power generation combined with carbon capture either for permanent storage, or for use as feedstock in ma-terials or fuel production (see below).
All in all, however, the role of biomass power generation is deeply structurally different from the uses that have been (and continue to be) encouraged by policy inter-ventions focused on near-term renewable energy volume targets.
BUILDING HEATING: REDUCED RATHER THAN INCREASED USE BY 2050In buildings, the role of biomass looks increasingly limited as well. Where heat pumps are an option, the economics are shifting to strongly favour electrification, as illustrated in the value curve at the beginning of the chapter (Exhibit 11). Heat pump technologies also are improving rapidly, at both small and large scales and for a growing range of temperatures. Several other factors are at play as well: energy efficiency im-provements, the use of hydrogen in areas with developed clus-ters, other renewable sources such as geothermal and solar thermal, and the use of excess heat (including from new tech-nologies, such as electrolysers or synthetic fuel production).82
In this landscape, biomass for heating can compete on a cost basis mainly in very specific niches: where very low-cost local feedstock is available; when there are additional revenue streams (e.g., from waste disposal); in combina-tion with valorising CO
2 streams, or where there are signi-
ficant sunk costs in infrastructure, notably district heating networks. Overall, however, especially given the constraints on supply identified in Chapter 1, biomass looks unlikely to be widely used for building heat by 2050.
This poses acute strategic questions for providers of large-scale heating solutions, often via district heating networks. Waste-based options often provide a range of services beyond just heating, notably waste management (hygiene, destruction of toxic substances, safe disposal of streams rejected for recycling, avoided environmental impact from landfill, etc.). Increasingly, value also is tilted towards the provision of local electricity grid capacity. In the future, the list of co-benefits could grow to include negative emissions solutions (via CCS on incineration of biomass in waste) or provision of raw materials (via upgrading of sepa-rated CO
2 for chemicals or fuels). Such integrated offerings,
serving a wide variety of societal needs, are likely to be far more competitive than incineration alone.

5656 57
INDUSTRY: A FOCUS ON HYBRID SOLUTIONS FOR HIGH-TEMPERATURE, BASELOAD HEATVisions for the decarbonisation of industry have shifted profoundly. Even five years ago, scenarios foresaw a reduc-tion in industrial electricity use, while recent analyses point to massive growth. That is because electricity is now expec-ted to power fundamentally different processes, including via the use of hydrogen as a feedstock and energy source.83
Yet along with its role as feedstock for chemicals and ma-terials, there may be a strong use-case for biomass for indu-strial heating in specific applications. Industry often requires constant heat, and in some contexts, it may prove costly to provide it with electricity supplies that include large shares of variable renewable energy. Whether biomass is a better fit depends on the precise needs of different industries.
For low-temperature heat, biofuels face strong compe-tition from industrial heat pumps. Bio-based options would thus be most competitive when they can use cheap resi-dues or waste that could not be used elsewhere economi-cally, and in periods when electricity prices are high.
By far the largest user of bioenergy for industrial low-temperature heating today is the pulp and paper indu-stry. There, it is an integral part of valorising biomass waste streams, and it has enabled the sector to phase out most of its fossil fuel use. However, even now, electric boilers are being used instead of biofuels when electricity prices are low. The biomass resource freed up can occasionally be sold, but it is most attractive as an incremental (albeit lower-quality) source of fibre supply. Demand for the latter is poised to grow as the product portfolio expands beyond board and papermaking, finding new options to valorise lower-quality fibre. Hybrid systems could become the norm, using biomass only when electricity prices are high. This is especially likely as competition for limited biomass supplies becomes tighter.
For high-temperature heat, biomass may remain more competitive. A review of major alternatives (a range of direct electrification technologies and hydrogen) suggests that bi-
ofuels could be the lowest-cost option at prices as high as 7–9 EUR per EJ, depending on future electricity prices.84 However, there are many caveats. High-temperature proces-ses often require highly refined fuels in gas or liquid form that even today can be substantially costlier. Meanwhile, electrical heating brings important advantages, both in precision and energy efficiency (e.g., where microwaves could be used), or in improving process efficiency (e.g., in avoiding materials losses in the reheating of steel). Here too a hybrid system might be the most viable long-term option, with direct electri-city or electrolysers used in periods of low electricity prices and a potential bio-based option as backup.
SUMMING UP: BIOENERGY AS A SEARCH FOR HIGH-VALUE NICHESAcross sectors, it is clear that bioenergy faces growing competition from new technology options in key use-cases: biofuels for transport, bulk power generation, boilers for building heat, and industrial heat generation. Use-cases will remain, but mainly in specific niches or as a backup option. Three factors stand out for bioenergy competitiveness in these sectors:
• Access to and effective use of biomass resources for which there is no higher-value use, especially locally produ-ced wastes and residues;
• Ability to mobilise substantial revenue streams from co-benefits such as waste disposal, grid flexibility services, or carbon feedstock valorisation or storage; and/or
• Highly flexible use profiles as part of hybrid solutions that enable the use of electricity (including for hydrogen pro-duction) in periods of low electricity prices.
Companies considering their future options thus have complex equations to solve before they commit to biofuels as a major decarbonisation option. Policymakers, meanwhi-le, need to recognise that large-scale use of bioenergy across entire sectors is increasingly unlikely and adapt man-dates and incentives accordingly, while allowing niche uses to be driven by the market.

56 5757

5858 59
Bioenergy has a potential role in aviation, but is a less likely solution for shippingWhile many sectors already are making fundamental changes in the technologies they use, some are still deca-des away from major shifts. In aviation and shipping, it is difficult to imagine the diesel and jet engines used today being replaced. For short-haul trips, electrification is already coming to these sectors, with fuel cell and battery-electric options put forward or already being tested for both planes and ferries. There also are some proponents of hydrogen fuel cells in aviation, but it is still unclear if hydrogen fuel cells will prove viable in the long-term.85 However, most of the energy use in these sectors (83% for shipping and 73% for aviation86) is in long-distance journeys, where batteries and fuel cells face intrinsic disadvantages of bulk, weight, and capital cost. ‘Drop-in’ fuels that can replace fossil fuels in engines thus have strong appeal in these sectors.
Moreover, shipping and aviation often are forgotten in consi-dering future energy use, even though both could grow sub-stantially. Bunker fuels for international shipping and aviation often are not accounted for in national emissions inventories or climate commitments. Future scenarios for bioenergy use tend to omit them as well. In the EU, current scenarios have not accounted for them. However, these sectors’ total energy use is large, with significant implications if they used biofuels to decarbonise. The ships and planes departing the EU for in-ternational destinations in 2019 would need as much as 8 EJ of primary bioenergy if served entirely by biofuels, with strong projected growth to 2050, particularly in aviation.87
The cost of cutting CO2 emissions in these sectors is
high compared with most other parts of the economy. Esti-mates range around 150-350 EUR per tonne CO
2 for ship-
ping and 115–230 EUR per tCO2 for aviation.88 For com-
parison, record CO2 prices in the EU ETS in 2021 have
seen CO2 prices reach 50 EUR/t.89 The higher costs mean
that aviation and shipping are likely to be among the last to make fundamental changes in their technologies, including switching to alternative fuels.
Yet bio-based fuels are far from the only option for drop-in fuels. For shipping, one alternative is to replace bunker fuels with ammonia – a chemical otherwise used mostly for fertiliser and other chemicals production. Another option is methanol, which can be produced from CO
2 and hydrogen via well under-
stood pathways. For aviation, synthetic jet fuel from captured CO
2 is the main contender beside advanced biofuels.
The economic viability of non-bio options in shipping and aviation depends strongly on the costs of hydrogen production and the capture of non-fossil CO
2. Both the fundamental pro-
duction processes and the potential uses of non-bio solutions for shipping and aviation are relatively well understood. Cost competitiveness can thus be estimated by considering the cost of the key inputs: hydrogen production and, for methanol or synthetic fuels, the cost of carbon capture (Exhibit 17).
Importantly, products such as jet fuel, ammonia, and me-thanol are global commodities, with low transport cost relati-ve to their value. Thus, while the EU will need to rely on do-mestic resources in many cases, these liquid fuels could be imported, just as the EU imports most of its jet kerosene or oil used to produce shipping fuels today. The cost of production against which biofuels should be compared is therefore the globally available cost. This turns out to matter a great deal in a scenario where cheap solar power could be used to pro-duce the hydrogen used to make sustainable aviation fuels.
For ammonia, the analysis suggests a break-even cost aga-inst advanced biofuels of around 2.5 EUR per kg hydrogen, assuming a biomass feedstock cost of 6–8 EUR per GJ. For aviation, the break-even cost of hydrogen is more demanding, 1.2–1.9 EUR per kg hydrogen, for the same biomass feedstock cost and a cost of (non-fossil) CO
2 feedstock of 100–200 EUR
per tonne CO2 used. Conversely, as long as hydrogen costs
are above 2 EUR per kg, or the price of CO2 capture remains
at 200 EUR/t, biomass will be a cheaper option for a range of biomass feedstocks available at 6.5–10.5 EUR per GJ.90

58 5959
The competitiveness of bioenergy depends on hydrogen and carbon capture costs
Exhibit 17
SOURCE: MATERIAL ECONOMICS AND ENERGY TRANSITIONS COMMISSION (ETC) ANALYSIS. FOR DETAILS SEE TECHNICAL ANNEX.
0 00 0
14 14
10 10
6 6
12 12
8 8
4 4
2 2
0.5 0.51.0 1.01.5 1.52.0 2.02.5 2.53.0 3.03.5 3.5
Biomass priceEUR / GJ
Biomass priceEUR / GJ
hydrogen priceEUR / kg
hydrogen priceEUR / kg
shipping
ammonia cost advantage
synfuel cost advantage
biofuel cost advantage
biofuel cost advantage
aviation
150 EUR / tCO2 200 EUR / tCO250 EUR / tCO2
Cost of carbon
100 EUR / tCO2
Note: The production cost of biofuels for both aviation and shipping are directly dependent on the feedstock price of biomass (the y-axis). For shipping, the production cost of the non-biomass alternative (ammonia) depends on the hydrogen price (the x-axis). For aviation, the production cost of the non-biomass
alternative (synthetic aviation fuels) is dependent on both the hydrogen price (the x-axis) and the cost of carbon (the diagonal lines).

6060 61
This means that the long-term value of biomass in these sectors depends strongly on the cost of hydrogen. While the break-even hydrogen costs that would outcompete biofuels are far lower than those seen today, they may not be out of reach when set against trends in electricity generation costs in regions with good solar energy resources (see Exhibit 18). For example, a cost of 1.5 EUR per kg hydrogen could be reached even today by combining the globally available lowest costs of solar power, if electrolysers could be sour-ced at a cost of 500 EUR per kW capacity.91 Many analysts now foresee significantly stronger learning effects and cost reduction potentials than this.92 Moreover, where hydrogen is used as feedstock in production, there is no or little need for transport infrastructure that otherwise can raise the cost of delivered hydrogen significantly.
The cost of carbon capture is still more uncertain. Within the net-zero setting considered here, using fossil CO
2
captured from energy or industrial processes is not a viable option, as it does not create net-zero emissions at a sys-tems level. To reach net-zero emissions, options instead are either to capture CO
2 from biomass (‘biogenic CO
2’) used
for energy production (e.g., from a pulping mill or waste incineration facility), or to use CO
2 captured directly from
air. The scale of biogenic CO2 suitable for capture is highly
uncertain, so direct air capture of CO2 provides a backstop
option. Some assessments suggest that costs could be brought down to the levels shown in the analysis above, at 100–200 EUR/t CO
2.93
To give a sense of magnitude, for a cost of CO2 from
direct-air capture at 150 EUR/t, hydrogen would need to be provided at around 1.6–1.9 EUR/kg for synthetic aviation fuels to be cheaper than bioenergy with a feedstock cost of 6–8 EUR/GJ (Exhibit 17). In reality, both hydrogen and feedstock costs will vary. Still, the analysis suggests that biofuels and synthetic fuels might compete closely for large shares of the market, though uncertainties here are greater than for other parts of the analysis.
Taken together, this suggests many scenarios where bio-mass could have a role in sustainable aviation fuels. To get there, significant technology development is needed to ena-ble the use of woody biomass, as potentially available supp-ly of other options is far more limited than future demand. In contrast, for shipping the long-term equation is likely to favour alternatives to biofuels, notably ammonia. Biofuels would be cost-effective relative to ammonia only if global hydrogen costs were to remain much higher than many ana-lysts now foresee.

60 6161
Exhibit 18
Note: 1 Assuming average costs of transport and storage today is 1.5 EUR/kg H2 produced. In 2030, 50% local production, 40% transported by pipelines and 10% transported by road/maritime freight.
SOURCE: MATERIAL ECONOMICS, “MAINSTREAMING GREEN HYDROGEN IN EUROPE” (2020) .
What is needed to get to below 2 EUR/kg green hydrogenlevelised cost of hydrogen production, EUR/kg H2 delivered
Today Abundant cheap
RENEWABLE ELECTRICITY
Electrolyzer technology
Efficient and low
cost infra-structure1
Abundant cheap
RENEWABLE ELECTRICITY
Cost with 1200 TWh
global demand
Oxygen and heat sales
Cost with 500 TWh global demand
Electrolyzer technology
1.7
0.9
0.50.50.1
0.6
0.85.1
3.6
Electrolyser technology innovation Abundant cheap RES Efficient and low cost
infrastructure
The future globally available cost of hydrogen production could fall to very low levels
• 300-fold prod capacity (300 MW to 110 GW)
• 5% efficiency increase
• 10% increased lifetime
• Production up to 300 GW
• 15% efficiency increase
• 10% increased lifetime
• Acceleration of project deployments• Mobilisation of investments• Innovation support focused on
efficiency gains and electrolyser lifetimes
• Rapid deployment to reduce costs• Optimised utilisation of electrolysers • Large scale production in European
circumference, e.g., Spain, Portugal, the Nordics (and potentially N. Africa) for excess H2 needs
• Optimised balance of local (prioritised if possible) and centralised production
• Dedicated high volume pipelines• 100% repurposed pipelines where
possible• Centralised large storage solutions
• Electricity price at 30 EUR/MWh
• Electricity price at 20 EUR/MWh
• 40% of O2 and 20% of heat sold
• Local prod, pipelines when needed
~1
Dedicated production
without infra-
structure
6262 63
Carbon management and ‘negative emissions’ can add additional value to biomass use
The above analysis suggests a strong focus on are-as where biomass offers unique properties not available through other solutions. The carbon content of biomass creates an additional such consideration: It is possible for biomass to offer carbon dioxide removals (or ‘negative emissions’) if the CO
2 captured by plants is stored for long
periods of time.
BIOMASS CAN PLAY AN IMPORTANT ROLE IN CARBON REMOVALSThe creation of such carbon removals / negative emis-sions is a major part of all climate scenarios that meet stringent climate targets. They reach enormous scale in glo-bal mitigation scenarios, to remove 2.5–16 billion tonnes of CO
2 per year by 2050 in IPCC scenarios94 (for compa-
rison, around 4.5 billion tonnes of crude oil are extracted globally per year95). In the EU, recent scenarios have sug-gested 52–298 million tonnes of negative CO
2 emissions
per year in 2050.96 These estimates are controversial. There are ongoing arguments both about the feasibility of such large amounts of negative emissions, and about the effect that planning for large future negative emissions could have on dampening current efforts to cut fossil CO
2 emissions
instead.97
The options for negative emissions span a wide range. So-called ‘nature-based solutions’ rely on creating increased stores of carbon either in plants (especially forests) or in soils, through measures such as increasing forest cover or resto-
ring wetlands.98 The other main category is to capture carbon and store it underground (carbon capture and storage, CCS). Bioenergy provides a major potential option for such carbon removal: CO
2 is captured by plants, and when released as the
biomass is used for energy, it is stored via CCS (bioenergy with CCS, or BECCS). BECCS features heavily in many sce-narios for climate mitigation, but more recently, there also has been interest in the option of directly capturing CO
2 from air
(direct air carbon capture and storage, or DACCS).99
The cost of these solutions varies. One review conclu-ded that BECCS would cost 100–200 USD per tonne CO
2,
which puts it at the high end of abatement options, while DACCS could reach 100–300 USD per tonne CO
2.100 Natu-
re-based solutions are systematically less costly where avai-lable: 5–50 USD per tonne for afforestation or reforestation, 30–100 USD per tonne for biochar, and 0–100 USD per tonne for soil carbon sequestration.101 These estimates may be optimistic: As with all options, there are questions about the true extent of CO
2 savings. For nature-based solutions,
a major issue is whether the carbon store created would be permanent enough to contribute to long-term CO
2 targets.102
For BECCS, as with all bioenergy use, the actual CO2 sa-
vings depend on whether the production and extraction of the biomass itself leads to CO
2 emissions (see next chapter)
that offset some of the benefit. Some studies have sugge-sted this can have a large impact, eroding between 38–54% of the emissions reductions (once 50% is eroded, the solu-tion is in fact no longer carbon-negative, although it can be carbon-neutral).103

62 6363
The use of biofuels in transport has increased
25-fold since 2000

6464 65
144–372 Mt CO2 per year
Emissions that could be avoided by limiting the expansion of
biomass supply.

64 6565
144–372 Mt CO2 per year
THE USE OF BIOMASS FOR CCS AND CCU CAN ADD VALUE TO SPECIFIC NICHES OF BIOMASS USES1. DACCS may be a much more viable option than believed to date. Some recent estimates have sugge-sted that DACCS could fall to costs as low as 50 EUR/t by 2040,104 making it more cost-effective than BECCS – and potentially more than several nature-based options. The po-tential for DACCS to be as cost-effective as BECCS provides a major shift in perspective. Most climate scenarios analy-sing future biomass use have not included this possibility.105
The use of DACCS has other potential benefits: Notably, the land footprint is 10-50 times smaller than that of BECCS per tonne of CO
2 captured.106 Given the risk that land-use
changes cut into a large share of the benefits of BECCS, the cost gap may be smaller still than pure engineering-based estimates have suggested. Direct air capture of CO
2 therefo-
re deserves to be taken very seriously. Nonetheless, major questions remain about how viable and cost-effective this early-stage technology will prove.
2. BECCS is most viable on pre-existing, large point sources of CO2 from biomass. It leads to both lower costs and less claim on additional biomass resources when applied on large point sources of CO
2 that are likely to exist
anyway in a future energy system. The analysis suggests the following as key categories for this:
• Pulp and paper production: The pulp and paper industry emits almost 70 million tonnes of biomass-derived CO
2 per
year.107 Even if this is likely to fall for papermaking– given the potential for energy efficiency to use electricity to free up some of the biomass that is currently used for low-grade heat, as discussed above – a significant potential for BECCS remains in the production of pulp. The cost can be lower than for many other BECCS options, at 50–60 EUR/t CO
2.108
• Waste incineration: The gasification or incineration of waste is the main alternative for streams that cannot be recyc-led. With an increasing focus on extracting residual plastics from municipal waste, future waste streams will also be much more dominated by biomass than is the case today. CCS is an option for sufficiently large facilities (costs are as much as 80% higher for facilities around 200 kt CO
2 per year than they
are for ones of 500 kt CO2 per year or more).109
• Biofuels production: The production of biofuels via the main likely future routes leads to large streams of high purity CO
2 that can be directly captured at low cost. For fermen-
tation routes, around 15% of the CO2 is released, while in
gasification it can be as high as 55%.110 Storing this carbon could thus provide another revenue stream for biofuels pro-duction.
3. BECCS for dedicated heat and power generation plants faces much larger uncertainties. The key diffe-rence to the above examples is that stand-alone biomass power plants are very unlikely to be economically viable in the absence of legacy subsidies. Adding CCS would only change that picture if a) there is a sufficient premium for ‘firm’ low-CO
2 power that can be predictably dispatched,
and b) the additional revenue stream from CO2 storage is
large enough to overcome the financial disadvantage. The analysis for this report suggests both are unlikely, but as noted, different assessments view this very differently, from scenarios with almost no use of biomass (with or without CCS), to ones with large shares.
4. CCU may prove more attractive in the long term. A major additional question is whether BECCS or bioener-gy with carbon capture and utilisation (BECCU) will prove more attractive. As noted in the previous chapter, the use of non-fossil CO
2 as a feedstock could very well be an im-
portant part of the solution for chemicals production and aviation fuel in a net-zero economy – with low-cost hydro-gen a key prerequisite. Within reasonable ranges for green hydrogen costs of 1–1.5 EUR per kg, waste-to-materials could prove cost-effective relative to other, net-zero routes for materials circularity (such as pyrolysis or gasification). Likewise, depending on the cost of direct air capture of CO
2,
CCU from more concentrated CO2 streams such as biofuels
plants or pulp production may be more valuable than CCS.
5. Long-lived biomaterials can provide another source of carbon storage. Finally, the use of long-lived products from biomaterials can provide an additional form of carbon storage. A prominent example is long-lived wood products, which bind carbon for the entire lifetime of their use. Assessments show that this mechanism for carbon storage can be substantial, running to several hundred mil-lion tonnes of CO
2-equivalents globally,111 while in the EU
they could be 30–40 million tonnes per year in a 2030 perspective.112

6666 67
Course correction – an integrated perspective
on the BioeconomyThe principles for prioritising biomass use laid out in the previous chapter suggest a major departure from how these resources have been used to date. Taken together, they amount to a major course correction: Tomorrow’s use of biomass looks very different from today’s, or from many scenarios that have been proposed.
In this chapter, we analyse the value at stake and prere-quisites for such a change in course. We contrast a busi-ness-as-usual scenario with high biomass use with a high-value scenario, and find major gains both in pure financial terms as well as in terms of resource efficiency and net CO
2
impacts.
Chapter 3

66 6767

6868 69
A high-value scenario for EU biomass useThe high-value scenario uses the findings presented in the previous chapter to develop a potential deployment of biomass into bioenergy and biomaterials. As shown in Exhibit 19, bioenergy use is in the range of 4–8 EJ (vs. 6 EJ today) with biomaterials use of 5.5–7 EJ (vs. just over 4 EJ today).
The largest biomass uses are in materials applications and in aviation, where biomass takes on a large role. Bio-mass deployment in the power sector is small and highly specialised, but because power demand will grow so strongly by 2050 the total volume still makes power generation one of the top uses. Biomass use in other sectors is very limited. There is almost no use of biofuels in road transport, while heating is limited to specialised niches centred on handling
waste flows in integrated offerings. Shipping likewise uses biofuels only in a small subset of categories.
This is contrasted with a ‘business as usual’ (BAU) scena-rio, where biomass is distributed in line with current EU policies (with mandates and subsidies for use for power generation and as transport fuel). The result is a mix similar to those pro-posed in the sector studies reviewed in Chapter 2. In this sce-nario, 6.5 EJ more supply of bioenergy is created than in the high-value scenario, mainly through dedicated energy crops, but also by extracting more residues from forests and agricul-tural land.113 Even so, supply is insufficient for many newer app-lications, and alternative solutions are required for chemicals, aviation, and shipping. Material use is assumed to be the same in the BAU scenario as in the high-value scenario.

68 6969
A high-value scenario for EU biomass use in 2050Exhibit 19
materials
energy
Sector Role in scenario Range in scenario (EJ)
fibre
timber
chemicals production
road transport (passenger)
road transport (freight)
power generation
LOW-TEMPERATURE INDUSTRIAL HEAT
HIGH-TEMPERATURE INDUSTRIAL HEAT
aviation
shipping
total
Expanded use of fibre-based products in packaging, and expanding in newer applications including textiles, insulation materials, and a range of advanced materials niches; continued decline in uses of printed paper.
Increased use of wood in construction and wood use in other sectors (packaging, consumer goods).
Biofuels in road transport lose competitiveness to electric battery vehicles (cars and buses). Turnover of fleet means that biofuels are all but phased out by 2050.
As in passenger transport, biofuels are costlier than alternatives by the 2030s, giving enough time for replacement of nearly all of the European fleet by 2050, by which time biofuels are almost entirely phased out of use.
Biomass used in some EU markets as backup capacity (supported by capacity markets or reliability reserves), and for flexible generation required for seasonal flexibility. Biomass for large-scale power generation is limited, including with carbon capture and storage.
Electricity and hydrogen limited to short-haul applications. Long-haul aviation served by a combination of advanced biofuels and synthetic fuels, sourced in part from biogenic CO2 , in part from CO2 captured directly from air. Once deployed at scale, synthetic fuels are largely imported to the EU from regions with low-cost and abundant renewable energy resources.
Electricity and hydrogen are used on shorter shipping routes. International shipping served principally by ammonia, with imports more cost-effective than exclusive EU production. Advanced biofuels are limited to a small subset of ship and route categories.
Very limited use, focused on locally stranded wood residues, some existing district heating capacity, and waste incineration for heat production in conjunction with provision of waste management services. Industrial low-temperature heat – including some existing applications – are fully or partly electrified.
Bioenergy used in pulp production but less in paper production, where electrification frees up resources for other sues). Biomass is also used as a complement to hydrogen and electricity, creating a hybrid solution for flexibility in selected high-temperature options, with biogas complementing hydrogen and a range of biofuels complementing direct electrification.
Biomass used as a “last-resort” source of non-fossil feedstock for plastics and chemicals, after extensive demand-side measures to reduce use, some substitution to other materials, mechanical recycling of plastics, and chemical recycling at end of life. Biomass fraction is sourced partly from municipal waste, partly from residue flows via gasification and fermentation routes.
(Range 5.5-7)
(Range 4-8)
1-3
3.5-4.0
1.6-1.8
0.8-1.2
0.3-0.6
0.7-1.1
0.5-0.7
1.3-2.2
0
0
6
6
Note: 1 Primary energy equivalents have been used as the measure for both materials and energy in this study to make values comparable. Materials have been converted from mass (kg) or volume (m3) to energy by the specific energy density of the material. The energy is also measured in primary rather than final energy
form, to account for conversion losses in the production of biofuels. The values shown are for EU27 + UK.
SOURCE: MATERIAL ECONOMICS ANALYSIS.

7070 71
The results show a large value at stake (Exhibit 20). The high-value scenario is 36–49 billion EUR per year cheaper, based on the detailed cost estimates underlying the value curve presented in Chapter 2. This is both because lower-cost solutions are used in key applications (notably, in road transport and bulk power generation), and because steering biomass towards high-priority areas avoids the high abate-ment costs of alternative solutions in these sectors (notably, in chemicals, aviation, shipping, and power sector flexibility).
This also means that the high-value scenario is a chea-per way to cut CO
2 emissions. The average abatement cost
is 85–115 EUR/t CO2 lower than in the BAU scenario. Ac-
counting for the additional biogenic emissions that higher biomass use entails (see below), this difference grows to 132–180 EUR/t in the BAU scenario – far above CO
2 prices
required for most abatement measures.114
A high-value scenario for biomass use has large benefits for the EU economy
Exhibit 20
SOURCE: MATERIAL ECONOMICS ANALYSIS BASED ON MULTIPLE SOURCES.115
Million hectares of land not converted to energy
crops
land area savingscost savings CO2 savings
Billion EUR lower annual costs in 2050
Million tonnes of CO2 avoided
3736 144

70 7171
Land claims are 90% lower for non-biomass options

7272 73
LAND CLAIMS ARE 90% LOWER OR NON-BIOMASS OPTIONS
The high-value scenario also leads to substantially lower land claims. Alternatives to biomass have a footprint of just 2–16% of the land area required to produce an equivalent amount of energy and feedstock (Exhibit 21). The main dri-ver of land use in the non-bio-options is electricity genera-tion, with a smaller footprint from the mining of minerals and (where this is used) direct air capture of CO
2.
Concretely, the BAU scenario requires some 35–40 mil-lion hectares of land for energy crop production that could
be avoided in the high-value scenario. In return, the high-value scenario requires 3–4 million hectares for electricity generation, mining, and other uses. The distribution of land also is very different. As discussed, it is difficult to see how the EU could be a large-scale importer of biomass in a situation where farmland use for food and feed produc-tion is still growing rapidly and where, at the margin, large amounts of deforestation and other land-use conversion is required to enable this trend. The 35–40 million hectares would therefore be within the EU. In contrast, around 40% of the land footprint in the high-value scenario – for the production of imported ammonia, methanol, and synthetic fuels – could (and, following the economics, very likely would) – be outside the EU.116

72 7373
Land use efficiency of different use cases for biomass
Exhibit 21
SOURCE: MATERIAL ECONOMICS AND ENERGY TRANSITIONS COMMISSION (ETC) ANALYSIS BASED ON MULTIPLE SOURCES.117
Land use savings of using non-biomass option % land requirement vs. bio-based option
Synfuels vs. biofuels
Ammonia in diesel engine vs.
biofuels
Fuel-cell electric vehicles vs.
biofuels
Hydrogen storage vs.
biomass plant
Renewable electricity and batteries vs.
biomass plant
Battery-electric vehicles vs.
biofuels
Renewable electricity vs. biomass plant
Electric heat pumps vs.
biomass boilers
Heat pumps vs. biomass boilers
16%
11%
8%
6%
4% 4% 3%
2% 2%
Aviation Shipping Heavy duty Power interday
Power intraday
Light duty Power bulk generation
Residential heating
Industrial heating

7474 75
THE HIGH-VALUE SCENARIO REQUIRES 1100 TWh OF ELECTRICITY AND ACCESS TO ALTERNATIVE SOURCES OF CARBON FEEDSTOCKThe ability to achieve the high-value scenario depends on mobilising the necessary electricity. The amount of power required for alternatives to bioenergy and biomateri-als varies widely between applications (Exhibit 22). At one extreme, there are cases where electrification provides a major efficiency improvement, so one unit of electricity can replace 2.5–5 units of biomass in primary energy terms.118 This includes heat pumps for space heating, battery electric vehicles, and baseload electricity generation. At the other extreme are approaches where the alternative to using bio-mass is to use synthetic carbon (for chemicals and liquid fuels in shipping and aviation). In these, the relationship is reversed, so replacing one unit of biomass requires 1.1–1.7 units of electricity, rising to more than 1.5–2.8 units for some chemicals.119 This of course also drives cost and is a major reason why biomass use can be particularly valuable in these applications.
In total, 1100 TWh of additional electricity is required for the high-value scenario, which means that on average, 1 MWh of electricity replaces 1.7 MWh of primary biomass.120 This is a very large amount; for comparison, total electricity use in the EU-28 in 2019 was just under 3000 TWh.121 However, as with land claims, not all or even a majority of the generation would necessarily occur within the EU. In particular, a large share of synthetic fuels and ammonia could be imported from locations
with cheaper renewable energy resources than are available at scale in the EU. As discussed in Chapter 2, this would be requi-red to make electricity-based options competitive with biofuels in aviation (and potentially in shipping). The total electricity requi-rements in the EU itself are thus lower, in the region of 500–700 TWh, depending on how successfully the EU can mobilise its own low-cost solar and wind power energy resources.
Viewed in this light, one of the advantages of relying on alternatives to biomass is that it enables the use of globally available resources. As noted in Chapter 2, relying on im-ported biofuels is a risky strategy for the EU in a situation where supplies will be stretched globally, and where ongoing land-use conversion continues to be both a major source of greenhouse gas emissions and highly destructive of biodiver-sity. Solar and wind power face much less of a trade-off, and resources are abundant. The challenge in mobilising these resources is less one of cost, and more one of a) matching supply of variable renewable energy with the time of use, and b) conveying the energy to demand centres. Synthetic fuels provide a way to do both: a) by running lower-cost electroly-sers to match the load profile of combined solar and wind generation, and b) by using the resulting hydrogen to produ-ce relatively energy-dense ammonia or synthetic fuels locally.
The large electricity needs provide a reminder of the im-portance of considering the demand side: the role for ener-gy efficiency, resource-efficient systems, materials efficiency, and circular materials flows. This helps reduce claims both on biomass resources, and on the energy and other inputs to the alternatives.

74 7575
The electricity requirements of replacing biomass vary strongly between use-cases
Exhibit 22
SOURCE: MATERIAL ECONOMICS AND ENERGY TRANSITIONS COMMISSION (ETC) ANALYSIS BASED ON MULTIPLE SOURCES.122
Electricity required to replace one MWh of biomassMWh electricity / MWh biomass
1.7
1.1
0.6 0.6
0.4 0.40.2 0.2 0.2
Aviation Shipping Power interday
Heavy duty
Power intraday
building heating
Power bulk
generation
light duty
Industrial heating
chemicals
1.5-2.8

76 77

76 7777
THE HIGH-VALUE SCENARIO COULD AVOID EMISSIONS OF 144–372 MILLION TONNES OF CO2 PER YEARThe high-value scenario also reduces the risk of CO
2
emissions that are associated with the production and ex-traction of biomass resources. There are four main effects to consider: value chain emissions, biogenic CO
2 emissions,
indirect land-use change, and carbon debt and payback.
1. Value chain emissions. The cultivation of crops and fur-ther preparation and processing of feedstock into fuels and materials can produce GHG emissions. Examples include the nitrous oxide and other GHG emissions from the production or application of fertilisers and other chemicals; fossil fuels used in harvesting, transporting, drying, grinding, and other processing; or the release of methane (a powerful greenhou-se gas) in the processing of feedstock to biogas or biofuels.
2. Biogenic CO2 emissions from land-use change. The extraction of biomass feedstock affects the total amount of carbon that is taken up by plants from the atmosphere (‘sequestered’) and then stored in vegetation and in soils. The balance of this ‘biogenic CO
2’ from the production of
biomass feedstock depends on three main factors:
• First, when land changes from one state to another there can be a direct loss of biomass. The clearest case is whe-re land storing large amounts of carbon (forests, wetlands, etc.) is permanently converted to other uses that store much less (such as annual crops).
• Second, different crop or forestry practices can have markedly different rates of sequestration of CO
2 by growing
plants. For example, younger forests take up more CO2 than
do old-growth forests.
• Third, soils store several times more carbon than does vegetation,123 and different management systems can pro-foundly affect these stores of soil organic carbon. In parti-cular, annual crops generally store significantly less carbon than do perennial plants.
3. Indirect land-use change. To complicate matters, there is scope for large indirect effects, whereby the culti-vation of energy crops in one part of the world can result in additional biogenic CO
2 emissions in another. Markets
for many crops are global. Converting land to the cultiva-tion of bioenergy crops can displace food crops, reducing the local supply of food and driving an increase in food crop production elsewhere in the world. Where additional land is then turned over to cultivation, this indirect land-use change (iLUC) can lead to very large GHG impacts, especially where it contributes to deforestation in tropical regions.
Reviews of a large number of studies have demonstra-ted that, unless carefully managed, the negative effects of iLUC can more than offset any gains from using bioenergy to replace fossil fuels.124 A major concern with EU biomass policy therefore has been to try to design safeguards to limit the use of biomass with large iLUC impacts, notably by limiting the use of food crops to a very small share of how EU Member States meet renewable energy targets. While there is agreement that iLUC is a potentially important factor, there is little consensus on what measures are effective top prevent it, and widely differing views on how likely iLUC is for different categories of crop.125
4. Biogenic CO2 ‘carbon debt’ and payback. Finally, effects play out in complex ways over time. Where land use changes or biomass is harvested, a ‘carbon debt’ can be created: Land-use change or harvest leads to an immediate release of carbon from plant matter and soils, while it takes time for biomass to grow back and seques-ter an equivalent amount of carbon again.126 In the most destructive cases, notably where deforestation is involved, the initial carbon debt can be so large that the payback time extends over several centuries.127 Equally, however, the carbon debt for a landscape as a whole can be much smaller than it is for an individual field or forest stand (for example, if harvests are rotated so that the overall carbon stock is managed). Of course, for climate neutrality, it is not sufficient just to reach parity with fossil fuels, but the overall CO
2 emissions have to be net-zero.

78
Most proposed EU use cases are at neither extreme. As reviewed in Chapter 1, in a scenario with small increases on current supply, most would be supplied from forest industry by-products and agricultural and forest residues. Increasing supply further would likely involve some increased wood har-vesting, but most of the proposed supply would come from energy crops grown on abandoned land. Estimates for these sources vary widely on what the true GHG footprint is. One ma-jor study carried out for the European Commission found that the total biogenic CO
2 emissions resulting from the EU pro-
duction of agricultural biomass for energy or materials use (a combination of energy crops and agricultural residues) would be in the span of 12–24 kg CO
2 per GJ of energy content.132
This is in the same range as suggested by other studies, but the average masks significant variation. Estimates vary widely, and effects could be either significantly higher (up to 100 kg CO
2 per GJ) with poor management practices, or lower (if con-
fined to perennial energy crops, and only on land that would otherwise revert to grassland or to degraded land).133
The emissions factor for additional and incremental wood extracted for energy uses (that is, beyond what is already pro-duced) could be in the region of 50 kg CO
2 per GJ in a per-
spective of two to three decades.134 The comparatively large impact arises because forests are already heavily managed, so increasing supply would require either more intensive practices, harvesting additional areas, or increasing imports from sources where wood is harvested directly for energy uses. Even so, this estimate of 50 kg CO
2 per GJ would requires stringent adheren-
ce to good forest management practices. Less success in im-plementing best practice could see emissions grow as high as 110 kg CO
2 per GJ or more (exceeding that of coal), and some
modelled scenarios with sharply increased supply calculate emissions corresponding to as much as 166 kg CO
2 per GJ.135
Note that these examples are not an average for all wood used for energy, but specifically estimates for the additional emissions that result when EU supplies are increased beyond a reference level (as this is the relevant comparison of the high-value scena-rio and the business as usual scenario).
LIMITING THE EXPANSION OF BIOMASS SUPPLY COULD AVOID 144–372 MT CO2 PER YEAR
To fully evaluate the CO2 impact of biomass use for
energy, all four effects must be considered: value chain emissions, biogenic CO
2, indirect land-use change, and
carbon debt dynamics. The existence and relevance of these various effects is not in dispute. However, the net impact varies enormously between different use-cases for biomass. Moreover, effects are complex and uncer-tain, so estimates for any one use-case also can vary widely.128
Starting with value chain emissions, these are typi-cally on the order of 10–20 kg CO
2 per GJ for the types of
biomass that are relevant for expanding future EU biomass, though there are some significantly higher estimates.129 If applied to the 6.5 EJ of additional biomass use in the BAU case over the high-value case, it translates to 65–130 mil-lion tonnes of CO
2 per year. However, in many cases, pro-
duction emissions could be cut substantially, including by switching to zero-carbon solutions for heating and transport. From a 2050 perspective, GHG emissions from production could therefore be much smaller than today.
The release of biogenic CO2 depends strongly on the
precise underlying land management and sourcing practi-ces. At one extreme, there are cases where the biogenic CO
2 is so large that the use of bioenergy leads to higher
net total GHG emissions than the continued use of fossil fuels. For example, if whole trees are used as fuel for power generation the CO
2 impact can be higher even than the con-
tinued use of coal-fired power.130 Similarly, transport biofuels from energy crops displacing forests can have 2–6 times higher GHG emissions than the continued use of petroleum.131
At the other extreme, some cases – such as the use of mu-nicipal waste for energy – can even have additional negative effects on GHG emissions.

78 79
This leads to two important conclusions about the CO2
effects of wood fuels on EU climate targets. First, it matters hugely where supplies come from. Wood fuel imports, wood sourced from more intensive forest management (especially if via poor practices), and an increase in out-take of woody biomass can all have very large footprints, to the point whe-re biogenic CO
2 negates the climate benefits of switching
from fossil fuels for very long periods of time. Conversely, however, the CO
2 implications of using wood by-products or
residues from existing forestry are much smaller and may lead to practically no additional biogenic CO
2 (if their use
does not affect harvesting practices). Second, this means that the risk of additional biogenic CO
2 grows much lar-
ger for increased wood fuel supply beyond what is already produced. Studies suggest increases would need to involve turning to the sources with the higher footprints, potentially creating large amounts of additional biogenic CO
2 footprint
for many decades.
Putting this together for agricultural and forest biomass, the analysis suggests that the high-value scenario (with much smaller increases than business as usual) would avoid around 144 Mt CO
2 of additional emissions at the
lower end of estimates, where it is compared to good fo-restry practices and energy crops with low GHG impact. This means that around a third of the fossil fuel emissions avoided by mobilising more biomass are offset by increased emissions of biogenic CO
2. Increased biomass energy thus
cuts emissions, but it does not do so fully – with strong implications for targets to reduce emissions to net zero. In scenarios with poor management, where more of the supply is met by increasing harvesting of forest biomass for energy or energy crops are planted on land that would otherwise revert to forest or grassland, the effect could be more than twice as big: 372 Mt CO
2. This would mean that most of the
benefit of replacing fossil fuels is negated. (Of course, simi-lar ‘poor practice’ examples can constructed for alternatives as well; for example, if electricity supply used instead of biomass energy were not zero-carbon.)136
This tells us that biogenic CO2 is a critical factor. At worst,
it can even erode much of the climate mitigation benefit of using additional bioenergy to replace fossil fuels; at best, it can be managed down to low levels, leaving much of the CO
2 benefit intact. The difference in CO
2 impacts between
good and bad execution could run in the hundreds of mil-lions of tonnes of CO
2 per year. The most important factors
to keep impacts on the lower end of the range are to en-sure good forestry practices, limit imports of biomass from regions with weaker practices, steer any expansion of en-ergy crops only towards land that would otherwise revert to grassland or to degraded land, and eliminate emissions from the supply for biomass processing via low-carbon electricity and transport.
Opinions diverge sharply on how successful this is li-kely to be. There is little doubt that some biomass streams (wastes, some share of residues, and several categories of by-products) can be used without large additional CO
2 emis-
sions. However, there is a vigorous debate about the feasi-bility of limiting energy crop cultivation to areas that would not otherwise revert to forest or other vegetation with high carbon stores, and little support in research for scenarios to increase forest biomass use for energy further without a big trade-off with biogenic CO
2. And in all cases, the press-
ures towards uses with high biogenic CO2 emissions grow
stronger the more biomass is produced and extracted.
At a minimum, achieving a low-CO2 outcome would re-
quire a major change from today’s practices. As noted in Chapter 1, today’s energy crops are largely annual food crops grown on existing agricultural land, rather than peren-nial crops grown on abandoned, marginal land. Likewise, as noted in Chapter 1, as much as 37–51% of the wood used for energy is directly harvested (with higher CO
2 impact),
not derived from by-products or residues (with much lower CO
2 impact).137 Overall, the risk of biogenic CO
2 emissions
thus adds to the reasons to take a cautious approach to future levels of bioenergy use.

80
An agenda for a high-value biomass futureThis study has highlighted multiple contradictions and tensions in plans for future biomass use. Different policy areas pull in conflicting directions. Current plans for biomass use – company strategies, National Energy and Climate Plans, and the scenarios that underpin EU Directives – collectively require a much larger supply than is likely to materialise. Policy frameworks also treat different categories of biomass the same even though they may have very different environmental impacts, and full accounting for CO
2 impacts is only now being tested.
Policies subsidise the use of bioenergy despite the av-ailability of other low-CO
2 solutions, many of which look
more economically attractive in the long run. All in all, the EU’s near-term trajectory is increasingly at odds with its long-term destination, creating risks that sharp readjust-ments will be needed along the way.
It is clear that the EU can make better use of its biomass resources – but to achieve the greatest possible economic and climate benefits, it needs to realign its policies and plans as soon as possible. This would also benefit com-panies, as the current situation is too uncertain for sound investments. Producers such as land and forest owners or pulp and paper companies have every interest in impro-ved policies that steer resources towards the applications with the highest value, reduce risk, and distinguish between good and bad practices. Likewise, companies that hope to rely on biomass for fuel or as feedstock need a much more stable basis for making major capital commitments.
In order to enable future high-value uses of biomass and better align societal goals with business opportunities, the EU needs to take four key actions (Exhibit 23).

8180
1. ENSURE COHERENCE BETWEEN POLICY AREAS
Improve coherence between EU energy, biodiversity, and agricultural policy.
Create consistent incentives for land-use and energy CO2 emissions
2. SET A CREDIBLE LONG-TERM DIRECTION FOR BIOMASS USE
Reset expectations about future levels of biomass use
Account for the differential impact of different sources of biomass
3. CREATE POLICIES TO SUPPORT HIGH-VALUE USES OF BIOMASS
Ensure balanced incentives for materials and energy uses of biomass
Reconsider volume targets and policy that steer towards low-value uses of biomass
4. CREATE THE ENABLERS FOR A HIGH-VALUE BIOMASS FUTURESupport an accelerated innovation agenda
Enable the deployment of low-carbon electrification
AN AGENDA FOR A HIGH-VALUE BIOMASS FUTUREExhibit 23

8282 83
1. ENSURE COHERENCE BETWEEN POLICY AREAS

82 8383
CREATE CONSISTENT INCENTIVES FOR LAND USE AND ENERGY CO2 EMISSIONS Chapter 3 described how removing biomass and soil carbon stocks for bioenergy can lead to the release of biogenic CO
2, the
carbon content of vegetation and soils. Until recently, these bio-genic CO
2 emissions were not fully accounted for in EU climate
frameworks. While bioenergy is counted as zero-carbon under the Renewable Energy Directive and the EU Emissions Trading Scheme, biogenic CO
2 was not fully represented in in national
climate accounts. The LULUCF Regulation 2018/841 aims to address this, by accounting for these carbon impacts separately.
However, there is controversy about whether the new accoun-ting will succeed in capturing all relevant impacts – not surprising, given the complexity involved.138 Data uncertainties, a lack of ac-counting for imports, and uncertainties in the underlying science may mean that not all changes are captured. All stakeholders should therefore expect continual revisions to this framework.
Equally relevant is that the incentives created are split and work very differently for different parties. The zero-rating of bio-mass combustion means there are strong incentives for all en-ergy consumers to use biomass in place of fossil fuels. The biogenic CO
2 part of the equation is handled completely separa-
tely, as the LULUCF Regulation holds countries accountable for these emissions via national climate accounts.
It thus is largely up to national governments to attempt to create incentives and governance structures that encourage only bioenergy uses that do not create too large a debit in their national climate accounts. This is no easy task, and at best, work in progress (see below).
Companies cannot count on biomass remaining “zero carbon” indefinitely. At some point, efforts by countries to align incentives on biogenic CO
2 with the LULUCF Regulation could
lead them to reassess the carbon neutrality of various sources of biomass feedstock. That already happened with biofuels pro-duction from food crops. As long as this issue remains unresol-ved, it creates further uncertainty.
IMPROVE COHERENCE BETWEEN EU ENERGY, BIODIVERSITY, AND AGRICULTURAL POLICIES
Chapter 1 summarised studies of EU biomass poten-tial that consistently find that biomass availability greatly depends on what biodiversity and other environmental tar-gets are adopted. Likewise, the available supply (and the land area needed to grow energy crops) is closely linked to how much more agricultural yields can be increased. Energy scenarios and policy that envision strong growth in biomass supply thus make important assumptions about how land use, forestry, and agriculture will evolve.
At the same time, other EU policies are being reshaped in ways that have strong implications for biomass supplies. For example, the proposed Biodiversity Strategy would more than double the land area set aside for nature con-servation. The proposed Farm-to-Fork Strategy, in turn, aims to double organic agriculture and reduce fertiliser use by at least 20% – both of which would likely lower agricultural yields.
EU policies could therefore pull in conflicting direc-tions: energy and climate policy one way, and biodiversity and agricultural policy in another. There is an urgent need to align these different policies.
Until policy-makers create greater coherence, compa-nies will face uncertainty. At worst, they might find them-selves using biomass supplies that carry a ‘hidden cost’ of negative impacts on biodiversity or other environmental objectives. Their carefully laid plans might then require expensive future corrective action to reduce emissions in other ways.

8484 85
2. SET A CREDIBLE LONG-TERM DIRECTION FOR BIOMASS USE
Now the parameters in the equation are fundamentally shifting. Chapter 1 showed how increased urgency about halting biodiversity loss and limiting other environmental effects have major implications for future land use scena-rios, and thus for future biomass production. Chapter 2, meanwhile, showed that alternative solutions are being de-veloped in sector after sector, and many cases seem set to be cheaper than solutions based on biomass. On both the supply and demand sides, key factors are changing fast.
Still, as Chapter 1 showed, assessments about the future role of biomass have changed very little over the last decade. The assumption of a near-doubling in bioenergy use, under-pinned by increased forest harvests and large-scale energy crop cultivation, has been nearly constant. National Energy and Climate Plans likewise emphasise the same uses as were envisioned when the 2009 Renewable Energy Directive was put in place, with continued strong focus on biomass power and transport biofuels – even though these now look much less economically attractive than they did 12 years ago.
RESET EXPECTATIONS ABOUT FUTURE LEVELS OF BIOMASS USE
Expectations and targets for future biomass use have not kept up with developments. There is a need to bring sce-narios in line with current priorities for biodiversity, and with the rapidly shifting opportunities for electrification across all major sectors of the economy.
Past policies envisioned a high-biomass future, in large part, because available alternatives were assumed to be limi-ted. A large-scale increase in the extraction of biomass thus seemed worth betting on, even if supply came at the price of increasing environmental burdens, or would have to be mobilised from sources that are unproven at scale (such as the converting massive amounts of abandoned land to grow perennial energy crops).

84 8585
It is time to reset expectations. There are signs that a major gradual reevaluation is already happening in other contexts. For example, the International Energy Agency’s (IEA) new ‘Net Zero’ scenario for global energy systems, though more ambitious than past IEA scenarios in the speed and extent of emissions reductions, foresees a much smaller role for bioenergy. The global amount bioenergy in 2050 is 100 EJ, whereas previous assessments had projected 140 EJ or more.139 Whether even 100 EJ is realistic is still debatable.140
The point is more that up-to-date analyses of the energy transition now see much more focused use of biomass.
This study finds a strong case for a similar reevaluation of the future EU energy system. As explored in Chapter 3, an up-to-date technology assessment suggests that lower bioe-nergy use than in current EU scenarios could be both more cost-effective and less at risk of compromising the environ-mental integrity of the intended CO
2 emissions reductions.
ACCOUNT FOR THE DIFFERENTIAL IMPACT OF DIFFERENT SOURCES OF BIOMASS
A defining feature of biomass is the large difference in the environmental impacts of different sources of supply. The umbrella category ‘biomass’ encompasses everything from by-products and waste streams that would anyway be created (and thus have little additional environmental bur-den), to dedicated, large-scale production systems with po-tentially large opportunity costs and environmental burdens.
Despite this, EU policy has so far made little distinction between categories of biomass. The main exception is the limit on the quantity of food crops that can be counted towards fulfilment of Member State renewable energy tar-gets, motivated by the high risk of indirect land-use change (iLUC). The 2018 Renewable Energy Directive also attempts to set basic safeguards to limit feedstock use from land with particularly high biodiversity or carbon stocks.
However, the biodiversity and net CO2 impacts of biomass
supply go far beyond these situations. Imports are a parti-cularly important case in point, as the safeguards of the EU LULUCF Regulation cannot be counted on (even in the EU, a climate leader, did not fully implement the IPCC guideli-nes until 2018, and many other regions lag far behind). But even within the EU, as Chapter 3 discussed, the difference between good and bad practice in biomass sourcing can be a matter of several hundred million tonnes of CO
2 per year.
National Energy and Climate Plans (where Member Sta-tes set out their intended future biomass use for energy) also fail to adequately address the issue. Most plans give little or no indication of what the sources of supply would be; if they do, there is little discussion of the impacts on biodiversity that could result, or how mobilising the supplies would affect carbon sinks.141
Addressing this will be complex and no doubt contro-versial. Even seemingly simple categories can encompass enormous variation in environmental impact. For example, ‘wood fuel used for bioenergy’ carries very different biodi-versity and CO
2 footprints if it is, say, roundwood harvested
directly for energy use, or wood necessarily harvested after natural disturbances, or by-products from forest industry ac-tivity, increased outtake from neglected coppice forests, etc. Broad-brush interventions thus risk not accounting for local circumstances.
Policy-makers cannot shy away from this issue. The cur-rent situation is highly unstable, as market actors see no difference between options that in fact have widely different impacts on a broad range of societal priorities. Large in-vestment decisions on everything from biofuels, to bioche-micals production, are on shaky ground until this issue is addressed.
AVOID A COSTLY ‘DOUBLE TRANSITION’ AND STRANDED ASSETS
The focus of this report has been on 2050. That is the tar-get date for the EU’s – and the Paris Agreement’s – long-term vision, but for long-lived industrial and energy assets, mid-cen-tury is now just one investment cycle away. Given the major shift in economics that is taking place, decision-makers must set a careful path from legacy expectations to forward-looking investments.
For policy-makers, the obvious risk is that legacy policies are perpetuated even where they are based on an outdated view of technology and supply potentials. There is a risk of a ‘double transition’, first to bioenergy – based on policy groun-ded in technology expectations more than 10 years old – and then rapidly away from it. At worst, a double transition implies double costs and double investments. Or it can create iner-tia and lock-in that delay or complicate the eventual transition to net-zero emissions. Given the short timelines to 2050, a guiding rule should be that policies should only encourage biomass uses that have a credible long-term role, especially where major investments are required.
For companies, the corresponding dilemma is to avoid fu-ture stranded assets. The companies consulted for this study had different perspectives. Many saw the same developments as outlined in Chapter 2, that biomass is less cost-effective in the longer run than had been assumed even recently. The-se companies are therefore updating their CO
2 and feedstock
strategies to adopt other options. However, other companies still saw biomass as a tempting way to respond to near-term pressures to reduce emissions – not least where policy pro-vides financial support for doing so. A major insight from this study therefore is that companies need to take care in strategic decisions in this space. They need to look beyond their own sector, and consider the overall claims on the biomass resour-ces that would underpin their own future use.
3. CREATE POLICIES 3.

8686 87
3. CREATE POLICIES TO SUPPORT HIGH-VALUE USES OF BIOMASS

86 8787
RECONSIDER VOLUME TARGETS AND POLICIES THAT STEER TOWARDS LOW-VALUE USES OF BIOMASS
EU policy already steers biomass use heavily. Beyond general instruments (such as the “zero carbon” rating of bio-mass combustion and the CO
2 price in the EU ETS), there
are more than 60 policy measures in place in EU countries directly to encourage the use of bioenergy, dispensing an-nual subsidies of more than 14 billion Euro.142 As noted in Chapter 1, this policy push has led to a doubling of biomass for energy since 2000.
The overall framework for these policies has been simple: to achieve a higher total volume of biomass use in energy. The metric for success is increased use, energy unit for energy unit. This follows the logic of the Renewable Energy Directive, setting an overall target for renewable en-ergy use where one unit of biomass contributes as much as another. EU Member States report directly on their progress in their National Energy and Climate Plans. The result has been a major push of biomass first into high-volume energy production for heat and power, and then (following specific targets) into transport fuels. This is still ongoing in the latest set of such plans.
A major insight from this report, however, is that this is nowhere near an optimal use of biomass. As Chapter 2 showed, the value of biomass in a net-zero economy is not how much it contributes to bulk energy production, whe-re it typically is far from the cheapest solution. Instead, its value is greatest in specific niches that make the best use of its unique properties: the non-fossil carbon content, the possibility to use hybrid systems to create flexibility in a high-renewables energy system, its capacity to offer highly specialised liquid fuels, etc.
None of these are captured by policy frameworks that count all energy uses as if they were the same. A revision of the policy framework therefore seems critical to achieve the high-value outcome that is described in Chapter 3.
A major conclusion of this study is current policy structu-res are ill suited to achieving the highest-value uses of bio-mass. Biomass is a scarce and valuable resource that must not be wasted or misdirected, and different applications compete for the same feedstock. Policy therefore needs to be carefully crafted to align incentives for the use of bio-mass where it creates the most value.
ENSURE BALANCED INCENTIVES FOR MATERIALS AND ENERGY USES OF BIOMASS
Support for bioenergy without equivalent support for bio-materials already distorts the use of biomass. Policy-makers need to level the playing field to enable crucial contributions of bio-based materials in a transition away from fossil fuels and feedstock.
Bio-based materials are likely to make a vital contribution to the transition to net-zero CO
2 emissions. As shown in Chap-
ter 2, they typically are the highest-value use cases for bio-mass. However, in contrast to policies and financial support to promote bioenergy use, there is no or little equivalent conside-ration of bio-based materials in the EU policy framework or in scenarios for future biomass use.
This is part of a more general disconnect: ‘climate policy’ is often more or less equated with ‘energy policy’. Yet how materials are produced and used is key to meeting EU climate targets, and the preconditions for low-CO
2 materials differ from
those of low-CO2 energy. The case of hydrogen illustrates the
same logic: Hydrogen can be both an energy carrier, used as fuel, and a feedstock used in the production of chemicals, ste-el, fuels and more. If it is seen mostly as an energy carrier, with policies only supporting energy uses, many important feed-stock and materials applications may be missed. The same is true for biomass.
The lack of policies explicitly promoting high-value bio-mass uses is somewhat understandable. If policy were to di-rectly intervene to favour one material over another (as has been done for energy), it would carry big risks of distorting markets. Yet the current situation also is not a level playing field. When the same biomass resource can be used either for materials or for energy uses, but policy supports only energy uses, biomaterials production instead risks being directly dis-advantaged. This is all the more so when the ‘sink’ of carbon represented by long-lived materials made from biomass is not accounted for.
A correction of some sort is needed. If not, biomass resources – which, as Chapter 1 showed, are scarcer than typically appreciated – risk being misallocated, creating large costs and missed opportunities. All in all, there is a strong case to integrate materials into policy frameworks that affect materials use.
8888 89
4. PUT IN PLACE THE ENABLERS FOR A HIGH-VALUE BIOMASS FUTURE

88 8989
4. PUT IN PLACE THE ENABLERS FOR A HIGH-VALUE BIOMASS FUTURE
SUPPORT AN ACCELERATED INNOVATION AGENDA
For biomass energy, the most urgent need is to deve-lop the conversion routes that enable the use of feedstock with low environmental impact in the sectors with the hig-hest value. The 2018 Renewable Energy Directive provides some impetus for this, by requiring the use of some ad-vanced biofuels, but much more could be done. Especially important is the use of ligno-cellulosic biomass (e.g., from waste streams or from woody energy crops) for sustainable aviation fuel. Gasification and other routes required for this are not yet deployed at scale.
Similarly, a range of biomaterials could bring significant benefits if developed further. EU biorefineries and pulp and paper producers are exploring a wide range of potential products, from polymers to novel fibres, lubricants, solvents, surfactants and other categories. Given the complexity and dominance of fossil-based chemicals, finding attractive pathways for bio-based alternatives is a key innovation pri-ority.
The innovation agenda is equally pressing for several of potential alternatives to biomass. Beyond green hydrogen, which is crucial to many alternatives to biomass, key areas include the use of ammonia for shipping; energy storage and other flexibility solutions for power systems with high shares of variable renewable electricity; carbon capture technology and electrochemistry for the production of synt-hetic fuels; and conversion routes for waste-to-materials. Mission-based innovation approaches could work very well in several of these areas.
Finally, there is a need for a comprehensive set of carbon management technologies that can add value to EU bio-mass use. Some of these are nature-based solutions, where innovation is required to create the business models and in-stitutional arrangements that enable financing and safeguar-ding of long-term carbon sink benefits. Carbon storage and utilisation is another key agenda, as there is still very limited experience of bioenergy with CCS, despite its prominence in all climate scenarios.
ENABLE THE DEPLOYMENT OF LOW-CARBON ELECTRIFICATION
Making the most of biomass means using it where it is most valuable. This requires that other solutions are enabled where they are more attractive. The EU therefore needs to pro-mote large-scale deployment of low-carbon electricity, build-out of infrastructure, and international supply chains for key liquid fuels and basic chemicals.
As noted in Chapter 3, alternatives to biomass have in common that they often require low-carbon electricity: either directly, to replace biomass energy, or indirectly, by enabling the production of feedstock for alternative energy carriers or chemicals (hydrogen, ammonia, synthetic fuels, methanol).
Building out low-carbon electricity at scale is therefore key. The environmental claims of electrification are often lower, starting with the lower land footprint. However, ensuring that the incremental supply of electricity is carbon-free is critical for this to hold. Much like biomass use can be far from CO
2-neutral
if biogenic CO2 emissions are created, the climate benefits of
further electrification can be negated if the incremental electri-city supply is not zero-carbon (or if additional claims delay the switch to low-carbon power in other parts of the economy).
Many of the solutions also depend on infrastructure: for the electrification of heat, charging of vehicles, power trans-mission and distribution, electrification of large point loads in industry, distribution of hydrogen, and more. While many of the solutions can be intrinsically lower-cost than biomass, they will only become reality if the infrastructure is in place to enable their deployment.
In addition, the EU can actively develop international supply chains for some of the synthetic fuels and chemicals involved. Especially where low-cost hydrogen is a cost driver, and where international transportation is feasible (e.g. ammonia, metha-nol), the EU will likely be better of trading with regions that have plentiful and cheap renewable energy resources.
Overall, the need to optimise biomass use thus adds to the broad agenda of an electricity-driven transition to net-zero emissions.

90
ENDNOTES1 The lower range of the gap (5 EJ) is based on the difference between the higher span of the available supply (13 EJ) and the lower span of the potential demand (18 EJ), while the higher range of the gap (8 EJ) is oppositely based on the lower span of the available supply (11 EJ) and the higher span of the potential demand (19 EJ). Current agricultural biomass production in the EU is approximately 13 EJ (see Exhibit 2), which means that 8 EJ correspond to 62% of this.
2 Eurostat, 2020, “Electricity and Heat Statistics,” Eurostat - Statistics Explained.
3 The wood equivalent of 55 million tonnes of wood is based on an energy density of 18 GJ/t biomass. The energy density of stemwood is generally a bit higher (19–20 GJ/t) while forestry residues have a lower energy density (about 16 GJ/t) based on multiple sources and expert interviews (Nurek, Gen-dek, and Roman, 2018, “Forest Residues as a Renewable Source of Energy: Elemental Composition and Physical Properties,” BioResources; McKendry, 2002, “McKendry, P.: Energy Production from Biomass (Part 1): Overview of Biomass. Bioresour. Technol. 83, 37-46,” Bioresource Technology; Forest Research, n.d., “Typical Calorific Values of Fuels,” Forest Research.). The land area required depends on crop grown, but based on data from the EU long-term strategy, 0.16–0.19 EJ of biomass can be produced per million hectares of land and year, calculated based on the report’s scenarios on land use and corresponding output from energy crops (European Commission, 2018, “A Clean Planet for All - A European Strategic Long-Term Vision for a Prosperous, Modern, Competitive and Climate Neutral Economy.”) . This roughly means 5–7 million hectares would be needed to grow 1 EJ of energy crops. The agricultural land of Germany is 16.6 million hectares according to the World Bank, which means that 1 EJ correspond to approximately one third of this area (World Bank, n.d., “Agricultural Land (Sq. Km) - Germany | Data,” The World Bank.
4 Joint Research Centre (European Commission), 2019, “Brief on Biomass for Energy in the European Union.”)
5 The bioenergy demand is based on Eurostat data while biomass demand for materials as well as food and feed is based on JRC data. (Eurostat, 2021, “EU Energy Balance Sheets April 2021 Edition”; Camia et al., 2018, “Biomass Production, Supply, Uses and Flows in the European Union: First Results from an Integrated Assessment,” Publications Office of the European Union; 2021, The Use of Woody Biomass for Energy Production in the EU.)
6 Food and Agriculture Organization of the United Nations (FAO), 2021, “Forestry Production and Trade”; Ericsson and Nilsson, 2018, “Climate Inno-vations in the Paper Industry: Prospects for Decarbonisation,” Miljö- Och Energisystem, LTH, Lunds Universitet.
7 Bentsen and Felby, 2012, “Biomass for Energy in the European Union - a Review of Bioenergy Resource Assessments,” Biotechnology for Biofuels.
8 Smith, Kralli, and Lemoine, 2021, “Analysis on Biomass in National Energy and Climate Plans.”
9 Eurostat, 2021, “EU Energy Balance Sheets April 2021 Edition.”
10 European Commission, 2018, “A Clean Planet for All - A European Strategic Long-Term Vision for a Prosperous, Modern, Competitive and Climate Neutral Economy”; International Energy Agency, 2017, “Energy Technology Perspectives 2017”; International Renewable Energy Agency and European Commission, 2018, Renewable Energy Prospects for the European Union; European Climate Foundation, 2010, “Roadmap 2050 - a Practical Guide to a Prosperous, Low-Carbon Europe”; CEFIC, 2013, “European Chemistry for Growth: Unlocking a Competitive, Low Carbon and Energy Efficient Future”; Camia et al., 2018, “Biomass Production, Supply, Uses and Flows in the European Union: First Results from an Integrated Assessment,” Publi-cations Office of the European Union; 2021, The Use of Woody Biomass for Energy Production in the EU.; Ricardo, 2018, “Impact Analysis of Mass EV Adoption and Low Carbon Intensity Fuels Scenarios”; Terlouw et al., 2019, “Gas for Climate. The Optimal Role for Gas in a Net Zero Emissions Energy System”; Committee on Climate Change (CCC), 2018, “Biomass in a Low-Carbon Economy.”
11 Ricardo, 2018, “Impact Analysis of Mass EV Adoption and Low Carbon Intensity Fuels Scenarios.”, with final energy demand converted to primary energy.
12 Terlouw et al., 2019, “Gas for Climate. The Optimal Role for Gas in a Net Zero Emissions Energy System.”
13 European Climate Foundation, 2010, “Roadmap 2050 - a Practical Guide to a Prosperous, Low-Carbon Europe.”
14 Material Economics, 2019, “Industrial Transformation 2050 - Pathways to Net-Zero Emissions from EU Heavy Industry.”
15 The three scenarios in the report “Low carbon energy and feedstock for the European chemical industry” by Dechema use 200–250 million tonnes of biomass per year for chemical production in 2050. This corresponds to 3.5–4.8 EJ assuming a conversion factor of 17–19 GJ per tonne biomass (Bazzanel-la and Ausfelder, 2017, “Low Carbon Energy and Feedstock for the European Chemical Industry.”)
16 Data for the chemical sector is based on CEFIC, Material Economics, and Dechema. Potential biomass demand for pulp and paper as well as solid wood products have been calculated based on data from Forsell, Hänninen, and EU Commission. Forsell and Hänninen both have data on end-use produc-tion/output of materials (e.g., sawnwood). This has been used to calculate how much wood (biomass) is needed based on current input-output ratios of wood-processing industries (JRC data). The other categories are based on Material Economics analysis. (CEFIC, 2013, “European Chemistry for Growth: Unlocking a Competitive, Low Carbon and Energy Efficient Future”; Bazzanella and Ausfelder, 2017, “Low Carbon Energy and Feedstock for the Eu-ropean Chemical Industry”; Material Economics, 2019, “Industrial Transformation 2050 - Pathways to Net-Zero Emissions from EU Heavy Industry”; European Commission, 2016, “Study on Impacts on Resource Efficiency of Future EU Demand for Bioenergy”; Hänninen et al., 2014, “European Forest Industry and Forest Bioenergy Outlook up to 2050: A Synthesis”; Forsell, N. et al, 2015, Study on Impacts on Resource Efficiency of Future EU Demand for Bioenergy (ReceBio). Final Report.; Camia et al., 2018, “Biomass Production, Supply, Uses and Flows in the European Union: First Results from an Integrated Assessment,” Publications Office of the European Union.)
17 Net-trade of forestry biomass is 0.14 EJ per year while net-trade for agricultural biomass is 0.45 EJ, out of which 0.04 EJ is for materials and energy use based on data from JRC converted to energy-units. Trade of agricultural biomass is based on dry matter of vegetal biomass equivalents, which means that animal-based foods are converted into their feed equivalent. The annual imports of agricultural biomass are 121 Mt per year of vegetal equivalents (2.4 EJ) while annual exports are 98 Mt of vegetal equivalents per year (1.9 EJ). About 10% of the imports are for bio-based materials, and the same value has been assumed for exports. (Camia et al., 2018, “Biomass Production, Supply, Uses and Flows in the European Union: First Results from an Integrated Assessment,” Publications Office of the European Union.)
18 Camia et al., 2018, “Biomass Production, Supply, Uses and Flows in the European Union: First Results from an Integrated Assessment,” Publications Office of the European Union; 2021, The Use of Woody Biomass for Energy Production in the EU.; European Commission, 2017, “Sustainable and

90 91
Optimal Use of Biomass for Energy in the EU beyond 2020”; Joint Research Centre (European Commission), 2019, “Brief on Biomass for Energy in the European Union”; Elbersen et al., 2012, “Atlas of EU Biomass Potentials”; Searles and Malins, 2013, “Availability of Cellulosic Residues and Wastes in the EU”; Dees et al., 2017, “D1.6 A Spatial Data Base on Sustainable Biomass Cost Supply of Lignocellulosic Biomass in Europe - Methods & Data Sources”; The European Commission’s science and knowledge service, 2019, “Food, Feed, Fibres, Fuels. Enough Biomass for a Sustainable Bioeconomy?,” EU Science Hub - European Commission.
19 Primary wood is made up of stemwood removals (3.8 EJ per year, with 0.1 EJ coming from wood outside of forests), used mostly for the manufacturing of solid wood products and pulp and paper, and residues such as branches and tops (0.6 EJ per year). For more information, see Exhibit 7. (Camia et al., 2018, “Biomass Production, Supply, Uses and Flows in the European Union: First Results from an Integrated Assessment,” Publications Office of the European Union; 2021, The Use of Woody Biomass for Energy Production in the EU..)
20 Camia et al., 2018, “Biomass Production, Supply, Uses and Flows in the European Union: First Results from an Integrated Assessment,” Publications Office of the European Union.
21 Official statistics of harvest rates generally exclude unaccounted, or ‘missing’, sources of woody biomass. However, actual fellings are up to 20% higher if including these ‘missing’ sources of biomass used for materials and energy, which in turn means a higher forest management intensity (Forest Europe, 2020, “State of Europe’s Forests 2020”; European Environment Agency, 2012, “Forest Growth — European Environment Agency.”)
22 The data for annual changes of EU forests is based on latest available data from the JRC. The net annual increment (NAI) is based on the gross annual increment of 9.6 EJ (1,099 Mm3, 505 Mt) minus natural mortality of forests of 1.2 EJ (134 Mm3, 61 Mt). Reported fellings are 4.3 EJ (486 Mm3, 224 Mt) and unreported/unaccounted removals are 1.0 EJ (118 Mm3, 54 Mt) based on EU Wood Resource Balances (the ‘missing’ sources of woody biomass from Wood Resource Balances are assumed to be mainly unreported fellings). This means that the total net growth of forests is 2.1 EJ (237 Mm3, 109 Mt). All data is average values for the period 2004–2013 except the unreported/unaccounted removals which is for 2015. (Camia et al., 2018, “Biomass Production, Supply, Uses and Flows in the European Union: First Results from an Integrated Assessment,” Publications Office of the European Union; 2021, The Use of Woody Biomass for Energy Production in the EU.)
23 Total agricultural residues production in the EU is 442 million tonnes per year (7.1 EJ) based on data from JRC and a conversion factor of 16 GJ/t agricultural residues. According to JRC, 23% of this is harvested, corresponding to 1.6 EJ per year. Annual use of agricultural residues is about 0.7 EJ for bioenergy (based on data from European Commission) and 1.0 EJ for food and feed use. (Camia et al., 2018, “Biomass Production, Supply, Uses and Flows in the European Union: First Results from an Integrated Assessment,” Publications Office of the European Union; European Commission, 2018, “A Clean Planet for All - A European Strategic Long-Term Vision for a Prosperous, Modern, Competitive and Climate Neutral Economy”; Joint Research Centre (European Commission), 2019, “Brief on Biomass for Energy in the European Union.”)
24 According to Biomass Futures, it is estimated that around 5.5 million hectares (Mha) of agricultural land is used for bioenergy cropping in the EU-27 (corresponding to 3.2% of total cropping area). Other sources have values around this estimate. The EU Commission estimated that 4.4 Mha was used in the EU for biofuel production in 2012 while McKinsey estimated that 6 Mha were used in 2015. (Elbersen et al., 2012, “Atlas of EU Biomass Potentials”; European Commission, 2015, “Technical Assessment of the EU Biofuel Sustainability and Feasibility of 10% Renewable Energy Target in Transport”; McKinsey & Company, 2020, “Net-Zero Europe - Decarbonization Pathways and Socioeconomic Implications.”)
25 European Commission, 2018, “A Clean Planet for All - A European Strategic Long-Term Vision for a Prosperous, Modern, Competitive and Climate Neutral Economy.”
26 Camia et al., 2018, “Biomass Production, Supply, Uses and Flows in the European Union: First Results from an Integrated Assessment,” Publications Office of the European Union; Joint Research Centre (European Commission), 2019, “Brief on Biomass for Energy in the European Union.”
27 The data for waste is based on post-consumer wood (0.3 EJ, 17 Mt) from JRC, paper and carboard (0.6 EJ) from ICCT and ECF, as well as other waste for energy use (0.5 EJ) from European Commission. The current use of organic waste for energy use in the EU is based on 2012 data and includes “Animal and mixed food waste” (0.06 EJ), “Used animal fats & vegetable oils” (0.04 EJ), “Vegetal wastes” (0.06 EJ), “Household and similar wastes” (0.24 EJ), and “Common Sludges” (0.05 EJ). Waste data in literature often have different definitions of waste, and it is in many cases not clear what exactly is included or not, which make data hard to compare. Forestry and agricultural residues are for example sometimes included in waste, and some studies only include energy use while others include material use (e.g., recycled paper). (Camia et al., 2018, “Biomass Production, Supply, Uses and Flows in the European Union: First Results from an Integrated Assessment,” Publications Office of the European Union; Searles and Malins, 2013, “Availability of Cellulosic Residues and Wastes in the EU”; European Commission, 2017, “Sustainable and Optimal Use of Biomass for Energy in the EU beyond 2020.”)
28 Material Economics, 2018, “The Circular Economy - A Powerful Force for Climate Mitigation.”
29 Ericsson and Nilsson, 2018, “Climate Innovations in the Paper Industry: Prospects for Decarbonisation,” Miljö- Och Energisystem, LTH, Lunds Universitet.
30 Material Economics analysis based on data from ICCT and ECF. (Searles and Malins, 2013, “Availability of Cellulosic Residues and Wastes in the EU.”)
31 Based on incineration levels of paper and carboard waste (0.1 EJ) as well as post-consumer wood (0.2 EJ) from ECF/ICCT. In addition to this, an ad-ditional 0.5 EJ of organic waste (excl. wood and paper) is used for energy per year according to a report by the EU Commission (European Commission, 2017, “Sustainable and Optimal Use of Biomass for Energy in the EU beyond 2020”; Searles and Malins, 2013, “Availability of Cellulosic Residues and Wastes in the EU.”)
32 The discussion below builds on a large number of studies, many of which in turn collate and compare the estimates in the underlying literature. The key sources that form the basis for the discussion below include Dees et al., 2017, “D1.6 A Spatial Data Base on Sustainable Biomass Cost Supply of Lignocel-lulosic Biomass in Europe - Methods & Data Sources”; European Commission, 2018, “A Clean Planet for All - A European Strategic Long-Term Vision for a Prosperous, Modern, Competitive and Climate Neutral Economy”; Searles and Malins, 2013, “Availability of Cellulosic Residues and Wastes in the EU”; Camia et al., 2018, “Biomass Production, Supply, Uses and Flows in the European Union: First Results from an Integrated Assessment,” Publications Office of the European Union; Joint Research Centre (European Commission), 2019, “Brief on Biomass for Energy in the European Union”; European Commission, 2017, “Sustainable and Optimal Use of Biomass for Energy in the EU beyond 2020”; Elbersen et al., 2012, “Atlas of EU Biomass Poten-tials”; Ronzon and Piotrowski, 2017, “Are Primary Agricultural Residues Promising Feedstock for the European Bioeconomy?,” Industrial Biotechnology; Allen et al., 2014, “Space for Energy Crops – Assessing the Potential Contribution to Europe’s Energy Future.”
92
33 Another potential source sometimes mooted for future biomass production is aquatic biomass, and especially the farming of macroalgae (seaweed). This has points in its favour: It makes no direct claims on land resources, and there are potential environmental benefits, such as creating habitats for marine life, carbon sequestration, and absorption of excess nitrogen. Nonetheless, large-scale supply is seen as unlikely in most assessments, with the most optimistic reaching 0.8 EJ/year by 2050. For this to happen, economics would have to improve significantly, via both reductions in production costs and a significant capacity to extract high-value products. Likewise, it would be necessary to demonstrate that there are no adverse impacts on marine biodiversity. Given these uncertainties, we do not include it among the supply sources in the scenarios of this study.
34 For more information about current supply, see Exhibit 6. The available supply scenario is to a large extent based on data from S2Biom, the most recent major study on future EU biomass supply. Two scenarios by S2Biom have been analysed in detail, the Base Potential and the User Defined Potential 4 (UD04), the latter is more closely aligned with current targets for biodiversity based on EU policy. The S2Biom scenarios also have data for total potential supply (materials and energy), in comparison to most other sources that only look at the potential for bioenergy use. Other key sources include the EU long-term strategy, Biomass Futures, and the European Commission as well as studies that have analyzed more specific segments of biomass supply (e.g., energy crops). (European Commission, 2018, “A Clean Planet for All - A European Strategic Long-Term Vision for a Prosperous, Modern, Competitive and Climate Neutral Economy”; Searles and Malins, 2013, “Availability of Cellulosic Residues and Wastes in the EU”; Camia et al., 2018, “Biomass Production, Supply, Uses and Flows in the European Union: First Results from an Integrated Assessment,” Publications Office of the European Union; Joint Research Centre (European Commission), 2019, “Brief on Biomass for Energy in the European Union”; European Commission, 2017, “Sustainable and Optimal Use of Biomass for Energy in the EU beyond 2020”; Elbersen et al., 2012, “Atlas of EU Biomass Potentials”; Dees et al., 2017, “D1.6 A Spatial Data Base on Sustainable Biomass Cost Supply of Lignocellulosic Biomass in Europe - Methods & Data Sources”; Ronzon and Piotrowski, 2017, “Are Primary Agricultural Residues Promising Feedstock for the European Bioeconomy?,” Industrial Biotechnology; Allen et al., 2014, “Space for Energy Crops – Assessing the Potential Contribution to Europe’s Energy Future.”)
35 European Commission. Joint Research Centre., 2020, Mapping and Assessment of Ecosystems and Their Services: An EU Wide Ecosystem Assessment in Support of the EU Biodiversity Strategy.
36 European Commission. Joint Research Centre., 2020, Mapping and Assessment of Ecosystems and Their Services: An EU Wide Ecosystem Assessment in Support of the EU Biodiversity Strategy.
37 European Commission, 2020, “Farm to Fork Strategy: For a Fair, Healthy and Environmentally-Friendly Food System”; 2020, “EU Biodiversity Strat-egy for 2030 - Bringing Nature Back into Our Lives.”
38 European Commission, n.d., “Protecting Water in the CAP,” European Commission.
39 Air Quality Expert Group, 2018, “Air Pollution from Agriculture. Prepared for: Department for Environment, Food and Rural Affairs; Scottish Gov-ernment; Welsh Government; and Department of the Environment in Northern Ireland.”
40 European Environment Agency, 2019, “Nutrient Enrichment and Eutrophication in Europe’s Seas - Moving towards a Healthy Marine Environment”; Chislock, M. F. et al., 2013, “Eutrophication: Causes, Consequences, and Controls in Aquatic Ecosystems | Learn Science at Scitable,” Nature Education Knowledge.
41 European Commission, 2020, “Farm to Fork Strategy: For a Fair, Healthy and Environmentally-Friendly Food System.”
42 Specifically, several studies have total removals from forests in ‘low’ scenarios at levels considerably lower than today. For example, de Wit and Faaij provides a range down to 1.4 EJ, as against today’s more than 5 EJ. (de Wit and Faaij, 2010, “European Biomass Resource Potential and Costs,” Biomass and Bioenergy.)
43 Data based on the S2Biom’s Base Potential and User Defined Potential 4 (UD04). The UD04 case is more closely aligned with targets for biodiversity as now articulated in policy. The UD04 scenario sees an increase in protected forest by 5%, an increase in retained trees by 5%, as well as no stump extraction. The data is for 2030 but assumed to be similar for 2050. In the base case, the potential of production from forests is 293 Mt (5.6 EJ) and the potential of primary residues from forests is 39 Mt (0.6 EJ). In the UD04 case, the potential is 263 Mt (5.0 EJ) for forests and 30 Mt (0.5 EJ) for residues. The unit conversions used is 19 GJ/t of forests and 16 GJ/t of primary residues from forests. Current supply of biomass from forestry is around 4.9 EJ from forestry and 0.6 EJ from primary residues. Thus, the base case would see an additional supply of 0.7 EJ (mainly from primary production from forests) while the UD04 scenario would see an increase of 0.0 EJ (supply from forests would increase 0.1 EJ and supply from residues would decrease 0.1 EJ). It is important to note that the data is potential biomass supply based on technical and sustainability constraints, but not economic constraints. Thus, it would not be economical to harvest all this biomass even though it technically and sustainably could be produced. (Dees et al., 2017, “D1.6 A Spatial Data Base on Sustainable Biomass Cost Supply of Lignocellulosic Biomass in Europe - Methods & Data Sources.”)
44 If including food sector, one-third of all the biomass supply to the EU is imported. The largest import countries for biofuels are United States (Soybean & sugar cane feedstock, Ethanol, Wood pellets), Brazil (Sugar cane feedstock), Indonesia & Malaysia (Palm oil feedstock), Canada (Wood pellets), Argen-tina (Biodiesel). (European Commission. Joint Research Centre., 2020, Future Transitions for the Bioeconomy towards Sustainable Development and a Climate-Neutral Economy: Knowledge Synthesis : Final Report.)
45 Energy Transitions Commission, 2021, “Bioresources within a Net-Zero Emissions Economy: Making a Sustainable Approach Possible (Forthcoming).”
46 FAO and UNEP, 2020, The State of the World’s Forests 2020; Curtis et al., 2018, “Classifying Drivers of Global Forest Loss,” Science.
47 Watson et al., 2019, “Summary for Policymakers of the Global Assessment Report on Biodiversity and Ecosystem Services of the Intergovernmental Science-Policy Platform on Biodiversity and Ecosystem Services.”
48 (Matthews et al. 2015)
49 Rowe et al., 2011, “Counting the Cost of Carbon in Bioenergy Systems: Sources of Variation and Hidden Pitfalls When Comparing Life Cycle Assess-ments,” Biofuels; DG Energy, 2010, “The Impact of Land Use Change on Greenhouse Gas Emissions from Biofuels and Bioliquids”; Laborde Debucquet, 2011, “Assessing the Land Use Change Consequences of European Biofuel Policies.”
50 Ahlgren and Di Lucia, 2014, “Indirect Land Use Changes of Biofuel Production – a Review of Modelling Efforts and Policy Developments in the European Union,” Biotechnology for Biofuels.

92 93
51 McKinsey & Company, 2020, “Net-Zero Europe - Decarbonization Pathways and Socioeconomic Implications.”
52 European Commission. Joint Research Centre., 2020, Analysis of Climate Change Impacts on EU Agriculture by 2050: JRC PESETA IV Project : Task 3.
53 Searle et al., 2016, “Crops of the Biofrontier: In Search of Opportunities for Sustainable Energy Cropping.”
54 Dees et al., 2017, “D1.6 A Spatial Data Base on Sustainable Biomass Cost Supply of Lignocellulosic Biomass in Europe - Methods & Data Sources.”
55 Allen et al., 2014, “Space for Energy Crops – Assessing the Potential Contribution to Europe’s Energy Future.”
56 European Commission, 2017, “Sustainable and Optimal Use of Biomass for Energy in the EU beyond 2020”; de Wit and Faaij, 2010, “European Biomass Resource Potential and Costs,” Biomass and Bioenergy; Bentsen and Felby, 2012, “Biomass for Energy in the European Union - a Review of Bioenergy Resource Assessments,” Biotechnology for Biofuels.
57 Current land use for agriculture is 161 million hectares (Mha) in the EU (McKinsey & Company, 2020, “Net-Zero Europe - Decarbonization Pathways and Socioeconomic Implications.”), which means that 30 Mha correspond to around 20% of this area.
58 In 2019, 71% of the gross available energy in the EU-27 was made up by fossil fuels. (Eurostat, 2021, “Share of Fossil Fuels in Gross Available Energy,” Eurostat - Your Key to European Statistics.)
59 Material Economics and Energy Transitions Commission (ETC) analysis based on data from multiple sources. Current energy use for international shipping departing from the EU is 1.9 EJ per year while energy use for international aviation departing from the EU is 2.2 EJ based on Eurostat Energy Balances Eurostat, 2021 (“EU Energy Balance Sheets April 2021 Edition.”). Assuming an efficiency of 60% for shipping and 46% for aviation to convert biomass to biofuels, this would mean that 8 EJ would be needed in total. For more information on aviation and shipping, see Technical Annex.
60 The biomass potential is based on higher estimates from reliable sources, or the biomass needed if converting future energy demand per sector in climate scenarios entirely to bioenergy use (e.g., the amount of bioenergy needed if all power was produced with biomass). Exhibit 10 shows how much biomass would be required for a sector if it only use bioenergy, not necessarily the amount of biomass anyone believe that the sector will use. In Exhibit 11, the width of the boxes show the potential biomass demand based on estimations by existing scenarios and sources, and thus show how much biomass people believe will be used in different sectors. (International Energy Agency, 2017, “Energy Technology Perspectives 2017”; Eurostat, 2021, “EU Energy Balance Sheets April 2021 Edition”; Bazzanella and Ausfelder, 2017, “Low Carbon Energy and Feedstock for the European Chemical Industry”; World Economic Forum and McKinsey & Company, 2020, “Clean Skies for Tomorrow: Sustainable Aviation Fuels as a Pathway to Net-Zero Aviation”; Energy Transition Commission, 2020, “Making Mission Possible: Delivering a Net-Zero Economy”; Mantzos et al., 2018, “The JRC Integrated Database of the European Energy System,” European Commission.)
61 The appearance of negative prices in the value curve may seem puzzling, but it has a straightforward implication: In some cases, the cost gap between a biomass-based option and the alternative solution is so large that the non-biomass option remains more cost effective when compared just to the capital cost and non-fuel operating expenditure of the biomass option.
62 Based on the marginal cost of energy crops from S2Biom and other sources. (S2Biom, n.d., “S2Biom - Tools for Biomass Chains (Cost / Supply Curves),” S2Biom; Robert Matthews, Hogan, and Mackie, 2018, “Carbon Impacts of Biomass Consumed in the EU: Supplementary Analysis and Interpretation for the European Climate Foundation”; International Renewable Energy Agency and European Commission, 2018, Renewable Energy Prospects for the European Union.)
63 Material Economics, 2020, “Mainstreaming Green Hydrogen in Europe”; World Economic Forum and McKinsey & Company, 2020, “Clean Skies for Tomorrow: Sustainable Aviation Fuels as a Pathway to Net-Zero Aviation.”
64 Material Economics analysis based on multiple sources. The prices of timber and pulp and paper vary per region and is affected by factors such as harvest cost, processing cost and taxes. (International Renewable Energy Agency and European Commission, 2018, Renewable Energy Prospects for the Euro-pean Union; Dees et al., 2017, “D1.6 A Spatial Data Base on Sustainable Biomass Cost Supply of Lignocellulosic Biomass in Europe - Methods & Data Sources”; Robert Matthews, Hogan, and Mackie, 2018, “Carbon Impacts of Biomass Consumed in the EU: Supplementary Analysis and Interpretation for the European Climate Foundation”; Thek and Obernberger, 2012, The Pellet Handbook; Skogsstyrelsen and Biometria, 2021, “Rundvirkespriser.”)
65 Camia et al., 2021, The Use of Woody Biomass for Energy Production in the EU.
66 Leskinen et al., 2018, “Substitution Effects of Wood-Based Products in Climate Change Mitigation.”
67 Material Economics, 2019, “Industrial Transformation 2050 - Pathways to Net-Zero Emissions from EU Heavy Industry.”
68 Pew Charitable Trusts and SYSTEMIQ, 2020, “Breaking the Plastics Wave.”
69 The annual production of plastics globally is 393 million tonnes per year. Since plastics contain carbon corresponding to 2.7 tonnes of CO2 per tonne of material, this would correspond to 1.061 billion tonnes of CO2-equivalents per year. Source: Material Economics analysis based on ETC and Material Economics (Energy Transition Commission, 2019, “Mission Possible Sectoral Focus: Plastics”; Material Economics, 2019, “Industrial Transformation 2050 - Pathways to Net-Zero Emissions from EU Heavy Industry.”.)
70 Material Economics, 2019, “Industrial Transformation 2050 - Pathways to Net-Zero Emissions from EU Heavy Industry.”.
71 Use of fossil carbon as feedstock in petrochemicals leads directly to release of fossil CO2 unless carbon capture and storage (CCS) is used on all relevant sources. The requirements for zero emissions are then very exacting, requiring three separate CCS facilities at different points in the value chain: on the petrochemicals complex containing the cracker, on the upstream refinery producing the naphtha or other feedstock, and on the waste incineration facility that handles the end-of-life plastics. While possible in principle, the economics and feasibility of this approach have major question marks.
72 Material Economics analysis based on the report Material Economics, 2019, “Industrial Transformation 2050 - Pathways to Net-Zero Emissions from EU Heavy Industry.”

94
73 For example, Roadmap 2050 (European Climate Foundation, 2010, “Roadmap 2050 - a Practical Guide to a Prosperous, Low-Carbon Europe,” 2050.) (published a decade ago) foresaw a climate scenario with 5000 TWh (18 EJ) of biomass used for energy, of which 40% used in road transport and 40% in power generation (and thus just 20% for all other uses). The scenarios in the European Commission’s Energy Roadmap 2050 likewise foresaw that 40–55% of bioenergy use would be in the power sector. European Commission, 2011, “Energy Roadmap 2050 - Impact Assessment and Scenario Analysis.”.
74 Smith, Kralli, and Lemoine, 2021, “Analysis on Biomass in National Energy and Climate Plans.”
75 For example, the McKinsey cost curve 2.1 and IEA WEO 2011 both have negligible roles for electric vehicles to 2030. An exception is the 2012 EU Energy Roadmap 2050, which had 80% electric or hybrid electric vehicles by 2050 – lower than today, but still a strong early statement of their potential role (McKinsey & Company, 2010, “Impact of the Financial Crisis on Carbon Economics: Version 2.1 of the Global Greenhouse Gas Abatement Cost Curve”; International Energy Agency, 2011, World Energy Outlook 2011; European Commission, 2011, “Energy Roadmap 2050 - Impact Assessment and Scenario Analysis.”)
76 The 2011 EU Energy Roadmap saw biofuels powering 40% of trucking (European Commission, 2011, “Energy Roadmap 2050 - Impact Assessment and Scenario Analysis.”). This view carried over for many years. For example, biofuels are the most significant factor in global emissions reductions from trucks in the 2017 IEA report on The Future of Trucks.(International Energy Agency, 2017, “The Future of Trucks - Implications for Energy and the Environment.”)
77 Material Economics, 2018, “The Circular Economy - A Powerful Force for Climate Mitigation.”
78 Hydrogen Council and McKinsey & Company, 2020, “Path to Hydrogen Competitiveness; A Cost Perspective.”
79 European Commission, 2018, “A Clean Planet for All - A European Strategic Long-Term Vision for a Prosperous, Modern, Competitive and Climate Neutral Economy”; International Energy Agency, 2020, “World Energy Outlook 2020.”
80 Eurelectric, 2018, “Decarbonisation Pathway - Full Study Results.”
81 Committee on Climate Change (CCC), 2018, “Biomass in a Low-Carbon Economy.”
82 See for example EU Heatmap 4 for scenarios and analysis of this.
83 For example, WEO 2017 saw a 13% reduction in EU electricity use in industry between 2016 and 2040. A range of recent assessments have pointed instead to a major increase (Material Economics, 2019, “Industrial Transformation 2050 - Pathways to Net-Zero Emissions from EU Heavy Industry”; European Commission, 2018, “A Clean Planet for All - A European Strategic Long-Term Vision for a Prosperous, Modern, Competitive and Climate Neutral Economy”; Lechtenböhmer et al., 2016, “Decarbonising the Energy Intensive Basic Materials Industry through Electrification – Implications for Future EU Electricity Demand,” Energy.)
84 Material Economics analysis for Exhibit 11.
85 Airbus, 2021, “ZEROe - Towards the World’s First Zero-Emission Commercial Aircraft,” Airbus; ZeroAvia, 2021, “Our Vision: Renewably–Powered Hydrogen–Electric Aviation,” ZeroAvia - The First Practical True Zero Emission Aviation Powertrain; Hepher and Frost, 2021, “Airbus Tells EU Hydrogen Won’t Be Widely Used in Planes before 2050 - By Reuters,” Investing.Com UK.
86 IMO, 2020, “Fourth IMO GHG Study”; World Economic Forum and McKinsey & Company, 2020, “Clean Skies for Tomorrow: Sustainable Aviation Fuels as a Pathway to Net-Zero Aviation.”
87 Material Economics and Energy Transitions Commission (ETC) analysis based on data from multiple sources. Current energy use for international shipping departing from the EU is 1.9 EJ per year while energy use for international aviation departing from the EU is 2.2 EJ based on Eurostat Energy Balances (Eurostat, 2021, “EU Energy Balance Sheets April 2021 Edition.”.) Assuming an efficiency of 60% for shipping and 46% for aviation to convert biomass to biofuels, this would mean that 8 EJ would be needed in total. For more information on aviation and shipping, see Technical Annex.
88 Energy Transition Commission, 2019, “Mission Possible Sectoral Focus: Shipping”; 2019, “Mission Possible Sectoral Focus: Aviation.”
89 Sheppard and Hodgson, 2021, “Cost of Polluting in EU Soars as Carbon Price Hits Record €50,” Financial Times, 50.
90 The lower value of the range (6.5 EUR/GJ biomass) is based on a CO2 price of 100 EUR/tCO2 and a hydrogen price of 2 EUR/t hydrogen while the higher value of the range (10.5 EUR/GJ biomass) is based on the same hydrogen price but a CO2 price of 200 EUR/t CO2. Material Economics analysis. For more details on costs, see Technical Annex.
91 Material Economics analysis assuming a capital cost of 500 EUR/kW electrolyser, a discount rate of 8%, a lifetime of 20 years, an electricity price of 20 EUR/MWh, a utilisation of 5,500 hours per year, and other operating and maintenance costs at 150–200 EUR per tonne hydrogen. According to an article from 2017, by the International Energy Agency (IEA), the cost of large-scale alkaline electrolysers already had a cost of 450 USD/kW (approxi-mately 380–400 EUR/kW). (Philibert, 2017, “Producing Ammonia and Fertilizers: New Opportunities from Renewables,” International Energy Agency.)
92 Material Economics, 2020, “Mainstreaming Green Hydrogen in Europe.”
93 Keith et al., 2018, “A Process for Capturing CO2 from the Atmosphere,” Joule.
94 IPCC et al., 2018, “Summary for Policymakers. In: Global Warming of 1.5°C. An IPCC Special Report,” in .
95 The transportation of carbon dioxide will need more infrastructure than what is needed today for the global oil industry, based on amount of transport-ed. (bp, 2020, “Bp Statistical Review of World Energy 2020.”)
96 European Commission, 2018, “A Clean Planet for All - A European Strategic Long-Term Vision for a Prosperous, Modern, Competitive and Climate Neutral Economy.”
97 Minx et al., 2018, “Negative Emissions—Part 1: Research Landscape and Synthesis,” Environmental Research Letters; Anderson and Peters, 2016, “The Trouble with Negative Emissions,” Science.

94 95
98 Nature-based solutions (NBS) are activities that rely on nature to reduce the accumulation of GHGs in the atmosphere and provide benefits for ad-aptation, biodiversity, and human well-being. Within this category, there is a subset referred to as “natural climate solutions”, defined as “conservation, restoration, and/or improved land management actions to increase carbon storage and/or avoid greenhouse gas emissions across global forests, wetlands, grasslands, and agricultural lands” (Griscom et al., 2017, “Natural Climate Solutions,” Proceedings of the National Academy of Sciences.)
99 Realmonte et al., 2019, “An Inter-Model Assessment of the Role of Direct Air Capture in Deep Mitigation Pathways,” Nature Communications; Fuss et al., 2018, “Negative Emissions—Part 2: Costs, Potentials and Side Effects,” Environmental Research Letters.
100 Fuss et al., 2018, “Negative Emissions—Part 2: Costs, Potentials and Side Effects,” Environmental Research Letters; Kansy, 2020, “An Investor Guide to Negative Emission Technologies and the Importance of Land Use.”
101 Fuss et al., 2018, “Negative Emissions—Part 2: Costs, Potentials and Side Effects,” Environmental Research Letters; Kansy, 2020, “An Investor Guide to Negative Emission Technologies and the Importance of Land Use.”
102 National Academies of Sciences, 2018, Negative Emissions Technologies and Reliable Sequestration: A Research Agenda.
103 Fajardy and Dowell, 2017, “Can BECCS Deliver Sustainable and Resource Efficient Negative Emissions?,” Energy & Environmental Science.
104 Ueckerdt et al., 2021, “Potential and Risks of Hydrogen-Based e-Fuels in Climate Change Mitigation,” Nature Climate Change; Fasihi, Efimova, and Breyer, 2019, “Techno-Economic Assessment of CO2 Direct Air Capture Plants,” Journal of Cleaner Production.
105 Realmonte et al., 2019, “An Inter-Model Assessment of the Role of Direct Air Capture in Deep Mitigation Pathways,” Nature Communications.
106 Fasihi, Efimova, and Breyer, 2019, “Techno-Economic Assessment of CO2 Direct Air Capture Plants,” Journal of Cleaner Production; Smith, Kralli, and Lemoine, 2021, “Analysis on Biomass in National Energy and Climate Plans.”
107 Ericsson and Nilsson, 2018, “Climate Innovations in the Paper Industry: Prospects for Decarbonisation,” Miljö- Och Energisystem, LTH, Lunds Universitet.
108 Johnsson, Normann, and Svensson, 2020, “Marginal Abatement Cost Curve of Industrial CO2 Capture and Storage – A Swedish Case Study,” Fron-tiers in Energy Research.
109 Material Economics analysis based on evaluation of carbon capture and storage in a number of European cities.
110 Fajardy et al., 2018, “BECCS Deployment: A Reality Check.”
111 Johnston and Radeloff, 2019, “Global Mitigation Potential of Carbon Stored in Harvested Wood Products,” Proceedings of the National Academy of Sciences.
112 Jonsson et al., 2021, “Boosting the EU Forest-Based Bioeconomy: Market, Climate, and Employment Impacts,” Technological Forecasting and Social Change.
113 In the analysis of the high-value scenario compared to the business as usual (BAU) scenario, 6.5 EJ has been assumed to be the gap in biomass use. This is the average of the 2050 demand-supply gap illustrated in Exhibit 1, which shows that the gap between demand in current climate scenarios and available supply is 5–8 EJ.
114 Material Economics analysis. The average abatement cost has been calculated by dividing the cost savings (36–49 bn EUR) with the reduction in emissions (423 MtCO2), which has been calculated based on an assumed emission factor of fossil fuels of 65 MtCO2/EJ (mix of gas and oil) multiplied by the gap of 6.5 EJ. Accounting for the additional biogenic emissions that higher biomass use entails, around 150 Mt, this would mean a net abatement of 273 Mt. Dividing the cost savings of 36–49 bn EUR with this results in the abatement cost of 132–180 EUR/tCO2.
115 Material Economics analysis based on multiple sources. The cost savings is based on detail analysis of the value-curve (Exhibit 11) and a conservative biomass price of 5 EUR/GJ. Assuming a biomass price of 7 EUR/GJ would instead result in a cost saving of 49 billion EUR per year in 2050. The land savings answer the question: How much land do we save if we do not grow 6.5 EJ of energy crops (the supply-demand gap). Assuming a productivity of 0.18 EJ/Mha, based on data from EU long-term strategy, this means a land saving of 37 Mha. The CO2 savings are based on detailed analysis comparing the business-as-usual case with the high-value case based on sources mentioned in the text.
116 Material Economics analysis. The land used savings of 35–40 million hectares of land is calculated by multiplying the additional 6.5 EJ of bioenergy used in the BAU scenario with the area needed to grow 1 EJ of bioenergy crops (0.16–0.19 EJ/Mha). The energy needed to grow 1 EJ of bioenergy crops is calculated based on data from the EU long-term strategy (European Commission, 2018, “A Clean Planet for All - A European Strategic Long-Term Vision for a Prosperous, Modern, Competitive and Climate Neutral Economy.”). The land-use for the high-value scenario (3–4 Mha) is calculated based on data from Exhibit 21 and land use for the BAU scenario. The around 40% of land footprint in the high-value scenario that could be outside of the EU is an estimate by Materials Economics.
117 Calculated by dividing the land use footprint of the non-biomass option (e.g., battery-electric vehicles) with the land use footprint of the biomass option (e.g., biofuels). For more information about land use for the specific sectors, see Technical Annex.
118 This is the inverse of Exhibit 22. For example, 0.2 MWh of electricity is needed to replace 1 MWh of biomass for industrial heating (Exhibit 22), which means that one unit of electricity replace 5 units of biomass.
119 See Exhibit 22 and Technical Annex for more details.
120 Material Economics analysis. The 1100 TWh of additional electricity required is calculated based on the additional energy use in the ‘business as usual’ scenario compared to the high-value scenario multiplied by the electricity requirement to replace one MWh of biomass (based on Exhibit 22). The 1.7 MWh of biomass that one MWh electricity replaces is an average of Exhibit 22, weighted based on the difference in energy use between ‘business as usual’ and the high-value scenario. For more details, see Technical Annex.
121 In 2018, the gross electricity production was 2941 TWh in the EU27. Eurostat, 2020, “Electricity and Heat Statistics,” Eurostat - Statistics Explained.

96
122 Calculated by dividing the efficiency of the biomass-option (e.g., biomass boiler) with the efficiency of the electric option (e.g., electric heat pump). For more information, see Technical Annex.
123 Scharlemann et al., 2014, “Global Soil Carbon: Understanding and Managing the Largest Terrestrial Carbon Pool,” Carbon Management.
124 Laborde Debucquet, 2011, “Assessing the Land Use Change Consequences of European Biofuel Policies”; DG Energy, 2010, “The Impact of Land Use Change on Greenhouse Gas Emissions from Biofuels and Bioliquids”; Rowe et al., 2011, “Counting the Cost of Carbon in Bioenergy Systems: Sources of Variation and Hidden Pitfalls When Comparing Life Cycle Assessments,” Biofuels.
125 DG Energy, 2010, “The Impact of Land Use Change on Greenhouse Gas Emissions from Biofuels and Bioliquids.”
126 Fargione et al., 2008, “Land Clearing and the Biofuel Carbon Debt,” Science.
127 Fargione et al., 2008, “Land Clearing and the Biofuel Carbon Debt,” Science; Gasparatos et al., 2017, “Renewable Energy and Biodiversity: Implica-tions for Transitioning to a Green Economy,” Renewable and Sustainable Energy Reviews; Fajardy and Dowell, 2017, “Can BECCS Deliver Sustainable and Resource Efficient Negative Emissions?,” Energy & Environmental Science.
128 Key issues under debate include: the size of effects, with surprisingly little consensus on some of the basic science, such as the extent to which energy crop production on abandoned agricultural land would lead to lower or higher soil organic content in practice (The International Council on Clean Transportation, 2018, “Sustainability Challenges of Lignocellulosic Bioenergy Crops.”), or differences in the extent of carbon stores in different types of land (DG Energy, 2010, “The Impact of Land Use Change on Greenhouse Gas Emissions from Biofuels and Bioliquids.”); 2) the relevant counterfactual, where studies often make very different assumptions about what would happen if biomass were not extracted; and 3) the assumptions about management practices: One major study found that limited success in enforcing sustainability criteria would mean that more than a third of the CO2 gains from biomass were eroded by GHG impacts from its production, whereas better management practices would mean that just 14% were eroded (Rowe et al., 2011, “Counting the Cost of Carbon in Bioenergy Systems: Sources of Variation and Hidden Pitfalls When Comparing Life Cycle Assessments,” Biofuels, 201; R. Matthews et al., 2014, “Review of Literature on Biogenic Carbon and Life Cycle Assessment of Forest Bioenergy. Final Task 1 Report.”) Carbon impacts of using biomass in bioenergy and other sectors: forests
129 Creutzig et al., 2015, “Bioenergy and Climate Change Mitigation: An Assessment,” GCB Bioenergy; Fajardy and Dowell, 2017, “Can BECCS Deliver Sustainable and Resource Efficient Negative Emissions?,” Energy & Environmental Science; Rowe et al., 2011, “Counting the Cost of Carbon in Bioen-ergy Systems: Sources of Variation and Hidden Pitfalls When Comparing Life Cycle Assessments,” Biofuels.
130 Marelli et al., 2014, Carbon Accounting of Forest Bioenergy: Conclusions and Recommendations from a Critical Literature Review.; Robert Matthews, Hogan, and Mackie, 2018, “Carbon Impacts of Biomass Consumed in the EU: Supplementary Analysis and Interpretation for the European Climate Foundation.”
131 The International Council on Clean Transportation, 2018, “Sustainability Challenges of Lignocellulosic Bioenergy Crops.”
132 Robert Matthews et al., 2015, “Carbon Impact of Biomass Consumed in the EU: Quantitative Assessment.”
133 Stephenson and MacKay, 2014, “Life Cycle Impacts of Biomass Electricity in 2020 - Scenarios for Assessing the Greenhouse Gas Impacts and Energy Input Requirements of Using North American Woody Biomass for Electricity Generation in the UK”; Fajardy and Dowell, 2017, “Can BECCS Deliver Sustainable and Resource Efficient Negative Emissions?,” Energy & Environmental Science; The International Council on Clean Transportation, 2018, “Sustainability Challenges of Lignocellulosic Bioenergy Crops.”
134 Robert Matthews et al., 2015, “Carbon Impact of Biomass Consumed in the EU: Quantitative Assessment”; Stephenson and MacKay, 2014, “Life Cycle Impacts of Biomass Electricity in 2020 - Scenarios for Assessing the Greenhouse Gas Impacts and Energy Input Requirements of Using North American Woody Biomass for Electricity Generation in the UK.”
135 110 g CO2/MJ is based on Matthews et al 2015. 166 g CO2/MJ is calculated based on Jonsson et al 2018, where an increased supply of 238 Mm3 of fuelwood (around 530 TWh) results in a reduced carbon sink of 86 Tg carbon per year, or 316 Mt CO2 per year, implying emissions per unit energy of 0.6 tCO2/MWh, or 166 g CO2/MJ. Similar emissions factors are implied by the results in Jonsson et al 2021 and other studies.(Robert Matthews et al., 2015, “Carbon Impact of Biomass Consumed in the EU: Quantitative Assessment”; Jonsson et al., 2021, “Boosting the EU Forest-Based Bioeconomy: Market, Climate, and Employment Impacts,” Technological Forecasting and Social Change; 2018, “Outlook of the European Forest-Based Sector: Forest Growth, Harvest Demand, Wood-Product Markets, and Forest Carbon Dynamics Implications,” IForest - Biogeosciences and Forestry.)
136 Material Economics analysis based on multiple sources (mentioned in the text).
137 Camia et al., 2021, The Use of Woody Biomass for Energy Production in the EU.
138 Robert Matthews, 2020, “Assessment of EU LULUCF Regulation.”
139 International Energy Agency, 2021, “Net Zero by 2050 - A Roadmap for the Global Energy Sector”; 2017, “Energy Technology Perspectives 2017.”
140 For example, a recent analysis by the Energy Transitions Commission suggests that only half this amount might in fact be likely. (Energy Transitions Commission, 2021, “Bioresources within a Net-Zero Emissions Economy: Making a Sustainable Approach Possible (Forthcoming).”)
141 Smith, Kralli, and Lemoine, 2021, “Analysis on Biomass in National Energy and Climate Plans”; European Commission, 2020, “An EU-Wide Assess-ment of National Energy and Climate Plans - Driving Forward the Green Transition and Promoting Economic Recovery through Integrated Energy and Climate Planning.”
142 Smith, Kralli, and Lemoine, 2021, “Analysis on Biomass in National Energy and Climate Plans.”

96 97
Ahlgren, S., and L. Di Lucia. 2014. “Indirect Land Use Changes of Biofuel Production – a Review of Modelling Efforts and Policy Developments in the European Union.” Biotechnology for Biofuels 7 (1): 35. doi:10.1186/1754-6834-7-35.
Air Quality Expert Group. 2018. “Air Pollution from Agriculture. Prepared for: Department for Environment, Food and Rural Affairs; Scottish Government; Welsh Government; and Department of the Environment in Northern Ireland.” https://uk-air.defra.gov.uk/assets/documents/reports/aqeg/2800829_Agricultu-ral_emissions_vfinal2.pdf.
Airbus. 2021. “ZEROe - Towards the World’s First Zero-Emission Commercial Aircraft.” Company website. Airbus. May 26, 2021. https://www.airbus.com/innovation/zero-emission/hydrogen/zeroe.html.
Allen, B., B. Kretschmer, D. Baldock, H. Menadue, S. Nanni, and G. Tucker. 2014. “Space for Energy Crops – Assessing the Potential Contribution to Europe’s Energy Future.” Report produced for BirdLife Europe, European Environmental Bureau and Transport & Environment. London. http://www.birdlife.org/sites/default/files/attachments/IEEP_2014_Space_for_Energy_Crops_0.pdf.
Anderson, K., and G. Peters. 2016. “The Trouble with Negative Emissions.” Science 354 (6309): 182–83. doi:10.1126/science.aah4567.Bazzanella, A.M., and F. Ausfelder. 2017. “Low Carbon Energy and Feedstock for the European Chemical Industry.” DECHEMA Gesellschaft für Chemische Technik und Biotechnologie e.V. https://dechema.de/dechema_media/Downloads/Positionspapiere/Technology_study_Low_carbon_energy_and_feedstock_for_the_European_chemical_industry.pdf.
Bentsen, N.S., and C. Felby. 2012. “Biomass for Energy in the European Union - a Review of Bioenergy Resource Assessments.” Biotechnology for Biofuels 5 (1): 25. doi:10.1186/1754-6834-5-25.
bp. 2020. “Bp Statistical Review of World Energy 2020,” 68. https://www.bp.com/content/dam/bp/business-sites/en/global/corporate/pdfs/energy-economics/statistical-review/bp-stats-review-2020-full-report.pdf.
Camia, A., J. Giuntoli, R. Jonsson, N. Robert, N.E. Cazzaniga, G. Jasinevičius, V. Avitabile, et al. 2021. The Use of Woody Biomass for Energy Production in the EU. https://op.europa.eu/publication/manifestation_identifier/PUB_KJNA30548ENN.
Camia, A., N. Robert, K. Jonsson, R. Pilli, S. García-Condado, R. López-Lozano, M. van der Velde, et al. 2018. “Biomass Production, Supply, Uses and Flows in the European Union: First Results from an Integrated Assessment.” Publications Office of the European Union, 126. doi:10.2760/539520.
CEFIC. 2013. “European Chemistry for Growth: Unlocking a Competitive, Low Carbon and Energy Efficient Future.” http://www.cefic.org/Industry-support/.
Chislock, M. F., Doster, E., Zitomer, R. A., and Wilson, A. E. 2013. “Eutrophication: Causes, Consequences, and Controls in Aquatic Ecosystems | Learn Science at Scitable.” Nature Education Knowledge. 2013. https://www.nature.com/scitable/knowledge/library/eutrophication-causes-consequences-and-controls-in-aqu-atic-102364466/.
Committee on Climate Change (CCC). 2018. “Biomass in a Low-Carbon Economy.” Report. Committee on Climate Change. https://www.theccc.org.uk/publication/biomass-in-a-low-carbon-economy/.
Creutzig, F., N.H. Ravindranath, G. Berndes, S. Bolwig, R. Bright, F. Cherubini, H. Chum, et al. 2015. “Bioenergy and Climate Change Mitigation: An Assess-ment.” GCB Bioenergy 7 (5): 916–44. doi:10.1111/gcbb.12205.
Curtis, P.G., C.M. Slay, N.L. Harris, A. Tyukavina, and M.C. Hansen. 2018. “Classifying Drivers of Global Forest Loss.” Science 361 (6407): 1108–11. doi:10.1126/science.aau3445.
Dees, M., B. Elbersen, J.B. Fitzgerald, M. Vis, P. Anttila, N. Forsell, M. Hökl, et al. 2017. “D1.6 A Spatial Data Base on Sustainable Biomass Cost Supply of Lignocellulosic Biomass in Europe - Methods & Data Sources.” Project report. S2Biom - A project funded under the European Union 7th Framework Programme for Research. https://www.s2biom.eu/images/Publications/D1.6_S2Biom_Spatial_data_methods_data_sources_Final_Final.pdf.
DG Energy. 2010. “The Impact of Land Use Change on Greenhouse Gas Emissions from Biofuels and Bioliquids.” European Commission, DG Energy. http://www.globalbioenergy.org/uploads/media/1007_EC_-_The_impact_of_land_use_change_on_greenhouse_gas_emissions_from_biofuels_and_bioliquids.pdf.Elbersen, B., I. Startisky, G. Hengeveld, M.-J. Schelhaas, H. Naeff, and H. Böttcher. 2012. “Atlas of EU Biomass Potentials.” https://ec.europa.eu/energy/intelli-gent/projects/sites/iee-projects/files/projects/documents/biomass_futures_atlas_of_technical_and_economic_biomass_potential_en.pdf.
Energy Transition Commission. 2019. “Mission Possible Sectoral Focus: Aviation.” Energy Transition Commission. https://www.energy-transitions.org/wp-con-tent/uploads/2020/08/ETC-sectoral-focus-Aviation_final.pdf.
Energy Transition Commission. 2019. “Mission Possible Sectoral Focus: Plastics.” Energy Transition Commission. https://www.energy-transitions.org/wp-con-tent/uploads/2020/08/ETC-sectoral-focus-Plastics_final.pdf.
Energy Transition Commission. 2019. “Mission Possible Sectoral Focus: Shipping.” Energy Transition Commission. https://www.energy-transitions.org/wp-con-tent/uploads/2020/08/ETC-sectoral-focus-Shipping_final.pdf.
Energy Transition Commission. 2020. “Making Mission Possible: Delivering a Net-Zero Economy.” Version 1.0. Energy Transition Commission. https://www.energy-transitions.org/wp-content/uploads/2020/09/Making-Mission-Possible-Full-Report.pdf.
Energy Transitions Commission. 2021. “Bioresources within a Net-Zero Emissions Economy: Making a Sustainable Approach Possible (Forthcoming).” https://www.energy-transitions.org/publications/.
Ericsson, K., and L.J. Nilsson. 2018. “Climate Innovations in the Paper Industry: Prospects for Decarbonisation.” Miljö- Och Energisystem, LTH, Lunds Universitet, IMES/EESS report series, 110 (October): 37. https://portal.research.lu.se/portal/en/publications/climate-innovations-in-the-paper-industry-pro-spects-for-decarbonisation(8f33e51d-0c5d-4eb1-bfcf-bab822306140).html.
BIBLIOGRAPHY

98
Eurelectric. 2018. “Decarbonisation Pathway - Full Study Results.” https://cdn.eurelectric.org/media/3558/decarbonisation-pathways-all-slides-links-29112018-h-4484BB0C.pdf.
European Climate Foundation. 2010. “Roadmap 2050 - a Practical Guide to a Prosperous, Low-Carbon Europe.” European Climate Foundation. http://www.roadmap2050.eu/attachments/files/Volume1_ExecutiveSummary.pdf.
European Commission. 2011. “Energy Roadmap 2050 - Impact Assessment and Scenario Analysis.” European Commission. https://ec.europa.eu/energy/sites/ener/files/documents/roadmap2050_ia_20120430_en_0.pdf.
European Commission. 2015. “Technical Assessment of the EU Biofuel Sustainability and Feasibility of 10% Renewable Energy Target in Transport.”
European Commission. 2016. “Study on Impacts on Resource Efficiency of Future EU Demand for Bioenergy.” European Commission. https://ec.europa.eu/environment/enveco/resource_efficiency/pdf/studies/Task%203.pdf.
European Commission. 2017. “Sustainable and Optimal Use of Biomass for Energy in the EU beyond 2020.” https://biomassmurder.org/docs/2017-05-00-eu-ropean-commission-sustainable-and-optimal-use-of-biomass-for-energy-in-the-eu-beyond-2020-english.pdf.
European Commission. 2018. “A Clean Planet for All - A European Strategic Long-Term Vision for a Prosperous, Modern, Competitive and Climate Neutral Economy.” Brussels. https://ec.europa.eu/clima/sites/default/files/docs/pages/com_2018_733_analysis_in_support_en_0.pdf.
European Commission. 2020. “An EU-Wide Assessment of National Energy and Climate Plans - Driving Forward the Green Transition and Promoting
Economic Recovery through Integrated Energy and Climate Planning.” https://eur-lex.europa.eu/legal-content/EN/TXT/PDF/?uri=CELEX:52020D-C0564&from=EN.
European Commission. 2020. “EU Biodiversity Strategy for 2030 - Bringing Nature Back into Our Lives.” https://eur-lex.europa.eu/resource.html?uri=cellar:a-3c806a6-9ab3-11ea-9d2d-01aa75ed71a1.0001.02/DOC_1&format=PDF.
European Commission. 2020. “Farm to Fork Strategy: For a Fair, Healthy and Environmentally-Friendly Food System.” https://ec.europa.eu/food/sites/food/files/safety/docs/f2f_action-plan_2020_strategy-info_en.pdf.
European Commission. n.d. “Protecting Water in the CAP.” Text. European Commission. Accessed June 1, 2021. https://ec.europa.eu/info/food-farming-fishe-ries/sustainability/environmental-sustainability/natural-resources/water_en.
European Commission. Joint Research Centre. 2020. Analysis of Climate Change Impacts on EU Agriculture by 2050: JRC PESETA IV Project : Task 3. LU: Publications Office. https://data.europa.eu/doi/10.2760/121115.
European Commission. Joint Research Centre. 2020. Future Transitions for the Bioeconomy towards Sustainable Development and a Climate-Neutral Economy: Knowledge Synthesis : Final Report. LU: Publications Office. https://data.europa.eu/doi/10.2760/667966.
European Commission. Joint Research Centre. 2020. Mapping and Assessment of Ecosystems and Their Services: An EU Wide Ecosystem Assessment in Support of the EU Biodiversity Strategy. LU: Publications Office. https://data.europa.eu/doi/10.2760/757183.
European Environment Agency. 2012. “Forest Growth — European Environment Agency.” Data and maps. November 22, 2012. https://www.eea.europa.eu/data-and-maps/indicators/forest-growth-1/assessment.
European Environment Agency. 2019. “Nutrient Enrichment and Eutrophication in Europe’s Seas - Moving towards a Healthy Marine Environment.” European Environment Agency. https://www.eea.europa.eu/publications/nutrient-enrichment-and-eutrophication-in/download.
Eurostat. 2020. “Electricity and Heat Statistics.” Eurostat - Statistics Explained. September 17, 2020. https://ec.europa.eu/eurostat/statistics-explained/index.php?title=Electricity_and_heat_statistics.
Eurostat. 2021. “EU Energy Balance Sheets April 2021 Edition.” https://ec.europa.eu/eurostat/web/energy/data/energy-balances.
Eurostat. 2021. “Share of Fossil Fuels in Gross Available Energy.” Eurostat - Your Key to European Statistics. April 2, 2021. https://ec.europa.eu/eurostat/web/products-eurostat-news/-/ddn-20210204-1.
Fajardy, M., and N.M. Dowell. 2017. “Can BECCS Deliver Sustainable and Resource Efficient Negative Emissions?” Energy & Environmental Science 10 (6): 1389–1426. doi:10.1039/C7EE00465F.
Fajardy, M., A. Köberle, Mac Dowell, Niall, and Fantuzzi, Andrea. 2018. “BECCS Deployment: A Reality Check,” December, 15. https://www.researchgate.net/publication/330774659_BECCS-deployment-_a-reality-check.
FAO and UNEP. 2020. The State of the World’s Forests 2020. FAO and UNEP. doi:10.4060/ca8642en.
Fargione, J., J. Hill, D. Tilman, S. Polasky, and P. Hawthorne. 2008. “Land Clearing and the Biofuel Carbon Debt.” Science 319 (5867): 1235–38. doi:10.1126/science.1152747.
Fasihi, M., O. Efimova, and C. Breyer. 2019. “Techno-Economic Assessment of CO2 Direct Air Capture Plants.” Journal of Cleaner Production 224 (July): 957–80. doi:10.1016/j.jclepro.2019.03.086.
Food and Agriculture Organization of the United Nations (FAO). 2021. “Forestry Production and Trade.” May 27, 2021. http://www.fao.org/faostat/en/#data/FO/visualize.

98 99
Forest Europe. 2020. “State of Europe’s Forests 2020.” Forest Europe. https://foresteurope.org/wp-content/uploads/2016/08/SoEF_2020.pdf.
Forest Research. n.d. “Typical Calorific Values of Fuels.” Forest Research. Accessed May 28, 2021. https://www.forestresearch.gov.uk/tools-and-resources/fthr/biomass-energy-resources/reference-biomass/facts-figures/typical-calorific-values-of-fuels/.
Forsell, N. et al. 2015. Study on Impacts on Resource Efficiency of Future EU Demand for Bioenergy (ReceBio). Final Report. LU: European Commission. https://ec.europa.eu/environment/enveco/resource_efficiency/pdf/bioenergy/KH-02-16-505-EN-N%20-%20final%20report.pdf.
Fuss, S., W.F. Lamb, M.W. Callaghan, J. Hilaire, F. Creutzig, T. Amann, T. Beringer, et al. 2018. “Negative Emissions—Part 2: Costs, Potentials and Side Effects.” Environmental Research Letters 13 (6): 063002. doi:10.1088/1748-9326/aabf9f.
Gasparatos, A., C.N.H. Doll, M. Esteban, A. Ahmed, and T.A. Olang. 2017. “Renewable Energy and Biodiversity: Implications for Transitioning to a Green Economy.” Renewable and Sustainable Energy Reviews 70 (April): 161–84. doi:10.1016/j.rser.2016.08.030.
Griscom, B.W., J. Adams, P.W. Ellis, R.A. Houghton, G. Lomax, D.A. Miteva, W.H. Schlesinger, et al. 2017. “Natural Climate Solutions.” Proceedings of the National Academy of Sciences 114 (44): 11645–50. doi:10.1073/pnas.1710465114.
Hänninen, R., L. Hetemäki, E. Hurmekoski, A. Mutanen, A. Näyhä, J. Forsström, J. Viitanen, and T. Koljonen. 2014. “European Forest Industry and Forest Bioenergy Outlook up to 2050: A Synthesis,” 173.
Hepher, T., and L. Frost. 2021. “Airbus Tells EU Hydrogen Won’t Be Widely Used in Planes before 2050 - By Reuters.” Investing.Com UK, June 10, 2021. htt-ps://uk.investing.com/news/stock-market-news/airbus-tells-eu-hydrogen-wont-be-widely-used-in-planes-before-2050-2391573.
Hydrogen Council, and McKinsey & Company. 2020. “Path to Hydrogen Competitiveness; A Cost Perspective.” https://hydrogencouncil.com/wp-content/uploads/2020/01/Path-to-Hydrogen-Competitiveness_Full-Study-1.pdf.
IMO. 2020. “Fourth IMO GHG Study.” https://www.imo.org/en/OurWork/Environment/Pages/Fourth-IMO-Greenhouse-Gas-Study-2020.aspx
International Energy Agency, ed. 2011. World Energy Outlook 2011. Paris: OECD. https://www.iea.org/reports/world-energy-outlook-2011.
International Energy Agency. 2017. “Energy Technology Perspectives 2017.” International Energy Agency. www.iea.org/etp2017.
International Energy Agency. 2017. “The Future of Trucks - Implications for Energy and the Environment,” no. Second edition: 164. https://iea.blob.core.win-dows.net/assets/a4710daf-9cd2-4bdc-b5cf-5141bf9020d1/TheFutureofTrucksImplicationsforEnergyandtheEnvironment.pdf.
International Energy Agency. 2020. “World Energy Outlook 2020,” October, 464. https://www.iea.org/reports/world-energy-outlook-2020.
International Energy Agency. 2021. “Net Zero by 2050 - A Roadmap for the Global Energy Sector,” 224. https://www.iea.org/reports/net-zero-by-2050.
International Renewable Energy Agency and European Commission. 2018. Renewable Energy Prospects for the European Union. Abu Dhabi: International Renewable Energy Agency (IRENA). http://www.irena.org/-/media/Files/IRENA/Agency/Publication/2018/Feb/IRENA_REmap_EU_2018.pdf.
IPCC, M. Allen, M. Babiker, Y. Chen, H. de Coninck, S. Connors, R. van Diemen, et al. 2018. “Summary for Policymakers. In: Global Warming of 1.5°C. An IPCC Special Report.” In . https://www.researchgate.net/profile/Robin-Matthews/publication/329866816_Summary_for_Policymakers_In_Global_warming_of_15C_An_IPCC_Special_Report/links/5c1e7657a6fdccfc70628e47/Summary-for-Policymakers-In-Global-warming-of-15C-An-IPCC-Special-Report.pdf.Johnsson, F., F. Normann, and E. Svensson. 2020. “Marginal Abatement Cost Curve of Industrial CO2 Capture and Storage – A Swedish Case Study.” Frontiers in Energy Research 8. doi:10.3389/fenrg.2020.00175.
Johnston, C.M.T., and V.C. Radeloff. 2019. “Global Mitigation Potential of Carbon Stored in Harvested Wood Products.” Proceedings of the National Academy of Sciences 116 (29): 14526–31. doi:10.1073/pnas.1904231116.
Joint Research Centre (European Commission). 2019. “Brief on Biomass for Energy in the European Union,” 8. doi:10.2760/546943.
Jonsson, R., F. Rinaldi, R. Pilli, G. Fiorese, E. Hurmekoski, N. Cazzaniga, N. Robert, and A. Camia. 2021. “Boosting the EU Forest-Based Bioeconomy: Market, Climate, and Employment Impacts.” Technological Forecasting and Social Change 163 (February): 120478. doi:10.1016/j.techfore.2020.120478.
Jonsson, R., B. Viorel, G. Fiorese, R. Pilli, F. Rinaldi, C. Baranzelli, and A. Camia. 2018. “Outlook of the European Forest-Based Sector: Forest Growth, Harvest Demand, Wood-Product Markets, and Forest Carbon Dynamics Implications.” IForest - Biogeosciences and Forestry 11 (April). doi:10.3832/ifor2636-011.
Kansy, T. 2020. “An Investor Guide to Negative Emission Technologies and the Importance of Land Use.” Vivid Economics. https://www.unpri.org/downlo-ad?ac=11980.
Keith, D.W., G. Holmes, D. St. Angelo, and K. Heidel. 2018. “A Process for Capturing CO2 from the Atmosphere.” Joule 2 (8): 1573–94. doi:10.1016/j.joule.2018.05.006.
Laborde Debucquet, D. 2011. “Assessing the Land Use Change Consequences of European Biofuel Policies.” IFPRI. http://ebrary.ifpri.org/utils/getfile/collection/p15738coll5/id/197/filename/198.pdf.
Lechtenböhmer, S., L.J. Nilsson, M. Åhman, and C. Schneider. 2016. “Decarbonising the Energy Intensive Basic Materials Industry through Electrification – Implications for Future EU Electricity Demand.” Energy 115 (November): 1623–31. doi:10.1016/j.energy.2016.07.110.Leskinen, P., G. Cardellini, S. González-García, E. Hurmekoski, R. Sathre, J. Seppälä, C. Smyth, T. Stern, P.J. Verkerk, and European Forest Institute. 2018. “Substitution Effects of Wood-Based Products in Climate Change Mitigation.” From Science to Policy. From Science to Policy. European Forest Institute. doi:10.36333/fs07.

100
Mantzos, L., N. Matei, E. Mulholland, M. Rózsai, M. Tamba, and T. Wiesenthal. 2018. “The JRC Integrated Database of the European Energy System.” European Commission. 2018. https://publications.jrc.ec.europa.eu/repository/handle/JRC112474.
Marelli, L., A. Agostini, J. Giuntoli, and A. Boulamanti. 2014. Carbon Accounting of Forest Bioenergy: Conclusions and Recommendations from a Critical Literature Review. LU: Publications Office. https://data.europa.eu/doi/10.2788/29442.
Material Economics. 2018. “The Circular Economy - A Powerful Force for Climate Mitigation.” https://materialeconomics.com/publications/the-circular-eco-nomy.
Material Economics. 2019. “Industrial Transformation 2050 - Pathways to Net-Zero Emissions from EU Heavy Industry.” https://materialeconomics.com/publications/industrial-transformation-2050.
Material Economics. 2020. “Mainstreaming Green Hydrogen in Europe.” https://materialeconomics.com/publications/mainstreaming-green-hydrogen-in-euro-pe.
Matthews, R., L. Sokka, S. Soimakallio, N. Mortimer, J. Rix, M. Schelhaas, T. Jenkins, et al. 2014. “Review of Literature on Biogenic Carbon and Life Cycle Assess-ment of Forest Bioenergy. Final Task 1 Report,” 322. /paper/Review-of-literature-on-biogenic-carbon-and-life-of-Matthews-Sokka/10ad90553795038186694a-ef2551c542377339b4.
Matthews, Robert. 2020. “Assessment of EU LULUCF Regulation,” 65. https://www.fern.org/fileadmin/uploads/fern/Documents/2020/Fern_Study_Assess-ment_of_LULUCF_Regulation.pdf.
Matthews, Robert, G. Hogan, and E. Mackie. 2018. “Carbon Impacts of Biomass Consumed in the EU: Supplementary Analysis and Interpretation for the European Climate Foundation.” Forest Research. https://www.drax.com/wp-content/uploads/2019/10/CIB-Summary-report-for-ECF-v10.5-May-20181.pdf.Matthews, Robert, N. Mortimer, J.P. Lesschen, T. Lindroos, L. Sokka, A. Morris, P. Henshall, et al. 2015. “Carbon Impact of Biomass Consumed in the EU: Quantitative Assessment.” Final project report, project: DG ENER/C1/427. Farnham: Forest Research. https://ec.europa.eu/energy/sites/ener/files/documents/EU%20Carbon%20Impacts%20of%20Biomass%20Consumed%20in%20the%20EU%20final.pdf.
McKendry, P. 2002. “McKendry, P.: Energy Production from Biomass (Part 1): Overview of Biomass. Bioresour. Technol. 83, 37-46.” Bioresource Technology 83 (June): 37–46. doi:10.1016/S0960-8524(01)00118-3.
McKinsey & Company. 2010. “Impact of the Financial Crisis on Carbon Economics: Version 2.1 of the Global Greenhouse Gas Abatement Cost Curve.” https://www.mckinshttps://www.mckinsey.com/business-functions/sustainability/our-insights/impact-of-the-financial-crisis-on-carbon-economics-version-21is%20on%20carbon%20economics%20version%2021/impact%20of%20the%20financial%20crisis%20on%20carbon%20economics%20version%2021.pdf.
McKinsey & Company. 2020. “Net-Zero Europe - Decarbonization Pathways and Socioeconomic Implications.” December 3, 2020. https://www.mckinsey.com/business-functions/sustainability/our-insights/how-the-european-union-could-achieve-net-zero-emissions-at-net-zero-cost.
Minx, J.C., W.F. Lamb, M.W. Callaghan, S. Fuss, J. Hilaire, F. Creutzig, T. Amann, et al. 2018. “Negative Emissions—Part 1: Research Landscape and Synthesis.” Environmental Research Letters 13 (6): 063001. doi:10.1088/1748-9326/aabf9b.
National Academies of Sciences, E. 2018. Negative Emissions Technologies and Reliable Sequestration: A Research Agenda. doi:10.17226/25259.
Nurek, T., A. Gendek, and K. Roman. 2018. “Forest Residues as a Renewable Source of Energy: Elemental Composition and Physical Properties.” BioResources 14 (1): 6–20. doi:10.15376/biores.14.1.6-20.
Pew Charitable Trusts, and SYSTEMIQ. 2020. “Breaking the Plastics Wave.” https://www.pewtrusts.org/-/media/assets/2020/07/breakingtheplasticwave_report.pdf.
Philibert, C. 2017. “Producing Ammonia and Fertilizers: New Opportunities from Renewables.” International Energy Agency, October, 6.
Realmonte, G., L. Drouet, A. Gambhir, J. Glynn, A. Hawkes, A.C. Köberle, and M. Tavoni. 2019. “An Inter-Model Assessment of the Role of Direct Air Capture in Deep Mitigation Pathways.” Nature Communications 10 (1): 3277. doi:10.1038/s41467-019-10842-5.
Ricardo. 2018. “Impact Analysis of Mass EV Adoption and Low Carbon Intensity Fuels Scenarios,” 166. https://www.concawe.eu/wp-content/uploads/RD18-001538-4-Q015713-Mass-EV-Adoption-and-Low-Carbon-Fuels-Scenarios.pdf.
Ronzon, T., and S. Piotrowski. 2017. “Are Primary Agricultural Residues Promising Feedstock for the European Bioeconomy?” Industrial Biotechnology 13 (June): 113–27. doi:10.1089/ind.2017.29078.tro.
Rowe, R., J. Whitaker, P.H. Freer-Smith, J. Chapman, S. Ryder, K.E. Ludley, D.C. Howard, and G. Taylor. 2011. “Counting the Cost of Carbon in Bioenergy Systems: Sources of Variation and Hidden Pitfalls When Comparing Life Cycle Assessments.” Biofuels 2 (6): 693–707. doi:10.4155/bfs.11.131.
S2Biom. n.d. “S2Biom - Tools for Biomass Chains (Cost / Supply Curves).” S2Biom. Accessed May 28, 2021. https://s2biom.wenr.wur.nl/home.
Scharlemann, J.P., E.V. Tanner, R. Hiederer, and V. Kapos. 2014. “Global Soil Carbon: Understanding and Managing the Largest Terrestrial Carbon Pool.” Carbon Management 5 (1): 81–91. doi:10.4155/cmt.13.77.
Searle, S., C. Petrenko, E. Baz, and C. Malins. 2016. “Crops of the Biofrontier: In Search of Opportunities for Sustainable Energy Cropping.” Washington D.C.: The International Council on Clean Transportation. https://theicct.org/sites/default/files/publications/Energy%20Crop%20White%20Paper%20vF.pdf.Searles, S., and C. Malins. 2013. “Availability of Cellulosic Residues and Wastes in the EU.” International Council on Clean Transportation. https://theicct.org/sites/default/files/publications/ICCT_EUcellulosic-waste-residues_20131022.pdf.
Sheppard, D., and C. Hodgson. 2021. “Cost of Polluting in EU Soars as Carbon Price Hits Record €50.” Financial Times, May 4, 2021. https://www.ft.com/content/2b965427-4fbc-4f2a-a14f-3be6019f0a7c.
Skogsstyrelsen, and Biometria. 2021. “Rundvirkespriser.” 2021. /statistik/statistik-efter-amne/rundvirkespriser/.

100 101
Smith, M., A. Kralli, and P. Lemoine. 2021. “Analysis on Biomass in National Energy and Climate Plans.” Rotterdam: Trinomics. https://www.fern.org/fileadmin/uploads/fern/Documents/2021/Fern_-_Biomass_in_NECPs_-_Final_report.pdf.
Stephenson, D.A.L., and D. MacKay. 2014. “Life Cycle Impacts of Biomass Electricity in 2020 - Scenarios for Assessing the Greenhouse Gas Impacts and Energy Input Requirements of Using North American Woody Biomass for Electricity Generation in the UK.” London: Department of Energy & Climate Change. htt-ps://assets.publishing.service.gov.uk/government/uploads/system/uploads/attachment_data/file/349024/BEAC_Report_290814.pdf.Terlouw, W., D. Peters, J. van Tilburg, M. Schimmel, T. Berg, J. Cihlar, G. Ur Rehman Mir, et al. 2019. “Gas for Climate. The Optimal Role for Gas in a Net Zero Emissions Energy System,” 231. https://gasforclimate2050.eu/wp-content/uploads/2020/03/Navigant-Gas-for-Climate-The-optimal-role-for-gas-in-a-net-zero-emissions-energy-system-March-2019.pdf.
The European Commission’s science and knowledge service. 2019. “Food, Feed, Fibres, Fuels. Enough Biomass for a Sustainable Bioeconomy?” Text. EU Science Hub - European Commission. September 27, 2019. https://ec.europa.eu/jrc/en/news/food-feed-fibres-fuels-enough-biomass-sustainable-bioeconomy.The International Council on Clean Transportation. 2018. “Sustainability Challenges of Lignocellulosic Bioenergy Crops,” February, 13. https://theicct.org/sites/default/files/publications/Energy_Crop_Sustainability_briefing_20180226.pdf.
Thek, G., and I. Obernberger. 2012. The Pellet Handbook. 0 ed. Routledge. doi:10.4324/9781849775328.Ueckerdt, F., C. Bauer, A. Dirnaichner, J. Everall, R. Sacchi, and G. Luderer. 2021. “Potential and Risks of Hydrogen-Based e-Fuels in Climate Change Mitiga-tion.” Nature Climate Change 11 (5): 384–93. doi:10.1038/s41558-021-01032-7.
Watson, R.T., I.A. Baste, A. Larigauderie, P. Leadley, U. Pascual, B. Baptiste, S. Demissew, et al. 2019. “Summary for Policymakers of the Global Assessment Report on Biodiversity and Ecosystem Services of the Intergovernmental Science-Policy Platform on Biodiversity and Ecosystem Services,” 60.Wit, M. de, and A. Faaij. 2010. “European Biomass Resource Potential and Costs.” Biomass and Bioenergy 34 (2): 188–202. doi:10.1016/j.biombioe.2009.07.011.
World Bank. n.d. “Agricultural Land (Sq. Km) - Germany | Data.” Databank. The World Bank. Accessed May 28, 2021. https://data.worldbank.org/indicator/AG.LND.AGRI.K2?locations=DE.
World Economic Forum, and McKinsey & Company. 2020. “Clean Skies for Tomorrow: Sustainable Aviation Fuels as a Pathway to Net-Zero Aviation.” Insight report. https://www.weforum.org/reports/clean-skies-for-tomorrow-sustainable-aviation-fuels-as-a-pathway-to-net-zero-aviation.ZeroAvia. 2021. “Our Vision: Renewably–Powered Hydrogen–Electric Aviation.” Company website. ZeroAvia - The First Practical True Zero Emission Aviation Powertrain. May 26, 2021. https://www.zeroavia.com/.

102102 103
EU Biomass Use in a Net-Zero Economy
Priorities for EU biomass resources in a low-carbon transition
Material Economics Sverige AB www.materialeconomics.com [email protected]
This study examines how the EU can make the most of its bio-mass resources to meet materials and energy needs in the transition to net-zero greenhouse gas emissions, without compromising other policy goals.
The report finds that biomass will play valuable roles in future ma-terials and chemical production and in some aspects of the energy supply – but that a major course correction is needed. Policymakers and business leaders alike need to revisit their plans for biomass use to ensure they are sustainable and economically viable.
Disclaimer: The analysis and conclusions of this report are those of Material Economics. Material Economics is solely responsible for the contents of this report and the views are those of the authors
Please refer to this report as: Material Economics (2021). EU Biomass Use In A Net-Zero Economy - A Course Correction for EU Biomass