eu funded r&d collaboration networks in the area of information society technologies and the...
TRANSCRIPT

EU funded R&D collaboration networks in the area of Information Society Technologies and the role of Greek actors
Aimilia ProtogerouTeam for the Technological, Economic and Strategic
Analysis of the Information Society, LIEE/NTUAErmoupolis Seminars 2007
12-15 July

Aim of the presentation
To show some interesting findings on the structure and evolution of the research collaboration networks formed under the 4th, 5th and 6th EU Framework Programmes during the period 1994-2006 in the area of Information Society Technologies (IST).
To contribute to a better understanding of the role of Greek actors in these networks.
The RJV-IST type of networks
These networks are comprised of firms, universities, research institutes and other organizations that get connected by cooperative contractual agreements.
Exploration networks Policy-driven networks vs. other
network types studied through patent citations or technology alliances.
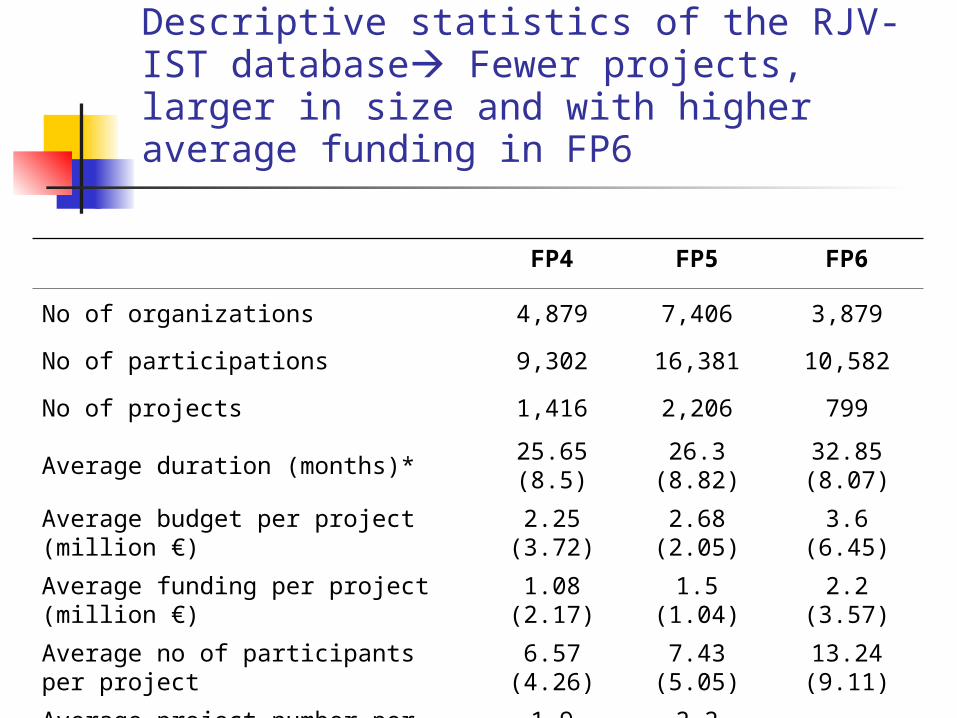
Descriptive statistics of the RJV-IST database Fewer projects, larger in size and with higher average funding in FP6
FP4 FP5 FP6
No of organizations 4,879 7,406 3,879
No of participations 9,302 16,381 10,582
No of projects 1,416 2,206 799
Average duration (months)*25.65 (8.5)
26.3 (8.82)
32.85 (8.07)
Average budget per project (million €)
2.25 (3.72)
2.68 (2.05)
3.6 (6.45)
Average funding per project (million €)
1.08 (2.17)
1.5 (1.04) 2.2 (3.57)
Average no of participants per project
6.57 (4.26)
7.43 (5.05)
13.24 (9.11)
Average project number per participant
1.9 (3.15) 2.2 (5.09) 2.7 (5.6)

Returning and new entities by organization type (FP5 vs. FP4 and FP6 vs. FP4 +FP5) There is a core of returning organizations exhibiting more stable relationships than others
0%
10%
20%
30%
40%
50%
60%
70%
80%
90%
100%
returning new returning new
FP5 FP6
Other
Industry
Research
Education

Frequency of participation for all entity types in FPs The grand majority of entities participate in only one project
0%
10%
20%
30%
40%
50%
60%
70%
80%
1 2 3 4 5 6 to 10 11 to 20 >20
En
titi
es
Memberships
FP4
FP5
FP6
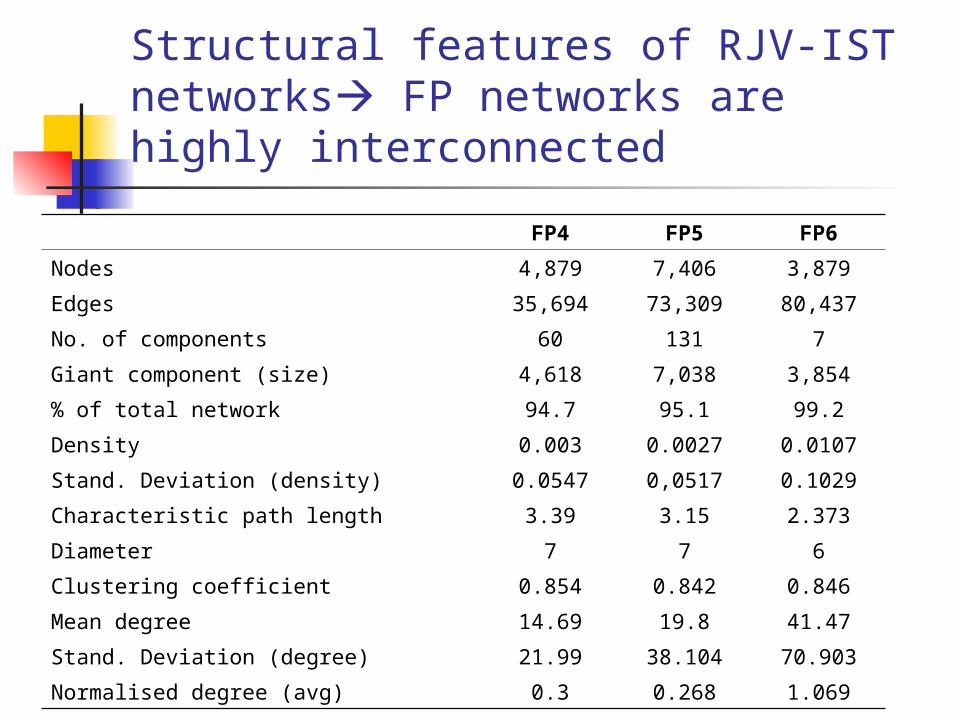
Structural features of RJV-IST networks FP networks are highly interconnected
FP4 FP5 FP6
Nodes 4,879 7,406 3,879
Edges 35,694 73,309 80,437
No. of components 60 131 7
Giant component (size) 4,618 7,038 3,854
% of total network 94.7 95.1 99.2
Density 0.003 0.0027 0.0107
Stand. Deviation (density) 0.0547 0,0517 0.1029
Characteristic path length 3.39 3.15 2.373
Diameter 7 7 6
Clustering coefficient 0.854 0.842 0.846
Mean degree 14.69 19.8 41.47
Stand. Deviation (degree) 21.99 38.104 70.903
Normalised degree (avg) 0.3 0.268 1.069
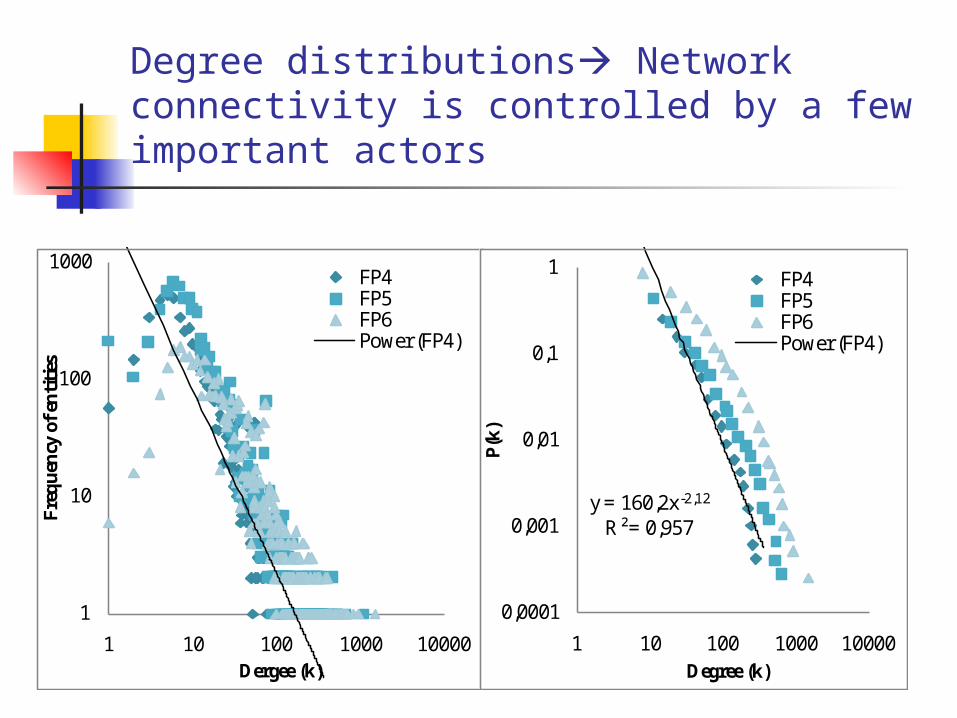
Degree distributions Network connectivity is controlled by a few important actors
1
10
100
1000
1 10 100 1000 10000
Fre
qu
ency
of
enti
ties
Dergee (k)
FP4FP5FP6Power (FP4)
y = 160,2x-2,12
R² = 0,957
0,0001
0,001
0,01
0,1
1
1 10 100 1000 10000
P(k
)
Degree (k)
FP4FP5FP6Power (FP4)

Preferential attachment Highly connected nodes become even more connected through time
0
1
2
3
4
5
6
7
rela
tive
pro
babi
lity
of
new
lin
ks
No of previous links
FP5
0
0,5
1
1,5
2
rela
tive
pro
babi
lity
of
new
lin
ks
No of previous links
FP6

Network resilience The network is vulnerable to the removal of the most connected nodes
0%
20%
40%
60%
80%
100%
0% 2% 4% 6% 8% 10%
Siz
e of
gia
nt
com
po
nen
t
f
FP4
0%
20%
40%
60%
80%
100%
0% 2% 4% 6% 8% 10%
Siz
e of
gia
nt
com
po
nen
t
f
FP5
0%
20%
40%
60%
80%
100%
0% 2% 4% 6% 8% 10%
Siz
e of
gia
nt
com
po
nen
t
f
FP6
0
1
2
3
4
5
6
0% 2% 4% 6% 8% 10%C
har
acte
rist
ic p
ath l
ength
f
Random NodesMost connected nodes
0
3
6
9
12
15
0% 2% 4% 6% 8% 10%
Ch
arac
teri
stc
pat
h l
eng
th
f
Random nodesMost connected nodes
0
2
4
6
8
10
0% 2% 4% 6% 8% 10%
Ch
arac
teri
sticp
ath
len
gth
f
Random nodes
Most connected nodes

Small-world propertyThe network under study seems to be an effective mechanism for the diffusion and exchange of technological knowledge
FP NetworkCharacteristic path length
Clustering coefficient
4thActual 3.39 0.854
Random 3.164 0.003
5thActual 3.15 0.842
Random 2.984 0.003
6thActual 2.373 0.846
Random 2.218 0.011
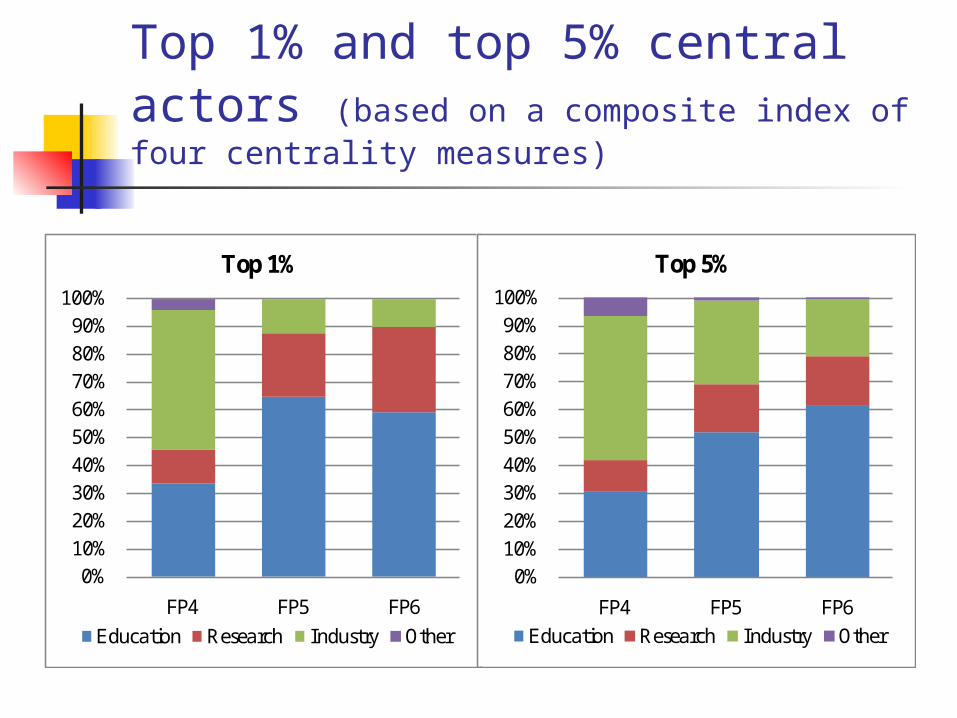
Top 1% and top 5% central actors (based on a composite index of four centrality measures)
0%
10%
20%
30%
40%
50%60%
70%
80%
90%
100%
FP4 FP5 FP6
Top 1%
Education Research Industry Other
0%
10%
20%
30%
40%
50%
60%
70%
80%
90%
100%
FP4 FP5 FP6
Top 5%
Education Research Industry Other

Very active Greek participation in the RJV- IST networks
Country Participations % participations Entities %
entities Prime
Contractor % prime
contractors Germany 5639 15.8 2160 14.9 780 17.4 France 4559 12.8 1705 11.8 677 15.1 United Kingdom 4392 12.3 1760 12.1 610 13.6 Italy 4171 11.7 1575 10.9 569 12.7 Spain 2676 7.5 1140 7.9 421 9.4 Greece 2053 5.7 621 4.3 287 6.4 Netherlands 1550 4.3 646 4.5 225 5.0 Belgium 1485 4.2 566 3.9 248 5.5 Sweden 1049 2.9 461 3.2 94 2.1 Switzerland 950 2.7 326 2.2 20 0.4 Austria 933 2.6 399 2.8 96 2.1 Finland 834 2.3 370 2.6 62 1.4 Portugal 687 1.9 317 2.2 44 1.0 Denmark 587 1.6 288 2.0 65 1.5 Norway 571 1.6 268 1.8 64 1.4 Ireland 562 1.6 233 1.6 66 1.5 Poland 389 1.1 183 1.3 24 0.5 Israel 331 0.9 171 1.2 46 1.0 Hungary 288 0.8 137 0.9 13 0.3 Czech Republic 235 0.7 127 0.9 11 0.2 Slovenia 169 0.5 76 0.5 6 0.1 Bulgaria 137 0.4 80 0.6 1 0.0 Romania 130 0.4 84 0.6 3 0.1 United States 111 0.3 70 0.5 0 0.0 Cyprus 110 0.3 48 0.3 3 0.1 Luxembourg 94 0.3 56 0.4 15 0.3 Other 1014 2.8 638 4.4 31 0.7 Total 35706 14505 4481
So far the networks examined:
display characteristics typical for complex networks, such as scale-free distributions and small-world property
are highly-connected and robust, gaining in connectivity through the years
are dependent on a core of central actors finally, educational institutions and
research centers assume a more active and prominent role compared to firms and ‘other’ actors.
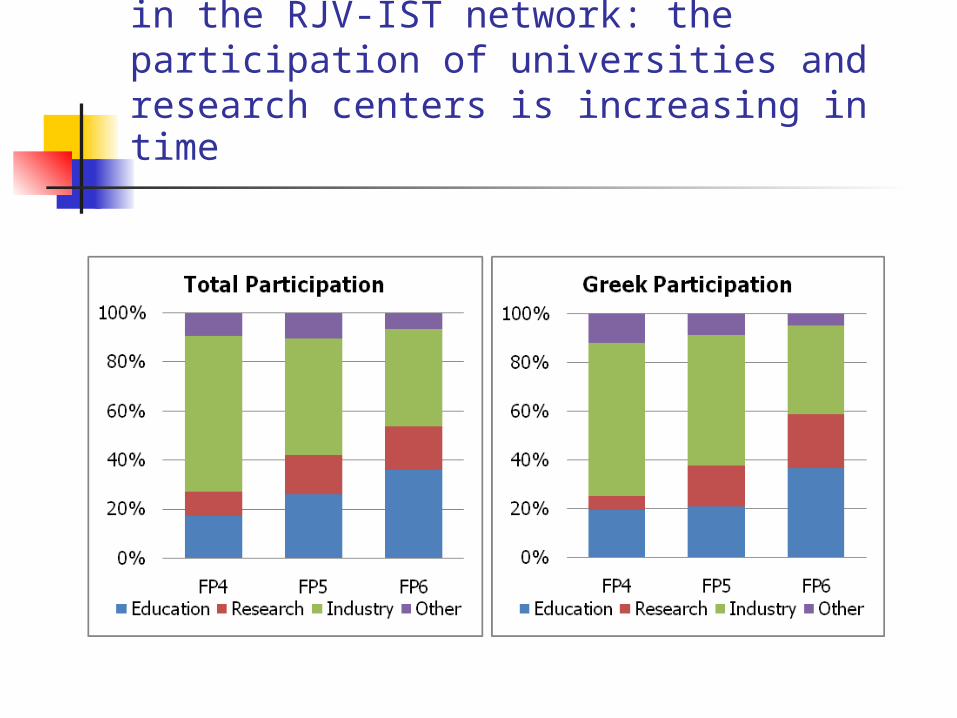
Participation by organization type in the RJV-IST network: the participation of universities and research centers is increasing in time

Greece has a central role in the RJV-IST network, based on a composite 4-dimension centrality index
Network of top 1% most central actors
Network of top 5% most central actors Country
Participations % of total
Entities % of total
Participations % of total
Entities % of total
Germany 1223 21.7 24 1.1 2196 38.9 122 5.6 France 843 18.5 14 0.8 1760 38.6 103 6.0 Italy 682 16.4 17 1.1 1500 36.0 104 6.6 United kingdom 618 14.1 18 1.0 1604 36.5 112 6.4
Greece 502 24.5 11 1.8 863 42.0 44 7.1 Spain 416 15.5 9 0.8 742 27.7 42 3.7 Belgium 367 24.7 5 0.9 552 37.2 22 3.9 Netherlands 260 16.8 8 1.2 567 36.6 35 5.4 Sweden 138 13.2 3 0.7 364 34.7 27 5.9 Austria 133 14.3 3 0.8 282 30.2 16 4.0 Finland 102 12.2 3 0.8 314 37.6 24 6.5 Portugal 54 7.9 2 0.6 212 30.9 19 6.0 Denmark 23 3.9 1 0.3 141 24.0 13 4.5 Ireland 16 2.8 1 0.4 168 29.9 18 7.7 Luxembourg 0 0 0 0.0 11 11.7 1 1.8
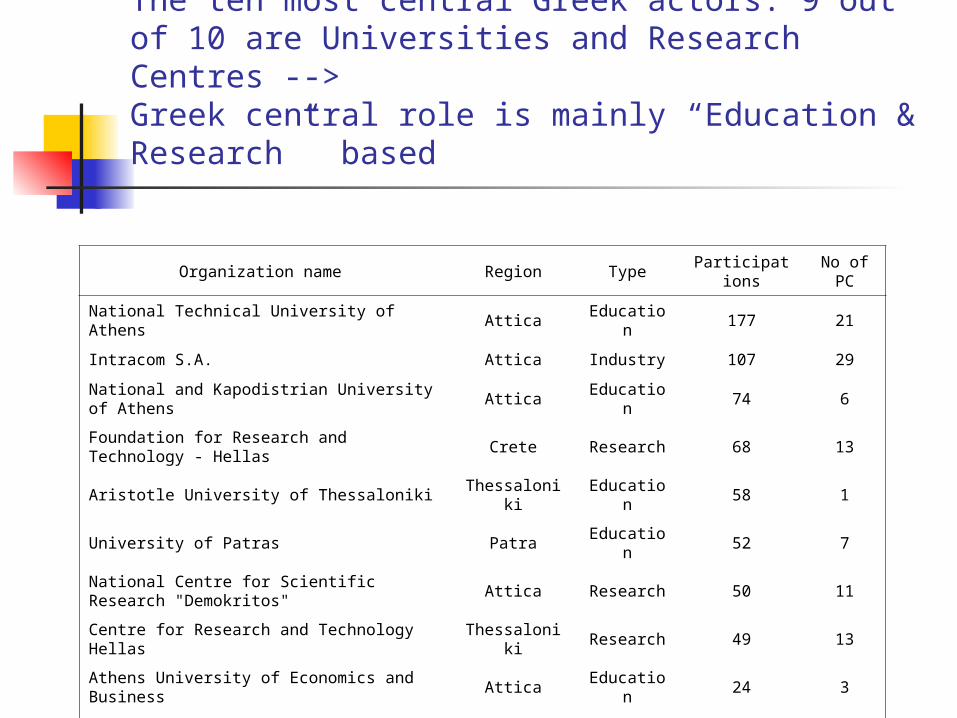
The ten most central Greek actors: 9 out of 10 are Universities and Research Centres -->Greek central role is mainly “Education & Research” based
Organization name Region TypeParticipation
sNo of
PC
National Technical University of Athens Attica Education 177 21
Intracom S.A. Attica Industry 107 29
National and Kapodistrian University of Athens
Attica Education 74 6
Foundation for Research and Technology - Hellas
Crete Research 68 13
Aristotle University of Thessaloniki Thessaloniki Education 58 1
University of Patras Patra Education 52 7
National Centre for Scientific Research "Demokritos"
Attica Research 50 11
Centre for Research and Technology Hellas Thessaloniki Research 49 13
Athens University of Economics and Business
Attica Education 24 3
Technical University of Crete Crete Education 22 1
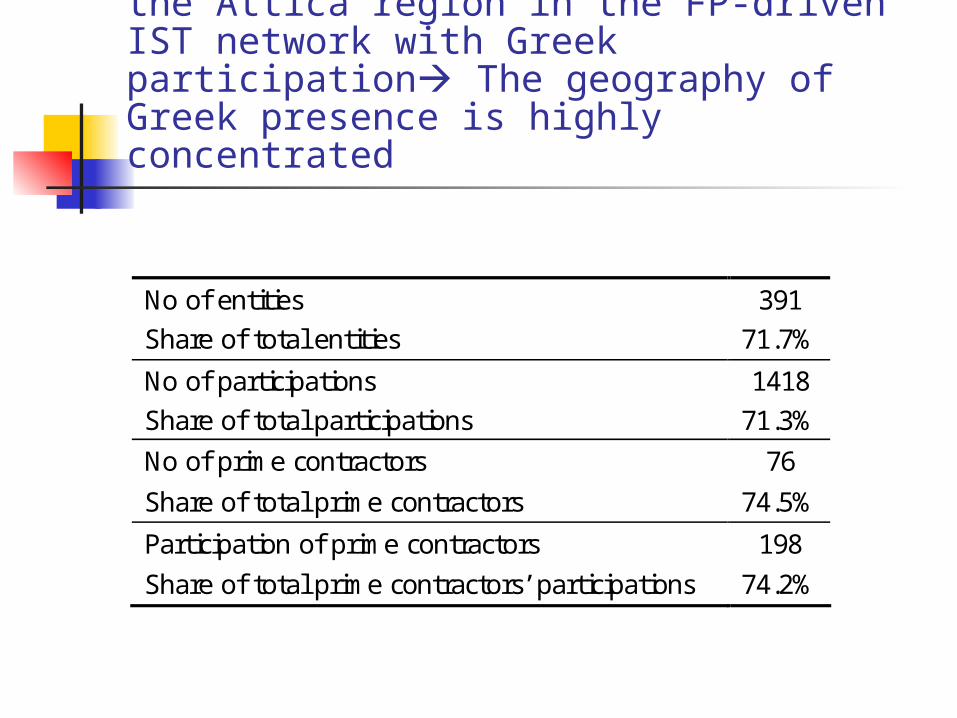
The increased presence (>70%) of the Attica region in the FP-driven IST network with Greek participation The geography of Greek presence is highly concentrated
No of entities 391
Share of total entities 71.7%
No of participations 1418
Share of total participations 71.3%
No of prime contractors 76
Share of total prime contractors 74.5%
Participation of prime contractors 198
Share of total prime contractors’ participations 74.2%
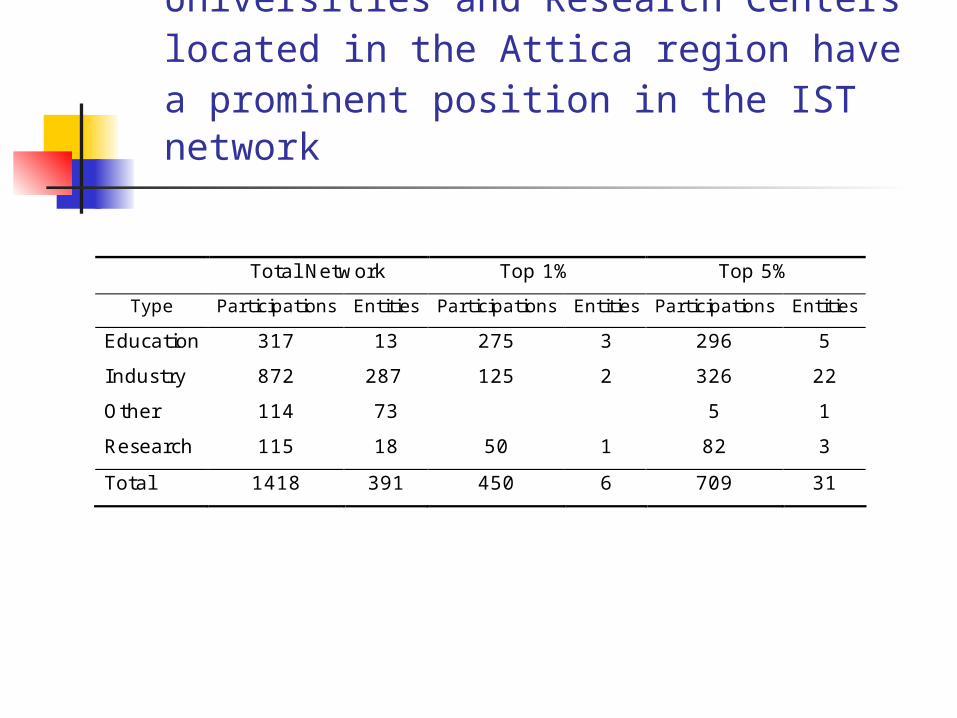
Universities and Research Centers located in the Attica region have a prominent position in the IST network
Total Network Top 1% Top 5%
Type Participations Entities Participations Entities Participations Entities
Education 317 13 275 3 296 5
Industry 872 287 125 2 326 22
Other 114 73 5 1
Research 115 18 50 1 82 3
Total 1418 391 450 6 709 31

The impact of FP-driven research networks on innovation in Greece: Evidence from case studies Mainly intangible benefits.
The direct network impact, i.e. commercial deployment, was assessed as generally less intensive or significant compared to the indirect impact (i.e. improvement of skills and new knowledge diffusion, relations and trust built between partners, access to complementary knowledge and expertise). Nevertheless indirect impact is important and could be further exploited.

Deviation of the Greek ICT sector from EU average, based on aggregate innovation measures
Greek ICT sector is deviating from EU average in all three variables measured (R&D intensity, share of market novelties in turnover, contribution to the labour productivity growth).

Why this mismatch?
The size and nature of Greek ICT firms. The creators of technological knowledge in
Greece do not generally think in terms of market opportunities exploitation.
There is a lack of a critical mass of demanding users
There is no early involvement of users The Greek environment operates in a
rather disorganized and ‘anarchic’ manner

Why this mismatch? The purchasing practices of i.e. the Public
sector- a major buyer- do not fit with the concept of intelligent customer.
The nature and the quality of entrepreneurship as measured by the educational level of new entrepreneurs and the type and knowledge intensity of ventures undertaken (Global Entrepreneurship Monitoring, 2003-2006).

How this mismatch can be overcome?
System of policies “activating knowledge” throughout the knowledge
generation and diffusion value chain, and promoting knowledge-based entrepreneurship as a
mechanism to convert research outputs into viable products.
Not just policies providing incentives for SMEs. Promote intelligent customer practices in ICT procurement
within the Public Sector. Enhancing human capital for the promotion of technology-
based entrepreneurship: Target specific groups (engineers and scientists) by enriching and broadening the engineering education curriculum (coupling “technical thinking and engineering feeling” with “market and business understanding” and managerial skills).