eu vehicle technology study: background and results of phase i · agenda 1 introduction 2 eu...
TRANSCRIPT
ICCT International Workshop on greenhouse gas reduction potential and costs of light-duty vehicle technologies
EU vehicle technology study: Background and results of Phase I
John German April 27, 2012 Brussels
Agenda
Introduction 1
EU vehicle market statistics 2
Ricardo vehicle simulations 3
FEV cost analysis Phase I 4

3
Introduction Detailed technical data for EU rulemaking Setting (cost-)effective CO2 standards requires knowledge about technical
reduction potential and associated costs Comprehensive, transparent data is needed for fact-based discussion
Requires sufficient budget to carry out vehicle simulations and detailed cost studies
Current EU budget for cars & vans studies ≈ 1 million EUR Very limited availability of staff resources
In the past relied much on industry surveys limited transparency and tendency to overstate costs for required technologies
Basic idea of ICCT project • Vehicle market is a global market with similar technologies worldwide • Make use of existing technology studies in other markets • US studies for 2017-25 LDV regulation are currently best-practice example

4
Introduction The US LDV greenhouse gas standards US 2012-16 light-duty vehicle GHG standard
– Footprint-based
– Fleet target (cars + light trucks) for 2016: 250 g/mile = 155 g/km ≈ 170 g/km (in NEDC)
– Status: adopted, phase-in began in 2012
US 2017-25 light-duty vehicle GHG standard – Footprint-based
– Fleet target (cars + light trucks) for 2025: 165 g/mile = 103 g/km ≈ 110 g/km (in NEDC) (≈ 98 g/km for cars only)
– Status: Notice of Intent, final proposal and adoption expected for 2012

5
Introduction Global comparison of LDV CO2 standards

6
Introduction Global comparison of LDV CO2 standards
EU baseline: 142!
EU 2020: 95!
US baseline: 219!
US 2025:107!
Japan baseline:131!
Japan 2020: 105!
China baseline: 185!
China 2015: 167!
90!
110!
130!
150!
170!
190!
210!
230!
250!
270!
2000! 2005! 2010! 2015! 2020! 2025!
GR
AM
S C
O2
PE
R K
ILO
ME
TE
R N
OR
MA
LIZ
ED
TO
N
ED
C T
ES
T C
YC
LE!
EU! US-LDV! Japan! China!
!"#$%&'()*+$,)-./,$-/0/1,+$.)+23'(/$0//,$+1/()-'24$56$'(1378'(.$2,&/-$67/3$,9:/+;$,&/$,)-./,$<'33$=/$32</-4$$!>#$?@$)(8$%)()8)$3'.&,A87,9$B/&'13/+$'(1378/$3'.&,A12CC/-1')3$B/&'13/+4$!D#$E((7)3$-),/$'+$1)3173),/8$7+'(.$=)+/3'(/$)1,7)3$:/-62-C)(1/$)(8$,)-./,$B)37/+4$
$$$
$$$
$$$$
$$
F4GH$)((7)339$
"4IH$)((7)339$
D4IH$)((7)339$
>H$)((7)339$

7
Introduction Technical studies for US rulemakings Underlying technical studies:
– Vehicle simulation work (Ricardo)
– Teardown engineering cost assessment (FEV)
– Weight reduction assessment (Lotus Engineering, FEV)
– Battery modeling for electric vehicles (US energy laboratory)
– Confidential business information from manufacturers
– …
3 agencies (EPA, NTHSA, CARB) Total budget for technical studies ≈ 15 million $ Total technical staff working on LDV standards ≈ 50
Links to detailed reports on methodology and results: http://www.epa.gov/otaq/climate/publications.htm#vehicletechnologies
8
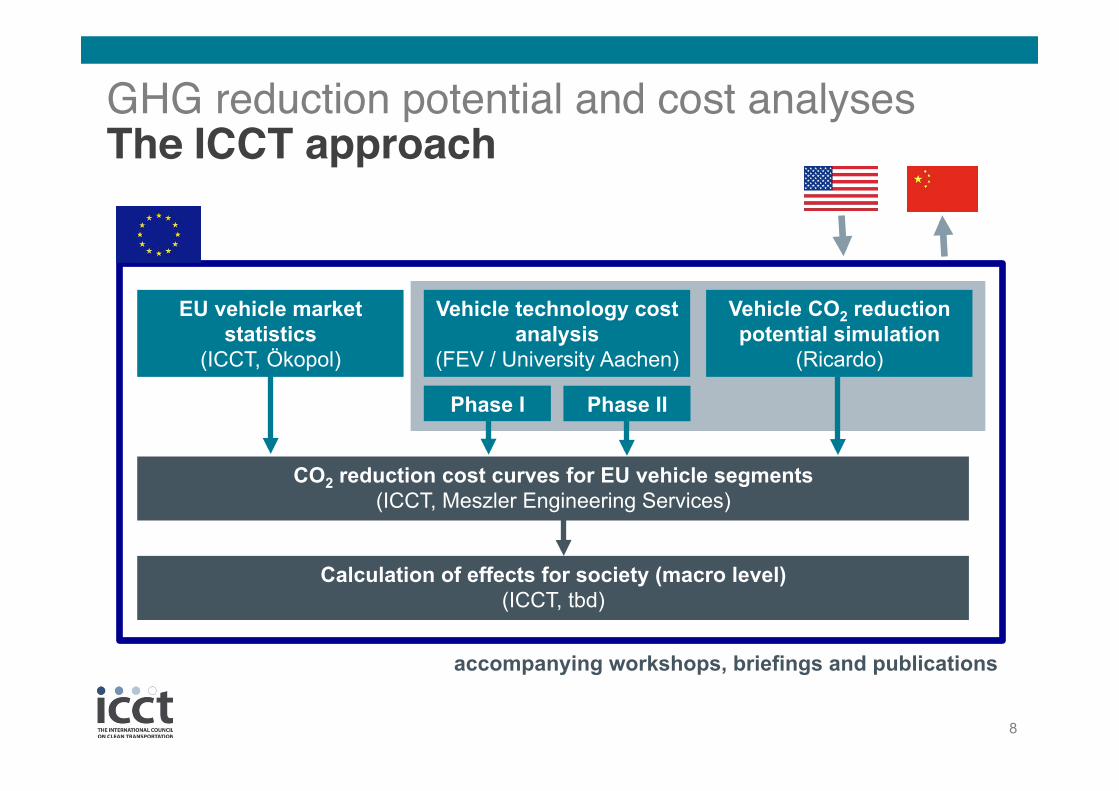
GHG reduction potential and cost analyses The ICCT approach
Vehicle technology cost analysis
(FEV / University Aachen)
Vehicle CO2 reduction potential simulation
(Ricardo)
Phase II
EU vehicle market statistics
(ICCT, Ökopol)
CO2 reduction cost curves for EU vehicle segments (ICCT, Meszler Engineering Services)
Calculation of effects for society (macro level) (ICCT, tbd)
Phase I
accompanying workshops, briefings and publications

9
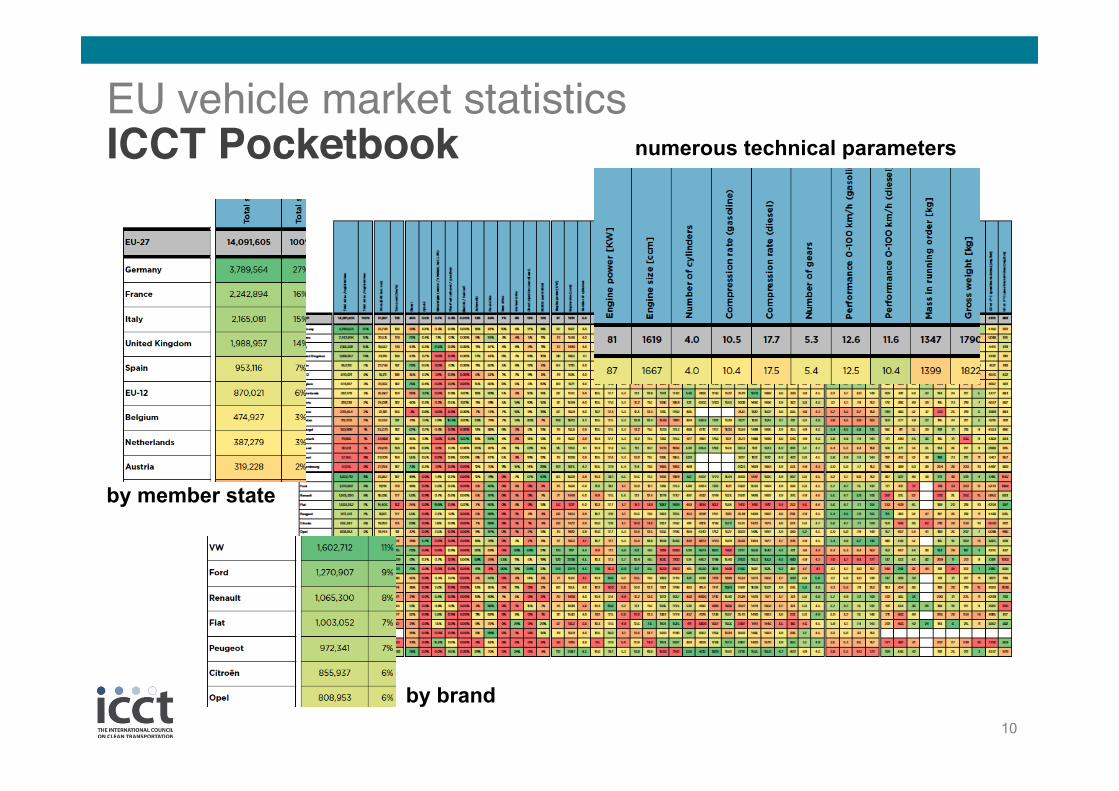
EU vehicle market statistics ICCT Pocketbook
First edition published in Jan 2012
2001-2010 EU-27 passenger cars 2009-2010 EU-27 vans
Provides data beyond official CO2 monitoring data
Data sources: Polk, KBA, VCA, Automobil Revue, manufacturers, suppliers
Update planned for summer 2012
http://www.theicct.org/european-vehicle-market-statistics 140
145
150
155
160
165
170
175
1200 1225 1250 1275 1300 1325 1350
New
pas
seng
er c
ars
– A
vera
ge C
O2 e
mis
sion
s [g
/km
]
Mass in running order [kg]
2001
2002 2003
2004 2005
2006
2007
2008
2009
2010
10
EU vehicle market statistics ICCT Pocketbook
by member state
by brand
numerous technical parameters

11
GHG reduction potential and cost analyses The ICCT approach
Vehicle technology cost analysis
(FEV / University Aachen)
Vehicle CO2 reduction potential simulation
(Ricardo)
Phase II
EU vehicle market statistics
(ICCT, Ökopol)
CO2 reduction cost curves for EU vehicle segments (ICCT, Meszler Engineering Services)
Calculation of effects for society (macro level) (ICCT, tbd)
Phase I
accompanying workshops, briefings and publications

12
Ricardo vehicle simulations How does vehicle simulation work? Principle idea:
1. Input data (engine maps, road load data, etc.) fed into software tool to calculate fuel consumption / CO2 emissions over a drive cycle
2. Software model is validated by comparing calculated results against known data for an existing vehicle model
3. Input data is changed (e.g. new engines maps) to account for future changes in technology and model is re-run

13
Ricardo vehicle simulations What is so special about the simulations? Generally accepted approach:
– To study future CO2 reduction potential, technology interactions have to be accounted for (by grouping technologies into packages) vehicle simulations takes interactions into account
– Ricardo’s vehicle simulation methodology follows closely industry-internal approach of vehicle development and was confirmed by an independent peer review: http://www.epa.gov/otaq/climate/publications.htm#vehicletechnologies
Deliverables of the Ricardo vehicle simulations project: – Report describing methodology and results
– Software tool for public use to allow users to change vehicle parameters and calculate resulting CO2 emissions themselves
– See ICCT website for details

14
Ricardo vehicle simulations Differences EU vs. US project Additional driving cycles Additional vehicle segments Additional technologies
Adapted underlying assumptions

15
Ricardo vehicle simulations Differences EU vs. US project Additional driving cycles
NEDC JC-08
FTP-75

Ricardo vehicle simulations Differences EU vs. US project Additional vehicle segments
New
A B C D E small SUV small N1 large N1
Peugeot 107
Toyota Yaris
VW Golf
Toyota Avensis
BMW 5 series
BMW X3
Renault Kangoo
Mercedes Sprinter
11% 28% 32% 11% 3% <5% ≈50% ≈50%
Toyota Yaris
Toyota Camry
Chrysler 300C
Saturn Vue
Dodge G. Caravan
New

17
Ricardo vehicle simulations Differences EU vs. US project Additional technologies
• Start-stop incl. energy-recuperation • Gasoline direct injection (DI), turbocharging and downsizing (stoichiometric) • Gasoline DI, turbocharging and downsizing (lean-stoich.) • Gasoline exhaust gas recirculation (EGR) DI turbo • Gasoline Atkinson cycle engine with cam profile switching (CPS) • Gasoline Atkinson cycle engine with digital valve actuation (DVA) • Gasoline P2 hybrid • Gasoline PowerSplit hybrid • Diesel advanced 2020+ engine • Advanced transmission technologies
(6/8-speed automatic, dual clutch transmission) • Manual transmission sensitivity analysis

18
Ricardo vehicle simulations Differences EU vs. US project Adapted underlying assumptions
– Making use of EU applicable engine maps – Future gasoline vehicles will meet California LEV III requirements
(equivalent to Euro 6+)
– Baseline diesel vehicles meet Euro 5 standard
– Future diesel vehicles will meet Euro 6+ standards
– Ricardo results do not account for weight changes; to be handled separately using provided software tool
– Blanket 3.5% improvement in fuel consumption coming from a combination of friction improvements in future engines
– Ricardo baseline vehicles to be understood as ≈2010 model year vehicles with start-stop technology implemented

B-segment (29% market, 38% diesel)
19
Ricardo vehicle simulations The baseline vehicles
Gasoline Ricardo EU-27 Ricardo EU-27
Vehicle model Toyota Yaris n/a Toyota Yaris n/a
Engine size 4 cyl., 1.5 l 4 cyl., 1.3 l 4 cyl., 1.2 l 4 cyl., 1.5 l
Engine power 82 kW 63 kW 59 kW 61 kW
Engine type PFI PFI (MS DI≈2%) n/a n/a
Vehicle weight 1,130 kg 1,090 kg 1,130 kg 1,160 kg
Transmission 6-AT MT (MS≈94%)* 6-AT MT (MS≈94%)*
Acceleration 0-100 km/h 9.9 s 13.2 s 12.2 s 13.3 s
CO2 in NEDC 128 g/km 136 g/km 108 g/km 113 g/km
Remarks Start-Stop/Reg. Euro 5 eq.
no Start-Stop Euro 4 (MS≈60%)
Start-Stop/Reg. Euro 5
no Start-Stop Euro 4 (MS≈60%)
Ricardo simulations baseline vehicle vs. EU-27 average new vehicle in 2010 Abbreviations: PFI (port fuel injection), DFI (direct fuel injection), MS (market share), AT (automatic transmission), MT (manual transmission), vehicle weight is given in mass in running order (includes 68 kg driver and 7 kg of luggage) *5-MT: 86%, 6-MT: 8%
Diesel

C-segment (32% market, 38% diesel)
20
Ricardo vehicle simulations The baseline vehicles
Gasoline Ricardo EU-27 Ricardo EU-27
Vehicle model VW Golf n/a VW Golf n/a
Engine size 4 cyl., 2.0 l 4 cyl., 1.6 l 4 cyl., 1.6 l 4 cyl., 1.7 l
Engine power 86 kW 86 kW 75 kW 83 kW
Engine type PFI PFI (MS DI≈19%) n/a n/a
Vehicle weight 1,413 kg 1,270 kg 1,413 kg 1,360 kg
Transmission 6-AT MT (MS≈91%)* 6-AT MT (MS≈91%)*
Acceleration 0-100 km/h 10.0 s 11.3 s 10.0 s 11.6 s
CO2 in NEDC 165 g/km 156 g/km 124 g/km 131 g/km
Remarks Start-Stop/Reg. Euro 5 eq.
no Start-Stop Euro 4 (MS≈60%)
Start-Stop/Reg. Euro 5
no Start-Stop Euro 4 (MS≈60%)
Ricardo simulations baseline vehicle vs. EU-27 average new vehicle in 2010 Abbreviations: PFI (port fuel injection), DFI (direct fuel injection), MS (market share), AT (automatic transmission), MT (manual transmission), vehicle weight is given in mass in running order (includes 68 kg driver and 7 kg of luggage) * MS 5-MT: 49%, 6-MT: 42%
Diesel

C-segment (32% market, 38% diesel)
21
Ricardo vehicle simulations The baseline vehicles
Gasoline Ricardo EU-27 Ricardo EU-27
Vehicle model Ford Focus n/a Ford Focus n/a
Engine size 4 cyl., 1.6 l 4 cyl., 1.6 l 4 cyl., 1.6 l 4 cyl., 1.7 l
Engine power 88 kW 86 kW 75 kW 83 kW
Engine type PFI PFI (MS DI≈19%) n/a n/a
Vehicle weight 1,257 kg 1,270 kg 1,413 kg 1,360 kg
Transmission 6-MT MT (MS≈91%)* 6-AT MT (MS≈91%)*
Acceleration 0-100 km/h --- 11.3 s 10.0 s 11.6 s
CO2 in NEDC 139 g/km 156 g/km 124 g/km 131 g/km
Remarks Start-Stop/Reg. Euro 5 eq.
no Start-Stop Euro 4 (MS≈60%)
Start-Stop/Reg. Euro 5
no Start-Stop Euro 4 (MS≈60%)
Ricardo simulations baseline vehicle vs. EU-27 average new vehicle in 2010 Abbreviations: PFI (port fuel injection), DFI (direct fuel injection), MS (market share), AT (automatic transmission), MT (manual transmission), vehicle weight is given in mass in running order (includes 68 kg driver and 7 kg of luggage) * MS 5-MT: 49%, 6-MT: 42%
Diesel
--- revised C class vehicle ---
D-segment (11% market, 80% diesel)
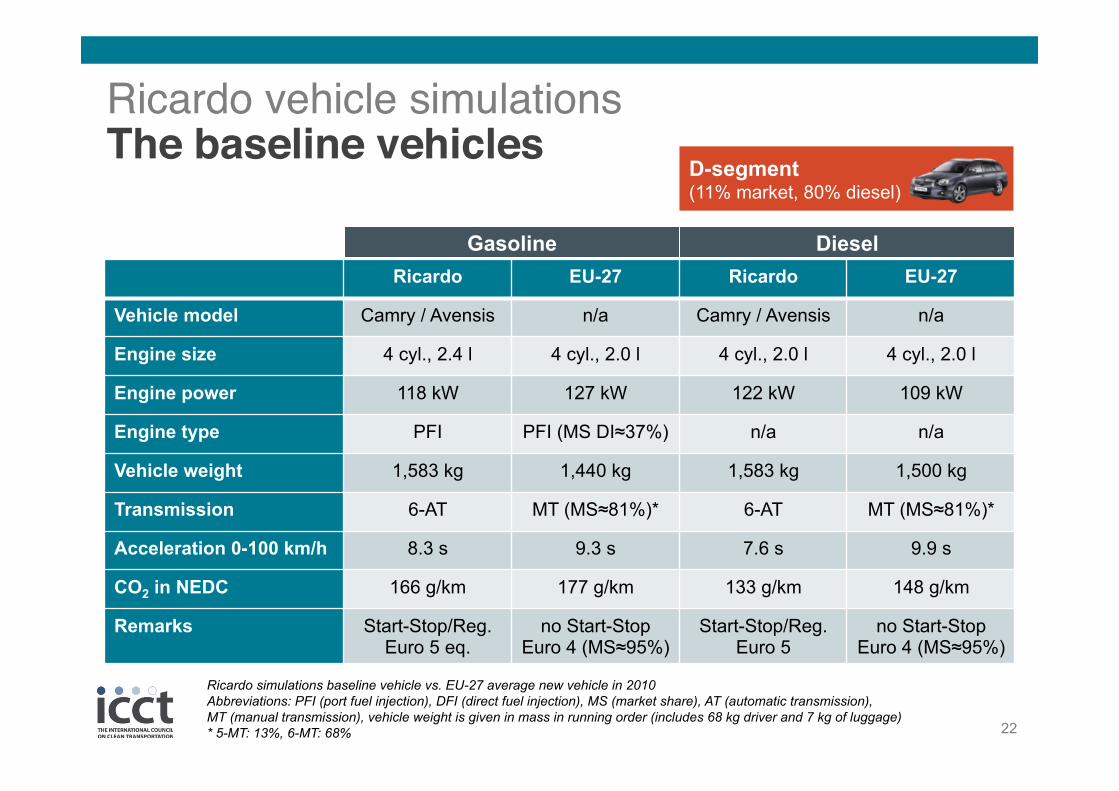
22
Ricardo vehicle simulations The baseline vehicles
Gasoline Ricardo EU-27 Ricardo EU-27
Vehicle model Camry / Avensis n/a Camry / Avensis n/a
Engine size 4 cyl., 2.4 l 4 cyl., 2.0 l 4 cyl., 2.0 l 4 cyl., 2.0 l
Engine power 118 kW 127 kW 122 kW 109 kW
Engine type PFI PFI (MS DI≈37%) n/a n/a
Vehicle weight 1,583 kg 1,440 kg 1,583 kg 1,500 kg
Transmission 6-AT MT (MS≈81%)* 6-AT MT (MS≈81%)*
Acceleration 0-100 km/h 8.3 s 9.3 s 7.6 s 9.9 s
CO2 in NEDC 166 g/km 177 g/km 133 g/km 148 g/km
Remarks Start-Stop/Reg. Euro 5 eq.
no Start-Stop Euro 4 (MS≈95%)
Start-Stop/Reg. Euro 5
no Start-Stop Euro 4 (MS≈95%)
Ricardo simulations baseline vehicle vs. EU-27 average new vehicle in 2010 Abbreviations: PFI (port fuel injection), DFI (direct fuel injection), MS (market share), AT (automatic transmission), MT (manual transmission), vehicle weight is given in mass in running order (includes 68 kg driver and 7 kg of luggage) * 5-MT: 13%, 6-MT: 68%
Diesel

There are many different technologies available to reduce vehicles’ CO2 emissions
Technical efficiency, low-CO2 options – Petroleum efficiency
• Gasoline • Diesel • Hybrid
– Alternative fuels • Compressed natural gas • Biofuels
– Electric-drive • Plug-in hybrid electric • Electric • Fuel cell electric
23 Electric
Turbo
Hybrid
Plug-in hybrid
Fuel cell
Stop-start
Advanced materials and design
Low rolling resistance tires
Aerodynamics
Efficient accessories
Direct injection
Diesel
6+ Speed
Variable valve controls
Low-friction lubricants
HFO 1234yf
Ricardo vehicle simulations Efficiency, low CO2 technologies

24
• Cools intake mixture: especially important for turbocharging
• Longer valve overlap increases low-rpm torque (fuel injected after valves close)
• Spray-guided reduces wall impingement and particulate emissions
Ricardo vehicle simulations Gasoline direct injection
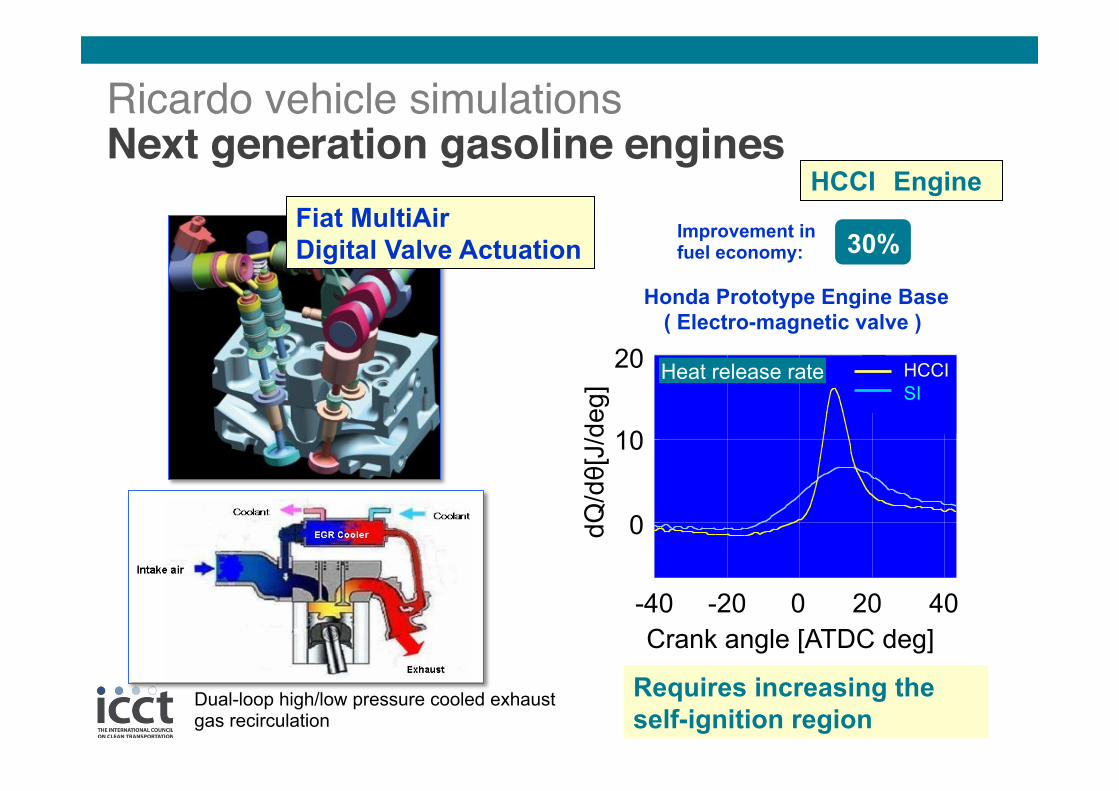
Honda Prototype Engine Base ( Electro-magnetic valve )
HCCI Engine
30% Improvement in fuel economy:
!"#$%$" &"#'"%$#("
)*+
+
*+
,+
)-+ ),+ + ,+ -+ .+/$#01%203&"%4256/%7"38
79:7;%4<:7"38
=>
!//>
Heat release rate
Crank angle [ATDC deg]
dQ/dθ[
J/de
g]
-40 0 -20 40 20
0
10
20 HCCI SI
Requires increasing the self-ignition region
Dual-loop high/low pressure cooled exhaust gas recirculation
Ricardo vehicle simulations Next generation gasoline engines
Fiat MultiAir Digital Valve Actuation

Terry Alger, Southwest Research Institute, “Clean and Cool”, Technology Today, Summer 2010
Highly dilute combustion – considerable efficiency improvement
Advanced ignition systems required
Ricardo vehicle simulations Turbo boosted-EGR systems

32 © Ricardo plc 2012 RD.12/40201.1 1 February 2012 Non-Confidential – ICCT
Ricardo developed model inputs for technology packages,
e.g., Stoichiometric, Direct Injection Turbocharged Engine
Source: Schmuck-Soldan, S., A. Königstein, and F. Westin, 2011
Efficiency map generated by Ricardo for EPA program (left) is based on benchmarking and
research data, and compares favorably to research results from 2011 General Motors
paper (right) from demonstration engine.
Source: Ricardo Analysis
27
Ricardo vehicle simulations Ricardo developed model inputs
e.g., Stoichiometric, Direct Injection Turbocharged Engine

Toyota and Ford: Optimizes city efficiency, inexpensive CVT Achilles' Heel: Fixed torque split between engine and generator
28
Hybrid TransmissionA hybrid transmission that uses Toyota’s original power split device
Hybrid TransmissionThe hybrid transmission consists of the power split device, the generator, the electric motor and the reduction gears, etc.
The power from the engine is split into two by the power split device. One of the output shafts is connected to the motor and thewheels while the other is connected to the generator. In this way, the motive power from the engine is transmitted through tworoutes, i.e., a mechanical route and an electrical route.
An electronically controlled continuouslyvariable transmission is also provided, which canchange speed while continuously varying the rpmof the engine and the rpm of the generator andthe electric motor (in relation to vehicle speed).
THS II also reduces friction loss by about30% by using ball bearings in the transmissionand low-friction.
Power Split DeviceThe power split device uses a planetary
gear. The rotational shaft of the planetary carrierinside the gear mechanism is directly linked tothe engine, and transmits the motive power tothe outer ring gear and the inner sun gear viapinion gears. The rotational shaft of the ring gearis directly linked to the motor and transmits thedrive force to the wheels, while the rotational shaftof the sun gear is directly linked to the generator.
EngineGenerator Motor
Pinion gear
Planetary gear
Sun gear (generator)
Planetary carrier (engine)
Ring gear(motor/power shaft)
-10-
Source: Hybrid Synergy Drive, Toyota Hybrid System II, Toyota Motor Corp., May 2003
• Two large motors – generator must handle part of
engine output – Motor must handle generator
plus battery output
• Cruising efficiency loss – Part of engine output always
incurs losses in generator and motor
• Power recirculation possible
Ricardo vehicle simulations Input Powersplit: Planetary gearing

EngineClutch
Transmission /Transaxle
Electric Motor
New P2 hybrid – single motor with two clutches – Pre-transmission clutch: engine decoupling and larger motor – Nissan, VW, Hyundai, BMW, and Mercedes
Achilles' Heel: Bump-starting engine – Hyundai: Separate BAS to start motor Cost – Nissan: 2nd clutch designed to slip Drivability – VW: Retained conventional torque converter Efficiency
29 VW Touareg hybrid module Nissan Fuga/M35 parallel hybrid layout
Ricardo vehicle simulations P2 hybrid system

30
Ricardo vehicle simulations Simulation results Provided in project report and accompanying software tool

Ricardo vehicle simulations Simulation results C-segment (gasoline)
only engine + transmission
31
cyl. = number of cylinders, [l] = engine displacement, inj. = engine type, [kg] = vehicle weight, trans. = transmission, [s] = acceleration 0-100 km/h, em. = emission standard, red. = CO2 reduction compared to Ricardo baseline vehicle STDI = stoichiometric turbocharged gasoline direction injection, LBDI = lean-stoichiometric turbocharged gasoline direct injection, EGR = exhaust gas recirculation, DCT = dual clutch transmission, AT = automatic transmission, MT = manual transmission, PFI = port fuel injection // more technologies in project report // note that vehicle weight is not adapted for individual packages in the original Ricardo report but was adjusted for this summary (additional weight for hybrid configuration)
cyl. [l] inj. [kg] trans. [s] [g/km] em. red.
EU-27 2010 average 4 1.6 PFI 1,270 5-MT 11.3 156 EU4 +X% Ricardo baseline (start stop) 4 1.6 PFI 1,257 6-MT 9.1 139 EU5 --- STDI (start stop + stoich. direct injection + downsizing) 3 0.8 DI 1,257 8-AT
8-DCT 9.0 9.1
101 99 EU6 -27%
-28%
LBDI (start stop + lean-stoich direct injection + downsizing) 3 0.8 DI 1,257 8-AT
8-DCT 9.0 9.1
99 96 EU6 -28%
-31%
EGBR (start stop + high load EGR DI + downsizing) 3 0.8 DI 1,257 8-AT
8-DCT 9.0 9.1
97 95 EU6 -30%
-32%
Atkinson CPS (P2) 4 1.9 DI 1,324 8-DCT 9.1 78 EU6 -44%
Exemplary results:
Ricardo vehicle simulations Simulation results C-segment (gasoline)
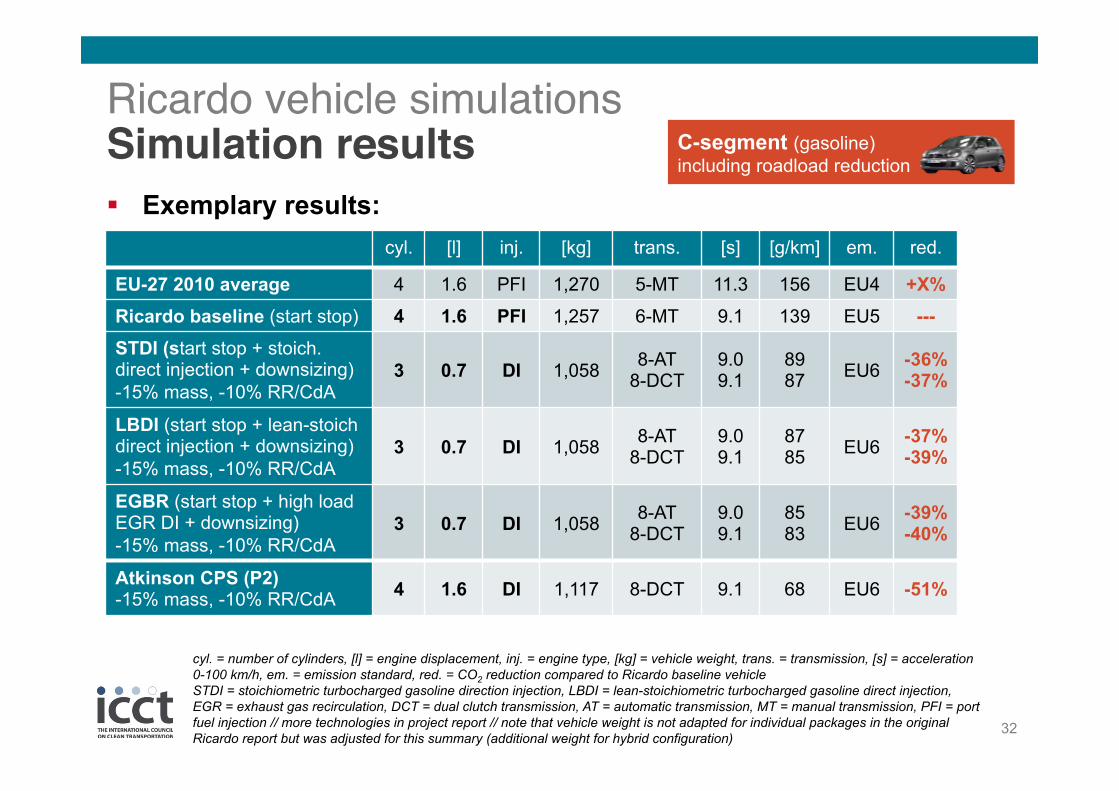
including roadload reduction
32
cyl. = number of cylinders, [l] = engine displacement, inj. = engine type, [kg] = vehicle weight, trans. = transmission, [s] = acceleration 0-100 km/h, em. = emission standard, red. = CO2 reduction compared to Ricardo baseline vehicle STDI = stoichiometric turbocharged gasoline direction injection, LBDI = lean-stoichiometric turbocharged gasoline direct injection, EGR = exhaust gas recirculation, DCT = dual clutch transmission, AT = automatic transmission, MT = manual transmission, PFI = port fuel injection // more technologies in project report // note that vehicle weight is not adapted for individual packages in the original Ricardo report but was adjusted for this summary (additional weight for hybrid configuration)
cyl. [l] inj. [kg] trans. [s] [g/km] em. red.
EU-27 2010 average 4 1.6 PFI 1,270 5-MT 11.3 156 EU4 +X% Ricardo baseline (start stop) 4 1.6 PFI 1,257 6-MT 9.1 139 EU5 --- STDI (start stop + stoich. direct injection + downsizing) -15% mass, -10% RR/CdA
3 0.7 DI 1,058 8-AT 8-DCT
9.0 9.1
89 87 EU6 -36%
-37%
LBDI (start stop + lean-stoich direct injection + downsizing) -15% mass, -10% RR/CdA
3 0.7 DI 1,058 8-AT 8-DCT
9.0 9.1
87 85 EU6 -37%
-39%
EGBR (start stop + high load EGR DI + downsizing) -15% mass, -10% RR/CdA
3 0.7 DI 1,058 8-AT 8-DCT
9.0 9.1
85 83 EU6 -39%
-40%
Atkinson CPS (P2) -15% mass, -10% RR/CdA 4 1.6 DI 1,117 8-DCT 9.1 68 EU6 -51%
Exemplary results:
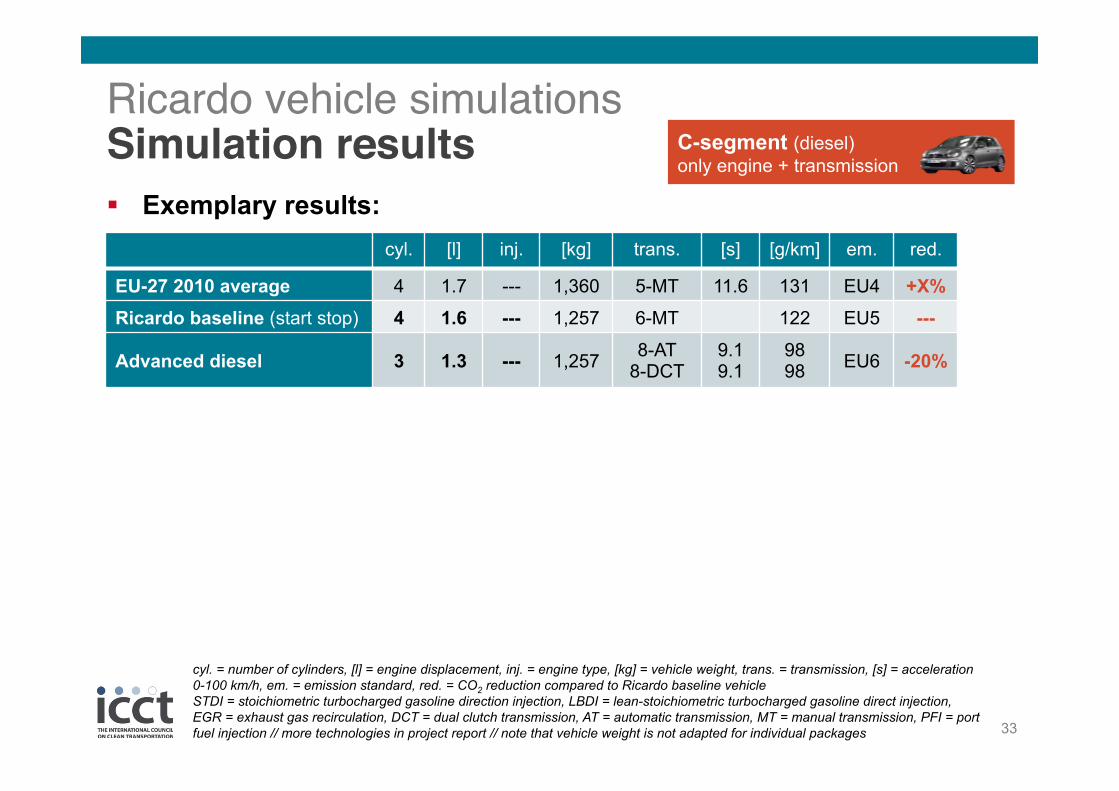
C-segment (diesel) only engine + transmission
33
Ricardo vehicle simulations Simulation results
cyl. = number of cylinders, [l] = engine displacement, inj. = engine type, [kg] = vehicle weight, trans. = transmission, [s] = acceleration 0-100 km/h, em. = emission standard, red. = CO2 reduction compared to Ricardo baseline vehicle STDI = stoichiometric turbocharged gasoline direction injection, LBDI = lean-stoichiometric turbocharged gasoline direct injection, EGR = exhaust gas recirculation, DCT = dual clutch transmission, AT = automatic transmission, MT = manual transmission, PFI = port fuel injection // more technologies in project report // note that vehicle weight is not adapted for individual packages
cyl. [l] inj. [kg] trans. [s] [g/km] em. red.
EU-27 2010 average 4 1.7 --- 1,360 5-MT 11.6 131 EU4 +X% Ricardo baseline (start stop) 4 1.6 --- 1,257 6-MT 122 EU5 ---
Advanced diesel 3 1.3 --- 1,257 8-AT 8-DCT
9.1 9.1
98 98 EU6 -20%
Exemplary results:

34
Ricardo vehicle simulations Response Surface Model software tool Tool and user guide available on ICCT website

35
Ricardo vehicle simulations Response Surface Model software tool Tool also allows Monte-Carlo simulations

36
Ricardo vehicle simulations Outlook Potential additions for the future:
– Diesel hybrid – 2-cylinder gasoline DI engine
– A-segment vehicle
– E-segment vehicle – New world harmonized driving cycle (WLTP)

37
GHG reduction potential and cost analyses The ICCT approach
Vehicle technology cost analysis
(FEV / University Aachen)
Vehicle CO2 reduction potential simulation
(Ricardo)
Phase II
EU vehicle market statistics
(ICCT, Ökopol)
CO2 reduction cost curves for EU vehicle segments (ICCT, Meszler Engineering Services)
Calculation of effects for society (macro level) (ICCT, tbd)
Phase I
accompanying workshops, briefings and publications

38
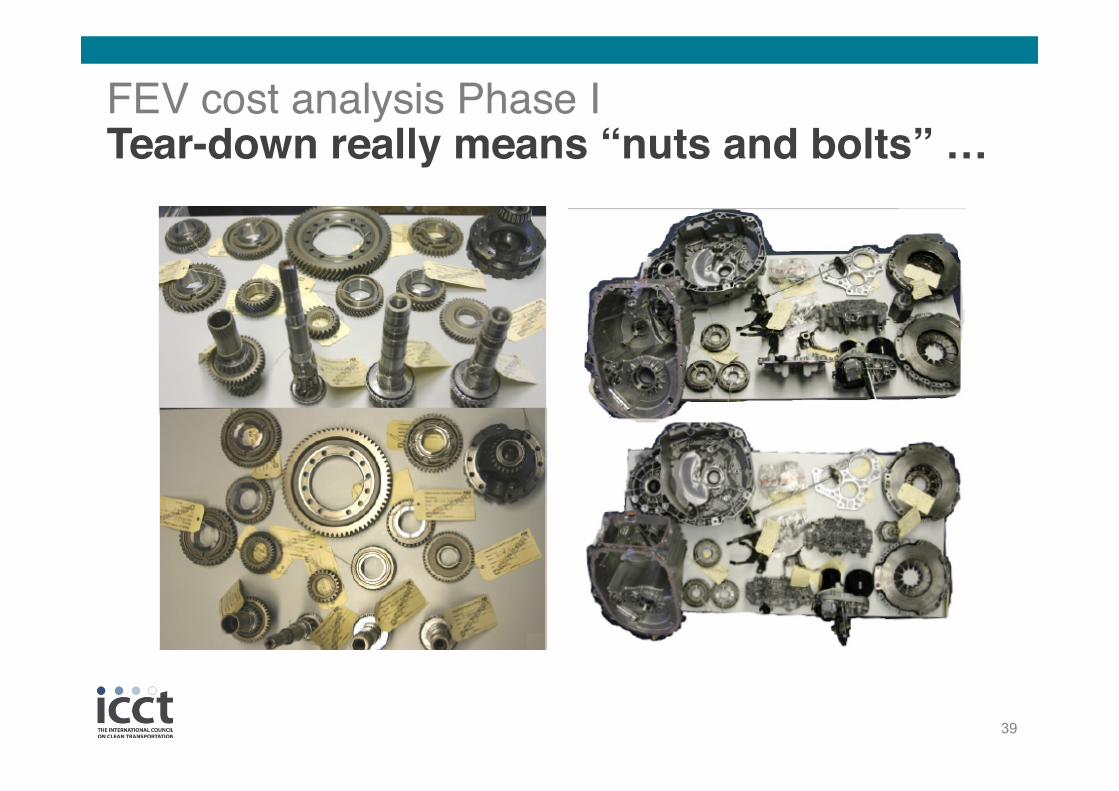
FEV cost analysis Phase I Principle idea of tear-down cost analysis
Tech
nolo
gy c
ost
Time Starting point: today’s cost at low-volume production
Target point: cost in future at mass-production
fully-learned out mass-production in future
apply learning factor X
Tech
nolo
gy c
ost
Time Starting point Target point
apply learning factor X
“Conventional” approach Tear-down approach
• Low-volume production methods very different from future mass-production
• Learning factor X applied over a long time range (introducing uncertainty)
• Cost at learned-out mass production can be determined quite accurate
• Learning factor X applied over short range only (less uncertainty)
39
FEV cost analysis Phase I Tear-down really means “nuts and bolts” …

40
FEV cost analysis Phase I General approach for tear-down analysis
VEHICLE
Engine System
Transmission System
Body System
Suspension System
etc.
Crank-Drive
Subsystem
Cylinder Block
Subsystem
Cylinder Head
Subsystem
Valvetrain Subsystem
etc.
Connecting Rod Sub-
Subsystem
Piston Sub-
Subsystem
Crankshaft Sub-
Subsystem
Flywheel Sub-
Subsystem
etc.
Rod - Connecting
Cap - Rod,
Connecting
Bearing - Rod,
Connecting
Bolt - Rod, Cap
Connecting
etc.
41
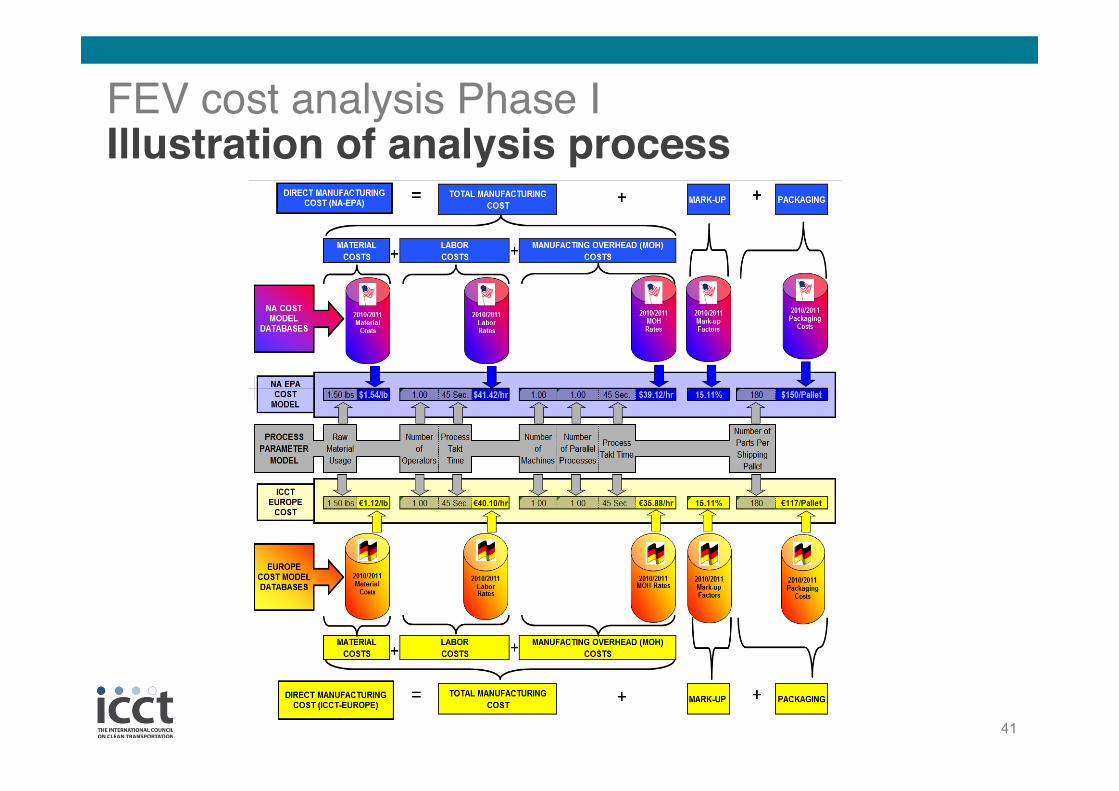
FEV cost analysis Phase I Illustration of analysis process
!
42
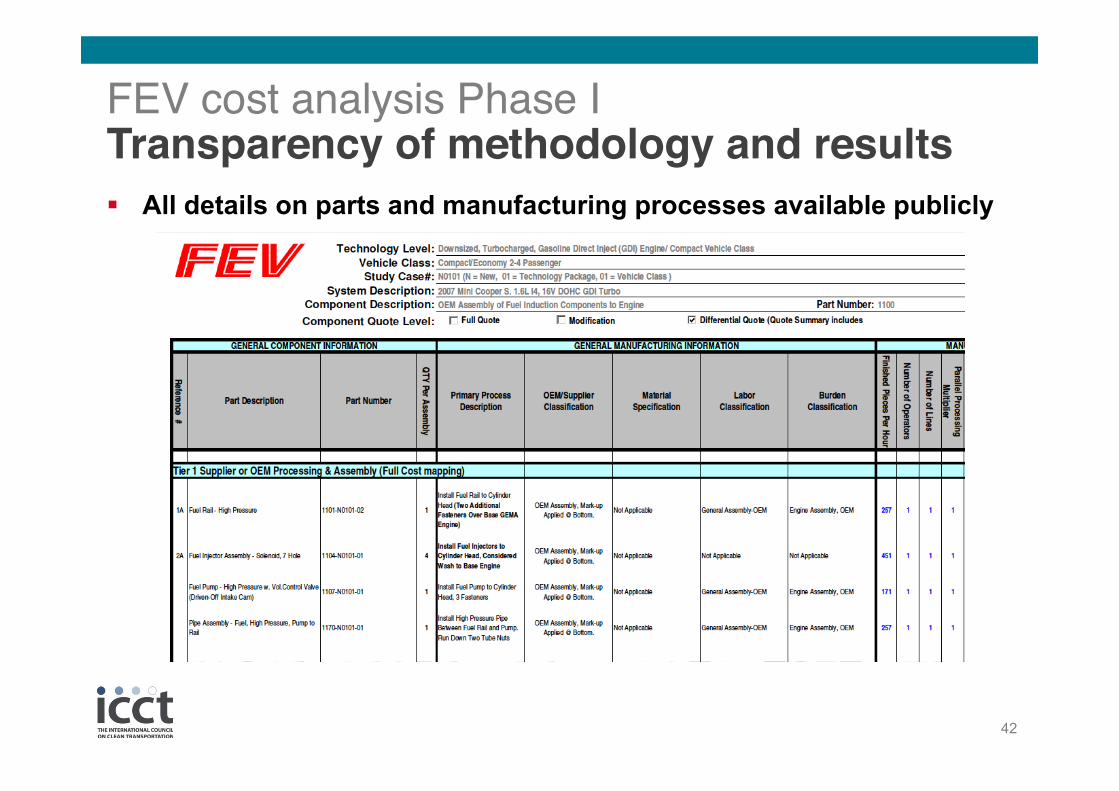
FEV cost analysis Phase I Transparency of methodology and results All details on parts and manufacturing processes available publicly

43
FEV cost analysis Phase I The tear-down approach in comparison Key advantages of the tear-down cost analysis approach:
– great level of transparency – reduced uncertainty of results by avoiding learning factors
– following closely industry-internal approach for costing
– better transferability to other regions
Downside of the approach: – very expensive
Approach has been subject to independent peer-review: – http://www.epa.gov/otaq/climate/
publications.htm#vehicletechnologies
44
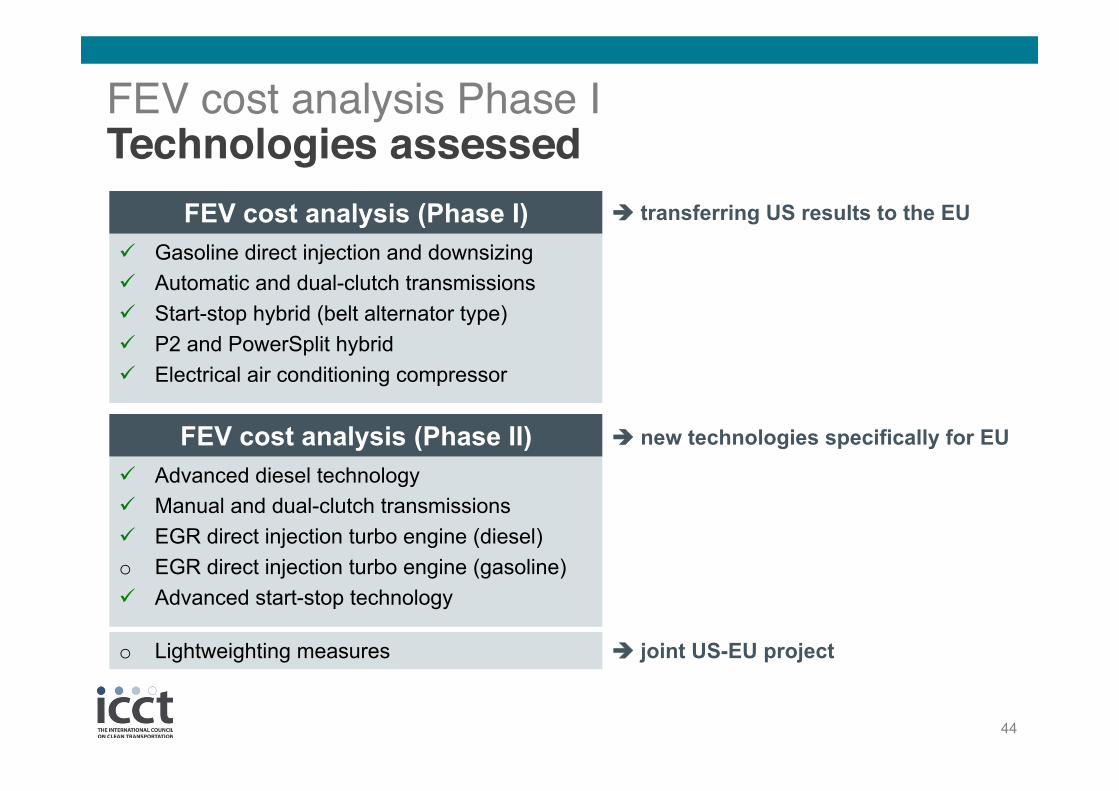
FEV cost analysis Phase I Technologies assessed
Gasoline direct injection and downsizing Automatic and dual-clutch transmissions Start-stop hybrid (belt alternator type) P2 and PowerSplit hybrid Electrical air conditioning compressor
Advanced diesel technology Manual and dual-clutch transmissions EGR direct injection turbo engine (diesel) o EGR direct injection turbo engine (gasoline) Advanced start-stop technology
FEV cost analysis (Phase I)
FEV cost analysis (Phase II)
o Lightweighting measures
transferring US results to the EU
new technologies specifically for EU
joint US-EU project

45
FEV cost analysis Phase I EU vehicle segments used for FEV study
Tech.
ID#Technology
LevelTechnology Description
New
Technology
Configuration
Downsized, turbocharged, gasoline direct
injection (GDI), dual variable valve timing
(dVVT, internal combustion engine (ICE)
Base
Technology
Configuration
Port-fuel injected, 4-valve, naturally aspirated
gasoline engine, dual variable valve timing
New
Technology
Configuration
Variable Valve Lift and Timing
(Multi-Air), Naturally Aspirated, Port Fuel
Injection Engine
Base
Technology
Configuration
Port-fuel injected, 4-valve, naturally aspirated
gasoline engine, dual variable valve timing
New
Technology
Configuration
Mild hybrid vehicle, start-stop technology with
launch assist and regenerative braking.
Base
Technology
Configuration
Conventional powertrain vehicle (ICE and
Transmission) with similar power and torque
performance attributes.
New
Technology
Configuration
Power-split hybrid electric vehicle
Base
Technology
Configuration
Conventional powertrain vehicle (ICE and
Transmission) with similar power and torque
performance attributes.
New
Technology
Configuration
Electrically driven air conditioning compressor
unit
Base
Technology
Configuration
Mechanically driven air conditioning
compressor unit
New
Technology
Configuration
P2 hybrid electric vehicle
Base
Technology
Configuration
Conventional powertrain vehicle (ICE and
Transmission) with similar power and torque
performance attributes.
New
Technology
Configuration
6-speed automatic transmission
Base
Technology
Configuration
5-speed automatic transmission
New
Technology
Configuration
6-speed wet dual clutch transmission
Base
Technology
Configuration
6-speed automatic transmission
New
Technology
Configuration
8-speed automatic transmission
Base
Technology
Configuration
6-speed automatic transmission
New
Technology
Configuration
8-speed wet dual clutch transmission
Base
Technology
Configuration
6-speed wet dual clutch transmission
Notes:
12
10
09
08
07
06
05
04
01
1.6-2.0
VW Polo,
Ford Fiesta
1.2-1.4
VW Golf
Ford Focus
VW Passat
BMW 3 Series
1.4-1.6
2,390
100
108
Subcompact car typically
powered by an inline 4
cylinder engine, naturally
aspirated, port fuel injection,
5-speed manual
transmission (MT).
Powertrain - Vehicle Class
Summary Matrix (P-VCSM)
1.2-3.0 3.0-5.5
A small or mid-sized sports-
utility or cross-over vehicle,
or a small-midsize SUV, or
a Mini Van powered by a 4
cylinder turbocharged
engine, direct fuel injection,
6-speed MT or AT & 7 DCT.
Large sports-utility vehicles,
typically powered by a 8
cylinder naturally aspirated
engine, direct fuel injection,
! 6-speed AT.
VW Tiguan
BMW X1/X3
VW Touareg
BMW X5/X6
A midsize passenger car
typically powered by a 4
cylinder turbocharged, direct
fuel injection, 6-speed MT
and AT or 7-speed DCT,
Start/Stop system.
A midsize or large
passenger car typically
powered by 4 and 6
cylinder turbocharged, direct
fuel injection, 6-speed MT or
! 6 speed AT.
2.0-3.0
VW Sharan
BMW 5 Series
3,749
234
237
16
Compact or small car
typically powered by an
inline 4 cylinder engine,
naturally aspirated, port fuel
injection, 6-speed manual
transmission or 7-speed
dual clutch transmission
(DCT).
02
Vehicle Category Example
Typical Engine Size Range (Liters)
Ave. Curb Weight (lb)(1)
Ave. Power (hp)(1)
Ave. Torque (lb*ft)(1)
Weight-to-Power Ratio (lb/hp)
European Vehicle Segments
00 01 02 03 05 06
2,803
121
132
23
157
174
2124
(1) Bases on 2010/2011 OEM published vehicle data (averages are not sales weighted)
4,867
364
362
13
3,505
178
195
20
3,299
1.6L, I4, 4V, DOHC,
Turbo, GDI, dVVT, ICE
2.4L, I4, 4V, DOHC, NA,
PFI, dVVT, ICE
2.0L, I4, 4V, DOHC,
Turbo, GDI, dVVT, ICE
3.0L, V6, 4V, DOHC, NA,
PFI, dVVT, ICE
3.5L V6, 4V, DOHC,
Turbo, GDI, dVVT, ICE
5.4L, V8, 3V, SOHC, NA,
PFI, sVVT, ICE
1.4L, I4, 4V-MultiAir,
SOHC, NA, PFI, ICE
1.4L, I4, 4V, DOHC, NA,
PFI, dVVT, ICE
2007 Saturn Vue
Greenline Start-Stop BAS
Technology
2007 Saturn Vue
Conventional Powertrain
2010 Ford Fusion Power-
Split Cost Models Updated
for Europe Compact/Small
Vehicle Segment HEV
Parameters
2010 Ford Fusion Power-
Split Cost Models Updated
for Europe Subcompact
Vehicle Segment HEV
Parameters
2010 Ford Fusion Power-
Split Cost Models Updated
for Europe Midsize/Large
Vehicle Segment HEV
Parameters
2010 Ford Fusion Power-
Split Cost Models
Converted to Europe P2
HEV Subcompact
Configuration
2010 Ford Fusion Power-
Split Cost Models
Converted to Europe P2
HEV Compact/Small
Configuration
2010 Ford Fusion Power-
Split Cost Models
Converted to Europe P2
HEV Midsize Configuration
2010 Ford Fusion Power-
Split Cost Models
Converted to Europe P2
HEV Midsize/Large
Configuration
2010 Ford Fusion Power-
Split Cost Models
Converted to Europe P2
HEV Small/Midsize
COV/SUV Configuration
2010 Ford Fusion Power-
Split Cost Models
Converted to Europe P2
HEV Large SUV
Configuration
2007 Toyota 6-Speed
FWD AT (U660E)
2005 Toyota 6-Speed
FWD AT (U151E)
2009 VW 6-Speed FWD
Wet DCT (DQ250)
2007 Toyota 6-Speed AT
FWD (U660E)
2010 ZF 8-Speed RWD
AT (8HP70)
2009 ZF 6-Speed RWD AT
(6HP28)
8-Speed FWD Wet DCT
concept based on DQ250
2009 VW 6-Speed FWD
Wet DCT (DQ250)
Veh. ID#
= Custom Models, Single Vehicle Segment
= Scaleable Models, Multiple Vehicle Segments and
Technologies Modifications relative to Custom Model
= Scaleable Models, Multiple Vehicle Segments
= Custom Models, Single Vehicle Segment Result
Scaled to Alternative Vehicle Segments
2010 Ford Fusion Power-
Split Cost Models Updated
for Europe Midsize Vehicle
Segment HEV Parameters
2010 Ford Fusion Power-
Split Cost Models Updated
for Europe Small/Mid
COV/SUV Segment HEV
Parameters
1.2L, I4, 4V, DOHC,
Turbo, GDI, dVVT, ICE
1.6L, I4, 4V, DOHC, NA,
PFI, dVVT, ICE
1.0L, I3, 4V, DOHC,
Turbo, GDI, dVVT, ICE
1.4L, I4, 4V, DOHC, NA,
PFI, dVVT, ICE
2010 Ford Fusion AC
Compressor Models
Updated for Europe
Compact/Small Vehicle
Segment HEV Parameters
2010 Ford Fusion AC
Compressor Models
Updated for Europe
Subcompact Vehicle
Segment HEV Parameters
2010 Ford Fusion AC
Compressor Cost Models
Updated for Europe
Midsize/Large Vehicle
Segment HEV Parameters
2010 Ford Fusion AC
Compressor Cost Models
Updated for Europe
Midsize Vehicle Segment
HEV Parameters
2010 Ford Fusion AC
Compressor Cost Models
Updated for Europe
Small/Mid COV/SUV
Segment HEV Parameters

46
FEV cost analysis Phase I Key assumptions Cost structure timeframe (labor rates, material costs, etc.): 2010
Direct manufacturing costs = cost of components and assembly to the OEM
Indirect manufacturing costs includes: OEM corporate overhead (sales, marketing, warranty, profit, etc.), OEM engineering, design, and testing costs (internal and external), OEM owned tooling
OEM manufacturing location: Germany
Supplier manufacturing location: Germany
Annual capacity planning volume: 450,000 units

47
FEV cost analysis Phase I Germany as manufacturing base for study
Approach to meet European average Consideration of German labor
costs as representative of Western European conditions
Labor cost in Europe
1 to 10 €/h 10 to 20 €/h 25 to 30 €/h 30 €/h and more
Definition of one percent relation between German labor costs and an average of Eastern European countries
Sensitivity analysis for manufacturing base located in Eastern Europe
48
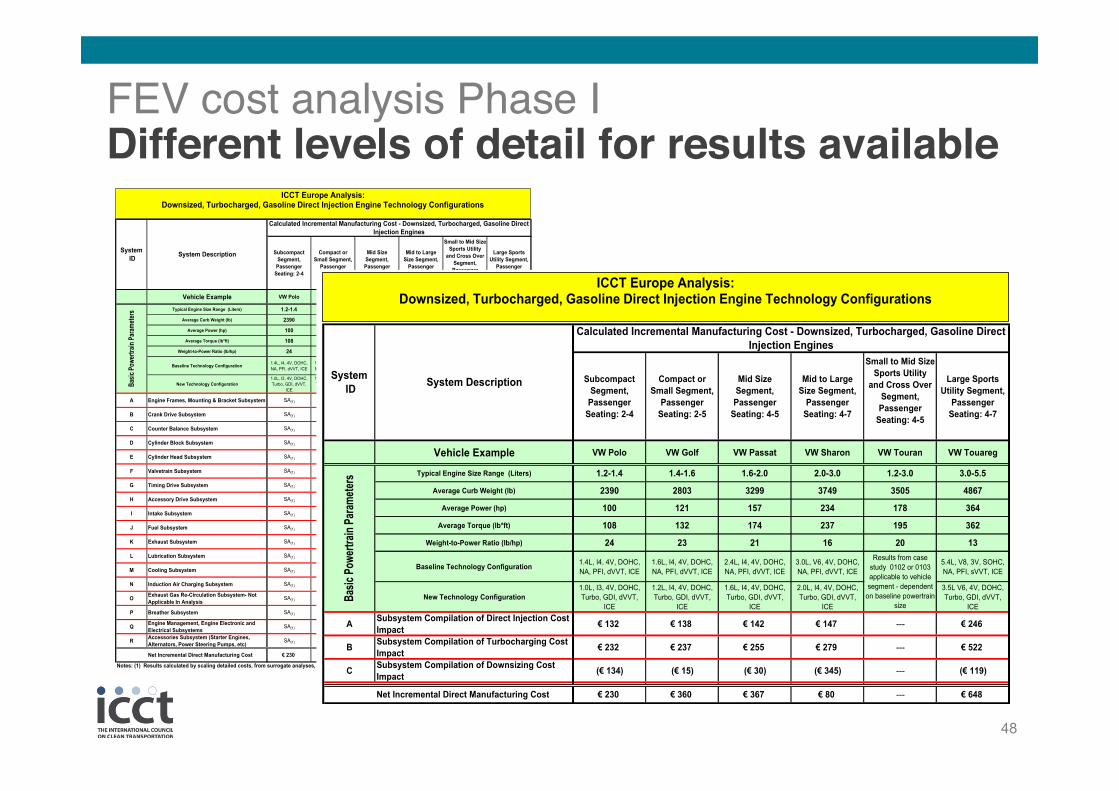
FEV cost analysis Phase I Different levels of detail for results available
Subcompact
Segment,
Passenger
Seating: 2-4
Compact or
Small Segment,
Passenger
Seating: 2-5
Mid Size
Segment,
Passenger
Seating: 4-5
Mid to Large
Size Segment,
Passenger
Seating: 4-7
Small to Mid Size
Sports Utility
and Cross Over
Segment,
Passenger
Seating: 4-5
Large Sports
Utility Segment,
Passenger
Seating: 4-7
Vehicle Example VW Polo VW Golf VW Passat VW Sharon VW Touran VW Touareg
Typical Engine Size Range (Liters) 1.2-1.4 1.4-1.6 1.6-2.0 2.0-3.0 1.2-3.0 3.0-5.5
Average Curb Weight (lb) 2390 2803 3299 3749 3505 4867
Average Power (hp) 100 121 157 234 178 364
Average Torque (lb*ft) 108 132 174 237 195 362
Weight-to-Power Ratio (lb/hp) 24 23 21 16 20 13
Baseline Technology Configuration1.4L, I4, 4V, DOHC,
NA, PFI, dVVT, ICE
1.6L, I4, 4V, DOHC,
NA, PFI, dVVT, ICE
2.4L, I4, 4V, DOHC,
NA, PFI, dVVT, ICE
3.0L, V6, 4V, DOHC,
NA, PFI, dVVT, ICE
5.4L, V8, 3V, SOHC,
NA, PFI, sVVT, ICE
New Technology Configuration
1.0L, I3, 4V, DOHC,
Turbo, GDI, dVVT,
ICE
1.2L, I4, 4V, DOHC,
Turbo, GDI, dVVT,
ICE
1.6L, I4, 4V, DOHC,
Turbo, GDI, dVVT,
ICE
2.0L, I4, 4V, DOHC,
Turbo, GDI, dVVT,
ICE
3.5L V6, 4V, DOHC,
Turbo, GDI, dVVT,
ICE
A Engine Frames, Mounting & Bracket Subsystem SA(1) SA(1) ! 0 ! 0 --- ! 0
B Crank Drive Subsystem SA(1) SA(1) ! 1 (! 25) --- (! 19)
C Counter Balance Subsystem SA(1) SA(1) (! 27) ! 28 --- ! 0
D Cylinder Block Subsystem SA(1) SA(1) (! 4) ! 16 --- ! 32
E Cylinder Head Subsystem SA(1) SA(1) ! 6 (! 108) --- (! 1)
F Valvetrain Subsystem SA(1) SA(1) ! 7 (! 86) --- ! 5
G Timing Drive Subsystem SA(1) SA(1) ! 1 (! 45) --- (! 9)
H Accessory Drive Subsystem SA(1) SA(1) ! 0 ! 5 --- ! 8
I Intake Subsystem SA(1) SA(1) (! 11) (! 23) --- (! 27)
J Fuel Subsystem SA(1) SA(1) ! 67 ! 59 --- ! 86
K Exhaust Subsystem SA(1) SA(1) ! 26 (! 22) --- ! 44
L Lubrication Subsystem SA(1) SA(1) ! 24 (! 9) --- ! 74
M Cooling Subsystem SA(1) SA(1) ! 27 ! 29 --- ! 37
N Induction Air Charging Subsystem SA(1) SA(1) ! 193 ! 209 --- ! 331
OExhaust Gas Re-Circulation Subsystem- Not
Applicable In AnalysisSA(1) SA(1) ! 0 ! 0 --- ! 0
P Breather Subsystem SA(1) SA(1) ! 3 ! 13 --- ! 24
QEngine Management, Engine Electronic and
Electrical SubsystemsSA(1) SA(1) ! 40 ! 26 --- ! 49
RAccessories Subsystem (Starter Engines,
Alternators, Power Steering Pumps, etc)SA(1) SA(1) ! 12 ! 12 --- ! 14
Net Incremental Direct Manufacturing Cost ! 230 ! 360 ! 367 ! 80 --- ! 648
Notes: (1) Results calculated by scaling detailed costs, from surrogate analyses, at subsystem compilation levels (SA = Scaled Analysis)
System
IDSystem Description
Calculated Incremental Manufacturing Cost - Downsized, Turbocharged, Gasoline Direct
Injection Engines
Bas
ic P
ower
trai
n P
aram
eter
s
Results from case
study 0102 or 0103
applicable to vehicle
segment - dependent
on baseline powertrain
size
ICCT Europe Analysis: Downsized, Turbocharged, Gasoline Direct Injection Engine Technology Configurations
Subcompact
Segment,
Passenger
Seating: 2-4
Compact or
Small Segment,
Passenger
Seating: 2-5
Mid Size
Segment,
Passenger
Seating: 4-5
Mid to Large
Size Segment,
Passenger
Seating: 4-7
Small to Mid Size
Sports Utility
and Cross Over
Segment,
Passenger
Seating: 4-5
Large Sports
Utility Segment,
Passenger
Seating: 4-7
Vehicle Example VW Polo VW Golf VW Passat VW Sharon VW Touran VW Touareg
Typical Engine Size Range (Liters) 1.2-1.4 1.4-1.6 1.6-2.0 2.0-3.0 1.2-3.0 3.0-5.5
Average Curb Weight (lb) 2390 2803 3299 3749 3505 4867
Average Power (hp) 100 121 157 234 178 364
Average Torque (lb*ft) 108 132 174 237 195 362
Weight-to-Power Ratio (lb/hp) 24 23 21 16 20 13
Baseline Technology Configuration1.4L, I4, 4V, DOHC,
NA, PFI, dVVT, ICE
1.6L, I4, 4V, DOHC,
NA, PFI, dVVT, ICE
2.4L, I4, 4V, DOHC,
NA, PFI, dVVT, ICE
3.0L, V6, 4V, DOHC,
NA, PFI, dVVT, ICE
5.4L, V8, 3V, SOHC,
NA, PFI, sVVT, ICE
New Technology Configuration
1.0L, I3, 4V, DOHC,
Turbo, GDI, dVVT,
ICE
1.2L, I4, 4V, DOHC,
Turbo, GDI, dVVT,
ICE
1.6L, I4, 4V, DOHC,
Turbo, GDI, dVVT,
ICE
2.0L, I4, 4V, DOHC,
Turbo, GDI, dVVT,
ICE
3.5L V6, 4V, DOHC,
Turbo, GDI, dVVT,
ICE
ASubsystem Compilation of Direct Injection Cost
Impact! 132 ! 138 ! 142 ! 147 --- ! 246
BSubsystem Compilation of Turbocharging Cost
Impact! 232 ! 237 ! 255 ! 279 --- ! 522
CSubsystem Compilation of Downsizing Cost
Impact(! 134) (! 15) (! 30) (! 345) --- (! 119)
Net Incremental Direct Manufacturing Cost ! 230 ! 360 ! 367 ! 80 --- ! 648
Bas
ic P
ower
trai
n P
aram
eter
s
Results from case
study 0102 or 0103
applicable to vehicle
segment - dependent
on baseline powertrain
size
System
IDSystem Description
Calculated Incremental Manufacturing Cost - Downsized, Turbocharged, Gasoline Direct
Injection Engines
ICCT Europe Analysis: Downsized, Turbocharged, Gasoline Direct Injection Engine Technology Configurations

49
FEV cost analysis Phase I Selected results from Phase I Gasoline direct injection, turbocharging & downsizing
2012 2016 2020 2025
6 02001.4L, I4, 4V, DOHC, NA,
PFI, dVVT, ICE
1.4L, I4, 4V-MultiAir,
SOHC, NA, PFI, ICE Subcompact VW Polo ! 107 ! 159 ! 145 ! 126 ! 117
! 194 ! 123 ! 89
! 946 ! 854 ! 726 ! 664
! 473 ! 407 ! 375
Variable Valve Timing and Lift, Fiat Multiair System
En
gin
e
Downsized, Turbocharged, Gasoline Direct Injection Internal Combustion Engines
! 648
Midsize/Large VW Sharan ! 245
Net Incremental Manufacturing Costs
(Direct + Indirect Costs ) with Applicable
Learning Applied
! 371 ! 327 ! 267 ! 237
! 505 ! 460 ! 398 ! 367
Te
ch
no
log
y
ID
Ca
se S
tud
y #
Baseline Technology
Configuration
New Technology
Configuration
4 01033.0L, V6, 4V, DOHC, NA,
PFI, dVVT, ICE
2.0L, I4, 4V, DOHC, Turbo,
GDI, dVVT, ICE
European
Market
Segment
European
Vehicle
Segment
Example
Calculated
Incremental Direct
Manufacturing
Cost
2010/2011
Production Year
5 01065.4L, V8, 3V, SOHC, NA,
PFI, sVVT, ICE
3.5L V6, 4V, DOHC, Turbo,
GDI, dVVT, ICELarge SUV VW Touareg
! 367
! 80
3 01022.4L, I4, 4V, DOHC, NA,
PFI, dVVT, ICE
1.6L, I4, 4V, DOHC, Turbo,
GDI, dVVT, ICEMidsize VW Passat
1 0100
2 ! 360 01011.6L, I4, 4V, DOHC, NA,
PFI, dVVT, ICE
1.2L, I4, 4V, DOHC, Turbo,
GDI, dVVT, ICE
Compact/
SmallVW Golf
! 520
1.4L, I4, 4V, DOHC, NA,
PFI, dVVT, ICE
1.0L, I3, 4V, DOHC, Turbo,
GDI, dVVT, ICESubcompact VW Polo ! 230

50
FEV cost analysis Phase I Selected results from Phase I PowerSplit hybrid
2012 2016 2020 2025
Po
we
r-S
pli
t H
EV
1 0500
Subcompact car typically powered
by an inline 4 cylinder engine,
naturally aspirated, port fuel
injection, 5-speed manual
transmission (MT).
Power-split HEV
System Power: 64.6kW
ICE Power: 52.7kW
(I4 -> I3)
Traction Motor: 43.2kW
Generator: 30.3kW
Li-Ion Battery: 140V, 0.743kWh
A small or mid-sized sports-utility
or cross-over vehicle, or a small-
midsize SUV, or a Mini Van
powered by a 4 cylinder
turbocharged engine, direct fuel
injection, 6-speed MT or AT & 7
DCT.
Power-split HEV
System Power: 114.6 kW
ICE Power: 93.6 kW
(I4 -> DS I4)
Traction Motor: 76.6kW
Generator: 53.8kW
Li-Ion Battery: 199V, 1.053 kWh
6 0506
2 0501
Compact or small car typically
powered by an inline 4 cylinder
engine, naturally aspirated, port
fuel injection, 6-speed manual
transmission or 7-speed dual
clutch transmission (DCT).
Power-split HEV
System Power: 77.8kW
ICE Power: 63.6kW
(I4 - DS I4)
Traction Motor: 52.0kW
Generator: 36.5kW
Li-Ion Battery: 162V, 0.857kWh
Compact/
SmallVW Golf
A midsize passenger car typically
powered by a 4 cylinder
turbocharged, direct fuel injection,
6-speed MT and AT or 7-speed
DCT, Start/Stop system.
Power-split HEV
System Power: 101.2kW
ICE Power: 82.6 kW
(I4 -> DS I4)
Traction Motor: 67.7kW
Generator: 47.5kW
Li-Ion Battery: 188V, 0.994kWh
Midsize VW Passat
VW Polo ! 1,809
! 2,012
Subcompact
! 2,230
4 0503
A midsize or large passenger car
typically powered by 4 and 6
cylinder turbocharged, direct fuel
injection, 6-speed MT or " 6
speed AT.
Power-split HEV
System Power: 151.1 kW
ICE Power: 123.4 kW
(V6 -> I4)
Traction Motor: 101kW
Generator: 70.9kW
Li-Ion Battery: 211V, 1.118kWh
Midsize/Large VW Sharan ! 2,215
3 0502
Large sports-utility vehicles,
typically powered by a 8 cylinder
naturally aspirated engine, direct
fuel injection, " 6-speed AT.
n/a Large SUV VW Touareg ---
5 0505Small/Midsize
SUV/COVVW Tiguan ! 2,336
! 4,555 ! 3,506 ! 2,624 ! 2,158
European
Vehicle
Segment
Example
Calculated
Incremental
Direct
Manufacturing
Cost
2010/2011
Production
Year
! 5,034 ! 3,883 ! 2,908 ! 2,397
! 5,632 ! 4,331 ! 3,240 ! 2,663
! 5,802 ! 4,410 ! 3,282 ! 2,671
! 5,891 ! 4,532 ! 3,391 ! 2,788
--- --- --- ---
Te
ch
no
log
y
ID
Ca
se S
tud
y #
Baseline Technology
Configuration
New Technology
Configuration
European
Market
Segment
Net Incremental Manufacturing Costs
(Direct + Indirect Costs ) with Applicable
Learning Applied

51
FEV cost analysis Phase I Selected results from Phase I P2 hybrid
2012 2016 2020 2025
P2
HE
V
1 0700
Subcompact car typically powered
by an inline 4 cylinder engine,
naturally aspirated, port fuel
injection, 5-speed manual
transmission (MT).
P2 HEV
System Power: 64.6 kW
ICE Power: 51.7 kW
(I4 -> I3)
Traction Motor: 12.9 kW
Li-Ion Battery: 140V, 0.743kWh
Subcompact
3 0702
A midsize passenger car typically
powered by a 4 cylinder
turbocharged, direct fuel injection,
6-speed MT and AT or 7-speed
DCT, Start/Stop system.
P2 HEV
System Power: 101.2kW
ICE Power: 80.9 kW
(I4 -> DS I4)
Traction Motor: 20.23 kW
Li-Ion Battery: 188V, 0.994kWh
VW Polo ! 1,704
2 0701
Compact or small car typically
powered by an inline 4 cylinder
engine, naturally aspirated, port
fuel injection, 6-speed manual
transmission or 7-speed dual
clutch transmission (DCT).
P2 HEV
System Power: 77.8 kW
ICE Power: 62.3 kW
(I4 -> DS I4)
Traction Motor: 16 kW
Li-Ion Battery: 162V, 0.857kWh
Compact/
SmallVW Golf ! 1,915
! 2,080
4 0703
A midsize or large passenger car
typically powered by 4 and 6
cylinder turbocharged, direct fuel
injection, 6-speed MT or " 6
speed AT.
P2 HEV
System Power: 151.1 kW
ICE Power: 120.9 kW
(V6 -> I4)
Traction Motor: 30 kW
Li-Ion Battery: 211V, 1.118 kWh
Midsize/Large VW Sharan ! 1,947
A small or mid-sized sports-utility
or cross-over vehicle, or a small-
midsize SUV, or a Mini Van
powered by a 4 cylinder
turbocharged engine, direct fuel
injection, 6-speed MT or AT & 7
DCT.
P2 HEV
System Power: 114.6 kW
ICE Power: 91.7 kW
(I4 -> DS I4)
Traction Motor: 22.9 kW
Li-Ion Battery: 199V, 1.053kWh
Small/Midsize
SUV/COVVW Tiguan
Midsize VW Passat
! 2,164
6 0706
Large sports-utility vehicles,
typically powered by a 8 cylinder
naturally aspirated engine, direct
fuel injection, " 6-speed AT.
P2 HEV
System Power: 271.8kW
ICE Power: 271.8 kW
(No Change to V8)
Traction Motor: 54.3 kW
Li-Ion Battery: 269V, 1.427kWh
Large SUV VW Touareg ! 2,756
5 0705
Te
ch
no
log
y
ID
Ca
se S
tud
y #
Baseline Technology
Configuration
! 4,391 ! 3,355 ! 2,502 ! 2,045
! 4,914 ! 3,760 ! 2,806 ! 2,297
! 5,398 ! 4,115 ! 3,067 ! 2,502
! 4,023 ! 2,972 ! 2,382
! 5,621 ! 4,284 ! 3,192 ! 2,603
! 7,156 ! 5,454 ! 4,064 ! 3,316
New Technology
Configuration
European
Market
Segment
European
Vehicle
Segment
Example
Calculated
Incremental
Direct
Manufacturing
Cost
2010/2011
Production
Year
Net Incremental Manufacturing Costs
(Direct + Indirect Costs ) with Applicable
Learning Applied
! 5,382

52
Technology availability increases - and its costs decrease - over time Incremental vehicle costs and percent improvements versus MY2008 baseline Data from EPA/NHTSA 2012-2016 rulemaking and EPA/NHTSA/CARB TAR for 2020
FEV cost analysis Phase I Technology cost dropping

53
FEV cost analysis Phase I Technology evolution
!"#$%&'&()* +&,-#"* ."%"/0* 1&20*
!"#$%&
'()#*+,*-
),.-
.%/,0+1+,*-
2,%-'345-
#6."'7%,8-
9::;-<=>-=6?%#@- A&BC-D9A:&
DE::-
F#)G-=HI-J-;K-$)#- ;9&;AC- DLE9-
F#)G-=HI-J-9E-$)#- ;M&9:C- DAA:-
F#)G-=HI-J-/N-
$%%[email protected]=-9:&9AC- DQMB-
E&-@%-M&
0?66.-
)"@%R)7'-
9::;-<=>-=6?%#@- L&EC-D;A:&
DL::-
F#)G-=HI- L&EC- 2D-;A8-
I"@%R)7'-
@%-F>!-F#)G-=HI- E&MC-
2D;AE&
D99L8-
x 2 efficiency
New technology: x 2 efficiency
again
from cost increase to decrease
New technology: more efficient and
cheaper
Cost is direct manufacturing cost NRC Report is Effectiveness and lmpact of Corporate Average Fuel Economy (CAFE) Standards, 2002 Draft RIA is for NHTSA/EPA proposed standards for 2017-25 light-duty vehicles

54
FEV cost analysis Phase I P2 future improvements not in FEV analysis
VW Golf (C-class) example. Base hybrid cost: €1,915 High-power Li-ion batteries – smaller, lighter, lower cost
– Reduce battery size 48%: - €328 25% vehicle load reduction – 25% smaller motor/battery
– Battery cost: - €93 (incremental to high power battery) – Motor cost: - €40
Integrate motor into transmission & system into vehicle – Eliminate motor case: - €70 – Eliminate oil pump/filter: - €27 – Eliminate electric A/C compressor (drive A/C off motor): - €113 – Enable use of AMT instead of DCT: - €150 – Simpler integrated braking system: - €80
Total cost reduction: €900, or 47%

55
Contact details
John German Senior Fellow, Regional Lead US [email protected] Peter Mock Senior Researcher, Regional Lead EU [email protected]