euler hermes sa solvency and financial condition report ......required capital (or risk capital)...
TRANSCRIPT
Euler Hermes SA
Solvency and Financial Condition Report (SFCR)
Fiscal Year 2017
Euler Hermes SA
Avenue des Arts 56
1000 Bruxelles, Belgique
Tél. + 32 2 289 31 11
www.eulerhermes.com
Entreprise d’assurance belge agréée sous le code 418
Immatriculée au Registre des Personnes Morales (Bruxelles)
sous le n° 0403 248 596
Branches: 07,09,13,14,15,16
http://www.nbb.be/pub/app/prud/pruddata.aspx?l=fr&id=vo1
EH SA - Solvency and Financial Condition Report 2017
page 2 of 141
Contents
Contents __________________________________________________________________ 2
Summary __________________________________________________________________ 5
Business and performance ________________________________________________ 8 A.A.1. Business _________________________________________________________________ 8
Legal entity, auditor and supervisor _______________________________________________ 8 A.1.1. Group structure and qualified holdings _____________________________________________ 8 A.1.2. Material lines of business and geographical areas ____________________________________ 9 A.1.3. Significant events _____________________________________________________________ 10 A.1.4.
A.2. Underwriting Performance_________________________________________________ 11 Aggregate underwriting performance _____________________________________________ 11 A.2.1. Underwriting performance by material line of business _______________________________ 13 A.2.2. Underwriting performance by material geographical area _____________________________ 14 A.2.3.
A.3. Investment Performance __________________________________________________ 17 Income and expenses arising from investments _____________________________________ 17 A.3.1. Gains and losses recognized directly in equity ______________________________________ 19 A.3.2. Investments in securitization ____________________________________________________ 19 A.3.3.
A.4. Performance of other activities _____________________________________________ 20 A.5. Any other information ____________________________________________________ 20
System of governance ___________________________________________________ 21 B.B.1. General information on the system of governance _____________________________ 21
Structure of the system of governance ____________________________________________ 21 B.1.1. Remuneration policy___________________________________________________________ 26 B.1.2. Material transactions __________________________________________________________ 32 B.1.3.
B.2. Fit and Proper requirements _______________________________________________ 32 Description of requirements for Fit & Proper _______________________________________ 32 B.2.1. Description of processes and procedures in place ___________________________________ 34 B.2.2.
B.3. Risk management system including the Own Risk and Solvency Assessment _________ 37 Description of risk management system ___________________________________________ 37 B.3.1. Governance of the Internal Model ________________________________________________ 42 B.3.2. Description of ORSA process ____________________________________________________ 47 B.3.3.
B.4. Internal control system ___________________________________________________ 50 Description of the internal control system _________________________________________ 50 B.4.1. Implementation of Compliance Function __________________________________________ 54 B.4.2.
B.5. Internal Audit Function____________________________________________________ 58 Implementation of the Internal Audit Function _____________________________________ 58 B.5.1. Internal audit activities and processes _____________________________________________ 58 B.5.2. Independence and objectivity of the Internal Audit Function __________________________ 59 B.5.3.
B.6. Actuarial Function ________________________________________________________ 61 Implementation of the Actuarial Function _________________________________________ 61 B.6.1. Governance __________________________________________________________________ 62 B.6.2. Interfaces ___________________________________________________________________ 63 B.6.3.
B.7. Outsourcing _____________________________________________________________ 64 Implementation of the outsourcing policy _________________________________________ 64 B.7.1. Roles and responsibilities _______________________________________________________ 67 B.7.2.
B.8. Any other information ____________________________________________________ 69
Risk profile ____________________________________________________________ 70 C.C.1. Underwriting Risk ________________________________________________________ 70
Description of the measures used ________________________________________________ 70 C.1.1. Description of the risk exposure _________________________________________________ 70 C.1.2. Description of assets investment _________________________________________________ 70 C.1.3. Risk concentration ____________________________________________________________ 70 C.1.4. Risk mitigation _______________________________________________________________ 70 C.1.5.

EH SA - Solvency and Financial Condition Report 2017
page 3 of 141
Expected Profit Included in Future Premiums (EPIFP)_________________________________ 71 C.1.6. Risk sensitivity ________________________________________________________________ 71 C.1.7.
C.2. Market Risk _____________________________________________________________ 71 Description of the measures used ________________________________________________ 71 C.2.1. Description of the risk exposure _________________________________________________ 72 C.2.2. Description of assets invested ___________________________________________________ 73 C.2.3. Risk concentration ____________________________________________________________ 75 C.2.4. Risk mitigation _______________________________________________________________ 76 C.2.5. Expected profit included in future premiums _______________________________________ 76 C.2.6. Risk sensitivity ________________________________________________________________ 76 C.2.7.
C.3. Credit Risk ______________________________________________________________ 78 Description of the measures used ________________________________________________ 78 C.3.1. Description of the risk exposure _________________________________________________ 78 C.3.2. Description of assets investment _________________________________________________ 80 C.3.3. Risk concentration ____________________________________________________________ 80 C.3.4. Risk mitigation _______________________________________________________________ 80 C.3.5. Expected Profit Included in Future Premiums _______________________________________ 80 C.3.6. Risk sensitivity ________________________________________________________________ 80 C.3.7.
C.4. Liquidity Risk ____________________________________________________________ 80 Description of the measures used ________________________________________________ 80 C.4.1. Description of the risk exposure _________________________________________________ 81 C.4.2. Description of assets investment _________________________________________________ 81 C.4.3. Risk concentration ____________________________________________________________ 82 C.4.4. Risk mitigation _______________________________________________________________ 82 C.4.5. Expected Profit Included in Future Premiums _______________________________________ 82 C.4.6. Risk sensitivity ________________________________________________________________ 82 C.4.7.
C.5. Operational Risk _________________________________________________________ 83 Description of the measures used ________________________________________________ 83 C.5.1. Description of the risk exposure _________________________________________________ 84 C.5.2. Description of assets investment _________________________________________________ 84 C.5.3. Risk concentration ____________________________________________________________ 85 C.5.4. Risk mitigation _______________________________________________________________ 85 C.5.5. Expected Profit Included in Future Premiums _______________________________________ 85 C.5.6. Risk sensitivity ________________________________________________________________ 85 C.5.7.
C.6. Other material risks ______________________________________________________ 85 C.7. Any other information ____________________________________________________ 85
Valuation for solvency purposes ___________________________________________ 86 D.D.1. Assets _________________________________________________________________ 86
Valuation of assets ____________________________________________________________ 86 D.1.1. Changes to the recognition and valuation bases used or to estimations __________________ 99 D.1.2. Assumptions and judgments on the future and other major sources of estimation uncertaintyD.1.3.
99 Material financial assets ________________________________________________________ 99 D.1.4. Financial and operating leases __________________________________________________ 100 D.1.5. Material deferred tax assets ___________________________________________________ 101 D.1.6. Aggregating class of assets _____________________________________________________ 101 D.1.7.
D.2. Technical Provisions _____________________________________________________ 102 Valuation of Technical Provisions for solvency purposes _____________________________ 102 D.2.1. Level of uncertainty __________________________________________________________ 106 D.2.2. Material changes in calculation assumptions for Technical Provisions __________________ 107 D.2.3. Differences with Technical Provisions in financial statements _________________________ 107 D.2.4. Matching adjustment _________________________________________________________ 108 D.2.5. Volatility Adjustment _________________________________________________________ 108 D.2.6. Transitional risk-free interest rate-term structure __________________________________ 108 D.2.7. Transitional deduction ________________________________________________________ 108 D.2.8. Recoverable from mitigation techniques __________________________________________ 108 D.2.9.

EH SA - Solvency and Financial Condition Report 2017
page 4 of 141
D.3. Other liabilities _________________________________________________________ 109 Valuation of other liabilities ____________________________________________________ 109 D.3.1. Financial liabilities ____________________________________________________________ 114 D.3.2. Leasing arrangements_________________________________________________________ 114 D.3.3. Deferred Tax Liabilities ________________________________________________________ 115 D.3.4. Economic benefits ___________________________________________________________ 115 D.3.5. Employee benefits ___________________________________________________________ 115 D.3.6. Contingent liabilities __________________________________________________________ 118 D.3.7.
D.4. Alternative methods for valuation __________________________________________ 119 D.5. Any other information ___________________________________________________ 120
Capital Management __________________________________________________ 121 E.E.1. Own funds _____________________________________________________________ 121
Information on the own funds __________________________________________________ 121 E.1.1. Additional ratios _____________________________________________________________ 124 E.1.2. Loss absorbency mechanism ___________________________________________________ 124 E.1.3. Reconciliation reserve ________________________________________________________ 124 E.1.4.
E.2. Solvency Capital Requirement and Minimum Capital Requirement _______________ 124 Evolution of SCR and MCR ratios ________________________________________________ 124 E.2.1. Standard formula and Undertaking Specific Parameters _____________________________ 125 E.2.2. Inputs to calculate the MCR ____________________________________________________ 125 E.2.3. Material changes to SCR and MCR _______________________________________________ 126 E.2.4.
E.3. Use of the duration-based Equity Risk sub-module in the calculation of the Solvency Capital Requirement ___________________________________________________________ 126 E.4. Differences between the standard formula and any Internal Model used __________ 126
Description of the Internal Model _______________________________________________ 126 E.4.1. Methodologies ______________________________________________________________ 128 E.4.2. Data quality _________________________________________________________________ 135 E.4.3. Risks not covered by standard formula but covered by Internal Model _________________ 135 E.4.4.
E.5. Non-compliance with the Minimum Capital Requirement and non-compliance with the Solvency Capital Requirement ___________________________________________________ 136
Non-compliance with the Minimum Capital Requirement ____________________________ 136 E.5.1. Non-compliance with the Solvency Capital Requirement _____________________________ 136 E.5.2.
E.6. Any other information ___________________________________________________ 136
Appendix 1: Key terms and abbreviations ______________________________________ 137
Appendix 2: Publically disclosed QRTs _________________________________________ 140
Appendix 3: Disclaimer _____________________________________________________ 141
EH SA - Solvency and Financial Condition Report 2017
page 5 of 141
Summary
The Solvency and Financial Condition Report (SFCR) is a reporting requirement implemented as part of Solvency II (SII).
The scope of this report covers the following topics in relation to Euler Hermes Société Anonyme (EH SA) business: business and performance, system of governance, risk profile, valuation for solvency purposes and capital management.
Business and performance (A)
EH SA is an insurance company based in Brussels, Belgium that is 100% owned by Euler Hermes Group (EH Group). EH SA’s main line of business (LoB) is credit and suretyship insurance, which rep-resents over 90% of earned premium in 2017.
EH SA operates 19 branches and has 49 subsidiaries worldwide. The material geographical regions are the DACH region (Germany (DE), Austria and Switzerland (CH)), the France region, the Northern region, the Mediterranean countries, Middle East and Africa region (MMEA) and the Asia and Pacific region (APAC).
Several significant events occurred in 2017 for EH SA:
Allianz SE filed with the Autorité des Marchés Financiers (AMF) a simplified cash tender offer for EH Group shares, and announced its intention to implement a squeeze-out procedure in the event minority shareholders hold less than 5% of the share capital and voting rights of EH Group upon completion of the offer. The Supervisory Board of EH Group issued a favourable opinion re-garding the offer;
The cross border merger of EH Hellas into EH SA has been authorized by the National Bank of Belgium (NBB) and the Bank of Greece, and completed on December 29th, 2017, with retroactive effect from January 1st, 2017.
In 2017 EH SA’s turnover was at 1,646M€, almost stable at +0.3% compared to 2016, driven by satis-fying commercial activity but impacted by negative foreign exchange. Retention rate improved and insured volumes are showing positive growth. France and Northern Europe are driving premium growth and Germany is stabilizing while Asia was impacted by high wastage and MMEA by weaker performance.
Claims costs were at 808M€, up by 2.4% compared to last year. This evolution is the combination of a higher cost of claims on current attachment year, offset by higher net releases from previous at-tachment years.
The investment strategy was marked in 2017 by the decrease of realized gains, especially on bonds, linked to asset management arbitrage partially offset by higher dividends received from subsidiaries, as well as an increase in Exchange Rate (FX) result. As a result, the total investment income stood at 125M€ in 2017 compared to 136M€ previous year.
EH SA - Solvency and Financial Condition Report 2017
page 6 of 141
System of governance (B)
EH SA management structure is organized around the Board of Directors (BoD) and the Management Committee (MC). The BoD set up two specialized advisory committees, namely the Audit, Risk and Compliance Committee and the Nomination and Remuneration Committee. Similarly, the MC has established various operational committees to assist it in its tasks.
EH SA has also implemented four independent Key Functions (Internal Audit, Compliance, Risk Man-agement and Actuarial), constituting the 2nd and 3rd of its “three lines of defence” organization.
To ensure the well-functioning of these functions, EH SA has set up the Risk Policy Framework (RPF) which is a set of policies, standards and guidelines overarching the risk management system of EH SA. It includes but is not limited to high Fit and Proper standard for its BoD, BoM and Key Function holders, as well as a set other policies that oversee principles and governance of Key Functions.
The risk management function measures and assesses EH SA’s risks through processes among which the ORSA and the Top Risk Assessment (TRA). The latter covers strategic risks which cannot be mod-elled and Board members are defined as owners, responsible for the assessment as well as the defi-nition and set up of appropriate risk mitigation plans.
Risk profile (C)
EH SA considers the main following risks in its risk profile: Underwriting, Market, Credit, Operational, Liquidity and Reputational.
EH SA considers and monitors the Underwriting, Market, Credit and Operational Risks through the Required Capital (or Risk Capital) calculated within its Internal Model. No material data quality defi-ciencies were identified in the data used for the Internal Model.
EH SA also keeps under control its Underwriting, Market and Credit Risks through the use of quanti-tative limits and diversification.
EH SA uses different diversification approaches: across investment styles and asset managers, as well as through a Strategic Asset Allocation (SAA) for Market Risk; by geography and industry for Credit Risk. Moreover, the reinsurance is the primary risk mitigation tool utilized.
Stress tests are performed using standard financial scenarios as well as several internally developed scenarios: 2008 financial crisis, Brexit and Information Technology (IT) outage.
Valuation for solvency purposes (D)
EH SA’s assets and liabilities are presented and reconciled in Market Value Balance Sheet (MVBS) and local Belgian Generally Accepted Accounting Principles (BeGAAP).
There have not been any significant changes to the recognition and valuation of material classes of assets and liabilities during the reporting period.
Total assets at the end of 2017 amounted to 3,888M€ on an MVBS basis. Assets have been invested in alignment with the prudent person principle.

EH SA - Solvency and Financial Condition Report 2017
page 7 of 141
Total liabilities at the end of 2017 amounted to 2,671M€ on a MVBS basis, of which 1,560M€ of Technical Provisions. The Volatility Adjustment (VA) impact is negligible with only 0.06% deviation between the discounted reserves with VA and without VA.
Capital management (E)
EH SA own funds are exclusively composed of basic own funds. The own funds are composed of tier 1 unrestricted for more than 98.4% and of tier 3 for the rest (the tier 3 own funds are net deferred tax assets (DTA))
EH SA complies with NBB regulatory requirements and is in line with its capital management strategy in terms of solvency.
The MCR ratio is at 482% and the SCR ratio is at 187%.
EH SA - Solvency and Financial Condition Report 2017
page 8 of 141
Business and performance A.
A.1. Business
Legal entity, auditor and supervisor A.1.1.
Name and legal form A.1.1.1.
Name and legal form Euler Hermes SA
Address Avenue des arts 56, 1000 Brussels, Belgium
Website www.eulerhermes.com
Euler Hermes SA is referred to as EH SA throughout this document. EH SA’s legal company form is a limited company (société anonyme) with the registration number BCE 0403.248.596.
Supervisor A.1.1.2.
Name National Bank of Belgium
Address Boulevard de Berlaimont 14, 1000 Brussels, Belgium
Auditor A.1.1.3.
Name KPMG Belgium
Address Avenue du Bourgetlaan 40, B-1130 Brussels, Belgium
Group structure and qualified holdings A.1.2.
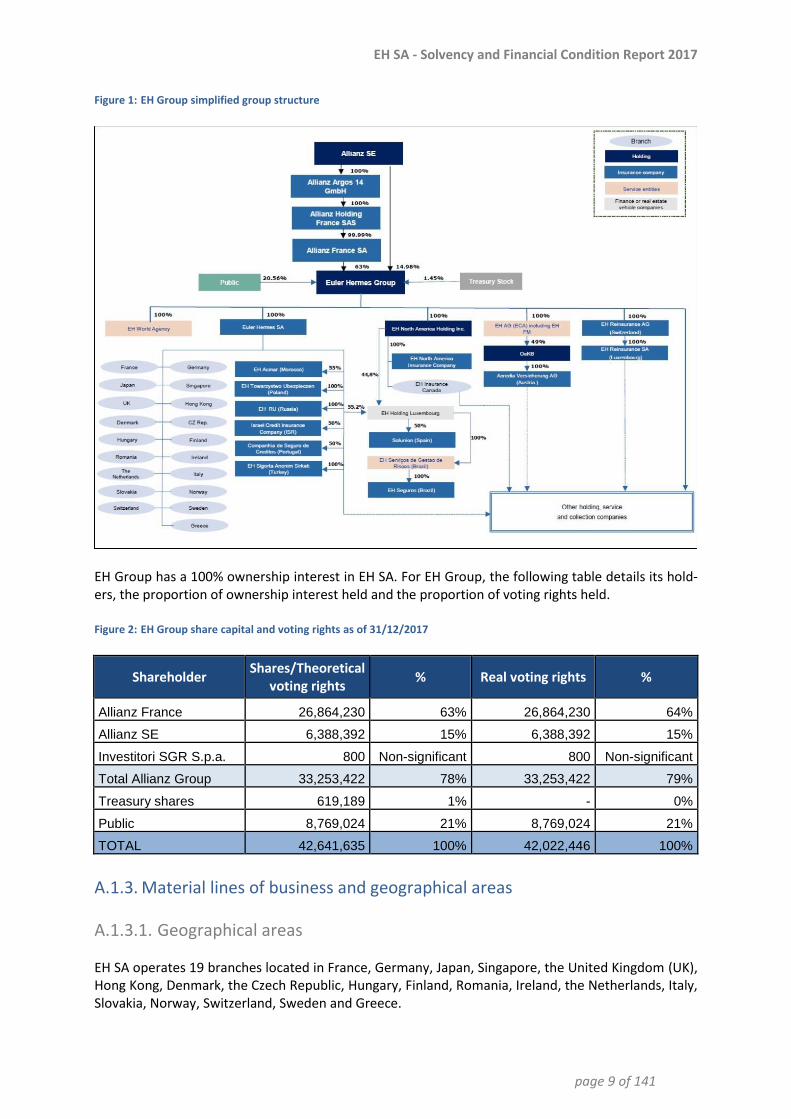
EH SA, located in Belgium, is a part of EH Group, located in France. Below is a simplified group struc-ture chart for EH SA as of 31.12.2017, which also details the percent ownership and legal links to its parent entities and its material related undertakings.
EH SA - Solvency and Financial Condition Report 2017
page 9 of 141
EH Group simplified group structure Figure 1:
EH Group has a 100% ownership interest in EH SA. For EH Group, the following table details its hold-ers, the proportion of ownership interest held and the proportion of voting rights held.
EH Group share capital and voting rights as of 31/12/2017 Figure 2:
Shareholder Shares/Theoretical
voting rights % Real voting rights %
Allianz France 26,864,230 63% 26,864,230 64%
Allianz SE 6,388,392 15% 6,388,392 15%
Investitori SGR S.p.a. 800 Non-significant 800 Non-significant
Total Allianz Group 33,253,422 78% 33,253,422 79%
Treasury shares 619,189 1% - 0%
Public 8,769,024 21% 8,769,024 21%
TOTAL 42,641,635 100% 42,022,446 100%
Material lines of business and geographical areas A.1.3.
Geographical areas A.1.3.1.
EH SA operates 19 branches located in France, Germany, Japan, Singapore, the United Kingdom (UK), Hong Kong, Denmark, the Czech Republic, Hungary, Finland, Romania, Ireland, the Netherlands, Italy, Slovakia, Norway, Switzerland, Sweden and Greece.
EH SA - Solvency and Financial Condition Report 2017
page 10 of 141
EH SA additionally has 49 subsidiaries (including 3 JV: Solunion, ICIC and COSEC) or participations in 31 different countries.
Lines of Business A.1.3.2.
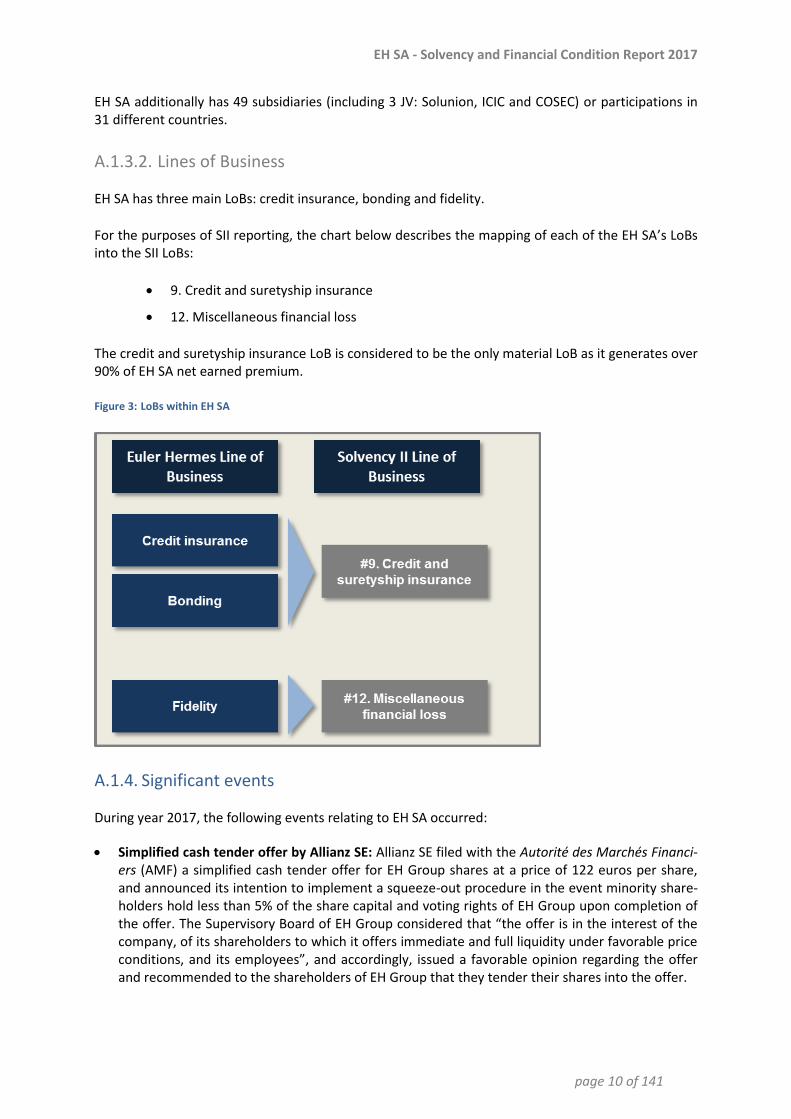
EH SA has three main LoBs: credit insurance, bonding and fidelity.
For the purposes of SII reporting, the chart below describes the mapping of each of the EH SA’s LoBs into the SII LoBs:
9. Credit and suretyship insurance
12. Miscellaneous financial loss
The credit and suretyship insurance LoB is considered to be the only material LoB as it generates over 90% of EH SA net earned premium.
LoBs within EH SA Figure 3:
Significant events A.1.4.
During year 2017, the following events relating to EH SA occurred:
Simplified cash tender offer by Allianz SE: Allianz SE filed with the Autorité des Marchés Financi-ers (AMF) a simplified cash tender offer for EH Group shares at a price of 122 euros per share, and announced its intention to implement a squeeze-out procedure in the event minority share-holders hold less than 5% of the share capital and voting rights of EH Group upon completion of the offer. The Supervisory Board of EH Group considered that “the offer is in the interest of the company, of its shareholders to which it offers immediate and full liquidity under favorable price conditions, and its employees”, and accordingly, issued a favorable opinion regarding the offer and recommended to the shareholders of EH Group that they tender their shares into the offer.

EH SA - Solvency and Financial Condition Report 2017
page 11 of 141
Changes in the share capital and in share ownership: as at December 31, 2017, the Allianz group owned 33,253,422 shares out of a total of 42,641,635 shares, corresponding to 77.98% of the share capital of EH Group. This increase followed several transactions, representing 14.98% of the share capital, which took place since the cash tender offer was launched. EH Group is inte-grated into the Allianz consolidation scope. As at December 31, 2017, EH Group’s share capital was composed of 42,641,635 shares, including 619,189 shares held in treasury stock.
Blue Europe III, realization of cross-border merger: the cross border merger of EH Hellas into EH SA has been authorized by the NBB and the Bank of Greece, and completed on December 29, 2017, with retroactive effect from January 1st, 2017.
A.2. Underwriting Performance
Aggregate underwriting performance A.2.1.
The turnover consists of premium income, comprising earned premiums generated by direct insur-ance and assumed business, and service revenues, mostly premium-related.
Credit insurance policies are designed to cover the risk of non-payment by the policyholder’s cus-tomers.
Premiums are based mainly on policyholders’ sales or their outstanding customer risk, which also depends on their sales.
Service revenues consist mainly of two types of service fees:
Information fees: these consist in billings for research and analysis carried out to provide policy-holders with the required credit insurance cover, and of amounts billed for monitoring the sol-vency of their customers. All these revenues are directly related to credit insurance business and EH SA does not sell services offering access to business solvency information to third parties that are not policyholders.
Collection fees: these correspond to amounts billed for debt collection services provided to poli-cyholders and to companies that are not policyholders.
The table below compares the aggregated underwriting performance as of 31.12.2017 recognized in BeGAAP with the underwriting performance as of 31.12.2017 recognized in International Financial Reporting Standards (IFRS).
Aggregated underwriting performance as of 31.12.2017 (BeGAAP vs IFRS) Figure 4:
31.12.2017 (In K€) BeGAAP IFRS Δ %
Turnover 1,647,620 1,646,118 1,502 0.1%
Claims costs - 808,391 - 807,886 - 505 0.1%
Gross operating expenses - 574,334 - 574,339 5 0.0%
Gross technical result 264,895 263,894 1,002 0.4%
Outward result - 217,170 - 218,463 1,293 -0.6%
Technical result 47,725 45,431 2,294 5.1%
EH SA - Solvency and Financial Condition Report 2017
page 12 of 141
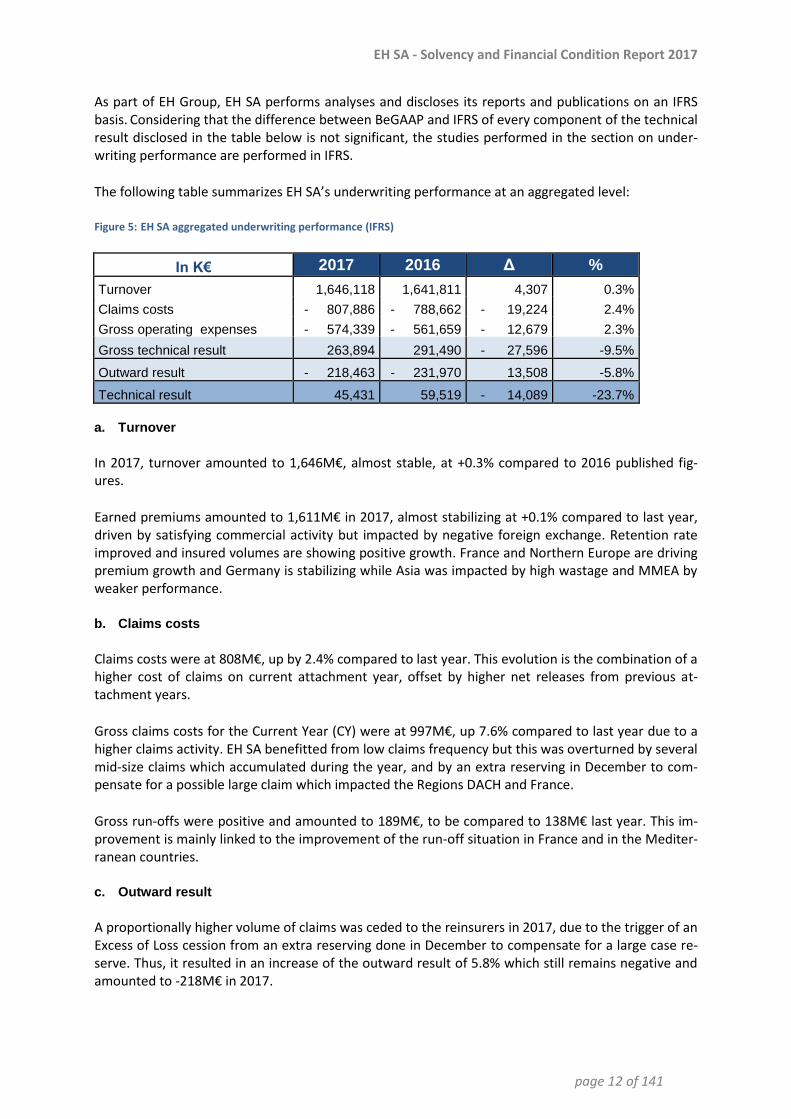
As part of EH Group, EH SA performs analyses and discloses its reports and publications on an IFRS basis. Considering that the difference between BeGAAP and IFRS of every component of the technical result disclosed in the table below is not significant, the studies performed in the section on under-writing performance are performed in IFRS.
The following table summarizes EH SA’s underwriting performance at an aggregated level:
EH SA aggregated underwriting performance (IFRS) Figure 5:
In K€ 2017 2016 Δ %
Turnover 1,646,118 1,641,811 4,307 0.3%
Claims costs - 807,886 - 788,662 - 19,224 2.4%
Gross operating expenses - 574,339 - 561,659 - 12,679 2.3%
Gross technical result 263,894 291,490 - 27,596 -9.5%
Outward result - 218,463 - 231,970 13,508 -5.8%
Technical result 45,431 59,519 - 14,089 -23.7%
a. Turnover
In 2017, turnover amounted to 1,646M€, almost stable, at +0.3% compared to 2016 published fig-ures.
Earned premiums amounted to 1,611M€ in 2017, almost stabilizing at +0.1% compared to last year, driven by satisfying commercial activity but impacted by negative foreign exchange. Retention rate improved and insured volumes are showing positive growth. France and Northern Europe are driving premium growth and Germany is stabilizing while Asia was impacted by high wastage and MMEA by weaker performance.
b. Claims costs
Claims costs were at 808M€, up by 2.4% compared to last year. This evolution is the combination of a higher cost of claims on current attachment year, offset by higher net releases from previous at-tachment years.
Gross claims costs for the Current Year (CY) were at 997M€, up 7.6% compared to last year due to a higher claims activity. EH SA benefitted from low claims frequency but this was overturned by several mid-size claims which accumulated during the year, and by an extra reserving in December to com-pensate for a possible large claim which impacted the Regions DACH and France.
Gross run-offs were positive and amounted to 189M€, to be compared to 138M€ last year. This im-provement is mainly linked to the improvement of the run-off situation in France and in the Mediter-ranean countries.
c. Outward result
A proportionally higher volume of claims was ceded to the reinsurers in 2017, due to the trigger of an Excess of Loss cession from an extra reserving done in December to compensate for a large case re-serve. Thus, it resulted in an increase of the outward result of 5.8% which still remains negative and amounted to -218M€ in 2017.

EH SA - Solvency and Financial Condition Report 2017
page 13 of 141
d. Gross operating expenses
Gross operating expenses increased by 2.3% compared to published data last year.
The increase in costs was higher than the top line growth, driven by investments in digital, process transformation and robotization that have been made. These investments do not contribute to reve-nue yet, and together with the pressure from external factors (tariff and brokerage increases) they are eating up the first savings yielded by the restructuring plans and other productivity measures launched since last year.
Human Resource (HR) expenses were up at constant exchange rates, impacted by conventional sala-ry increases and the accelerated vesting of EH share-based compensation plans (“EH LTI”) incurred by Allianz simplified cash tender offer.
Brokerage costs increased in line with premiums growth and also included the fact that growth in specialty lines and new products has come with a higher cost than traditional business.
IT costs increased due to higher depreciation costs and external information fees were up in links with higher business activity.
Other operating expenses included an exceptional positive impact from the old Belgium retail portfo-lio.
Underwriting performance by material line of business A.2.2.
Per section A.1.3 of this report, the only SII LoB considered material at EH SA is credit and suretyship insurance. The following table summarizes EH SA’s underwriting performance for this LoB:
Credit and suretyship insurance underwriting performance (IFRS) Figure 6:
In K€ 2017 2016 Δ %
Turnover 1,537,602 1,536,951 650 0.0%
Claims costs - 755,863 - 736,056 - 19,807 2.7%
Gross operating expenses - 524,717 - 516,099 - 8,619 1.7%
Gross technical result 257,022 284,797 - 27,775 -9.8%
Outward result - 201,910 - 227,373 25,462 -11.2%
Technical result 55,111 57,424 - 2,313 -4.0%
As seen in the section above, the total technical result is down by 23.7% compared to last year while the technical result of EH SA’s credit and suretyship insurance is down by 4.0%. This is mostly ex-plained by a negative impact of the outward result on fidelity LoB where its amount reached -16.6M€, down by 261.1% compared to last year where the amount was at -4.6M€.
This impact is explained by a change of the reinsurance treaty covering fidelity LoB that occurred in 2017:
As of 2016, fidelity was reinsured by a Variable Quota Share treaty.
As of 2017, fidelity was reinsured by a Quote Share (QS) treaty of 90%.
EH SA - Solvency and Financial Condition Report 2017
page 14 of 141
Considering the impact of a change in reinsurance treaty for fidelity LoB and regarding the table above, most of EH SA’s business is covered by the credit and suretyship insurance LoB. Thus, the analysis performed in section A.2.1 of this report also applies to this section.
Underwriting performance by material geographical area A.2.3.
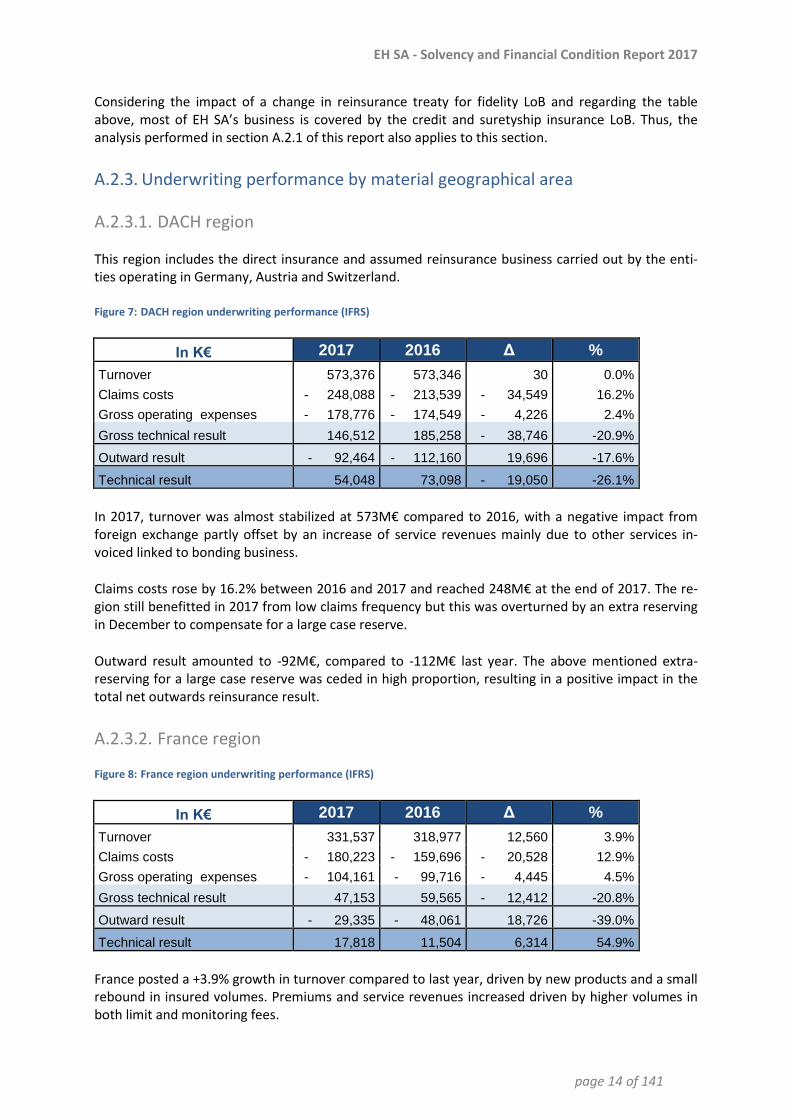
DACH region A.2.3.1.
This region includes the direct insurance and assumed reinsurance business carried out by the enti-ties operating in Germany, Austria and Switzerland.
DACH region underwriting performance (IFRS) Figure 7:
In K€ 2017 2016 Δ %
Turnover 573,376 573,346 30 0.0%
Claims costs - 248,088 - 213,539 - 34,549 16.2%
Gross operating expenses - 178,776 - 174,549 - 4,226 2.4%
Gross technical result 146,512 185,258 - 38,746 -20.9%
Outward result - 92,464 - 112,160 19,696 -17.6%
Technical result 54,048 73,098 - 19,050 -26.1%
In 2017, turnover was almost stabilized at 573M€ compared to 2016, with a negative impact from foreign exchange partly offset by an increase of service revenues mainly due to other services in-voiced linked to bonding business.
Claims costs rose by 16.2% between 2016 and 2017 and reached 248M€ at the end of 2017. The re-gion still benefitted in 2017 from low claims frequency but this was overturned by an extra reserving in December to compensate for a large case reserve.
Outward result amounted to -92M€, compared to -112M€ last year. The above mentioned extra-reserving for a large case reserve was ceded in high proportion, resulting in a positive impact in the total net outwards reinsurance result.
France region A.2.3.2.
France region underwriting performance (IFRS) Figure 8:
In K€ 2017 2016 Δ %
Turnover 331,537 318,977 12,560 3.9%
Claims costs - 180,223 - 159,696 - 20,528 12.9%
Gross operating expenses - 104,161 - 99,716 - 4,445 4.5%
Gross technical result 47,153 59,565 - 12,412 -20.8%
Outward result - 29,335 - 48,061 18,726 -39.0%
Technical result 17,818 11,504 6,314 54.9%
France posted a +3.9% growth in turnover compared to last year, driven by new products and a small rebound in insured volumes. Premiums and service revenues increased driven by higher volumes in both limit and monitoring fees.
EH SA - Solvency and Financial Condition Report 2017
page 15 of 141
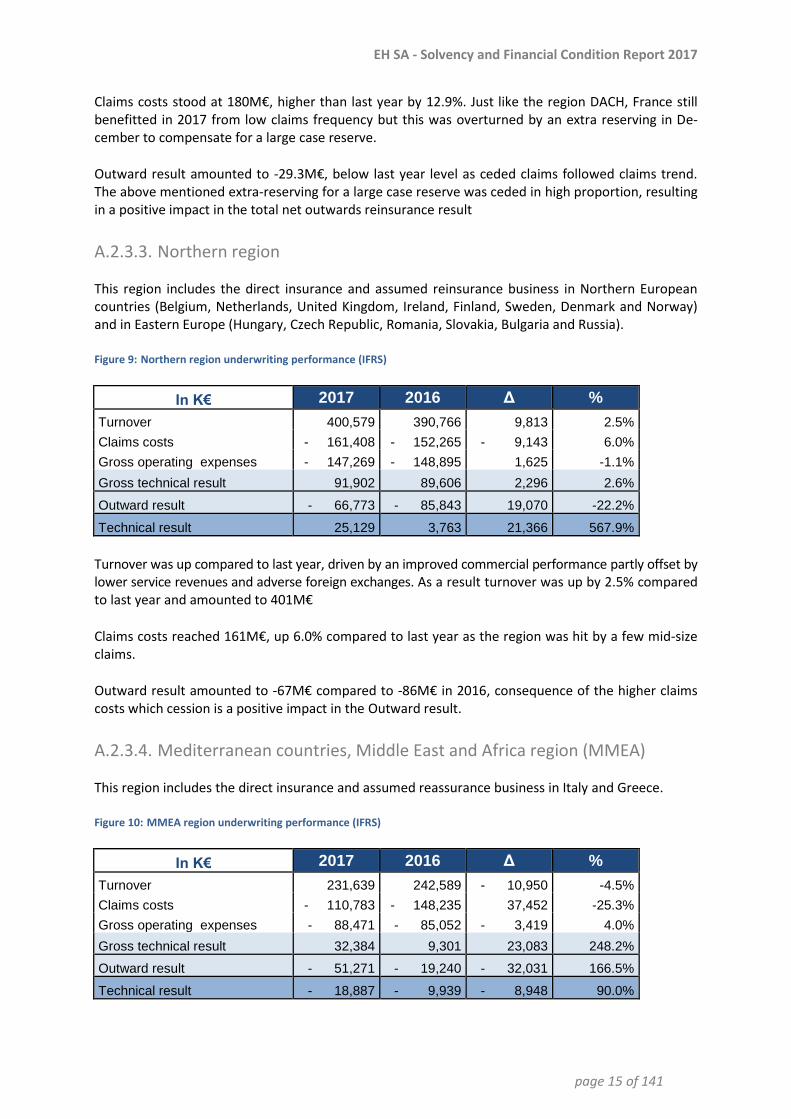
Claims costs stood at 180M€, higher than last year by 12.9%. Just like the region DACH, France still benefitted in 2017 from low claims frequency but this was overturned by an extra reserving in De-cember to compensate for a large case reserve.
Outward result amounted to -29.3M€, below last year level as ceded claims followed claims trend. The above mentioned extra-reserving for a large case reserve was ceded in high proportion, resulting in a positive impact in the total net outwards reinsurance result
Northern region A.2.3.3.
This region includes the direct insurance and assumed reinsurance business in Northern European countries (Belgium, Netherlands, United Kingdom, Ireland, Finland, Sweden, Denmark and Norway) and in Eastern Europe (Hungary, Czech Republic, Romania, Slovakia, Bulgaria and Russia).
Northern region underwriting performance (IFRS) Figure 9:
In K€ 2017 2016 Δ %
Turnover 400,579 390,766 9,813 2.5%
Claims costs - 161,408 - 152,265 - 9,143 6.0%
Gross operating expenses - 147,269 - 148,895 1,625 -1.1%
Gross technical result 91,902 89,606 2,296 2.6%
Outward result - 66,773 - 85,843 19,070 -22.2%
Technical result 25,129 3,763 21,366 567.9%
Turnover was up compared to last year, driven by an improved commercial performance partly offset by lower service revenues and adverse foreign exchanges. As a result turnover was up by 2.5% compared to last year and amounted to 401M€
Claims costs reached 161M€, up 6.0% compared to last year as the region was hit by a few mid-size claims.
Outward result amounted to -67M€ compared to -86M€ in 2016, consequence of the higher claims costs which cession is a positive impact in the Outward result.
Mediterranean countries, Middle East and Africa region (MMEA) A.2.3.4.
This region includes the direct insurance and assumed reassurance business in Italy and Greece.
MMEA region underwriting performance (IFRS) Figure 10:
In K€ 2017 2016 Δ %
Turnover 231,639 242,589 - 10,950 -4.5%
Claims costs - 110,783 - 148,235 37,452 -25.3%
Gross operating expenses - 88,471 - 85,052 - 3,419 4.0%
Gross technical result 32,384 9,301 23,083 248.2%
Outward result - 51,271 - 19,240 - 32,031 166.5%
Technical result - 18,887 - 9,939 - 8,948 90.0%
EH SA - Solvency and Financial Condition Report 2017
page 16 of 141
At 216M€, turnover was down 11.0% compared to 2016. Premiums decreased versus last year due to the exit of loss-making policies and lower commercial performance in Italy.
Claims costs reached 109M€, significantly down compared to 2016 (-26.6%), thanks to improved claims situation in Turkey and Gulf countries which were hit last year by several mid-size claims.
The Outward result was -45M€ compared to -19M€ last year, due to a much lower cession on claims following lower claims costs.
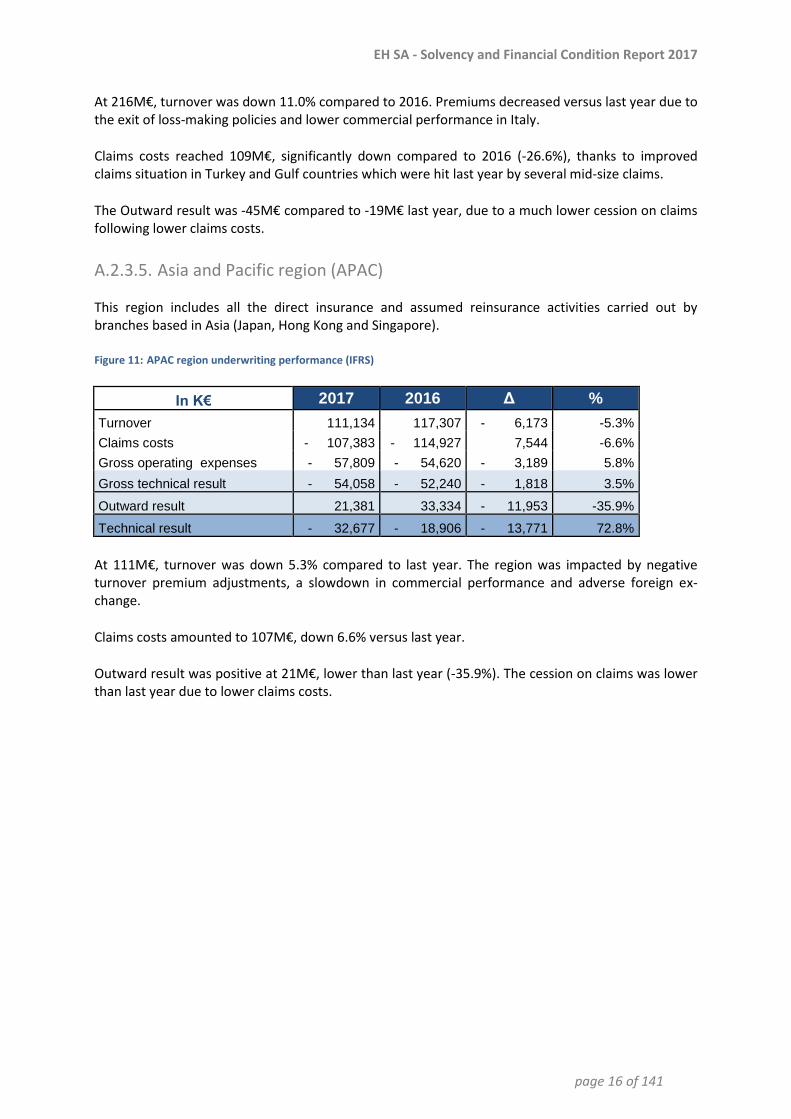
Asia and Pacific region (APAC) A.2.3.5.
This region includes all the direct insurance and assumed reinsurance activities carried out by branches based in Asia (Japan, Hong Kong and Singapore).
APAC region underwriting performance (IFRS) Figure 11:
In K€ 2017 2016 Δ %
Turnover 111,134 117,307 - 6,173 -5.3%
Claims costs - 107,383 - 114,927 7,544 -6.6%
Gross operating expenses - 57,809 - 54,620 - 3,189 5.8%
Gross technical result - 54,058 - 52,240 - 1,818 3.5%
Outward result 21,381 33,334 - 11,953 -35.9%
Technical result - 32,677 - 18,906 - 13,771 72.8%
At 111M€, turnover was down 5.3% compared to last year. The region was impacted by negative turnover premium adjustments, a slowdown in commercial performance and adverse foreign ex-change.
Claims costs amounted to 107M€, down 6.6% versus last year.
Outward result was positive at 21M€, lower than last year (-35.9%). The cession on claims was lower than last year due to lower claims costs.
EH SA - Solvency and Financial Condition Report 2017
page 17 of 141
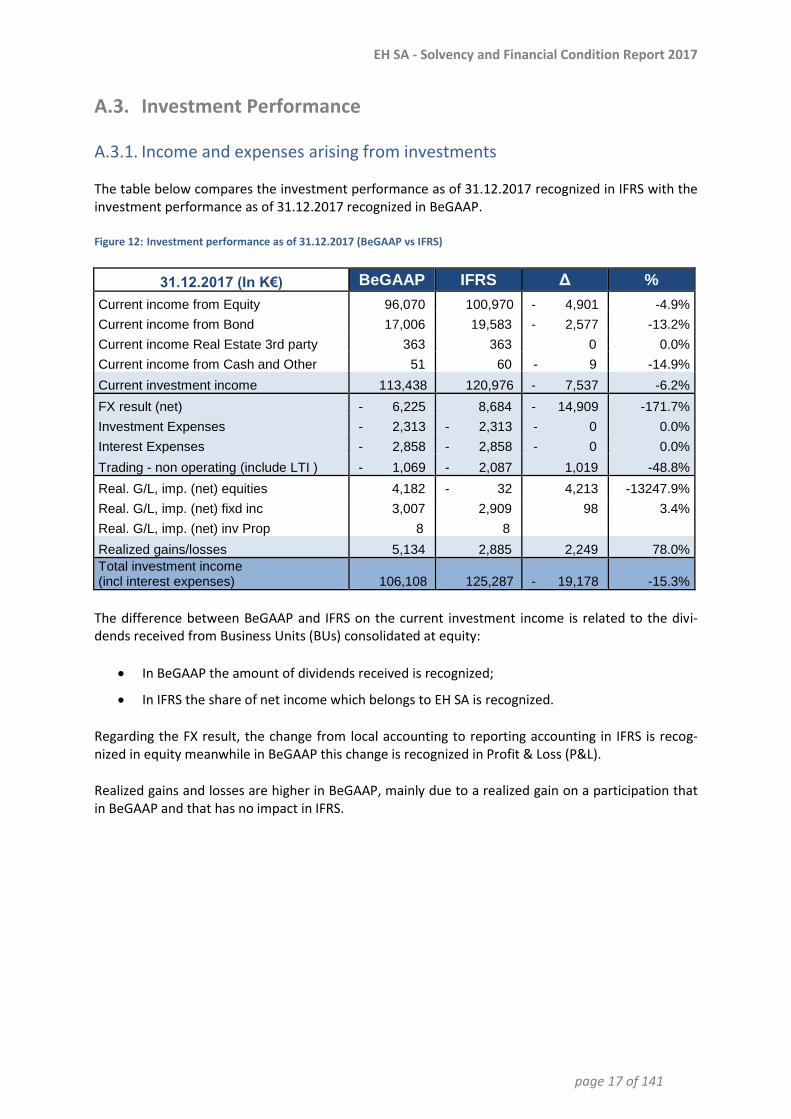
A.3. Investment Performance
Income and expenses arising from investments A.3.1.
The table below compares the investment performance as of 31.12.2017 recognized in IFRS with the investment performance as of 31.12.2017 recognized in BeGAAP.
Investment performance as of 31.12.2017 (BeGAAP vs IFRS) Figure 12:
31.12.2017 (In K€) BeGAAP IFRS Δ %
Current income from Equity 96,070 100,970 - 4,901 -4.9%
Current income from Bond 17,006 19,583 - 2,577 -13.2%
Current income Real Estate 3rd party 363 363 0 0.0%
Current income from Cash and Other 51 60 - 9 -14.9%
Current investment income 113,438 120,976 - 7,537 -6.2%
FX result (net) - 6,225 8,684 - 14,909 -171.7%
Investment Expenses - 2,313 - 2,313 - 0 0.0%
Interest Expenses - 2,858 - 2,858 - 0 0.0%
Trading - non operating (include LTI ) - 1,069 - 2,087 1,019 -48.8%
Real. G/L, imp. (net) equities 4,182 - 32 4,213 -13247.9%
Real. G/L, imp. (net) fixd inc 3,007 2,909 98 3.4%
Real. G/L, imp. (net) inv Prop 8 8
Realized gains/losses 5,134 2,885 2,249 78.0%
Total investment income (incl interest expenses) 106,108 125,287 - 19,178 -15.3%
The difference between BeGAAP and IFRS on the current investment income is related to the divi-dends received from Business Units (BUs) consolidated at equity:
In BeGAAP the amount of dividends received is recognized;
In IFRS the share of net income which belongs to EH SA is recognized.
Regarding the FX result, the change from local accounting to reporting accounting in IFRS is recog-nized in equity meanwhile in BeGAAP this change is recognized in Profit & Loss (P&L).
Realized gains and losses are higher in BeGAAP, mainly due to a realized gain on a participation that in BeGAAP and that has no impact in IFRS.
EH SA - Solvency and Financial Condition Report 2017
page 18 of 141
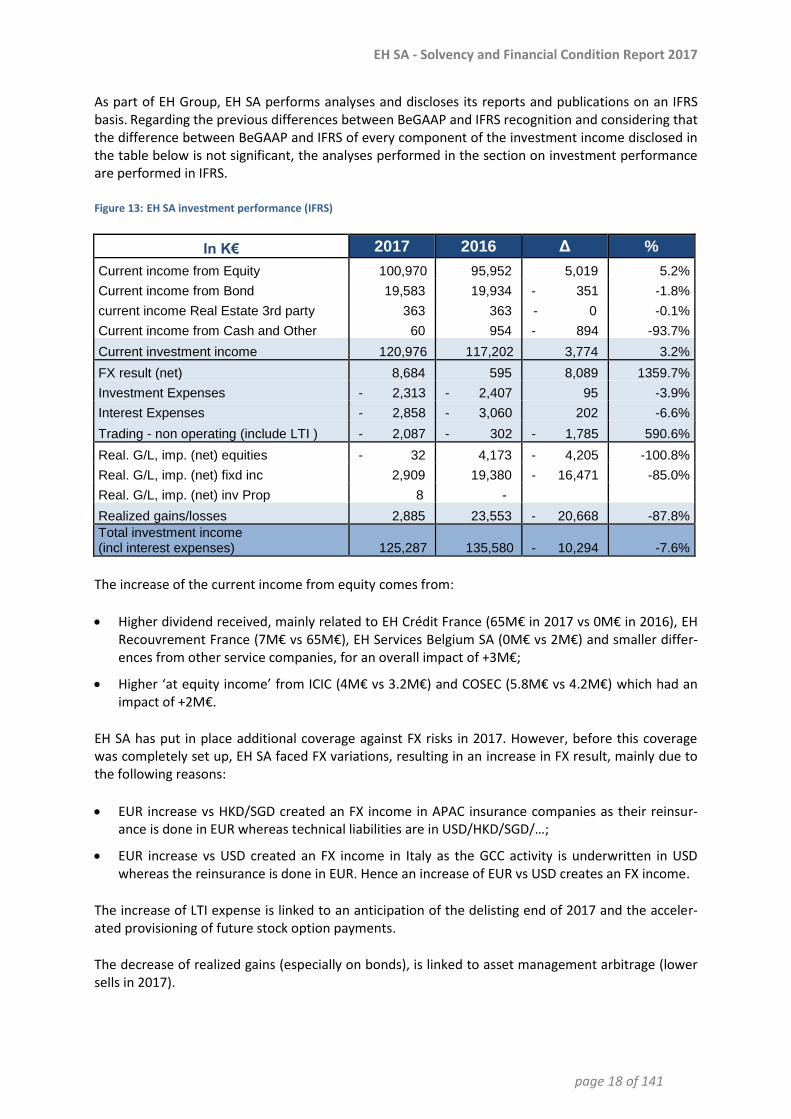
As part of EH Group, EH SA performs analyses and discloses its reports and publications on an IFRS basis. Regarding the previous differences between BeGAAP and IFRS recognition and considering that the difference between BeGAAP and IFRS of every component of the investment income disclosed in the table below is not significant, the analyses performed in the section on investment performance are performed in IFRS.
EH SA investment performance (IFRS) Figure 13:
In K€ 2017 2016 Δ %
Current income from Equity 100,970 95,952 5,019 5.2%
Current income from Bond 19,583 19,934 - 351 -1.8%
current income Real Estate 3rd party 363 363 - 0 -0.1%
Current income from Cash and Other 60 954 - 894 -93.7%
Current investment income 120,976 117,202 3,774 3.2%
FX result (net) 8,684 595 8,089 1359.7%
Investment Expenses - 2,313 - 2,407 95 -3.9%
Interest Expenses - 2,858 - 3,060 202 -6.6%
Trading - non operating (include LTI ) - 2,087 - 302 - 1,785 590.6%
Real. G/L, imp. (net) equities - 32 4,173 - 4,205 -100.8%
Real. G/L, imp. (net) fixd inc 2,909 19,380 - 16,471 -85.0%
Real. G/L, imp. (net) inv Prop 8 -
Realized gains/losses 2,885 23,553 - 20,668 -87.8%
Total investment income (incl interest expenses) 125,287 135,580 - 10,294 -7.6%
The increase of the current income from equity comes from:
Higher dividend received, mainly related to EH Crédit France (65M€ in 2017 vs 0M€ in 2016), EH Recouvrement France (7M€ vs 65M€), EH Services Belgium SA (0M€ vs 2M€) and smaller differ-ences from other service companies, for an overall impact of +3M€;
Higher ‘at equity income’ from ICIC (4M€ vs 3.2M€) and COSEC (5.8M€ vs 4.2M€) which had an impact of +2M€.
EH SA has put in place additional coverage against FX risks in 2017. However, before this coverage was completely set up, EH SA faced FX variations, resulting in an increase in FX result, mainly due to the following reasons:
EUR increase vs HKD/SGD created an FX income in APAC insurance companies as their reinsur-ance is done in EUR whereas technical liabilities are in USD/HKD/SGD/…;
EUR increase vs USD created an FX income in Italy as the GCC activity is underwritten in USD whereas the reinsurance is done in EUR. Hence an increase of EUR vs USD creates an FX income.
The increase of LTI expense is linked to an anticipation of the delisting end of 2017 and the acceler-ated provisioning of future stock option payments.
The decrease of realized gains (especially on bonds), is linked to asset management arbitrage (lower sells in 2017).
EH SA - Solvency and Financial Condition Report 2017
page 19 of 141
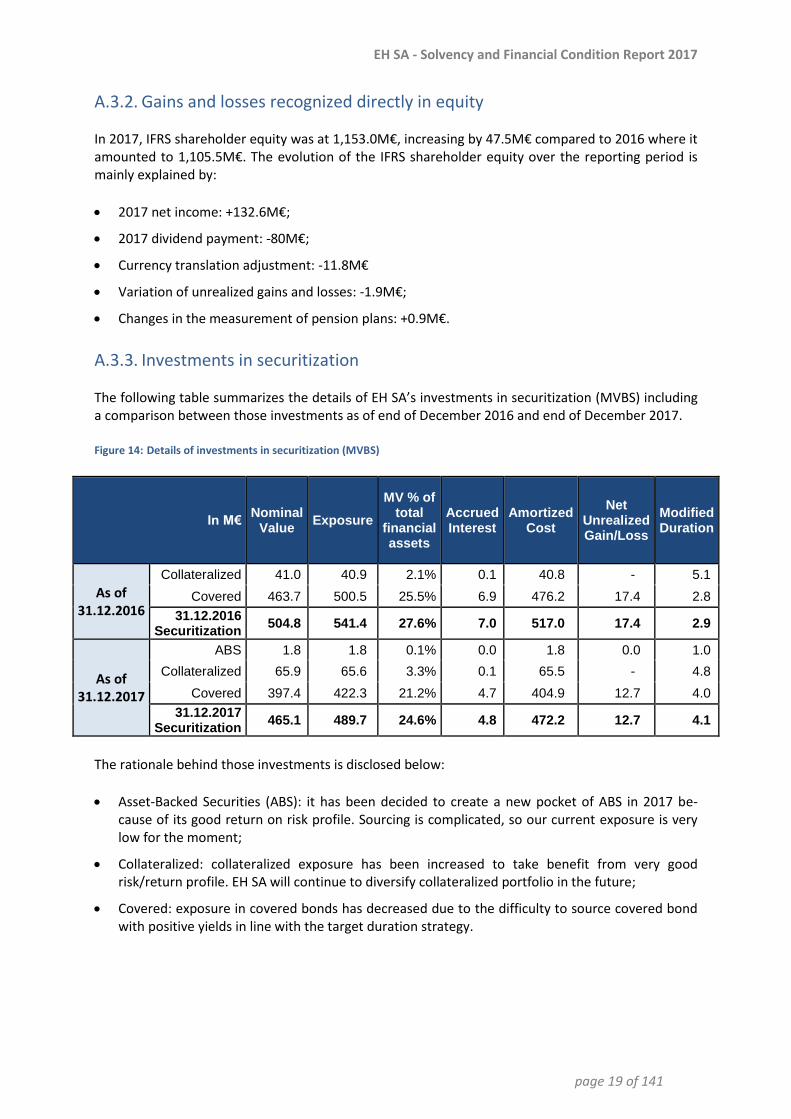
Gains and losses recognized directly in equity A.3.2.
In 2017, IFRS shareholder equity was at 1,153.0M€, increasing by 47.5M€ compared to 2016 where it amounted to 1,105.5M€. The evolution of the IFRS shareholder equity over the reporting period is mainly explained by:
2017 net income: +132.6M€;
2017 dividend payment: -80M€;
Currency translation adjustment: -11.8M€
Variation of unrealized gains and losses: -1.9M€;
Changes in the measurement of pension plans: +0.9M€.
Investments in securitization A.3.3.
The following table summarizes the details of EH SA’s investments in securitization (MVBS) including a comparison between those investments as of end of December 2016 and end of December 2017.
Details of investments in securitization (MVBS) Figure 14:
In M€ Nominal
Value Exposure
MV % of total
financial assets
Accrued Interest
Amortized Cost
Net Unrealized Gain/Loss
Modified Duration
As of 31.12.2016
Collateralized 41.0 40.9 2.1% 0.1 40.8 - 5.1
Covered 463.7 500.5 25.5% 6.9 476.2 17.4 2.8
31.12.2016 Securitization
504.8 541.4 27.6% 7.0 517.0 17.4 2.9
As of 31.12.2017
ABS 1.8 1.8 0.1% 0.0 1.8 0.0 1.0
Collateralized 65.9 65.6 3.3% 0.1 65.5 - 4.8
Covered 397.4 422.3 21.2% 4.7 404.9 12.7 4.0
31.12.2017 Securitization
465.1 489.7 24.6% 4.8 472.2 12.7 4.1
The rationale behind those investments is disclosed below:
Asset-Backed Securities (ABS): it has been decided to create a new pocket of ABS in 2017 be-cause of its good return on risk profile. Sourcing is complicated, so our current exposure is very low for the moment;
Collateralized: collateralized exposure has been increased to take benefit from very good risk/return profile. EH SA will continue to diversify collateralized portfolio in the future;
Covered: exposure in covered bonds has decreased due to the difficulty to source covered bond with positive yields in line with the target duration strategy.
EH SA - Solvency and Financial Condition Report 2017
page 20 of 141
A.4. Performance of other activities
EH SA has identified three sources of material (using a threshold of 1M€ in order to determine mate-riality) income and expenses in 2017 outside of those from underwriting and investments. These are 1) restructuring expenses, 2) amortization of goodwill and intangible assets and 3) interests and simi-lar expenses.
Restructuring expenses: in 2017, restructuring expenses are recognized for an amount of 15M€ (IFRS and BeGAAP). In 2016 the amount recognized for restructuring expenses was 29.7M€. In the continuity of the initiatives implemented last year in Germany and France, EH Group has launched additional plans in Northern Europe and across the Group. The Alchemy project is the most significant program. It consists in further developing Competence Centers throughout EH Northern Europe in several areas (Policy Administration, Risk and Information, Claims and Collec-tion and Finance). As a result, EH Northern Europe intends to reallocate part of the workforce in the Region towards its existing Competence Centers. Provisions have also been booked for the OneFinance project. Its aim is to further centralize the accounting and treasury functions.
Amortization of goodwill and intangible assets: goodwill and intangible assets are linearly amor-tized over 5 years in BeGAAP. A -1.2M€ amortization has been recognized in 2017 on FR and UK businesses.
Interests and similar expenses: in 2017, the EH SA French branch incurred a 2M€ (IFRS and Be-GAAP) expense related to its share in the expenses of EH SFAC Direct (which is an Economic In-terest Grouping between EH French entities which pools all expenses and income between its members).
A.5. Any other information
There is no other material information regarding EH SA’s business and performance to be disclosed.

EH SA - Solvency and Financial Condition Report 2017
page 21 of 141
System of governance B.
B.1. General information on the system of governance
Structure of the system of governance B.1.1.
EH SA management structure is organized around the BoD and the MC.
In order to enhance the effectiveness of the oversight of EH SA activities, functioning and risk profile, the BoD decided to set up two specialized advisory committees, namely (i) the Audit, Risk and Com-pliance Committee and (ii) the Nomination and Remuneration Committee.
The rules governing the responsibilities, composition and functioning of the BoD, the MC and the specialized committees are set out hereafter.
There have not been any material changes in the system of governance over the reporting period.
Board of Directors B.1.1.1.
In general, the BoD has the power to perform all acts necessary or useful for achieving EH SA corpo-rate purpose, with the exception of those reserved to EH SA General Meeting of Shareholders by law or the articles of association of EH SA (the “Articles of Association”).
In accordance with SII regulation, the BoD has, however, delegated all of its management powers to the MC, with the exception of determining overall policy and of acts reserved to the BoD by the Bel-gian Companies Code or the SII regulation.
Accordingly, the Board is tasked in particular with:
Defining EH SA overall strategy and objectives as well as the risk policy, including the general exposure limits; and
Carrying out effective oversight of EH SA activities.
B.1.1.1.1. Definition of EH SA overall strategy and the risk policy
Defining the overall strategy includes identifying EH SA strategic objectives and the key focuses of its organizational structure and validating EH SA main policies and reporting (particularly regarding gov-ernance policies and prudential reporting).
In terms of risk policy, the BoD is, in particular, responsible for:
Determining EH SA level of Risk Appetite and overall tolerance limits for all of its activities;
Approving EH SA overall risk management policy;
Approving the main risk management policies.
The BoD bears primary responsibility for the strategic decisions taken regarding risk.
EH SA - Solvency and Financial Condition Report 2017
page 22 of 141
B.1.1.1.2. Supervision of EH SA activities
The BoD’s supervision extends to all areas of EH SA activity, with a special focus on the MC and com-pliance with the risk policy.
In particular, the BoD:
Evaluates the effectiveness of the governance system at least once a year;
Verifies the proper functioning of EH SA independent key control functions at least once a year;
Determines the actions to be taken in response to Internal Audit’s findings and recommenda-tions;
Evaluates the general principles of the remuneration policy at least once a year;
Evaluates, at least once a year, the integrity of the accounting and financial reporting systems and the operational and financial control systems.
The BoD’s supervision is carried out through, inter alia, various reporting channels in place within EH SA.
The BoD bears responsibility for several aspects of the reporting and publication of financial infor-mation (including approval of a policy ensuring the ongoing adequateness of information communi-cated to the NBB, the approval and updating of the SFCR, the regular supervisory report and the Memorandum).
The BoD also exercises the powers conferred on it pursuant to the Belgian Companies Code and the SII regulation (such as the power to transfer EH SA registered office, appoint members of the MC, create advisory committees and approve the annual financial statements, etc.).
Finally, the BoD represents EH SA in respect of third parties and in legal proceedings.
Without prejudice to the general powers of representation of the Board as a collective body, acting by a majority of its members, EH SA is also duly represented and bound vis-à-vis third parties by any director who is a member of the MC, for all acts concerning the day-to-day management of EH SA and other acts.
Management Committee B.1.1.2.
The BoD has delegated all of its management powers to the MC, with the exception of determining overall policy and of acts reserved to the BoD by the Belgian Companies Code or the SII regulation.
EH SA is duly bound by special representatives, appointed at the initiative of the MC, within the limits of their mandates.
The MC is therefore in charge of the effective management and direction of EH SA activities (includ-ing the day-to-day management), within the framework of the strategy defined by the BoD.
In particular, the MC is responsible for all tasks concerning
The implementation of the strategy defined by the BoD
The implementation of the risk management system
EH SA - Solvency and Financial Condition Report 2017
page 23 of 141
The establishment, monitoring and evaluation of the organizational and operational structure
Reporting to the BoD and to the NBB
The MC is accountable to the BoD and reports to it on the performance of its functions.
In addition, the MC represents EH SA in its relations with staff, customers, insurance companies in Belgium and abroad and the authorities.
To assist it in its tasks, the MC has established various operational committees. These operational committees are advisory committees to the MC and they act on the delegated authority of the latter.
The Reinsurance Committee (ReCo): the ReCo analyses reinsurance structures and conditions, mainly focusing on the relevance of the structures relative to the commercial underwriting strat-egy, the capacity requirements needed to cover the underwritten risks and EH SA own funds. The ReCo also ensures that reinsurance conditions are in line with market practices given the eco-nomic environment that EH SA operates in. Finally, the ReCo validates the rules of day-to-day management to be followed by EH SA various departments to ensure that underwritten risks are covered by the reinsurance treaties;
The Finance Committee (FiCo): the FiCo analyses EH SA and group's investments in light of the risk management policy. It develops investment plans and approves the rules for their implemen-tation;
The Risk Underwriting Committee (RUC): the RUC is responsible for establishing procedures, structures and systems for managing Credit Risk exposure within EH SA. It defines quality stand-ards and manages the exposure portfolio. It is responsible for ensuring that the limits and guide-lines regarding exposures are adhered to;
The Risk Committee (RiCo): the RiCo oversees the rules, procedures and actions taken to identi-fy, evaluate and control current and future risks within EH SA to ensure Compliance with the Risk Strategy and Risk Appetite set by the MC;
The Loss Reserve Committee (LRC): the LRC determines, in accordance with IFRS, the amount of claims reserves, recoveries and costs related to the management of claims. These reserves are an integral part of the quarterly closing;
The Marketing & Commercial Committee (MCC): the MCC is a platform for the exchange of best practices in sales, marketing and distribution across the group’s regions and branches. It discuss-es growth opportunities and reviews whether the forecast budget has been reached. The MCC discusses the sales and marketing IT systems used across all regions and branches;
The Project Investment Committee (PIC): the PIC decides on EH SA investments in any project, IT-related or otherwise, with a value of more than 100K€ or that involves more than 100 working days;
The Compensation Committee (CoCo): without prejudice to the powers of the Nomination and Remuneration Committee, the CoCo oversees decisions relating to the remuneration of employ-ees of EH SA and its subsidiaries. In particular, it ensures that remuneration practices are con-sistent within EH SA and its subsidiaries, and meet legal and regulatory requirements;
The Integrity Committee (IntCo): the IntCo is responsible for preventing and detecting the risks of fraud, corruption and misconduct and manages whistleblowing cases;
The Product Committee (ProdCo): the ProdCo evaluates each new product and approves its launch;
EH SA - Solvency and Financial Condition Report 2017
page 24 of 141
The Security Committee (GSC): the GSC monitors and controls all security and Business Continui-ty Management (BCM) issues. It ensures that security and BCM policies and standards are im-plemented throughout EH SA;
The Smart Circle (SmCir): the SmCir promotes ongoing collaboration among all Key Functions of the Company;
The Management Audit Committee (MAC): the MAC proceeds to a detailed review of the Inter-nal Audits report and makes recommendations in respect of implementation decision and follow-up;
The Governance & Control Committee (GovCC): the GovCC’s purpose is to discuss and decide on questions in regard to EH SA overall governance and control framework;
Audit, Risk and Compliance Committee B.1.1.3.
Making use of the option available under the SII regulation, the BoD decided to create a single com-mittee to take on the duties assigned to the RiCo and the audit committee as provided for by the said Law, namely the Audit, Risks and Compliance Committee.
The tasks of the Audit, Risk and Compliance Committee are as follows:
Audit duties:
o Monitoring the financial reporting process and, more specifically, the process of pre-paring financial statements (both statutory and consolidated);
o Monitoring the financial policy;
o Monitoring the effectiveness of EH SA internal control and risk management sys-tems;
o Monitoring Internal Audit, its activities and its effectiveness;
o Monitoring the statutory audit of the statutory and consolidated annual financial statements, including following up the statutory auditor’s questions and recommen-dations;
o Monitoring the appointment process for statutory auditors and, where appropriate, renewing the auditor’s term of office, making reasoned recommendations to that ef-fect to the BoD;
o Examining and monitoring the independence of the statutory auditor.
Tasks related to risk management:
o Monitoring the Risk Strategy;
o Monitoring the functioning of the risk management function;
o Monitoring the process of appointing independent valuers and the performance of their duties.
At least once a year, the Audit, Risk and Compliance Committee reports to the BoD on the perfor-mance of its duties and, as a minimum, when it is drawing up the statutory and consolidated financial statements and, if applicable, the summary financial statements intended for publication. The Com-mittee presents at least one report on each of these subjects to the Board each year.
EH SA - Solvency and Financial Condition Report 2017
page 25 of 141
Nomination and Remuneration Committee B.1.1.4.
The creation of a nomination committee is not a legal requirement. However, the BoD believes that setting up such a committee is good practice, not only to evaluate the level of knowledge, involve-ment, availability and independence of directors but also to identify the required needs and suitable profiles. However, having multiple specialized committees, the BoD decided to set up a single com-mittee, the Nomination and Remuneration Committee, responsible for both the nomination of can-didates and remuneration of members, given the complementary nature of those tasks.
The Nomination and Remuneration Committee’s duties are as follows:
In the area of nomination, the Committee:
o Makes reasoned recommendations and proposals to the BoD regarding the ap-pointment of members of the BoD, the MC and the specialized committees;
o Gives an opinion on nominations made by shareholders;
o Verifies the integrity, competence, experience and independence of each candidate;
o Considers the desirability of renewing appointments and draws up a succession plan for corporate officers;
o Defines the independence criteria for members of the BoD, organizes a procedure for selecting the Board’s future independent members and performs its own assess-ment of the potential candidates before approaching them in any way; ensures that the independent members of the BoD meet the independence criteria throughout their term of office;
o Obtains drafts of agreements which results or could in a conflict of interest for mem-bers of the BoD and the MC and, where appropriate, gives its opinion to the BoD or the MC;
o Analyses all external functions performed by the corporate officers and ensures that they do not hold an unlawful combination of offices.
In the area of remuneration, the Committee:
o Issues an opinion on EH SA remuneration policy:;
o Prepares discussions on remuneration, particularly remuneration that has an impact on EH SA risk and risk management and on which the BoD is called upon to decide;
o Provides direct oversight of the remuneration allocated to the Heads of independent key control functions.
The Nomination and Remuneration Committee submits an annual remuneration report to the BoD and reviews the information provided to shareholders in the annual report relating to corporate of-ficers’ remuneration and to the principles and methods applied for determining managers’ remuner-ation, and for the allocation and exercise of share purchase or subscription options.

EH SA - Solvency and Financial Condition Report 2017
page 26 of 141
Key functions B.1.1.5.
EH SA has the following independent Key Functions:
Head of Internal Audit;
Head of Compliance;
Head of Risk Management;
Head of Actuarial Function.
Regarding SII regulation, Compliance, Actuarial Function and Internal Audit operate within the risk management framework which is composed of three lines of defence. The first line of defence is composed of risk taking units and involves the Risk Underwriting Function, the Reinsurance Function, the Investment Function and the Market Management, Marketing, Commercial and Distribution Function (MMCD). The second line of defence involves the Compliance Function, the Risk Manage-ment Function and the Actuarial Function. Finally the third line of defence involves the Internal Audit Function. A chart in Section B.3.1.5 of this report discloses further details on the objectives of the three lines of defence governance.
Thanks to the implementation of the risk management framework, policies, processes in place, the Key Functions, are deemed as well-defined and appropriate in having the necessary authority, re-sources and operational independence to carry out their tasks. Detailed information on activities, processes, implementation and independence of the four independent Key Functions mentioned above is disclosed in the following sections.
Remuneration policy B.1.2.
EH SA has put in place a remuneration policy aligned with the business strategy, risk profiles, targets and risk management practices, including the interest and long-term results of EH SA.
The remuneration policy promotes sound and efficient risk management and does not encourage the taking of risk beyond the risk tolerance of EH SA.
Definitions B.1.2.1.
A Risk Taker is defined as a person whose actions may have a significant impact on the entity’s risk profile. These are typically employees with a profit and loss responsibility and the respective authori-ty to assume risks, including strategic risks, on behalf of the entity. EH SA has identified the following Risk takers:
Non Key Functions which typically involve high risk taking subject to an assessment based on local regulatory requirements:
o Heads of Risk Underwriting, Investment, Treasury, Sales and Distribution and Fi-nance
o Committee chair of relevant committees such as the Investment Committee or Product Committee provided that the committee has decision making power simi-lar to the Board.
EH SA - Solvency and Financial Condition Report 2017
page 27 of 141
All direct reports to the Board of Management and direct reports to typical risk taking posi-tions are reviewed regularly by the HR department and may be included based on a further risk assessment.
For purposes of the remuneration policy, Key Functions are:
The Actuarial Function;
The Risk & Capital Management (R&CM) Function;
The Compliance Function; and
The Internal Audit Function.
Key Function Staff comprises the further persons working within Key Functions (i) with a direct re-porting line to the Key Function holders and independent decision rights, or, (ii) being experts with independent decision rights.
Principles for Remuneration B.1.2.2.
B.1.2.2.1. General Remuneration Principles
B.1.2.2.1.1. Remuneration Appropriateness
To ensure the appropriateness of the remuneration of individuals and general pay levels, vertical and horizontal benchmarking is performed.
B.1.2.2.1.2. Target Setting Principles
According to a business specific strategy, a three-year plan is prepared and aggregated to form the financial plans for EH SA.
Selected Key Performance Indicators (KPIs) from the financial plans form the basis for the financial and operational targets which reflect the strategy of EH SA are designed to:
Avoid conflicts of interest;
Avoid encouraging risk-taking that exceeds the risk tolerance limits of the EH SA;
Reflect appropriately the material risks and their time horizon and;
Take into account the overall success of EH SA.
B.1.2.2.1.3. Principles for Board of Directors Remuneration
To avoid a conflict of interest, members of BoD only receive a fixed remuneration subject to attend-ance. Mandates carried by members of the Board of Management of EH Group in BoD of EH SA are not compensated at all.
For compensated members of BoD the total remuneration is set at a level consistent with the scale and scope of the BoD’s duties. It takes into account EH SA activities, business and financial situation. The remuneration structure also takes into account the individual functions and responsibilities of BoD members, such as chair, vice-chair or committee mandates.
EH SA - Solvency and Financial Condition Report 2017
page 28 of 141
Composition of the remuneration B.1.2.3.
B.1.2.3.1. General Compensation Principles
The following general principles relate to Compensation components of all staff.
Fixed compensation:
o Base salary is the fixed remuneration component and rewards the role and responsi-bilities taking account of market conditions and providing for a stable source of in-come. The fixed component represents a sufficiently high proportion of the total re-muneration to avoid the employees being overly dependent on the variable compo-nents;
o Employees may also receive benefits and allowances subject to local rules and condi-tions.
Variable compensation:
o Variable compensation components are designed to incentivise performance without providing incentives for risks which might be incompatible with the risk profile of EH SA, including risk limits. Therefore, subject to local labor law, variable compensation components may not be paid, or payment may be restricted in the case of a breach of risk limits or a compliance breach. Furthermore, variable compensation may be deferred or fully or partially cancelled by the competent supervisory authority in case that the applicable SCR are not met. Where relevant, employment agreements need to take account of such deferral or cancellation rights;
o The volume and relative weight of the variable component depend on the level of seniority and the position, i.e. higher percentages of variable compensation relative to fixed Compensation typically apply to more senior positions. Variable components typically consist of annual bonus (short term incentive) and mid-/long-term incen-tives either granted in cash, equity or other instruments.
One-time payments:
o One-time payments such as guaranteed, sign-on, buy-out, retention, severance or ex-gratia bonus are granted only if justified by business or market reasons and upon approval of the relevant approval body. All one-time compensation arrangements and severance payments have to include a cap in accordance with legal requirements and are subject to fulfilment criteria;
o Severance payments must not reward failure. Therefore, unless otherwise required by law or prevailing market practice, severance payments take the performance achieved over the whole period of activity into account. No severance payment is to be paid in case of a termination for cause or if the employment has ended upon own initiative of the employee. Guaranteed bonuses are generally not a practice at EH SA.
B.1.2.3.2. Remuneration of directors
The remuneration of directors includes the following components:
Fixed compensation:
o The non-executive directors are entitled to an annual compensation of 10,000EUR, paid in the form of an attendance fee of 2,500EUR per meeting;

EH SA - Solvency and Financial Condition Report 2017
page 29 of 141
o The executive directors are compensated on an overall basis by EH Group, the group’s holding company, for all their mandates related to the group and receive no specific additional remuneration for their mandates as directors within EH SA;
o The chairmanship of the BoD is also remunerated in the amount of 10,000EUR per annum, in the form of an attendance fee of 2,500EUR per meeting.
Variable compensation: no variable compensation (whether in cash or in the form of stock op-tions, shares, etc.) is allocated to the directors for their mandates;
In addition, the independent directors who are members of the BoD’s committees (Audit, Risk and Compliance Committee and Nomination and Remuneration Committee) receive an annual remuneration amounting to 10,000EUR for their mandate within these committees. An addition-al remuneration, equally amounting to 10,000EUR, is also allocated to the Chairman of the Audit, Risk and Compliance Committee and the Chairman of Nomination and Remuneration Committee, respectively.
B.1.2.3.3. Remuneration of the Management Committee members
The members of the MC are compensated on an overall basis by EH Group, the group’s holding com-pany, for all their mandates related to the group. They receive no specific additional remuneration for their mandates as members of the MC within EH SA.
B.1.2.3.4. Remuneration of Key Functions
The remuneration of Key Functions is composed of two elements:
An annual fixed part, representing a target of 50-80% of the total remuneration; and
A variable part, representing a target of 20-50% of the total remuneration which, is divided into two or three equal components:
o An annual variable bonus;
o Mid-Term Bonus (MTB) (payable after three years: some of the Risk Takers (Heads of independent key control functions excluded) are eligible for a MTB, a system that was established to increase the loyalty of its executives and to assess performance over three years. The MTB is subject to a sustainability assessment on pay-out based on performance indicators;
o LTI (payable after four years): as part of a long-term bonus system for executive managers, Key Functions benefit from RSUs (Restricted Stock Units). RSUs are broken down into two parts: 50% of the RSUs are based on the Allianz share price trend and 50% on the EH Group share price trend, with a vesting period of four years starting on the award date as compensation for performance with respect to year N-1.
EH SA - Solvency and Financial Condition Report 2017
page 30 of 141
Assessment of Performance B.1.2.4.
The performance of Risk Takers is subject to an assessment based on 50% of financial targets and on 50% of individual targets. Heads of independent control functions are not subject to any financial targets, in order to allow them to exercise their functions independently from the financial perfor-mance of EH SA.
B.1.2.4.1. 50% financial targets
Financial targets are assessed on the basis of:
Three financial criteria for all Risk Takers:
o Group operating profit;
o Group net income; and
o Group turnover.
Other criteria specific to each of them and defined according to their responsibilities.
The measurement for financial results will be in the range of 0-200%.
B.1.2.4.2. 50% individual targets
Individual targets are 25% quantitative targets and 25% qualitative targets specific to the duties and responsibilities of each Risk Takers.
Individual quantitative targets are personal priorities which are quantifiable and objectively measur-able.
B.1.2.4.3. Individual qualitative targets
Individual qualitative targets are based on meritocracy principles consisting of the four following attributes and underlying behaviors: customer and market excellence, collaborative leadership, en-trepreneurship and trust.
B.1.2.4.4. Absence of payment in case of breach of compliance/risk/financial re-quirements
Any payout can be reduced partially or in full in the case of a breach of the code of conduct, risk lim-its, compliance requirements or comparable criteria deemed relevant.
EH SA - Solvency and Financial Condition Report 2017
page 31 of 141
B.1.2.4.5. Conditions for payment of the variable compensation when a person leaves EH SA
The payment of variable compensation is subject to whether the person was considered as a bad leaver or a good leaver.
A person is a “bad leaver” if he/she leaves his/her function upon his/her own initiative or if EH SA terminates his/her function for just cause. As a “bad leaver”, the person will cease to be entitled to any annual or MTB, subject to applicable laws and regulations and any RSU already granted will im-mediately lapse and no further RSU will be granted.
A person who is not a “bad leaver” is considered to be a “good leaver”. In this case, EH SA will pay out to the person leaving as a “good leaver”:
Any outstanding annual bonus on a prorated basis and based on actual target achievement;
The MTB will be paid on a prorated basis following the end of the third financial year and after the regular sustainability assessment;
In respect to any RSU granted, EH SA will make a pay-out in accordance with the RSU conditions.
B.1.2.4.6. Pension plan
Heads of independent control functions and Risk Takers are not eligible for a supplementary pension plan (top hat scheme or “retraite chapeau”). They are eligible for a supplementary defined-contribution pension plan subject to the country’s local pension system, of which are predominantly Belgian and French regimes:
Belgium:
o Heads of independent control functions and Risk Takers, who hold a Belgian contract that commenced before 2012, benefit from a group insurance plan called “goal to be achieved”, whereby the amount of supplementary pension plan (which would be available at retirement age) is calculated on the basis of the worker’s salary and the number of years during which the worker entered into the plan. The monthly contri-butions are therefore not fixed. The persons, of which hold a Belgian contract that commenced after 2012, benefit from a group insurance plan called “fixed contribu-tion”, whereby the monthly contributions are determined on the basis of the salary and paid into a pension plan which will be made available to workers at retirement age.
France:
o Heads of independent control functions and Risk Takers, who hold a French contract, benefit from a supplementary pension plan to the legal regime: two mandatory schemes (basic pension managed by the CNAV and supplementary pension AGRIC/ARRCO managed by B2V); two supplementary and optional schemes managed by AG2R La Mondiale until December 2017, and being transferred to Amundi in 2018 (Article 83 or Pension Fund and PERCO).
o Depending on the year of birth and in implementing provisions known today, the cumulative conditions for entry into retirement are: year of birth + legal retirement age + number of quarters required. The basic pension is the first retirement regime in France. It is based on the principle of distribution among the generations.
EH SA - Solvency and Financial Condition Report 2017
page 32 of 141
Material transactions B.1.3.
As of 2017, there was no material transaction to be disclosed other than the information already disclosed in the other sections.
B.2. Fit and Proper requirements
Description of requirements for Fit & Proper B.2.1.
The application of the SII regulation requires a high Fit and Proper standard for Senior Management and Key Function holders across EH SA. For these positions, a policy establishes the core principles (general principles, fitness and propriety) and processes necessary to ensure sufficient knowledge, experience and professional qualifications as well as the necessary integrity and soundness of judg-ment.
Roles requiring regulatory Fit & Proper assessment B.2.1.1.
Fit & Proper assessment must be carried out for individuals appointed within EH SA’s (Belgian entity)
scope. This includes the following people:
Management:
o Members of the BoD;
o Senior Management is defined as the persons effectively running EH SA, i.e. the members of the MC;
o Heads (or “Country Managers”) of the branches of EH SA in countries other than the country of EH’s headquarters.
Key Function holders are the persons responsible for carrying out the independent the following key control functions:
o Compliance Function
o Risk Management function
o Actuarial Function
o Internal Audit Function
They are the heads of the respective departments with a direct access to the MC. For each Key Func-tion there is one Key Function holder. The Key Function staff comprises further persons working within Key Functions, including those with a direct reporting line to the Key Function holders and, in addition, experts with independent decision rights.
Each Key Function holder and the Key Function staff must demonstrate the Fitness & Propriety re-quired for the fulfilling of the tasks assigned to him/her on an ongoing basis.
Details on Fit & Proper requirements B.2.1.2.
A person is considered Fit if his/her professional qualifications, knowledge and experience are ade-quate to enable sound and prudent fulfillment of his/her role. This includes leadership experience and management skills, as well as the relevant qualifications, knowledge and experience for the spe-cific role.
EH SA - Solvency and Financial Condition Report 2017
page 33 of 141
The qualifications, knowledge and experience required depend on the position.
The members of the BoD collectively possess qualification, knowledge and expertise about:
Credit insurance, asset management and financial markets, i.e. an understanding of the business, economic and market environment in which EH SA operates;
The business strategy and business model of EH SA;
EH SA’s system of governance, i.e. an understanding of the risks EH SA is facing and the capability of managing them and of assessing the capacity of EH SA to deliver effective governance, over-sight and controls;
Financial and actuarial analysis, i.e. the ability to interpret EH SA’s financial and actuarial infor-mation, identify key issues, put in place appropriate controls and take necessary measures based on this information; and
Regulatory framework and requirements, i.e. an understanding of the regulatory framework in which EH SA operates and the capacity to adapt to changes to it, in particular the Circular NBB_2013_02 of 17 June 2013 regarding the Fit & Proper standards and the chapter 2 of the Cir-cular 2016-31 of 5 July 2016 regarding the prudential expectations of the NBB regarding govern-ance systems for the insurance and reinsurance sector.
Appropriate diversity of qualifications, knowledge and experience within the MC are ensured and the collective Fitness is maintained at all times when changes occur within the MC.
While each individual member of the MC is not expected to possess expert knowledge, competence and experience within all areas of EH SA, he must possess the qualification, experience and knowledge which are necessary for carrying out the specific responsibilities within the MC assigned to him.
Members of the Senior Management other than members of the MC must possess the qualification, experience and knowledge as outlined with regard to the MC to the extent they are relevant for their responsibility. This depends on the degree of autonomy within the overall organization of EH SA which the branch, organizational unit or regional business division has for the business.
Each Key Function holder must possess the Fitness required to fulfill the tasks assigned to him by the policy of the respective Key Function, if any, and applicable law. In cases where a Key Function is outsourced according to the EH SA outsourcing policy, the Fitness requirements for the person are identical to those applying to the respective Key Function holder himself.
A person is considered Proper: if he/she is of good repute and integrity, considering his/her charac-ter, personal behavior and business conduct, including criminal, financial and supervisory aspects. Propriety includes honesty and financial soundness required for him/her to fulfill his/her position in a sound and prudent manner.
Whereas certain requirements must be positively fulfilled for a person to be considered Fit, in re-spect of propriety there are no such positive criteria, but rather negative circumstances, which are hints that a person may not be Proper. Thus the propriety assessment does not consist, like the Fit-ness assessment, in the verification that requirements are fulfilled, but in the consideration of any hint which may cast a doubt on a person’s propriety.

EH SA - Solvency and Financial Condition Report 2017
page 34 of 141
Such hints are:
Any occupational prohibitions referred to in Article 41 of the SII regulation;
Any previous conviction, or current procedure possibly leading to a conviction, of a criminal of-fence, in particular offences under any financial services legislation (e.g. Laws on money launder-ing, market manipulation or insider dealing, fraud and financial crime), breaches of companies, insolvency and consumer protection laws;
Any previous conviction, or current procedure possibly leading to a conviction, of a relevant dis-ciplinary or administrative offence;
Any administrative sanctions for non-compliance with any financial services legislation and any current investigation or enforcement action by any regulatory or professional body;
Any relevant inconsistency with regard to a candidate’s education or professional experience; and
Any further circumstance resulting in the risk of financial crime, non-Compliance with law or the jeopardizing of the sound and prudent management of EH SA business.
Description of processes and procedures in place B.2.2.
The Fit & Proper assessment checklist has been reviewed and distributed to all Heads of HR. It gives a definition of the controls that are carried out at each employee level and for each situation (ap-pointment, transfer, departure, ad hoc, etc.)
The HR department adheres closely to these guidelines to ensure that each person who joins EH SA fulfils the professional experience and integrity requirements laid down in the Fit & Proper policy.
In addition, the process of the NBB's prior approval and regulatory reporting requirements is de-scribed in the EH SA policy application note. The HR department and Legal department work togeth-er on this process.
Processes and procedures for ensuring Fitness and Propriety at B.2.2.1.recruitment
EH SA ensures that, during the recruiting process of any member of the Senior Management or of a Key Function holder, whether internal or external to the EH Group, their Fitness and Propriety are assessed. An employment or service contract may only be entered into after the successful comple-tion of a recruiting process as described below.
B.2.2.1.1. Job descriptions/Fitness requirements for the position
Job descriptions are used to fill open positions for members of Senior Management other than members of the MC and for Key Function holders, both internally and externally. The HR department ensures that the job descriptions for open positions are in place, in line with corporate communica-tion requirements and local laws and regulations, including anti-discrimination regulations. Each job description specifies the job role and the tasks and key responsibilities associated with it, as well as the Fitness required to perform the job role in a sound and prudent manner.

EH SA - Solvency and Financial Condition Report 2017
page 35 of 141
B.2.2.1.2. Curriculum vitae/background checks
B.2.2.1.2.1. External candidates
All candidates must submit current curriculum vitae at the beginning of the recruiting process. The final candidate for a position within the Senior Management or as Key Function holder must be sub-ject to a background check, comprising of:
The submission by the candidate of copies of his required qualifications;
The submission by the candidate of a proof of good reputation and of no previous bankruptcy, including a certificate of good conduct or adequate documents (e.g. Criminal records check, po-lice clearance certificate), presented not later than three months after the date of issue; and
A reference check and a public media search conducted by the recruiting HR department, subject to applicable privacy laws and regulations.
Each respective Key Function holder determines for which Key Function staff positions the final can-didates are subject to a (partial) background check. In doing so the Key Function holder considers the positions’ level of responsibility, e.g. direct reporting line to the Key Function holder. In the event that any of the documents to be submitted by the candidate for the background check is not availa-ble, the HR department, responsible for the recruitment, decides on the adequate measure (e.g. Request for a statutory self-declaration to serve as proof).
B.2.2.1.2.2. Internal candidates
When candidates have been employed by EH SA for less than four years, or uncertain justified cases, it must be secured that their curriculum vitae is available. Besides they are subject to background checks as described above.
Irrespective of their tenure within EH SA, internal candidates applying to assume an executive posi-tion for the first time must undertake a global assessment, including:
An interview with a professional interviewer;
References from the candidate’s superiors, peers, direct reports and other stakeholders; and
Psychometrics to assess the candidate’s leadership styles and the organizational climate he creates (optional).
B.2.2.1.3. Interviews
For Head positions the candidates have an interview with three members of either the MC or BoD and a HR professional.
All other candidates for executives positions (including Key Function holders) have an interview with the responsible member of the MC and, if applicable, with the functional member of the MC as well as a HR professional.
B.2.2.1.4. Assessment by NBB
Pursuant to the NBB circular NBB_2013_02 of 17 June 2013 regarding Fit & Proper standards, for positions under the scope of this circular, candidates must be prior vetted by the NBB.

EH SA - Solvency and Financial Condition Report 2017
page 36 of 141
As a consequence, an assessment file is submitted to NBB and if necessary, an interview with NBB is organized.
B.2.2.1.5. Appointment of members of the Board of Directors
Directors are appointed and reappointed by the General Shareholders’ Meeting, on the recommen-dation of the Nomination and Remuneration Committee. Reasoned proposals and recommendations from the Nomination and Remuneration Committee are transmitted to the General Shareholders’ Meeting.
B.2.2.1.6. Appointment of members of the Management Committee
Members of the Management Committee are appointed and reappointed by the Board of Directors, on the recommendation of the Nomination and Remuneration Committee.
Processes for ensuring ongoing Fitness and Propriety B.2.2.2.
A person’s Fitness and Propriety is assessed on a regular basis, to ensure ongoing Fitness and Propri-ety of the person for his position, for instance, as part of annual performance reviews or Career De-velopment Conferences.
Ad-hoc reviews are required in certain extraordinary situations which give rise to questions regarding a person’s Fitness or Propriety, e.g. in case of:
Relevant breach of the EH SA Code of Conduct;
Failure to submit required self-disclosure statements, e.g. statements of accountability or disclo-sure of security trading;
Investigation or any other procedure possibly leading to a conviction of a criminal, disciplinary or administrative offence (in the case of an administrative or disciplinary offence, the relevance to the EH SA business and the person’s position are taken into account), or to administrative sanc-tions for non-compliance with any financial services legislation; and
Substantiated complaint within EH SA (e.g. whistle-blowing) or from supervisors.
Outsourcing of a Key Function B.2.2.3.
In cases where a Key Function is outsourced according to the EH SA outsourcing policy, the Due Dili-gence of the Provider by the Business Owner comprises a description of the process used by the Pro-vider to ensure the Fitness and Propriety of its personal and a written confirmation that the Provid-er’s personal working within the outsourced Key Function is Fit & Proper.
At the date of the writing of the narrative report, no Key Function is outsourced.

EH SA - Solvency and Financial Condition Report 2017
page 37 of 141
Assessment results B.2.2.4.
Based on the information gathered during recruiting, a regular or ad-hoc review or an outsourcing Due Diligence, each case must be assessed individually, considering the following:
As regards Fitness, if it appears that a member of the Senior Management, a Key Function holder or a candidate to such a position suffers from a specific lack of knowledge, competen-cies or skills, it is considered whether this lack is curable through specific professional train-ing and if so, the person must be provided with such training;
Regarding Propriety, whereas any hint of a possible lack of Propriety must be taken into ac-count for the assessment, factors such as the type of misconduct or conviction, the severity of the case, the level of appeal (definitive vs. non-definitive conviction), the lapse of time since and the person’s subsequent conduct are also taken into account, as well as the per-son’s level of responsibility within EH SA and the relevance of the finding for the respective position (i.e. the position’s exposure to integrity and fraud risks). Furthermore, any finding with respect to a person’s Propriety must be shared with the Compliance department, as well as the legal department where adequate. At the date of the writing of the narrative re-port, all members of senior management and all Key Function holders have been approved by NBB as Fit & Proper as of 31/12/2017.
Training B.2.2.5.
EH SA ensures that, on an on-going basis, relevant professional training, including e-learning, is avail-able (internally or via external providers) to the Senior Management and Key Function holders, to enable them to constantly meet the Fitness requirements of their roles.
As regards Propriety, EH SA’s Compliance department provides regular training on ethical business behaviour such as anti-fraud and anti-corruption topics, providing employees with clear rules for Proper behaviour, both for themselves and their reports.
B.3. Risk management system including the Own Risk and Solvency Assessment
Description of risk management system B.3.1.
Risk management framework B.3.1.1.
Effective risk management is based on a common understanding of risks, clear organizational struc-tures, and comprehensively defined risk management processes. The following principles of the EH SA risk management framework serve as a basic foundation upon which EH SA risk management approach is implemented and conducted:
Promotion of a strong risk management culture supported by a robust risk governance frame-work;
Consistent application of an integrated RC framework across EH SA to protect the capital and support effective capital management;
Integration of risk considerations and capital needs into management and decision-making pro-cesses through the attribution of risk and allocation of capital;

EH SA - Solvency and Financial Condition Report 2017
page 38 of 141
MC is responsible for the Risk Strategy and appetite;
RC is the central parameter used to define Risk Appetite as part of the Solvency Assessment. It serves as key indicator in the decision-making and risk management process with respect to capi-tal allocation and limits;
Clear definition of the organizational structure and risk processes;
All material risks, including both single risks and risk concentrations across one or more risk cate-gories, are measured using consistent quantitative and qualitative methods;
A consistent limit system is in place to support adherence to the Risk Appetite and to manage concentration risk exposure and, where appropriate, assist with capital allocation;
Appropriate risk mitigation techniques are employed to address instances where identified risks exceed, or otherwise breach, the established Risk Appetite (e.g. Limit breaches);
The Risk Strategy and corresponding Risk Appetite are transferred into standardized limit man-agement processes covering all quantified risks throughout EH SA and taking into account the ef-fects of risk diversification and risk concentration;
Risk Management Function generates internal risk reports at both predefined regular intervals and on an ad hoc basis that contain relevant, risk-related information in a clear and concise form;
Risk management processes are embedded wherever possible directly within business processes, including processes involving strategic and tactical decisions as well as day to day business pro-cesses that impact the risk profile;
All business decisions with potential to materially impact the risk profile, including both regularly recurring and ad-hoc decisions and all decisions taken by the MC, are documented timely and in a manner that clearly reflects consideration of all material risk implications.
EH SA MC is responsible for the Risk Strategy and Appetite. The Risk Strategy reflects the general approach towards the management of all material risks arising from the conduct of business and the pursuit of business objectives. The Risk Appetite elaborates on the Risk Strategy through the estab-lishment of the specific level of risk tolerance for all material quantified and non-quantified risks, and thereby the desired level of confidence, in relation to clearly defined risk and performance criteria, taking into account shareholders’ expectations and requirements imposed by regulators and rating agencies. Five core elements define EH SA’s Risk Appetite:
Setting target ratings for top risks;
Monitoring the capitalization level and solvency ratios;
Managing liquidity to ensure flexibility;
Defining quantitative financial limits;
Defining policies, standards and functional rules.
Risk management processes B.3.1.2.
EH SA has established for all material quantified and non-quantified risks a comprehensive risk man-agement process which incorporates:
Risk identification;
Risk assessment;

EH SA - Solvency and Financial Condition Report 2017
page 39 of 141
Risk response and control activities;
Risk monitoring; and
Risk reporting.
The process is implemented and conducted within the confines of a clearly defined Risk Strategy and Risk Appetite and periodically assessed for adequacy.
At a minimum, EH SA follows to the hereunder quantitative and qualitative risk management process requirements:
Solvency Assessment: a comprehensive assessment of all risks inherent to the business in order to determine whether current and future capital will be sufficient to ensure on-going solvency against these risks. The Solvency Assessment constitutes the ORSA. EH SA MC dis-cusses the solvency assessment, takes appropriate actions based on the findings and reports the outcome to their local Supervisor;
RC calculation: EH SA calculates their RC with respect to all material risks of the risk catego-ries Market, Credit, Business and Operational Risk (using Risk and Control Self-Assessment (RCSA) and Scenario Analysis, further details can be found in section C.5.1), as well as Un-derwriting Risk on a quarterly basis;
TRA: a periodic analysis of all material quantified and non-quantified risks to identify and re-mediate significant threats to financial results, operational viability or the delivery of key strategic objectives. The TRA covers all risk categories as well as risk Concentrations. EH SA performs a TRA on a regular, at least annual basis and report their results to Group R&CM;
Further risk management processes: in addition to the TRA, EH SA manages all material risks of all risk categories through the application of specific risk management processes;
Risk management framework quality assurance: a self-assessment of the effectiveness of the local Risk Management Function, as well as implementation maturity of the risk management framework and corresponding risk management processes, are performed by EH SA Risk Man-agement Function following the Risk Assessment, Diagnostics, Analysis and Reporting (RADAR) process. Based on the results of the RADAR process, EH SA takes action to address any identified weaknesses in their risk management framework.
Risk management implementation B.3.1.3.
The BoD of EH SA is responsible for determining EH SA level of Risk Appetite and overall tolerance limits for all of its activities.
The Audit, Risk and Compliance Committee monitors the Risk Strategy and the functioning of the risk management function as further elaborated here-above.
The MC is responsible for sound organizational and operational structures and procedures to ensure compliance with the risk management policy. More specifically, the responsibilities are:
Implementing EH SA risk policy into EH SA system of governance and in particular EH SA corpo-rate rules as appropriate to EH SA business and risks;
Establishing a Risk Management Function responsible for the independent risk oversight under the responsibility of EH SA Chief Executive Officer (CEO);
EH SA - Solvency and Financial Condition Report 2017
page 40 of 141
Implementing the risk management framework and corresponding processes, including the Sol-vency Assessment; and
Approving and adapting the IM to ensure its adequateness for the use by EH SA.
Risk Management Function responsibilities are the operational execution of:
Regularly reviewing, on at least an annual basis, the consistency between the Risk Strategy and business strategy, and proposing changes to the Risk Strategy and Risk Appetite to the MC;
Assessing on a regular basis the adequacy of the RPF towards fulfillment of regulatory require-ments and achievement of the Risk Strategy and ensuring updates occur as appropriate, specifi-cally with respect to the risk policy and standards for the management of:
o Underwriting and reserving;
o Asset Liability Management (ALM);
o Investment risk;
o Liquidity risk;
o Concentration risk;
o Operational risk;
o Reinsurance and other insurance risk mitigation techniques.
Overseeing the execution of risk management processes;
Monitoring and reporting EH SA risk profile including the calculation and reporting of the RC;
Supporting the MC through the analysis and communication of risk management related infor-mation and by facilitating the communication and implementation of its decisions;
Escalation to the MC in case of material and unexpected increases of risk exposure;
Reporting the solvency assessment as well as any further material risk management related in-formation to EH Group R&CM;
Developing and implementing the IM, in particular its local components, including validation and suitability assessments.
The RiCo is responsible for:
Preparing and proposing to the MC the Risk Strategy, Risk Appetite and limits;
Operational execution of the risk limit framework and overseeing the risk management system;
Preparing and proposing to the MC the solvency assessment;
Defining and operationalising group-wide risk standards (including the corporate rules of the RPF).
The Financial Committee (FiCo) is responsible for approving individual financing transactions in line with RC considerations.
The Risk Management Function has intense interfaces and a close cooperation with other functions in order to effectively implement the Risk management framework. In line with regulatory require-ments reciprocal oversight is exercised amongst the Key Functions.

EH SA - Solvency and Financial Condition Report 2017
page 41 of 141
Board
EH Risk EH Risk taking taking business units
the to
is
EH Risk management committee EH Risk management committee and risk management function
Key responsibilities include: • •
Board Strategy, Risk Appetite and policy
EH risk taking BU supported by the management
Delegated authority from the Board to: Develop and implement the Internal
Model;
Measure and manage business perfor-
mance;
Develop and implement internal control
and risk management framework;
Ensure that the business is managed
within the agreed Risk Appetite.
EH Internal Audit Functions
Provides independent and objective assurance over the effectiveness of corporate standards, including assur-ance that the risk management process is functioning as described and identifies improvement opportunities.
EH Risk Management, Actuarial and Compliance Functions
Provides objective oversight of the man-agement of risk. Key responsibilities include:
Design and deployment of overall Internal
Model governance framework;
Development and monitoring of policies
and procedures;
Monitoring adherence to framework and
strategy;
Compliance rules.
First line: Risk ownership
Second line: Risk control and monitoring
Third line: Independent assurance
Risk Policy Framework B.3.1.4.
The RPF is a set of policies, standards and guidelines overarching the risk management system of EH SA. It defines all the risk-related principles to embed in the different processes and describes the core elements of the Enterprise Risk Management framework as minimum requirements to apply.
The capacity of having this framework being applied and respected within EH SA represents a risk foundation. Hence, it is properly monitored by the Risk and Capital Management (R&CM) team.
The objective is to ensure an ongoing update, validation and implementation of the Risk Policy Framework by performing an annual review of the implementation of the policies, standards and guidelines of the framework.
Three Lines of Defence B.3.1.5.
As required by SII, EH SA adopted a “three lines of defence” model for risk governance, with clear responsibilities between the different organizational functions as described hereafter:
Three lines of defence Figure 15:
Independence B.3.1.6.
The Risk Management Function is under the competence field of the CEO.
The Risk Management Function is a Key Function within the internal control system. Its main objec-tives are:
Supporting the first line of defence by helping employees at all levels of EH SA to be aware of the risks related to their business activities and how to properly respond to them;
Supporting the MC with development of a Risk Strategy and Risk Appetite;
EH SA - Solvency and Financial Condition Report 2017
page 42 of 141
Monitoring of the risk profile to ensure it remains within the approved Risk Appetite and follow-ing up on instances of any Risk Appetite breaches.
The Risk Management Function has a standing within the EH SA’s organizational structure that en-sures to maintain the necessary independence from first line of defence functions. Necessary inde-pendence means that no undue influence is exercised over the Risk Management Function, for in-stance in terms of reporting, objectives, target setting, and compensation or by any other means.
The Risk Management Function has the right to communicate with any employee and obtain access to any information, records or data necessary to carry out its responsibilities, to the extent legally permitted. Notwithstanding, information access can be restricted to dedicated risk personnel contin-gent upon prior agreement with the Chief Risk Officer (CRO).
The CRO possesses the qualification, experience and knowledge required to manage the risks relative to the responsibilities of its role.
The CRO, as Head of the Risk Management department to which the Risk Management Function has been assigned is the relevant Key Function holder.
Governance of the Internal Model B.3.2.
Responsibilities B.3.2.1.
The MC is responsible for approving the application to use the IM to calculate the SCR. The approval is required within the scope of the initial Internal Model Approval Process (IMAP). In addition, the MC is responsible for confirming the ongoing appropriateness of the IM at least annually by signing off the Annual Validation Report.
The EH SA CRO is responsible for ensuring compliance with the EH Group standards on model gov-ernance aligned with Allianz at the local level. Responsibilities of the EH SA CRO include:
Ensuring model validation is performed and documented in accordance with the EH Group standards on model governance aligned with Allianz, i.e. adequate independence and skills of model reviewers;
Ensuring that the persons providing expert judgment possess adequate skills and experience;
Ensuring that all relevant documentation in the model inventory and the IMAP documentation repository is kept complete and up-to-date in particular after a model change and that the doc-umentation standards are fulfilled.
The following roles, consisting of either an individual or group of individuals, are established in order to facilitate adherence with the requirements of EH SA’s standards:
Model Approvers are responsible for:
o Initial approval of the models they are responsible for;
o Deciding on a remediation plan if the validation results for models they are responsi-ble for indicate findings that have to be addressed.
Model Owners are responsible for:
o Ensuring the existence of adequate model documentation;
EH SA - Solvency and Financial Condition Report 2017
page 43 of 141
o Developing model in accordance with the established design requirements;
o Overseeing the implementation of model controls;
o Carrying through activities to assess the appropriateness of the results produced by the model;
o Assessing the data quality and define appropriate data update cycles;
o Signing-off of expert judgment;
o Assessing the suitability of local model components and central model components for local application.
Independent Reviewers may be independent internal or external parties and are responsible for independent validation of models and reporting of the results according to the specifications in the guideline for model validation.
The EH SA Model Governance Coordinator supports the EH SA CRO by:
o Gaining approval of the validation plan by the local RiCo;
o Coordinating the Annual Model Validation plan within the relevant legal entity;
o Collecting suitability assessment results from Model Owners and documenting these in the relevant template for EH SA;
o Gathering independent validation results of local model components and document-ing these in the local Annual Validation Report for EH SA;
o Following-up the status of the local remediation plans and disclose a status of open and closed findings in the local Annual Validation Report;
o Regularly communicating the status of local validation plan to the model governance coordinator at Group level;
o Preparing the Annual Model Validation Report.
The Actuarial Function is involved in risk modelling topics affecting their area of expertise, in-cluding dependencies with other risks.
Risk Committee and interaction with the Management Committee B.3.2.2.
The RiCo:
Make a recommendation to the MC for the approval of the initial application for using an IM;
Assess the ongoing appropriateness of the IM, decide on remediation action for identified weaknesses and make a recommendation to MC for the confirmation of the ongoing appro-priateness of the IM.
The use of the IM is subject to approval by the MC for initial model approval and for ongoing confir-mation of the appropriateness of the IM.
Local model components are classified into one of the three tiers on local level according to their contribution on the local SCR and Group TP.
The RiCo has the option to re-assign the tiering of the model depending on the qualitative assess-ment. This considers but is not limited to the result of the Annual Validation Report which comprises quantitative and qualitative validation, as well as other feedback from the business use of the IM.
EH SA - Solvency and Financial Condition Report 2017
page 44 of 141
A new model validation and approval process cycle is triggered by any model change resulting from rejection by the approver.
In case of conflicting approval decisions at the local entity and Group level, a consensus is negotiated between all stakeholders.
The EH SA RiCo assesses the overall appropriateness of the IM as it applies to the legal entity and submits a recommendation to the MC for confirmation.
If the assessment of the IM results in a material weakness, the EH SA RiCo must inform the MC, en-sure a remediation plan is in place and initiate immediate action aiming to restore the appropriate-ness of the model. This may trigger out of cycle model changes relating to the key findings and rec-ommendations of the assessment.
Governance of Trade Credit Insurance & Surety Model B.3.2.3.
As EH SA core business is trade credit insurance & surety and that a specific IM has been developed dedicated to this risk, the following refers to the governance of this model.
EH SA CRO is responsible for ensuring and supporting an adequate trade credit insurance & surety RC process from the data collection to the review of results. It covers:
Reliable and timely data input for the Credit Insurance Risk Model to meet deadlines;
High standard of quality level according to criteria;
Evidence of checks of data and data delivery sign off;
An audit track document covering the data preparation, storage of data and analysis of impact is an important component of the data input;
The organization of a Parameters & Assumptions Approval Committee (PAAC);
At the end of the process, EH SA CRO gives a statement of accountability to EH SA R&CM;
EH SA CRO ensures that all parameters changes are made according to expert judgment with measure for the impact of such change;
EH SA CRO ensures that a proper validation process is in place in the BU.
If the requested scope of data requirements or data quality standards is not fulfilled in a certain de-livery, EH SA CRO is in charge of initiating issue fixing and tracking.
A PAAC is organized every quarter with the Risk Information and Claims (RIC) teams in order to rein-force the expert judgment and validate the parameters.
The name of participants and the minutes of the committee must be addressed to EH R&CM with the data input. These minutes must include a presentation of the parameters and the expert judgment used to define them so they can be used for the EH Group PAAC to justify the entity position.
Material changes to the Internal Model governance B.3.2.4.
In 2017, a project is initiated to allow storing and tracking of all findings from the Plan For Future Improvements (PFFI) and validations in ORGS. This is currently under implementation within EH and should be fully operational by Q1 2018.
EH SA - Solvency and Financial Condition Report 2017
page 45 of 141
Second, the process to introduce minor and immaterial model changes was adjusted. The new minor and immaterial model change process will allow to:
Avoid unanticipated movements in quarterly results;
Avoid operational challenges during the tight closing timelines;
Have a prospective view on the total impact of all minor and immaterial model changes.
Description of the validation process B.3.2.5.
B.3.2.5.1. Validation plan
The validation plan addresses the issue of sequencing the model validation activities and cycles as appropriate. The Validation Coordinator (VAC) together with the Model Owner (MO) will define a validation plan based on:
The model lifecycle of all models to be validated (what is the current stage of the model and when will the next request for validation be);
The size of the validation, which depends on the model complexity and the validation type;
The validation capacity;
The requests from supervisors;
The materiality of the risk which is measured.
The VAC and MO will submit the planning to the CRO for sign-off and subsequently inform the Model and Approval Adjustment Committee (MAAC). Post MAAC, the VAC will engage with the necessary model stakeholders to identify and define their expected level of engagement.
B.3.2.5.2. Validation results
The validation report containing the findings and proposed recommendations is ultimately reviewed by the MAAC and signed-off by the MC.
It lists and classifies the findings identified during the model review taking into account the materiali-ty of the finding and/or potential issues.
Every finding is assigned a recommendation by the independent validator in order to mitigate the model risk associated to it.
A remediation plan is developed by the responsible Model Owner for every finding coming from the independent validator, including mitigating actions required for affected model uses.
Remediation plans have to be agreed upon with the independent reviewer and communicated to the MAAC for approval.
Once agreed every validation finding (irrespective of its materiality) together with its recommenda-tion and remediation action (or justification for low severity findings where applicable) will be docu-mented and assigned to the Model Owner for action.
EH SA - Solvency and Financial Condition Report 2017
page 46 of 141
Once a remediation action is completed, the Model Owner will submit a closure report to the inde-pendent validator for review and approval.
B.3.2.5.3. Validation recommendations follow-up
Planned remediation activities are regularly tracked by the independent validator in order to ensure their timely closure. A progress status report is presented to the MAAC on a quarterly basis.
After the Model Owner submitted a closure report, the independent validator will review:
Whether the provided evidences are complete as per the remediation plan;
If complete, the independent validator will proceed, with the review and validation of the pro-vided closure evidences. Conclusions will state whether the recommendations are closed, ex-tended or opened.
Upon completion of its recommendations’ validation, the independent validator will consolidate all recommendations statuses into one validation report which will summarize:
The validation status and conclusion for each recommendation;
The assessment of possible model risk and impact on model uses for “Extended” and “Open” recommendations as well as new deadlines for their complete resolution;
The overall assessment of the model adequacy reflecting the remaining “Extended” and/or “Open” recommendations.
The report will be shared with the Model Owner(s) and subsequently, the independent validator will submit the validation report to the MAAC.
Finally, the independent validator will provide in the annual validation report for MC approval, a sta-tus of all recommendations processed throughout the calendar year together with their impact as-sessment both on RC and model uses.
B.3.2.5.4. Escalation Procedure
The escalation procedure is necessary in case of disagreement on the validation outcome.
The escalation procedure is initiated by the Model Stakeholder under validation. It consists of 3 steps:
The escalation procedure starts with a notice of escalation submitted by the MO to the Valida-tion (VAL) with which there is a disagreement. The notice of escalation includes a concise sum-mary of the concern/issue. The notice must be communicated as promptly as possible and sub-stantiated with the necessary evidences against the validation outcome.
The VAC will discuss the issue with the MO and necessary model stakeholders. This can result in two possibilities:
o Firstly, the issue is resolved, in which case the validation report can be send to the MAAC;
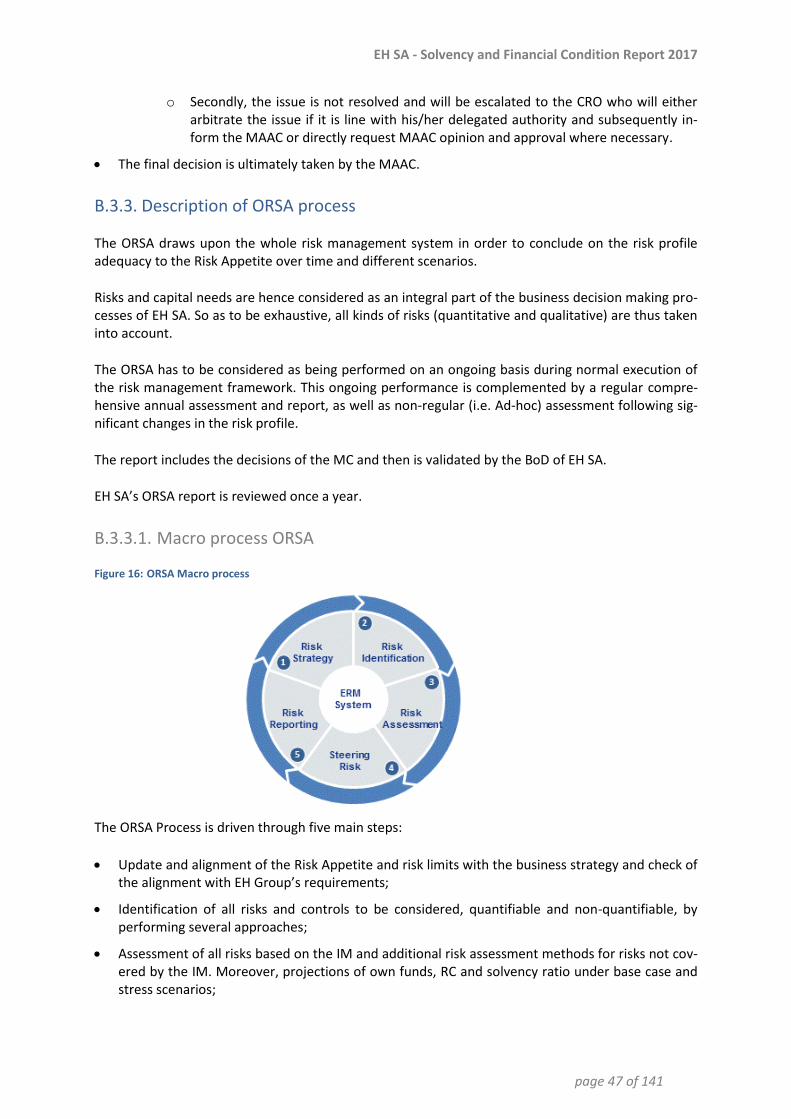
EH SA - Solvency and Financial Condition Report 2017
page 47 of 141
o Secondly, the issue is not resolved and will be escalated to the CRO who will either arbitrate the issue if it is line with his/her delegated authority and subsequently in-form the MAAC or directly request MAAC opinion and approval where necessary.
The final decision is ultimately taken by the MAAC.
Description of ORSA process B.3.3.
The ORSA draws upon the whole risk management system in order to conclude on the risk profile adequacy to the Risk Appetite over time and different scenarios.
Risks and capital needs are hence considered as an integral part of the business decision making pro-cesses of EH SA. So as to be exhaustive, all kinds of risks (quantitative and qualitative) are thus taken into account.
The ORSA has to be considered as being performed on an ongoing basis during normal execution of the risk management framework. This ongoing performance is complemented by a regular compre-hensive annual assessment and report, as well as non-regular (i.e. Ad-hoc) assessment following sig-nificant changes in the risk profile.
The report includes the decisions of the MC and then is validated by the BoD of EH SA.
EH SA’s ORSA report is reviewed once a year.
Macro process ORSA B.3.3.1.
ORSA Macro process Figure 16:
The ORSA Process is driven through five main steps:
Update and alignment of the Risk Appetite and risk limits with the business strategy and check of the alignment with EH Group’s requirements;
Identification of all risks and controls to be considered, quantifiable and non-quantifiable, by performing several approaches;
Assessment of all risks based on the IM and additional risk assessment methods for risks not cov-ered by the IM. Moreover, projections of own funds, RC and solvency ratio under base case and stress scenarios;
EH SA - Solvency and Financial Condition Report 2017
page 48 of 141
Steering of the overall solvency needs in quantitative terms with a qualitative description of all material risks. Then, demonstration of the compliance of future business with the Risk Strategy;
Reporting of the performed results and analysis by filling the ORSA report and diffusing it to all relevant stakeholders;
ORSA governance B.3.3.2.
The BoD is responsible for signing-off the final report;
The MC is actively:
o Ensuring proper implementation of its standard;
o Challenging the outcome of the ORSA and doing a pre-approval signing of the report;
o Instructing on any follow-up actions to be taken.
The RiCo is responsible for:
o Overseeing the ORSA process;
o Reviewing and pre-approving the ORSA results prior to submission to the MC;
o Monitoring quarterly all the ORSA components and the execution of any follow-up actions;
o Requesting performance of a non-regular ORSA if any events potentially altering the last overall ORSA conclusions occur;
The CRO is responsible for:
o Coordinating the ORSA process, the various contributors and preparing the ORSA Report;
o Annually assessing the compliance of the ORSA report/process with regulatory re-quirements;
o Providing the RiCo with insight on the ORSA results and distributing them to all key stakeholders related to business strategy, Risk Strategy and risk and capital Man-agement;
o Advising the MC regarding the ORSA results;
o Ensuring the follow-up of the instructions coming from the MC;
o Providing the ORSA results report to the MC;
o Communicating with supervisory authorities.
Capital management strategy B.3.3.3.
To meet SII requirements in an efficient manner, EH SA has set in place target capitalization ratios and limits.
In accordance with the standards and guidelines coming from EH Group, EH SA updated its capital management policy in 2016, willing to have an even more precise capital management. EH SA there-by put in place an additional set of limits, to supplement the previous minimum ratios and target ratios.

EH SA - Solvency and Financial Condition Report 2017
page 49 of 141
The current capital management strategy, dividend policy and limits are defined as follows:
EH SA targets to stay within the capital management range of the “Action Barrier” and the “Upper Bound” in the normal course of business;
The bounds of the capital management range are defined in line with the capital manage-ment ratio as defined in the group Risk Appetite;
In case of a breach of the capital management range in any of the two dimensions, the MC will evaluate the situation in their next regular Board meeting and evaluate any potential countermeasures to get back within the capital management range. In particular, any capital held in excess of the upper bound is deemed excess capital. This excess capital is made avail-able to EH Group as early as possible over the plan horizon;
If EH SA drops below the alert barrier, the MC is expected to establish a contingency plan in line with the Group to conserve its solvency within due time;
If EH SA falls below the action barrier during the course of the year but stays above the min-imum capital ratio, it is still expected to pay out the planned dividend while any adjustments will be considered to the planned dividends over the remaining plan horizon;
If EH SA falls below the minimum capital ratio the MC will take measures to re-establish the minimum capital ratios in due time.
EH SA - Solvency and Financial Condition Report 2017
page 50 of 141
B.4. Internal control system
Description of the internal control system B.4.1.
Internal control framework B.4.1.1.
The internal control framework is laid out in EH SA’S governance and controls policy, as approved by the MC.
EH SA applies an Integrated Risk and Control System (IRCS) to support effective management of Op-erational Risks (e.g. Information security, business continuity and outsourcing), including reporting risks and Compliance risks.
EH SA has established a Group Governance and Control Committee (GovCC) which has the following objectives:
To support the MC with respect to regulatory governance requirements
To facilitate the collaboration between the key control functions on governance and control related topics
To oversee the System of Governance and to conduct the regular review of its System of Governance
To coordinate the Internal Control System framework.
The EH SA internal control system has the following objectives:
To safeguard EH SA ability to operate as a going concern and the continuity of its business;
To create a solid control environment, by ensuring that every member of personnel is aware of the importance of internal control and the role that they must play in the internal control sys-tem;
To perform control procedures that are commensurate with the risks carried by EH SA’s activities and processes;
To provide relevant information to the management bodies as part of their decision-making pro-cesses;
To ensure compliance with the applicable laws and regulations.
With respect to the areas of control, activities and reporting aspects, the controls are performed within EH SA in accordance with requirements regarding independence.
They are incorporated into EH SA operational and organizational configuration and subject to contin-ual review. When needed, internationally recognized control frameworks such as the COSO frame-work (the Committee of Sponsoring Organizations of the Treadway Commission’s internal control - Integrated Framework) and the COBIT framework (Control Objectives for Information and Related Technologies) may be used.
EH SA - Solvency and Financial Condition Report 2017
page 51 of 141
The internal controls hence describe all the activities undertaken by and within EH SA to achieve specific control objectives, such that the controls are put in place and applied across all segments and sectors of activity. These controls ensure a permanent assessment of the effectiveness of relevant processes and procedures (including those pertaining to operations and reporting), their coherence and their proportional nature within EH SA, as well as the potential actions that may be taken to rap-idly address any deficiencies.
The EH SA Internal Control function is part of the Risk Management function. In particular, it identi-fies any material errors in the Company’s consolidated financial statements and management re-ports.
The internal control system encompasses different control concepts. In addition to general aspects related to control activities, specific controls are also performed, notably with respect to levels relat-ing to legal entities, financial reporting, IT, venture capital calculation, underwriting (including prod-ucts and distribution) and investments. Alongside these controls, reports are submitted to manage-ment.
General control elements B.4.1.2.
The following key principles govern the processes and the manner in which governance and controls are organized at EH SA:
Central, regional and local roles and responsibilities must be strictly defined;
It is important to safeguard the separation of tasks to avoid excessive risk-taking and potential conflicts of interest;
Important decisions must be taken by at least two representatives of the operational entity un-der review, even if, under local regulations, EH SA may be represented by a single person (four-eyes principle);
In the interests of sound commercial judgement, the decision-making processes must be applied at all management levels that hold relevant information, notably through impartial access to necessary information;
To facilitate communication throughout EH SA, English is the common language used at EH SA.;
Steps must be taken to ensure that all members of personnel are aware of the importance of internal controls through the clear definition and communication of roles and responsibilities and the provision of suitable training;
It is important to maintain structured, documented processes for which key controls are in place and function effectively;
The COSO framework and part of the COBIT model apply to the financial reporting process.
According to the COSO description, there are five components of internal control:
Control environment (awareness among personnel of the need for internal control);
Risk assessment (factors that may have a bearing on the achievement of objectives);
Control activities (notably the application of standards and procedures);
Information and communication of data required to manage and control activity;
Monitoring of control systems.

EH SA - Solvency and Financial Condition Report 2017
page 52 of 141
EH SA applies the three-lines-of-defence internal control model, with graded control responsibilities:
The first line of defence is implicated in the day-to-day management of activities and in the man-agement of risks and controls;
The second line of defence entails performing independent controls and challenging the day-to-day management of activities and controls carried out by the first line;
The third line of defence provides independent assurance with respect to the first and second lines of defence in the form of periodic assessments (Internal Audit).
The “Governance & Control” policy clearly states what is expected of each line of defence and each control function. It also determines how controls are organized across the central, regional and local functions.
Each corporate rule must be approved as part of a documented procedure. This rule framework is made available to all members of personnel via intranet and, where applicable, in the languages of all the countries in which EH SA operates. It must also comply with the applicable regulatory require-ments.
Specific elements B.4.1.3.
B.4.1.3.1. Internal Control Over Financial Reporting (ICOFR)
EH SA has introduced controls over its financial reporting (ICOFR) in order to identify and mitigate the risk of material error in its consolidated financial statements and management reports.
These controls seek to encompass all relevant financial reporting components, notably:
The processes relating to financial reporting;
The policies, procedures and controls that need to be applied in order to prepare reliable fi-nancial statements;
Accounting data that provides a true picture of the transactions entered into and the measures taken to prepare the financial statements;
Assurance that income and expenses have been duly authorised;
Assurance as to the prevention or timely detection of non-authorised transactions that might have a significant bearing on the financial statements.
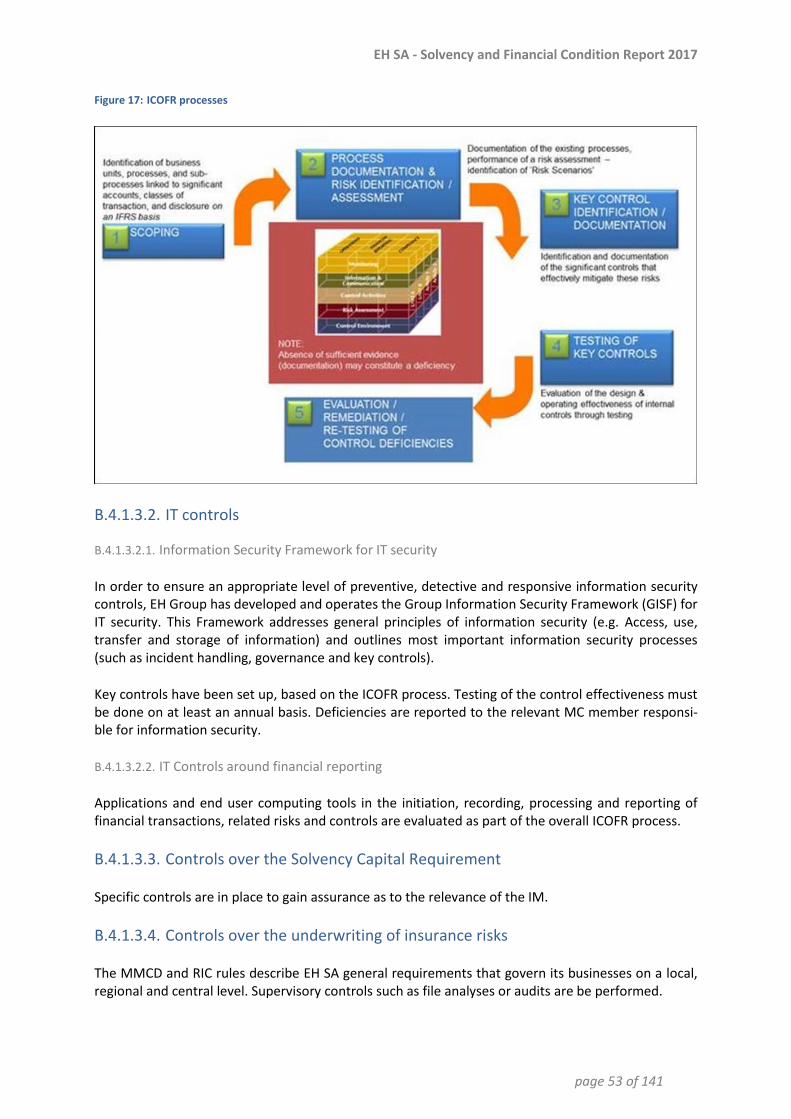
EH SA - Solvency and Financial Condition Report 2017
page 53 of 141
ICOFR processes Figure 17:
B.4.1.3.2. IT controls
B.4.1.3.2.1. Information Security Framework for IT security
In order to ensure an appropriate level of preventive, detective and responsive information security controls, EH Group has developed and operates the Group Information Security Framework (GISF) for IT security. This Framework addresses general principles of information security (e.g. Access, use, transfer and storage of information) and outlines most important information security processes (such as incident handling, governance and key controls).
Key controls have been set up, based on the ICOFR process. Testing of the control effectiveness must be done on at least an annual basis. Deficiencies are reported to the relevant MC member responsi-ble for information security.
B.4.1.3.2.2. IT Controls around financial reporting
Applications and end user computing tools in the initiation, recording, processing and reporting of financial transactions, related risks and controls are evaluated as part of the overall ICOFR process.
B.4.1.3.3. Controls over the Solvency Capital Requirement
Specific controls are in place to gain assurance as to the relevance of the IM.
B.4.1.3.4. Controls over the underwriting of insurance risks
The MMCD and RIC rules describe EH SA general requirements that govern its businesses on a local, regional and central level. Supervisory controls such as file analyses or audits are be performed.
EH SA - Solvency and Financial Condition Report 2017
page 54 of 141
B.4.1.3.5. Controls over investments
As part of the general approach to investment management, EH SA applies a series of controls to its investments:
Investments are subject to the general risk management framework of EH SA, including the Risk Strategy and its corresponding Risk Appetite (e.g. limits). The MC incorporates the investment boundaries established by the Risk Appetite into an investment strategy that includes a clearly defined SAA;
The SAA considers the broader strategy of effective ALM and establishes quotas and leeways for all main asset classes on a segment level. Following the management dialogue, adherence to the SAA and corresponding limits defined within the Risk Strategy is monitored on an ongoing basis;
The investment management is complemented by investment strategy processes designed to ensure that adequate portfolio management and controls around mandating internal and exter-nal asset managers exist. For certain investments (e.g. Alternatives), specific investment criteria have been defined to further mitigate investment risks and provide transparency;
A financial control process governs the management and oversight of processes relevant for the planning, monitoring and controlling of investment results and risks. These processes are sup-ported by investment reports and a standardized process for the review and monitoring of new financial instruments.
The above investment control environment is supplemented by an investment governance structure, which in particular includes:
A clear allocation of investment responsibilities;
A dedicated committee structure;
The establishment of EH Investment and Treasury Group as the Group’s internal service provider for investment management advice;
Investment related corporate rules (e.g. Investment guidelines);
The third line controls in investment management is executed by a dedicated Internal Invest-ment Audit team;
With respect to the investment of third party assets (EH Asset Management), separate control mechanisms exist pursuant to specific external regulatory requirements. Adherence thereto is governed by the responsible function.
Implementation of Compliance Function B.4.2.
In Compliance with Article 55 of the SII regulation, Circular NBB_2016_31 of 5 July 2016 regarding the prudential expectations of the NBB regarding governance systems for the insurance and reinsur-ance sector defines the Compliance Function as a Key Function for the management of an insurance company and the protection of its integrity. The function is “responsible for ensuring compliance with the legal and/or regulatory integrity and conduct requirements that apply to institutions”. The Compliance Function must perform its work on an ongoing basis and cover all the activities carried out by the business.

EH SA - Solvency and Financial Condition Report 2017
page 55 of 141
Principles of the Compliance Function B.4.2.1.
B.4.2.1.1. Responsibilities
Compliance is a key control function within the internal control System of EH SA as outlined in its governance and control policy. The role of Compliance includes the following responsibilities:
Supporting corporate values;
Advising the Board and senior management on new regulatory developments and standards;
Educating staff about compliance issues (e.g., anti-corruption and anti-fraud laws, anti-bribery, conflicts of interest);
Acting as internal contact point for compliance queries or complaints (internal whistleblow-ing);
Providing assistance for implementation of compliance manuals, internal codes of conduct, and best practices; and,
Ensuring the compliance or explain principle is adhered to, so that whenever a decision or rec-ommendation of the Compliance Function is not observed, an explanation is given.
The following areas, although they are managed and implemented by other departments (e.g. R&CM, HR, Purchasing, and Market Management, Commercial & Distribution), are also reviewed by the Compliance Function:
Subcontracting;
Incompatible offices, Fit & Proper process;
Laws on market practices and consumer protection;
Laws on insurance intermediation; and
SII policies.
B.4.2.1.2. Independence
The independence of the Compliance Function is established as follows:
The Compliance Function has a formal status within EH SA, which is described in the compliance policy;
The designated Chief Compliance Officer is given direct access to each member of the MC, the approved auditor and, where applicable, the Chairman of the BoD;
The Chief Compliance Officer and other Compliance Function employees are protected from any conflicts of interest between their Compliance responsibilities and any other responsibilities they may have at EH SA, particularly in relation to sales;
The Compliance Function must be independent and able to promote values and defend princi-ples within EH SA at all times;
Compliance Function employees have access to all the information and all the employees they need to perform their duties;
Any bonus received by the Compliance Officer is based exclusively on achieving qualitative indi-vidual targets rather than on the financial results of EH SA.

EH SA - Solvency and Financial Condition Report 2017
page 56 of 141
Internal organization B.4.2.2.
EH SA always has a Chief Compliance Officer, Regional Compliance Function holders and, where ap-propriate, local Compliance Function holders for each branch and subsidiary. These local Compliance Officers are therefore responsible for the Compliance Function’s involvement at local level.
Compliance Function holders are chosen based on their skills set and experience. They attend regular training sessions that have been approved or organized by the insurance sector. They are also chosen based on their integrity, which is investigated by way of background checks.
Moreover, in accordance with EH SA's operational and functional structure, Compliance falls under the duties of the MC member in Charge of Finance, Tax, Legal & Compliance. Local Compliance Func-tion holders report to the Head of Finance of their respective branch or subsidiary as their line man-ager, but also to their regional Compliance Function holder. Similarly, regional Compliance Function holders tend to report to the Head of Finance of their respective region as their line manager, but also to EH SA's Chief Compliance Officer.
The Internal Audit Function independently and objectively verifies the suitability and effectiveness of the Chief Compliance Officer.
Functioning B.4.2.3.
Compliance at EH SA is basically structured around the following three pillars:
Management: tangible and genuine involvement of managers and executives (tone at the top);
Compliance subject: based on the testing activities performed by R&CM, exhaustiveness and robustness tests;
Compliance Function representatives inside the business lines and support functions: these rep-resentatives act as go-betweens, providing feedback on operations and helping to disseminate compliance-related messages.
The primary activities of the Compliance Function are:
Identifying and assessing Compliance risk, and drawing up a plan of action accordingly:
Compliance risk is the risk that EH SA and/or its employees are hit with legal, administrative or regu-latory sanctions for a failure to comply with legal and regulatory integrity and conduct rules that re-sults in reputational damage and possibly financial harm. This reputational damage may also arise from failing to adhere to internal policy and EH SA own values and rules of conduct as regards the integrity of its activities. A loss of reputation may damage the credibility of EH SA and its employees.
Analyzing risks annually so as to define the scope and priorities of the Compliance Function:
This analysis is based on more detailed studies that may have been carried out elsewhere (e.g. on the risk of fraud and corruption).
In this way, based on the risk assessment, a compliance plan is drawn up every year and validated by the management. The plan contains not only the measures to be taken but also an estimate of how many employees will be required to implement them. The necessary resources are thus seconded to ensure the Compliance Function runs properly. The plan of actions is sent to the Internal Audit team for information purposes.
EH SA - Solvency and Financial Condition Report 2017
page 57 of 141
The EH SA Compliance plan is drawn up and monitored pursuant to point 3.2.5 of the Circular NBB_2012_14 on Compliance “The Compliance Function draws up a written plan of actions. This plan provides a sufficiently detailed description of the nature and frequency of the missions to be carried out by the Compliance Function over a specific period (one or several years). The plan is based on a risk-based approach, the principles of which are established in writing and evaluated regularly. Risk assessment comprises all the institution’s activities and entities, and takes into account all relevant data obtained during previous compliance activities. The analysis also covers expected changes and developments.”
Monitoring expected changes (laws, systems, markets):
The Compliance Function works with the Legal department to monitor regulatory changes offer ad-vice and help draw up directives on regulatory compliance. It helps management to organize compli-ance training for employees and works with operational teams to ensure that employees are aware of Compliance risk, as well as acting as a point of contact for employees.
The Compliance Function uses a matrix to divide its work into 10 key areas of compliance.
Each area is allocated to a person responsible for monitoring legislative and regulatory developments in that area reporting back to the team. These 10 areas are:
Anti-corruption;
Anti-fraud;
Anti-money laundering;
Economic sanctions;
Code of conduct and conflicts of interest;
Data protection;
Antitrust;
SII;
Training and disclosure;
Compliance reviews.
The aim of the matrix is to ensure that the team deals with the aforementioned areas in real time and on an ongoing basis.
The monitoring tasks allocated to the Compliance Function are based on an assessment of Compli-ance risks for the business at local, regional and Group level. This assessment reveals key topics (e.g. fraud, corruption, economic sanctions, etc.) and ongoing areas (e.g. conflicts of interest, insider trad-ing, etc.) which are discussed annually with management to determine which areas are subject to monitoring. The monitoring tasks are performed by local Compliance Function holders, who assess how the compliance procedures and rules are being applied to operating processes and then com-municates the results of these tasks to senior management and to the regional Compliance Function holder (and to the Chief Compliance Officer) by way of a quarterly compliance report produced local-ly.
The MC receives regular reports on the work carried out by the Compliance Function. These reports cover the areas mentioned above as well as other topics.

EH SA - Solvency and Financial Condition Report 2017
page 58 of 141
The compliance policy includes a Monitoring & Testing program and a schedule for testing the effec-tiveness of key controls pertaining to the Compliance topics mentioned earlier. The annual compli-ance plan can be found in EH SA’s Memorandum of Governance.
B.5. Internal Audit Function
Implementation of the Internal Audit Function B.5.1.
The Internal Audit Function is common to the EH Group. This function is performed independently so that it reports to the CEO and to the Audit and Risk Committee. No auditor is performing an opera-tional function.
Audit is organized by function:
Risk/HR;
Market Management/Commercial Underwriting/Distribution;
Finance/Accounting;
Operations and Corporate Governance.
It has to be noted that regional correspondents have been put in place.
An annual program of audit assignments is defined every year, including global audits of the subsidi-aries (sovereign audits), transversal audits of processes performed simultaneously in the main sub-sidiaries, and vertical audits of all the processes of a given function within a subsidiary. It is subject to both a discussion and a validation process with operational staff, General Management and the Audit Committees.
The last stage of the validation of the audit program is the presentation to the Audit and Risk Com-mittee for approval in the fourth quarter. The audit program is consistent with achieving a five-year risk cover while at the same time providing short-term cover of the most sensitive risks.
The audit activity is governed by an audit charter. It sets out in details the missions and organization of the various control levels within the Group and its subsidiaries. It is supplemented by the devel-opment of audit standards and procedures at local and Group levels.
As third-line-of-defence, execution of regular controls, e.g. for distribution networks, is not in scope of the Internal Audit Function.
Internal audit activities and processes B.5.2.
Internal audit service is competent to investigate and assess the appropriateness and effectiveness of both the internal control and the way the responsibilities assigned are assumed. In particular, it checks:
Policies respect;
Risks control;
The reliability of financial information;
IT systems continuity and reliability;
EH SA - Solvency and Financial Condition Report 2017
page 59 of 141
The working of different services.
In general, EH Internal Audit team acts on five kinds of audit which cover all of the activity fields and IT of EH:
Local audits: limited to audits required by local regulation;
Transversal audits: audit missions on one process for different entities;
Sovereign audits: audits which cover all of the processes of one entity;
Ad hoc audits: non-scheduled audits asked by BoD;
Vertical audits: audits of all processes of one function within one entity.
An audit universe, including outsourced and co-sourced functions, is defined and revised annually based on a risk-based approach driven by structured risk-ratings that have been assigned to audit areas after a rigorous risk-assessment has been completed. The audit universe covers the complete system of Governance. It takes into account scope and frequency. This risk-based utilizes the applica-tion of risk-rating factors categorised by risk type.
Internal audit must engage adequate capacity to ensure that there is satisfactory coverage of the risk-universe within a 5-year audit plan. Consequently, each year, audit resources are allocated to audit areas according to the risk measures and the risk-universe must be (re)assessed on a rolling basis. This annual audit plan must be approved by the EH CEO and the Audit Committee
Internal audit works are evidenced through documented and structured working papers.
EH SA Internal Audit issues an audit report for each audit which includes detailed results and appro-priate recommendations based on facts and professional judgment. The audit report also summariz-es the most important results including an overall assessment of the auditee’s risk and internal con-trol status.
Management is responsible for implementing related corrective actions and for remediating identi-fied audit findings. EH Internal Audit must be informed of the actual implementation of recommen-dations and must perform follow-up actions and must implement escalation steps.
In addition to auditing activities, EH SA management may seek the advice of Internal Audit on inter-nal control related topics. The advisory function of Audit may not jeopardise its core audit activities and the fulfilment of its audit plan and thus the Head of Internal Audit of EH SA must confirm to the EH CEO (and Audit Committee), at least annually, the independence of the Internal Audit activity.
Independence and objectivity of the Internal Audit Function B.5.3.
In order to ensure the objectivity and the independence of the Internal Audit Function, the following specific requirements have been set:
Independence:
o The Internal Audit Function must have a standing within the EH organizational struc-ture that ensures to maintain the necessary independence. Necessary independence means that no undue influence is exercised over the Internal Audit Function, and In-ternal Audit must avoid conflicts of interest in fact or appearance;
EH SA - Solvency and Financial Condition Report 2017
page 60 of 141
o Internal auditors and the Internal Audit Function have the authority to express as-sessment and recommendations but cannot give orders (except in cases of suspicion of illegal activities/fraud);
o To ensure the independence of their judgment, Internal Audit Function representa-tives do not receive any incentives based on the profit and loss account of EH SA but on qualitative KPIs;
o Auditors are hierarchically and organizationally segregated from operating activities they are in charge to control. Once a year the Head of Internal Audit establishes a declaration of independence in which he testifies that he performs his activity inde-pendently and does not report to any operating function but exclusively and directly to the chairman of EH SA MC;
o Audit missions results are validated by auditees and sent to the chairman of the BoD, to the director of the department to which the mission was assigned, and to the Au-dit, Risk and Compliance Committee.
Reporting Lines:
o Head of EH Internal Audit reports directly to the CEO and to the Audit Committee. The Head of EH Internal Audit must regularly have direct interaction with the CEO and the Chair of the Audit Committee.
Unrestricted information access:
o EH Internal Audit has the right to communicate with any employee and obtain in-formation, records or data necessary to carry out its responsibilities, to the extent le-gally permitted. EH Internal Audit has the responsibility and the right to review activ-ities, procedures and processes in all areas of the EH Group, without limitation. EH Internal Audit has the unlimited right to obtain information and management must inform Internal Audit of serious deficiencies and major changes in internal control systems this information must be handled with discretion and confidentiality.
Fitness and Propriety:
o Internal auditors must possess analytical skills, knowledge in the field of finance, ac-counting and IT as well as an understanding of the organization of insurance and/or finance companies. In order to achieve and maintain the required professional skill level, continuing training is necessary. Skills in effective communication are also im-portant;
o Enhancing independence and objectivity, and avoiding potential conflicts of interest, tenure of Internal Audit Key Function holders is limited to eight years;
o The Head of Internal Audit must possess the qualification, experience and knowledge required to evaluate the adequacy and effectiveness of the system of governance, is-sue recommendations, in particular as to deficiencies with regard to the internal con-trol system and the compliance with the corporate rules, and verify the compliance with decisions taken as a consequence thereof. He or she must be familiar with all In-ternal Audit relevant standards, publications and practices;
o The Head of the Internal Audit must share characteristics of:
Honesty, integrity and reputation;
Competence and capability; and
Financial soundness.
o EH SA Fit and Proper policy applies.
EH SA - Solvency and Financial Condition Report 2017
page 61 of 141
Outsourcing of Internal Audit tasks:
o In general, EH Internal Audit is exercised with EH Group internal resources. If EH In-ternal Audit lacks certain knowledge, skills or competencies, resources can be sought from third parties. In cases of outsourcing, as permitted by law and supervisory bod-ies, EH Internal Audit management remains responsible for achieving all required audit standards defined by the internal audit policy and other applicable standards;
o Complete outsourcing of an Audit Function to external providers is not permitted. No exception is allowed.
B.6. Actuarial Function
Implementation of the Actuarial Function B.6.1.
Responsibilities B.6.1.1.
In accordance with operational and governance structure of EH SA, actuary falls within the compe-tence field of the BoD member in charge of functions related to Accounting, Management Control, Actuarial Function, Tax Office, Legal & Compliance.
Persons responsible for the Actuarial Function possess an actuarial knowledge as well as financial mathematics.
The Actuarial Function is part of the EH SA internal control System as outlined in EH SA governance and control policy. The role of actuarial includes the following responsibilities:
Coordinating the calculation of TP so as to ensure the appropriateness of methodologies, underlying models and assumptions used to calculate TP;
In addition to the duties in the calculation of TP, the Actuarial Function assumes the follow-ing tasks in the reporting of EH SA’s annual accounts:
o Verifies that the amounts of the TP are adequately reflected;
o Monitors the Compliance of the TP with the requirements of Articles 126-139 of the SII Act of 13 March 2016 and the Royal Decree of 17 November 1994.
Assessing the sufficiency and quality of the data used in the calculation of TP;
Comparing Best Estimate (BE) against experience;
Informing the MC and BoD in regards to the reliability and adequacy of the calculation of TP;
Overseeing calculation of TP covered by SII;
Reporting quarterly about TP level to the LRC, statues on its appropriateness, and gets BoD approval regarding the level of those TP;
Monitoring the setup, by regions, of the Reserve Risk model and validates the capital level re-lated to EH SA TP. It also contributes to the setup of an effective risk management system;
The Actuarial Function is involved in the overall underwriting and pricing policy as well as in the set of reinsurance agreements.
EH SA - Solvency and Financial Condition Report 2017
page 62 of 141
Reporting B.6.1.2.
The Actuarial Function reports regularly (at a minimum, once a year) to the BoD – either via Actuarial Function Report or via committee (e.g. LRC or RiCo) – informing its members on the status of its ac-tivities. Specifically, the report must summarize the work completed and explain the corresponding results, identifying and recommending any areas for improvement.
Ad hoc reports are submitted upon the occurrence of the following events:
The launch or modification of a product
The conclusion of a new reinsurance treaty
When actuarial is required to give its formal opinion regarding any updates or revisions to the underwriting policies and pricing, to the adequacy of the reinsurance arrangements (whether internal or external) and to the rebates and bonus-malus systems (or any similar system)(impact on the BE)
Moreover, at least once a year the Chief Actuarial Officer establishes:
A report on reserving risk in which he testifies the appropriateness of RC amount related to EH SA TP
An opinion on underwriting policy and reinsurance agreements
When he establishes a report, the Chief Actuarial Officer produces and signs an independent opinion on the actuarial processes and on the calculation stemmed from them.
The Actuarial Function is responsible to ensure that all regulatory reporting is completed, validated and submitted as required by the NBB – at least annually, and on an ad hoc basis as requested.
The Actuarial Function must inform the MC and the BoD of any detected change of the risks that could possibly affect EH SA and its reputation.
Independence B.6.1.3.
As a Key Function, actuarial serves a role that is independent of EH SA’s operational activities.
The appointment of the Head of the Actuarial Function is subject to prior approval and an evaluation of its expertise and professional reputation by the NBB.
The dismissal of the Actuarial Function is upon decision of the EH SA BoD and must be communicated to the NBB without delay.
Governance B.6.2.
The EH SA MC is responsible for sound organizational and operational structures and procedures to ensure compliance with the actuarial policy. It establishes and maintains an appropriate and effective Actuarial Function, in proportion to EH SA’s risk exposure. The MC is free to decide on the concrete organizational set-up of the Actuarial Function subject to strict compliance with the EH Group actuar-ial policy principles, tasks and processes.

EH SA - Solvency and Financial Condition Report 2017
page 63 of 141
The EH SA MC decides on and clearly assigns the relevant tasks for the Actuarial Function.
The nomination of the EH SA Actuarial Function holder is pre-aligned with the EH Group Actuarial Function holder.
The EH SA Actuarial Function holder is responsible for the implementation of the EH Group’s Actuari-al Function principles and procedures and is empowered by the management to fulfil this task.
The Head of the EH SA Actuarial Function has a direct access to the EH SA MC
An appropriate committee structure or comparable management meetings is set up in order to ena-ble the Actuarial Function to fulfil its roles and responsibilities.
The Actuarial Function holder is a member of the Loss Reserve Committee.
Interfaces B.6.3.
The Actuarial Function has intense interfaces and a close cooperation with other functions. In line with regulatory requirements, reciprocal oversight is exercised amongst the functions mentioned below. The relationship of the Actuarial Function with the R&CM, Compliance and Internal Audit Functions is as follows:
The Actuarial Function is co-operating closely with the R&CM Function in many areas, in particular the Actuarial Function is:
Providing input and advice regarding the amount, structure and uncertainty of the TP. This in-cludes close interaction with respect to methodologies, models and assumptions commonly used for the calculation of TP as well as for RC;
Contributing to methodologies, models and assumptions used for the assessment of Risk in the area of expertise of the Actuarial Function;
Contributing to the overall risk management process for its area of expertise.
The compliance oversight covers the adequate set-up of the Actuarial Function.
The Actuarial Function (as a 2nd line of defence function) and the Internal Audit Function (3rd line of defence) are separated with no reporting of one function into the other. However, this does not ex-clude to jointly exercise specific tasks in the course of investigations.
Actuarial tasks are included in the audit program and methodology of the Internal Audit Function, including a periodic assessment of the adequacy and effectiveness of the Actuarial Function. The Head of the Internal Audit Function keeps the Actuarial Function holder informed of any audit find-ings relating to actuarial tasks – and vice versa.
Upon request, EH SA Internal Audit Function holder can attend the Loss Reserve Committee at his/her own discretion especially in order to test the operational effectiveness of the committee.

EH SA - Solvency and Financial Condition Report 2017
page 64 of 141
B.7. Outsourcing
EH SA has adopted the global outsourcing policy within its risk management framework.
The outsourcing policy outlines the minimum standards of EH SA outsourcing framework, and in par-ticular, establishes the core principles and processes for the outsourcing of functions and services by EH SA.
Implementation of the outsourcing policy B.7.1.
Definition of outsourcing B.7.1.1.
For the purposes of regulatory notification and approval, the following legal definition applies: out-sourcing’ is an arrangement of any form between an insurance or reinsurance company and a service provider, whether a supervised entity or not, by which that service provider performs a process, a service or an activity critical and essential for EH SA, whether directly or by sub-outsourcing, which would otherwise be performed by the insurance or reinsurance company itself.
The outsourcing contracts detected are then categorized into 3 types:
Outsourcing of Key functions (R&CM, Internal Audit, Compliance, Actuarial, Legal and Accounting & Reporting);
Outsourcing of Critical or Important Functions or Services (CIFS): function or service that is essen-tial to the operation of EH SA, activities that directly impact the customer. It needs a risk-based approach and an overall assessment;
Simple outsourcing: all other services.
The outsourcing policy is applicable to the outsourcing of functions or services provided by a third party (intercompany provider or external provider). EH SA follows two steps to determine whether the outsourcing policy applies:
Determine whether an arrangement with a service provider qualifies as outsourcing in the mean-ing of the outsourcing policy;
Determine whether the outsourcing covers a Key Function, is critical or important, or a simple outsourcing.
A function is defined as an internal capacity to undertake practical tasks within a system of govern-ance, including the Key Functions (R&CM, Internal Audit, Compliance, Actuarial, and two additional Key Functions within EH SA which are Legal and Accounting & Reporting).
A service is defined as an activity, which specifically relates to conducting the core business.
EH SA - Solvency and Financial Condition Report 2017
page 65 of 141
Outsourcing processes B.7.1.2.
The outsourcing processes consist of the following phases:
The decision phase dedicated to define a business plan and perform a risk assessment;
The implementation phase to assess and select the provider and arrange the outsourc-ing agreement;
The operational phase to monitor and steer the outsourced service;
The exit phase to manage the continuity of the services outsourced and issues related to the cancellation of an outsourcing contract.
Tools have been developed by the Group Procurement department to help business owners to de-tect and classify outsourcing correctly.
Among these tools, a checklist, mandatory for all the contracts managed by EH SA, allows to:
Ensure that the outsourcing policy is implemented in the local entities;
Implement correctly the outsourced process/outsourcing contract;
Monitor the performance of the outsourced services.
All contracts are stored on a central repository with the mandatory documentation, following the policy.
For all types of outsourcing the basic requirements during the different phases are the following:
Decision phase:
o Perform group outsourcing policy classification;
o Define Business Owner;
o Check for dependencies;
o Define Business Plan;
o Assess risk a through the risk assessment template and guide.
Implementation phase:
o Involve needed support functions;
o Select Provider;
o Perform Vendor Integrity Screening (VIS) since 1st euro ,Privacy Impact analysis (PIA);
o Perform Due Diligence;
o If sub-outsourcing, EH SA approval is required;
o Ensure other needed approvals & communication;
o Conduct IT security questionnaire (where relevant);
o Negotiate contract, using contract template, including all requested clauses, KPIs & steering process .

EH SA - Solvency and Financial Condition Report 2017
page 66 of 141
Operational phase:
o Monitor activities to follow the provider’s performance;
o Document the monitoring by the Business Owner and with timely escalation to MC;
o Amend agreement if needed;
o Launch contingency plan when needed (anticipated termination or other….);
o For EH Group internal outsourcing: all the outsourcing principles apply.
Exit phase:
o Ensure reversibility aligned with EH SA Business Continuity Plan;
o Return or destroy all the data provided to or generated by the provider, remove of provider’s access to outsourcing EH SA’s systems;
o Ensure transition to “in house “or other vendor.
For outsourcing of CIFS, the following additional requirements are requested:
The entire MC beforehand approves the outsourcing, including sub-outsourcing by external pro-vider;
Set up a Business Continuity Plan (including exit strategy) prior to outsourcing;
Focus more carefully on the provider selection:
o Ensuring relevant aspects of the provider‘s risk management and internal control systems are adequate;
o Verifying the staff of the provider involved in the service are sufficiently qualified;
o Ensuring the provider has adequate Business Continuity Plan in place and periodically test back up facilities (once a year).
EH SA, in a timely manner, notifies in writing the NBB prior to the outsourcing of CIFS, as well as of any subsequent material developments with respect to those functions or activities;
The BoD receives, (at least) once a year, a report on the providers’ performances.
For Key Functions outsourcing, the cumulated requirements for all types of outsourcing and for CIFS outsourcing need to be completed by the following requirements:
The outsourcing of a Key Function requires prior written consent from corresponding Group Key Function holder;
Outsourcing of Key Functions to Group external providers is not permissible;
Business Owner has to be Fit & Proper;
Adequate segregation of responsibilities has to be ensured for the Business Owner;
EH SA needs to notify who is the Business Owner to their responsible supervisory authority.
EH SA - Solvency and Financial Condition Report 2017
page 67 of 141
Roles and responsibilities B.7.2.
Responsibilities of the MC are:
Adopting the EH SA outsourcing policy, adjusted as necessary in order to comply with local regu-latory requirements;
Deploying the policy to all local branches and subsidiaries;
Ensuring compliance with the EH SA outsourcing policy at all times within EH SA;
Responsibilities of the Outsourcing Function are:
Providing operational guidelines for implementing and conducting the outsourcing process in line with the outsourcing policy, where necessary, e.g. through provision of manuals, templates, trainings);
Monitoring EH SA implementation of the outsourcing policy (e.g. conducting self-assessments and onsite reviews), identifying material gaps, informing relevant Group Functions about these gaps and following-up on their timely remediation;
Consolidation of local outsourcing inventories into the EH Group repository ( EHCD);
Collecting and providing the relevant information from and to the relevant organizational units in order to provide the MC with relevant information on outsourcings in EH SA as well as to fulfil the regulatory reporting requirements.
Supporting the Business Owner in performing the tasks under the outsourcing policy.
Responsibilities of EH SA Legal are:
Ensuring adoption of a local outsourcing policy by the MC pursuing the outsourcing where re-quired;
Notifying Group Legal and Group Procurement about conflicts of the outsourcing policy with local law or regulations and request and document approvals for material deviations from the outsourcing policy;
Advising on how to implement the outsourcing policy within EH SA;
Assisting the designated Business Owner in assessing whether:
o An arrangement with a service provider qualifies as outsourcing under the outsourc-ing policy, and if so, whether the outsourced function/service is a Key Function or a CIFS;
o Any claims against the Provider are asserted in case the outsourcing agreement is terminated.
Drafting/reviewing outsourcing agreements;
Notifications/applications to supervisory authority, if required by Belgian law.

EH SA - Solvency and Financial Condition Report 2017
page 68 of 141
Responsibilities of R&CM are:
Monitoring and overseeing outsourcing risks (e.g. operational and concentration risks) in the context of the IRCS;
Supporting the outsourcing designated Business Owner in the risk assessment and Due Diligence process (in particular with a view to the adequacy of the Provider’s risk management and internal control system);
Monitoring the implementation of this policy (evidence collection), in coordination with the rele-vant departments.
Finally, the designated Business Owner must ensure adherence to the outsourcing policy and fulfil all tasks that have been assigned to EH SA in the outsourcing policy with respect to the outsourcing(s) for which he is responsible. In particular, the designated Business Owner is in charge of:
Assessing whether an arrangement with a service provider qualifies as outsourcing under the outsourcing policy, and if so, whether the outsourced function/service is a Key-Function or a CIFS;
Setting-up the necessary Business Plan and risk assessment, including the screening of any out-sourcing against the criteria of the outsourcing policy;
Undertaking Due Diligence with regard to the Provider;
Involving the relevant organizational units in the outsourcing process;
o Obtaining all necessary approvals e.g. from the MC or equivalent governance body and the EH Group Key Function holder in case of Key Function;
o Involving the Legal Function in the drafting of the outsourcing agreement;
o Providing regular performance report to the MC or equivalent governance body when outsourcing Key-Functions or other CIFS;
Setting-up the necessary contingency plans and exit strategies together with Business Continuity Management Officer in case of outsourcing CIFS;
Monitoring the outsourcing and making amendments to the outsourcing where necessary;
Taking the appropriate measures in case of any adverse event or termination of the outsourcing, involving the Key Functions and Information Security Officer;
Adequately documenting each individual step of the outsourcing process and delivering the out-sourcing agreement and key supporting documentation for central storing to local Outsourcing Function;
In case of termination, assessing together with the Legal Function whether any claims against the Provider are asserted.
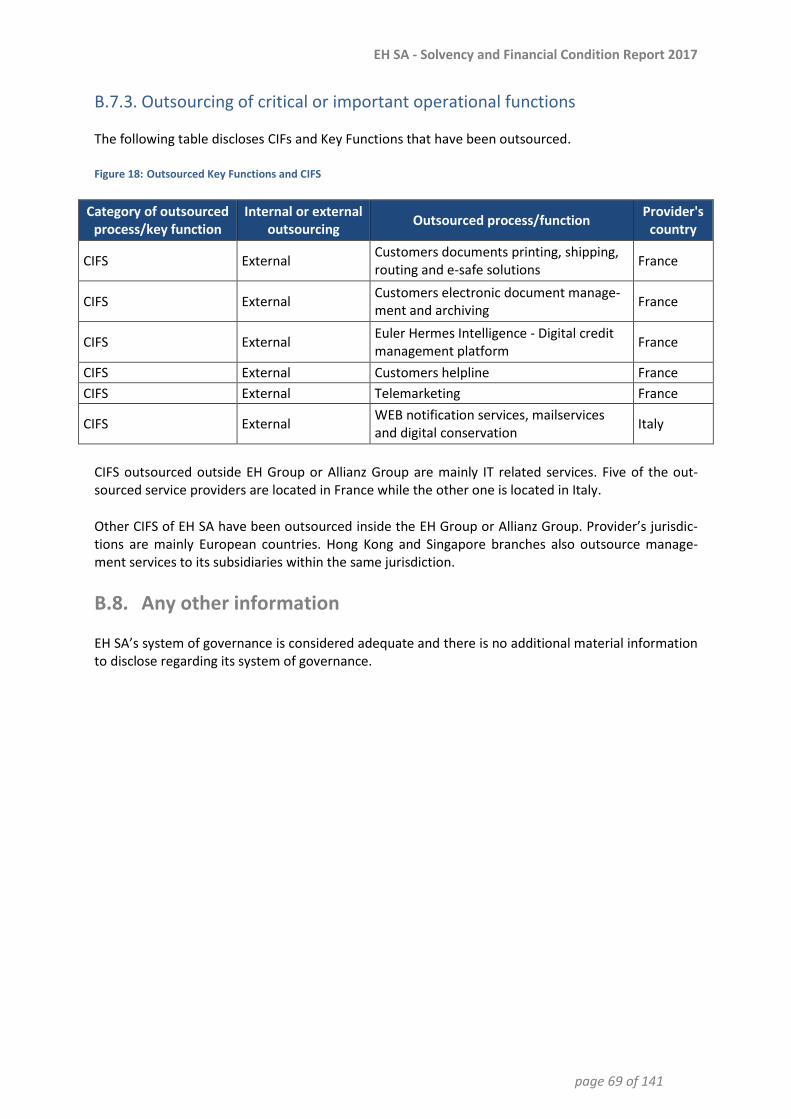
EH SA - Solvency and Financial Condition Report 2017
page 69 of 141
Outsourcing of critical or important operational functions B.7.3.
The following table discloses CIFs and Key Functions that have been outsourced.
Outsourced Key Functions and CIFS Figure 18:
Category of outsourced process/key function
Internal or external outsourcing
Outsourced process/function Provider's
country
CIFS External Customers documents printing, shipping, routing and e-safe solutions
France
CIFS External Customers electronic document manage-ment and archiving
France
CIFS External Euler Hermes Intelligence - Digital credit management platform
France
CIFS External Customers helpline France
CIFS External Telemarketing France
CIFS External WEB notification services, mailservices and digital conservation
Italy
CIFS outsourced outside EH Group or Allianz Group are mainly IT related services. Five of the out-sourced service providers are located in France while the other one is located in Italy.
Other CIFS of EH SA have been outsourced inside the EH Group or Allianz Group. Provider’s jurisdic-tions are mainly European countries. Hong Kong and Singapore branches also outsource manage-ment services to its subsidiaries within the same jurisdiction.
B.8. Any other information
EH SA’s system of governance is considered adequate and there is no additional material information to disclose regarding its system of governance.

EH SA - Solvency and Financial Condition Report 2017
page 70 of 141
Risk profile C.
C.1. Underwriting Risk
Description of the measures used C.1.1.
EH SA’s Risk Management team measures and assesses its risks using EH SA’s Internal Model. Further details on the methodologies used within the IM for Underwriting Risk can be found in section E.4.2.1.2.
The IM reflects the risk profile of EH SA and is used to measure the solvability through the RC. The model has to be used in both strategic and tactical decisions to ensure that a sufficient risk tolerance is respected. Based on that, the IM is appropriate for all the different decisions that can be taken within EH SA that have an impact on the risk profile.
Description of the risk exposure C.1.2.
Property & Casualty (P&C) Underwriting Risk is the main component of EH SA’s Underwriting Risk, which is composed by:
Premium Risk for fidelity LoB: the risk of loss because of an unexpected high loss volume result-ing in an insufficient coverage of premiums. Premium Risk is subdivided in Catastrophe Risk (CAT Risk) and Non-Catastrophe Risk (Non-CAT Risk);
Reserve Risk: the risk of loss resulting from deviations between payments for incurred losses that have not yet been definitively settled and the reserves set up to cover these payments, or the use of an insufficient basis for the calculation of reserves.
The standalone RC calculated for the P&C (Property and Casualty) Underwriting Risk amounts to 148M€, decreasing by 7% compared to 2016. This decrease is mainly due to higher internal cession rate of the reinsurance treaties for the fidelity business compared to 2016.
Description of assets investment C.1.3.
Please refer to Section C.2.3 of this report for information regarding how assets have been invested in accordance with the “prudent person principle” so that EH SA’s risks have been properly managed.
Risk concentration C.1.4.
Please refer to Section C.3.4 of this report for a description of the material risk concentrations to which EH SA is exposed.
Risk mitigation C.1.5.
EH SA purchased reinsurance coverage, including both proportional and non-proportional treaties, and cedes a significant amount of premium from credit insurance within QS/ excess of loss reinsur-ance. Reinsurance is the only risk mitigation technique implemented by EH SA that is considered to be material. In particular, EH SA does not use any SPVs.

EH SA - Solvency and Financial Condition Report 2017
page 71 of 141
To form its opinion on the effectiveness of reinsurance arrangements, EH Group Actuarial Function conducts the quarterly Loss Reserve Meetings for EH Re AG, where the estimated cessions of EH Group to EH Re AG are monitored. Moreover, the EH Group Actuarial Function participates on a regular basis to the reinsurance committee meetings organized by EH Re AG where the profitability of assumed business and potential changes on the internal and external reinsurance cessions are discussed.
Expected Profit Included in Future Premiums (EPIFP) C.1.6.
Please refer to Section C.2.6 of this report for information on the total amount of the EPIFP.
Risk sensitivity C.1.7.
Information on relevant stress tests and scenario analysis, as well as the underlying methods and main assumptions, can be found in Section C.2.7 of this report.
C.2. Market Risk
Description of the measures used C.2.1.
EH SA’s risk management team measures and assesses its risks using EH SA’s internal RC model. Fur-ther details on the methodologies used within the IM for Market Risk can be found in Section E.4.2.1.1.
In 2017, two packages of major model changes were implemented. First, the package of major model changes submitted in August 2016 was implemented in 1Q 2017 following the supervisory approval in February 2017. These changes were already described in last year’s SFCR.
This package consisted in 3 relevant central model changes for EH SA regarding Market Risk as de-scribed in the table below:
Market Risk model changes Figure 19:
Model Change Short Name
Affected Module
Model Change short description
Credit Spread Model Market Risk
Incremental spread modelling
Improved coverage of adverse historical shocks
Term structure of credit spreads is modelled
Improved adequacy of high yield risk charges
Avoidance of rating hierarchy violations
Pensions IAS19 Market Risk/LNMR
Basic SCR calculations on IAS19 values instead of current economic basis
Economic Scenario Generator -new in-terest rate para-metrization
Market Risk Enhanced flexibility of model volatility function and in-creased skew
A second package of major model changes was implemented in 2017. It aims at introducing negative interest rates and was submitted in May 2017. The implementation was done in Q4 2017.
EH SA - Solvency and Financial Condition Report 2017
page 72 of 141
Interest rate modelling is at the core of almost all modules of the IM; therefore the introduction of negative interest rates impacted most of them (e.g. Market Risk, Credit Risk…)
The Model Change Application Package (MCAP) was performed according to IM governance and MC process incl. validation and approval. All changes of central and local modules were validated as fully appropriate.
Description of the risk exposure C.2.2.
Within EH SA, Market Risk is composed of the following risks:
Interest Rate Risk: the risk of loss which can arise due to changes in market interest rates e.g. If future interest income is above or below a fixed or guaranteed interest rate applicable to re-serves;
Equity Risk: the risk of loss based on market changes in the value of an equity or a participation portfolio;
Equity Volatility Risk: it measures an adverse move in implied volatilities of equity options;
Property (Real Estate) Risk: the risk of loss arising from changes in the market price for property investments;
Spread Risk: the risk due to exposure to some spread. It often arises with a long-short position or with derivatives;
Foreign Exchange, Currency Risk: the risk of loss arising from changes in foreign currency ex-change rates;
Market Risk concentrations.
The standalone Market RC amounts to 322M€, decreasing by 30M€ (-8%) compared to 2016.
As required by the Directive, the calculations of these sub-risks are mainly based on the assets mar-ket values and market conditions.
The evolution of the sub-risk components has to be analysed by correlation with the underlying as-sets.
Interest Rate Risk: the large decrease of the Interest Rate Risk is mainly driven by the model changes introduced at the beginning of 2017 with a new interest rate parametrization in the Economic Scenario Generator and at the end of 2017 with the introduction of negative interest rate in the model, partially offset by model changes related to pension funds;
Credit Spread Risk: the increase of the Credit Spread Risk is mainly due to the changes in the Credit Spread Model. The increase of exposure of BBB government and corporate bonds explains most of the remaining evolution;
Exchange Rate Risk: the decrease of the FX RC is mainly driven by portfolio changes. Indeed, the net exposure in non-EUR currencies decreased by about 30%. At the same time, the exposure in EUR is rather stable;
Inflation Risk: the increase of Inflation Risk is mainly due to new modelling of Inflation Risk for DE Pension Fund, switching from a stochastic to a deterministic approach.

EH SA - Solvency and Financial Condition Report 2017
page 73 of 141
Equity Risk: the decrease of the Equity Risk is mainly due to the following events :
o Change in the market conditions with a decrease of the volatility, mainly on the listed equities;
o Fall of the EH Credit France strategic participation market value, following a dividend payment;
Real Estate Risk : The evolution of the Real Estate Risk is mainly explained by reclassifications. CBRE1 has been reclassified from equity to real estate and two real assets were changed from low to high volatility.
Description of assets invested C.2.3.
EH SA actively manages its investment portfolio and is actively taking investment risks in a controlled and limited manner. This is based on the firm belief that by taking risks on the investment side addi-tional value can be generated on a mid to long-term basis, i.e. that the additional return on invest-ments overcompensates the additional cost of capital in the mid to long-run.
This approach results in a mid to long-term focused investment policy with an emphasis on SAA and the goal of realising the long-term risk premium of asset classes.
Tactical asset allocation is used on a limited basis as an enhancement to the SAA in order to profit from market opportunities. The investment activities follow the general principles of a congruent ALM with a sufficient duration and currency matching within prescribed limits. All technical reserves are supported by investments made by Investment and Treasury Group in respect with local regula-tion.
EH SA’s investment strategy aims for a positive global mid to long-term (3-5 years) risk adjusted after tax investment return considering:
Local as well as group-wide external and internal regulations, and policies;
Risk-bearing capacity and risk tolerance of EH SA and its shareholders;
General principles of a congruent ALM;
Return objectives, expectations, and risk tolerance of the shareholders;
Expectations of external parties (e.g. Regulators, rating agencies, clients).
While pursuing the investment philosophy and objectives outlined, investment management and risk controlling at EH SA are based on a common understanding of the investment and ALM related risks and comprehensively defined risk management and controlling processes embedded in clear and transparent organizational and governance structures, whereby the following principles apply.
Prudent Person Principle (refers to the Solvency II European Union (EU) C.2.3.1.Directive)
EH SA only invests in assets and instruments whose risks can be properly measured, managed and controlled, taking into account the assessment of its overall solvency needs.
1 CBRE is a consulting company in real estate.

EH SA - Solvency and Financial Condition Report 2017
page 74 of 141
All assets are invested in such a manner as to ensure the security, quality, liquidity and profitability of the portfolio as a whole.
Assets held to cover the TP are also invested in a manner appropriate to the nature and duration of the insurance and reinsurance liabilities. Those assets are invested in the best interest of policyhold-ers and beneficiaries.
In the case of a conflict of interest, EH SA ensures that the investment is made in the best interest of policyholders and beneficiaries.
The use of derivative instruments is possible insofar as they contribute to a reduction of risks or facil-itate efficient portfolio management.
Focus on liquid, high quality, low risk assets C.2.3.2.
The predominant portion of the portfolio is invested in cash and liquid, tradable, high quality securi-ties, mainly: developed market treasuries, government related bonds and covered bonds. Further diversification in credit investments (e.g. corporate bonds, ABS, Mortgage-Backed Securities, emerg-ing market bonds) are allowed within pre-defined risk limits. Main technical reserves are supported by investments in cash and fixed income securities. Parts of the reserves and the economic net asset value might be invested in equity and real estate within pre-defined risk limits. The investment uni-verse encompasses:
Fixed Income Instruments:
o Cash;
o Treasuries / government related bonds;
o Securitised and collateralised bonds;
o Corporate bonds;
Equity;
Real estate;
Alternative: private equity and derivatives (for hedging purposes only);
Strategic investments in the group subsidiaries and other related companies are excluded from the scope of asset management as they are managed according to specific rules (Joint Venture for example).
Other alternative asset classes are currently not part of the investment universe, but might be in-cluded in the light of risk diversification in a very limited way. The introduction of new asset classes and investment products/mandates is subject to the approval of the FiCo.
Asset-Liability-Management C.2.3.3.
The investment activities follow the general principles of a congruent ALM with a sufficient duration and currency matching within prescribed limits. The duration differences between assets and liabili-ties and the net foreign currency exposure are regularly monitored and appropriate actions and hedges are executed.
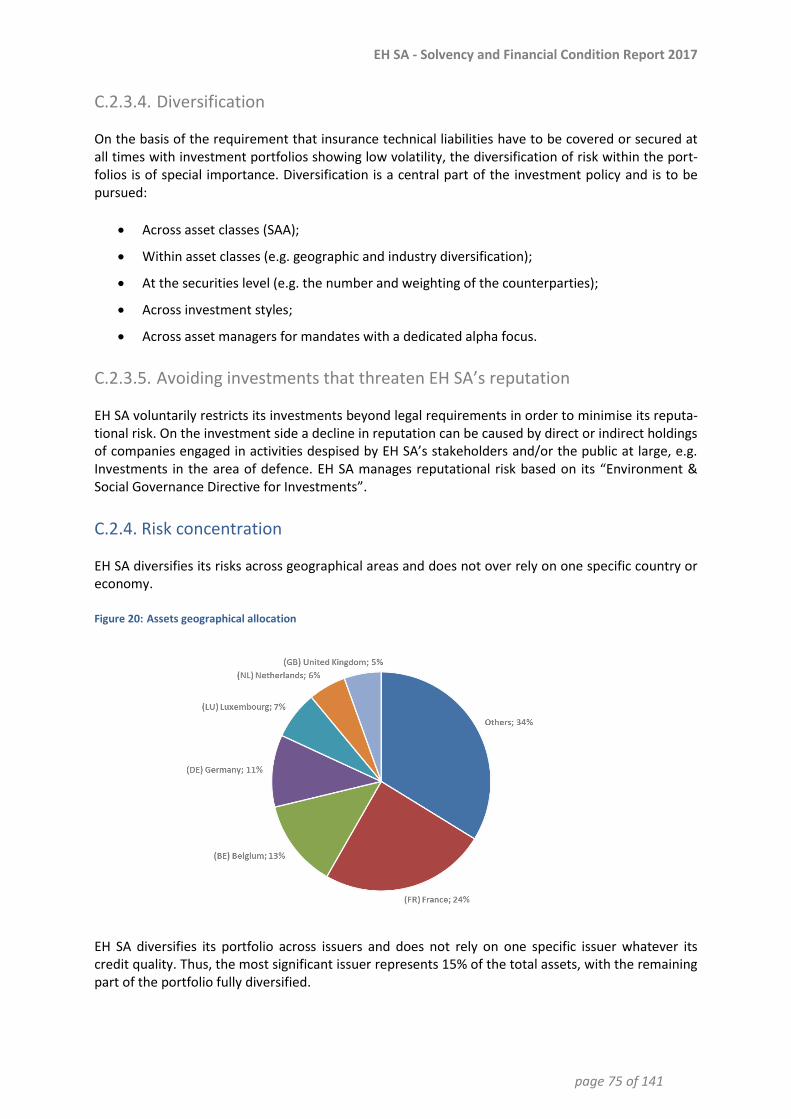
EH SA - Solvency and Financial Condition Report 2017
page 75 of 141
Diversification C.2.3.4.
On the basis of the requirement that insurance technical liabilities have to be covered or secured at all times with investment portfolios showing low volatility, the diversification of risk within the port-folios is of special importance. Diversification is a central part of the investment policy and is to be pursued:
Across asset classes (SAA);
Within asset classes (e.g. geographic and industry diversification);
At the securities level (e.g. the number and weighting of the counterparties);
Across investment styles;
Across asset managers for mandates with a dedicated alpha focus.
Avoiding investments that threaten EH SA’s reputation C.2.3.5.
EH SA voluntarily restricts its investments beyond legal requirements in order to minimise its reputa-tional risk. On the investment side a decline in reputation can be caused by direct or indirect holdings of companies engaged in activities despised by EH SA’s stakeholders and/or the public at large, e.g. Investments in the area of defence. EH SA manages reputational risk based on its “Environment & Social Governance Directive for Investments”.
Risk concentration C.2.4.
EH SA diversifies its risks across geographical areas and does not over rely on one specific country or economy.
Assets geographical allocation Figure 20:
EH SA diversifies its portfolio across issuers and does not rely on one specific issuer whatever its credit quality. Thus, the most significant issuer represents 15% of the total assets, with the remaining part of the portfolio fully diversified.

EH SA - Solvency and Financial Condition Report 2017
page 76 of 141
Moreover, EH SA does not expect any foreseeable specific risk concentration over the business plan-ning period.
Risk mitigation C.2.5.
Market Risk mitigation is performed by applying investment strategies to mitigate high volatility as-sets as well as a regular monitoring of the investments. These strategies are applied through quanti-tative financial limits which are one of the components of the Risk Appetite defined in the Risk Strat-egy. They include different kinds of limits.
The SAA is a target asset allocation set yearly by the FiCo in order to ensure a balance between the assets yields and the related RC. Quarterly, FiCo reviews the SAA so it reflects the Risk Appetite de-fined within EH SA. The FiCo also discusses every decision concerning investment strategy. This way EH SA can effectively monitor investment risks.
EH SA has also in place monthly monitoring by realizing monthly financial reporting and closing on investment performance.
The daily use of Bloomberg allows EH SA to perform a day-to-day monitoring of its assets.
Finally EH SA has Over-The-Counter puts on equity to mitigate risk issued from the assets which are more volatile. The main goal of this strategy is to avoid the recognition of any impairment. Regarding current market situation, protection on equity can be provided at low cost.
As of 2017, no breach has been identified over the SAA.
Expected profit included in future premiums C.2.6.
EH SA’s EPIFP in future premiums amounts to 50.1M€.
Risk sensitivity C.2.7.
EH SA has designed and implemented a firm-wide program covering stress testing, reverse stress testing and scenario analysis.
For stress tests, EH SA usually follows standard shocks in line with European Insurance and Occupa-tional Pensions Authority (EIOPA) recommendations. For scenario analysis and reverse stress tests, a dedicated process is run by the Enterprise Stress Testing Group (ESTG) which is a panel made of risk, business and economic experts who meet on an annual basis to identify up to 5 most relevant stress scenarios for the year to come. These scenarios are subsequently proposed to the EH SA RiCo for review and selection.
Standard financial stress scenarios C.2.7.1.
EH SA’s solvency position is challenged on an annual basis against a set of different financial stress scenarios in line with the EIOPA recommendations. In 2017, the following scenario effects were ana-lysed:
Equity drop: -30% in market values of all equity investments;
Interest rates up: +100 basis points (bps) in interest rate;
EH SA - Solvency and Financial Condition Report 2017
page 77 of 141
Interest rates down: -100 bps in interest rate;
Credit spread: +100 bps in credit spread on corporate and ABS bonds;
Combined scenario: -30% in market values of all equity investments and -100 bps interest rate.
None of these scenarios causes a major decrease of SII ratios.
Reverse stress tests C.2.7.2.
Taking into account its core business and its RC breakdown, EH SA has opted for using its local credit insurance model component for identifying its reverse stress test scenarios. In that respect, and simi-larly to 2016, EH SA has looked at the tail of its gross loss distribution simulated by its model, before any reinsurance effect, and identified the first scenario above the 99.5% quantile which would breach its capital position and threaten its survival.
From this scenario, EH SA ESTG has subsequently identified the macroeconomic and business envi-ronment that could lead to such a situation as well as its likelihood. To that respect, the analysis was based on a set of aggregated indicators and statistics out of the scenarios, e.g. Top 20 countries’ de-fault rates, top 20 industry sectors’ default rates, top 50 counterparties’ loss amounts, etc. From there, a set of risk drivers affecting the global economy as well as the industry sectors were identified and their aggregated impact assessed.
The conclusion reached from this analysis is that a combination of the above macro events would be very unlikely even in a severe situation. The analysis made use of historical statistics up to 2007 per country and revealed that compared to the 2008 financial crisis, the above scenario in terms of fre-quency would be 2 to 3 times higher. As a result of that, the only common denominator to such an unlikely macro situation has been identified as being a CAT event.
Scenario analysis C.2.7.3.
To complete the analysis about the resilience of its solvency positions, EH SA has developed addi-tional scenario analysis.
EH SA ESTG has identified and proposed to the EH SA RiCo a set of relevant ‘business’ scenarios for analysis:
2008/2009 financial crisis: the financial crisis is designed to be a recurrent scenario as it serves as a benchmark given its severity level since the events of 1929;
Hard Brexit: this scenario is designed to capture the potential impact of a situation where no agreement has been reached between UK and EU;
IT outage: this scenario is designed to capture the impact of the failure of a major IT system.
Under such scenarios, EH SA’s solvency position at the end of 2017 would remain above regulatory requirements.
Only the scenario similar to the 2008/2009 financial crisis would make the SCR drop below the mini-mum capital ratio set by the MC for capital management purposes. As a consequence, EH SA would need to take corrective actions in this situation.

EH SA - Solvency and Financial Condition Report 2017
page 78 of 141
C.3. Credit Risk
Description of the measures used C.3.1.
EH SA’s Risk Management team measures and assesses its risks using EH SA’s Internal RC Model. Further details on the methodologies used within the IM for Credit Risk can be found in Section E.4.2.1.3.
As for Market Risk, in 2017, only the second package of major model changes had an impact. This second package introduced negative interest rates and also has an impact on Credit Risk, as men-tioned in section C.2.1.
Description of the risk exposure C.3.2.
Within EH SA, Credit Risk is composed of the following risks:
Counterparty Default Risk: the risk of loss due to default of the counterparty within the con-text of transactions e.g. Derivative, reinsurance, loans etc;
Credit Risk attached to credit insurance & surety: Credit Risk that can arise either from the risk of loss in the economic value of credit exposures because of deterioration in the credit quality of counterparties (migration risk) including their defaults, or non-performance of in-struments. Default occurs as the result of the inability or unwillingness to fulfil contractual obligations;
Country Transfer Risk: the risk of loss arising from cross-border transactions as a result of transfer and convertibility risks (e.g. the risk of a country not being able to make payments due, freeze on deposits or limitations on foreign currency transfers);
Issuer/Investment Credit Risk: the risk of loss arising from an unexpected change in the cre-ditworthiness (migration or default) or collateral of a debtor. Default occurs as the result of the inability or unwillingness to fulfil contractual obligations;
Settlement Risk: the risk of loss arising from trading activities when there is a mutual under-taking to deliver on a progressive basis, for example when the trading centres fall within dif-ferent time zones, and the counterparty does not fulfil its contractual obligations, despite the fact that the other party to the contract has already performed its duties.
The Credit Risk Portfolio is subdivided in 4 different risk categories: investment, reinsurance, insur-ance and German pension funds.
The total standalone Credit RC decreased by 8.9M€ between 2016 and 2017 and the insurance port-folio represents almost 90% of the global Credit RC.

EH SA - Solvency and Financial Condition Report 2017
page 79 of 141
Credit RC per activities (in M€) Figure 21:
In M€ Q4 2017 Q4 2016 ∆
Investment portfolio 9.8 6.7 3.1
Reinsurance portfolio 21.5 21.2 0.3
Insurance portfolio 308.1 318.6 -10.5
Pension funds 3.5 4.0 -0.5
Total Standalone 342.9 351.7 -8.9
Total diversified 333.7 338.4 -4.6
As shown above, the overall result is fairly stable.
a. Credit Risk on the reinsurance portfolio
The Reinsurance portfolio RC is calculated through the Allianz tool MKMV.
The Credit Risk on the reinsurance portfolio remained stable over the period. The slight evolution observed is due to the evolution of exposure.
b. Credit Risk on the investment portfolio
The investment portfolio RC is calculated through the Allianz tool MKMV.
The Credit Risk on the investment portfolio increased (3.1M€) compared to Q4 2016. This increase is mainly driven by an overestimation of the RC by around 1.6M€ on 3 joint sureties and the introduc-tion of a new guarantee of 62M€, adding 0.8M€ to Credit RC.
c. Pension funds
The Pension funds stand for 1.0% of the global credit RC, therefore it is deemed non material. More-over, the RC on the Pension Funds was globally stable over the period.
d. Credit Risk on the insurance portfolio
The RC related to the insurance portfolio has decreased by 10.5 M€, mainly due to:
According to the Q1 2017 PAAC decision, parameters were estimated in a best-estimate ap-proach (free of any implicit over-prudency) and an explicit prudency margin was introduced to account for the uncertainty around the calibration of the (best-estimate) parameters (a prudency margin was already introduced for UK in Q4 2016 but was increased in Q1 2017).
The introduction/increase of the prudency margin led to an increase of the risk capital, partially offset by the review of the parameters in a best-estimate approach and usual update of parame-ters.
The reinsurance conditions on bonding changed. The local retention for this LoB decreased dras-tically affecting directly the level of RC associated to it;
A new scaling approach was implemented for the non-modelled entities, using locally defined factors (per grade) instead of group average factors. This method was roll-out on Turkey and GCC in Q4 2017, leading to an increase in RC (Credit Insurance scaling).

EH SA - Solvency and Financial Condition Report 2017
page 80 of 141
Description of assets investment C.3.3.
Please refer to Section C.2.3 for information regarding how assets have been invested in accordance with the “prudent person principle” so that EH SA’s risks have been properly managed.
Risk concentration C.3.4.
Trade credit insurance is the core business of EH SA. Thus, several processes have been put in place to closely monitor the EH SA’s portfolio quality and risk.
Large risks management process
The methodology is to identify the largest and most sensitive buyers and ensure there is a granular review of each risk. A standard template has been defined which presents the key metrics and pro-prietary analysis maximising the expertise and local knowledge from each country.
Concentration risk management processes
The evolution of the total exposure is monitored through three different dimensions to avoid con-centration risk: the grade, the country and the trade sector. The portfolio is strongly diversified on each of these dimensions.
EH SA has succeeded in allocating its exposure in a well-proportioned manner and thus limiting the risk that may arise from a trade sector dependency or from a certain category of buyers or countries. Both the most sensitive buyers and the most sensitive countries are closely monitored.
Risk mitigation C.3.5.
For Credit Risk, please refer to Section C.1.5 of this report for information regarding relevant risk mitigation techniques.
Expected Profit Included in Future Premiums C.3.6.
Please refer to Section C.2.6 of this report for information on the total amount of the EPIFP.
Risk sensitivity C.3.7.
Please refer to section C.2.7 of this report for information on relevant stress tests and scenario analy-sis, as well as the underlying methods and main assumptions.
C.4. Liquidity Risk
Description of the measures used C.4.1.
The Liquidity Risk is the risk that EH SA would not be able to meet its short-term current or future payment obligations as and when they fall due. This comprises insufficient liquidity resources to meet payment obligations under current (base case scenario) as well as potential future conditions (stress scenarios).
EH SA - Solvency and Financial Condition Report 2017
page 81 of 141
Liquidity Risk management is a component of EH SA Risk Appetite and is a core part of the financial planning, taking into account the cash flow schedule as well as capital allocation process.
In accordance with the Liquidity Risk Management Standard, an analysis is performed on a quarterly basis to identify accurately the resources and needs of liquidity and to simulate the evolution of EH SA liquidity ratio on different time horizons and in different conditions.
In this approach, we consider the liquidity ratio as being the fraction of needs of liquidity over re-sources of liquidity.
Liquidity resources mainly come from premiums, reinsurance receivables and investment inflow;
Liquidity needs mainly include policyholder benefits and claims and related expenses, reinsurance payables, operating expenses, dividends and planned purchase or re-purchase of assets.
According to the Risk Appetite of EH SA, the liquidity ratio is managed through the following thresholds:
Ratio>100%: Red (action level);
100%>Ratio>80%: Amber (alert level);
Ratio<80%: Green (validated in the EH SA Risk Appetite).
In case of breaching, countermeasure actions can be made such as asset sales, a diminution of the dividends and a stop in assets purchasing.
Description of the risk exposure C.4.2.
The Liquidity Risk management framework is built on a regular Liquidity Risk assessment and supervi-sion, made by regular monitoring of liquidity positions.
To this end, EH SA monitors quarterly the market values of its assets and their classification in terms of liquidity.
This monitoring especially aims at gauging the liquid assets that EH SA could sell in a short period of time in case the liquidity ratio raises over 100%. Such asset sales are part of the “countermeasures” considered in the quarterly liquidity analysis.
The projection of the liquidity resources and needs under current market conditions over the next 12 months shows that EH SA would always manage to have enough liquid inflows to cover its needs.
As in 2016, liquidity risk is not a material risk in 2017 but it is part of EH SA’s risk profile.
Description of assets investment C.4.3.
Please refer to Section C.2.3 of this report for information regarding how assets have been invested in accordance with the “prudent person principle” so that EH SA’s risks have been properly managed.
EH SA - Solvency and Financial Condition Report 2017
page 82 of 141
Risk concentration C.4.4.
EH SA is not exposed to any material risk concentration regarding Liquidity Risk.
Risk mitigation C.4.5.
EH SA does not enter into specific risk mitigation techniques for Liquidity Risk.
Expected Profit Included in Future Premiums C.4.6.
Please refer to Section C.2.6 of this report for information on the total amount of the EPIFP.
Risk sensitivity C.4.7.
Stressed conditions are applied with a calibration so as to reflect extreme circumstances, and include financial markets stress, large claims simulations, disruption in premium collection, etc. As for busi-ness stress scenarios, EH SA identified many liquidity stress scenarios and chose to perform the one which appeared to be the most relevant for 2017.
The scenario selected for 2017 was a deterioration of the market conditions leading to an economic crisis, a recession event which implies an increase of the claim frequency for credit insurers. Thus, a combination of a market stress scenario and a recession scenario (Reserve Risk + Credit Risk) was simulated.
In this scenario, the liquidity ratio never goes up to more than the 80% threshold within 12 months as EH SA could succeed in keeping a level of liquidity sources far above the level of liquidity needs, thanks to the possible use of the different countermeasures identified.
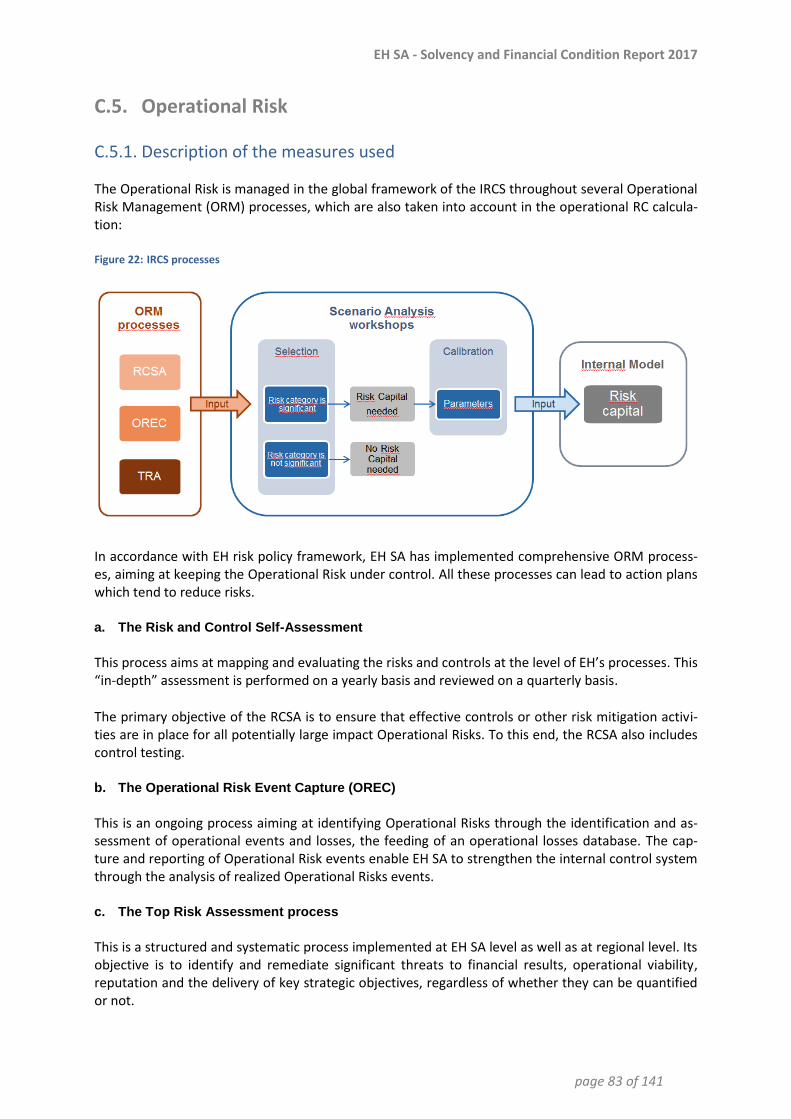
EH SA - Solvency and Financial Condition Report 2017
page 83 of 141
C.5. Operational Risk
Description of the measures used C.5.1.
The Operational Risk is managed in the global framework of the IRCS throughout several Operational Risk Management (ORM) processes, which are also taken into account in the operational RC calcula-tion:
IRCS processes Figure 22:
In accordance with EH risk policy framework, EH SA has implemented comprehensive ORM process-es, aiming at keeping the Operational Risk under control. All these processes can lead to action plans which tend to reduce risks.
a. The Risk and Control Self-Assessment
This process aims at mapping and evaluating the risks and controls at the level of EH’s processes. This “in-depth” assessment is performed on a yearly basis and reviewed on a quarterly basis.
The primary objective of the RCSA is to ensure that effective controls or other risk mitigation activi-ties are in place for all potentially large impact Operational Risks. To this end, the RCSA also includes control testing.
b. The Operational Risk Event Capture (OREC)
This is an ongoing process aiming at identifying Operational Risks through the identification and as-sessment of operational events and losses, the feeding of an operational losses database. The cap-ture and reporting of Operational Risk events enable EH SA to strengthen the internal control system through the analysis of realized Operational Risks events.
c. The Top Risk Assessment process
This is a structured and systematic process implemented at EH SA level as well as at regional level. Its objective is to identify and remediate significant threats to financial results, operational viability, reputation and the delivery of key strategic objectives, regardless of whether they can be quantified or not.

EH SA - Solvency and Financial Condition Report 2017
page 84 of 141
The TRA process is based on a quarterly review and monitoring, with a full run exercise once per year.
Its scope covers all risk categories defined in the Group risk policy (i.e. Market, Credit, Underwriting, Business, Operational, Reputational, Liquidity and Strategic Risk) as well as concentration and emerg-ing risks. For each of the top risks, respective EH SA’s MC members are defined as risk owners and define a target score.
For the top risks identified, the “probability” and “impact” are assessed and form an “actual score”, compared to a “target score”.
The “impact” is the highest score between the economic impact and the reputational impact, if any.
The “target scores” of all top risks are part of the overall Risk Appetite, which is formally approved by the MC. If the actual score is higher than the target score, the risk owner is responsible for ensuring that a documented risk mitigation plan is in place.
d. Scenario Analysis workshops
Each year, “Scenario Analysis” workshops are organized with EH SA experts in order to set the IM parameters to be used to calculate the operational RC.
The inputs for these workshops are the results and assessments of the ORM processes described above, aiming at helping an appropriate calibration of the parameters.
Description of the risk exposure C.5.2.
EH SA’s definition of Operational Risk, as well as several sub-categories of this risk:
Operational Risk: the risk of loss resulting from inadequacies or failures in processes or con-trols due to technical resources, people, organization or external factors;
Legal Risk: the risk of loss caused by non-compliance with existing or new legislation or su-pervisory regulations, disadvantageous changes to existing laws or supervisory regulations, as well as the risk of a loss resulting from material litigation or regulatory proceedings, in par-ticular through disadvantageous interpretations of laws by courts. Furthermore, Legal Risk includes losses due to ambiguity of laws or unfavourable contract clauses. Legal Risk does not constitute a separate risk category, as it is captured within the Operational Risk
Financial Misstatement Risk: the risk of loss caused by issuing external financial reports which are not fairly stated in all material respects. Financial misstatement risk is partially covered within the Operational Risk.
EH SA’s standalone operational RC increased by 60% from Q4 2016 to Q4 2017 and amounts to 53M€. This evolution is explained by a model change that occurred during Q1 2017.
Description of assets investment C.5.3.
Please refer to Section C.2.3 for information regarding how assets have been invested in accordance with the “prudent person principle” so that EH SA’s risks have been properly managed.

EH SA - Solvency and Financial Condition Report 2017
page 85 of 141
Risk concentration C.5.4.
EH SA is not exposed to any material risk concentration regarding Operational Risk.
Risk mitigation C.5.5.
EH SA does not enter into specific risk mitigation techniques for Operational Risk.
Expected Profit Included in Future Premiums C.5.6.
Please refer to Section C.2.6 for information on the total amount of the EPIFP.
Risk sensitivity C.5.7.
Please refer to section C.2.7 of this report for information on relevant stress tests and scenario anal-yses, as well as the underlying methods and main assumptions.
C.6. Other material risks
EH SA is not concerned by any other material risks.
C.7. Any other information
EH SA does not have any additional information to disclose regarding its risk profile.

EH SA - Solvency and Financial Condition Report 2017
page 86 of 141
Valuation for solvency purposes D.
D.1. Assets
Valuation of assets D.1.1.
The following table summarizes the amounts for EH SA assets, classified by asset classes as disclosed in the Quarterly Reporting Templates (QRT), for both MVBS valuation and BeGAAP valuation.
It is to be noted that the BeGAAP balance sheet disclosed in this report, including assets and liabili-ties, is not the balance sheet from Belgian statutory accounts but it is a mapping of the MVBS bal-ance sheet.
Asset (MVBS vs BeGAAP) Figure 23:
In K€ MVBS BE GAAP
Goodwill 0 1 574
Deferred acquisition costs 0 -30 419
Intangible assets 0 76 023
Deferred tax assets 17 886 0
Pension benefit surplus 0 0
Property, plant & equipment held for own use 31 539 13 628
Investments (other than assets held for index-linked and unit-linked contracts) 2 044 683 1 875 714
Property (other than for own use) 4 881 618
Holdings in related undertakings, including participations 591 343 430 139
Equities 10 145 40 664
Equities - listed 327 35 042
Equities - unlisted 9 818 5 622
Bonds 1 236 154 1 210 310
Government Bonds 323 636 317 759
Corporate Bonds 910 711 890 744
Structured notes 0 0
Collateralised securities 1 807 1 806
Collective Investments Undertakings 105 582 97 940
Derivatives 2 425 1 890
Deposits other than cash equivalents 79 198 79 198
Other investments 14 955 14 954
Assets held for index-linked and unit-linked contracts 0 0
Loans and mortgages 91 568 91 057
Loans on policies 0 0
Loans and mortgages to individuals 0 0
Other loans and mortgages 91 568 91 057
Reinsurance recoverables from: 951 358 1 121 667
Non-life and health similar to non-life 951 358 1 121 667
Non-life excluding health 951 358 1 121 667
Health similar to non-life 0 0
Life and health similar to life, excluding health and index-linked and unit-linked 0 0
Health similar to life 0 0
Life excluding health and index-linked and unit-linked 0 0
Life index-linked and unit-linked 0 0
Deposits to cedants 2 972 2 972
Insurance and intermediaries receivables 396 535 455 134
Reinsurance receivables 2 754 -92 964
Receivables (trade, not insurance) 219 072 233 513
Own shares (held directly) 31 807 0
Amounts due in respect of own fund items or initial fund called up but not yet paid in 0 0
Cash and cash equivalents 95 867 95 901
Any other assets, not elsewhere shown 2 413 2 446
Total assets 3 888 455 3 846 245
EH SA - Solvency and Financial Condition Report 2017
page 87 of 141
Below is an overview of valuation and recognition bases applied in MVBS as well as the differences with BeGAAP.
Goodwill D.1.1.1.
a. MVBS
Goodwill is not recognized in MVBS.
b. BeGAAP
In BeGAAP, goodwill is recorded if the acquisition cost of an insurance portfolio, an activity or a com-pany is higher than the net value of the company; it is generally depreciated over five years.
c. Differences between MVBS and BeGAAP
In BeGAAP, the asset is higher by 1.6M€ compared to MVBS because goodwill are not recognized in MVBS.
Deferred acquisition costs D.1.1.2.
a. MVBS
In MVBS, acquisition costs are considered to be included in the calculation of the BE of the TP. There-fore, DAC is not recognized.
b. BeGAAP
In BeGAAP, the brokerage part of DAC is recognized.
c. Differences between MVBS and BeGAAP
Thus in BeGAAP, the asset is lower by 30.4M€ compared to MVBS due to the recognition of DAC. The amount of DAC is negative because they are recognized net of cessions. Moreover in Belgian statuto-ry accounts, DAC are recognized directly within the TP.
Intangible assets D.1.1.3.
a. MVBS
In MVBS, intangible assets other than goodwill are valued at zero unless the intangible asset can be sold separately and the undertaking can demonstrate that there is a value for the same or similar asset that has been derived from quoted market prices in active markets. If so, the market value for this intangible asset is booked on account.
Computer software tailored to the needs of the undertaking and “off the shelf” software licenses that cannot be sold to another user are valued at zero.
b. BeGAAP
In BeGAAP, Intangible assets other than goodwill are recorded at:
EH SA - Solvency and Financial Condition Report 2017
page 88 of 141
Their acquisition value or contribution value ; or
Production value (limit: prudent estimation of their value in use or their future profit contri-bution)
Intangible assets are depreciated based on the valuation rules of the company (restricted to useful life to the company) in line with Belgian accounting standards. Currently, the following rules are ap-plicable:
Other intangible fixed assets, study costs and internally developed IT expenses (i.e. Soft-ware): linearly at 12.5% per year;
Study costs and externally developed IT expenses: linearly at 12.5% per year;
Study costs and Micro-IT (Software) development expenses: linearly at 33.3% per year;
Depreciation charge is calculated “prorata temporis”. Revaluation is not permitted. General-ly, when an asset is sold, the gain or loss is calculated as the difference between the selling price and the book-value (purchase price minus accumulated depreciation) at the first of January of the year of the sale.
The following expenses may not be capitalized:
Expenditures on research phase, such as:
o Conceptual development;
o Design, evaluation and final selection of potential alternatives.
Post-implementation expenditures, such as:
o Operations, maintenance and administration;
o Data migration;
o Training of employees.
The following expenses are capitalized:
Expenditures on development phase, such as:
o Application development;
o Documentation of the local requirements, the organizational structure of the soft-ware;
o Design of the program specifications;
o Wages and other staff related expenses of own employees directly involved in the development.
Upgrade expenditures (which aim at adding functionalities, improve performance).
c. Differences between MVBS and BeGAAP
Under MVBS, intangible assets have been valued at zero because there is usually no active market for intangible assets, prices are not available to the public, or the intangible asset is unique. Thus in Be-GAAP, the asset is higher by 76M€ compared to MVBS.

EH SA - Solvency and Financial Condition Report 2017
page 89 of 141
Deferred tax assets D.1.1.4.
a. MVBS
Temporary concept
Deferred taxes – except DTA arising from the carry forward of unused tax losses or unused tax credits – are valued on the basis of the difference between:
The values ascribed to assets recognized and valued in accordance with the EU Directive on SII; and
The values ascribed to assets as recognized and valued for tax purposes.
Deferred taxes are recognized and valued in relation to all assets that are recognized for SII or for tax purposes.
Balance sheet item concept
Temporary differences between the SII value of the assets and its corresponding tax base are as-sessed on a single asset basis. The deferred tax calculations take into account the tax regulations specific to particular assets in the applicable tax regimes.
DTA realizability
In the case of DTA EH SA demonstrates to the NBB that it is probable that future taxable profit will be available to utilize those DTA. This demonstration takes into account any legal requirements on the time limits relating to the carry forward of unused tax losses or the carry forward of unused tax cred-its.
When conducting the realizability testing, the same principles as under International Accounting Standards (IAS) 12 are applied.
Discounting
DTA are not discounted.
b. BeGAAP
In BeGAAP, on the following deferred taxes are recognized:
Deferred taxes on realized gains on intangible assets, tangible assets and securities issued by the Belgian public sector, whereas the taxation of such gains is deferred; and
Foreign deferred taxes of the same nature as those mentioned previously.
c. Differences between MVBS and BeGAAP
In BeGAAP, no DTA is recognized thus the asset is lower by 17.9M€ compared to MVBS.
EH SA - Solvency and Financial Condition Report 2017
page 90 of 141
Property, plant & equipment held for own use D.1.1.5.
a. MVBS
In MVBS, property plant and equipment are measured at fair value.
The method selected for the valuation of property for own use is the most representative estimate of the amount for which the assets could be exchanged between knowledgeable willing parties in an arm’s length transaction. Such methods are based on the following:
Current prices in an active market for properties of a different nature, condition or location or subject to different lease or other contractual terms, adjusted to reflect those differ-ences;
Recent prices of similar properties on less active markets, with adjustments to reflect any changes in economic conditions since the date of the transactions that occurred at those prices;
Discounted cash flow projections based on reliable estimates of future cash flows, support-ed by the terms of any existing lease and other contracts and, when possible, by external ev-idence such as current market rents for similar properties in the same location and condition and using discount rates that reflect current market assessments of the uncertainty in the amount and timing of the cash flows.
In determining the valuation of the property, the undertaking takes into account a market partici-pant’s ability to generate economic benefits by using the assets in its highest and best use, or by sell-ing it to another market participant that would use the asset in its highest and best use. If, in some cases, the various inputs to the applicable approaches suggest different valuations of a property, the reasons for those differences need to be considered in order to determine the most representative valuation estimate within a range.
b. BeGAAP
In BeGAAP, they are recorded at their historical value. Investment properties are depreciated each year while no depreciation charge is recorded on the lands. At EH SA, investment properties are de-preciated over 33 years.
Revaluation is permitted where the value of the assets permanently exceeds its book value and is justified by the profitability of the company. Assets suffering a permanent diminution in value are written down with the charge taken to profit and loss. When a permanent impairment is no longer justified the write-down is reversed via extraordinary income. Generally, when an asset is sold, the gain or loss is calculated as the difference between the selling price and the book-value at the first of January of the year of the sale.
c. Differences between MVBS and BeGAAP
In BeGAAP, the asset is lower by 18.1M€ compared to MVBS because of a revaluation at fair value in MVBS.
EH SA - Solvency and Financial Condition Report 2017
page 91 of 141
Property (other than for own use) D.1.1.6.
a. MVBS
In MVBS, property (other than for own use) are measured at fair value.
When determining the fair value of property other than own use, the valuation approaches as de-scribed in the above section on property, plant and equipment held for own use have to be consid-ered.
b. BeGAAP
In BeGAAP, property (other than for own use) recognition and valuation follows the same rules as property, plant and equipment held for own use.
c. Differences between MVBS and BeGAAP
In BeGAAP, the asset is lower by 4.3M€ compared to MVBS because of a revaluation at fair value in MVBS.
Participations and related undertakings D.1.1.7.
a. MVBS
In MVBS, participations and related undertakings are valued at a quoted market price in an active market, if available. If there is no quoted market price, then participations in insurance undertakings are valued using the Adjusted Equity method. Participations in non-insurance undertakings are val-ued by using the Adjusted Equity method or the adjusted IFRS equity method.
Adjusted Equity method: the value of the participation is the proportionate share of the net asset value of the MVBS;
IFRS equity method: the value of the participation is the proportionate share of the net asset value of the IFRS balance sheet, where goodwill and other intangibles (including software) are valued at zero and hence are deducted from the participation value.
b. BeGAAP
In BeGAAP, participations (also called investments in subsidiaries and affiliates) are recorded at their acquisition value. Impairment tests are performed at each closing dates.
c. Differences between MVBS and BeGAAP
In BeGAAP, the asset is lower by 161.2M€ compared to MVBS because of the following adjustments:
MVBS is revaluated at fair value: -145.3M€;
Depreciation on many subsidiaries in BeGAAP: -14.8M€.
EH SA - Solvency and Financial Condition Report 2017
page 92 of 141
Equities D.1.1.8.
a. MVBS
The line item “Equities” includes the sum of listed and unlisted equities. (Un-)listed equities repre-sent shares in corporations’ capital, (not) negotiated on a regulated market or on a multilateral trad-ing facility. It excludes holdings in related undertakings, e.g. participations.
Both listed and unlisted equities are valued at fair value in MVBS.
In exceptional cases, IAS 39 allows available-for-sale equities not to be measured at fair value but at cost. This is the case if the equity's fair value cannot be measured reliably. The exemption is only applicable to unquoted equity instruments when there is significant variability in the range of rea-sonable fair value estimates and the probabilities of the various estimates within the range cannot be assessed reasonably (IAS 39.46(c)).
b. BeGAAP
In BeGAAP, investments (equities included) are recorded at their amortized cost. Impairments are recorded for each share for which the market value, individually, is lower than 20% of the acquisition value over 6 months. Impairment is equivalent to the difference between the individual market value and the acquisition value decreased by 20%. Impairments are also recorded for each share for which the market value, individually, is lower than 80% of the acquisition value. After application of this individual rule, if the market value of the total portfolio is below its acquisition value net of individual downward value adjustments, an additional depreciation is recorded for the amount up to the dif-ference of these values.
c. Differences between MVBS and BeGAAP
In BeGAAP, the asset is higher by 30.5M€ compared to MVBS because of the following adjustments:
In MVBS, own shares are recognized under the own shares asset line at an amount of 31.8M€ whereas in BeGAAP own shares are recognized under the equities asset line at an amount of 34.7M€. The amounts’ difference is due to a recognition of the own shares at fair value in MVBS versus a recognition at acquisition cost in BeGAAP;
Equities are revaluated at fair value in MVBS: -4.2M€.
Bonds D.1.1.9.
a. MVBS
The line item “Bonds” includes the sum of government bonds, corporate bonds, structured notes and collateralised securities.
All Bonds items are valued at fair value in MVBS.
b. BeGAAP
In BeGAAP, investments (bonds included) are recorded at their amortized cost. Impairments are rec-orded in case of risks relating to the bond or loan commitments, such as: capital reimbursement is (partially) uncertain or doubtful, interest payment is uncertain or delayed, adverse change of the security or loan terms and conditions.

EH SA - Solvency and Financial Condition Report 2017
page 93 of 141
Impairments are recorded for each security for which the market value, individually, is lower than 20% of the acquisition value over 6 months. Impairment is equivalent to the difference between the individual market value and the acquisition value decreased by 20%.
Impairments are also recorded for each bond/loan for which the amortized cost, individually, is lower than 80% of the acquisition value. After application of this individual rule, if the market value of the total portfolio is below its acquisition value net of individual downward value adjustments, an addi-tional depreciation is recorded for the amount up to the difference of these values. Differences be-tween acquisition cost and the final reimbursement value are accounted for in profit and losses ac-count on a prorata temporis basis.
c. Differences between IFRS and BeGAAP
In BeGAAP, the asset is lower by 25.8M€ compared to MVBS because in MVBS bonds are revaluated at fair value.
Collective investments undertakings D.1.1.10.
a. MVBS
The interests in collective investments undertakings are measured at fair value in MVBS.
b. BeGAAP
In BeGAAP, collective investments undertakings follow the same rules as for bonds.
c. Differences between MVBS and BeGAAP
In BeGAAP, the asset is lower by 7.6M€ compared to MVBS because in MVBS collective investments undertakings are revaluated at fair value.
Derivatives D.1.1.11.
a. MVBS
Derivatives are measured at fair value in MVBS.
b. BeGAAP
In BeGAAP, Derivatives follow the same rules as for bonds
c. Differences between MVBS and BeGAAP
In BeGAAP, the asset is lower by 0.5M€ compared to MVBS because in MVBS derivatives are revalu-ated at fair value.
Deposits other than cash equivalents D.1.1.12.
a. MVBS
Due to the short-term nature of the deposits, BeGAAP value is considered to be a good proxy of the fair value of the deposits.
EH SA - Solvency and Financial Condition Report 2017
page 94 of 141
b. BeGAAP
In BeGAAP, Deposits other than cash equivalents are recorded at their amortized cost.
c. Differences between MVBS and BeGAAP
Thus, there is no difference between MVBS and BeGAAP.
Other investments D.1.1.13.
a. MVBS
Other investments include investments not covered by positions of investments indicated above. They are measured at fair value in MVBS
b. BeGAAP
In BeGAAP, other investments follow the same rules as for bonds.
c. Differences between MVBS and BeGAAP
As of 2017, those investments are mainly composed of a loan for which fair value is equal to amor-tized cost. Thus, there is no difference between MVBS and BeGAAP.
Loans and mortgages - other loans and mortgages D.1.1.14.
a. MVBS
In MVBS, EH recognizes other loans and mortgages are at the amortized cost.
b. BeGAAP
In BeGAAP, other loans and mortgages follow the same rules than for bonds.
c. Differences between MVBS and BeGAAP
In BeGAAP, the asset is lower by 0.5M€ compared to MVBS because:
A loan within EH has been depreciated in BeGAAP: -0.3M€;
In BeGAAP some cash pool receivables are booked in deduction of liabilities: -0.2M€.
Reinsurance recoverables from Non-life excluding Health D.1.1.15.
a. MVBS
The calculation of reinsurance recoverables leads either to the recognition of reinsurance recovera-bles calculated as a whole or the BE for the reinsurance recoverable. No RM is reported in the section of the reinsurance recoverable as the RM recognized within the TP is already net of reinsurance. However, a credit default adjustment (CDA) has to be calculated. The BE of TP has to be calculated gross, i.e. amounts recoverable from reinsurance contracts are not deducted.

EH SA - Solvency and Financial Condition Report 2017
page 95 of 141
The CDA is calculated as the expected present value of the change in cash flows underlying the amounts recoverable from that counterparty that arises if the counterparty defaults (including de-faults as a result of insolvency or dispute) at a certain point in time. For that purpose, the change in cash flows does not take into account the effect of any measures that mitigate the Credit Risk of the counterparty, other than risk mitigating techniques based on collateral holdings. The risk mitigating techniques that are not taken into account are separately recognized without increasing the amount recoverable from reinsurance contracts. The calculation takes account of possible default events over the lifetime of the reinsurance contract and whether the PD varies over time, and how when it does vary. It is carried out separately by each counterparty and for each LoB. In non-life insurance, it is also carried out separately for premium provisions and provisions for claims outstanding.
b. BeGAAP
In BeGAAP, the reinsurance share of reserves is calculated based on the TP and the applicable ces-sion rates agreed in the reinsurance treaties: reinsurance share in Unearned Premium Reserve (UPR); claims provisions; provision for bonus and rebates.
c. Differences between MVBS and BeGAAP
In BeGAAP, the asset is higher by 170.3M€ compared to MVBS for the main reason that in BeGAAP there is no discounting.
Deposits to cedants D.1.1.16.
a. MVBS
Deposits to cedants include deposits relating to reinsurance accepted. In MVBS, deposits to cedants are valued at market value but due to short-term nature of deposits, the nominal value is considered to be a good proxy of the market value of the deposits.
b. BeGAAP
Under BeGAAP, deposits to cedants are recorded at their nominal value.
c. Differences between MVBS and BeGAAP
Thus, there is no difference between MVBS and BeGAAP
Insurance and intermediaries receivables D.1.1.17.
a. MVBS
Insurance and intermediaries receivables only include amounts past-due for payment by policyhold-ers and other insurers and are linked to the insurance business.
In MVBS, insurance and intermediaries receivables are recognized at fair value.
Furthermore, the receivables under BeGAAP and MVBS might differ due to the following reason: under SII, the premiums are booked according to the cash flows. Thus, premiums written but not yet due (e.g. future payments or reinstatement premium) are not shown as premium written like in Be-GAAP and are, thus, not recognized as receivable in the MVBS. They are rather included in the TP.

EH SA - Solvency and Financial Condition Report 2017
page 96 of 141
In other words, under MVBS only overdue receivables are to be presented under insurance and in-termediaries receivables, whereas still undue receivables representing future cash flows are to be included in the TP.
Additionally, valuation allowances have to be eliminated in the MVBS.
b. BeGAAP
In BeGAAP, insurance receivables are recorded at their nominal value:
Receivables due from the policyholders (premiums to receive, …);
Receivables due from the brokers;
Other insurance receivables:
o Salvage and subrogation/provisions for salvage and subrogation: salvage and subro-gation on settled claims files or claims files to be settled are estimated on a total ba-sis (actuarial estimation). This method takes into account the historical observations and is based upon statistical information wherein the expenses for future salvage and subrogation are included;
o Current accounts between insurance companies;
o Other.
c. Differences between MVBS and BeGAAP
In BeGAAP, the asset is higher by 58.6M€ compared to MVBS because of in MVBS, insurance and intermediaries receivables are recognized at fair value: +58.2M€.
Reinsurance receivables D.1.1.18.
a. MVBS
Reinsurance receivables include amounts past due for payment by reinsurers that are linked to the reinsurance business but that are not reinsurance recoverables. It might include receivables from reinsurers that relate to settled claims of policyholders or beneficiaries, receivables from reinsurers in relation to other than insurance events or settled insurance claims, for example commissions.
In MVBS, reinsurance receivables are recognized at fair value.
Additionally, valuation allowances have to be eliminated in the MVBS.
b. BeGAAP
In BeGAAP, reinsurance receivables are recorded at their nominal value:
Secured debts (confirmed in writing;)
Other.
c. Differences between MVBS and BeGAAP
In BeGAAP, the asset is lower by 95.7M€ compared to MVBS because some assets are netted with liabilities in BeGAAP while in MVBS, assets have to be un-netted.
EH SA - Solvency and Financial Condition Report 2017
page 97 of 141
Receivables (trade, not insurance) D.1.1.19.
a. MVBS
Receivables (trade, not insurance) include amounts receivable from employees or various business partners that are not insurance related. They also include amounts receivables from public entities since there is no reason to have separate lines for current tax assets.
Due to the short term nature of the receivables we consider amortized cost value to be fair value. However, since valuation allowances have to be eliminated in the MVBS, the receivables might have to be adjusted.
b. BeGAAP
In BeGAAP, other receivables are recorded at their nominal value:
Current accounts (head office);
Securities given in cash;
Other (tax recoverable, etc.).
c. Differences between MVBS and BeGAAP
In BeGAAP, the asset is higher by 14.4M€ compared to MVBS because of the following adjustments:
In MVBS, depreciation of a receivable from EH SA subsidiary, amounting to its own funds, be-cause there were negative: +36M€;
Some assets are netted with liabilities in BeGAAP while in MVBS, assets have to be un-netted: -4M€;
Regrouping issue in IFRS correctly done in BeGAAP: -8M€;
Recognition in BeGAAP of a receivable decrease linked to a pension liability transfer within EH: -9M€.
Own shares D.1.1.20.
a. MVBS
In MVBS, own shares have to be reported on the asset side with their fair value.
b. BeGAAP
In BeGAAP, own shares are recognized at their acquisition cost.
c. Differences between MVBS and BeGAAP
In BeGAAP, the asset is lower by 31.8M€ compared to MVBS because in MVBS, own shares are rec-ognized under the own shares asset line at an amount of 31.8M€ whereas in BeGAAP own shares are recognized under the equities asset line at an amount of 34.7M€. The amounts’ difference is due to a recognition of the own shares at fair value in MVBS versus a recognition at acquisition cost in Be-GAAP.
EH SA - Solvency and Financial Condition Report 2017
page 98 of 141
Cash and cash equivalents D.1.1.21.
a. MVBS
Bank accounts are not netted off, thus only positive accounts are recognized in MVBS. Bank over-drafts are to be shown within liabilities unless where both, legal right of offset and demonstrable intention to settle net exist. Cash and cash equivalents are measured at market value.
b. BeGAAP
In BeGAAP, cash and cash equivalents are measured at nominal value. Negative bank balances have to be reclassified to the short term financial liabilities in the annual accounts (per financial institu-tion).
c. Differences between MVBS and BeGAAP
There is no significant difference between MVBS and BeGAAP.
Any other assets, not elsewhere shown D.1.1.22.
a. MVBS
Any Other Assets, not Elsewhere Shown includes any assets that are not included in any of the other MVBS line items. Due to the miscellaneous character of this category, the following accounts were allocated to this line item.
Deferred charges
Due to the short-term nature of these items, the carrying amount is considered to be the fair value. However, if the carrying amount is considered not to be the fair value, the difference between the fair value and the carrying amount is posted on the separate revaluation account.
Other
Depending on the nature of the item, a revaluation at fair value could occur in MVBS.
b. BeGAAP
Deferred charges
In BeGAAP, accrued interests and rents are recorded at their nominal value.
Held for sale assets
In BeGAAP, these assets are recorded at amortized cost, in their respective asset category.
Other
The recognition basis depends on the nature of the item.
c. Differences between MVBS and BeGAAP
There is no significant difference between MVBS and BeGAAP.

EH SA - Solvency and Financial Condition Report 2017
page 99 of 141
Changes to the recognition and valuation bases used or to estimations D.1.2.
There have not been any changes to the recognition and valuation of material classes of assets dur-ing the reporting period.
Assumptions and judgments on the future and other major sources of D.1.3.estimation uncertainty
There are no specific assumptions or judgments about future and other major sources of estimation uncertainty.
Material financial assets D.1.4.
The default valuation method for assets and liabilities (other than Technical Provisions) under SII is the use of quoted market prices in active markets for the same assets or liabilities.
The use of quoted market prices is based on the criteria for active markets as defined in IFRS. Where the criteria for active markets are not satisfied, EH SA uses alternative valuation methods.
When using alternative valuation methods, EH SA relies as little as possible on entity-specific inputs and makes maximum use of relevant market inputs. If relevant observable inputs are not available, EH SA uses unobservable inputs reflecting the assumptions that market participants would use when pricing the asset or liability, including assumptions about risk.
The valuation technique used is consistent with one or more of the following approaches:
Market approach: this approach uses prices and other relevant information generated by market transactions involving identical or similar assets, liabilities or group of assets and liabilities;
Income approach: this approach converts future amounts, such as cash flows or income or ex-penses, to a single current amount;
Cost approach or current replacement: the cost approach reflects the amount that would be required currently to replace the service capacity of an asset.
EH SA - Solvency and Financial Condition Report 2017
page 100 of 141
The following table summarizes the different valuation methods used classified by class of assets. More detailed information on valuation of assets using alternative valuation methods is provided in Section D.4 of this report.
Valuation methods by assets class Figure 24:
MVBS asset Valuation method
Cash and cash equivalents Quoted market price in active markets for the same assets
Cash and cash equivalents Alternative valuation methods
Collective investment undertakings Quoted market price in active markets for the same assets
Collective investment undertakings Alternative valuation methods
Corporate bonds Quoted market price in active markets for the same assets
Corporate bonds Alternative valuation methods
Collateralised securities Quoted market price in active markets for the same assets
Deposits other than cash equivalent Alternative valuation methods
Deposits to cedants Alternative valuation methods
Equities - unlisted Alternative valuation methods
Equities - listed Quoted market price in active markets for the same assets
Government bonds Alternative valuation methods
Government bonds Quoted market price in active markets for the same assets
Loans and Mortgages Alternative valuation methods
Other Investments Alternative valuation methods
Participations and related undertakings Adjusted Equity methods
Participations and related undertakings IFRS Equity methods
Property (other than for own use) Alternative valuation methods Property, plant & equipment held for own use
Alternative valuation methods
Own shares Alternative valuation methods
Derivatives Alternative valuation methods
All related undertakings have been valued either with Adjusted Equity Methods or IFRS equity meth-ods.
Financial and operating leases D.1.5.
EH SA only agrees to lease operating leases from lessors. The only material asset class for leases is for real estate. The below table shows the current real estate lease contracts as well as the duration of these contracts in IFRS:
Operating leases (IFRS figures) Figure 25:
In K€ UK Northern Europe
Germany France Asia Others
Less than 1 year 2,188 3,142 6,451 10,606 2,022 1,535
Between 1 and 5 years 4,170 12,128 32,134 44,823 4,416 4,580
More than 5 years 207 0 77,198 48,817 0 4,072
Total 6,565 15,270 115,782 104,246 6,438 10,186
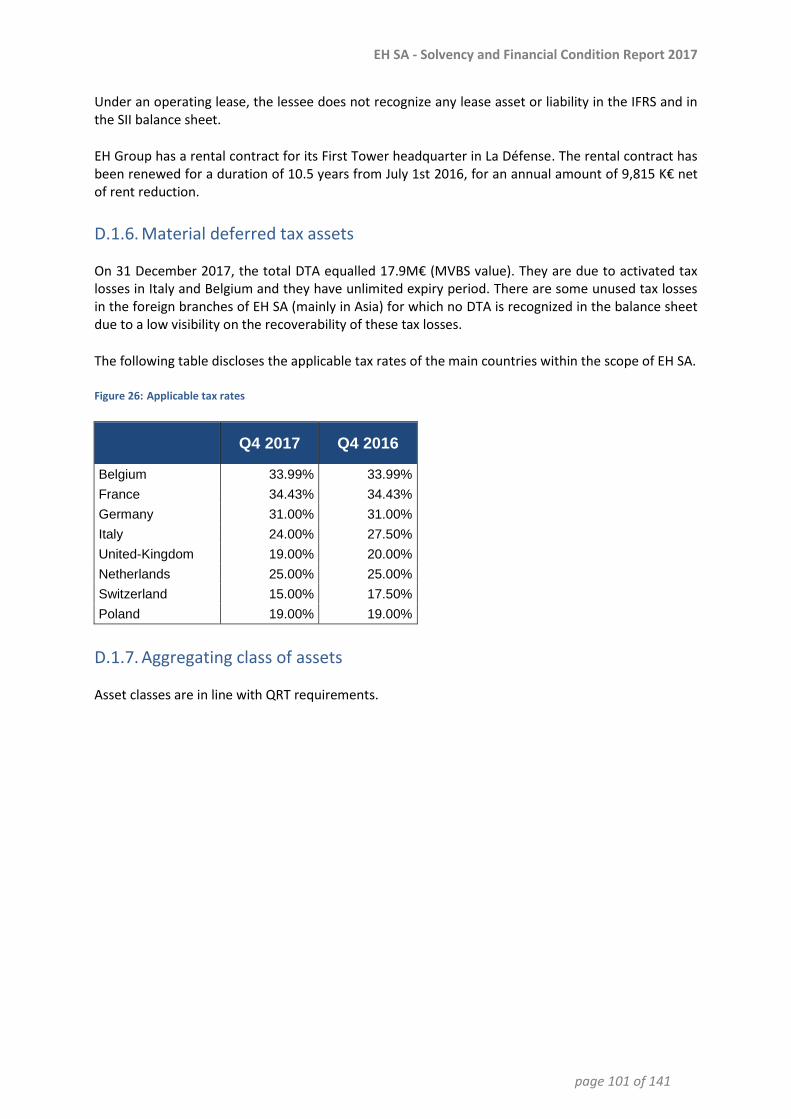
EH SA - Solvency and Financial Condition Report 2017
page 101 of 141
Under an operating lease, the lessee does not recognize any lease asset or liability in the IFRS and in the SII balance sheet.
EH Group has a rental contract for its First Tower headquarter in La Défense. The rental contract has been renewed for a duration of 10.5 years from July 1st 2016, for an annual amount of 9,815 K€ net of rent reduction.
Material deferred tax assets D.1.6.
On 31 December 2017, the total DTA equalled 17.9M€ (MVBS value). They are due to activated tax losses in Italy and Belgium and they have unlimited expiry period. There are some unused tax losses in the foreign branches of EH SA (mainly in Asia) for which no DTA is recognized in the balance sheet due to a low visibility on the recoverability of these tax losses.
The following table discloses the applicable tax rates of the main countries within the scope of EH SA.
Applicable tax rates Figure 26:
Q4 2017 Q4 2016
Belgium 33.99% 33.99%
France 34.43% 34.43%
Germany 31.00% 31.00%
Italy 24.00% 27.50%
United-Kingdom 19.00% 20.00%
Netherlands 25.00% 25.00%
Switzerland 15.00% 17.50%
Poland 19.00% 19.00%
Aggregating class of assets D.1.7.
Asset classes are in line with QRT requirements.
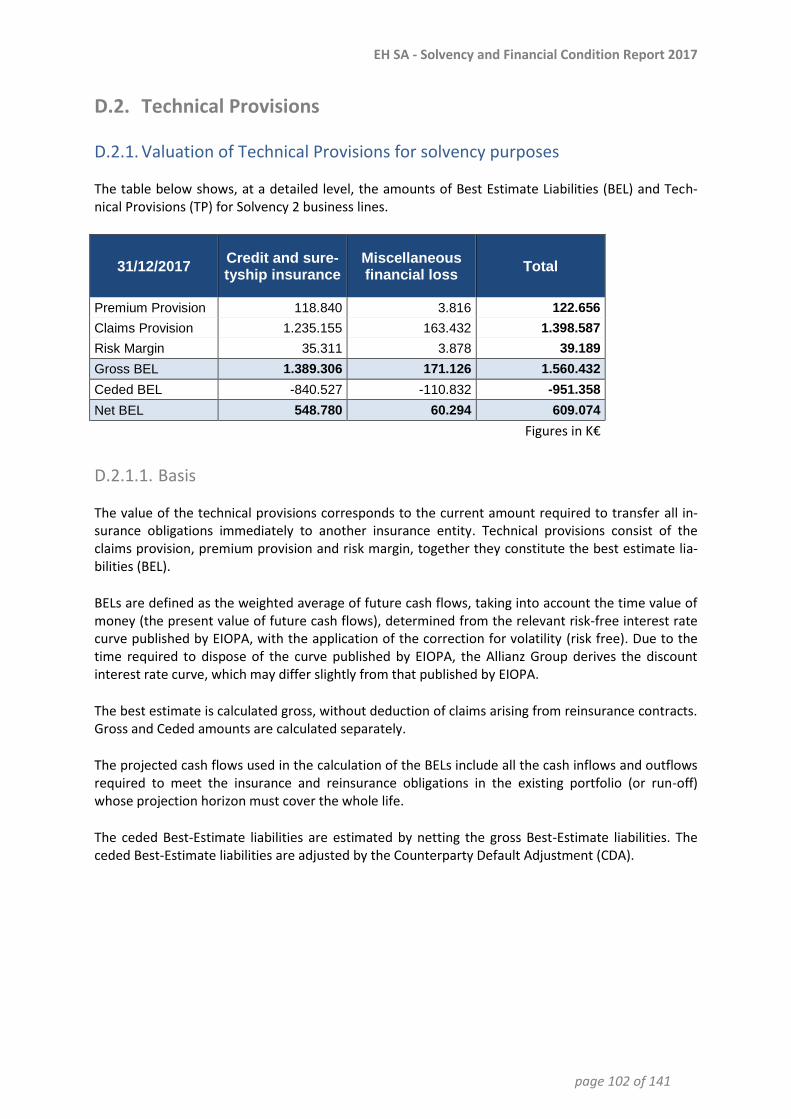
EH SA - Solvency and Financial Condition Report 2017
page 102 of 141
D.2. Technical Provisions
Valuation of Technical Provisions for solvency purposes D.2.1.
The table below shows, at a detailed level, the amounts of Best Estimate Liabilities (BEL) and Tech-nical Provisions (TP) for Solvency 2 business lines.
31/12/2017 Credit and sure-tyship insurance
Miscellaneous financial loss
Total
Premium Provision 118.840 3.816 122.656
Claims Provision 1.235.155 163.432 1.398.587
Risk Margin 35.311 3.878 39.189
Gross BEL 1.389.306 171.126 1.560.432
Ceded BEL -840.527 -110.832 -951.358
Net BEL 548.780 60.294 609.074
Figures in K€
Basis D.2.1.1.
The value of the technical provisions corresponds to the current amount required to transfer all in-surance obligations immediately to another insurance entity. Technical provisions consist of the claims provision, premium provision and risk margin, together they constitute the best estimate lia-bilities (BEL).
BELs are defined as the weighted average of future cash flows, taking into account the time value of money (the present value of future cash flows), determined from the relevant risk-free interest rate curve published by EIOPA, with the application of the correction for volatility (risk free). Due to the time required to dispose of the curve published by EIOPA, the Allianz Group derives the discount interest rate curve, which may differ slightly from that published by EIOPA.
The best estimate is calculated gross, without deduction of claims arising from reinsurance contracts. Gross and Ceded amounts are calculated separately.
The projected cash flows used in the calculation of the BELs include all the cash inflows and outflows required to meet the insurance and reinsurance obligations in the existing portfolio (or run-off) whose projection horizon must cover the whole life.
The ceded Best-Estimate liabilities are estimated by netting the gross Best-Estimate liabilities. The ceded Best-Estimate liabilities are adjusted by the Counterparty Default Adjustment (CDA).
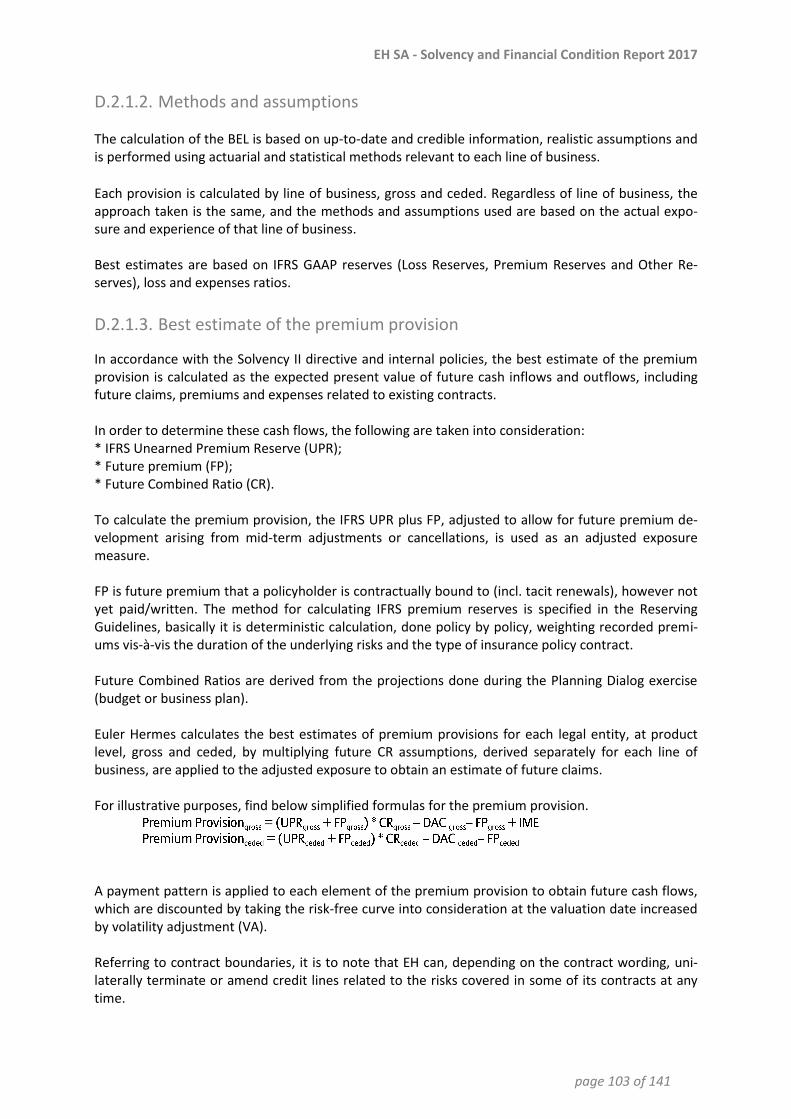
EH SA - Solvency and Financial Condition Report 2017
page 103 of 141
Methods and assumptions D.2.1.2.
The calculation of the BEL is based on up-to-date and credible information, realistic assumptions and is performed using actuarial and statistical methods relevant to each line of business.
Each provision is calculated by line of business, gross and ceded. Regardless of line of business, the approach taken is the same, and the methods and assumptions used are based on the actual expo-sure and experience of that line of business. Best estimates are based on IFRS GAAP reserves (Loss Reserves, Premium Reserves and Other Re-serves), loss and expenses ratios.
Best estimate of the premium provision D.2.1.3.
In accordance with the Solvency II directive and internal policies, the best estimate of the premium provision is calculated as the expected present value of future cash inflows and outflows, including future claims, premiums and expenses related to existing contracts. In order to determine these cash flows, the following are taken into consideration: * IFRS Unearned Premium Reserve (UPR); * Future premium (FP); * Future Combined Ratio (CR). To calculate the premium provision, the IFRS UPR plus FP, adjusted to allow for future premium de-velopment arising from mid-term adjustments or cancellations, is used as an adjusted exposure measure. FP is future premium that a policyholder is contractually bound to (incl. tacit renewals), however not yet paid/written. The method for calculating IFRS premium reserves is specified in the Reserving Guidelines, basically it is deterministic calculation, done policy by policy, weighting recorded premi-ums vis-à-vis the duration of the underlying risks and the type of insurance policy contract. Future Combined Ratios are derived from the projections done during the Planning Dialog exercise (budget or business plan). Euler Hermes calculates the best estimates of premium provisions for each legal entity, at product level, gross and ceded, by multiplying future CR assumptions, derived separately for each line of business, are applied to the adjusted exposure to obtain an estimate of future claims. For illustrative purposes, find below simplified formulas for the premium provision.
A payment pattern is applied to each element of the premium provision to obtain future cash flows, which are discounted by taking the risk-free curve into consideration at the valuation date increased by volatility adjustment (VA). Referring to contract boundaries, it is to note that EH can, depending on the contract wording, uni-laterally terminate or amend credit lines related to the risks covered in some of its contracts at any time.

EH SA - Solvency and Financial Condition Report 2017
page 104 of 141
Following a strict interpretation of article 18 of the SII Delegated Acts EH must consider the scenario of cancelling all limits (where applicable, i.e. If policy wording allows for limit cancelling and if premi-um depends from limit/covered amount) when calculating the future premium (as part of premium provisions).
Best estimate of the claims provision D.2.1.4.
In accordance with the Solvency II Directive and with the actuarial policy of the Euler Hermes and Allianz group, the best estimate of the claims reserve is calculated as the expected present value of future cash flows relating to claims that have occurred but not yet fully paid, including settlement costs direct and indirect.
The claims provision is based on the IFRS claims provision, with the addition of an allowance for fu-ture claims handling and investment management expenses. A payment pattern derived from histor-ical data for each line of business is applied to each element of the claims provisions to obtain future cash flows, which are discounted to reflect the time value of money in line with Solvency II require-ments.
In particular, the best estimate of the non-discounted claims provision is obtained through the adop-tion of statistical-actuarial methodologies and coincides with the amount of the loss reserves on the financial statements prepared in accordance with IFRS standards. In order to determine the present value of the future cash flows, appropriate paying patterns are taken into consideration and the risk-free curve at the valuation date increased by the Volatility Adjustment.
IFRS claims provisions are estimated using actuarial methods (e.g. Expected Loss Ratio, Chain-Ladder, and Bornhuetter & Ferguson) collectively called as triangles. Loss development triangles shows how claims develop overtime, allowing the actuary to extrapolate future evolution of occurred claims. It is part of the exercise to do an analysis on the reserve segmentation, the existence or not of outliers and possible trends. Based on this analysis and the inputs received from different departments (e.g. claims, reinsurance, product, finance and risk) the actuary should adapt the coefficients to better reflect the expected future claims development.
The Unallocated Loss Adjustment Expense (ULAE) reserve is calculated by paid to paid method. Basi-cally this method says that ULAE reserve should be estimated by applying the ratio between ULAE and CLAIMS paid over the loss reserves.
Investment Management Expenses (IME) D.2.1.5.
IME needs to be included according to Article 31 of the delegated act. Following Allianz guidance, the total IME is determined as 1.5 bp of the net BE TP which is then split into two parts related to gross claims resp. Gross premium provisions based on the share of those in the net BE (without future premium). IME is not ceded.
Risk Margin (RM) D.2.1.6.
The market value of liabilities is defined as the discounted BE reserve plus a RM, also known as Mar-ket Value Margin, representing the cost of capital to run off the business until final settlement. In other words, the RM is the cost of holding the necessary capital in excess of the best-estimate of the liabilities. Hence, the RM is integral part of the market value of liabilities and links the calculation of liabilities to risk models.

EH SA - Solvency and Financial Condition Report 2017
page 105 of 141
The calculation of the RM is based on the assumption that the whole portfolio of (re)insurance obli-gations, including any related reinsurance contracts is transferred to another (re)insurance undertak-ing – called reference undertaking - immediately (i.e. T=0).
The transfer scenario is defined such that only non hedgeable risks need to be considered. Especially it is assumed that the transfer of insurance and reinsurance obligations includes any reinsurance contracts relating to these obligations and that the reference undertaking is assumed not to have any (re)insurance obligations and any own funds before the transfer takes place. Only after the transfer of the portfolio the reference undertaking would raise eligible own funds, these assets are consid-ered to be selected in such a way that they minimise the SCR for Market Risk that the reference un-dertaking is exposed to. For non-life insurance obligations Market Risk can be considered to be nil as a result of the above ‘transfer’ assumptions.
The risk categories to be captured are: • Underwriting Risk with respect to the transferred business: premium reserve RC and claims re-serve RC. (The Premium RC is adjusted to reflect the legally bound future premium only, called Pre-mium Reserve RC.) • Credit Risk with respect to reinsurance contracts, SPVs, intermediaries and any other material exposures • Business risk (Cost and Lapse risk) • Operational Risk EH SA bases the calculation of RM on the IM SCR. For the RM calculation one of the main inputs is the RC.
For Reserve Risk and Premium Reserve Risk a roll-forward approach is used which is in line with the usual approach for those risks. Hence, previous year Model results are used.
Counterparty Default Adjustment (CDA) D.2.1.7.
In order to separate the individual risks as specified under SII, a CDA has to be calculated. In the cal-culation, the risk mitigation effect of reinsurance is taken into account even though the risk of the counterparties’ default remains. This has to be considered separately and an adjustment is made to the reinsurance recoveries in form of the CDA.
The following (simplified) version of the CDA is calculated:
𝐶𝐷𝐴 = −𝑚𝑎𝑥 {(1 − 𝑅𝑅) ×𝑃𝐷
1 − 𝑃𝐷× 𝐷𝑢𝑟𝑚𝑜𝑑 × 𝐵𝐸𝑟𝑒𝑐; 0}
Where:
RR = Recovery Rate = the possible % of retrieval even after a Reinsurer defaults
PD = Probability of Default of the counterparty within the next 12 months.
Durmod = modified Duration of the (ceded) recoverables
BErec = Best-Estimate of the (ceded) recoverables, i.e. The total ceded reserves
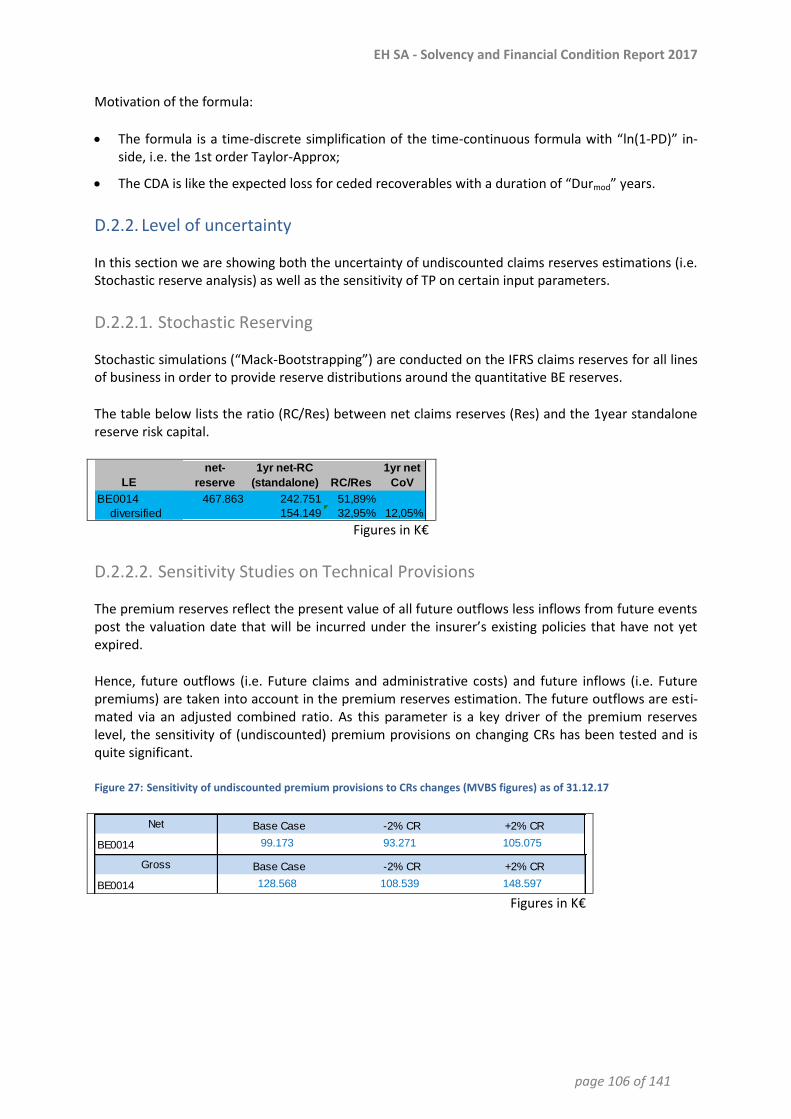
EH SA - Solvency and Financial Condition Report 2017
page 106 of 141
Motivation of the formula:
The formula is a time-discrete simplification of the time-continuous formula with “ln(1-PD)” in-side, i.e. the 1st order Taylor-Approx;
The CDA is like the expected loss for ceded recoverables with a duration of “Durmod” years.
Level of uncertainty D.2.2.
In this section we are showing both the uncertainty of undiscounted claims reserves estimations (i.e. Stochastic reserve analysis) as well as the sensitivity of TP on certain input parameters.
Stochastic Reserving D.2.2.1.
Stochastic simulations (“Mack-Bootstrapping”) are conducted on the IFRS claims reserves for all lines of business in order to provide reserve distributions around the quantitative BE reserves.
The table below lists the ratio (RC/Res) between net claims reserves (Res) and the 1year standalone reserve risk capital.
Figures in K€
Sensitivity Studies on Technical Provisions D.2.2.2.
The premium reserves reflect the present value of all future outflows less inflows from future events post the valuation date that will be incurred under the insurer’s existing policies that have not yet expired.
Hence, future outflows (i.e. Future claims and administrative costs) and future inflows (i.e. Future premiums) are taken into account in the premium reserves estimation. The future outflows are esti-mated via an adjusted combined ratio. As this parameter is a key driver of the premium reserves level, the sensitivity of (undiscounted) premium provisions on changing CRs has been tested and is quite significant.
Sensitivity of undiscounted premium provisions to CRs changes (MVBS figures) as of 31.12.17 Figure 27:
Figures in K€
LE Branch-LoB (OLD)
net-
reserve
1yr net-RC
(standalone) RC/Res
1yr net
CoV net-reserve
1yr net-RC
(standalone)
Branch-LoB
(NEW)
net-
reserve
1yr net-RC
(standalone) RC/Res
1yr net
CoV
BE0014 25 483.781 233.364 48,24% 478.194 232.749 25 467.863 242.751 51,89%
diversified 142.676 29,49% 10,80% 142.300 154.149 32,95% 12,05%
Net Base Case -2% CR +2% CR
BE0014 99.173 93.271 105.075
US0025 -21.794 -22.383 -21.205
CH0089 34.945 25.072 44.818
LU0008 11.032 10.551 11.513
Gross Base Case -2% CR +2% CR
BE0014 128.568 108.539 148.597
US0025 8.177 6.255 10.099
CH0089 49.363 32.586 66.141
LU0008 44.479 40.432 48.526
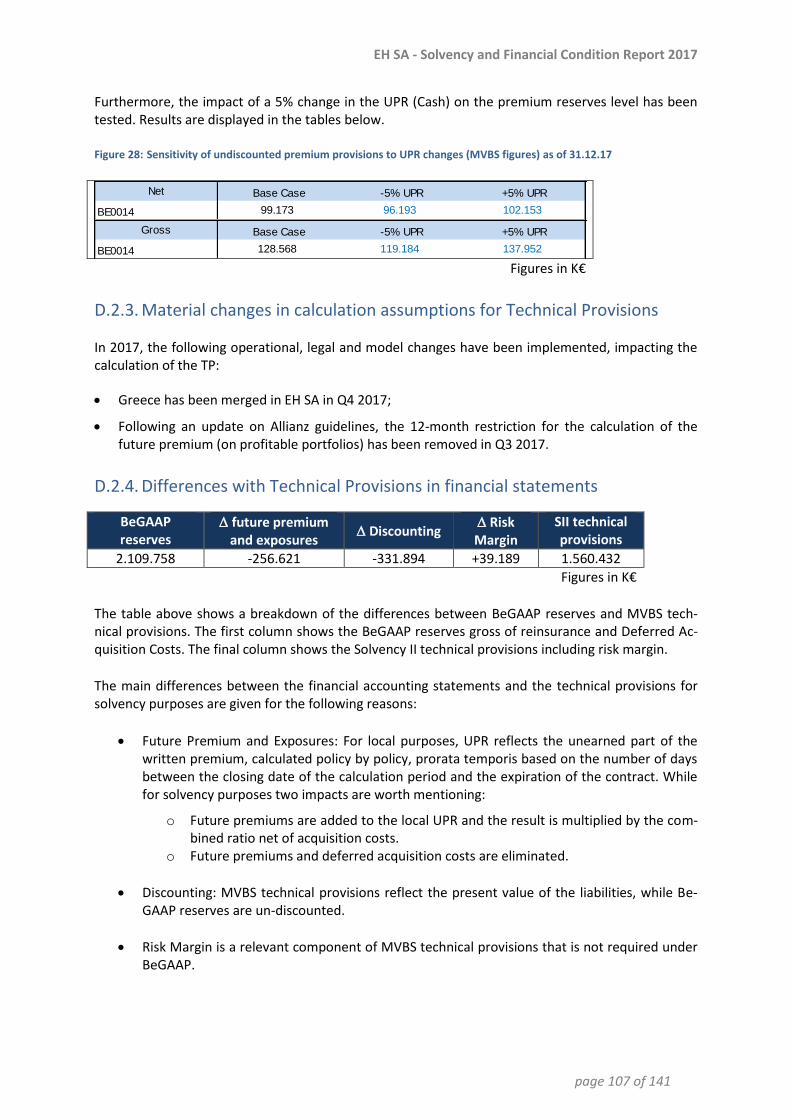
EH SA - Solvency and Financial Condition Report 2017
page 107 of 141
Furthermore, the impact of a 5% change in the UPR (Cash) on the premium reserves level has been tested. Results are displayed in the tables below.
Sensitivity of undiscounted premium provisions to UPR changes (MVBS figures) as of 31.12.17 Figure 28:
Figures in K€
Material changes in calculation assumptions for Technical Provisions D.2.3.
In 2017, the following operational, legal and model changes have been implemented, impacting the calculation of the TP:
Greece has been merged in EH SA in Q4 2017;
Following an update on Allianz guidelines, the 12-month restriction for the calculation of the future premium (on profitable portfolios) has been removed in Q3 2017.
Differences with Technical Provisions in financial statements D.2.4.
BeGAAP reserves
future premium and exposures
Discounting Risk
Margin
SII technical provisions
2.109.758 -256.621 -331.894 +39.189 1.560.432
Figures in K€
The table above shows a breakdown of the differences between BeGAAP reserves and MVBS tech-nical provisions. The first column shows the BeGAAP reserves gross of reinsurance and Deferred Ac-quisition Costs. The final column shows the Solvency II technical provisions including risk margin.
The main differences between the financial accounting statements and the technical provisions for solvency purposes are given for the following reasons:
Future Premium and Exposures: For local purposes, UPR reflects the unearned part of the written premium, calculated policy by policy, prorata temporis based on the number of days between the closing date of the calculation period and the expiration of the contract. While for solvency purposes two impacts are worth mentioning:
o Future premiums are added to the local UPR and the result is multiplied by the com-bined ratio net of acquisition costs.
o Future premiums and deferred acquisition costs are eliminated.
Discounting: MVBS technical provisions reflect the present value of the liabilities, while Be-GAAP reserves are un-discounted.
Risk Margin is a relevant component of MVBS technical provisions that is not required under BeGAAP.
Net Base Case -5% UPR +5% UPR
BE0014 99.173 96.193 102.153
US0025 -21.794 -21.742 -21.846
CH0089 34.945 30.440 39.450
LU0008 11.032 10.690 11.374
Gross Base Case -5% UPR +5% UPR
BE0014 128.568 119.184 137.952
US0025 8.177 6.667 9.687
CH0089 49.363 41.818 56.909
LU0008 44.479 41.849 47.109

EH SA - Solvency and Financial Condition Report 2017
page 108 of 141
Matching adjustment D.2.5.
EH SA does not apply a matching adjustment.
Volatility Adjustment D.2.6.
In accordance with the technical guidance provided by EIOPA and Allianz, the discount effect is cur-rently calculated by taking into account the volatility adjustment (VA) inside the risk-free SWAP (yield) curves. We have performed a sensitivity study where we have applied only the EUR SWAP curve with and without volatility adjustment to the cashflows, i.e. omitting the impact of different settlement currencies. Doing this, results in almost same discounted reserves for the LEs with a high share of EUR:
Figures in K€
As shown in the table above, the impact of the volatility adjustment is negligible (only 0,06% devia-tion between the discounted reserves with VA and without VA).
Transitional risk-free interest rate-term structure D.2.7.
EH SA does not apply the transitional risk-free interest rate-term structure referred to in Article 308c of Directive 2009/138/EC.
Transitional deduction D.2.8.
EH SA does not apply the transitional deduction referred to in Article 308d of Directive 2009/138/EC.
Recoverable from mitigation techniques D.2.9.
In 2017, EH SA had reinsurance recoverables of nearly 951M€. The recoverables are coming from non-life excluding health, which includes the credit and surety insurance and miscellaneous lines of business. Of these recoverables, 97.3% come from claims provisions, with the remaining due to pre-mium provisions.
There were no recoverables from SPVs.
in K€ Net BEL EUR-SWAP-VA EUR-SWAPEstimated
Sensitivity
Estimated
Sensitivity
BE0014 -569.885 -578.190 -578.558 368 -0,06%
LU0008 -50.339 -50.768 -50.793 25 -0,05%
CH0089 -642.105 -649.827 -650.196 369 -0,06%
US0025 -23.992 -24.103 -24.107 4 -0,02%
PL0019 -18.355 -18.752 -18.761 9 -0,05%
Total -1.304.676 -1.321.640 -1.322.415 775 -0,06%
Total Discounted Net Best Estimate Liability
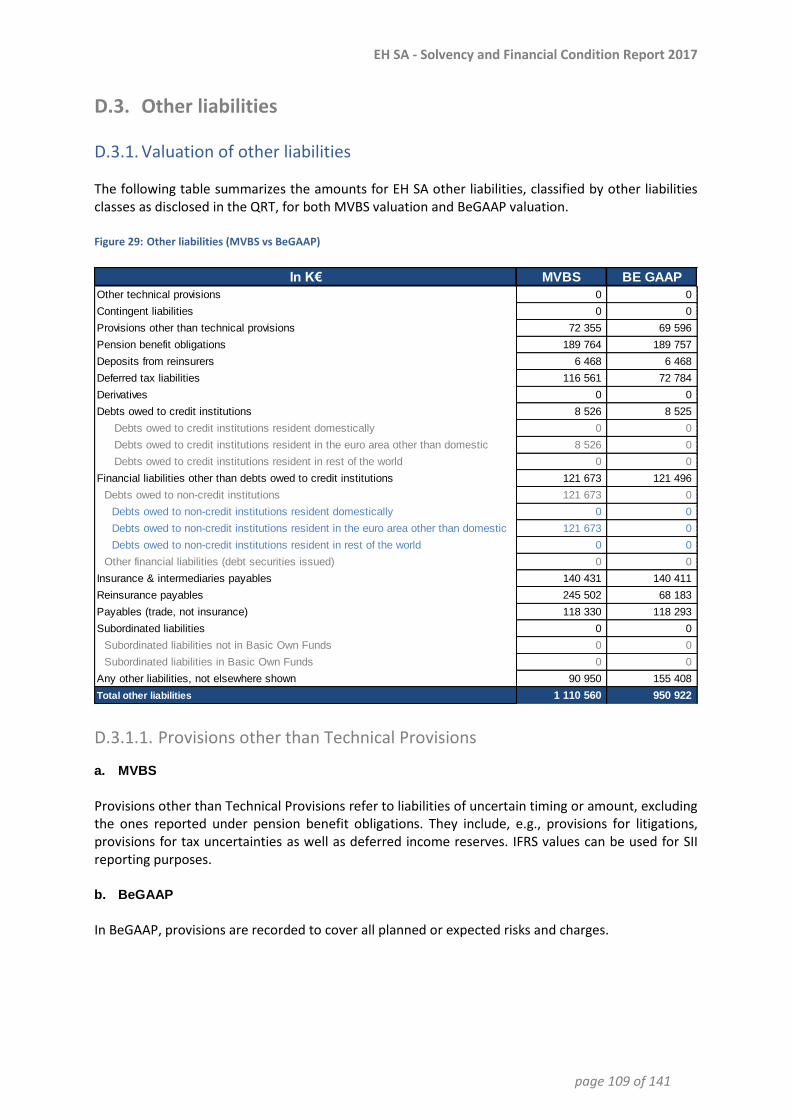
EH SA - Solvency and Financial Condition Report 2017
page 109 of 141
D.3. Other liabilities
Valuation of other liabilities D.3.1.
The following table summarizes the amounts for EH SA other liabilities, classified by other liabilities classes as disclosed in the QRT, for both MVBS valuation and BeGAAP valuation.
Other liabilities (MVBS vs BeGAAP) Figure 29:
Provisions other than Technical Provisions D.3.1.1.
a. MVBS
Provisions other than Technical Provisions refer to liabilities of uncertain timing or amount, excluding the ones reported under pension benefit obligations. They include, e.g., provisions for litigations, provisions for tax uncertainties as well as deferred income reserves. IFRS values can be used for SII reporting purposes.
b. BeGAAP
In BeGAAP, provisions are recorded to cover all planned or expected risks and charges.
In K€ MVBS BE GAAP
Other technical provisions 0 0
Contingent liabilities 0 0
Provisions other than technical provisions 72 355 69 596
Pension benefit obligations 189 764 189 757
Deposits from reinsurers 6 468 6 468
Deferred tax liabilities 116 561 72 784
Derivatives 0 0
Debts owed to credit institutions 8 526 8 525
Debts owed to credit institutions resident domestically 0 0
Debts owed to credit institutions resident in the euro area other than domestic 8 526 0
Debts owed to credit institutions resident in rest of the world 0 0
Financial liabilities other than debts owed to credit institutions 121 673 121 496
Debts owed to non-credit institutions 121 673 0
Debts owed to non-credit institutions resident domestically 0 0
Debts owed to non-credit institutions resident in the euro area other than domestic 121 673 0
Debts owed to non-credit institutions resident in rest of the world 0 0
Other financial liabilities (debt securities issued) 0 0
Insurance & intermediaries payables 140 431 140 411
Reinsurance payables 245 502 68 183
Payables (trade, not insurance) 118 330 118 293
Subordinated liabilities 0 0
Subordinated liabilities not in Basic Own Funds 0 0
Subordinated liabilities in Basic Own Funds 0 0
Any other liabilities, not elsewhere shown 90 950 155 408
Total other liabilities 1 110 560 950 922
EH SA - Solvency and Financial Condition Report 2017
page 110 of 141
c. Differences between MVBS and BeGAAP
In BeGAAP, the liability is higher by 2.8M€ compared to MVBS because of the following adjustments:
LTI relating to EH SA in BeGAAP versus LTI relating to EH Group in MVBS: -1.7M€;
Historical BeGAAP booking on provisions for stock based compensation GEI (Group Equity Incen-tive): -1.1M€.
Pension benefit obligations D.3.1.2.
a. MVBS
Pension benefit obligations are the total net obligations related to the employees' pension scheme. IAS 19 is considered a reasonable approach in valuing pension liabilities for SII purposes.
b. BeGAAP
In BeGAAP, EH SA records a provision for a pension plan in the statutory accounts only if the assets of the plan are lower than the minimum reserves as defined under the Belgian law.
For EH SA, the minimum pension reserves for its engagements must comply with local law.
According to Belgian law (only applicable for engagements in Belgium), the funding of pension plans must at least cover the vested rights, as defined by the applicable legislation. Consequently, in case the coverage of the vested rights by the mathematical reserves or plan assets is insufficient (i.e. The level of assets has become insufficient to cover the existing obligations), the employer must record a provision for defined contribution plans, for Defined-Benefit Plans (DBP) financed through insurance contracts, and for DBP financed through pension funds.
These minimum legal requirements may be superseded by more stringent contractual conditions as stipulated in the plan rules.
In addition to that, EH SA decided to record the provisions for pensions based on IAS 19R.
c. Differences between MVBS and BeGAAP
There is no significant difference between MVBS and BeGAAP.
Deposits from reinsurers D.3.1.3.
a. MVBS
Deposits from reinsurers include amounts (e.g. cash) received from a reinsurer or deducted by the reinsurer according to the reinsurance contract.
In MVBS, deposits from reinsurers are recorded at market value.
b. BeGAAP
In BeGAAP, deposits from reinsurers are recognized at their nominal value.

EH SA - Solvency and Financial Condition Report 2017
page 111 of 141
c. Differences between MVBS and BeGAAP
There is no significant difference between MVBS and BeGAAP.
Deferred Tax Liabilities D.3.1.4.
a. MVBS
Temporary concept:
DTL are valued on the basis of the difference between:
The values ascribed to liabilities recognized and valued in accordance with the EU Di-rective on SII and;
The values ascribed to liabilities as recognized and valued for tax purposes.
DTL are recognized and valued in relation to all assets that are recognized for SII or for tax purposes.
Balance sheet item concept:
Temporary differences between the SII value of the liabilities and its corresponding tax base are as-sessed on a single liability basis. The deferred tax calculations take into account the tax regulations specific to particular liabilities in the applicable tax regimes.
Discounting
DTL are not discounted.
b. BeGAAP
In BeGAAP, DTL are recognized on:
Realized gains on intangible assets, tangible assets and securities issued by the Belgian public sector, whereas the taxation of such gains is deferred; and
Foreign deferred taxes of the same nature as those mentioned in the above
c. Differences between MVBS and BeGAAP
In BeGAAP, the liability is lower by 43.8M€ compared to MVBS because DTL are not recognized in BeGAAP except tax debt related to the equalization reserve write-down in the German branch (booked on a deferred tax account in BeGAAP only).
Debts owed to credit institutions D.3.1.5.
a. MVBS
Debts owed to credit institutions include debt, such as mortgage, loans and bank overdrafts, owed to credit institutions (banks, etc.). It excludes subordinated liabilities and bonds being held by credit institutions since it is not possible for the entity to identify all the holders of the bonds it issued. In addition, the line item might also include liabilities designated as “at fair value through profit or loss” at inception. These liabilities are measured at fair value.
EH SA - Solvency and Financial Condition Report 2017
page 112 of 141
In MVBS, debts owed to credit institutions are measured at fair value. Adjustments for own credit standing are excluded in MVBS.
b. BeGAAP
In BeGAAP, debts owed to credit institutions are recognized at their nominal value.
c. Differences between MVBS and BeGAAP
There is no signifant difference between MVBS and BeGAAP.
Financial liabilities other than debts owed to credit institutions D.3.1.6.
a. MVBS
The MVBS line item financial liabilities other than debts owed to credit institutions includes bonds issued by EH SA (whether they are held by credit institutions or not), mortgages and loans due to other entities than credit institutions (sister insurance company, holding, etc.) and structured notes issued by the entity itself (not by SPV). Subordinated liabilities are not included in this MVBS line item.
In MVBS, financial liabilities other than debts owed to credit institutions are recorded at fair value. Adjustments for own credit standing are excluded in MVBS.
b. BeGAAP
In BeGAAP, financial liabilities other than debts owed to credit institutions are recognized at their nominal value.
c. Differences between MVBS and BeGAAP
There is no significant difference between MVBS and BeGAAP.
Insurance & intermediaries payables D.3.1.7.
a. MVBS
Insurance and intermediaries payables refer to amounts past due to policyholders, insurers, and oth-er business linked to insurance, but that are not TP. They include amounts past due to (re)insurance intermediaries, e.g. commissions due to intermediaries but not yet paid by EH SA. They exclude loans and mortgages due to other insurance companies if they are only related to financing such as loans and mortgages rather than being linked to insurance business.
In MVBS, payables are recognized at the amounts actually due on repayment (i.e., their settlement amount) but only include amounts past due for payment.
b. BeGAAP
In BeGAAP, insurance and intermediaries payables are recorded at their nominal value.

EH SA - Solvency and Financial Condition Report 2017
page 113 of 141
c. Differences between MVBS and BeGAAP
There is no significant difference between MVBS and BeGAAP.
Reinsurance payables D.3.1.8.
a. MVBS
Reinsurance payables are amounts past due to reinsurers (especially current accounts) other than deposits that are linked to reinsurance business, but that are not included in reinsurance recovera-bles. They include payables to reinsurers that relate to ceded premiums.
In MVBS, payables are recognized at the amounts actually due on repayment (i.e. their settlement amount) but only include amounts past due for payment.
b. BeGAAP
In BeGAAP, reinsurance payables are recorded at their nominal value.
c. Differences between MVBS and BeGAAP
In BeGAAP, the liability is lower by 177.3M€ compared to MVBS because of the following adjust-ments:
Some liabilities are netted with assets in BeGAAP while in MVBS liabilities have to be un-netted: -96.4M€;
In MVBS, ceded premiums written but not yet due are not shown as ceded premium written (they are included in the technical provisions instead). Thus, they are not recognized as reinsur-ance payables: -80.9M€.
Payables (Trade, not Insurance) D.3.1.9.
a. MVBS
Payables (trade, not insurance) include amounts due to employees, suppliers, public entities, etc. which are not insurance-related (cf. corresponding receivables [trade, not insurance] on the asset side).
Payables are generally recognized at the amounts actually due on repayment (i.e., their settlement amount). Due to their short-term nature, the settlement amount is considered to be a good proxy of the fair value for MVBS. However, there might be instances where the settlement amount differs from the fair value.
b. BeGAAP
In BeGAAP, trade payables are recorded at their nominal value. They are composed of fiscal and so-cial debts.
c. Differences between MVBS and BeGAAP
There is no significant difference between MVBS and BeGAAP.

EH SA - Solvency and Financial Condition Report 2017
page 114 of 141
Any Other Liabilities, not Elsewhere Shown D.3.1.10.
a. MVBS
Any other liabilities, not elsewhere shown include any liabilities not included in the other balance sheet items and, thus, represent a miscellaneous category.
b. Differences between MVBS and BeGAAP
In BeGAAP, the liability is higher by 64.5M€ compared to MVBS because of the following adjust-ments:
Some liabilities are netted with assets in BeGAAP while in MVBS liabilities have to be un-netted: -15.9M€;
Recognition in BeGAAP of dividend to be paid (80M€) in 2017.
Financial liabilities D.3.2.
The pricing of loans within the Group takes into consideration volume and term of a loan by applying market interest rates existing at inception (benchmark rates) with adjustments for various market factors described herein, in particular the credit worthiness of the debtor, exchange risks and par-ticular features of the facility, e.g. collateral, subordination (credit spread).
a. Benchmark rate
The relevant benchmark rate depends on the coupon format of the debt instrument. For instruments with a floating rate coupon, the benchmark rate is the respective EURIBOR or LIBOR Rate (as of the date of loan inception) for a given currency (benchmark rate). The choice of the relevant EURIBOR or LIBOR-rate depends on the coupon re-set frequency.
For instruments with a fixed rate coupon the appropriate benchmark rate is the swap-rate of the relevant currency and with the same term as the underlying debt instrument.
b. Credit spread
The benchmark rate is increased by the credit spread, which is determined by the risk profile associ-ated with the underlying debt instrument, including its final maturity. The basis for the determination of the credit spread is given by:
Spreads as observed in the secondary market (or, if available recent primary market levels) of directly comparable transactions;
And/or comparable credit default swap (CDS) levels;
And/or relevant indices provided by agencies such as S&P, Bloomberg, etc.
In addition, the credit spread shall also include EH SA credit spread.
Leasing arrangements D.3.3.
Refer to Section D.1.5 for information regarding leasing arrangements.
EH SA - Solvency and Financial Condition Report 2017
page 115 of 141
Deferred Tax Liabilities D.3.4.
On 31 December 2017, DTL equalled 116.6M€ (MVBS value). DTL are mainly due to temporary differ-ences on TP, provisions for pension obligations and revaluation of available for sales investments.
Economic benefits D.3.5.
Economic benefits could be generated for example by a growth in gross domestic product with econ-omy which could have an impact on the exposure. However, this is taken into account when defining the assumptions to assess the outflows generated by the insurance business.
Employee benefits D.3.6.
In accordance with the regulatory environment and collective agreements, the Group has established defined-contribution and defined benefit pension plans (company or multi-employer) in favour of employees.
a. Defined-contribution plans
Defined-contribution plans are funded through independent pension funds or similar organizations. Contributions fixed in advance (e.g. Based on salary) are paid to these institutions and the benefi-ciary’s right to benefits exists against the pension fund. The employer has no obligation beyond pay-ment of the contributions.
During the year ended December 31, 2017, EH SA recognized expenses for defined-contribution plans of 6.8M€ (2016: 7.3M€). Additionally, EH SA paid contributions for state pension schemes of 25.8M€ in 2017 (2016: 25.8M€).
b. DBP
There exist multiple DBP within EH SA which are described below:
Retirement indemnities (France): the rights in respect of retirement indemnities are defined by the insurance companies’ collective agreement. This plan is financed partly by a policy taken out with an insurance company;
PSAD (France): this is a supplementary retirement benefit plan that was closed in 1978 and covers executives of EH France. Contributions are paid by EH France to beneficiaries or their surviving spouse (reversion) until their death. The plan is managed by the Bureau Commun d'Assurance des Collectives, which informs EH France quarterly of the contributions to be paid;
Cardif (France): this is a supplementary retirement benefit plan that was closed in 2006 and covers members of the Group Management Board and/or corporate officers of EH Group and EH France. The contributions are paid by Cardif to the beneficiaries or their surviving spouse (reversion) until their death;
EH SA (Italy branch): Trattamento di Fine Rapporto (TFR) is a pension plan established by Ital-ian legislation that is similar to a DBP. It is valued in accordance with IAS 19 by an independ-ent actuary.

EH SA - Solvency and Financial Condition Report 2017
page 116 of 141
The following items were taken into account when measuring the commitment at the year-end:
The retirement age was taken as 62 years for women and 66 years for men;
The probability of leaving the Italy branch within the next five years for employees under 42 years of age has been determined based on historical data;
The average life expectancy has been determined based on current statistics;
The probability of an early request for TFR has also been calculated using historical data available within the company;
EH SA (Italy branch) has no dedicated hedging instrument that covers the actuarial liability;
EH SA (Italy branch) has no dedicated hedging instrument that covers the actuarial liability.
EH SA (UK branch): the UK branch operates a DBP that covers all employees who had joined the company by December 31, 2001. Under this plan, employees will be granted a pension on re-tirement, based on a fraction of their final salary and based on their length of service within the company while the plan was open to future accrual. The plan closed to future accrual with effect from December 31, 2012, at which point the link to future salary increases was removed. The company funds these rights through a dedicated fund. The retirement rights are revalued annual-ly based on different revaluation rates set by law according to the vesting date of the rights. The 2012 closure of the plan has resulted in a curtailment gain of £6.2 million;
AVK/APV: EH Deutschland, branch of EH SA, EH AG and EH Rating Deutschland GmbH have im-plemented a DBP for all their employees. The beneficiaries will receive an annuity upon retire-ment at 65 years old at the latest. These plans are financed in part by external companies, name-ly Pensionskasse AVK and Unterstützungskasse APV and by contractual trust arrangement name-ly Methusalem Trust e.V. Employees who leave the company prior to the date provided for may benefit from an annuity of a lower amount than the one initially provided for;
Within the Allianz DBP in which the Group is involved in Germany, the assumptions for determin-ing the DBO have been updated in 2014. The plan has been split into 2 items: on one hand the engagement to pay a fixed annuity to employees, engagement covered by an insurance contract and on the other hand the engagement to pay a compensation for the inflation. As a result, the analysis leads to the conclusion that the engagement to pay the fixed annuity was already fully covered in the absence of profit participation and could be evaluated at the fair value of plan as-set. The second part is still valued according to the projected unit credit method as required by IAS 19;
EH SA (Belgium branch) has implemented a plan that covers the payment to employees of EH Credit Insurance Belgium and EH Services Belgium SA of a fixed capital amount equal to a multi-ple of their salary at 60 years old. It also provides coverage in the event of death – a multiple of salary based on family composition – or invalidity of the employee. The plan was closed in 2012. In 2016, the Belgium Group insurance main and complementary DC plans have been accounted as DB plan due to minimum return defined by the Belgian law;
EH SA (Netherlands branch) implemented a defined benefit pension plan for its employees, man-aged by Delta Lloyd. The plan was closed at the end of 2012. A DBP was signed in February 2009 with Aegon and covers 6 employees. The plan is renewed every 5 years.
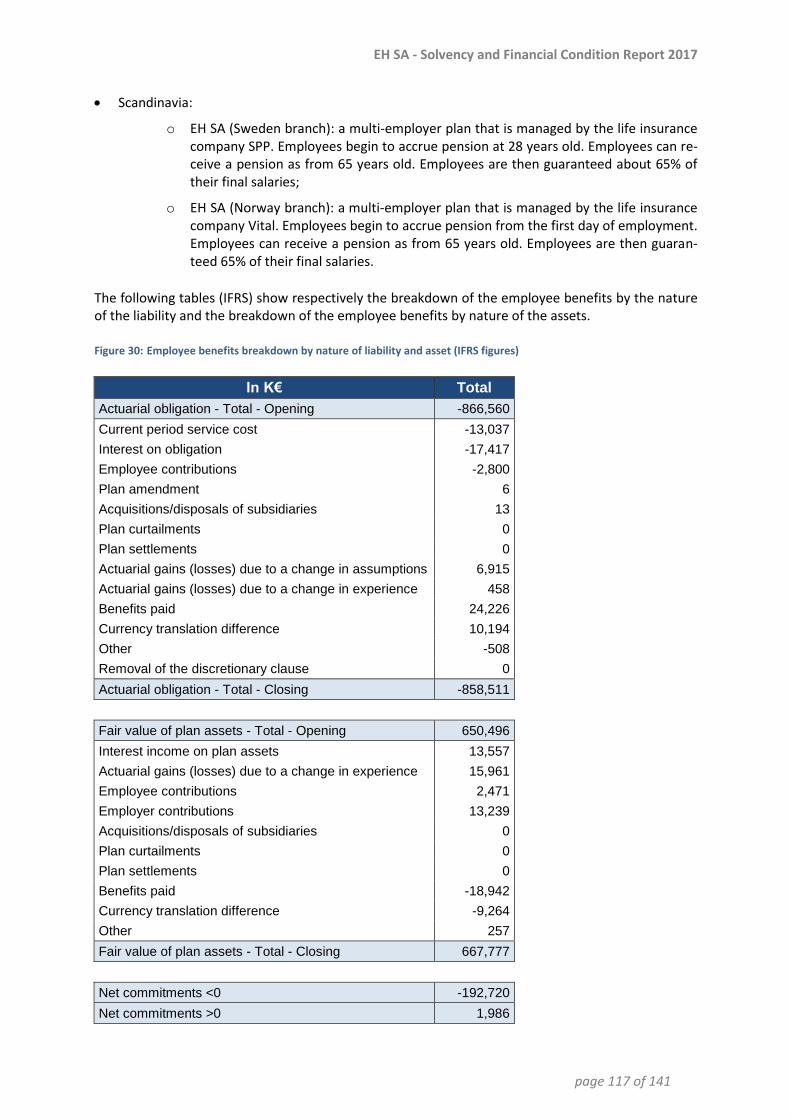
EH SA - Solvency and Financial Condition Report 2017
page 117 of 141
Scandinavia:
o EH SA (Sweden branch): a multi-employer plan that is managed by the life insurance company SPP. Employees begin to accrue pension at 28 years old. Employees can re-ceive a pension as from 65 years old. Employees are then guaranteed about 65% of their final salaries;
o EH SA (Norway branch): a multi-employer plan that is managed by the life insurance company Vital. Employees begin to accrue pension from the first day of employment. Employees can receive a pension as from 65 years old. Employees are then guaran-teed 65% of their final salaries.
The following tables (IFRS) show respectively the breakdown of the employee benefits by the nature of the liability and the breakdown of the employee benefits by nature of the assets.
Employee benefits breakdown by nature of liability and asset (IFRS figures) Figure 30:
In K€ Total
Actuarial obligation - Total - Opening -866,560
Current period service cost -13,037
Interest on obligation -17,417
Employee contributions -2,800
Plan amendment 6
Acquisitions/disposals of subsidiaries 13
Plan curtailments 0
Plan settlements 0
Actuarial gains (losses) due to a change in assumptions 6,915
Actuarial gains (losses) due to a change in experience 458
Benefits paid 24,226
Currency translation difference 10,194
Other -508
Removal of the discretionary clause 0
Actuarial obligation - Total - Closing -858,511
Fair value of plan assets - Total - Opening 650,496
Interest income on plan assets 13,557
Actuarial gains (losses) due to a change in experience 15,961
Employee contributions 2,471
Employer contributions 13,239
Acquisitions/disposals of subsidiaries 0
Plan curtailments 0
Plan settlements 0
Benefits paid -18,942
Currency translation difference -9,264
Other 257
Fair value of plan assets - Total - Closing 667,777
Net commitments <0 -192,720
Net commitments >0 1,986

EH SA - Solvency and Financial Condition Report 2017
page 118 of 141
The following table summarizes the actuarial assumptions used in the calculation of the employee benefits.
Actuarial assumptions for the calculation of employee benefits Figure 31:
As far as the Germany scope is concerned (87% of Group net commitments for the DBP), an increase of the discount rate by 50 bps would decrease the DBP obligation by 34M€. A decrease of 50 bps would lead to an increase of 40M€. An increase or a decrease of the salary by 25 bps would have no material effect on the DBP obligation.
The table below (IFRS) presents the estimated future benefit payments that will be met mainly to the benefit of the employee of the German entities, by the pension funds or by the Group:
Estimation of the future benefit payments of the employee of the German entities (IFRS figures) Figure 32:
In K€ Pension benefits
2017 14,720
2018 14,220
2019 14,984
2020 15,323
2021 16,164
2022 16,515
2023-2027 87,153
Contingent liabilities D.3.7.
EH SA does not recognize any contingent liability.
In K€Scandina
via
Scandina
via
Actuarial assumptions (1)Retirement
indemnitiesPSAD Cardif FTP VITAL
Discounting rates used 1.60% 1.60% 1.60% 1.60% 2.40% 1.80% 1.60% 2.00% 2.25% 2.30%
Inflation rate used 1.80% 1.80% 1.80% 1.50% 2.20% 1.50% 1.80% 0.00% 2.00% 2.30%
Expected rate of salary increase 2.20% 2.20% 2.20%1.50%/0.50
%(4)0.00% 1.70% 2.50% 2.50% 3.00% 2.50%
Expected rate of increase of medical costs 0.00% 0.00% 0.00% 0.00% 0.00% 0.00% 0.00% 0.00% 3.00% 0.00%
Rate of increase of benefit used by plan 0.00% 0.00% 0.00% 0.00% 3.10% 0.00% 0.00% 0.00% 2.00% 0.00%
Plan retirement age 63 63 63 62 et 66(3) 65 63 60 67 65 65
Plan residual service period 0 0 0 0 0 15 11 16 0 0
Other significant actuarial assumption used 0.00% 0.00% 0.00% 0.00% 0.00% 0.00% 0.00% 0.00% 0.00% 0.00%
Equities 0.00% 0.00% 0.00% 0.00% 41.70% 10.00% 0.00% 0.00% 5.00% 10.90%
Bonds 0.00% 0.00% 100.00% 0.00% 23.20% 85.30% 0.00% 0.00% 87.00% 40.40%
Real estate 100.00% 0.00% 0.00% 0.00% 7.80% 3.90% 0.00% 0.00% 8.00% 10.00%
Other instruments 0.00% 0.00% 0.00% 0.00% 27.30% 0.80% 100.00% 100.00% 0.00% 38.70%
Structure of plan assets (2)
(1) Actuarial assumptions: Germany and Belgium correspond to the actuarial assumptions of the most significant company
(2) Structure of hedging assets by entity. Germany and Netherlands correspond to the statictic of the most significant company
(3) The retirement age has been taken as 62 years for women and 66 for men
(4) 1.50% for the executives and 0.50% for the non-executives
ItalyUnited
KingdomGermany Belgium
Netherla
nds
France & Greece
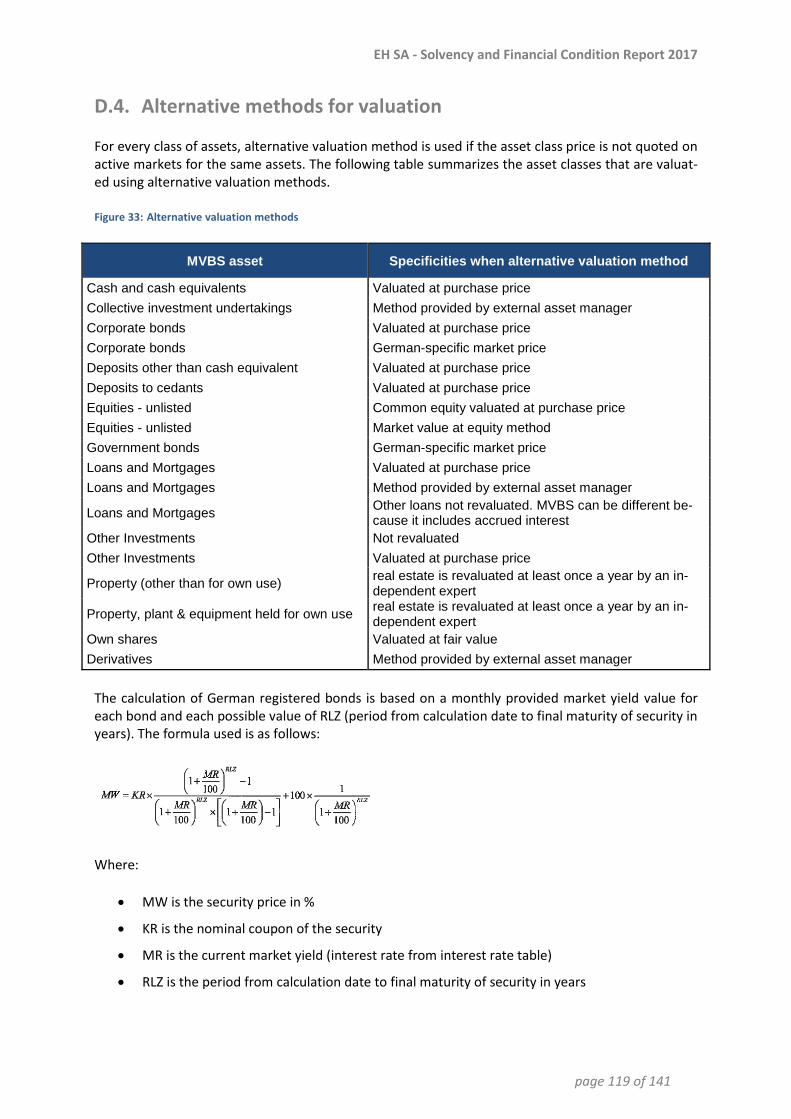
EH SA - Solvency and Financial Condition Report 2017
page 119 of 141
D.4. Alternative methods for valuation
For every class of assets, alternative valuation method is used if the asset class price is not quoted on active markets for the same assets. The following table summarizes the asset classes that are valuat-ed using alternative valuation methods.
Alternative valuation methods Figure 33:
MVBS asset Specificities when alternative valuation method
Cash and cash equivalents Valuated at purchase price
Collective investment undertakings Method provided by external asset manager
Corporate bonds Valuated at purchase price
Corporate bonds German-specific market price
Deposits other than cash equivalent Valuated at purchase price
Deposits to cedants Valuated at purchase price
Equities - unlisted Common equity valuated at purchase price
Equities - unlisted Market value at equity method
Government bonds German-specific market price
Loans and Mortgages Valuated at purchase price
Loans and Mortgages Method provided by external asset manager
Loans and Mortgages Other loans not revaluated. MVBS can be different be-cause it includes accrued interest
Other Investments Not revaluated
Other Investments Valuated at purchase price
Property (other than for own use) real estate is revaluated at least once a year by an in-dependent expert
Property, plant & equipment held for own use real estate is revaluated at least once a year by an in-dependent expert
Own shares Valuated at fair value
Derivatives Method provided by external asset manager
The calculation of German registered bonds is based on a monthly provided market yield value for each bond and each possible value of RLZ (period from calculation date to final maturity of security in years). The formula used is as follows:
Where:
MW is the security price in %
KR is the nominal coupon of the security
MR is the current market yield (interest rate from interest rate table)
RLZ is the period from calculation date to final maturity of security in years

EH SA - Solvency and Financial Condition Report 2017
page 120 of 141
D.5. Any other information
There is no other information to disclose with regards to valuation for solvency purposes.
EH SA - Solvency and Financial Condition Report 2017
page 121 of 141
Capital Management E.
E.1. Own funds
Information on the own funds E.1.1.
Management of the own funds E.1.1.1.
Capital poses the central resource for EH SA to support its multiple activities. It ties to the EH SA’s Risk Strategy, which defines the relevant Risk Appetite with regard to the risk bearing capacity includ-ing EH SA’s capital and solvency targets as well as risk limits, thus implementing EH SA’s business strategy. Capital management describes the set of activities undertaken by EH SA to ensure its ade-quate capitalization. The following principles are applied:
Capital management protects the Group’s capital base and supports effective capital manage-ment on Group level in line with the Group risk policy. It allocates capital to the underlying risk drivers under the budget limited by the Risk Strategy and with the target of optimising the ex-pected return under this constraint. Risk considerations and capital needs are integrated into management and decision-making processes. This is done by attribution of risk and allocation of capital to the various segments, lines of business and investments;
EH SA facilitates the fungibility of capital from a group-wide perspective by pooling/up-streaming available excess capital to EH Group while at the same time ensuring a sufficient level of capital is held at EH SA level. This includes a consideration of a buffer above the Minimum Capital Ratio to take into account potential market volatility;
EH SA ensures to comply with regulatory minimum capital requirements;
To ensure competiveness, EH SA however is committed to a top quartile capitalization and rating relative to its peers;
Capital is centrally managed in accordance with Group-wide rules and allocated to the benefit of the Group and its shareholders;
EH SA capitalization is managed using adequate buffers above minimum regulatory and where applicable rating agency requirements. Excess capital not required for business purposes over the (three year) plan horizon will be up-streamed by EH SA;
Capital management seeks to add economic value over our cost of capital;
EH SA management is committed to have shareholders participate in the economic development of the Group through dividend payments;
The capital allocation for steering the business is based on the IM also taking into account other constraints (such as rating and liquidity);
The RC for New Business will be allocated top down to LoBs that produce the highest Return on Risk Capital (RoRC) applying the principles of portfolio management. RoRC aims to ensure that EH SA is adequately compensated for the risk to which it is exposed.
Please refer to Section B.3.3.3 for further details on the capital management strategy.

EH SA - Solvency and Financial Condition Report 2017
page 122 of 141
Description of the own funds E.1.1.2.
In order to meet SII requirements, EH SA has defined its own funds as the excess of assets over liabili-ties, reduced by the amount of own shares (held directly and indirectly) and the foreseeable divi-dends. Own funds are distinguished into basic own funds and ancillary own funds. Basic own funds are defined as the excess of assets over liabilities plus any qualifying subordinated liabilities. Ancillary own funds are defined as any capital resources other than basic own funds that could be called up in order to absorb losses. Ancillary own funds are off-balance sheet and require regulatory approval in order to qualify.
Evolution of own funds (MVBS) Figure 34:
in M€ Q4 2017 Q4 2016 Variation
Total assets 4,083.5 4,085.8 -2.3
Total liabilities 2,776.3 2,817.0 -40.7
Excess of assets over liabilities 1,307.2 1,268.8 38.4
Correction OPCI + Interco -89.8 -84.7 -5.1
Dividends -80.0 -80.0 0.0
Own Shares -31.8 -30.9 -0.9
SII Own funds 1,105.7 1,073.3 32.4
The table here above shows that the SII own funds increased by 3% as the excess of asset over liabili-ties increased by 3%. The main explanations are given hereafter:
The retained earnings increased, driven by the positive result of the period;
The market value for investments decreased, mainly because of the additional distribution of EH Credit France;
The diminution of the combined ratio increased the future profits;
UK Pension Obligation increased mostly due to positive impact of the change in actuarial as-sumptions.
EH SA own funds are exclusively composed of basic own funds. The own funds are composed of tier 1 unrestricted for more than 98.4% and of tier 3 for the rest (the tier 3 own funds are net DTA). The available own funds were used for all calculations in this report. The table below summarizes EH SA own funds composition:
Composition of own funds (MVBS) Figure 35:
In M€ Total Tier 1
- unrestricted Tier 3
Ordinary share capital (gross of own shares) 229.4 229.4 0.0
Share premium account related to ordinary share capital 179.8 179.8 0.0
Reconciliation reserve 678.6 678.6 0.0
An amount equal to the value of net DTA 17.9 0.0 17.9
Total basic own funds after deductions 1,105.7 1,087.8 17.9

EH SA - Solvency and Financial Condition Report 2017
page 123 of 141
SCR and MCR covers E.1.1.3.
There is no specific restriction regarding EH SA’s own funds as they are composed of more than 98% of Tier 1 unrestricted. The remaining part of the own funds is composed of Tier 3 arising from DTA. The table below summarizes available and eligible amounts of own funds to cover both SCR and MCR.
Available and eligible own funds to meet SCR and MCR (MVBS) Figure 36:
In M€ Total Tier 1 - unre-
stricted Tier 3
Total available own funds to meet the SCR 1,105.7 1,087.8 17.9
Total available own funds to meet the MCR 1,087.8 1,087.8 0.0
Total eligible own funds to meet the SCR 1,105.7 1,087.8 17.9
Total eligible own funds to meet the MCR 1,087.8 1,087.8 0.0
Differences between valuation in financial statements and for solvency E.1.1.4.purposes
Evaluated from IFRS balance sheet, MVBS aims at showing an economic valuation of all assets and liabilities. Nevertheless, there are some differences between the two valuation methods which are monitored. The figures hereunder intend to show the main differences.
Bridge IFRS/MVBS Figure 37:
The eligible SII own funds value are 1,105.7M€ instead of 1,153.0M€ in IFRS.
Description of items deducted from own funds E.1.1.5.
EH SA does not have any ring-fenced or matching adjustment portfolio.
EH SA does not have any item deducted from own funds.
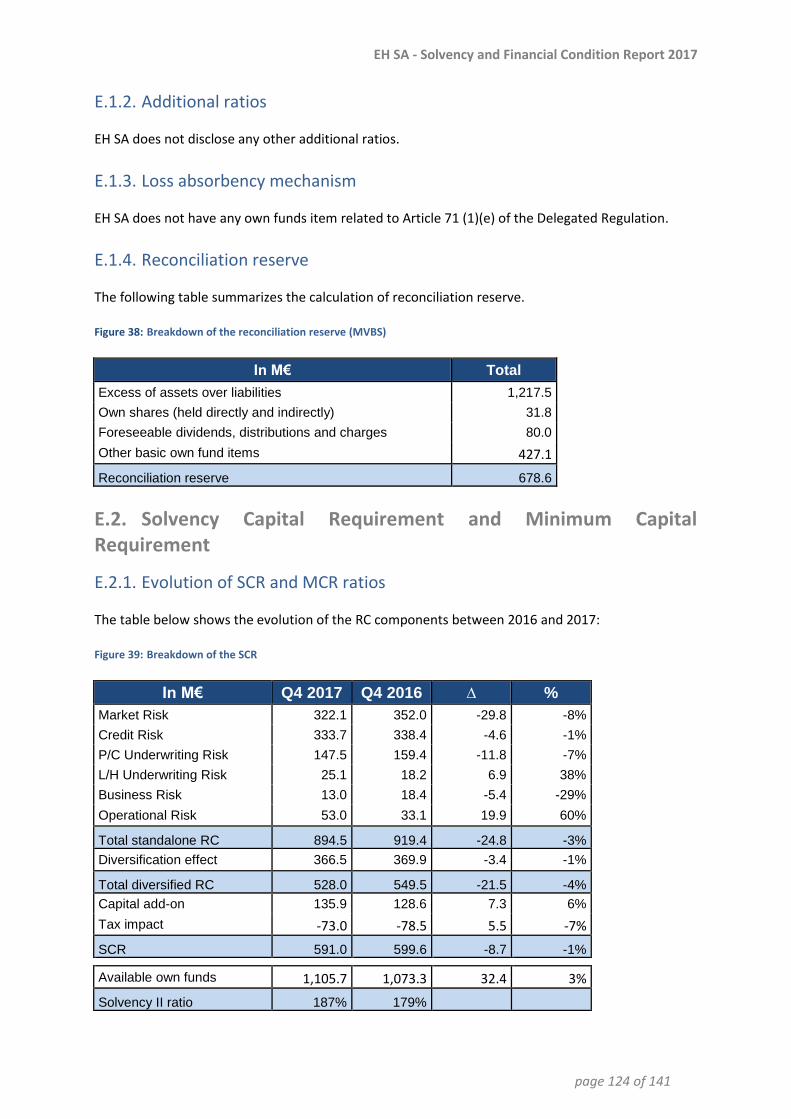
EH SA - Solvency and Financial Condition Report 2017
page 124 of 141
Additional ratios E.1.2.
EH SA does not disclose any other additional ratios.
Loss absorbency mechanism E.1.3.
EH SA does not have any own funds item related to Article 71 (1)(e) of the Delegated Regulation.
Reconciliation reserve E.1.4.
The following table summarizes the calculation of reconciliation reserve.
Breakdown of the reconciliation reserve (MVBS) Figure 38:
In M€ Total
Excess of assets over liabilities 1,217.5
Own shares (held directly and indirectly) 31.8
Foreseeable dividends, distributions and charges 80.0
Other basic own fund items 427.1
Reconciliation reserve 678.6
E.2. Solvency Capital Requirement and Minimum Capital Requirement
Evolution of SCR and MCR ratios E.2.1.
The table below shows the evolution of the RC components between 2016 and 2017:
Breakdown of the SCR Figure 39:
In M€ Q4 2017 Q4 2016 ∆ %
Market Risk 322.1 352.0 -29.8 -8%
Credit Risk 333.7 338.4 -4.6 -1%
P/C Underwriting Risk 147.5 159.4 -11.8 -7%
L/H Underwriting Risk 25.1 18.2 6.9 38%
Business Risk 13.0 18.4 -5.4 -29%
Operational Risk 53.0 33.1 19.9 60%
Total standalone RC 894.5 919.4 -24.8 -3%
Diversification effect 366.5 369.9 -3.4 -1%
Total diversified RC 528.0 549.5 -21.5 -4%
Capital add-on 135.9 128.6 7.3 6%
Tax impact -73.0 -78.5 5.5 -7%
SCR 591.0 599.6 -8.7 -1%
Available own funds 1,105.7 1,073.3 32.4 3%
Solvency II ratio 187% 179%
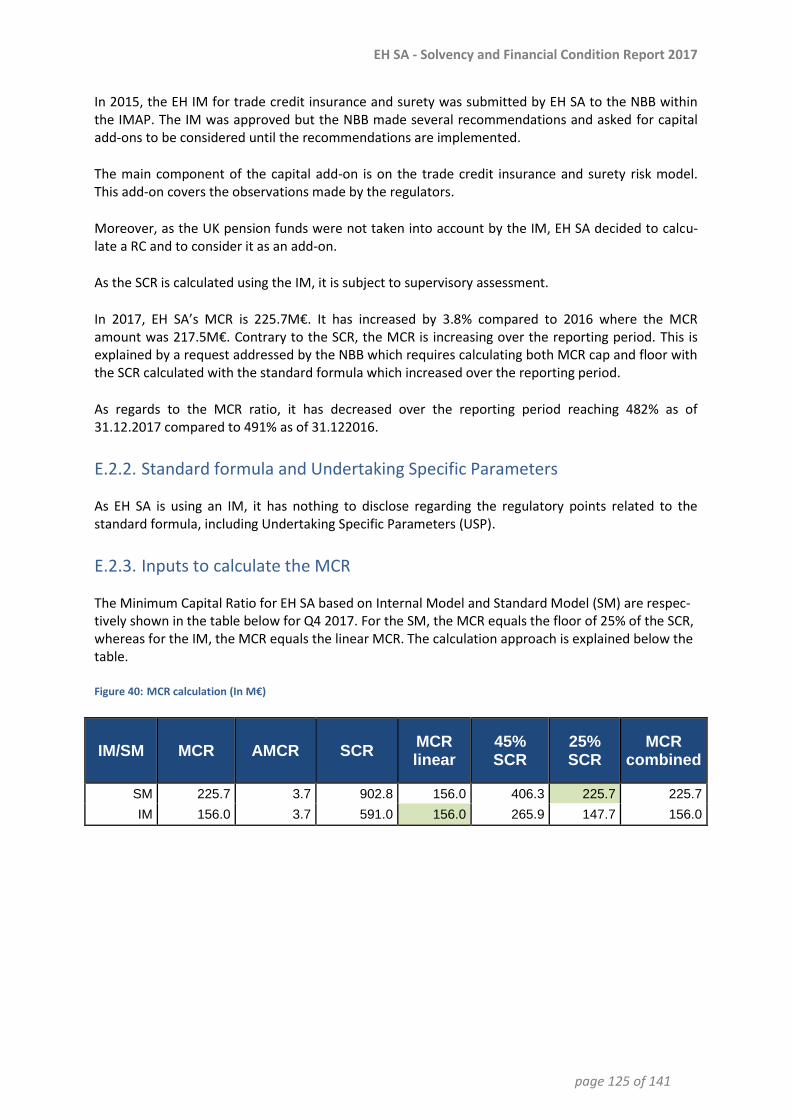
EH SA - Solvency and Financial Condition Report 2017
page 125 of 141
In 2015, the EH IM for trade credit insurance and surety was submitted by EH SA to the NBB within the IMAP. The IM was approved but the NBB made several recommendations and asked for capital add-ons to be considered until the recommendations are implemented.
The main component of the capital add-on is on the trade credit insurance and surety risk model. This add-on covers the observations made by the regulators.
Moreover, as the UK pension funds were not taken into account by the IM, EH SA decided to calcu-late a RC and to consider it as an add-on.
As the SCR is calculated using the IM, it is subject to supervisory assessment.
In 2017, EH SA’s MCR is 225.7M€. It has increased by 3.8% compared to 2016 where the MCR amount was 217.5M€. Contrary to the SCR, the MCR is increasing over the reporting period. This is explained by a request addressed by the NBB which requires calculating both MCR cap and floor with the SCR calculated with the standard formula which increased over the reporting period.
As regards to the MCR ratio, it has decreased over the reporting period reaching 482% as of 31.12.2017 compared to 491% as of 31.122016.
Standard formula and Undertaking Specific Parameters E.2.2.
As EH SA is using an IM, it has nothing to disclose regarding the regulatory points related to the standard formula, including Undertaking Specific Parameters (USP).
Inputs to calculate the MCR E.2.3.
The Minimum Capital Ratio for EH SA based on Internal Model and Standard Model (SM) are respec-tively shown in the table below for Q4 2017. For the SM, the MCR equals the floor of 25% of the SCR, whereas for the IM, the MCR equals the linear MCR. The calculation approach is explained below the table.
MCR calculation (In M€) Figure 40:
IM/SM MCR AMCR SCR MCR linear
45% SCR
25% SCR
MCR combined
SM 225.7 3.7 902.8 156.0 406.3 225.7 225.7
IM 156.0 3.7 591.0 156.0 265.9 147.7 156.0
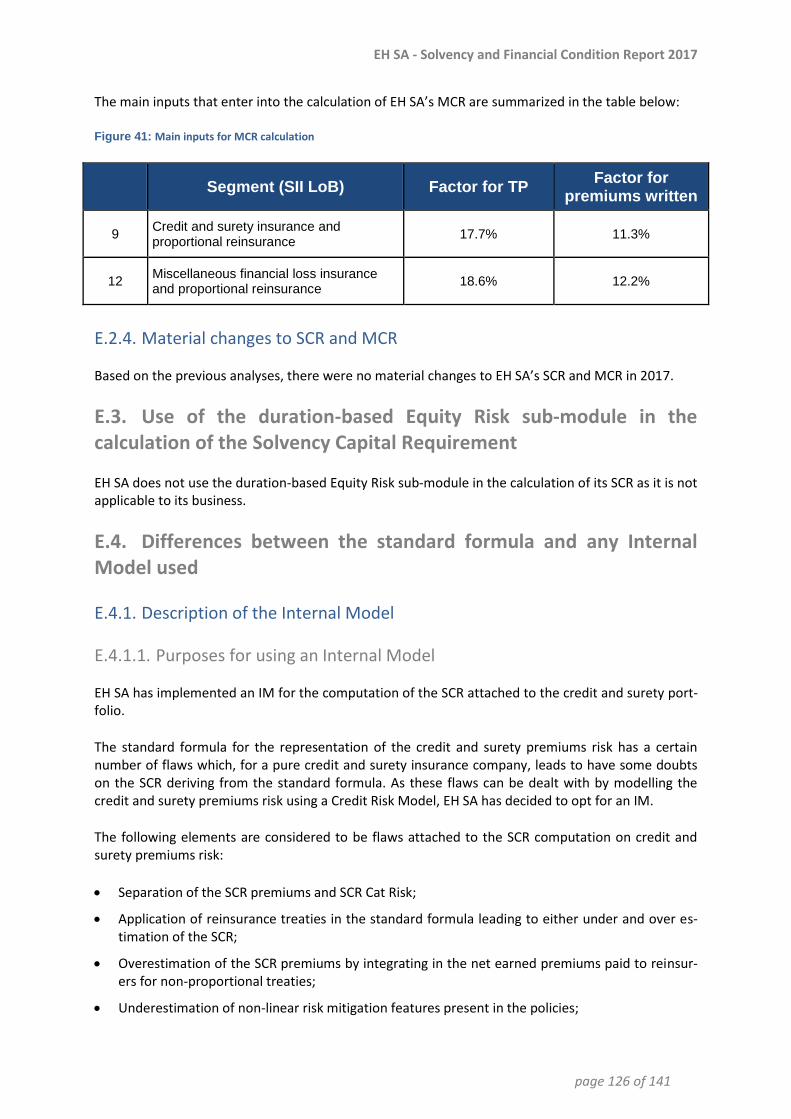
EH SA - Solvency and Financial Condition Report 2017
page 126 of 141
The main inputs that enter into the calculation of EH SA’s MCR are summarized in the table below:
Main inputs for MCR calculation Figure 41:
Segment (SII LoB) Factor for TP Factor for
premiums written
9 Credit and surety insurance and proportional reinsurance
17.7% 11.3%
12 Miscellaneous financial loss insurance and proportional reinsurance
18.6% 12.2%
Material changes to SCR and MCR E.2.4.
Based on the previous analyses, there were no material changes to EH SA’s SCR and MCR in 2017.
E.3. Use of the duration-based Equity Risk sub-module in the calculation of the Solvency Capital Requirement
EH SA does not use the duration-based Equity Risk sub-module in the calculation of its SCR as it is not applicable to its business.
E.4. Differences between the standard formula and any Internal Model used
Description of the Internal Model E.4.1.
Purposes for using an Internal Model E.4.1.1.
EH SA has implemented an IM for the computation of the SCR attached to the credit and surety port-folio.
The standard formula for the representation of the credit and surety premiums risk has a certain number of flaws which, for a pure credit and surety insurance company, leads to have some doubts on the SCR deriving from the standard formula. As these flaws can be dealt with by modelling the credit and surety premiums risk using a Credit Risk Model, EH SA has decided to opt for an IM.
The following elements are considered to be flaws attached to the SCR computation on credit and surety premiums risk:
Separation of the SCR premiums and SCR Cat Risk;
Application of reinsurance treaties in the standard formula leading to either under and over es-timation of the SCR;
Overestimation of the SCR premiums by integrating in the net earned premiums paid to reinsur-ers for non-proportional treaties;
Underestimation of non-linear risk mitigation features present in the policies;
EH SA - Solvency and Financial Condition Report 2017
page 127 of 141
Backward looking values representing the effect of risk mitigation measures implemented in the policy;
Computation based on the premiums which is not the most adequate measure of the risk.
The credit insurance business of EH SA is to take a share of the Credit Risk borne by the policyholder on its buyer. The classical Credit Risk modelling approaches, in particular those used in the banking world, are fully applicable to EH SA’s situation in order to simulate a loss distribution representing the expected loss with a one year time horizon.
Structure of the Internal Model E.4.1.2.
A Credit Risk modelling is essentially a two steps approach:
Simulation of the exposure which are defaulting leading to define the Exposure at Default (EAD);
Application of the mitigation factors either present in policies, in the reinsurance treaties or oth-er mitigation clauses leading to define the ultimate loss borne by the insurance company.
This modelling framework allows addressing all the issues stated in the point above:
Production of one loss distribution covering all kind of loss scenarios and loss events;
Risk mitigation features (either present in policy or a reinsurance treaty) can be modelled the way they are functioning and not estimated;
Risk mitigation features attached to the policies are representing the current status of the portfolio;
The model is based on exposure which is key metrics of the risk taken;
The parameters are defined in order to represent the risk borne by EH SA on a one year time horizon.
Scope of the Internal Model E.4.1.3.
The EH SA Internal Model covers:
All of its major insurance operations through its Trade Credit Insurance and Surety, Grading, Underwriting (P&C Underwriting & Business) and Operational Risk Models;
Its investment portfolio through its Market Risk and Credit Risk Models;
Its pension funds through its cash-flow and Life Non Market Risk Models;
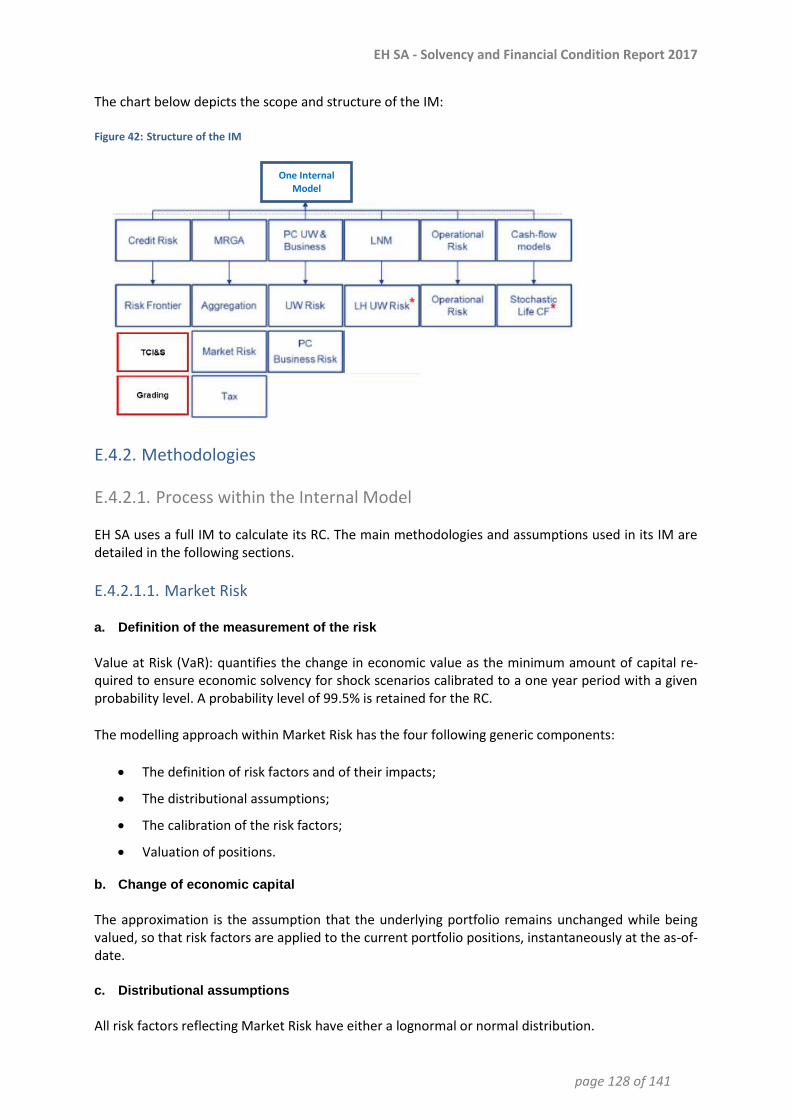
EH SA - Solvency and Financial Condition Report 2017
page 128 of 141
The chart below depicts the scope and structure of the IM:
Structure of the IM Figure 42:
Methodologies E.4.2.
Process within the Internal Model E.4.2.1.
EH SA uses a full IM to calculate its RC. The main methodologies and assumptions used in its IM are detailed in the following sections.
E.4.2.1.1. Market Risk
a. Definition of the measurement of the risk
Value at Risk (VaR): quantifies the change in economic value as the minimum amount of capital re-quired to ensure economic solvency for shock scenarios calibrated to a one year period with a given probability level. A probability level of 99.5% is retained for the RC.
The modelling approach within Market Risk has the four following generic components:
The definition of risk factors and of their impacts;
The distributional assumptions;
The calibration of the risk factors;
Valuation of positions.
b. Change of economic capital
The approximation is the assumption that the underlying portfolio remains unchanged while being valued, so that risk factors are applied to the current portfolio positions, instantaneously at the as-of-date.
c. Distributional assumptions
All risk factors reflecting Market Risk have either a lognormal or normal distribution.
One Internal Model
EH SA - Solvency and Financial Condition Report 2017
page 129 of 141
d. Calibration of risk factor distribution and to Measurement period
EH SA calibrates the distribution of risk factors on historical observation of weekly time series. This means the distribution of risk factors needs to be scaled to reflect this longer horizon.
e. Scenario based aggregation and its advantages
By means of Monte Carlo simulations, i.e. generation of independent samples of scenarios, EH SA generates a set of random scenarios, sufficiently large to estimate statistical quantities.
E.4.2.1.2. Reserve Risk
a. Reserving Uncertainty
Loss reserving is the process of forecasting unpaid liabilities. In order to measure the uncertainty embedded with forecasting, it is needed to obtain a predictive distribution of the unpaid liabilities and the associated cash flows. For most stochastic reserving models discussed in the actuarial litera-ture it is not easy or rather impossible to obtain a predictive distribution analytically. Therefore, a simulation approach was adopted: bootstrapping.
b. Cash flow estimation for Reserve Risk
Where a paid bootstrap has been used to estimate reserve uncertainty in a lob, the projected cash flow for that lob is already available as defined by the bootstrap.
Where either an incurred bootstrap or a lognormal simulation of the reserve has been used a cash flow estimate is required in order to obtain an estimation of the paid claims over the first future time period.
c. Dependencies
A rank normal correlation is applied within the ultimate gross loss distributions of the reserving LoBs.
d. The emergence pattern methodology
The evaluation of risk as it manifests over the first calendar year of development is based on a meth-odology using emergence patterns. These are patterns which describe the loss recognition over time of both premium and Reserve Risk.
e. Risk Capital
Even though the SCR is defined using the VaR at the confidence level of 99.5%, EH SA uses the term Ultimate Reserve RC for the difference between the VaR at the 99.93 percentile of the ultimate loss distribution at the horizon date and the mean of the ultimate loss distribution at the as-of-date. For a profit distribution this is the difference between the 0.07 percentile and the mean.
The RM is calculated according to the method prescribed by the Committee of European Insurance and Occupational Pensions Supervisors (CEIOPS) for SII.
EH SA - Solvency and Financial Condition Report 2017
page 130 of 141
f. Loss reserve Risk Margin calculation
The RM by LoB is calculated for the loss reserves. First, the net risk profile by lob is mapped to the SII lobs. Next, the RC is calculated and then used to generate the RM.
g. Premium reserve Risk Margin calculation
The methodology for calculating the RM for the premium reserve is identical to that used for the loss reserves for all calendar years except the first. Using the net risk profile from the emergence pattern model section, the capital required for the Premium Risk is calculated.
E.4.2.1.3. Credit Risk
EH decided to manage Credit Risk calculation with the combined use of two different models:
MKMV Risk Frontier which is a Moody’s solution for reinsurance and investments modelling;
EH IM which is a specific model developed by EH in order to capture specificities of credit in-surance business (buyer focused risk assessment and default definition, policy features and reinsurance structure)
Credit RC is calculated at first separately for each sub-type of Credit Risk prior to be consolidated across Credit Risks.
E.4.2.1.3.1. Credit Risk for reinsurance and investment modelling
Credit Risk is measured as a change in market value of the portfolio over a certain time horizon, due to defaults and credit quality migrations.
RC calculation is done through IMs based on a Value-at-Risk (“VaR”) approach. Following this ap-proach, the loss in the portfolio value of businesses is assessed within a one year timeframe for a large number of shock scenarios with a probability of occurrence up to 99.5% for RC calculation. This loss distribution provides Credit Value at Risk (CVaR) and expected losses.
The required internal RC is defined as the difference between the portfolio value under BE conditions and the portfolio value under the adverse conditions associated with the desired confidence level. The loss distribution is then derived.
For investment portfolio, EAD and Loss Given Default (LGD) are estimated following a linear model derived from a statistical analysis of historic data by asset classes.
E.4.2.1.3.2. Credit Risk for trade credit insurance & surety
The EAD is defined as the exposure of the buyer at the time of the default or for EH SA the claims declared before application of any loss mitigation techniques.
EH is using a Merton-type approach as a basis to build its default process using a Gaussian copula framework.
The LGD is obtained by applying to the EAD all possible loss reduction features. Then the simulation is based on Monte Carlo numerical method based on correlated Gaussian path.
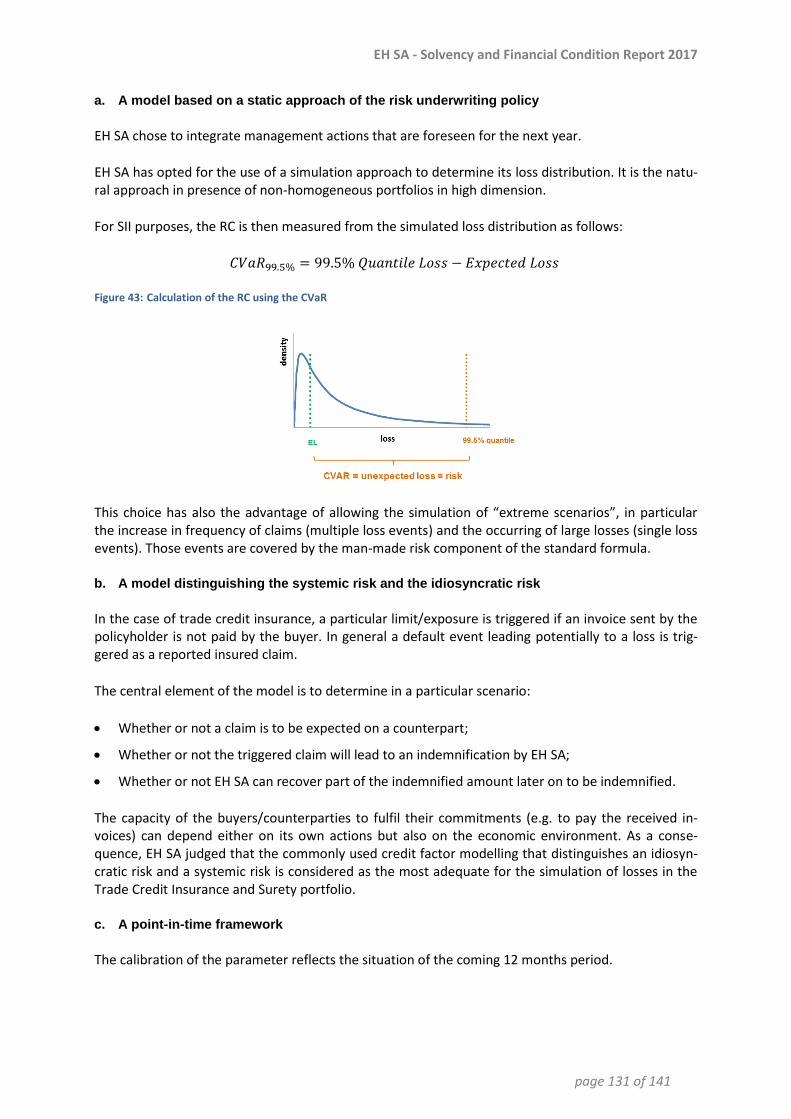
EH SA - Solvency and Financial Condition Report 2017
page 131 of 141
a. A model based on a static approach of the risk underwriting policy
EH SA chose to integrate management actions that are foreseen for the next year.
EH SA has opted for the use of a simulation approach to determine its loss distribution. It is the natu-ral approach in presence of non-homogeneous portfolios in high dimension.
For SII purposes, the RC is then measured from the simulated loss distribution as follows:
𝐶𝑉𝑎𝑅99.5% = 99.5% 𝑄𝑢𝑎𝑛𝑡𝑖𝑙𝑒 𝐿𝑜𝑠𝑠 − 𝐸𝑥𝑝𝑒𝑐𝑡𝑒𝑑 𝐿𝑜𝑠𝑠
Calculation of the RC using the CVaR Figure 43:
This choice has also the advantage of allowing the simulation of “extreme scenarios”, in particular the increase in frequency of claims (multiple loss events) and the occurring of large losses (single loss events). Those events are covered by the man-made risk component of the standard formula.
b. A model distinguishing the systemic risk and the idiosyncratic risk
In the case of trade credit insurance, a particular limit/exposure is triggered if an invoice sent by the policyholder is not paid by the buyer. In general a default event leading potentially to a loss is trig-gered as a reported insured claim.
The central element of the model is to determine in a particular scenario:
Whether or not a claim is to be expected on a counterpart;
Whether or not the triggered claim will lead to an indemnification by EH SA;
Whether or not EH SA can recover part of the indemnified amount later on to be indemnified.
The capacity of the buyers/counterparties to fulfil their commitments (e.g. to pay the received in-voices) can depend either on its own actions but also on the economic environment. As a conse-quence, EH SA judged that the commonly used credit factor modelling that distinguishes an idiosyn-cratic risk and a systemic risk is considered as the most adequate for the simulation of losses in the Trade Credit Insurance and Surety portfolio.
c. A point-in-time framework
The calibration of the parameter reflects the situation of the coming 12 months period.

EH SA - Solvency and Financial Condition Report 2017
page 132 of 141
E.4.2.1.4. Aggregation and diversification
VaR quantifies the change in economic value as the minimum amount of capital required to ensure economic solvency for shock scenarios calibrated to one year period with a given probability. The required internal RC is defined as the difference between the portfolio value under BE conditions and the portfolio value under the adverse conditions associated with the desired confidence level.
The aggregation method for the EH SA IM is based on an integrated Monte-Carlo simulation for Mar-ket Risk taking marginal risk distributions for non-Market Risk into account by modelling dependen-cies via a Gaussian Copula approach and taken into account diversification effects across sources of risk.
Difference between standard model and Internal Model E.4.2.2.
E.4.2.2.1. Market Risk
The scopes of IM & SM computations are identical for the Market Risk. It covers the EH SA invest-ment portfolio and the investments attached to the German defined benefit pension funds. There are however some differences in risk as some risks covered in the Market Risk of the SM are covered in the Credit Risk of the IM.
Hereafter is an overview of the main differences between the Market Risk sub-modules of the SM and the IM:
Credit Spread Risk:
o For covered and other bond: lower shocks are applied in the IM compared to the SM;
o Intra-risk diversification: the SM approach does not allow for any diversification when aggregating all the values of shocked instruments when the IM approach al-lows for a significant diversification between the asset classes.
Foreign Exchange Risk :
o Intra-risk diversification: the SM does not allow for diversification in the sub-module which is not the case in the IM;
o Level of shocks: while a single level of shock of 25% is defined in the SM approach, a specific level of shock is used in the IM;
Interest Rates Risk :
o In the SM, up and down stresses % changing the yield curve varies by term to maturi-ty. A minimum is defined for interest rates up stress;
o In the IM, changes in the yield curve like twists are considered, shifts for long-term are set. In addition, volatility stress is applied to yield curves;
o In the IM, there is diversification of Interest Rates Risk.
Equity Risk:
o The average shock level for equity type 1 and equity type 2 are slightly higher in IM than SM.
Property Risk:
o The average shock level for property risk is lower in IM than in SM.
EH SA - Solvency and Financial Condition Report 2017
page 133 of 141
Other differences come from difference in granularity/calibration between the two models.
Note also that European Economic Area (EEA) sovereign bonds, AAA and AA rated non-EEA sovereign bonds, supranational, and mortgage loans on residential property are not exempt from Spread Risk in the IM.
E.4.2.2.2. Credit Risk
The IM Credit Risk covers some components of the SM Market Risk and of the non-life Underwriting Risk. The SM counterparty default risk components are all covered by the IM Credit Risk.
The IM Credit Risk covers risks which are not covered in the SM (counterparty risk on European State bonds and counterparty risk on the SCR equivalent losses ceded to reinsurers).
As a consequence, these differences added to the differences in classification/granularity and calibra-tion between the models and the differences in modelling (discrete approach for SM vs stochastic approach for IM) explain the differences in Credit Risk.
E.4.2.2.3. Life Risks
The life risk bears only on the German defined benefit pension fund. For the SM, EH SA has taken the decision not to model this risk in application of the EIOPA rules.
E.4.2.2.4. Non-Life Risks
Both models capture the same types of risks EH SA is facing but following different classification and methods. Both models cover:
The Premium, Reserve and Business Risks due to cancellation of policies;
The ordinary claims level and the extraordinary claims level (recession, single loss events).
The classification is different between the two models. All risks (Premium, Reserve and Business) are under Non-Life Risk for the SM while the equivalent of the Premium Risk of the trade credit insur-ance and surety business is classified under Credit Risk for the IM and the Lapse Risk is under Busi-ness Risk. This has a double impact: representation and diversification.
On components classified both under the Non-Life Risks, the main difference lies in:
The methodology (discrete approach for the SM vs stochastic approach for the IM);
The calibration (across the industry for the SM vs own calibration for the IM);
The introduction of a diversification between “sub” lines of business (i.e. different products classified under credit and surety for EIOPA) of EH SA and a diversification between coun-tries;
The diversification approach (diversification limited to non-life risk in the SM while extended to all risk in the IM).
The relative weights of these various components contribute all significantly to the difference be-tween IM and SM.
EH SA - Solvency and Financial Condition Report 2017
page 134 of 141
On the Trade Credit Insurance and Surety portfolio, EH SA has developed its own model which has been classified as Credit Risk. This IM presents the following significant differences with the SM:
Computation at the level of the risk: buyer level (i.e. client of the insured which must pay its invoice) ;
Random scenario generation to simulate the loss distribution allowing covering different ex-treme scenario which are embedded in the Premium Risk and not captured in parallel.
The results of the IM and its comparison to the SM shows that the difference is due to the level of calibration of the recession risk by EIOPA and the fact that the calibration of the Premium Risk by EIOPA is not in line with our own experience (EIOPA is roughly +50% higher than EH own calibration using EIOPA method) while the contribution of the large/single losses to the SCR are equivalent.
E.4.2.2.5. Business Risks
Both models try to capture the deterioration of future earnings following a shock in terms of com-mercial activity. In the IM, the business risk has 2 components:
One not comparable with the SM (the new production risk – SCR equal to the fixed cost at-tached to the new production);
One which is partially comparable with the SM (Retention Risk – loss of operating profit to due to a less performant than anticipated renewal campaign).
The SM covers only this second risk.
However, on the component which philosophy is similar, the calibration is not comparable and there-fore the results are not directly comparable:
IM – loss of operating profit on 100% of the portfolio;
Standard Model – loss of operating profit on the profitable portfolio.
E.4.2.2.6. Operational Risk
The SM and IM approaches are significantly different. The IM is based on own expert scenarios of Operational Risk while the SM is based on a across the industry calibration. As a consequence, EH SA will not comment on the difference between the two models.
E.4.2.2.7. Diversification
The diversification mechanisms are significantly different due to:
All differences reported in the components of the pre-diversified SCR (classification of risks, calibration of risks…);
Calibration factors which are different (in particular for the Operational Risk which is diversi-fied in the IM and not in the SM);
The nature of the SM (discrete approach) and the nature of the IM (stochastic modelling).
EH SA - Solvency and Financial Condition Report 2017
page 135 of 141
As a consequence, EH notes that the diversification ratio is similar, recognizes that both approaches have been adequately computed and understands both results but cannot comment on this similari-ty of results.
E.4.2.2.8. Tax relief
The tax relief methodology is identical between SM and IM computation. Both methodologies calcu-late per branch the minimum of:
The tax rate multiplied by the RC (if necessary splitting the RC per tax rate category);
The DTL in the MVBS.
Data quality E.4.3.
EH SA has implemented a data quality framework across the whole company in accordance with the SII expectations. Thus, EH SA has produced all necessary deliverables with roles and responsibilities for each of them adding to an overall data governance organization.
Within the data quality framework, EH SA has set in place specific committees at different levels (the Group Data Quality council at strategic level and the Data Committee at operational level) and a clear definition of the stakeholders’ roles and responsibilities with validated attributions.
Moreover, in order to monitor the quality of data, KPIs have been implemented, are monitored and reported to the various committees through data quality dashboards. This consolidation and report-ing towards data committees are executed in such a way to be aligned to the EH SA quarterly RC closing process.
These KPIs are reported separately: KPIs per risk type on one side and IT KPIs on the other side.
In 2017, following the review of the data quality controls, a large number of new KPIs has been in-troduced for the TCI, to improve the framework of controls.
The quality of the data used at EH SA to calculate the RC is totally under control: only 0.9% of the KPIs are identified as “KO”.
Risks not covered by standard formula but covered by Internal Model E.4.4.
Please refer to Section E.4.2.2 of this report for differences in the risks and methodologies used be-tween the SM and the IM. In particular, differences in business risk are described in section E.4.2.2.5.
EH SA - Solvency and Financial Condition Report 2017
page 136 of 141
E.5. Non-compliance with the Minimum Capital Requirement and non-compliance with the Solvency Capital Requirement
Non-compliance with the Minimum Capital Requirement E.5.1.
EH SA is compliant with the Minimum Capital Requirement.
Non-compliance with the Solvency Capital Requirement E.5.2.
EH SA is compliant with the SCR.
E.6. Any other information
EH SA does not have any additional disclosures regarding its capital management.
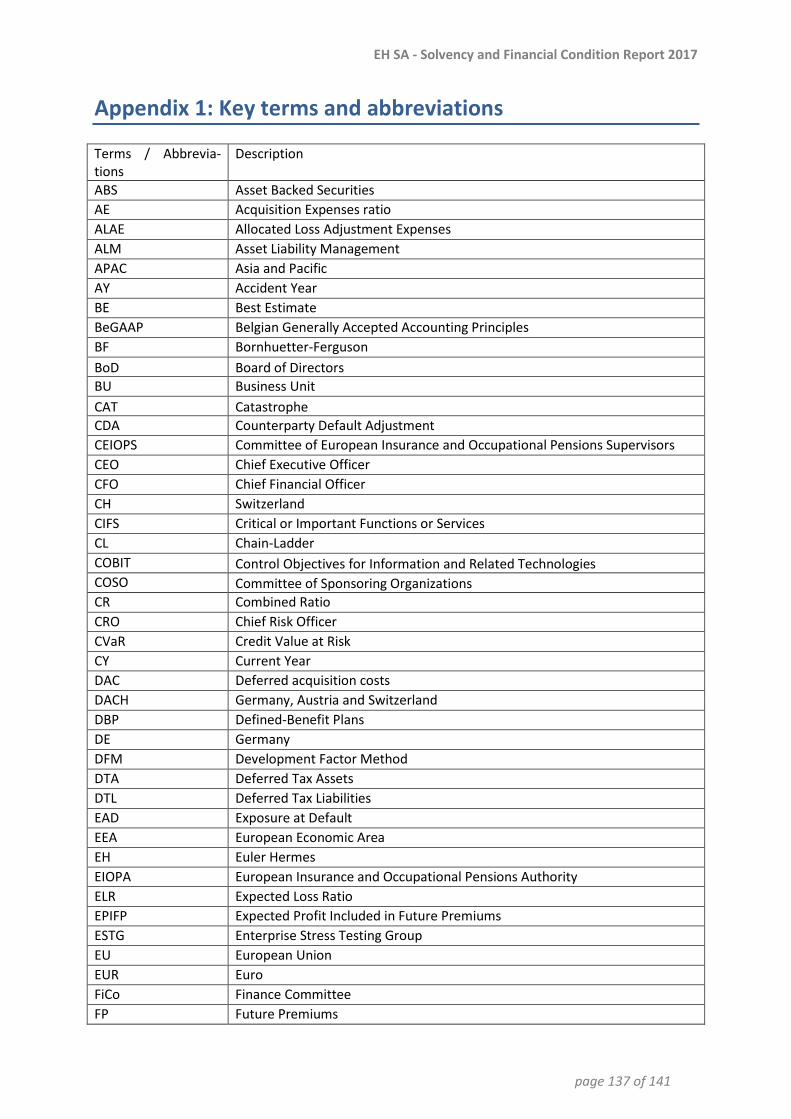
EH SA - Solvency and Financial Condition Report 2017
page 137 of 141
Appendix 1: Key terms and abbreviations
Terms / Abbrevia-tions
Description
ABS Asset Backed Securities
AE Acquisition Expenses ratio
ALAE Allocated Loss Adjustment Expenses
ALM Asset Liability Management
APAC Asia and Pacific
AY Accident Year
BE Best Estimate
BeGAAP Belgian Generally Accepted Accounting Principles
BF Bornhuetter-Ferguson
BoD Board of Directors
BU Business Unit
CAT Catastrophe
CDA Counterparty Default Adjustment
CEIOPS Committee of European Insurance and Occupational Pensions Supervisors
CEO Chief Executive Officer
CFO Chief Financial Officer
CH Switzerland
CIFS Critical or Important Functions or Services
CL Chain-Ladder
COBIT Control Objectives for Information and Related Technologies
COSO Committee of Sponsoring Organizations
CR Combined Ratio
CRO Chief Risk Officer
CVaR Credit Value at Risk
CY Current Year
DAC Deferred acquisition costs
DACH Germany, Austria and Switzerland
DBP Defined-Benefit Plans
DE Germany
DFM Development Factor Method
DTA Deferred Tax Assets
DTL Deferred Tax Liabilities
EAD Exposure at Default
EEA European Economic Area
EH Euler Hermes
EIOPA European Insurance and Occupational Pensions Authority
ELR Expected Loss Ratio
EPIFP Expected Profit Included in Future Premiums
ESTG Enterprise Stress Testing Group
EU European Union
EUR Euro
FiCo Finance Committee
FP Future Premiums

EH SA - Solvency and Financial Condition Report 2017
page 138 of 141
FX Exchange rate
G/L Gains/Losses
HKD Hong Kong Dollar
HR Human Resource
IAS International Accounting Standards
IBNER Incurred But Not Enough Reported
IBNR Incurred But Not Reported
IBNYR Incurred But Not Yet Reported
ICOFR Internal Control Over Financial Reporting
IELR Initial Expected Loss Ratio
IFRS International Financial Reporting Standards
IM Internal Model
IMAP Internal model Approval Process
IME Investment Management Expenses
IRCS Integrated Risk & Control System
IT Information Technology
KPI Key Performance Indicator
LGD Loss Given Default
LNMR Life Non-Market Risk
LoB Line of Business
LR Loss Ratio
LRC Loss Reserve Committee
LTI Long-Term Incentives
MAAC Model and Approval Adjustment Committee
MC Management Committee
MCR Minimum Capital Requirement
MKMV Moody's KMV model
MMCD Market Management, Commercial and Distribution Function
MMEA Mediterranean countries, Middle East and Africa
MO Model Owner
MSCI EM Morgan Stanley Capital International Emerging Markets Index
MSCI EMU Morgan Stanley Capital International European Economic and Monetary Un-ion Index
MSCI USA Morgan Stanley Capital International United State of America Index
MTB Mid-Term Bonus
MVBS Market Value Balance Sheet
NBB National Bank of Belgium
OPCI Organisme de Placement Collective en Immobilier
OREC Operational Risk Event Capture
ORM Operational Risk Management
ORSA Own Risk and Solvency Assessment
P&C Property & Casualty
P&L Profit & Loss
PAAC Parameters & Assumptions Approval Committee
PD Probability of Default
PR Premium Received
QRT Quantitative Reporting Templates
QS Quota Share

EH SA - Solvency and Financial Condition Report 2017
page 139 of 141
RADAR Risk Management Function following the Risk Assessment, Diagnostics, Anal-ysis and Reporting process
R&CM Risk & Capital Management
RC Risk Capital
RCSA Risk and Control Self Assessment
RG Ratio Growth
RIC Risk Information and Claims
RiCo Risk Committee
RM Risk Margin
RPF Risk Policy Framework
RR Recovery Rate
SA Société Anonyme
SAA Strategic Asset Allocation
SCR Solvency Capital Requirement
SFCR Solvency and Financial Condition Report
SFR Expenses regarding salvages and subrogation
SII Solvency II
SM Standard Model
SPV Special Purpose Vehicle
TFR Trattemento di Fine Rapporto
TP Technical Provisions
TRA Top Risk Assessment
UK United Kingdom
ULAE Unallocated Loss Adjustment Expenses
ULR Ultimate Loss Ratio
UPR Unearned Premium Reserve
USA United States of America
USD United States Dollar
USP Undertaking Specific Parameter
VA Volatility Adjustment
VaR Value at Risk
EH SA - Solvency and Financial Condition Report 2017
page 140 of 141
Appendix 2: Publically disclosed QRTs
Publically disclosed Quantitative Reporting Templates can be found on the EH Group main website: http://www.eulerhermes.com/

EH SA - Solvency and Financial Condition Report 2017
page 141 of 141
Appendix 3: Disclaimer
To the best of EH SA’s knowledge, the information contained herein is accurate and reliable as of the date of publication. However EH SA does not assume any liability whatsoever for the accuracy and completeness of the information contained herein.