eur 30504 en - europa
TRANSCRIPT
EUR 30504 EN
This publication is a Technical report by the Joint Research Centre (JRC), the European Commission’s science and knowledge service. It aims to provide evidence-based scientific support to the European policymaking process. The scientific output expressed does not imply
a policy position of the European Commission. Neither the European Commission nor any person acting on behalf of the Commission is responsible for the use that might be made of this publication. For information on the methodology and quality underlying the data used in this publication for which the source is neither Eurostat nor other Commission services, users should contact the referenced source.
The designations employed and the presentation of material on the maps do not imply the expression of any opinion whatsoever on the part of the European Union concerning the legal status of any country, territory, city or area or of its authorities, or concerning the delimitation of its frontiers or boundaries.
Contact information
Name: Nigel TAYLOR Address: European Commission, Joint Research Centre, Ispra, Italy Email: [email protected]
Name: Maria GETSIOU Address: European Commission DG Research and Innovation, Brussels, Belgium
Email: [email protected]
EU Science Hub https://ec.europa.eu/jrc
JRC123157
EUR 30504 EN
Luxembourg: Publications Office of the European Union, 2020
© European Union, 2020
The reuse policy of the European Commission is implemented by the Commission Decision 2011/833/EU of 12 December 2011 on the reuse of Commission documents (OJ L 330, 14.12.2011, p. 39). Except otherwise noted, the reuse of this document is authorised under the Creative Commons Attribution 4.0 International (CC BY 4.0) licence (https://creativecommons.org/licenses/by/4.0/). This means that reuse is allowed provided appropriate credit is given and any changes are indicated. For any use or reproduction of photos or other material that is not owned by the EU, permission must be sought directly from the copyright holders.
All content © European Union, 2020, except: cover page, © Fotolia 82963207, and where indicated otherwise
How to cite this report: Taylor, N., Jäger-Waldau, A., Photovoltaics Technology Development Report 2020, EUR 30504 EN, Publications Office of the European Union, Luxembourg 2020, ISBN 978-92-76-27274-8, doi:10.2760/827685, JRC123157.
PDF ISBN 978-92-76-27274-8 ISSN 2600-0466 ISSN 1831-9424 (online collection)
doi:10.2760/827685
Print ISBN 978-92-76-27275-5 ISSN 2600-0458 ISSN 1018-5593 (print collection)
doi:10.2760/215293

i
Contents
Foreword ................................................................................................................................................................................................................................. 1
Acknowledgements........................................................................................................................................................................................................... 2
1 Introduction ................................................................................................................................................................................................................ 3
1.1 Main Characteristics of the Technology ........................................................................................................................................ 3
1.2 Current Market Status .............................................................................................................................................................................. 5
1.3 Methodology and data sources .......................................................................................................................................................... 5
2 State of the art ........................................................................................................................................................................................................ 7
2.1 PV Technologies ........................................................................................................................................................................................... 7
2.1.1 Wafer-based crystalline silicon .................................................................................................................................................. 7
2.1.2 Thin-film Photovoltaics ................................................................................................................................................................ 11
2.1.1 Tandem PV ........................................................................................................................................................................................... 13
2.1.2 Concentrating Photovoltaics (CPV) ........................................................................................................................................ 14
2.2 Power conversion equipment ............................................................................................................................................................ 14
2.3 Cross-Cutting Aspects ........................................................................................................................................................................... 15
2.3.1 Standards .............................................................................................................................................................................................. 15
2.3.2 Building and Other Integrated Applications..................................................................................................................... 16
2.3.3 Sustainability and the Circular Economy .......................................................................................................................... 17
2.3.4 Performance, operation, reliability and lifetime ........................................................................................................... 18
3 R&D Overview ........................................................................................................................................................................................................ 20
3.1 Global and European Research and Innovation Landscape ........................................................................................... 20
3.1.1 Scientific Publications ................................................................................................................................................................... 20
3.1.2 Patents .................................................................................................................................................................................................... 23
3.2 EU Programmes......................................................................................................................................................................................... 27
3.2.1 Energy Union and the SET plan ............................................................................................................................................... 27
3.2.2 PV in Horizon 2020 ......................................................................................................................................................................... 27
3.2.3 SOLAR- ERA.NET................................................................................................................................................................................ 29
3.2.4 European Metrology Programme for Innovation and Research (EMPIR) ....................................................... 29
3.2.5 European Cooperation in Science and Technology (COST) .................................................................................... 30
3.2.6 EIT Innoenergy ................................................................................................................................................................................... 30
3.2.7 EIB InnovFin ......................................................................................................................................................................................... 30
3.2.8 NER-300 ................................................................................................................................................................................................ 30
3.3 Other R&D Programmes ...................................................................................................................................................................... 30
3.3.1 IEA Photovoltaic Power Systems Programme ................................................................................................................ 30
3.3.2 USA ............................................................................................................................................................................................................ 31
3.3.3 China ........................................................................................................................................................................................................ 32
3.3.4 Japan ....................................................................................................................................................................................................... 32
4 Impact of R&D with EU Co-Funding ........................................................................................................................................................ 34
ii
4.1 Wafer-based crystalline silicon ....................................................................................................................................................... 34
4.2 Thin film devices ....................................................................................................................................................................................... 34
4.3 Silicon wafer tandems .......................................................................................................................................................................... 35
4.4 Concentrating devices ........................................................................................................................................................................... 35
4.5 Building-related products .................................................................................................................................................................... 35
4.6 Operational Performance Improvement .................................................................................................................................... 36
4.7 Market Uptake ............................................................................................................................................................................................ 36
4.8 Circular Economy ...................................................................................................................................................................................... 36
5 Technology development Outlook............................................................................................................................................................. 47
5.1 Cost Trends................................................................................................................................................................................................... 47
5.1.1 Modules .................................................................................................................................................................................................. 47
5.1.2 PV Systems .......................................................................................................................................................................................... 48
5.2 Future Deployment Scenarios .......................................................................................................................................................... 50
5.2.1 Modelling Framework .................................................................................................................................................................... 50
5.2.2 Results..................................................................................................................................................................................................... 50
6 Conclusions .............................................................................................................................................................................................................. 52
6.1 R&I Resources and Programmes .................................................................................................................................................... 52
6.2 Technology Outlook................................................................................................................................................................................. 52
7 References ............................................................................................................................................................................................................... 54
Abbreviations and definitions ...................................................................................................................................................................... 57
List of figures......................................................................................................................................................................................................... 59
List of tables........................................................................................................................................................................................................... 60
Appendix 1 TRL definitions and checkpoints ................................................................................................................................................. 61
Appendix 2 Patent codes for PV devices and systems ........................................................................................................................... 66
Appendix 3 Listing of EU Supported R&D Projects for PV .................................................................................................................... 67
Appendix 4 Listing of SOLAR-ERANET Projects (status 2019) ........................................................................................................... 77
Appendix 5 PV-Related Projects supported by KIC-Innoenergy ......................................................................................................... 79

1
Foreword
The Low Carbon Energy Observatory (LCEO) is an internal European Commission Administrative Arrangement being executed by the Joint Research Centre for Directorate General Research and Innovation. It aims to provide top-class data, analysis and intelligence on developments in low carbon energy supply technologies. Its reports give a neutral assessment on the state of the art, identification of development trends and market barriers, as well as best practices regarding use private and public funds and policy measures. The LCEO started in April 2015 and runs to 2020. Which technologies are covered?
• Wind energy • Photovoltaics • Solar thermal electricity • Solar thermal heating and cooling • Ocean energy • Geothermal energy
• Hydropower • Heat and power from biomass • Carbon capture, utilisation and storage • Sustainable advanced biofuels • Battery storage • Advanced alternative fuels
How is the analysis done?
JRC experts use a broad range of sources to ensure a robust analysis. This includes data and results from EU-funded projects, from selected international, national and regional projects and from patents filings. External experts may also be contacted on specific topics. The project also uses the JRC-EU-TIMES energy system model to explore the impact of technology and market developments on future scenarios up to 2050.
What are the main outputs?
The project produces the following report series:
Technology Development Reports for each technology sector
Technology Market Reports for each technology sector
Future and Emerging Technology Reports (as well as the FET Database).
How to access the reports
Commission staff can access all the internal LCEO reports on the Connected LCEO page. Public reports are available from the Publications Office, the EU Science Hub and the SETIS website.

2
Acknowledgements
The authors thank Maria Getsiou for her review and valuable comments.
We would also like to thank
- JRC.C.2 colleagues Harald Muellejans, Robert, Kenny, Tony Sample and Ewan Dunlop for their critical but constructive reviews and comments and to Ruben Urraca and Ana Gracia Amillo for input on solar resource.
- The JRC.C.7 JRC-EU-TIMES team for energy modelling: Wouter Nijs, Pablo Ruiz Castello, Ioannis Tsiropoulos, Dalius Tarvydas
- Data on patent statistics and R&I investments at EU, national and corporate level have been provided by the JRC.C.7 SETIS R&I team: Francesco Pasimeni and Aliki Georgakaki.
Authors
Nigel Taylor Arnulf Jäger Waldau

3
1 Introduction
Over the past decade, solar photovoltaic (PV) electricity has grown rapidly to become a significant player in energy supply and a truly global industry. It is characterised by rapid innovation and increasing cost-competitiveness. As such, it is uniquely positioned to help achieve the EU's energy transition [1] and climate change objectives [2, 3] as well as to support EU jobs and economic growth in the context of the Green Deal [4].
This LCEO Technology Development Report aims to provide an unbiased assessment of the state of the art, development trends, targets and needs, technological barriers, as well as techno-economic projections until 2050. In this third edition (previous technology development reports were released in 2016 [5] and 2018 [6] and a PV technology market report in 2019 [7]) particular attention is given to how projects funded under Horizon 2020 are contributing to technology advancements in this field and to the related SET plan objectives [8].
1.1 Main Characteristics of the Technology
Photovoltaics is a solar-power technology for generating electricity using semiconductor devices called solar cells. Connected together, a number of solar cells form a solar ‘module’ or ‘panel’. These are then combined with suitable power electronics in a PV power system. The electricity power output ranges from a few watts in portable consumer products to multi-megawatt power stations.
Figure 1 shows a schematic of the main PV technologies. These can be broadly classified as "commercial", i.e. in mass production, "emerging" i.e., small production volumes and "novel", i.e. concept or early laboratory stage. Commercial technologies include wafer-based crystalline silicon (cSi) PV, as well as the thin-film technologies of copper indium/gallium disulfide/diselenide (CIGS) and cadmium telluride (CdTe). There is also growing interest for hybrid “thin-film on wafer1 concepts.
Figure 1 Overview of photovoltaic technologies
(source: adapted by JRC from a schematic at: http://pvthin.org/).
Thin-film silicon PV (amorphous and microcrystalline silicon) and concentrating photovoltaics (multijunction technology using III-V semiconductors, e.g., GaAs and InGaP) have lost market shares due to their lack of
(1) Silicon wafers are typically 180 microns thick, while thin-films are a few microns

4
efficiency improvements or problems with overall system cost reductions respectively. Some organic and dye-sensitized solar PV devices have been commercialised, but for the most part this technology remains in the novel and emerging categories. Hybrid organic-inorganic perovskite materials have emerged in the last five as promising option, in particular combined with wafer-based silicon to offer high efficiency and attractive manufacturing costs. A recent technology roadmap by international authors gives more detail on potential improvement pathways, also considering economic factors [9].
In terms of current market share, silicon wafer based photovoltaics are by far the dominant technology on the global market, with a 2019 share of over 95%. This report focuses on the commercial and emerging technologies, while the LCEO future and emerging technologies reports address novel approaches (technology readiness level less than 4). The SET plan Implementation Plan for PV gives a comprehensive picture of the technical challenges for PV technology development (see Text Box 1). The SET plan 2019 report [10] includes an assessment of progress on PV technology.
Text Box 1: SET plan PV Implementation Plan Priorities 2017 [8]
1. PV for BIPV and similar applications
The R&I activity on BIPV aims at developing a market pull approach for innovative and integrated PV solutions that will allow a faster market uptake of new PV technologies and a more intensive and multi-functional use of the available surface area in Europe, including quality and reliability. This requires a multidisciplinary approach and close collaboration between the PV/BIPV and building sectors.
On the one hand, for BIPV it seems likely that thin-film technologies (especially CIGS) are well suited. Therefore, a combined development of thin-film PV and BIPV is suggested. On the other hand, BIPV solutions based on other PV technologies can also offer attractive solutions. Sub-activities cover bifacial applications and PV installations on roads & waterways.
2. Technologies for silicon solar cells and modules with
higher quality
Wafer-based silicon (c-Si) technologies have the largest market share (>90%) in the worldwide solar PV sector. The main objective of this Activity is to develop and implement advanced c-Si PV technologies for high-quality, high-performance cells (≥24%) and modules in high-throughput industrial manufacturing processes, including (for the PV sector) new materials and production equipment. These products will serve as differentiator for the European PV industry by means of significant efficiency benefits and better performance related to sustainability aspects and recyclability of modules (PV Ecolabel, Ecodesign and Energy labels). Through this, the European PV industry will be able to strengthen its global position.
3. New technologies & materials
Crystalline silicon based solar cells as well as some thin-film technologies are gradually reaching their theoretical efficiency limit. The most promising approach (at least on the short and medium term) to go beyond this limit are tandem technologies. Concrete options are III/V-semiconductor or perovskite top cells on silicon bottom cells. Another option is a stack of two thin-film cells. A third route is the development of cost-effective concentrating PV (CPV).
The aim of this activity is to bring these technologies to an economically feasible level. …
…… Therefore the cell processing needs to be scaled-up on an industrial level and the cost needs to be reduced. New materials and the combination of two cell technologies need new interlayer development. Also the stability needs to be enhanced (or maintained if already sufficient). In the end the environmental impact of these new materials needs to be evaluated including quality and reliability.
4. Development of PV power plants and diagnostics
The aim of this activity is to develop and demonstrate business models and streamline the processes for effective operation and maintenance of residential and small commercial plants in order to keep the plant performance and availability high over the expected lifetime. Especially advanced monitoring is essential. Due to incompatibility and the accompanying extra costs this is often not done according to good industry practices.
Aspects of energy system integration are included, but as an integral part of the PV system.
5. Manufacturing technologies (for c-Si and thin-
film)
Further reduction of system and generation costs (LCoE) for silicon wafer based PV and thin-film technologies is strongly supported by the implementation of high-throughput, high yield industrial manufacturing technology. This includes production equipment (Capital Expenditure; CAPEX) and material (Bill of Materials; BOM) costs as well as product quality (efficiency and performance). Advances in this field will strengthen the European manufacturing industry. The introduction of new materials and cell/module designs enforces advances in the field of manufacturing technologies, including the introduction of Industry4.0 (“smart factory”) in PV, and will strengthen the European manufacturing equipment industry.
6. Cross-sectoral research at lower TRL
With respect to high level R&D, European research labs are still the leading institutions worldwide. A closer cooperation of these labs could help maintaining this position in order to support European industry with cutting-edge research results. On a topical level this activity covers all the other activities described above, with a focus on the low TRL-parts of the total R&I programs
5
1.2 Current Market Status
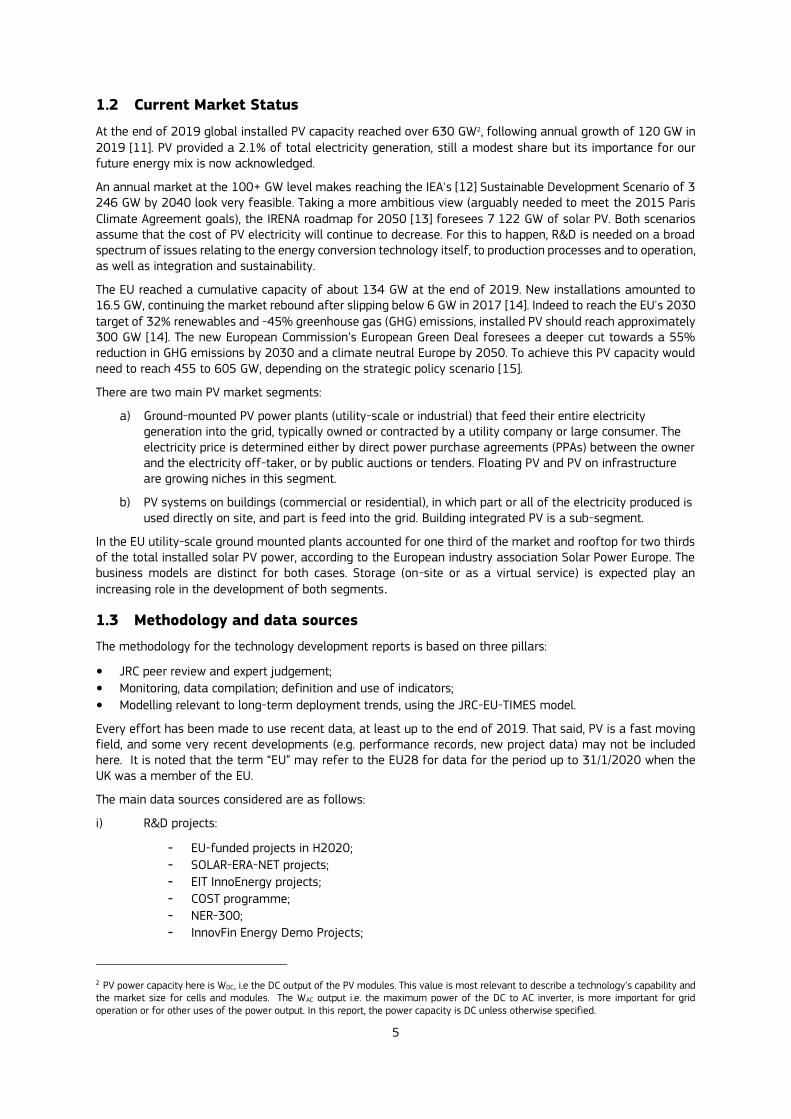
At the end of 2019 global installed PV capacity reached over 630 GW2, following annual growth of 120 GW in 2019 [11]. PV provided a 2.1% of total electricity generation, still a modest share but its importance for our future energy mix is now acknowledged.
An annual market at the 100+ GW level makes reaching the IEA's [12] Sustainable Development Scenario of 3 246 GW by 2040 look very feasible. Taking a more ambitious view (arguably needed to meet the 2015 Paris Climate Agreement goals), the IRENA roadmap for 2050 [13] foresees 7 122 GW of solar PV. Both scenarios assume that the cost of PV electricity will continue to decrease. For this to happen, R&D is needed on a broad spectrum of issues relating to the energy conversion technology itself, to production processes and to operation, as well as integration and sustainability.
The EU reached a cumulative capacity of about 134 GW at the end of 2019. New installations amounted to 16.5 GW, continuing the market rebound after slipping below 6 GW in 2017 [14]. Indeed to reach the EU's 2030 target of 32% renewables and -45% greenhouse gas (GHG) emissions, installed PV should reach approximately 300 GW [14]. The new European Commission’s European Green Deal foresees a deeper cut towards a 55% reduction in GHG emissions by 2030 and a climate neutral Europe by 2050. To achieve this PV capacity would need to reach 455 to 605 GW, depending on the strategic policy scenario [15].
There are two main PV market segments:
a) Ground-mounted PV power plants (utility-scale or industrial) that feed their entire electricity generation into the grid, typically owned or contracted by a utility company or large consumer. The electricity price is determined either by direct power purchase agreements (PPAs) between the owner and the electricity off-taker, or by public auctions or tenders. Floating PV and PV on infrastructure are growing niches in this segment.
b) PV systems on buildings (commercial or residential), in which part or all of the electricity produced is used directly on site, and part is feed into the grid. Building integrated PV is a sub-segment.
In the EU utility-scale ground mounted plants accounted for one third of the market and rooftop for two thirds of the total installed solar PV power, according to the European industry association Solar Power Europe. The business models are distinct for both cases. Storage (on-site or as a virtual service) is expected play an increasing role in the development of both segments.
1.3 Methodology and data sources
The methodology for the technology development reports is based on three pillars:
• JRC peer review and expert judgement;
• Monitoring, data compilation; definition and use of indicators;
• Modelling relevant to long-term deployment trends, using the JRC-EU-TIMES model.
Every effort has been made to use recent data, at least up to the end of 2019. That said, PV is a fast moving field, and some very recent developments (e.g. performance records, new project data) may not be included here. It is noted that the term “EU” may refer to the EU28 for data for the period up to 31/1/2020 when the UK was a member of the EU.
The main data sources considered are as follows:
i) R&D projects:
- EU-funded projects in H2020;
- SOLAR-ERA-NET projects;
- EIT InnoEnergy projects;
- COST programme;
- NER-300;
- InnovFin Energy Demo Projects;
2 PV power capacity here is WDC, i.e the DC output of the PV modules. This value is most relevant to describe a technology’s capability and the market size for cells and modules. The WAC output i.e. the maximum power of the DC to AC inverter, is more important for grid operation or for other uses of the power output. In this report, the power capacity is DC unless otherwise specified.
6
- Member States' activities reported to the SET plan Temporary Working Group;
- major international projects, e.g. IEA Technical Cooperation Programme PVPS;
- projects and programmes from major non-EU countries.
ii) Patents statistics, for patents filed on technologies/sub-technologies
iii) Scientific publishing statistics, as analysed with the JRC's TIM (tools for information monitoring) software, which makes use of text mining and computational linguistic techniques to treat and enrich individual data items with useful information.
iv) Existing scientific overviews and compilations, including the proceedings of the annual European Photovoltaic Solar Energy Conference (EUPVSEC); publications of the European Technology and Innovation Platform for Photovoltaics (ETIP-PV), the Fraunhofer ISE Photovoltaics Reports 2019 [16] and the 2020 International Technology Roadmap for Photovoltaics [17].
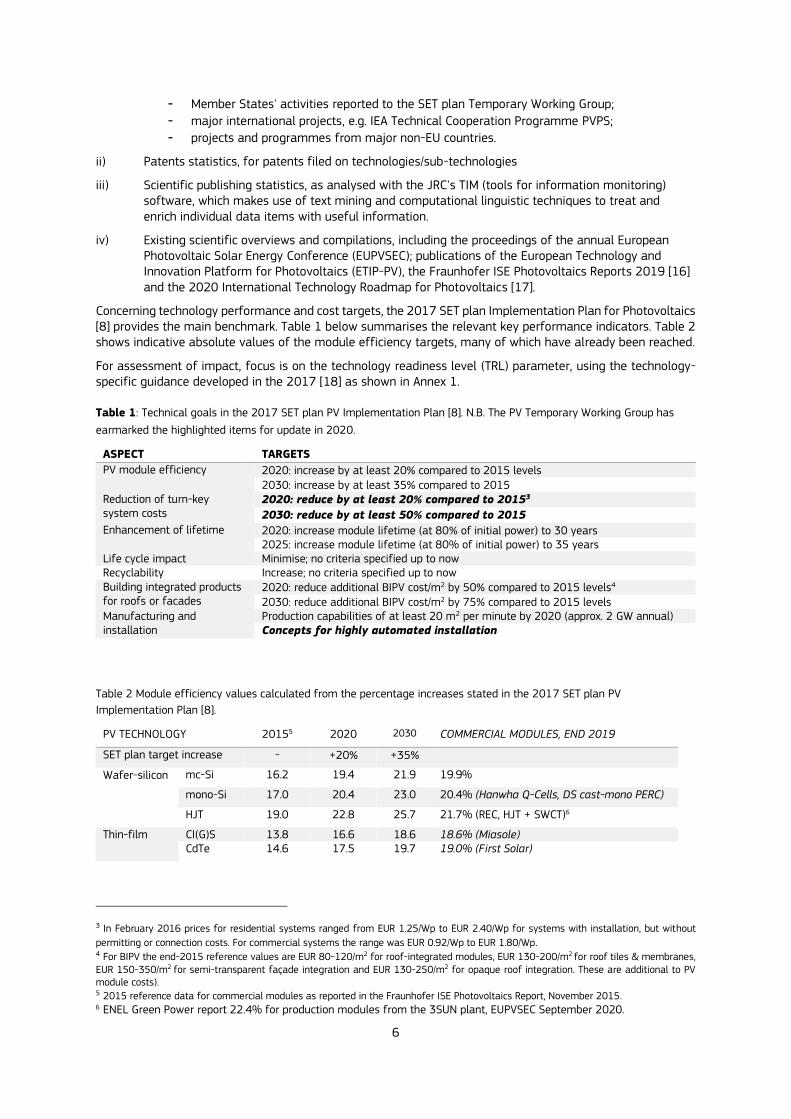
Concerning technology performance and cost targets, the 2017 SET plan Implementation Plan for Photovoltaics [8] provides the main benchmark. Table 1 below summarises the relevant key performance indicators. Table 2 shows indicative absolute values of the module efficiency targets, many of which have already been reached.
For assessment of impact, focus is on the technology readiness level (TRL) parameter, using the technology-specific guidance developed in the 2017 [18] as shown in Annex 1.
Table 1: Technical goals in the 2017 SET plan PV Implementation Plan [8]. N.B. The PV Temporary Working Group has
earmarked the highlighted items for update in 2020.
ASPECT TARGETS
PV module efficiency
2020: increase by at least 20% compared to 2015 levels 2030: increase by at least 35% compared to 2015
Reduction of turn-key system costs
2020: reduce by at least 20% compared to 20153
2030: reduce by at least 50% compared to 2015
Enhancement of lifetime
2020: increase module lifetime (at 80% of initial power) to 30 years 2025: increase module lifetime (at 80% of initial power) to 35 years
Life cycle impact Minimise; no criteria specified up to now Recyclability Increase; no criteria specified up to now Building integrated products for roofs or facades
2020: reduce additional BIPV cost/m2 by 50% compared to 2015 levels4 2030: reduce additional BIPV cost/m2 by 75% compared to 2015 levels
Manufacturing and installation
Production capabilities of at least 20 m2 per minute by 2020 (approx. 2 GW annual) Concepts for highly automated installation
Table 2 Module efficiency values calculated from the percentage increases stated in the 2017 SET plan PV
Implementation Plan [8].
PV TECHNOLOGY 20155 2020 2030 COMMERCIAL MODULES, END 2019
SET plan target increase - +20% +35%
Wafer-silicon mc-Si 16.2 19.4 21.9 19.9%
mono-Si 17.0 20.4 23.0 20.4% (Hanwha Q-Cells, DS cast-mono PERC)
HJT 19.0 22.8 25.7 21.7% (REC, HJT + SWCT)6
Thin-film CI(G)S 13.8 16.6 18.6 18.6% (Miasole) CdTe 14.6 17.5 19.7 19.0% (First Solar)
3 In February 2016 prices for residential systems ranged from EUR 1.25/Wp to EUR 2.40/Wp for systems with installation, but without
permitting or connection costs. For commercial systems the range was EUR 0.92/Wp to EUR 1.80/Wp. 4 For BIPV the end-2015 reference values are EUR 80-120/m2 for roof-integrated modules, EUR 130-200/m2 for roof tiles & membranes, EUR 150-350/m2 for semi-transparent façade integration and EUR 130-250/m2 for opaque roof integration. These are additional to PV module costs). 5 2015 reference data for commercial modules as reported in the Fraunhofer ISE Photovoltaics Report, November 2015. 6 ENEL Green Power report 22.4% for production modules from the 3SUN plant, EUPVSEC September 2020.

7
2 State of the art
2.1 PV Technologies
2.1.1 Wafer-based crystalline silicon
Wafer-based crystalline silicon is the mainstream PV technology. The production process starts smelting of silica (SiO2) to produce metallurgical silicon. This is then refined and either cast as polycrystalline or monocrystalline ingots (directional solidification) or drawn in the form of large single crystal ingots (Czochralski process). The ingots are sliced into wafers, which are processed into solar cells (adding passivation layers, antireflective layers and electrical contacts). The final step is the module assembly, in which 60 or 72 cells are usually laid up, interconnected and sealed as weatherproof packages, designed to last for at least 25 years.
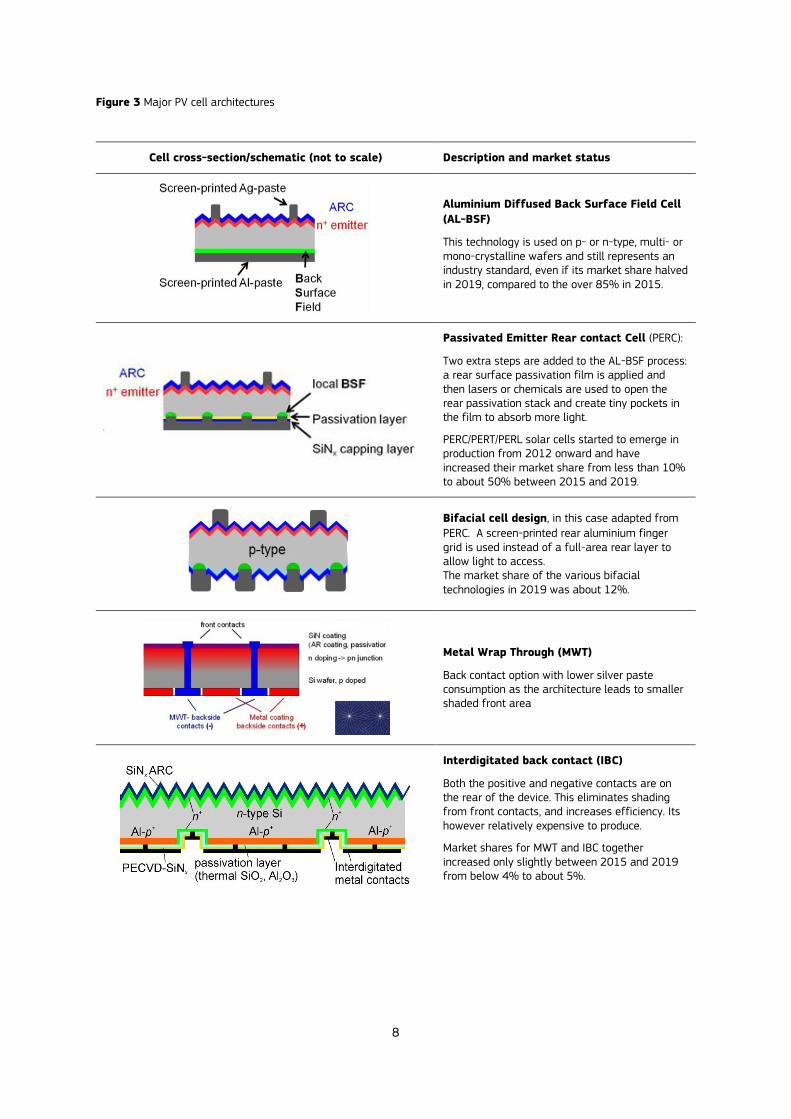
Silicon PV is a complex field, encompassing a broad range of technology variants (Figure 2). These are distinguished by doping (p- or n-type), by whether cast in multicrystalline or quasi–mono form or drawn as a monocrystalline ingot or by the type of contacting used to extract current. Figure 3 provides schematic details of the main cell architectures.
Figure 2 Schematic of the silicon wafer sub-technologies, with examples of recent cell efficiency records.
8
Figure 3 Major PV cell architectures
Cell cross-section/schematic (not to scale) Description and market status
Aluminium Diffused Back Surface Field Cell
(AL-BSF)
This technology is used on p- or n-type, multi- or mono-crystalline wafers and still represents an industry standard, even if its market share halved in 2019, compared to the over 85% in 2015.
Passivated Emitter Rear contact Cell (PERC):
Two extra steps are added to the AL-BSF process: a rear surface passivation film is applied and then lasers or chemicals are used to open the rear passivation stack and create tiny pockets in the film to absorb more light.
PERC/PERT/PERL solar cells started to emerge in production from 2012 onward and have increased their market share from less than 10% to about 50% between 2015 and 2019.
Bifacial cell design, in this case adapted from
PERC. A screen-printed rear aluminium finger grid is used instead of a full-area rear layer to allow light to access. The market share of the various bifacial technologies in 2019 was about 12%.
Metal Wrap Through (MWT)
Back contact option with lower silver paste consumption as the architecture leads to smaller shaded front area
Interdigitated back contact (IBC)
Both the positive and negative contacts are on the rear of the device. This eliminates shading from front contacts, and increases efficiency. Its however relatively expensive to produce.
Market shares for MWT and IBC together increased only slightly between 2015 and 2019 from below 4% to about 5%.

9
Cell cross-section/schematic (not to scale) Description and market status
Full Area Passivated Cell: the bottom of the
wafer is given a thin-film structure that passivates and serves as a conductive contact to the cell. This eliminates (i) the need for diffusion or implantation doping of the wafer and (ii) complicated patterning of selective emitter/BSF.
This technology is just emerging in large-scale production
Heterojunction (HJT) Cells: An ultra-thin layer
of amorphous silicon is deposited on the front and back surfaces of a mono, n-type wafer. This can also be combined with IBC contacting for the very highest efficiency Si cells.
Previously a niche product, but now being developed for large scale production by several manufacturers
Figure 4 shows the current and projected market shares of the main commercial technologies from the annual ITRPV report [17]. Up to 2018 p-type multicrystalline cells with aluminium diffused back-surface field (Al-BSF) architecture, dominated the market. There has since been a massive shift to PERC (passivated rear emitter and rear cell7) architectures, which in 2019 became the predominant silicon wafer technology with multi-GW factories. Cell efficiencies in industrial production are at 22% and better [19]. A further important driver is that the PERC production process can be adapted to make bi-facial cells i.e. they can use light falling on the rear surface as well as the front. In this way a relatively small and low cost modification to the cell processing equipment can give a significant increase in output (typically 10% or more depending on the mounting and environment, although manufacturers may claim much higher values).
These developments have not been without some problems. In particular, the industry has had to develop ways to cope with degradation processes such as:
a) light induced degradation (LID) can cause modules to lose a percentage of power after first exposure to light;
b) potential induced degradation (PID) can lead to significant power losses in longer-term operation, depending on the system configuration, and
c) LeTID (Light and elevated Temperature Induced Degradation) causes a progressive loss of performance and is more likely to occur at high operating temperatures.
Cells using n-type silicon offer superior performance for several fundamental physical reasons, but up to now the production price differential has favoured the p-type. Market share is currently about 10% [17]. Sunpower traditionally dominated this segment with its mono-crystalline cell with interdigitated back-contacts. They still hold the cell efficiency record in this class (25.3%), although Trina Solar have recently made big advances and announced a cell with 25.2% efficiency [20]. Other technology options include passivated contacts, in the PERC architecture, in full-area passivated designs (such as TopCon) and also in heterojunction (HJT) cells that include
7 PERC covers a family of cell concepts, of which the PERL (Passivated Emitter, Rear Locally-doped) and PERT (Passivated Emitter, Rear Totally-diffused) are the most widely implemented. The concept was first realised in the 1980s, but has taken off commercially in the last 3 years with the introduction of cost effective laser processing equipment, among other factors.

10
thin layers of amorphous silicon deposited on the n-type monocrystalline silicon wafer substrate. Although the market share for HJT modules is still relatively small (only a few percent in 2019), the ITRPV report forecasts it to reach 15% by the end of decade. Indeed the efficiency record for silicon wafer solar cells is held by Kaneka's IBC/HJT cell, which established a record of 26.7% in 2017. Kaneka maintain that this value could be increased up to 27.1% (the theoretical limit for this type of junction is 29.3%). Modules using these cells have reached 24% efficiency, but the specific production process is not commercially viable. Current industrial HJT manufacturing processes produce modules with 21.5 to 22.5% efficiency.
Figure 4 Current and projected global market shares of c-Si cell concepts.
(Source: ITRPV Roadmap [17])
It's worth noting that value chain for c-Si modules consists in several stages, all of which need to be addressed by R&D in order to reduce costs (Figure 5). Issues include:
• Silicon feedstock: fluidised bed reactors can offer significant energy (and hence cost) savings compared to the conventional Siemens process, but the product quality is not yet at the same level.
• Silicon wafers: the industry currently relies mainly on 160-180 µm wafers, and with silicon prices at an historic low (currently about USD 12/kg, down from USD 70/kg in 2010), the pressure to move to thinner cells is not as strong as it was a few years ago. The ITRPV roadmap foresees a modest reduction in thickness up to 2025, however not going below 100 µm. Overall, silicon material usage for cells has reduced over the last 10 years from 16 g/W to less than 6 g/W now. Moving to thinner wafers is also a challenge for the production process. The EU FP7 Cheetah project demonstrated the feasibility of handling 90 µm wafers on pilot production equipment with some adaptions, but lower thicknesses would require significant modification of the processing equipment.
• Kerfless wafer technologies are being developed that eliminate the sawing process. So-called epitaxial wafers/foils are fabricated by chemical vapour deposition of Si layers in the thickness range between 40 and 150 μm on re-usable seed substrates. The ITRPV roadmap [17] predicts a modest 10% market share for kerfless wafers in the 2025 timeframe. However, there are issues to be solved regarding automated handling of large area thin wafers in the production environment.
• Contacting: the use of passivated contacts (deposited as a thin-film layer) offers a step to higher efficiency by either enhancing the contacts in PERC-type cell or to go beyond PERC entirely, as in the full-area passivated contact designs such as TopCon.
• Metallisation: efforts to reduce silver usage and bring in substitutes e.g. copper.
• Anti-reflective glass: need to extend service life

11
• Cell interconnection: move to lead-free materials, use of half-cells or shingled cells, conducting adhesives, compatibility with thinner wafers etc.
• Encapsulants and backsheet development for longer service life and for cost reduction.
Research efforts in the EU are largely focussed in Germany (Fraunhofer ISE, ISC Konstanz, IFSH), Belgium (IMEC), the Netherlands (TNO8), France (CEA-INES) and Switzerland (EPFL). Institutes in many other countries also contribute significantly. These activities are mainly funded by national programmes and by industry collaborations (now often with Asian companies).
Figure 5 Proportional costs of the main elements in in c-Si PV module production.
(Source: ITRPV Roadmap [17]).
2.1.2 Thin-film Photovoltaics
The term "thin-film" refers to devices with active layers of a few microns thickness (i.e. about 100x thinner than silicon wafers) deposited on a suitable substrate. Thin-film PV emerged some decades ago exploiting advances in deposition methods. They offer:
- low manufacturing costs
- low energy payback time
- low CO2 footprint
Thin-film modules using cadmium telluride (CdTe), copper indium gallium diselenide (CIGS), amorphous and other thin-film silicon have been commercially available since the 1980s. Overall the market share has been decreasing in recent years, on account of the booming silicon wafer market and in 2019 was less than 5% of total annual PV module production, so in the order of 6 GW production.
Commercially, First Solar, USA, is a multi-GW scale producer with its established CdTe module technology. Although CIGS offers comparable or even higher efficiency, production is fragmented over a range of companies in Europe, US, Japan and China, with several contending manufacturing processes. The Japanese company Solar Frontier has now reached 1 GW capacity for its cadmium-free product. The 2019 CIGS White Paper by an industry/research consortium [21] claims that the technology can be competitive in many applications, including as building integrated products. ZSW, Germany, is Europe's leading lab for CIGS. It has boosted the efficiency of its solar cells to 23.5%, and estimate that values could reach 25%.
Over the last five years, a new class of hybrid organic-inorganics lead halides compounds, known as perovskites, have emerged as an important thin-film technology, not least for the high efficiencies achieved in labs (the cell record is 22.1%). The European Perovskite Initiative [22] brings together 73 entities to exploit European research in this area, in particular to work on the challenges of overall efficiency and stability, as well as further understanding of the eco-sustainability and environmental impacts in industrial scenarios. An important application of perovskites is for tandem devices, as discussed in section 2.4 below.
8 Now includes the former ECN activities
12
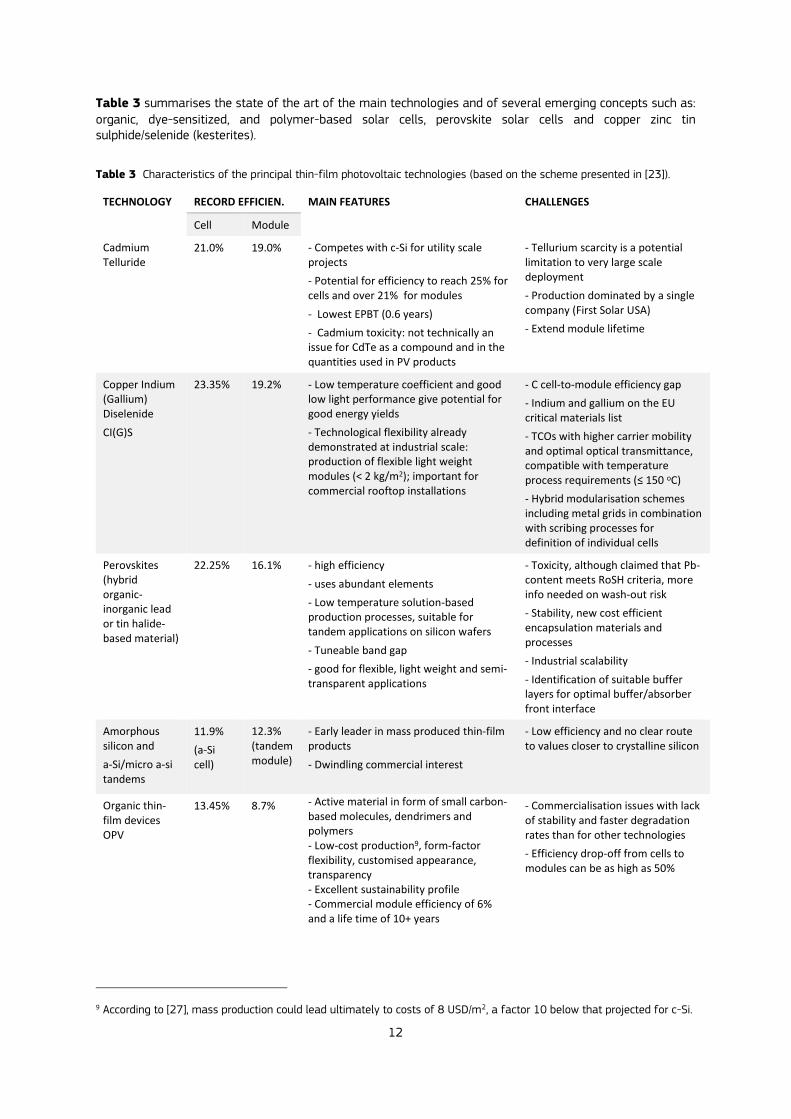
Table 3 summarises the state of the art of the main technologies and of several emerging concepts such as: organic, dye-sensitized, and polymer-based solar cells, perovskite solar cells and copper zinc tin sulphide/selenide (kesterites).
Table 3 Characteristics of the principal thin-film photovoltaic technologies (based on the scheme presented in [23]).
TECHNOLOGY RECORD EFFICIEN. MAIN FEATURES CHALLENGES
Cell Module
Cadmium Telluride
21.0% 19.0% - Competes with c-Si for utility scale projects
- Potential for efficiency to reach 25% for cells and over 21% for modules
- Lowest EPBT (0.6 years)
- Cadmium toxicity: not technically an issue for CdTe as a compound and in the quantities used in PV products
- Tellurium scarcity is a potential limitation to very large scale deployment
- Production dominated by a single company (First Solar USA)
- Extend module lifetime
Copper Indium (Gallium) Diselenide
CI(G)S
23.35% 19.2% - Low temperature coefficient and good low light performance give potential for good energy yields
- Technological flexibility already demonstrated at industrial scale: production of flexible light weight modules (< 2 kg/m2); important for commercial rooftop installations
- C cell-to-module efficiency gap
- Indium and gallium on the EU critical materials list
- TCOs with higher carrier mobility and optimal optical transmittance, compatible with temperature process requirements (≤ 150 oC)
- Hybrid modularisation schemes including metal grids in combination with scribing processes for definition of individual cells
Perovskites (hybrid organic-inorganic lead or tin halide-based material)
22.25% 16.1% - high efficiency
- uses abundant elements
- Low temperature solution-based production processes, suitable for tandem applications on silicon wafers
- Tuneable band gap
- good for flexible, light weight and semi-transparent applications
- Toxicity, although claimed that Pb-content meets RoSH criteria, more info needed on wash-out risk
- Stability, new cost efficient encapsulation materials and processes
- Industrial scalability
- Identification of suitable buffer layers for optimal buffer/absorber front interface
Amorphous silicon and
a-Si/micro a-si tandems
11.9%
(a-Si cell)
12.3% (tandem module)
- Early leader in mass produced thin-film products
- Dwindling commercial interest
- Low efficiency and no clear route to values closer to crystalline silicon
Organic thin-film devices OPV
13.45% 8.7% - Active material in form of small carbon-based molecules, dendrimers and polymers - Low-cost production9, form-factor flexibility, customised appearance, transparency - Excellent sustainability profile - Commercial module efficiency of 6% and a life time of 10+ years
- Commercialisation issues with lack of stability and faster degradation rates than for other technologies
- Efficiency drop-off from cells to modules can be as high as 50%
9 According to [27], mass production could lead ultimately to costs of 8 USD/m2, a factor 10 below that projected for c-Si.
13
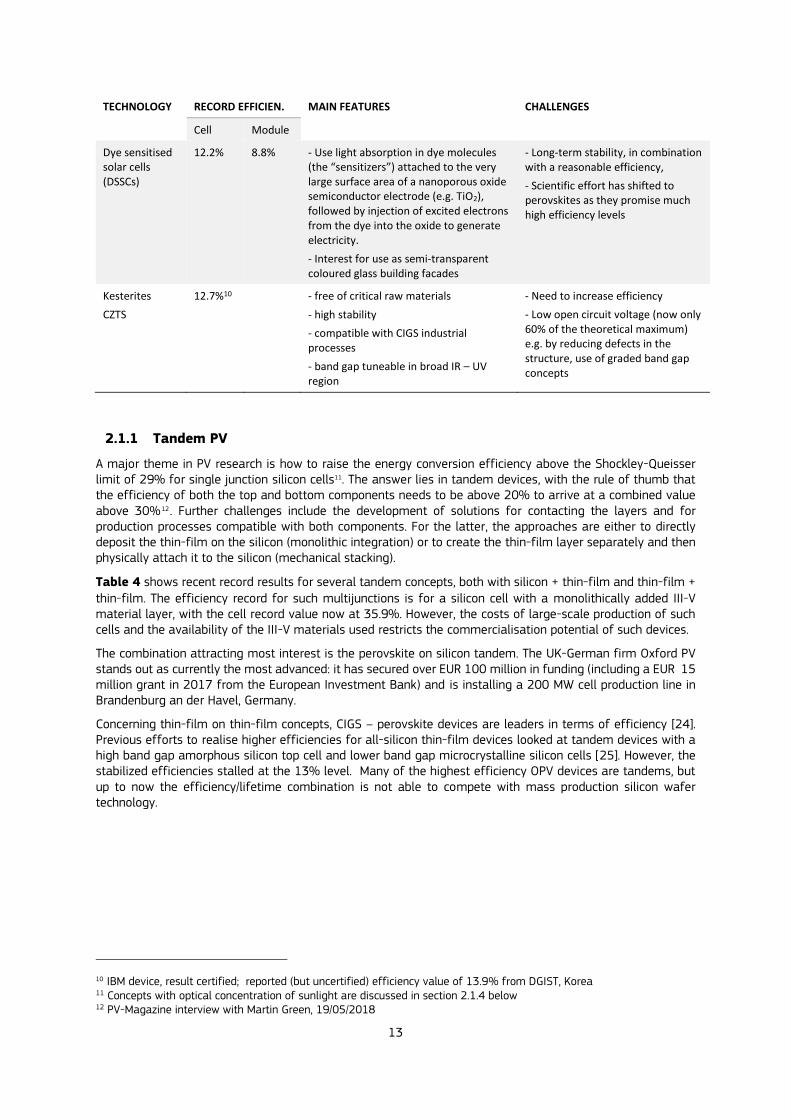
TECHNOLOGY RECORD EFFICIEN. MAIN FEATURES CHALLENGES
Cell Module
Dye sensitised solar cells (DSSCs)
12.2% 8.8% - Use light absorption in dye molecules (the “sensitizers”) attached to the very large surface area of a nanoporous oxide semiconductor electrode (e.g. TiO2), followed by injection of excited electrons from the dye into the oxide to generate electricity.
- Interest for use as semi-transparent coloured glass building facades
- Long-term stability, in combination with a reasonable efficiency,
- Scientific effort has shifted to perovskites as they promise much high efficiency levels
Kesterites
CZTS
12.7%10 - free of critical raw materials
- high stability
- compatible with CIGS industrial processes
- band gap tuneable in broad IR – UV region
- Need to increase efficiency
- Low open circuit voltage (now only 60% of the theoretical maximum) e.g. by reducing defects in the structure, use of graded band gap concepts
2.1.1 Tandem PV
A major theme in PV research is how to raise the energy conversion efficiency above the Shockley-Queisser limit of 29% for single junction silicon cells11. The answer lies in tandem devices, with the rule of thumb that the efficiency of both the top and bottom components needs to be above 20% to arrive at a combined value above 30%12 . Further challenges include the development of solutions for contacting the layers and for production processes compatible with both components. For the latter, the approaches are either to directly deposit the thin-film on the silicon (monolithic integration) or to create the thin-film layer separately and then physically attach it to the silicon (mechanical stacking).
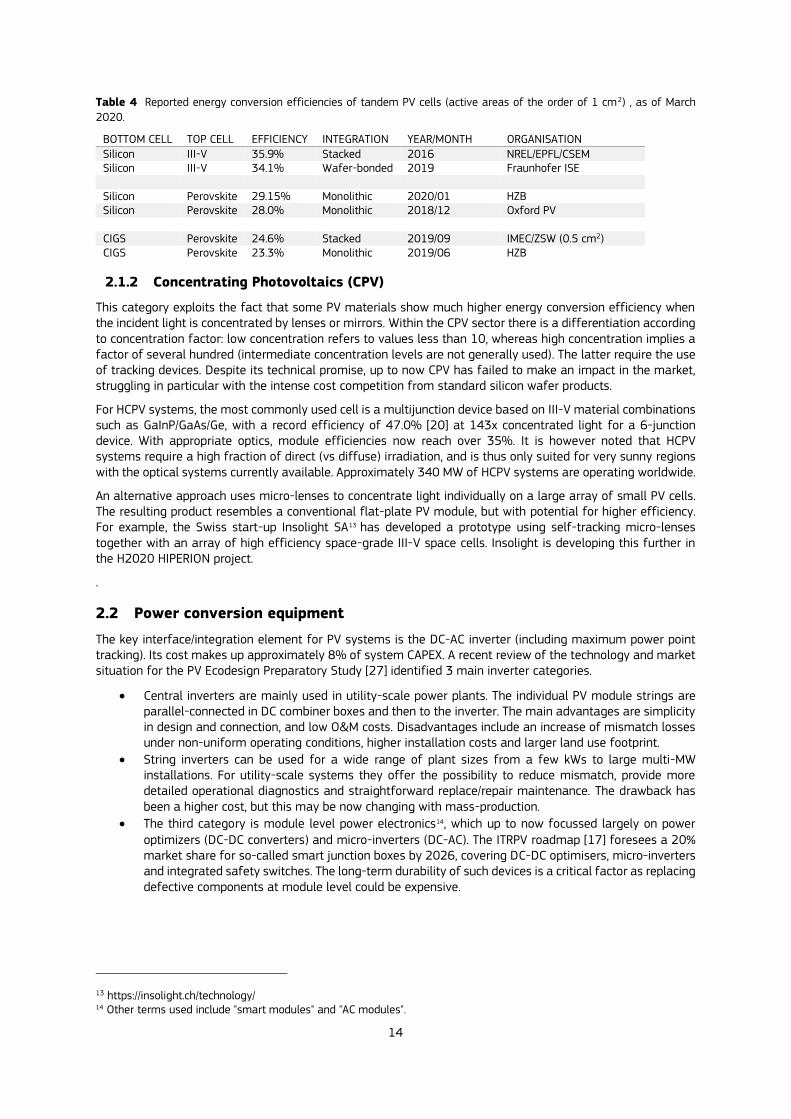
Table 4 shows recent record results for several tandem concepts, both with silicon + thin-film and thin-film + thin-film. The efficiency record for such multijunctions is for a silicon cell with a monolithically added III-V material layer, with the cell record value now at 35.9%. However, the costs of large-scale production of such cells and the availability of the III-V materials used restricts the commercialisation potential of such devices.
The combination attracting most interest is the perovskite on silicon tandem. The UK-German firm Oxford PV stands out as currently the most advanced: it has secured over EUR 100 million in funding (including a EUR 15 million grant in 2017 from the European Investment Bank) and is installing a 200 MW cell production line in Brandenburg an der Havel, Germany.
Concerning thin-film on thin-film concepts, CIGS – perovskite devices are leaders in terms of efficiency [24]. Previous efforts to realise higher efficiencies for all-silicon thin-film devices looked at tandem devices with a high band gap amorphous silicon top cell and lower band gap microcrystalline silicon cells [25]. However, the stabilized efficiencies stalled at the 13% level. Many of the highest efficiency OPV devices are tandems, but up to now the efficiency/lifetime combination is not able to compete with mass production silicon wafer technology.
10 IBM device, result certified; reported (but uncertified) efficiency value of 13.9% from DGIST, Korea 11 Concepts with optical concentration of sunlight are discussed in section 2.1.4 below 12 PV-Magazine interview with Martin Green, 19/05/2018
14
Table 4 Reported energy conversion efficiencies of tandem PV cells (active areas of the order of 1 cm2) , as of March
2020.
BOTTOM CELL TOP CELL EFFICIENCY INTEGRATION YEAR/MONTH ORGANISATION Silicon III-V 35.9% Stacked 2016 NREL/EPFL/CSEM Silicon III-V 34.1% Wafer-bonded 2019 Fraunhofer ISE Silicon Perovskite 29.15% Monolithic 2020/01 HZB Silicon Perovskite 28.0% Monolithic 2018/12 Oxford PV CIGS Perovskite 24.6% Stacked 2019/09 IMEC/ZSW (0.5 cm2) CIGS Perovskite 23.3% Monolithic 2019/06 HZB
2.1.2 Concentrating Photovoltaics (CPV)
This category exploits the fact that some PV materials show much higher energy conversion efficiency when the incident light is concentrated by lenses or mirrors. Within the CPV sector there is a differentiation according to concentration factor: low concentration refers to values less than 10, whereas high concentration implies a factor of several hundred (intermediate concentration levels are not generally used). The latter require the use of tracking devices. Despite its technical promise, up to now CPV has failed to make an impact in the market, struggling in particular with the intense cost competition from standard silicon wafer products.
For HCPV systems, the most commonly used cell is a multijunction device based on III-V material combinations such as GaInP/GaAs/Ge, with a record efficiency of 47.0% [20] at 143x concentrated light for a 6-junction device. With appropriate optics, module efficiencies now reach over 35%. It is however noted that HCPV systems require a high fraction of direct (vs diffuse) irradiation, and is thus only suited for very sunny regions with the optical systems currently available. Approximately 340 MW of HCPV systems are operating worldwide.
An alternative approach uses micro-lenses to concentrate light individually on a large array of small PV cells. The resulting product resembles a conventional flat-plate PV module, but with potential for higher efficiency. For example, the Swiss start-up Insolight SA13 has developed a prototype using self-tracking micro-lenses together with an array of high efficiency space-grade III-V space cells. Insolight is developing this further in the H2020 HIPERION project.
.
2.2 Power conversion equipment
The key interface/integration element for PV systems is the DC-AC inverter (including maximum power point tracking). Its cost makes up approximately 8% of system CAPEX. A recent review of the technology and market situation for the PV Ecodesign Preparatory Study [27] identified 3 main inverter categories.
Central inverters are mainly used in utility-scale power plants. The individual PV module strings are parallel-connected in DC combiner boxes and then to the inverter. The main advantages are simplicity in design and connection, and low O&M costs. Disadvantages include an increase of mismatch losses under non-uniform operating conditions, higher installation costs and larger land use footprint.
String inverters can be used for a wide range of plant sizes from a few kWs to large multi-MW installations. For utility-scale systems they offer the possibility to reduce mismatch, provide more detailed operational diagnostics and straightforward replace/repair maintenance. The drawback has been a higher cost, but this may be now changing with mass-production.
The third category is module level power electronics14, which up to now focussed largely on power optimizers (DC-DC converters) and micro-inverters (DC-AC). The ITRPV roadmap [17] foresees a 20% market share for so-called smart junction boxes by 2026, covering DC-DC optimisers, micro-inverters and integrated safety switches. The long-term durability of such devices is a critical factor as replacing defective components at module level could be expensive.
13 https://insolight.ch/technology/ 14 Other terms used include "smart modules" and "AC modules".

15
In terms of power conversion efficiency, central and string inverter products from leading manufacturers typically have a “Euro-efficiency”15 value of 98% and above [7], with module level devices somewhat lower (95%). Inverter development trends [27] include digitalisation, repowering, new features for grid stabilization and optimization of self-consumption; storage, as well as use of innovative semiconductors. In particular, the introduction of new wide bandgap semiconductors, such as silicon carbide and gallium nitride used in MOSFETs can bring improvements to efficiency, higher voltages, better reliability and designs that are more compact. Lifetime is a critical parameter. A 10–year design warranty is common, but inverters can be sensitive to thermal loads on the main electronic components under location-specific mounting and operational conditions. Lastly, the sizing of inverters maximum power to the PV field nominal DC power is changing. The average DC to AC ratio for large plants in Europe is 1.22 according to the WikiSolar database. However, there is a trend to higher ratios for utility-scale projects in order to maximise the period systems operate at their rated AC power even if more modules are installed. Factors between 1.3 and 1.5 may become common in the future [28].
2.3 Cross-Cutting Aspects
2.3.1 Standards
The International Electrotechnical Commission (IEC) Technical Committee 82 deals with solar photovoltaic energy systems and was established 1981. It has published more than 130 documents, which have laid the foundations for today’s global trade in PV products. In the EU, CENELEC has a mandate for standardization in the field of solar photovoltaic energy systems and components (M/089 EN). This is implemented by its Technical Committee 82: Solar Photovoltaic Systems. Under the terms of the Frankfurt Agreement with IEC, CENELEC transforms IEC standards into European standards, usually in a "fast track" procedure. The JRC annual PV standards report summarises the status of IEC and CENELEC activities [29] with regard to PV. A comprehensive review of standards for PV devices and systems was also prepared for the Ecodesign preparatory study [30].
PV modules on the EU market must comply with the requirements of the Low Voltage Directive and specifically the PV module safety standard series EN IEC 61730. Although not legally required, all module designs are subject to certification (type approval) under the IEC 61215 series, with specific requirements for each of the main technology groups (crystalline silicon, cadmium telluride, amorphous silicon and microcrystalline silicon, copper indium gallium selenide and copper indium selenide). Work is also in progress on a revision to include flexible (non-glass superstrate) products and bifacial designs. Compliance with IEC 61215 aims to ensure low initial failure rates in the PV products entering service. Extended testing protocols are being developed to give increased confidence for operational reliability and include:
Extreme environments (high temperature applications): IEC TS 63216
Testing of polymeric components: IEC 62788 series
Extended stress testing IEC TS 63209 (draft)
Sequential testing is necessary for some failure modes: IEC TR 63279 (draft)
The International Photovoltaic Quality Assurance Task Force (PVQAT) has been successful in coordinating pre-normative research and promoting new technical standards for verifying PV component and system quality and bankability. PVQAT has a three-pronged approach that seeks to establish:
• a rating system to ensure durable design of PV modules for the climate and application of interest;
• a guideline for factory inspections and quality assurance (QA) during manufacturing;
• a comprehensive system for certification of PV systems, verifying appropriate design, installation, and operation.
The IEC System for Certification to Standards Relating to Equipment for Use in Renewable Energy Applications (IECRE System) was formed in 2014 to define how certificates can be issued at system level for three energy sectors: wind, solar and marine energy. Under the scheme conformity assessment certificates can be issued
15 an averaged operating efficiency over a yearly power distribution corresponding to middle-Europe climate.

16
for individual PV power plants at various stages of design and implementation. It aims to give confidence that the plant will perform to specifications and reduce costs with a standard methodology. The certificate categories include:
PV Site Qualification certificate;
PV Power Block design qualification certificate;
PV Plant Design qualification certificate;
Conditional PV Project certificate (construction complete / commissioning);
Annual PV Plant Performance certificate;
PV Asset Transfer certificate;
PV Decommissioning certificate.
Finally, in the context of the EU's circular economy policy, CEN-CLC Joint Technical Committee 10 on Energy-related products - Material Efficiency Aspects for Ecodesign has published the following eight standards over the course of 2019 and 2020:
EN 45552:2020 ‘General method for the assessment of the durability of energy-related products’;
EN 45553:2020 ‘General method for the assessment of the ability to remanufacture energy-related products’;
EN 45554:2020 ‘General methods for the assessment of the ability to repair, reuse and upgrade energy-related products’;
EN 45555:2019 ‘General methods for assessing the recyclability and recoverability of energy-related products’;
EN 45556:2019 ‘General method for assessing the proportion of reused components in energy-related products’;
EN 45557:2020 ‘General method for assessing the proportion of recycled material content in energy-related products’;
EN 45558:2019 ‘General method to declare the use of critical raw materials in energy-related products’;
EN 45559:2019 ‘Methods for providing information relating to material efficiency aspects of energy-related products’.
Product-specific standards for PV modules and inverters can now be developed in this framework.
2.3.2 Building and Other Integrated Applications
A unique feature of photovoltaic technology is its potential for integration. Examples include:
Use of PV in buildings is a well-established concept and BIPV technologies have achieved impressive cost reductions and a high level of technical maturity. Nonetheless the market for multifunctional building-integrated products has taken longer to develop than many had predicted. With the right support in place and especially in the context industrial deployment and innovative manufacturing processes, BIPV could become a mainstream construction material in Europe [31]. Renewed efforts to decarbonise the building sector as part of the European Green Deal can boost the sector.
Floating PV is already well developed, with several GW installed worldwide and a pipeline of new projects. These are generally on inland water bodies or sheltered coastal sites, but researchers are also looking at open sea units.
Agri-PV allows dual use of productive land or of greenhouse structures [32]. The sector is receiving increasing attention, with total installations at already at the GW level.
Vehicle-integrated PV has potential to contribute to decarbonising transport and become a standard part of electric cars. A dedicated IEA PVPS task group has been set up to exchange research results internationally
Infrastructure integrated PV covers a range of applications, from lighting of urban areas to roadside structures.
17
All integrated applications present a research and engineering challenge to achieve a functional product at reasonable cost. In addition, dedicated standards may be needed to meet performance, environmental and safety requirements.
2.3.3 Sustainability and the Circular Economy
Photovoltaic modules have an environmental impact. Areas of potential concern include:
energy used over the entire life cycle of PV cells and modules, typically expressed as an energy payback time or energy footprint; these values are strongly influenced by the power source mix used during production of main materials, in particular the smelting of polysilicon for silicon wafer PV devices;
water required during production and operation i.e. for cleaning;
toxic and other potentially harmful materials used or created during manufacturing;
potential release of toxic and other potentially harmful materials during operation i.e. leeching, fires etc.;
reduction of use of materials whose availability is or may become critical: silver for crystalline silicon devices; tellurium, indium, gallium for thin-film devices;
limitation of land use i.e. possible displacement of agricultural activities, visual impact;
end-of-life management and recycling (PV modules are in the scope of the WEEE Directive since 2012, and a pan-European producer scheme called PV CYCLE offers WEEE compliance and waste management services for solar energy system products).
Carbon footprint and energy payback time (EPBT) have received particular attention. The world average carbon footprint of PV electricity generation is estimated at 55 g CO2-eq/kWh – for Europe values range from 38 g CO2-eq/kWh for Cyprus, which has a high irradiation to 89 gCO2-eq/kWh for Iceland, which has a low irradiation16 [33]. Regarding technologies, thin-film modules have the lowest emissions, followed by poly-crystalline silicon and then mono-crystalline silicon. There is considerable scope to reduce these values, and projections for 2050 indicate that life cycle emissions for PV can drop to 10 gCO2-eq/kWh and below [34].
At international level the IEA PVPS Task 12 group issued methodology guidelines on PV-specific parameters used as inputs in LCA [35].
EU Raw Materials Initiative aims to help ensure their secure, sustainable and affordable supply. Of relevance to PV, the 2020 critical materials list [36] includes gallium, indium and silicon metal. However, indium and gallium are only used in CIGS, and therefore not in the 95% of the PV produced today). Silicon metal is included due to the current import dependence on Chinese PV products; however silicon oxide feedstock is abundant. Usage of silver for connections is sometimes cited as a cause for concern, but the industry is working to decrease its use for cost reasons alone. R&D efforts concentrate on minimising silver use or on substitute materials like copper. Assessing future issues associated with large scale PV deployment is complicated by the associated assumptions of technology paths [38]. However the fact that PV offers a very broad range of options for materials and their sources can mitigate concerns that may arise from projections based on current device technologies.
The EU initiative on the Single Market for Green Products includes two methods to measure environmental performance throughout the lifecycle: the Product Environmental Footprint (PEF) and the Organisation Environmental Footprint (OEF) [39]. Photovoltaic electricity generation was assessed as a pilot product, and the resulting Product Environmental Footprint Category Rules 17 provide a methodology for assessing the environmental impacts of PV technologies based on life cycle assessment.
16 Calculated using an average "world" carbon footprint of 1798 kgCO2-eq/kWp for PV system manufacturing in 2011, based on market shares of 88% for c-Si and 12% for TF and other technologies. End-of-life processing is not included. 17 Available online at https://ec.europa.eu/environment/eussd/smgp/PEFCR_OEFSR_en.htm

18
In regard to Ecodesign, the Commission recently performed a preparatory study on solar panels, inverters and systems. It considered the mandatory Ecodesign and Energy Labelling tools as well as the voluntary Ecolabel and Green Public Procurement tools. The resulting policy recommendations were published in December 201918.
2.3.4 Performance, operation, reliability and lifetime
a) PV performance measures for trade, system design and planning
The rated peak power value at standard test conditions (1000 W/m2, 25 oC module temperature, AM1.5 solar spectrum) remains the key parameter for commerce in photovoltaic products, as well as for regulatory purposes (e.g. in trade cases) and for determining energy conversion efficiency.
However, to provide a measure of likely energy produced in operation conditions, an energy yield rating for PV modules is now available under the IEC 61853 series. This allows calculation of annual energy produced under 6 reference climates (i.e. an annual data set with hourly values of irradiation, spectral content, ambient temperature and wind speed). The approach offers investors and prosumers better information on expected operational performance, and can support product performance differentiation. The PV-ENERATE project19 supported under the EU EURAMET programme is looking at further development of the energy rating approach, both in terms of methodology and in technical scope, for instance to cover also bifacial PV modules.
b) Reliability and Operational Lifetime
Today’s market requires performance warranties20 that are decades long. Producers typically guarantee that modules will retain at last 80% of the label (initial) peak power after 25 years, and increasingly 30 years. The ITRPV report [17] notes a trend to stipulate an initial power loss in the first year of operation e.g. 2% and thereafter an average annual degradation rate e.g. 0.5%.
However, the subject of degradation of PV modules is still under debate within the PV community. The lack of extended standardisation work on this topic is due mainly to the fact that new and different failure modes of PV modules appear in the field as time passes and as new technologies and packaging are explored. The IEC 61215 series standard for design certification is valuable for rapidly revealing well-known failure mechanisms; however, it is insufficient for assessing long-term risk, for evaluating newer or less common materials and designs or establishing field performance degradation.
Field data can be used to give estimates for degradation rates. A comprehensive 2016 review [40] found a median degradation rate21 for c-Si technologies of (0.5-0.6)%/year and a mean of (0.8–0.9)%/year. The data for thin film technologies indicate a slightly higher rate of around 1%/year.
c) Operation performance analysis and monitoring
A range of tools is now available for situations that can range from utility-scale plants of 10 MW with 30 000 modules down to small roof systems of a few kW. Issues include:
- early detection of performance anomalies;
- optimisation operation and f maintenance;
- detecting faulty modules.
d) Forecasting/resource measurement methodologies
Solar irradiance measurements provide essential information at all stages of the PV system life cycle (site selection, system design, certification, operation, maintenance, trouble-shooting, upgrading, expansion) and business decisions rely on accurate solar irradiance data. Most modern sensors used to measure global (or hemispherical) solar irradiance fall into the following categories: thermopiles pyranometers, photodiodes and photovoltaic reference cells. Spectroradiometers are used for measuring spectral content. Within these categories are instruments in various price and performance classes.
18 Available online at https://susproc.jrc.ec.europa.eu/solar_photovoltaics/documents.html 19 a EURAMET project under the European Metrology Programme for Innovation and Research (EMPIR) programme, co-financed by the Participating States and by H2020 20 Modules also typically have a product warranty of 10 to 12 years 21 This degradation rate is relative to the initial nominal power (Wp); the decrease is therefore implicitly linear in time.
19
Data from geostationary satellites is also used to estimate the solar resource. The advantage of this approach is that the data are available uniformly over large geographical areas via online tools. The JRC’s PVGIS22 provides free and open access to PV potential for different technologies and configurations of grid connected and standalone systems and full time series of hourly values of both solar radiation and PV performance at any geographical location.
Using different satellites, the solar resource can be estimated for the entire world, except for the polar areas. In recent years, several data sets have achieved accuracy in the estimate of global horizontal irradiation of close to 5% (95% confidence interval for the annual average solar irradiation). The estimate of direct normal irradiance, important for concentrating PV plants, is less precise, with recent studies giving an uncertainty of about 10% (95% confidence interval). The availability of the solar resource data varies. For many areas long-term time series of data are available, e.g. for Europe, North America, Africa and most of Asia.
For planning of utility scale projects, developers favour so-called site-adaptation techniques [41]. Initially satellite-based data are used to select a promising location and then a pyranometer is installed to record ground data. This data (typically one year) is then used to correct the bias of the satellite-based estimations in order to reduce the uncertainty of the long-term PV yield estimations, and thus, reduce the financial risk of the project.
Power forecasting is necessary for efficient grid integration of fluctuating PV power. The IEA-PVPS Task 14 produced a state of the art report on forecasting in 2013 [42] and since 2016 the dedicated Task 16 is working to “lower barriers and costs of grid integration of PV and lowering planning and investment costs for PV by enhancing the quality of the forecasts and the resources assessments”.
For solar/power forecasting, recent reviews [43, 44] classify models in terms of:
(i) Output: electric power or solar irradiance? If solar irradiance is forecast, which is the usual case, a model of the actual plant is needed to calculate the power output.
(ii) Forecast horizon: intra-hour, intra-day, and day-ahead forecasts. (iii) Modelling approach: data-driven models (statistical models, machine-learning), physics-based
models (NWP, remote sensing, shadow imagery) and hybrid models.
The uncertainty of the estimations (RMSE) changes with the (i) forecast horizon, (ii) temporal resolution of the data, and (iii) climatic zone. The 2014 SET plan Integrated Roadmap originally specified an RMSE of <8% of installed power by 2020 for an intra-day single-site power forecast in NW-Europe. Recent work [45] recommends use of an RMSE skill score based on combination of climatology and persistence methods to allow reliable comparison of forecasts.
22 https://ec.europa.eu/jrc/en/pvgis

20
3 R&D Overview
3.1 Global and European Research and Innovation Landscape
3.1.1 Scientific Publications
In 2019 the scientific output on photovoltaics continued its steady growth, reaching just over 14,000 peer-reviewed articles according to data from Clarivate Analytics. Figure 6 shows countries with the highest share number of author affiliations23. China is clear leader, followed by the USA and then England. Europe is well represented in the top-20 by Germany, UK, France, Italy and Switzerland. The EU as whole is second only to China, underlining the high-level scientific excellence in photovoltaics in Europe. Compared to a decade ago, Asian countries account for a very significant fraction of scientific output. Clarivate Analytics also provides the category of highly cited articles24 that can be used a measure of quality. Figure 6 includes data on each countries’ share of such articles for the period 2015-2019. The overall ranking is relatively unchanged, although the leading countries or regions tend to have a larger share of the highly cited articles than of the total output. A number of countries, in particular USA, UK and Switzerland, appear to influence research much more than the simple volume of articles would suggest, whereas India had considerable output but with proportionally less impact up to now.
Figure 6 Top countries/regions for author affiliations in journal articles
(source: JRC analysis, Clarivate data)
23 Search string used: TI=(photovoltaic* OR "solar cell*") OR AK= (photovoltaic* OR "solar cell*") OR KP= (photovoltaic* OR "solar cell*") AND PY=2019; Refined by: DOCUMENT TYPES: ( ARTICLE );
24 a “highly cited paper” receives enough citations to place it in the top 1% of its academic field of based on a threshold for the field and publication year.
21
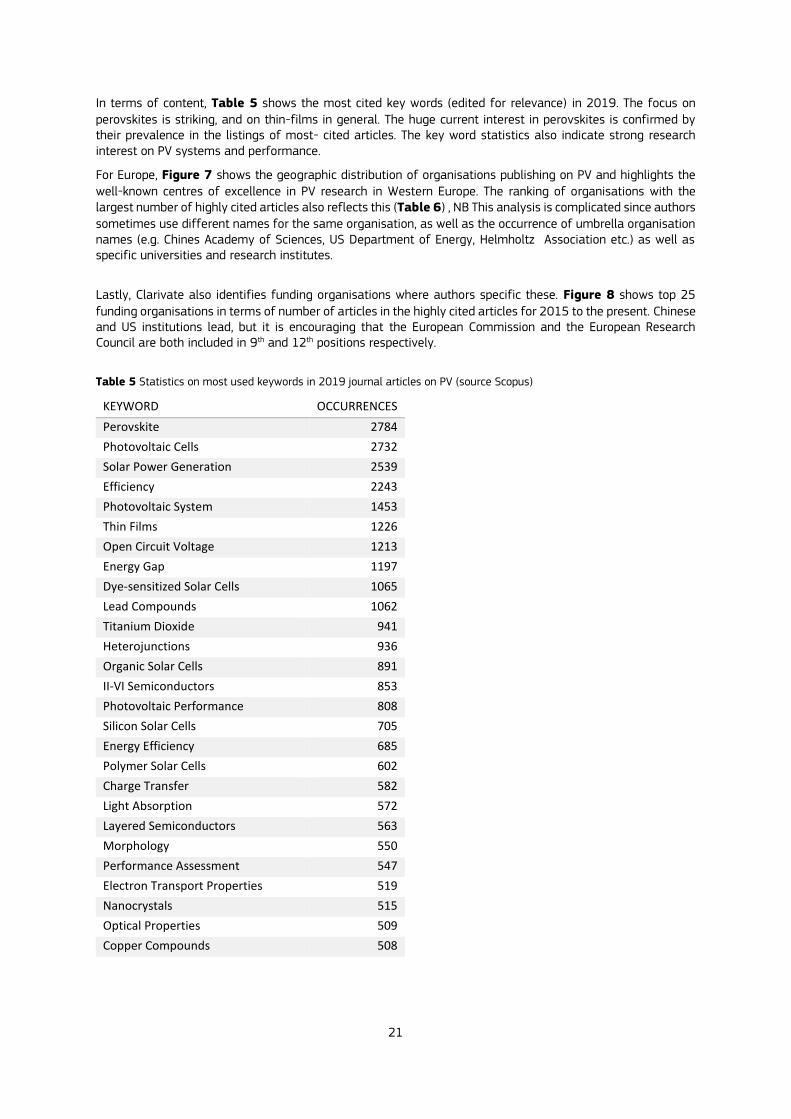
In terms of content, Table 5 shows the most cited key words (edited for relevance) in 2019. The focus on perovskites is striking, and on thin-films in general. The huge current interest in perovskites is confirmed by their prevalence in the listings of most- cited articles. The key word statistics also indicate strong research interest on PV systems and performance.
For Europe, Figure 7 shows the geographic distribution of organisations publishing on PV and highlights the well-known centres of excellence in PV research in Western Europe. The ranking of organisations with the largest number of highly cited articles also reflects this (Table 6) , NB This analysis is complicated since authors sometimes use different names for the same organisation, as well as the occurrence of umbrella organisation names (e.g. Chines Academy of Sciences, US Department of Energy, Helmholtz Association etc.) as well as specific universities and research institutes.
Lastly, Clarivate also identifies funding organisations where authors specific these. Figure 8 shows top 25
funding organisations in terms of number of articles in the highly cited articles for 2015 to the present. Chinese and US institutions lead, but it is encouraging that the European Commission and the European Research Council are both included in 9th and 12th positions respectively.
Table 5 Statistics on most used keywords in 2019 journal articles on PV (source Scopus)
KEYWORD OCCURRENCES
Perovskite 2784
Photovoltaic Cells 2732
Solar Power Generation 2539
Efficiency 2243
Photovoltaic System 1453
Thin Films 1226
Open Circuit Voltage 1213
Energy Gap 1197
Dye-sensitized Solar Cells 1065
Lead Compounds 1062
Titanium Dioxide 941
Heterojunctions 936
Organic Solar Cells 891
II-VI Semiconductors 853
Photovoltaic Performance 808
Silicon Solar Cells 705
Energy Efficiency 685
Polymer Solar Cells 602
Charge Transfer 582
Light Absorption 572
Layered Semiconductors 563
Morphology 550
Performance Assessment 547
Electron Transport Properties 519
Nanocrystals 515
Optical Properties 509
Copper Compounds 508

22
Figure 7 Geographical distribution of European organisations involved in articles on PV
(source JRC TIM technology)
Table 6 Top 20 European organisations for highly cited scientific articles on PV in 2019-2020
ORGANISATION HIGHLY CITED ARTICLES
ECOLE POLYTECHNIQUE FEDERALE DE LAUSANNE 96
UNIVERSITY OF OXFORD 62
UNIVERSITY OF CAMBRIDGE 42
IMPERIAL COLLEGE LONDON 29
LINKOPING UNIVERSITY 29
CENTRE NATIONAL DE LA RECHERCHE SCIENTIFIQUE CNRS 26
ISTITUTO ITALIANO DI TECNOLOGIA IIT 26
HELMHOLTZ ASSOCIATION 25
CONSIGLIO NAZIONALE DELLE RICERCHE CNR 23
UNIVERSITY OF ERLANGEN NUREMBERG 22
UNIVERSITY OF BATH 18
FRAUNHOFER GESELLSCHAFT 17
HELMHOLTZ ZENTRUM FUER MATERIALIEN UND ENERGIE GMBH HZB 15
ISTITUTO DI SCIENZE E TECNOLOGIE MOLECOLARI ISTM CNR 15
UNIVERSITAT JAUME I 14
SWISS FEDERAL LABORATORIES FOR MATERIALS SCIENCE TECHNOLOGY EMPA 13
EUROPEAN COMMISSION JOINT RESEARCH CENTRE 11
POLYTECHNIC UNIVERSITY OF MILAN 11
RESEARCH CENTER JULICH 9
ROYAL INSTITUTE OF TECHNOLOGY 9
(source: extraction from Clarivate data)
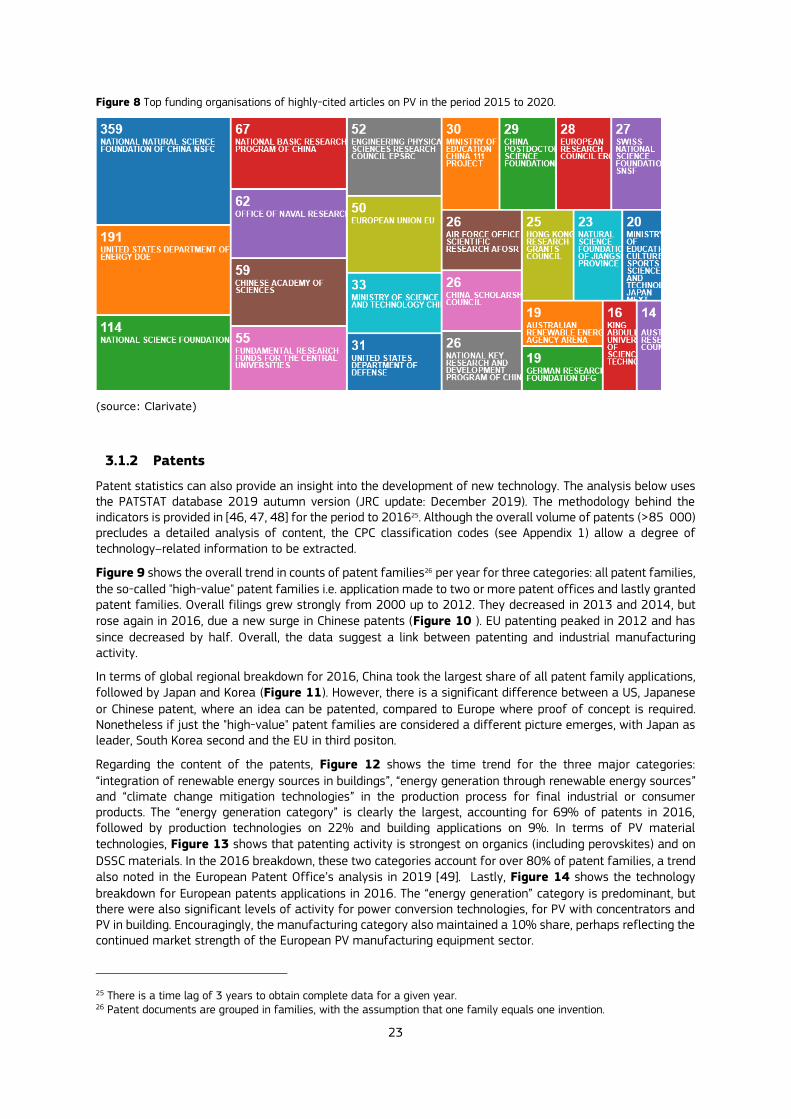
23
Figure 8 Top funding organisations of highly-cited articles on PV in the period 2015 to 2020.
(source: Clarivate)
3.1.2 Patents
Patent statistics can also provide an insight into the development of new technology. The analysis below uses the PATSTAT database 2019 autumn version (JRC update: December 2019). The methodology behind the indicators is provided in [46, 47, 48] for the period to 201625. Although the overall volume of patents (>85 000) precludes a detailed analysis of content, the CPC classification codes (see Appendix 1) allow a degree of technology–related information to be extracted.
Figure 9 shows the overall trend in counts of patent families26 per year for three categories: all patent families, the so-called "high-value" patent families i.e. application made to two or more patent offices and lastly granted patent families. Overall filings grew strongly from 2000 up to 2012. They decreased in 2013 and 2014, but rose again in 2016, due a new surge in Chinese patents (Figure 10 ). EU patenting peaked in 2012 and has since decreased by half. Overall, the data suggest a link between patenting and industrial manufacturing activity.
In terms of global regional breakdown for 2016, China took the largest share of all patent family applications, followed by Japan and Korea (Figure 11). However, there is a significant difference between a US, Japanese
or Chinese patent, where an idea can be patented, compared to Europe where proof of concept is required. Nonetheless if just the "high-value" patent families are considered a different picture emerges, with Japan as leader, South Korea second and the EU in third positon.
Regarding the content of the patents, Figure 12 shows the time trend for the three major categories:
“integration of renewable energy sources in buildings”, “energy generation through renewable energy sources” and “climate change mitigation technologies” in the production process for final industrial or consumer products. The “energy generation category” is clearly the largest, accounting for 69% of patents in 2016, followed by production technologies on 22% and building applications on 9%. In terms of PV material technologies, Figure 13 shows that patenting activity is strongest on organics (including perovskites) and on
DSSC materials. In the 2016 breakdown, these two categories account for over 80% of patent families, a trend also noted in the European Patent Office’s analysis in 2019 [49]. Lastly, Figure 14 shows the technology
breakdown for European patents applications in 2016. The “energy generation” category is predominant, but there were also significant levels of activity for power conversion technologies, for PV with concentrators and PV in building. Encouragingly, the manufacturing category also maintained a 10% share, perhaps reflecting the continued market strength of the European PV manufacturing equipment sector.
25 There is a time lag of 3 years to obtain complete data for a given year. 26 Patent documents are grouped in families, with the assumption that one family equals one invention.

24
Figure 9 Global trend in patent filings under PV related families per year.
Figure 10 Trend in patent filings by major global players for 2000-2016.
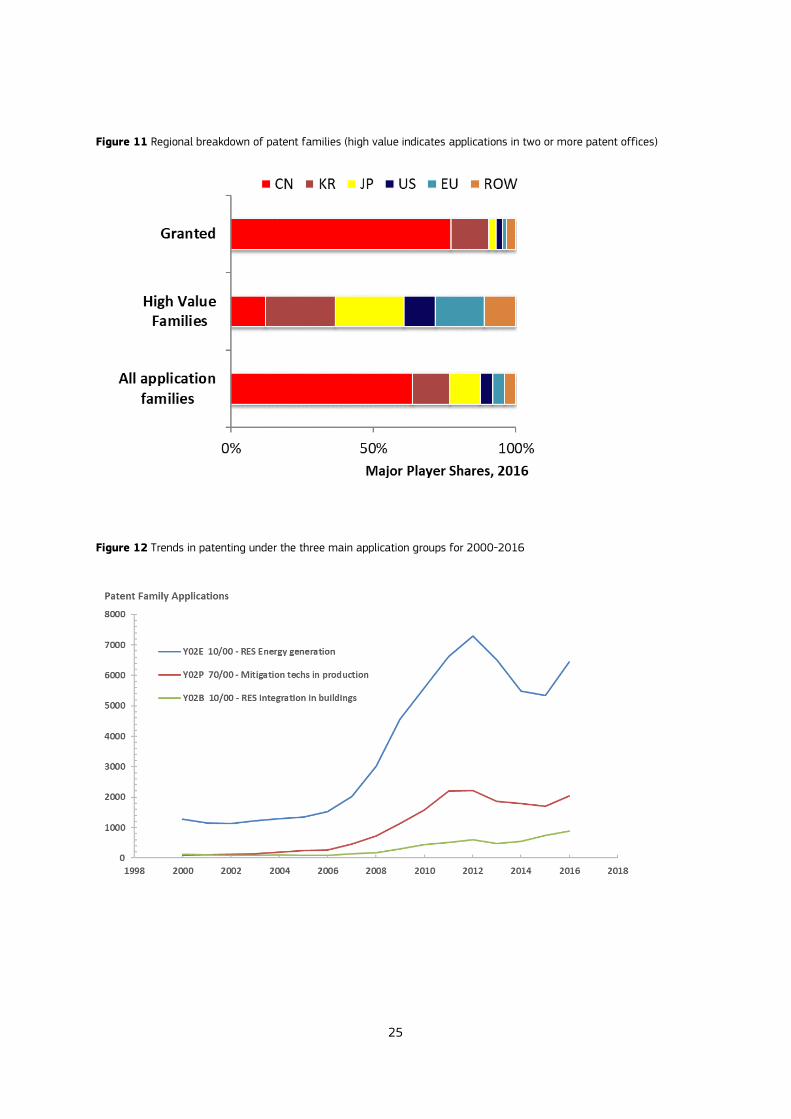
25
Figure 11 Regional breakdown of patent families (high value indicates applications in two or more patent offices)
Figure 12 Trends in patenting under the three main application groups for 2000-2016

26
Figure 13 Trends in patenting for main PV technology groups. (NB y-axis with logarithmic scale).
Figure 14 Sectorial breakdown of EU+UK PV patent family applications in 2016

27
3.2 EU Programmes
3.2.1 Energy Union and the SET plan
The Energy Union sets out a strategic vision for the transition to a low-carbon, secure and competitive economy in the European Union. It consists of five dimensions: security of energy supply; internal energy markets; energy efficiency; decarbonisation of the energy mix; and research and innovation [50]. The Strategic Energy Technology Plan (SET plan) is an integral part of this framework and aims to accelerate the development and deployment of low-carbon technologies. The implementation working group (IWG) on photovoltaics involves representatives of Member States, other stakeholders and the European Commission. This group issued a detailed implementation plan [8] in 2017 and are now in the process of updating it for 2020. The plan identifies six main areas:
1. PV for BIPV and similar applications 2. Technologies for silicon solar cells and modules with higher quality 3. New Technologies & Materials 4. Operation and diagnosis of photovoltaic plants 5. Manufacturing technologies 6. Cross-sectoral research at lower TRL
In 2018 the IWG started an evaluation of R&D projects of participating countries and regions, considering budget and priorities in each national program. The results will published in 2020. From the preliminary information available, the most prioritized areas were 1 (BIPV and similar applications) and 3 (new technologies & materials). However, the highest funding went to areas 2 (silicon technologies) and 5 (manufacturing technologies).
The European Technology and Innovation Platforms (ETIPs) support the implementation of the SET plan by bringing together EU countries, industry, and researchers in key areas. The photovoltaics platform, ETIP-PV27, has the goal to help ensure that Europe maintains and improves its industrial position, in order to achieve a leadership position within the global PV market.
Also under the SET plan governance framework, the European Energy Research Alliance (EERA) aims to accelerate technology development by cooperation amongst non-profit research institutes and universities on pan-European programmes. The EERA PV joint programme28 focuses primarily on cost reduction of PV systems, through enhancement of performance, development of low-cost, high-throughput manufacturing processes, and improvement of lifetime and reliability of PV systems and components.
In preparation for the EU’s 2021-2027 Horizon Europe research and innovation framework programme, the the Clean Energy Transition Partnership partnership is being developed strategy as Co-Funded European Partnership, meaning with Member States and Associated Countries funding, topped with EC funding. The CETP is currently developing a strategic research and innovation agenda.
3.2.2 PV in Horizon 2020
Under Horizon 2020, the EU has co-funded over 120 PV-related projects in the period 2014-2019, for a total budget of almost EUR 260 million, as part of EUR 510 million for all solar technologies (see Table 7). This compares with approximately EUR 360 million for wind power [51] and EUR 596 million for bioenergy [52] in the same period. Table 8 shows the breakdown according to the various funding programmes. Table 9 gives the distribution to the six SET plan PV priorities. The area “new technologies and materials” has received the largest single share (39%), followed by manufacturing technologies (23%) and BIPV (19%). Figure 15a shows the breakdown in terms of applications, where the category "general” accounts for the bulk
of funding, followed by buildings. The EU has also made significant grants for recycling technology. Figure
15b looks at the breakdown for materials technologies (here tandem concepts counted as 50% for the top and 50% for the bottom cell material). The main change compared the analysis carried out in 2017 [6] is the emergence of perovskites as a major research sector.
27 http://www.etip-pv.eu/homepage.html 28 https://www.eera-set.eu/eera-joint-programmes-jps/photovoltaic-solar-energy/

28
Table 7 H2020 funding for solar projects 2014-2019
SOLAR TECHNOLOGY FINISHED PROJECTS RUNNING PROJECTS TOTAL
Photovoltaics 82,785,217 183,213,168 265,998,385
CSP 49,058,269 111,512,694 160,570,963
Solar Thermal (non-concentrating) 8,218,159 26,705,728 34,923,887
Photochemical 7,028,031 26,159,682 33,187,713
Coordination 2,980,095 14,953,181 17,933,276
Solar windows 1,264,438 995,935 2,260,372
Hybrid Technology 395,455 1,398,478 1,793,932
Total 150,718,866 360,042,340 510,761,206
(Source: JRC analysis of COMPASS data)
Table 8 Breakdown of funding for PV or PV-related projects by programme.
H2020 PROGRAMME TOTAL EC FUNDING SHARE
LCE 81,698,045 31%
LC 54,104,466 21%
ERC 20,918,767 8%
NMBP 17,203,756 7%
SME 15,264,559 6%
MSCA 14,597,783 6%
WASTE 7,844,565 3%
FITPILOT 7,633,278 3%
CIRC 7,014,893 3%
EU 6,333,425 2%
FoF 5,642,708 2%
NMP 5,516,910 2%
EEB 4,900,313 2%
COMPET 4,081,349 2%
FETOPEN 2,993,404 1%
EIC-FTI 2,419,594 1%
EE 1,355,106 1%

29
Table 9 Breakdown of H2020 funding to 2019 for the SET plan PV priority activities
SET PLAN ACTIVITY AREA EU CONTRIBUTION
EUR %
1 BIPV and similar applications 49,353,345 19%
2 Silicon cell and module tech. 8,900,195 3%
3 New technologies & materials 101,321,541 39%
4 Plant operation and diagnosis 31,313,868 12%
5 Manufacturing technologies 58,964,605 23%
6 Cross-sectoral R&D at lower TRL 9,669,365 4%
Total Committed to end 2019 259,522,918
(source: JRC analysis of COMPASS data)
Figure 15 Technology and application breakdown by EC funding for PV-related projects, H2020, 2014-2017
a) Application areas b) PV materials breakdown
3.2.3 SOLAR- ERA.NET
SOLAR-ERA.NET is a network of more than 20 European R&D programmes in the field of solar electricity technologies (mostly PV but also CSP) and itself receives funding from the EU framework programmes for coordination [53]. It was launched in 2012 under FP7 and has continued under H2020 as SOLAR-ERA.NET Cofund projects 1 and 2. Up to now over it has contributed to 40 projects, with a total budget of EUR 100 m, of which well over half came from public funding. Compared to the directly-funded EU programmes, there is more emphasis on applied research and demonstration (up to TRL 7), and less basic research. SOLAR-ERA.NET has been successful in creating complementarity between national and EU funded programmes and has demonstrated flexibility and a bottom-up nature, with no “one size fits all” approach. Appendix 3 gives a listing of completed and running projects.
3.2.4 European Metrology Programme for Innovation and Research (EMPIR)
The European Association of National Metrology Institutes (EURAMET) supports relevant research via the European Metrology Research Programme (EMRP) and the European Metrology Programme for Innovation and Research (EMPIR). In the area of PV, it has funded the Photoclass project “Towards an energy-based parameter for photovoltaic classification” (2015-2017) and its successor PV-ENERATE “Advanced PV Energy Rating“ (2017-2020).
30
3.2.5 European Cooperation in Science and Technology (COST)
COST Actions are bottom-up science and technology networks with duration of four years. There is no funding for research itself. Current or recently complete projects that involve PV technology or are relevant to PV applications include:
TU1401 Renewable energy and landscape quality (RELY) 2014 - 2018
MP1402 Hooking together European research in atomic layer deposition (HERALD), 2014 - 2018
MP1307 Stable Next-Generation Photovoltaics: Unravelling degradation mechanisms of Organic and Perovskite Solar Cells by complementary characterization techniques (StableNextSol), 2014 to 2018
MP1406 Multiscale in modelling and validation for solar photovoltaics (MultiscaleSolar), 2015 -2019
CA16235 Performance and Reliability of Photovoltaic Systems: Evaluations of Large-Scale Monitoring Data (PEARLPV), 2017 - 2021
CA18222 Attosecond Chemistry, 2019 to 2023
3.2.6 EIT Innoenergy
InnoEnergy was established in 2010 and is supported by the European Institute of Innovation and Technology (EIT) as one of a series Knowledge and Innovation Communities (KICs). The InnoEnergy network includes 24 shareholders, as well as more than 360+ associate and project partners. It invests in businesses and helps develop innovative products, services, and solutions. According to the information on its web site, it has invested in at least 6 PV-related projects (see Appendix 1) up to 2016, but no new ones since then. The most recent investment was EUR 2 million in 2017 in Nexwafe (a Fraunhofer ISE spin-off), for its kerfless wafer technology.
3.2.7 EIB InnovFin
The European Investment Bank set up the InnovFin (EU Finance for innovators) financing tool to cover a wide range of loans, guarantees and equity-type funding. Investments in PV technology innovation include:
In 2016, EUR 20 million of quasi-equity under the InnovFin Mid Cap Growth Finance program to Heliatek (based in Germany) to help boost production capacity of its HeliaFilm product (an organic photovoltaic solar film for integration into building facades)
In 2017, EUR 15 million to Oxford PV Germany GmbH under the InnovFin Energy Demonstration Projects scheme to support the transfer of its disruptive perovskite on silicon tandem solar cell technology from lab scale to commercialisation.
3.2.8 NER-300
NER 300 is a demonstration programme for CCS and RES projects involving all Member States. The only PV project selected was the Santa Luzia Solar Farm, located near Lagos, Portugal for a 20 MW plant using concentrator photovoltaics (Magsun TRK-60 modules, 23% nominal efficiency at 800x concentration). However the project was withdrawn in July 2019. For the period 2021-2030 the Commission has launched a new programme called the ETS Innovation Fund.
3.3 Other R&D Programmes
3.3.1 IEA Photovoltaic Power Systems Programme
The IEA Photovoltaic Power Systems Programme (PVPS) involves Australia, Austria, Belgium, Canada, China, Denmark, European Union, Finland, France, Germany, International Copper Association, Israel, Italy, Japan, Korea, Malaysia, Mexico, Netherlands, Norway, Portugal, Spain, Sweden, Switzerland, Thailand, Turkey and the United States. Its mission is "To enhance the international collaborative efforts which facilitate the role of photovoltaic solar energy as a cornerstone in the transition to sustainable energy systems". The PVPS tasks do not involve research per se, but focus on bringing together and analysing information from the participants [54]. There are 8 ongoing tasks:
Task 1: Strategic PV Analysis & Outreach; Task 12: PV Sustainability; Task 13: Performance and Reliability of Photovoltaic Systems; Task 14: High Penetration of PV Systems in Electricity Grids; Task 15: Enabling Framework for the Development of BIPV; Task 16: Solar Resource;

31
Task 17: PV for Transport; Task 18: Off-Grid and Edge-of-Grid Photovoltaic Systems.
3.3.2 USA
Both the National Science Foundation and the US Department of Energy (through the Solar Energy Technology Office) fund a broad range of research activities on photovoltaics. A search of the NSF web page identified 2000 awards since 1990, amounting to USD 1.4 bn. However, after a peak in funding from 2008 to 2011, the annual total has dropped steadily (Figure 16).
The DOE’s program (previously known as the Sunshot initiative) has an overall goal of making solar energy (PV and concentrated solar thermal) affordable for all Americans. The 2030 cost targets are USD 0.03/kWh for utility scale PV, as well as USD 0.04/kWh and 0.05/kWh for commercial and residential systems respectively. These targets can be met with different mixes of technology, cost and performance. Table 10 shows a breakdown of funding for currently active projects and programs (it includes substantial support for DOE national labs such as NREL, Sandia and Brookhaven).
Figure 16 Sum of NSF awards per year for research on photovoltaics, 2000 to 2019.
(source: JRC elaboration of search results from NSF web site section “Research Spending & Results”)
Table 10 US DoE Solar Energy Technology Office, active projects as of August 2019
Sub-program Active Projects Gov. cost, $ Total cost, $
Systems Integration 73 171,939,833 250,377,333
Photovoltaics 103 185,757,310 206,562,787
CSP 68 125,880,840 155,003,535
Soft Costs 53 81,711,229 88,005,088
Technology to Market 28 33,927,940 50,737,601
CSP, Systems Integration 1 530,946 530,946
Grand Total 326 599,748,098 751,217,290
(Source JRC elaboration of Excel download from the SETO Solar Projects Map)
32
3.3.3 China
Several agencies and organisations are involved in funding R&D on photovoltaics, including:
Chinese Academy of Sciences
National Natural Science Foundation of China
National Basic Research Program of China (973 Program)
China Postdoctoral Science Foundation
Ministry of Science and Technology of the People's Republic of China
As mentioned above, China has become a leader in PV research in terms of science publications, and is also at the forefront of crystalline silicon and thin-film (in particular perovskite) cell development with several labs challenging for record efficiency records.
China has also been effective in promoting industrial innovation, in particular through the National Energy Administration’s (NEA) “Technology Top Runner Program” that was launched in 2015 to promote uptake of high-efficiency PV products and to accelerate PV industry transformation. Initially Top Runner projects were required to use mono-Si PV modules with efficiency higher than 17% or multi-Si modules with efficiency higher than 16.5%. The overall scale of support was for installations amounting to several GW annually. This scheme provide highly successful in achieving a major shift towards products such as PERC bifacial designs for mono-crystalline silicon.
3.3.4 Japan
R&D activities are divided between the New Energy and Industrial Technology Development Organization (NEDO), which promotes technology development towards commercialization, funded by METI, and the Japan Science and Technology Agency (JST), which promotes fundamental R&D, funded by the Ministry of Education, Culture, Sports, Science and Technology (MEXT).
NEDO has been promoting PV technology development consistently over the last 35 years. It manages a large portfolio of R&D projects. Its PV Development Strategy (NEDO PV Challenges) was announced in September 2014 with a headline cost target of JPY 7/kWh (approximately EUR 0.06/kWh). It identified measures to achieve target power generation costs as well as the development of recycling technologies. This cost target has now become part of the "Energy/Environment Innovation Strategy" launched by Japan's Cabinet Office in 2016.
The National Institute of Advanced Industrial Science and Technology (AIST), one of the largest public research organizations in Japan, includes substantial activities on photovoltaics:
AIST Renewable Energy Research Center (Fukushima)
Crystalline Si, energy rating;
Energy network.
AIST Research Center for Photovoltaics (Tsukuba and Koriyama (Fukujima Prefecture))
Improvement in device performance: CIGS, CZTS, thin-film Si, Organic TFs, DSSC, Perovskite, etc.
Innovative solar cells: multijunction, quantum-dot, plasmonics, etc.,
Module reliability and robust modules
Calibration, measurement, PV system safety, maintenance, and diagnosis
NEDO manages two demonstrative research projects and three technology development projects based on the NEDO PV Challenges, a guidance for technology development in which a target to realize the power generation cost of JPY 14/kWh by 2020 and JPY 7/kWh by 2030 is set. Three technology development projects are currently running:
Development of Solar Power Recycling Technology (FY 2014 to FY 2018)
Technological development for improvement of system performance and operation and maintenance (O&M) (FY 2014 to FY 2018) and
Development of high performance and reliable PV modules to reduce levelised cost of energy (FY 2015 to FY 2019). This budget line includes 19 projects under four main headings: 1) “Development of crystal silicon PV modules using advanced multiple technologies and high performance CIS modules”,

33
2) “Research and development of innovative new structure solar cells”, 3) “Development of common components for solar cells and modules” and 4) “Development of Common Fundamental Technologies”. Under the technology development, development of high efficiency solar cell technology and development of fundamental technologies for commercialization using pilot mass production line are carried out on various types of solar cells such as crystalline silicon solar cells, II-VI compound solar cells and organic solar cells.
In addition a “R&D project for international joint development of innovative technologies” is jointly conducted with G7 countries since 2015 and research themes on new structure solar cells were adopted in 2016.
R&D activities administered by MEXT by the Japan Science and Technology Agency (JST):
Photoenergy Conversion Systems and Materials for the Next Generation Solar Cells and
Creative Research for Clean Energy Generation using Solar Energy

34
4 Impact of R&D with EU Co-Funding
This section aims to assess the advances made by major29 recently completed or running projects, principally in terms of technology readiness level achieved. The 45 projects considered are clustered under the headings:
crystalline silicon devices
thin-film devices (including CIGS, PSC, OPV and others)
silicon wafer tandems
building related products
operation performance
market uptake
circular economy.
A series of tables (Table 11, Table 12, Table 14, Table 13, Table 15, Table 16 and Table 18) provide an overview of the main technology goals stated in the description of work and an estimate of the final or target TRL. The following sections provide an overall summary of the progress. NB In many cases the projects set highly ambitious targets, quite justifiably for research activities.
4.1 Wafer-based crystalline silicon
Table 11 shows the projects considered and the progress assessment. AMPERE (Automated photovoltaic cell and Module industrial Production to regain and secure European Renewable Energy market) is the stand out project. In November 2019 ENEL, the coordinator, inaugurated an industrial scale (200 MW) production line for high efficiency heterojunction modules, representing the culmination of over ten years of R&D by a cluster of European labs (CEA, Fraunhofer ISE, EPFL, IMEC and others). The FP6 HETSI and FP7 HERCULES projects also contributed substantially to this development process.
H2020 is also supporting further development of HJT technology. The NEXTBASE project (ended 2019) targeted a 26% efficiency level for cells and while the cells developed did not quite reach that level, the results may provide more clarity on the path to do. The HIGHLIGHT project launched in late 2019 also addresses HJT, targeting efficiency and material usage gains for applications in building and on electric vehicles.
The DISC project focussed on innovative carrier-selective contacts with scalable manufacturing processes..
4.2 Thin film devices
Table 12 shows the details of the main projects on thin-film devices (section 4.3 covers tandems with silicon wafers).
Pervoskite devices: although now the most active area of PV research worldwide, only really emerged in 2015. Since then the area has received significant funding under H2020, targeting four aspects: efficiency, long-term stability, scalable manufacturing and sustainability (in particular to minimise or replace the lead content). The one completed project is GOTSolar (2016 to 2018) produced good results, including a 144 cm2 module with an efficiency of 14.4% (two years on, the champion cell is 16.1% for 802 cm2). The ESPREesSo project ended in early 2020. APOLO runs from 2018 to 2022, targeting printable PSC devices with efficiencies over 20%. While there has been substantial progress on stability, efforts so far to substitute lead have not proved successful.
CIGS: In H2020 the EU continued its support for European R&D on CIGS with two large projects: Sharc25 and ARCIGS-M. SHARC25 ended in 2018 having achieved important scientific results although the ultimately the targeted record efficiency levels (25%) could not be delivered. ARCIGS-M focussed on further improving sustainability of CIGS manufacturing, exploring the use of ultra-thin layers and of innovative passivation and contacting steps. Progress on getting efficiencies comparable to existing top-end CIGS devices is slower than foreseen and the project was extended to mid-2020. The OLEDSOLAR project is currently looking at roll-to-roll manufacturing processes but no results are available.
Kesterites: two projects have been completed. In SWInG the chosen technology route (Ge-based kesterite) did not bring a breakthrough in terms of efficiency (target was 15%). STARCELL (including international partners) set itself an 18% efficiency target. They achieved cell efficiencies up to 11.8% and a 50 cm2 mini-module with
29 Here the term "major" refers to projects with over EUR 500 000 EU contribution.

35
7% efficiency. Both projects produced important scientific insights to the challenges to improving kesterite cells, but there is no clear route to overcoming these.
4.3 Silicon wafer tandems
Tandem cell design is one of the most promising areas of photovoltaics R&D and H2020 projects address several concepts (Table 13).
The first is perovskite on silicon wafers. The CHEOPS project (2016-2019) included Europe's foremost groups working in this area (Oxford PV, EPFL, CHOSE etc.). They succeeded in making tandem with efficiency just over 25% on a small area (record is 29%). The partners are continuing work in this field, notably Oxford PV with its 100-MW scale manufacturing plant for PSC-Si tandems.
The other area investigated is silicon with III-V material top cells. It has already been shown that this combination can produce efficiencies well above 30%, and the challenge is to find concepts with potential to be commercially viable given the high cost of III-V materials. Nanotandem developed a template-assisted selective epitaxy (TASE) approach and produced nanowire tandem cells (InGa on Si) with efficiencies of 18%, and record III-V nanowire cells with efficiency of 16.9%. The processes developed for the Si cells interfaces (e.g. the diffraction grating back reflector approach) are broadly applicable and were used in the record GaInP/AlGaAs//Si tandem cell. AligND Systems acquired the entire IP-portfolio, but from their webpage it does not appear that the technology is being applied yet. The SME project NanoSol aimed to industrialise an existing prototype called SolFilm using an aereotaxy technique (nanowires formed in gas phase, suspended in ink and then deposited) for GaAs nanowires on silicon. The project ended prematurely and the samples produced had low efficiency even for small areas (4%, 25 mm2). At this point it does not seem that the aereotaxy process can compete with the metalorganic vapour-phase epitaxy (MOVPE) method used by other groups working in this area. SiTaSol started in mid-2017 looking at two different epitaxial deposition/fabrication processes and no results on efficiencies are available at time of writing.
Lastly, the HIPERION project also used a III-V on silicon tandem concept but combined with a concentration optics (see also section 4.4).
4.4 Concentrating devices
Several projects have been active in H2020 (Table 14). The largest, CPVMatch, set itself the challenge of world record efficiency and a scalable fabrication process. It has delivered successful devices and optical systems, but there are no prospects for further development at present due to the difficulties in general of achieving competitive cost levels for concentrating PV technology.
Two SME projects have also aimed to develop CPV products. The second phase of CogemCPVT aimed to improve a prototype design. The REPHLECT project (also in phase 2) targeted an HCPV concept with a pilot line in Spain and a clone on Morocco.
Finally, the HIPERION project, which started in 2019, takes a very different approach using optical micro-tracking technology to concentrate sunlight on small (1 mm2) multijunction solar cells, mounted on top of a conventional silicon wafer cell. The modules themselves are not on trackers, but do have a small degree of movement between the upper and lower planes to optimise optical performance. Concentration level is larger than 200 times. Efficiencies of 30% have been reported for prototypes, and project will focus on scale-up to TRL 7.
4.5 Building-related products
Table 15 lists the projects which focussed on PV products for buildings. In general these combined product development (including customised manufacturing processes) and operation demonstration on buildings:
In Advanced-BIPV, Onyx Solar developed two full-scale (XL-format) PV glass products together with a corresponding manufacturing process, and is judged to have reached TRL 8. The company is taking part in further development and demonstrations activities in the PVSITES and TECH4WIN projects.
STILORMADE used the iCell crystalline silicon technology to develop and certify both standard (flat plate) and innovative (curved) products. Successful demonstrations were made on a range of buildings.
PV-SITES is a large consortium project that encompasses a number of facilitation activities (design tools, energy forecasting tools) as well as development and demonstration of products at several sites
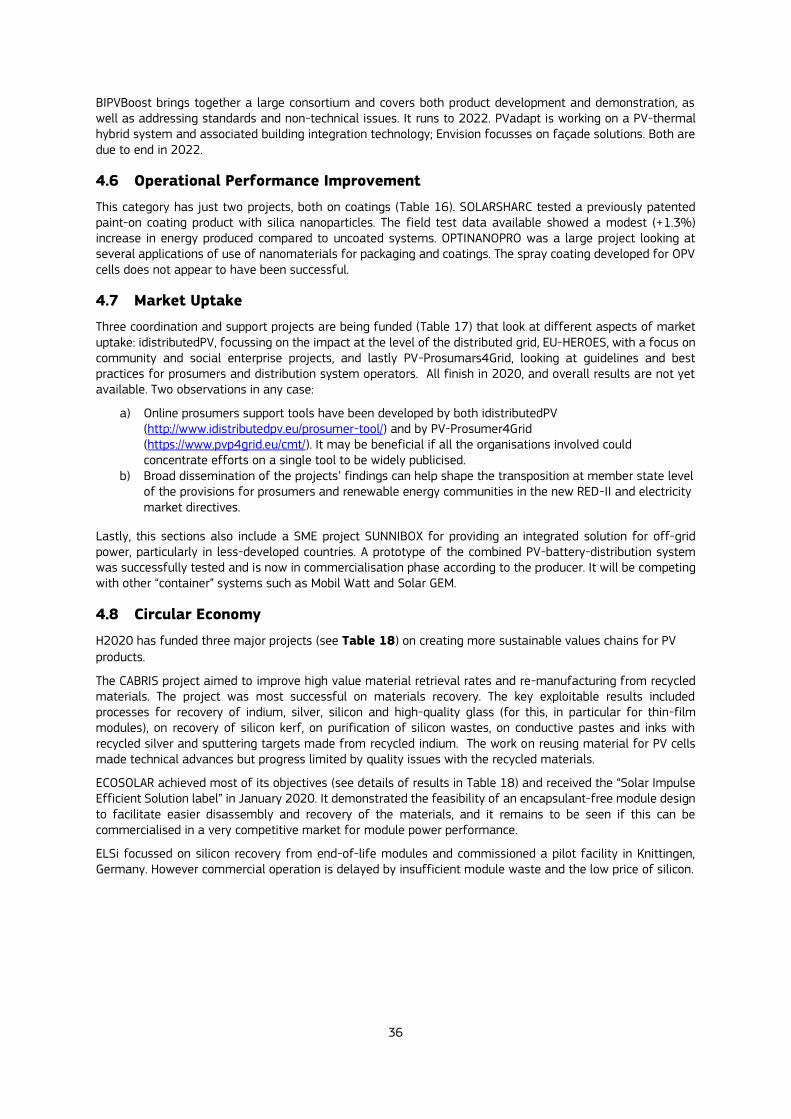
36
BIPVBoost brings together a large consortium and covers both product development and demonstration, as well as addressing standards and non-technical issues. It runs to 2022. PVadapt is working on a PV-thermal hybrid system and associated building integration technology; Envision focusses on façade solutions. Both are due to end in 2022.
4.6 Operational Performance Improvement
This category has just two projects, both on coatings (Table 16). SOLARSHARC tested a previously patented paint-on coating product with silica nanoparticles. The field test data available showed a modest (+1.3%) increase in energy produced compared to uncoated systems. OPTINANOPRO was a large project looking at several applications of use of nanomaterials for packaging and coatings. The spray coating developed for OPV cells does not appear to have been successful.
4.7 Market Uptake
Three coordination and support projects are being funded (Table 17) that look at different aspects of market uptake: idistributedPV, focussing on the impact at the level of the distributed grid, EU-HEROES, with a focus on community and social enterprise projects, and lastly PV-Prosumars4Grid, looking at guidelines and best practices for prosumers and distribution system operators. All finish in 2020, and overall results are not yet available. Two observations in any case:
a) Online prosumers support tools have been developed by both idistributedPV (http://www.idistributedpv.eu/prosumer-tool/) and by PV-Prosumer4Grid (https://www.pvp4grid.eu/cmt/). It may be beneficial if all the organisations involved could concentrate efforts on a single tool to be widely publicised.
b) Broad dissemination of the projects’ findings can help shape the transposition at member state level of the provisions for prosumers and renewable energy communities in the new RED-II and electricity market directives.
Lastly, this sections also include a SME project SUNNIBOX for providing an integrated solution for off-grid power, particularly in less-developed countries. A prototype of the combined PV-battery-distribution system was successfully tested and is now in commercialisation phase according to the producer. It will be competing with other “container” systems such as Mobil Watt and Solar GEM.
4.8 Circular Economy
H2020 has funded three major projects (see Table 18) on creating more sustainable values chains for PV products.
The CABRIS project aimed to improve high value material retrieval rates and re-manufacturing from recycled materials. The project was most successful on materials recovery. The key exploitable results included processes for recovery of indium, silver, silicon and high-quality glass (for this, in particular for thin-film modules), on recovery of silicon kerf, on purification of silicon wastes, on conductive pastes and inks with recycled silver and sputtering targets made from recycled indium. The work on reusing material for PV cells made technical advances but progress limited by quality issues with the recycled materials.
ECOSOLAR achieved most of its objectives (see details of results in Table 18) and received the “Solar Impulse Efficient Solution label” in January 2020. It demonstrated the feasibility of an encapsulant-free module design to facilitate easier disassembly and recovery of the materials, and it remains to be seen if this can be commercialised in a very competitive market for module power performance.
ELSi focussed on silicon recovery from end-of-life modules and commissioned a pilot facility in Knittingen, Germany. However commercial operation is delayed by insufficient module waste and the low price of silicon.

37
Table 11 Progress of major EU-funded projects under Horizon 2020: wafer-based crystalline silicon
Acronym Title Start/ End Date
Main Technology & Cost Objectives
TRL
EC fund-ing, EUR
NextBase Next-generation interdigitated back-contacted silicon heterojunction solar cells and modules by design and process innovations
01/10/2016 30/09/2019
- IBC-SHJ cells with efficiency above 26.0% and corresponding solar modules with efficiency above 22.0%. - Development of a new industrial manufacturing tool and low-cost processes for a competitive IBC-SHJ solar module cost of < 0.35 €/Wp.
4 3 800 421
DISC Double side contacted cells with innovative carrier-selective contacts
01/10/2016 30/09/2019
- Target efficiencies >25.5% on large area cell and >22% at module level - Demonstrating pilot manufacturing readiness at competitive costs. - Reduce non-abundant material consumption (Ag, In), with an enhancement of the energy yield, with modern module design ensuring outstanding durability
4 4 743 519
AMPERE Automated photovoltaic cell and Module industrial Production to regain and secure European Renewable Energy market
01/05/2017 30/04/2020
Setting-up of a 100 MW full-scale automated pilot line in production environment at the 3Sun fab (Catania) based on silicon heterojunction technology (HJT) developed within preceding European projects (CEA-INES & MBS platforms).
8 14 952 065
HIGHLITE High-performance low-cost modules with excellent environmental profiles for a competitive EU PV manufacturing industry
1/10/2019 to 30/9/2022
Focus on thin (100 μm) high-efficiency HJT c-Si with passivating contacts
building-applied PV modules with η ≥ 22% and ≤ 250 kg-eq.CO2/kWp,
building-integrated PV modules with η ≥ 21% and improved shading tolerance,
vehicle-integrated curved modules with η ≥ 20% and a weight ≤ 5 kg/m2.
Target 6/7 12,870,478
SUPER-PV Cost Reduction and Enhanced Performance of PV Systems
1/5/2018 to 30/4/2022
Module level: AR, anti-soiling and anti-heating coating based on nanomaterials; improved light harvesting; in-laminate bypass diodes, flexible encapsulation solutions. BOS component level: module-level power electronics using GaN technologies; fault-tolerant inverter topology and control architectures; low-cost meteo and soiling sensors. System level innovations: PV Information Management (PIM) platform for system design, manufacturing, installation and operation
9,907,793
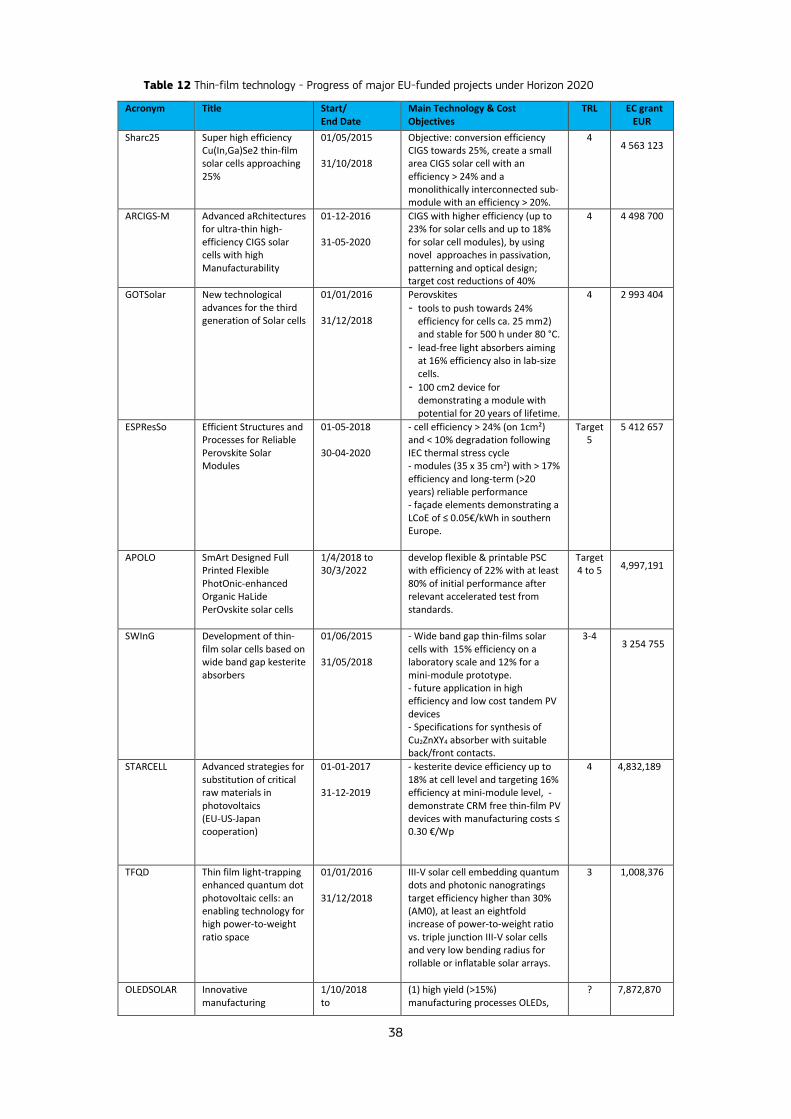
38
Table 12 Thin-film technology - Progress of major EU-funded projects under Horizon 2020
Acronym Title Start/ End Date
Main Technology & Cost Objectives
TRL
EC grant EUR
Sharc25 Super high efficiency Cu(In,Ga)Se2 thin-film solar cells approaching 25%
01/05/2015 31/10/2018
Objective: conversion efficiency CIGS towards 25%, create a small area CIGS solar cell with an efficiency > 24% and a monolithically interconnected sub-module with an efficiency > 20%.
4 4 563 123
ARCIGS-M Advanced aRchitectures for ultra-thin high-efficiency CIGS solar cells with high Manufacturability
01-12-2016 31-05-2020
CIGS with higher efficiency (up to 23% for solar cells and up to 18% for solar cell modules), by using novel approaches in passivation, patterning and optical design; target cost reductions of 40%
4 4 498 700
GOTSolar New technological advances for the third generation of Solar cells
01/01/2016 31/12/2018
Perovskites
- tools to push towards 24% efficiency for cells ca. 25 mm2) and stable for 500 h under 80 °C.
- lead-free light absorbers aiming at 16% efficiency also in lab-size cells.
- 100 cm2 device for demonstrating a module with potential for 20 years of lifetime.
4 2 993 404
ESPResSo Efficient Structures and Processes for Reliable Perovskite Solar Modules
01-05-2018 30-04-2020
- cell efficiency > 24% (on 1cm²) and < 10% degradation following IEC thermal stress cycle - modules (35 x 35 cm2) with > 17% efficiency and long-term (>20 years) reliable performance - façade elements demonstrating a LCoE of ≤ 0.05€/kWh in southern Europe.
Target 5
5 412 657
APOLO SmArt Designed Full Printed Flexible PhotOnic-enhanced Organic HaLide PerOvskite solar cells
1/4/2018 to 30/3/2022
develop flexible & printable PSC with efficiency of 22% with at least 80% of initial performance after relevant accelerated test from standards.
Target 4 to 5 4,997,191
SWInG Development of thin-film solar cells based on wide band gap kesterite absorbers
01/06/2015 31/05/2018
- Wide band gap thin-films solar cells with 15% efficiency on a laboratory scale and 12% for a mini-module prototype. - future application in high efficiency and low cost tandem PV devices - Specifications for synthesis of Cu2ZnXY4 absorber with suitable back/front contacts.
3-4 3 254 755
STARCELL Advanced strategies for substitution of critical raw materials in photovoltaics (EU-US-Japan cooperation)
01-01-2017 31-12-2019
- kesterite device efficiency up to 18% at cell level and targeting 16% efficiency at mini-module level, - demonstrate CRM free thin-film PV devices with manufacturing costs ≤ 0.30 €/Wp
4 4,832,189
TFQD Thin film light-trapping enhanced quantum dot photovoltaic cells: an enabling technology for high power-to-weight ratio space
01/01/2016 31/12/2018
III-V solar cell embedding quantum dots and photonic nanogratings target efficiency higher than 30% (AM0), at least an eightfold increase of power-to-weight ratio vs. triple junction III-V solar cells and very low bending radius for rollable or inflatable solar arrays.
3 1,008,376
OLEDSOLAR
Innovative manufacturing
1/10/2018 to
(1) high yield (>15%) manufacturing processes OLEDs,
? 7,872,870

39
Acronym Title Start/ End Date
Main Technology & Cost Objectives
TRL
EC grant EUR
processes and in-line monitoring techniques for the OLED and thin film and organic photovoltaic industries (CIGS and OPV)
30/9/2021 OPVs and CIGs solar cells in S2S and R2R environment. (2) inline system of inspection, quality control, functional testing and measurements (3) Recycling and re-use approaches (4) Automation and advance processing software for control and monitoring of manufacturing in R2R and S2S processes 5) up-scale and validation in 3 pilot lines and 4 production lines
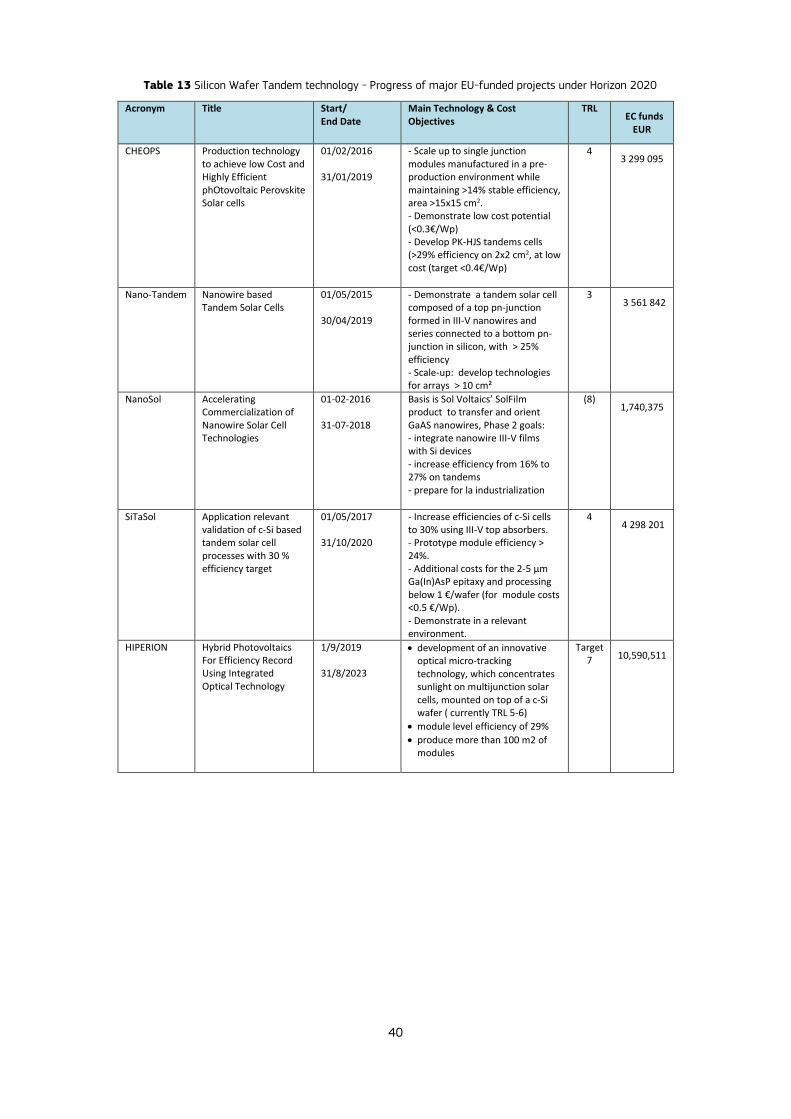
40
Table 13 Silicon Wafer Tandem technology - Progress of major EU-funded projects under Horizon 2020
Acronym Title Start/ End Date
Main Technology & Cost Objectives
TRL EC funds
EUR
CHEOPS Production technology to achieve low Cost and Highly Efficient phOtovoltaic Perovskite Solar cells
01/02/2016 31/01/2019
- Scale up to single junction modules manufactured in a pre-production environment while maintaining >14% stable efficiency, area >15x15 cm2. - Demonstrate low cost potential (<0.3€/Wp) - Develop PK-HJS tandems cells (>29% efficiency on 2x2 cm2, at low cost (target <0.4€/Wp)
4 3 299 095
Nano-Tandem Nanowire based Tandem Solar Cells
01/05/2015 30/04/2019
- Demonstrate a tandem solar cell composed of a top pn-junction formed in III-V nanowires and series connected to a bottom pn-junction in silicon, with > 25% efficiency - Scale-up: develop technologies for arrays > 10 cm²
3 3 561 842
NanoSol Accelerating Commercialization of Nanowire Solar Cell Technologies
01-02-2016 31-07-2018
Basis is Sol Voltaics’ SolFilm product to transfer and orient GaAS nanowires, Phase 2 goals: - integrate nanowire III-V films with Si devices - increase efficiency from 16% to 27% on tandems - prepare for la industrialization
(8) 1,740,375
SiTaSol Application relevant validation of c-Si based tandem solar cell processes with 30 % efficiency target
01/05/2017 31/10/2020
- Increase efficiencies of c-Si cells to 30% using III-V top absorbers. - Prototype module efficiency > 24%. - Additional costs for the 2-5 µm Ga(In)AsP epitaxy and processing below 1 €/wafer (for module costs <0.5 €/Wp). - Demonstrate in a relevant environment.
4 4 298 201
HIPERION Hybrid Photovoltaics For Efficiency Record Using Integrated Optical Technology
1/9/2019 31/8/2023
development of an innovative optical micro-tracking technology, which concentrates sunlight on multijunction solar cells, mounted on top of a c-Si wafer ( currently TRL 5-6)
module level efficiency of 29%
produce more than 100 m2 of modules
Target 7 10,590,511
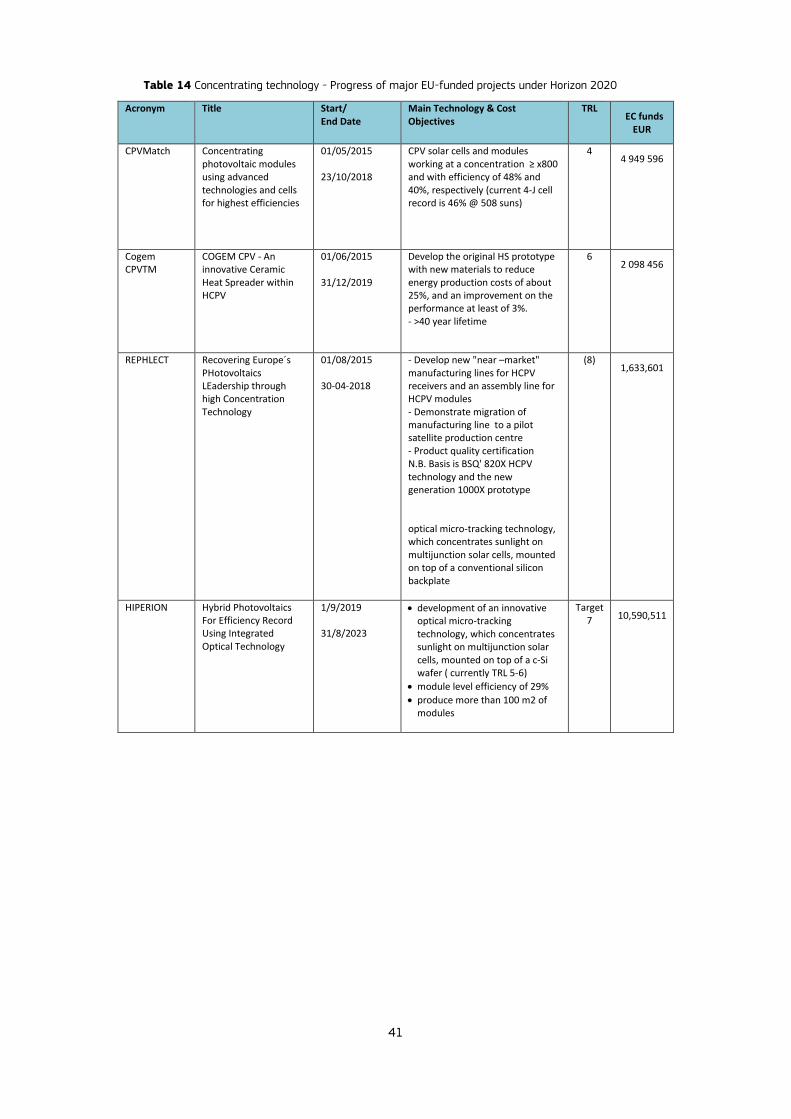
41
Table 14 Concentrating technology - Progress of major EU-funded projects under Horizon 2020
Acronym Title Start/ End Date
Main Technology & Cost Objectives
TRL EC funds
EUR
CPVMatch Concentrating photovoltaic modules using advanced technologies and cells for highest efficiencies
01/05/2015 23/10/2018
CPV solar cells and modules working at a concentration ≥ x800 and with efficiency of 48% and 40%, respectively (current 4-J cell record is 46% @ 508 suns)
4 4 949 596
Cogem CPVTM
COGEM CPV - An innovative Ceramic Heat Spreader within HCPV
01/06/2015 31/12/2019
Develop the original HS prototype with new materials to reduce energy production costs of about 25%, and an improvement on the performance at least of 3%. - >40 year lifetime
6 2 098 456
REPHLECT Recovering Europe´s PHotovoltaics LEadership through high Concentration Technology
01/08/2015 30-04-2018
- Develop new "near –market" manufacturing lines for HCPV receivers and an assembly line for HCPV modules - Demonstrate migration of manufacturing line to a pilot satellite production centre - Product quality certification N.B. Basis is BSQ' 820X HCPV technology and the new generation 1000X prototype optical micro-tracking technology, which concentrates sunlight on multijunction solar cells, mounted on top of a conventional silicon backplate
(8) 1,633,601
HIPERION Hybrid Photovoltaics For Efficiency Record Using Integrated Optical Technology
1/9/2019 31/8/2023
development of an innovative optical micro-tracking technology, which concentrates sunlight on multijunction solar cells, mounted on top of a c-Si wafer ( currently TRL 5-6)
module level efficiency of 29%
produce more than 100 m2 of modules
Target 7 10,590,511

42
Table 15 Building Integrated PV applications - Progress of major EU-funded projects under Horizon 2020
Acronym Title Start/ End Date
Main Technology & Cost Objectives
TRL EC fund-
ing, EUR
ADVANCED-BIPV
New generation of BIPV-glass with advanced integration properties
01/04/2015 31/03/2017
- Develop a new family of products (Novel XL-BIPV glazing units, with high-mechanical resistance and high performing vision glazing, based on PV thin-film transparent panes (transparency over 50%). - estimated selling price of 175-200€/m2
8 1 887 121
PVSITES Building-integrated photovoltaic technologies and systems for large-scale market deployment
01/06/2016 30/06/2020
- large BIPV market deployment by demonstrating a range building-integrated solar technologies and systems - High impact demonstration and dissemination actions for cost-effective renewable generation, reduction of energy demands and smart energy management.
7 5 467 612
SolTile A roof integrated solar tile system to develop cost-effective distributed solar power generation (Phase 2 project)
01/10/2016 30/09/2018
Aim is to re-engineer the tiles for increased efficiency; optimise the manufacturing processes; establish compliance with regulations; install and test 18 roofs for system validation.
3/4 1 542 733
STILORMADE Highly efficient non-standard solar modules manufactured through an automated, reconfigurable mass production processes delivering 30% reduction in costs
01-01-2017 31-12-2018
- Module eff. >19.5% (>21.5% for PERC) - pilot production line of 15MW (for BIPV and solar street lighting markets), then scale up to 60MW, and then 200MW - BIPV: >18% efficiency, tailored design, cost <€4/W (prod. & instal.), lifetime >25 years - Street Lights: >18% efficiency, cost <€2000 / light unit, >12-hour operation at average light intensity of 100W, lifetime of >25 years NB Based on S'Tile "iCell" concept with 4-interconnected sub-cell wafers (AL-BSF or PERC technology) and customised shapes
8 2 940 596
BIPVBoost Bringing down costs of BIPV multifunctional solutions and processes along the value chain, enabling widespread nZEBs implementation
1/10/2018 to 30/9/2022
flexible and automated BIPV manufacturing line
portfolio of multifunctional BIPV products for the building skin
process and energy management innovation based on digitalization
standardization and qualification activities
Target 6,7
8,844,070
PVadapt Prefabrication, Recyclability and Modularity for cost reductions in Smart BIPV systems
1/10/2018 to 31/3/2022
• a PV/T component active energy component comprised of a sheet of flat heat pipes in a PV module • a prefabricated structural panel with multiple passive functions (thermal, resilience, stability, waterproofing etc.)
Target 7
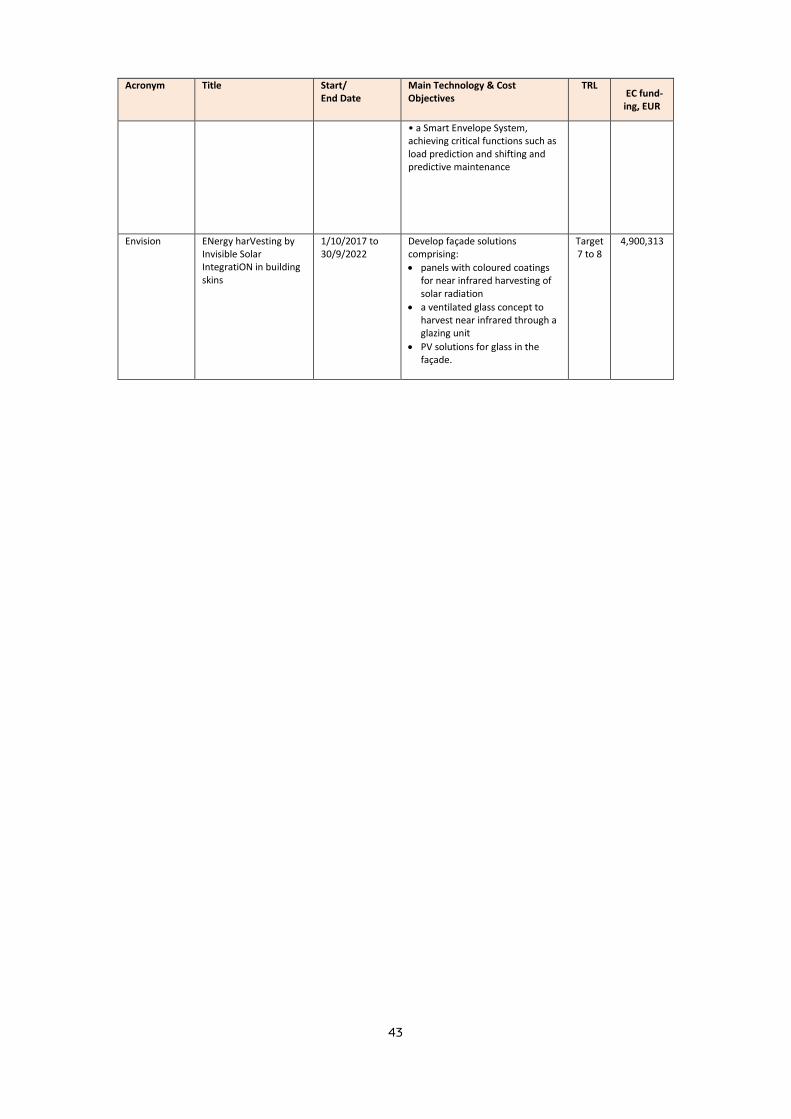
43
Acronym Title Start/ End Date
Main Technology & Cost Objectives
TRL EC fund-
ing, EUR
• a Smart Envelope System, achieving critical functions such as load prediction and shifting and predictive maintenance
Envision ENergy harVesting by Invisible Solar IntegratiON in building skins
1/10/2017 to 30/9/2022
Develop façade solutions comprising:
panels with coloured coatings for near infrared harvesting of solar radiation
a ventilated glass concept to harvest near infrared through a glazing unit
PV solutions for glass in the façade.
Target 7 to 8
4,900,313

44
Table 16 Operational performance enhancement - Progress of major EU-funded projects in H2020
Acronym Title Start/ End Date
Main Technology & Cost Objectives
TRL
EC funds EUR
SOLARSHARC
SOLARSHARC - a durable self-clean coating for solar panels to improve PV energy generation efficiency
01-05-2017 30-04-2019
Product is a patented coating technology that uses silica nano-particles bonded in a polymer matrix to give a robust self-cleaning coating: - 25 year lifetime without recoating - repellent to water, dust, and bio-fouling - Cost <€10 per m2 - High transparency and anti-reflective properties
8 2 267 636
Optinanopro Processing and control of novel nanomaterials in packaging, automotive and solar panel processing lines
1/10/2015 30/09/2018
For solar it included development of self-cleaning coatings to increase OPV effectiveness and extend the period between their maintenance and their lifetime by filtering UV light leading to material weathering.
4 6 920 685
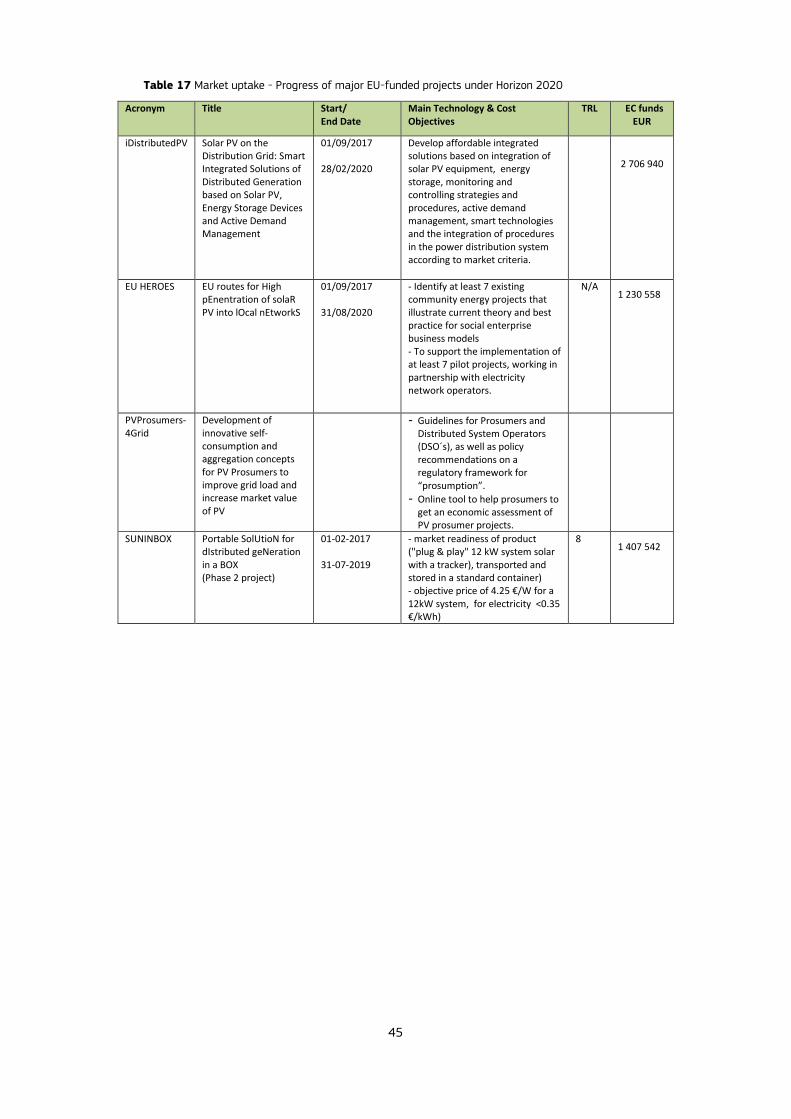
45
Table 17 Market uptake - Progress of major EU-funded projects under Horizon 2020
Acronym Title Start/ End Date
Main Technology & Cost Objectives
TRL
EC funds EUR
iDistributedPV Solar PV on the Distribution Grid: Smart Integrated Solutions of Distributed Generation based on Solar PV, Energy Storage Devices and Active Demand Management
01/09/2017 28/02/2020
Develop affordable integrated solutions based on integration of solar PV equipment, energy storage, monitoring and controlling strategies and procedures, active demand management, smart technologies and the integration of procedures in the power distribution system according to market criteria.
2 706 940
EU HEROES EU routes for High pEnentration of solaR PV into lOcal nEtworkS
01/09/2017 31/08/2020
- Identify at least 7 existing community energy projects that illustrate current theory and best practice for social enterprise business models - To support the implementation of at least 7 pilot projects, working in partnership with electricity network operators.
N/A 1 230 558
PVProsumers-4Grid
Development of innovative self-consumption and aggregation concepts for PV Prosumers to improve grid load and increase market value of PV
- Guidelines for Prosumers and Distributed System Operators (DSO´s), as well as policy recommendations on a regulatory framework for “prosumption”.
- Online tool to help prosumers to get an economic assessment of PV prosumer projects.
SUNINBOX Portable SolUtioN for dIstributed geNeration in a BOX (Phase 2 project)
01-02-2017 31-07-2019
- market readiness of product ("plug & play" 12 kW system solar with a tracker), transported and stored in a standard container) - objective price of 4.25 €/W for a 12kW system, for electricity <0.35 €/kWh)
8 1 407 542

46
Table 18 Circular economy aspects- Progress of major EU-funded projects under Horizon 2020
Acronym Title Start/ End Date
Main Technology & Cost Objectives
TRL EC funds
EUR
CABRISS Implementation of a CirculAr economy Based on Recycled, reused and recovered Indium, Silicon and Silver materials for photovoltaic and other application
01/06/2015 30/05/2018
- Retrieving up to 90% of the high value raw materials: silicon, indium and silver. · Manufacturing of PV from the recycled materials achieving lower cost (25% less) with at least the same cells efficiency as conventional processes.
>7 for some items
7,844,565
Eco-Solar Eco-Solar Factory - 40% plus eco-efficiency gains in the photovoltaic value chain with minimised resource and energy consumption by closed loop systems
01-10-2015 31-09-2018
PV modules with optimised recovery, reuse and resource efficient production methods. Demonstrator modules specs: • industrial size (60cells) • less than 2% degradation in IEC 61215 • 260 Wp for mc-Sis and 285 Wp for sc-Si • monitoring system for identifying faulty panels and repairing/replacing • cost-competitive aiming for 5-8 ct/kWh
(5/6) 5,642,708
ELSi Industrial scale recovery and reuse of all materials from end of life silicon-based photovoltaic modules
01-05-2016 30-04-2018
To recover >95% of end of life silicon-based PV modules; materials recovered to be of value and ready for reuse. - Recover materials from 100 metric tonnes of PV-waste - validate the ELSi process economic viability with a representative full-scale unit having an annual throughput of 968 metric tonnes of disused PV modules, equivalent to 44,000 modules per year.
(8/9) 2 529 607
CIRCUSOL Circular product-service system business models for the solar power industry
1/6/2018 to 31/5/2022
Develop sustainable product-service business models covering all sections of the value chain, including manufacturing, usage, re-use/remanufacture and recycling Product focus will be PV and batteries
N/A 7,014,893

47
5 Technology development Outlook
5.1 Cost Trends
The cost of PV electricity depends on several elements: the capital investment for the system, its location and the associated solar resource, its design, permitting and installation, the operational costs, the useful operation lifetime, end of life management costs and, last but not least, financing costs. Here the focus is on the investment needed for a PV system and for the modules, as the main energy conversion component.
5.1.1 Modules
Modules are the largest single cost component of a system, currently accounting for approximately 40% of the total capital investment needed for utility systems (Figure 17), and somewhat less for residential systems where
economies of scale for installation are less and soft costs are higher. Over the last four decades, solar module prices have fallen following a price-experience or ‘learning’ curve with an average learning rate of about 20%, i.e. the average selling price (ASP) of solar modules fell by 20% for each doubling of production volume. Table 19 shows the April 2020 wholesale spot prices for several technologies. Some commercial products
may be priced higher than these spot levels on a €/watt peak basis, but are competitive by offering features such as higher efficiency (therefore less area and lower balance of system costs), bifaciality (potential for higher overall power output depending on the reflected light at the rear side of the module), better actual energy yield for the conditions at a specific location, large module sizes to reduce BoS costs, claims of improved reliability and degradation resistance, lower CO2 footprint etc.. This cost reduction trend can continue, given the technology options in development and with further improvements in manufacturing; Hoffmann and Metz [55] have made the case for module costs reaching of 0.1 USD/W in 20 years’ time.
Cost information on building integrated PV products is more difficult to evaluate both because of the wide range of products and applications and the fact that it is less commonly reported. SUPSI’s 2017 survey in Europe [56] found prices from 100 to 400 EUR/m2 – for reference a standard polysilicon module has a cost level of approximately 36 EUR/m2.
Figure 17 PV system cost breakdown for a utility-scale system (> 100 kW)
Source: JRC elaboration of ITRPV 2020 data [17]

48
Table 19 Wholesale spot prices for PV modules, without taxes
Technology Average USD
High USD
Low USD
Poly Silicon Solar Module 0.177 0.290 0.160
Poly High Eff / PERC Module 0.196 0.330 0.180
Mono High Eff / PERC Module 0.200 0.380 0.185
Thin-film Solar Module 0.221 0.320 0.200
(source: PVInsights web site accessed 20/4/2020, exchange rate $/€ = 1.15)
Figure 18 Price-experience curve for solar modules [11].
Source: Bloomberg New Energy Finance (BNEF) and PV News
5.1.2 PV Systems
Over the last few years, the capital expenditures (CAPEX) for PV solar systems have converged globally. However, differences in market size and local competition can still lead to significant variations. Local factors like import taxes, local content rules, or existing tax credits have an additional influence on local prices. A global benchmark for levelized cost of electricity (LCOE) is published regularly by BNEF. For the 2nd half year (H2) 2019, this benchmark in the solar sector was USD 51 per MWh, which corresponds to a decrease of about 15% compared to of the second half 2018. With this, the LCOE for non-tracking silicon PV systems have decreased by over 77% over the last 10 years [11]. Similarly ITRTPV considers it plausible that current PV LCOE values are in a range of 25 to 61 USD/MWh for very sunny to temperature climatic conditions, and could fall to 20 to 40 USD/MWh by 2030. As part of the work of the ETIP-PV, Vartiainen et al [57] calculated PV LCOE in Europe for 2019 in a range from 24 EUR/MWh in Malaga to 42 EUR/MWh in Helsinki, and showed the potential to reduce these values by almost a half by 2030, and reduce threefold by 2050.
In terms of actual prices in the market, much attention is focussed on the power price agreement values obtained in auctions. A note of caution is needed as PPAs depend on the specific contractual conditions (volume, project delivery date, duration, taxes and financing). Also, project developers may be interested to bid low in order to acquire a grid connection that can be exploited for selling electricity produced outside of the PPA.
0.1
1
10
100
1 10 100 1,000 10,000 100,000 1,000,000
PV
Mo
du
le P
rice [
US
D2
01
9/W
p]
Cumulative Module Production [MW]
2008
New technologies must enter here
to be competitive
2008
2019
1975
2008
1986
Spot Prices
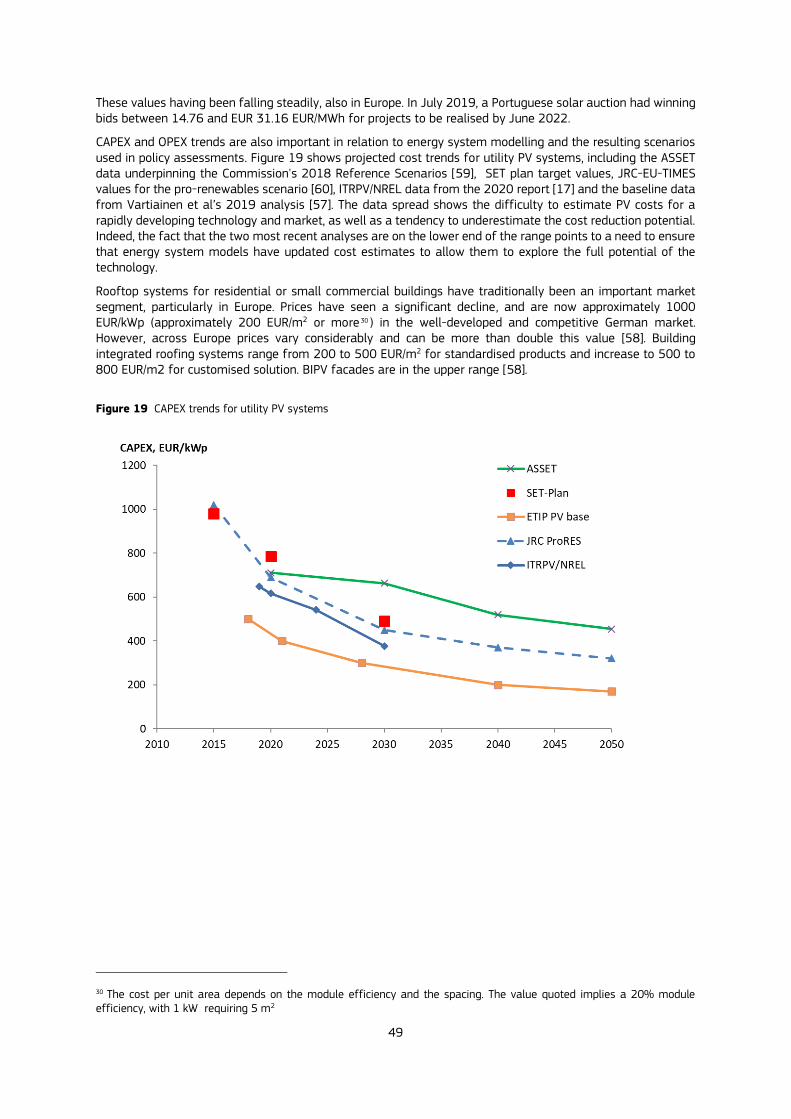
49
These values having been falling steadily, also in Europe. In July 2019, a Portuguese solar auction had winning bids between 14.76 and EUR 31.16 EUR/MWh for projects to be realised by June 2022.
CAPEX and OPEX trends are also important in relation to energy system modelling and the resulting scenarios used in policy assessments. Figure 19 shows projected cost trends for utility PV systems, including the ASSET data underpinning the Commission's 2018 Reference Scenarios [59], SET plan target values, JRC-EU-TIMES values for the pro-renewables scenario [60], ITRPV/NREL data from the 2020 report [17] and the baseline data from Vartiainen et al’s 2019 analysis [57]. The data spread shows the difficulty to estimate PV costs for a rapidly developing technology and market, as well as a tendency to underestimate the cost reduction potential. Indeed, the fact that the two most recent analyses are on the lower end of the range points to a need to ensure that energy system models have updated cost estimates to allow them to explore the full potential of the technology.
Rooftop systems for residential or small commercial buildings have traditionally been an important market segment, particularly in Europe. Prices have seen a significant decline, and are now approximately 1000 EUR/kWp (approximately 200 EUR/m2 or more 30 ) in the well-developed and competitive German market. However, across Europe prices vary considerably and can be more than double this value [58]. Building integrated roofing systems range from 200 to 500 EUR/m2 for standardised products and increase to 500 to 800 EUR/m2 for customised solution. BIPV facades are in the upper range [58].
Figure 19 CAPEX trends for utility PV systems
30 The cost per unit area depends on the module efficiency and the spacing. The value quoted implies a 20% module efficiency, with 1 kW requiring 5 m2
50
5.2 Future Deployment Scenarios
5.2.1 Modelling Framework
Within the LCEO project the JRC-EU-TIMES model [61] is used for assessing the possible impact of technology and cost developments. It represents the energy system of the EU27 plus UK, Switzerland, Iceland and Norway, with each country constituting one region of the model. It simulates a series of 9 consecutive time periods from 2005 to 2060, with results reported for 2020, 2030, 2040 and 2050. Several scenarios were analysed, including:
Baseline: Continuation of current trends; 48% CO2 reduction by 2050 with respect to 1990 levels
Diversified: Usage of all known supply, efficiency and mitigation options (including CCS and new nuclear plants); 2050 CO2 reduction target is achieved
ProRES: 80% CO2 reduction by 2050; no new nuclear; no CCS
SET plan 80% CO2 reduction by 2050, with technology cost learning curves aligned to the targets identified in the various SET plan implementation plans.
Zero-Carbon 100% CO2 reduction, underground CO2 storage limited to 300 Mt/year.
For PV, the specific inputs include:
a) CAPEX and fixed operating and maintenance (FOM) cost trends, together with learning rate values for three PV deployment options: utility scale, commercial (rooftop) scale and residential scale (see [60]);
b) Environmental constraints: country specific load factor values are included to account for geographical variations in the solar resource, as well as limits on installed capacity to reflect available land and roof resources.
5.2.2 Results
Figure 20 summarises the electricity generation results for the diversified, SET plan and Zero-Carbon scenarios (the outcome of other scenarios are discussed in previous LCEO reports [6,7]). A notable feature is the large increase in electricity production in the SET plan and ZeroCarbon scenarios, reflecting a deep electrification of transport and the use of electricity to produce hydrogen, synfuels and other previously petrochemical-based products. In terms of scenario design, ZeroCarbon is comparable to the EC 2050 LTS 1.5TECH. [62], and is consistent with the new Green Deal ambition for a climate neutral Europe by 2050. The larger amount of renewables is a consequence of a higher reduction of CO2 and because it limits underground CO2 storage to 300 Mt/year. In all cases, the renewables contribution is dominated by wind and solar (essentially PV). Figure 21 shows the calculated evolution of PV capacities over 2020-2050 in more detail. For the ZeroCarbon
scenario the installed capacity by 2050 reaches 2.8 TWDC, compared to approximately 1 TWDC in the LTS 1.5TECH scenario. In terms of the type of PV installation, the model results distinguish rooftop and open field (utility) plants. While the rooftop segment grows significantly, its share of total capacity would drop from 60% in 2020 to 21% in 2050 (Table 20). This reflects the respective costs: the cheapest form (utility scale PV) dominates, with a smaller role for new rooftop installations. A note regarding the 2030 timeframe: the above modelling reflects the policy situation ion 2018, aiming for 32% share of renewables. The European Commission now plans to raise the greenhouse gas (GHG) emissions reduction target from 40% towards 55% by 2030 and make Europe the first climate-neutral continent by 2050. The JRC [63] has analysed the potential role of PV by postulating an acceleration in the scenarios from the Commission’s 2018 long-term strategy (LTS) for energy and climate. To reach a 55% GHG emissions reduction, it is estimated that the cumulative PV capacity in the EU and the UK would need to reach 455–605 GWDC, depending on the strategic policy scenario. This implies a compound annual growth rate between 12 and 15% in the timeframe 2020–2030 to increase the annual PV market from approximately 16.5 GWDC in 2019 to 50–80 GWDC by 2030.
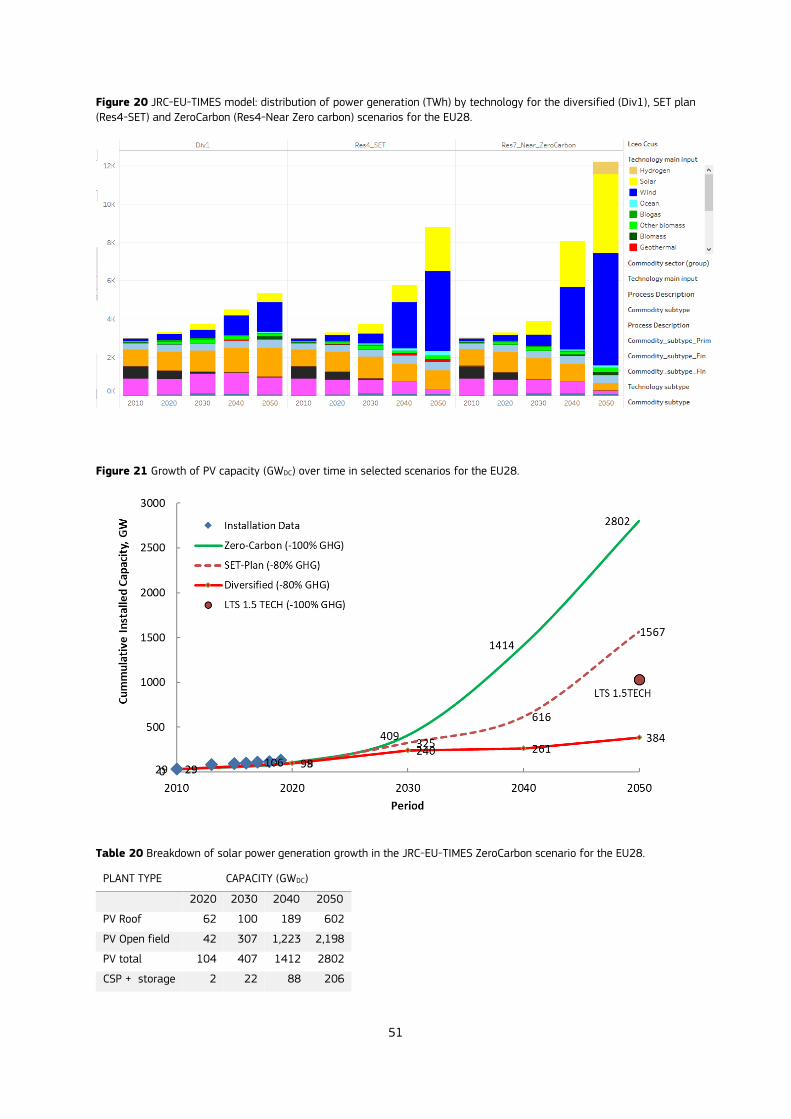
51
Figure 20 JRC-EU-TIMES model: distribution of power generation (TWh) by technology for the diversified (Div1), SET plan
(Res4-SET) and ZeroCarbon (Res4-Near Zero carbon) scenarios for the EU28.
Figure 21 Growth of PV capacity (GWDC) over time in selected scenarios for the EU28.
Table 20 Breakdown of solar power generation growth in the JRC-EU-TIMES ZeroCarbon scenario for the EU28.
PLANT TYPE CAPACITY (GWDC)
2020 2030 2040 2050
PV Roof 62 100 189 602
PV Open field 42 307 1,223 2,198
PV total 104 407 1412 2802
CSP + storage 2 22 88 206
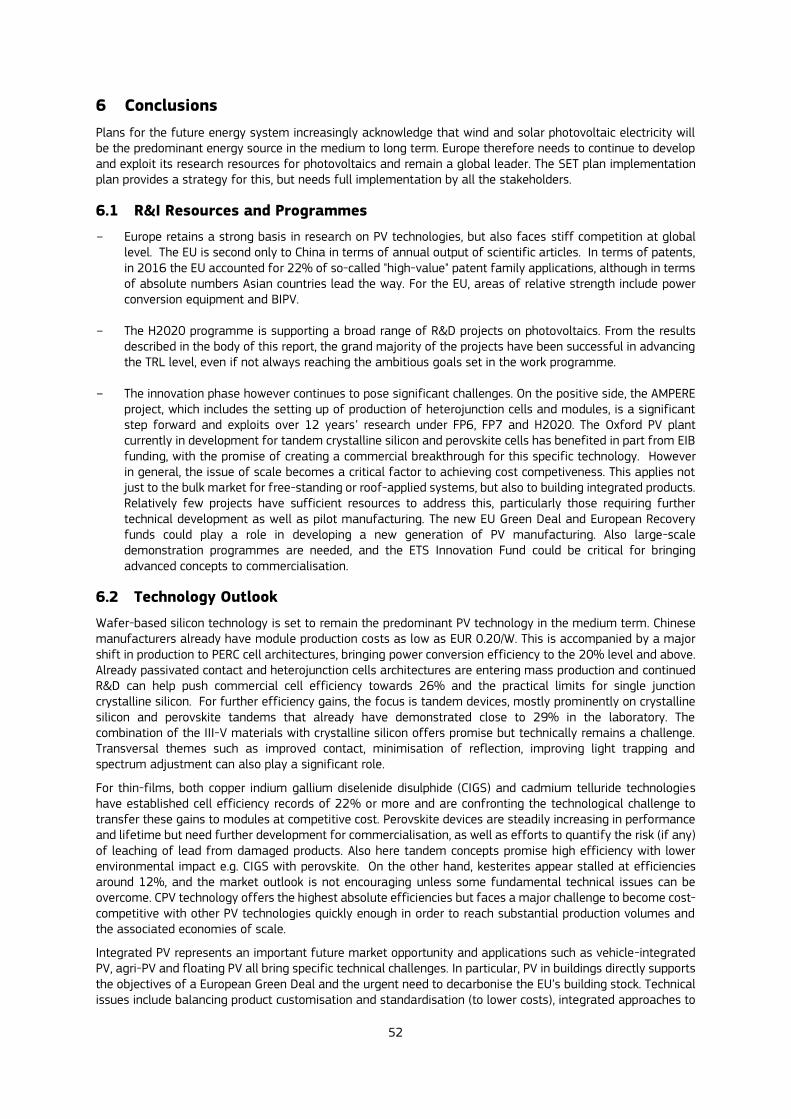
52
6 Conclusions
Plans for the future energy system increasingly acknowledge that wind and solar photovoltaic electricity will be the predominant energy source in the medium to long term. Europe therefore needs to continue to develop and exploit its research resources for photovoltaics and remain a global leader. The SET plan implementation plan provides a strategy for this, but needs full implementation by all the stakeholders.
6.1 R&I Resources and Programmes
Europe retains a strong basis in research on PV technologies, but also faces stiff competition at global level. The EU is second only to China in terms of annual output of scientific articles. In terms of patents, in 2016 the EU accounted for 22% of so-called "high-value" patent family applications, although in terms of absolute numbers Asian countries lead the way. For the EU, areas of relative strength include power conversion equipment and BIPV.
The H2020 programme is supporting a broad range of R&D projects on photovoltaics. From the results described in the body of this report, the grand majority of the projects have been successful in advancing the TRL level, even if not always reaching the ambitious goals set in the work programme.
The innovation phase however continues to pose significant challenges. On the positive side, the AMPERE
project, which includes the setting up of production of heterojunction cells and modules, is a significant step forward and exploits over 12 years’ research under FP6, FP7 and H2020. The Oxford PV plant currently in development for tandem crystalline silicon and perovskite cells has benefited in part from EIB funding, with the promise of creating a commercial breakthrough for this specific technology. However in general, the issue of scale becomes a critical factor to achieving cost competiveness. This applies not just to the bulk market for free-standing or roof-applied systems, but also to building integrated products. Relatively few projects have sufficient resources to address this, particularly those requiring further technical development as well as pilot manufacturing. The new EU Green Deal and European Recovery funds could play a role in developing a new generation of PV manufacturing. Also large-scale demonstration programmes are needed, and the ETS Innovation Fund could be critical for bringing advanced concepts to commercialisation.
6.2 Technology Outlook
Wafer-based silicon technology is set to remain the predominant PV technology in the medium term. Chinese manufacturers already have module production costs as low as EUR 0.20/W. This is accompanied by a major shift in production to PERC cell architectures, bringing power conversion efficiency to the 20% level and above. Already passivated contact and heterojunction cells architectures are entering mass production and continued R&D can help push commercial cell efficiency towards 26% and the practical limits for single junction crystalline silicon. For further efficiency gains, the focus is tandem devices, mostly prominently on crystalline silicon and perovskite tandems that already have demonstrated close to 29% in the laboratory. The combination of the III-V materials with crystalline silicon offers promise but technically remains a challenge. Transversal themes such as improved contact, minimisation of reflection, improving light trapping and spectrum adjustment can also play a significant role.
For thin-films, both copper indium gallium diselenide disulphide (CIGS) and cadmium telluride technologies have established cell efficiency records of 22% or more and are confronting the technological challenge to transfer these gains to modules at competitive cost. Perovskite devices are steadily increasing in performance and lifetime but need further development for commercialisation, as well as efforts to quantify the risk (if any) of leaching of lead from damaged products. Also here tandem concepts promise high efficiency with lower environmental impact e.g. CIGS with perovskite. On the other hand, kesterites appear stalled at efficiencies around 12%, and the market outlook is not encouraging unless some fundamental technical issues can be overcome. CPV technology offers the highest absolute efficiencies but faces a major challenge to become cost-competitive with other PV technologies quickly enough in order to reach substantial production volumes and the associated economies of scale.
Integrated PV represents an important future market opportunity and applications such as vehicle-integrated PV, agri-PV and floating PV all bring specific technical challenges. In particular, PV in buildings directly supports the objectives of a European Green Deal and the urgent need to decarbonise the EU’s building stock. Technical issues include balancing product customisation and standardisation (to lower costs), integrated approaches to

53
safety and building certification procedures, inclusion in building energy management tools, as well as methods for ensuring product durability and that these meet requirements for inspection and repair/replacement in service.
For all PV technologies, an increasing focus will be needed on circular economy aspects and to socio-economic effects associated with terawatt-scale deployment.

54
7 References
1. European Commission. A Clean Planet for all. A European long-term strategic vision for a prosperous, modern, competitive and climate neutral economy. COM(2018) 773 2018:114.
2. Adoption of the Paris Agreement, United Nations Framework Convention on Climate Change, FCCC/CP/2015/L.9/Rev.1, 12/12/2015
3. European Commission. Commission proposal for a regulation: European Climate Law. Brussels, Belgium: European Commission; 2020
4. European Commission, The European Green Deal. COM(2019) 640; 2019
5. Taylor, N, Jäger-Waldau A., Photovoltaics Technology Development Report 2016, Deliverable D2.1.2 for the Low Carbon Energy Observatory, JRC 100888, 2016
6. N. Taylor, A. Jäger-Waldau, Low Carbon Energy Observatory Photovoltaics Technology Development Report 2018 – Public Version, EUR 29916 EN , European Commission, Luxemburg, 2019, ISBN 978-92-76-12541-9, doi:10.2760/373667, JRC118300.
7. N. Taylor, A. Jäger-Waldau, Low Carbon Energy Observatory Photovoltaics Technology Market Report 2018 – Public Version, EUR 29935 EN, European Commission, Luxemburg, 2019, ISBN 978-92-76-12598-3, doi:10.2760/901540, JRC118307.
8. SET plan TWP PV Implementation Plan, Final Draft, 18 October 2017
9. G.M. Wilson et al, The 2020 Photovoltaic Technologies Roadmap, Journal of Physics D: Applied Physics, https://doi.org/10.1088/1361-6463/ab9c6a, Accepted Manuscript online 12 June 2020
10. S. Peteves et al, Implementing the SET PLAN - Progress from the Implementation working groups,2019, JRC 118272
11. Jäger-Waldau A. Snapshot of photovoltaics-February 2020. Energies 2020;13. https://doi.org/10.1051/epjpv/2018004
12. IEA PVPS, 2018 Snapshot of Global Photovoltaic Markets, ISBN 978–3–906042–72-5
13. IRENA (2018), Global Energy Transformation: A roadmap to 2050, International Renewable Energy Agency, Abu Dhabi.
14. Jäger-Waldau, A., PV Status Report 2019. Luxembourg: 2019, https://doi.org/10.2760/326629
15. Jäger-Waldau et al, How photovoltaics can contribute to GHG emission reductions of 55% in the EU by 2030, Renewable and Sustainable Energy Reviews 126 (2020) 109836
16. Photovoltaics Report, Fraunhofer Institute for Solar Energy & PSE AG, Freiburg, 14 November 2019
17. International Technology Roadmap for Photovoltaics - 2019 Results, Eleventh Edition, VDMA, April 2020
18. A. De Rose, M. Buna, C. Strazza, N. Olivieri, T. Stevens, L. Peeters, D. Tawil-Jamault, Technology Readiness Level: Guidance Principles for Renewable Energy technologies, Final Report, 2017 EUR 27988 EN
19. S.K. Chunduri, M. Schmela, High Efficiency Cell Technologies 2019 Edition, Taiyang News
20. M. A. Green, E.D. Dunlop, J. Hohl-Ebinger, M. Yoshita, N. Kopidakis, A. W.Y. Ho-Baillie, Solar cell efficiency tables (version 55),. Prog. Photovolt Res Appl. 2020; 28:3–15.
21. CIGS White Paper, 2019, https://cigs-pv.net/wortpresse/wp-content/uploads/2019/04/CIGS_White_Paper_2019_online.pdf
22. Perovskite-based photovoltaics: A unique chance for European PV-industry, A White Paper from the European Perovskite Initiative, September 2019
23. Pérez-Rodríguez, A., Thin-film photovoltaics: current status and future challenges, EMIRI Tech Talk on PV & CSP (photovoltaics & concentrated solar power) October 24th 2017, Brussels, Belgium
55
24. Marko Jošt, Lukas Kegelmann, Lars Korte, and Steve Albrecht, Monolithic Perovskite Tandem Solar Cells: A Review of the Present Status and Advanced Characterization Methods Toward 30% Efficiency, Adv. Energy Mater. 2020, 10, 1904102
25. Meier, J., S. Dubail, R. Platz, P. Torres, U. Kroll, J.A. Selvan, N. Pellaton Vaucher, C. Hof, D. Fischer, H. Keppner, R. Flückiger, A. Shah, S. Shklover, and K.-D. Ufert, 1997: Towards high-efficiency thin-film silicon solar cells with the “micromorph” concept. Solar Energy Materials and Solar Cells, 49(1-4), pp. 35-44
26. S. P. Philipps, A.W. Bett, K. Horowitz, S. Kurtz, Current status of concentrator photovoltaic (CPV) technology, Version 1.2, February 2016
27. Dodd, N.; Espinosa, N., Bennet, M. Preparatory study for solar photovoltaic modules, inverters and systems, Task 2 Report: Market data and trends, JRC 180611, 2018
28. SMA Solar Technology AG. Whitepaper: Maximum freedom when oversizing. Niestetal, Germany: 2019
29. Sample, T., Müllejans, H., Salis, E., Bardizza, G., Gracia Amillo, A., Kenny, R., Dunlop, ED. and Taylor, N., Photovoltaic Energy Systems: Summary of the Joint Research Centre's contribution to international and European standards in 2019, JRC Report 119538
30. Dunlop E.D., Gracia Amillo A., Salis E., Sample T., Taylor N., Standards for the assessment of the environmental performance of photovoltaic modules, power conversion equipment and photovoltaic systems, EUR 29247 EN, doi:10.2760/89830, 2019
31. Outcome of the workshop “Bringing the BIPV ecosystem together: building links between the BIPV sector, policymakers, municipalities and the construction sector”, European Commission Joint Research Centre, Ispra, Italy, 30 January 2020, in cooperation with Solar Power Europe.
32. Marmier, A. et al, European Union, Horizon Scanning Alert - Agrivoltaics, shielding crops with PV panels, European Commission 2020, JRC120514
33. M. de Wild-Scholten, V. Cassagne, T. Huld, Solar resources and carbon footprint of photovoltaic power in different regions in Europe, 29th European Photovoltaic Solar Energy Conference and Exhibition, 2014.
34. M. Peh et al, Understanding future emissions from low-carbon power systems by integration of life-cycle assessment and integrated energy modelling, Nature Energy, Vol 2, 2017, 939–945
35. R. Frischknecht, G. Heath, M. Raugei, P. Sinha, M. de Wild-Scholten IEA PVPS Task 12 - Methodology Guidelines on Life Cycle Assessment of Photovoltaic Electricity 3rd Edition
36. COM(2020) 474 final Critical Raw Materials Resilience: Charting a Path towards greater Security and 37. Sustainability
38. Carrara S., Alves Dias P., Plazzotta B. and Pavel C., Raw materials demand for wind and solar PV technologies in the transition towards a decarbonised energy system, EUR 30095 EN,
39. A.Wade, P. Stolz, R. Frischknecht, G. Heath, P. Sinha, S. Pelland, J. Remund, J. Kleissl, T. Oozeki, K. De Brabandere,, The product environmental footprint (PRF) of photovoltaic modules – lessons learned from the environmental footprint pilot phase on the way to a single market for green products in the European Union, Proc. 33rd European Photovoltaic Solar Energy Conference and Exhibition, 2017
40. Jordan, D., Kurtz S., VanSant K and Newmiller J., 2016 Compendium of photovoltaic degradation rates Prog Photovoltaics Res Appl 24 978-89
41. Polo et al. Preliminary survey on site-adaptation techniques for satellite-derived and reanalysis solar radiation datasets. Solar Energy 2016, 132, 25-37
42. Photovoltaic and Solar Forecasting: State of the Art, IEA PVPS Task 14, Subtask 3.1 Report IEA-PVPS T14, 01/ 2013, ISBN 978-3-906042-13-8
43. Yang, D., Kleissl J., Gueymard C. Pedro HTC, Coimbra CFM. History and trends in solar irradiance and PV forecasting: A preliminary assessment and review using text mining. Solar Energy 2018, 168, 60-101
56
44. Blaga R, Sabadus A, Stefu N, Dughir C, Paulescu M, Badescu V. A current perspective on the accuracy of incoming solar energy forecasting. Progress in Energy and Combustion Science 2019, 70, 119-144
45. Yang et al, Verification of deterministic solar forecasts, Solar Energy, available May 2020
46. A. Fiorini, A. Georgakaki, F. Pasimeni, E. Tzimas, “Monitoring R&D in Low-Carbon Energy Technologies”, EUR 28446 EN (2017), doi: 10.2760/434051,
47. Pasimeni, F., Fiorini, A., and Georgakaki, A. (2019). Assessing private R&D spending in Europe for climate change mitigation technologies via patent data. World Patent Information, 59, 101927. https://doi.org/10.1016/j.wpi.2019.101927
48. Pasimeni, F. (2019). SQL query to increase data accuracy and completeness in PATSTAT. World Patent Information, 57, 1-7. https://doi.org/10.1016/j.wpi.2019.02.001
49. N. Persat, M.-A. Le Meur, M. Boero, C. Königstein, An Overview Of Patent Application Data In Europe In The Field Of Photovoltaics, Proc. EUPVSEC 2019.
50. A Framework Strategy for a Resilient Energy Union with a Forward-Looking Climate Change Policy, COM(2015)80, Brussels, 25.2.2015
51. Telsnig T, Wind Energy Technology Development Report 2020, European Commission, 2020, JRC120709.
52. N. Scarlat, F. Fahl, Heat and Power from Biomass Technology Development Report, European Commission Joint Research Centre, 2020, JRC120920.
53. S. Nowak et al, Solar-Era.Net - European Network of National and Regional Research and Innovation Programmes: Latest Developments of Transnational Cooperation, Project Results and Opportunities, Proc. EUPVSEC 2019, doi: 10.4229/EUPVSEC20192019-7DO.7.3
54. IEA Photovoltaic Power Systems Programme, Annual Report 2019, ISBN 978-3-906042-95-4 (available at http://iea-pvps.org )
55. W. Hoffmann, A. Metz, Modules at a Price of 10 $ct/Wp - Dream or Reality? New Approach for Future Cost and Price Predictions, Proc. EUPVSEC 2019, d.o.i 10.4229/EUPVSEC20192019-7EO.3.6
56. I. Zanetti, P. Bonomo, F. Frontini, E. Saretta, Building Integrated Photovoltaics: Product overview for solar building skins Status Report 2017, 2017, SUPSI-SEAC BIPV
57. E. Vartiainen et al, Impact of weighted average cost of capital, capital expenditure, and other
parameters on future utility‐scale PV levelised cost of electricity, Prog Photovolt Res Appl. 2019; 1–
15. 58. BIPVBoost H2020 Project, Competitiveness status of BIPV solutions in Europe, January 2020,
https://bipvboost.eu/public-reports/
59. De Vita, A. et al. (2018) ‘Technology pathways in decarbonisation scenarios’, p. 62. Available at: https://ec.europa.eu/energy/sites/ener/files/documents/
60. Tsiropoulos, I., Tarvydas, D. and Zucker, A. (2018) Cost development of low carbon energy technologies - Scenario-based cost trajectories to 2050, 2017 Edition, EUR 29034 EN, JRC109894. Luxembourg. doi: 10.2760/490059.
61. Nijs, W, Ruiz, Castello P., Tarvydas, D., Tsiropoulos, I., Zucker, A., Deployment Scenarios for Low Carbon Energy Technologies, LCEO Deliverable Report D4.7, 2018
62. Capros P, Zazias G, Evangelopoulou S, Kannavou M, Fotiou T, Siskos P, et al. Energy-system modelling of the EU strategy towards climate-neutrality. Energy Policy 2019; 134. doi:10.1016/j.enpol.2019.110960.
63. Jaeger-Waldau, A., et al, How photovoltaics can contribute to GHG emission reductions of 55% in the EU by 2030, Renewable and Sustainable Energy Reviews 126 (2020) 109836

57
Abbreviations and definitions
General
CAPEX Capital expenses
EC European Commission
EERA European Energy Research Alliance
EIT European Institute of Innovation and Technology
EPBT Energy Pay Back Time
EPC Engineering, Procurement and Construction
ETIP PV European Technology Innovation Platform for Photovoltaics
ETS Emissions Trading Scheme
EU European Union
EUPVSEC European Photovoltaic Solar Energy Conference
FIOM Fixed installation, operating and maintenance [costs]
FP4/5/6/7 Fourth/Fifth/Sixth/Seventh Framework Programme (EU R&D programmes)
H2020 2014-2020 EU R&D Framework Programme
KPI Key Performance Indicator
LCA Life-Cycle Analysis
LCOE Levelised Cost of Electricity
NER New entrant Reserve
NREAP National Renewable Energy Action Plan
O&M Operation and Maintenance
OPEX Operational expenses (running costs)
R&D Research and Development
R&I Research and Innovation
SETIS Strategic Energy Technologies Information System
SET plan European Strategic Energy Technology Plan
SPE Solar Power Europe
TRL Technology Readiness Level
Technical and Theme-Related:
a-Si Amorphous silicon
AZO Aluminum-doped zinc oxide
CdTe Cadmium telluride
CIGS Copper Indium Gallium Diselenide
CPV Concentration Photovoltaics
c-Si Crystalline silicon
CVD Chemical Vapour Deposition
CZTS/Se Copper Zinc Tin Sulphide/Selenide (kesterites)
CZ Czochralski (process for mono-crystalline silicon)
58
DS Directionally solidified (multicrystalline, “cast-mono” and “quasi-mono” Si ingot)
DSC Dye-Sensitized Cell
ED Electro-Deposition
HJT Heterojunction Technology
ITO Indium tin oxide (used as a transparent conductive oxide on cells)
ITRPV International Technology Roadmap for Photovoltaics
LID Light-Induced Degradation
LeTID Light and elevated Temperature-Induced Degradation
Mo Molybdenum
OPV Organic solar cell
PERC Passivated Emitter Rear Contact
PERT Passivated Emitter Rear-Totally Diffused
PID Potential-Induced Degradation
PV Photovoltaic(s)
PSC Perovskite solar cell
R2R Roll-to-roll (production process)
SPC Solid Phase Crystallisation
SPS Spark Plasma Sintering
TCO Transparent Conductive Oxide
TF Thin-film

59
List of figures
Figure 1 Overview of photovoltaic technologies ......................................................................................................................................... 3
Figure 2 Schematic of the silicon wafer sub-technologies, with examples of recent cell efficiency records. ..... 7
Figure 3 Major PV cell architectures.................................................................................................................................................................... 8
Figure 4 Current and projected global market shares of c-Si cell concepts. .......................................................................... 10
Figure 5 Proportional costs of the main elements in in c-Si PV module production. ...................................................... 11
Figure 6 Top countries/regions for author affiliations in journal articles ................................................................................. 20
Figure 7 Geographical distribution of European organisations involved in articles on PV ............................................ 22
Figure 8 Top funding organisations of highly-cited articles on PV in the period 2015 to 2020. .............................. 23
Figure 9 Global trend in patent filings under PV related families per year............................................................................. 24
Figure 10 Trend in patent filings by major global players for 2000-2016. ........................................................................... 24
Figure 11 Regional breakdown of patent families (high value indicates applications in two or more patent offices) .................................................................................................................................................................................................................................. 25
Figure 12 Trends in patenting under the three main application groups for 2000-2016 ............................................. 25
Figure 13 Trends in patenting for main PV technology groups. (NB y-axis with logarithmic scale). ...................... 26
Figure 14 Sectorial breakdown of EU+UK PV patent family applications in 2016 ............................................................ 26
Figure 15 Technology and application breakdown by EC funding for PV-related projects, H2020, 2014-2017.................................................................................................................................................................................................................................................... 29
Figure 16 Sum of NSF awards per year for research on photovoltaics, 2000 to 2019. ................................................ 31
Figure 17 PV system cost breakdown for a utility-scale system (> 100 kW) ....................................................................... 47
Figure 18 Price-experience curve for solar modules [11]. ................................................................................................................. 48
Figure 19 CAPEX trends for utility PV systems ........................................................................................................................................ 49
Figure 20 JRC-EU-TIMES model: distribution of power generation (TWh) by technology for the diversified (Div1), SET plan (Res4-SET) and ZeroCarbon (Res4-Near Zero carbon) scenarios for the EU28. ................................ 51
Figure 21 Growth of PV capacity (GWDC) over time in selected scenarios for the EU28. ............................................... 51

60
List of tables
Table 1: Technical goals in the 2017 SET plan PV Implementation Plan [8]. N.B. The PV Temporary Working Group has earmarked the highlighted items for update in 2020. ..................................................................................................... 6
Table 2 Module efficiency values calculated from the percentage increases stated in the 2017 SET plan PV Implementation Plan [8]. ............................................................................................................................................................................................... 6
Table 3 Characteristics of the principal thin-film photovoltaic technologies (based on the scheme presented in [23]). .................................................................................................................................................................................................................................. 12
Table 4 Reported energy conversion efficiencies of tandem PV cells (active areas of the order of 1 cm2) , as
of March 2020. ................................................................................................................................................................................................................ 14
Table 5 Statistics on most used keywords in 2019 journal articles on PV (source Scopus) ........................................ 21
Table 6 Top 20 European organisations for highly cited scientific articles on PV in 2019-2020 ............................ 22
Table 7 H2020 funding for solar projects 2014-2019 ........................................................................................................................ 28
Table 8 Breakdown of funding for PV or PV-related projects by programme. ...................................................................... 28
Table 9 Breakdown of H2020 funding to 2019 for the SET plan PV priority activities ................................................... 29
Table 10 US DoE Solar Energy Technology Office, active projects as of August 2019 .................................................. 31
Table 11 Progress of major EU-funded projects under Horizon 2020: wafer-based crystalline silicon ............... 37
Table 12 Thin-film technology - Progress of major EU-funded projects under Horizon 2020 ................................... 38
Table 13 Silicon Wafer Tandem technology - Progress of major EU-funded projects under Horizon 2020 ..... 40
Table 14 Concentrating technology - Progress of major EU-funded projects under Horizon 2020 ........................ 41
Table 15 Building Integrated PV applications - Progress of major EU-funded projects under Horizon 2020 .. 42
Table 16 Operational performance enhancement - Progress of major EU-funded projects in H2020................. 44
Table 17 Market uptake - Progress of major EU-funded projects under Horizon 2020 ................................................. 45
Table 18 Circular economy aspects- Progress of major EU-funded projects under Horizon 2020 ......................... 46
Table 19 Wholesale spot prices for PV modules, without taxes .................................................................................................... 48
Table 20 Breakdown of solar power generation growth in the JRC-EU-TIMES ZeroCarbon scenario for the EU28..................................................................................................................................................................................................................................................... 51
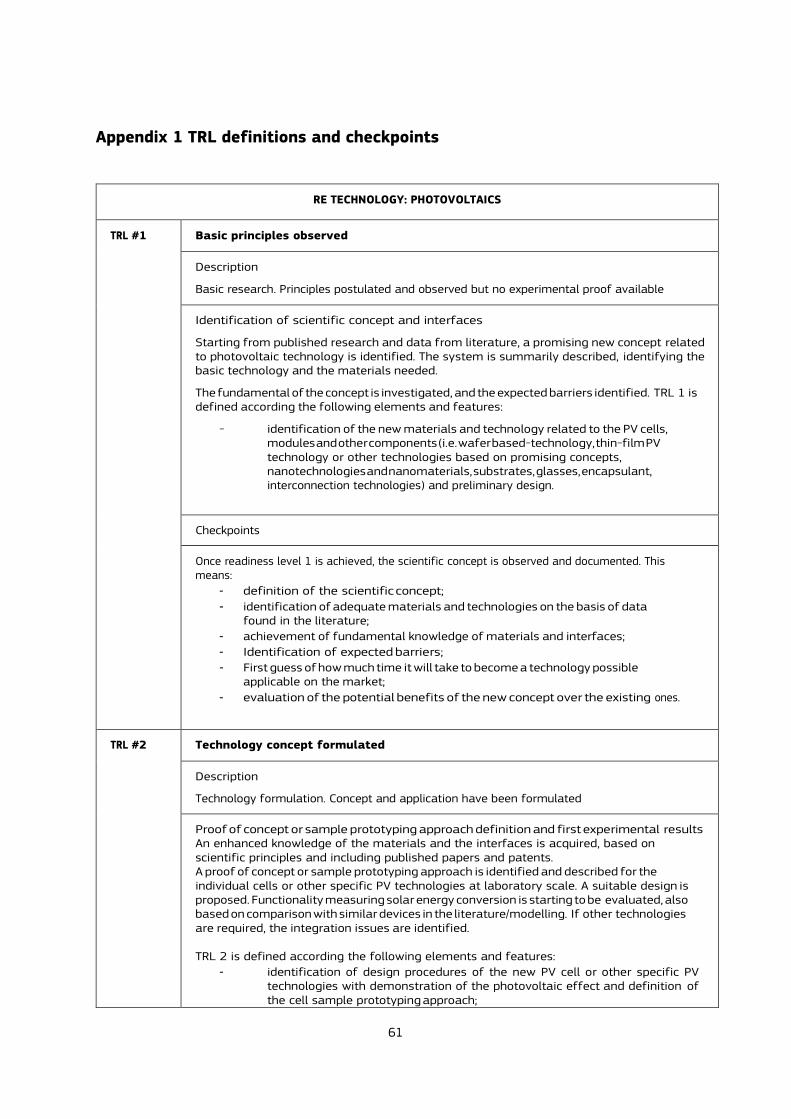
61
Appendix 1 TRL definitions and checkpoints
RE TECHNOLOGY: PHOTOVOLTAICS
TRL #1 Basic principles observed
Description
Basic research. Principles postulated and observed but no experimental proof available
Identification of scientific concept and interfaces
Starting from published research and data from literature, a promising new concept related to photovoltaic technology is identified. The system is summarily described, identifying the basic technology and the materials needed.
The fundamental of the concept is investigated, and the expected barriers identified. TRL 1 is defined according the following elements and features:
- identification of the new materials and technology related to the PV cells, modules and other components (i.e. wafer based-technology, thin-film PV technology or other technologies based on promising concepts, nanotechnologies and nanomaterials, substrates, glasses, encapsulant, interconnection technologies) and preliminary design.
Checkpoints
Once readiness level 1 is achieved, the scientific concept is observed and documented. This means:
- definition of the scientific concept;
- identification of adequate materials and technologies on the basis of data found in the literature;
- achievement of fundamental knowledge of materials and interfaces;
- Identification of expected barriers;
- First guess of how much time it will take to become a technology possible applicable on the market;
- evaluation of the potential benefits of the new concept over the existing ones.
TRL #2 Technology concept formulated
Description
Technology formulation. Concept and application have been formulated
Proof of concept or sample prototyping approach definition and first experimental results An enhanced knowledge of the materials and the interfaces is acquired, based on scientific principles and including published papers and patents. A proof of concept or sample prototyping approach is identified and described for the individual cells or other specific PV technologies at laboratory scale. A suitable design is proposed. Functionality measuring solar energy conversion is starting to be evaluated, also based on comparison with similar devices in the literature/modelling. If other technologies are required, the integration issues are identified. TRL 2 is defined according the following elements and features:
- identification of design procedures of the new PV cell or other specific PV technologies with demonstration of the photovoltaic effect and definition of the cell sample prototyping approach;
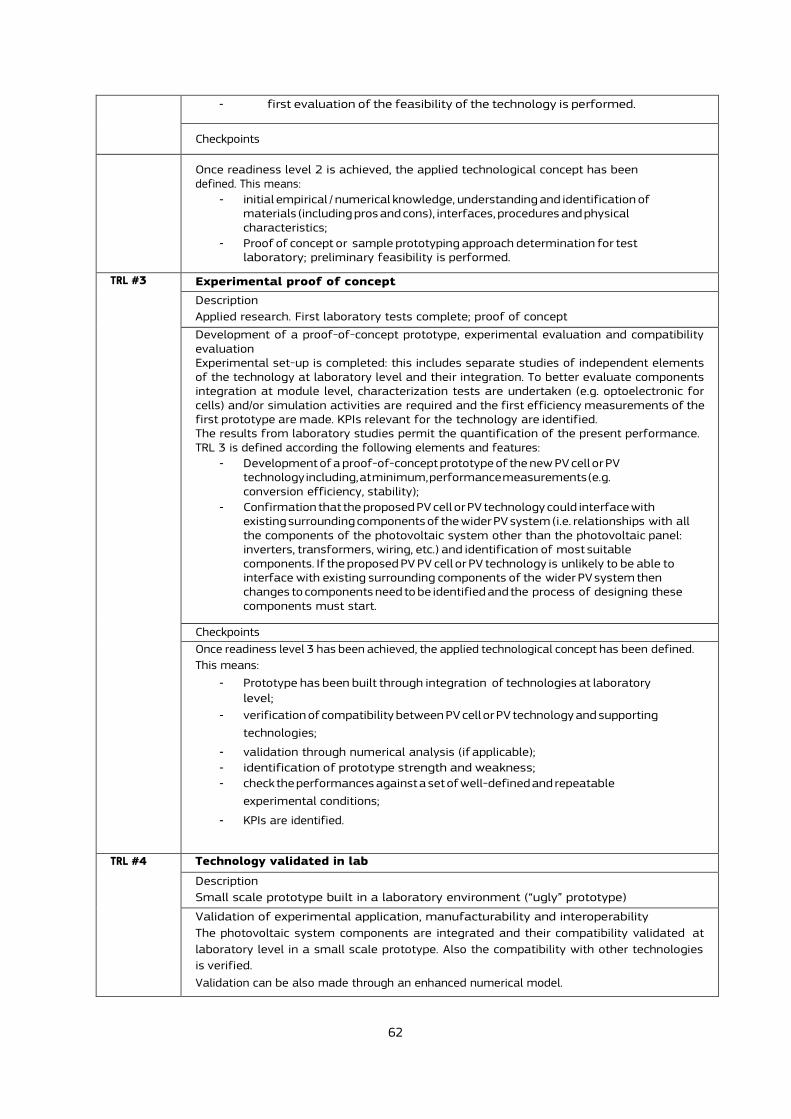
62
- first evaluation of the feasibility of the technology is performed.
Checkpoints
Once readiness level 2 is achieved, the applied technological concept has been defined. This means:
- initial empirical / numerical knowledge, understanding and identification of materials (including pros and cons), interfaces, procedures and physical characteristics;
- Proof of concept or sample prototyping approach determination for test laboratory; preliminary feasibility is performed.
TRL #3 Experimental proof of concept
Description
Applied research. First laboratory tests complete; proof of concept
Development of a proof-of-concept prototype, experimental evaluation and compatibility evaluation Experimental set-up is completed: this includes separate studies of independent elements of the technology at laboratory level and their integration. To better evaluate components integration at module level, characterization tests are undertaken (e.g. optoelectronic for cells) and/or simulation activities are required and the first efficiency measurements of the first prototype are made. KPIs relevant for the technology are identified. The results from laboratory studies permit the quantification of the present performance. TRL 3 is defined according the following elements and features:
- Development of a proof-of-concept prototype of the new PV cell or PV technology including, at minimum, performance measurements (e.g. conversion efficiency, stability);
- Confirmation that the proposed PV cell or PV technology could interface with existing surrounding components of the wider PV system (i.e. relationships with all the components of the photovoltaic system other than the photovoltaic panel: inverters, transformers, wiring, etc.) and identification of most suitable components. If the proposed PV PV cell or PV technology is unlikely to be able to interface with existing surrounding components of the wider PV system then changes to components need to be identified and the process of designing these components must start.
Checkpoints
Once readiness level 3 has been achieved, the applied technological concept has been defined.
This means:
- Prototype has been built through integration of technologies at laboratory
level;
- verification of compatibility between PV cell or PV technology and supporting
technologies;
- validation through numerical analysis (if applicable);
- identification of prototype strength and weakness;
- check the performances against a set of well-defined and repeatable
experimental conditions;
- KPIs are identified.
TRL #4 Technology validated in lab
Description
Small scale prototype built in a laboratory environment (“ugly” prototype)
Validation of experimental application, manufacturability and interoperability
The photovoltaic system components are integrated and their compatibility validated at
laboratory level in a small scale prototype. Also the compatibility with other technologies
is verified.
Validation can be also made through an enhanced numerical model.

63
In respect to TRL3, TRL 4 is defined according the following elements and features of the new
PV cell or PV technology:
- better reliability;
- the device dimensions are closer to final scale (e.g. module, energy production unit,
…);
- improved efficiency.
Checkpoints
Once readiness level 4 has been achieved, the applied technological concept is experimented
and validated. This means:
- the new PV cell or PV technology is reproducible and it is reliable/stable for its
intended application;
- device dimensions are closer to final scale;
- validation with enhanced numerical model;
- performances are repeatable and stable
TRL #5 Technology validated in relevant environment
Description
Large scale prototype tested in intended environment
Validation of experimental application and production in simulated environment
The photovoltaic components are integrated in a first complete system, with additional
supporting elements (i.e. hardware and software) and auxiliaries, to be tested and
validated in a (simulated) relevant working environment. It includes testing in different
environmental conditions (e.g. varying irradiance levels, shading, mechanical loading,
humidity levels...).
TRL 5 is defined according the following elements and features:
- photovoltaic module or technology large scale lab prototype is built and tested
in (simulated) relevant environment, with natural or artificially simulated
environmental conditions. Efficiency is calculated on testing results and matches
with expected performances;
- BoS components are integrated in the large scale lab prototype;
- The robustness of the system is proven in the simulated environment.
Checkpoints
Once readiness level 5 has been achieved, the technology is ready for full-scale. This means:
- Non technological parameters (environmental, social acceptance, regulatory) are
defined and qualitatively assessed;
- PV module or technology lab prototype completed;
- testing and validation in simulated relevant environment finished matching the
expected performances;
- quantification of an early average performance ratio (i.e. solar yield
[kWh/(kWp*yr)] in function of solar irradiation level [kWh/(m2*yr)]).
TRL #6 Technology demonstrated in relevant environment
Description
Prototype system tested in intended environment close to expected performance
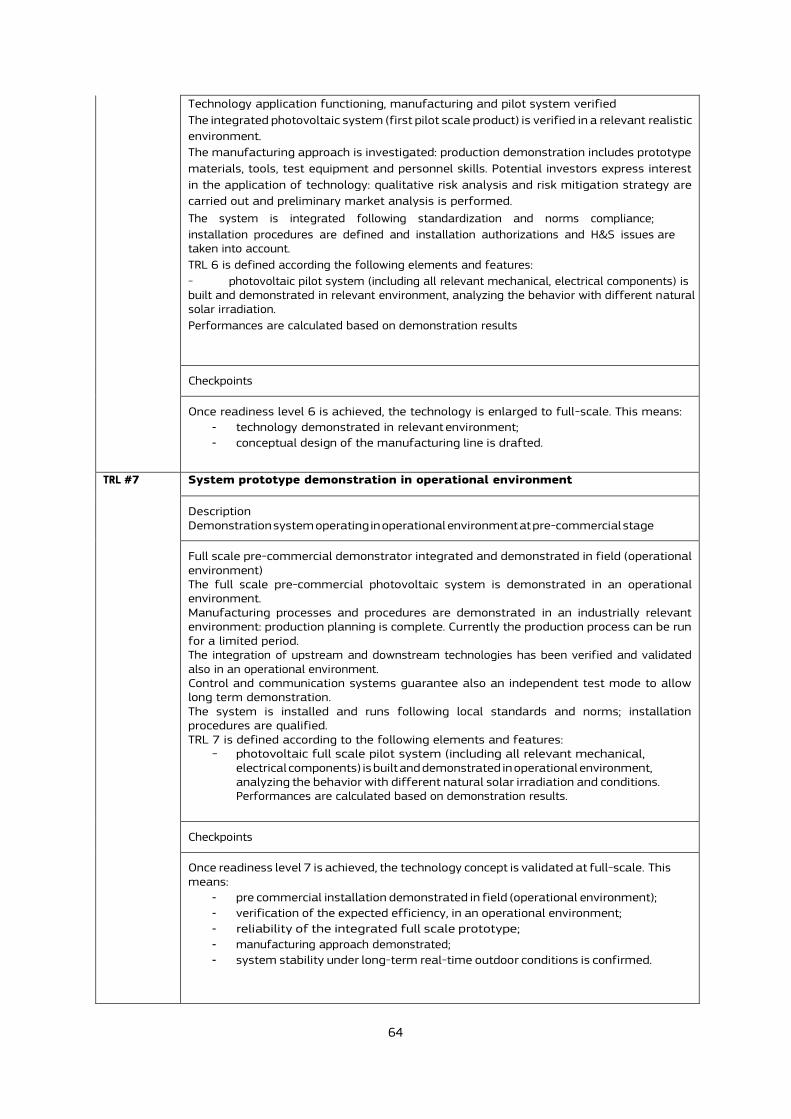
64
Technology application functioning, manufacturing and pilot system verified
The integrated photovoltaic system (first pilot scale product) is verified in a relevant realistic
environment.
The manufacturing approach is investigated: production demonstration includes prototype
materials, tools, test equipment and personnel skills. Potential investors express interest
in the application of technology: qualitative risk analysis and risk mitigation strategy are
carried out and preliminary market analysis is performed.
The system is integrated following standardization and norms compliance;
installation procedures are defined and installation authorizations and H&S issues are taken into account.
TRL 6 is defined according the following elements and features:
- photovoltaic pilot system (including all relevant mechanical, electrical components) is built and demonstrated in relevant environment, analyzing the behavior with different natural solar irradiation.
Performances are calculated based on demonstration results
Checkpoints
Once readiness level 6 is achieved, the technology is enlarged to full-scale. This means:
- technology demonstrated in relevant environment;
- conceptual design of the manufacturing line is drafted.
TRL #7 System prototype demonstration in operational environment
Description Demonstration system operating in operational environment at pre-commercial stage
Full scale pre-commercial demonstrator integrated and demonstrated in field (operational environment) The full scale pre-commercial photovoltaic system is demonstrated in an operational environment. Manufacturing processes and procedures are demonstrated in an industrially relevant environment: production planning is complete. Currently the production process can be run for a limited period. The integration of upstream and downstream technologies has been verified and validated also in an operational environment. Control and communication systems guarantee also an independent test mode to allow long term demonstration. The system is installed and runs following local standards and norms; installation procedures are qualified. TRL 7 is defined according to the following elements and features:
- photovoltaic full scale pilot system (including all relevant mechanical, electrical components) is built and demonstrated in operational environment, analyzing the behavior with different natural solar irradiation and conditions. Performances are calculated based on demonstration results.
Checkpoints
Once readiness level 7 is achieved, the technology concept is validated at full-scale. This means:
- pre commercial installation demonstrated in field (operational environment);
- verification of the expected efficiency, in an operational environment;
- reliability of the integrated full scale prototype;
- manufacturing approach demonstrated;
- system stability under long-term real-time outdoor conditions is confirmed.
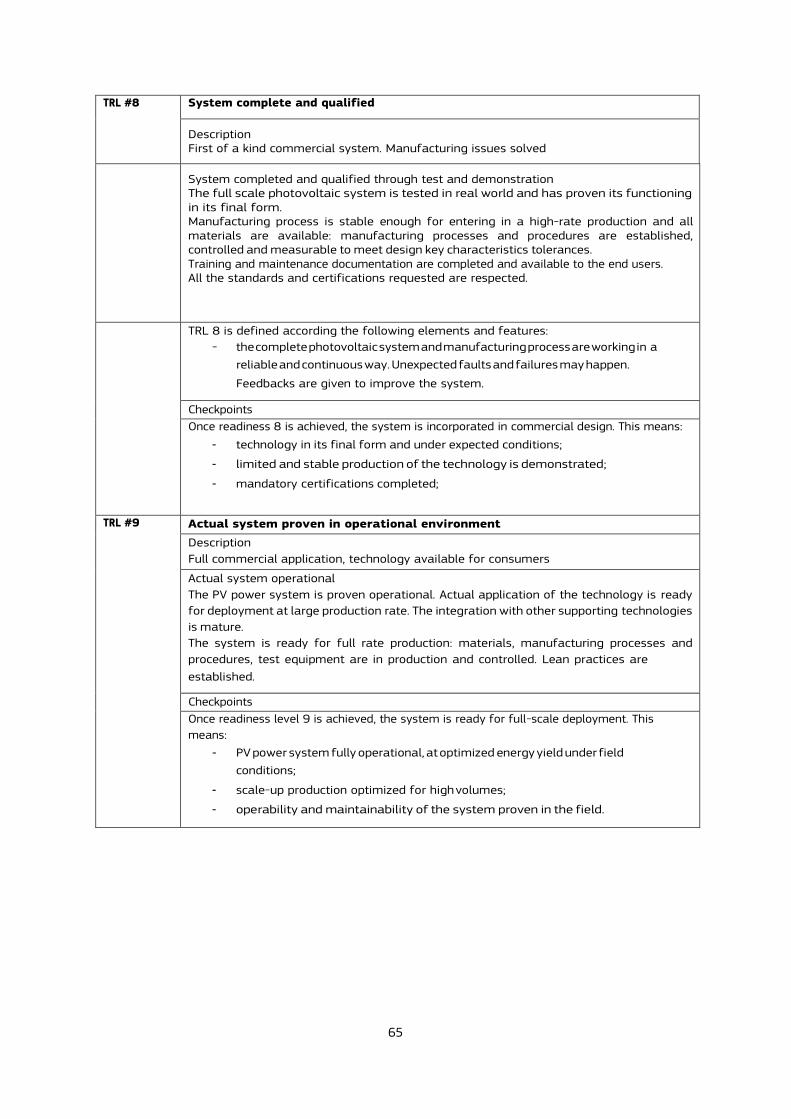
65
TRL #8 System complete and qualified
Description First of a kind commercial system. Manufacturing issues solved
System completed and qualified through test and demonstration The full scale photovoltaic system is tested in real world and has proven its functioning in its final form. Manufacturing process is stable enough for entering in a high-rate production and all materials are available: manufacturing processes and procedures are established, controlled and measurable to meet design key characteristics tolerances. Training and maintenance documentation are completed and available to the end users. All the standards and certifications requested are respected.
TRL 8 is defined according the following elements and features:
- the complete photovoltaic system and manufacturing process are working in a
reliable and continuous way. Unexpected faults and failures may happen.
Feedbacks are given to improve the system.
Checkpoints
Once readiness 8 is achieved, the system is incorporated in commercial design. This means:
- technology in its final form and under expected conditions;
- limited and stable production of the technology is demonstrated;
- mandatory certifications completed;
TRL #9 Actual system proven in operational environment
Description
Full commercial application, technology available for consumers
Actual system operational
The PV power system is proven operational. Actual application of the technology is ready
for deployment at large production rate. The integration with other supporting technologies
is mature.
The system is ready for full rate production: materials, manufacturing processes and
procedures, test equipment are in production and controlled. Lean practices are
established.
Checkpoints
Once readiness level 9 is achieved, the system is ready for full-scale deployment. This
means:
- PV power system fully operational, at optimized energy yield under field
conditions;
- scale-up production optimized for high volumes;
- operability and maintainability of the system proven in the field.

66
Appendix 2 Patent codes for PV devices and systems
Grouping CPC codes
Photovoltaic energy (PV generic) Y02E 10/50
Material Technologies Y02E 10/540
Y02E 10/541 CuInSe2 materials
Y02E 10/542 Dye sensitized
Y02E 10/543 Group II-VI materials (CdTe)
Y02E 10/544 Group III-V materials
Y02E 10/545 Microcrystalline silicon
Y02E 10/546 Polycrystalline silicon
Y02E 10/547 Monocrystalline silicon
Y02E 10/548 Amorphous silicon
Y02E 10/549 Organic31
Building applications Y02B 10/10,
Y02B 10/12 PV Roof systems for PV cells
Y02B 10/14 PV hubs
System with concentrators Y02E 10/52
Power conversion Y02E 10/56 PV - Power conversion electric or electronic aspects
Y02E 10/563 Grid connected
Y02E 10/566 Power management inside the plant
Y02E 10/58 Maximum power point tracking (MPPT) systems
PV-thermal hybrids Y02E 10/60
Manufacturing processes Y02P 02/70
31 CPC Y02E 10/549 includes perovskites, although these are hybrid organic/inorganic materials.

67
Appendix 3 Listing of EU Supported R&D Projects for PV
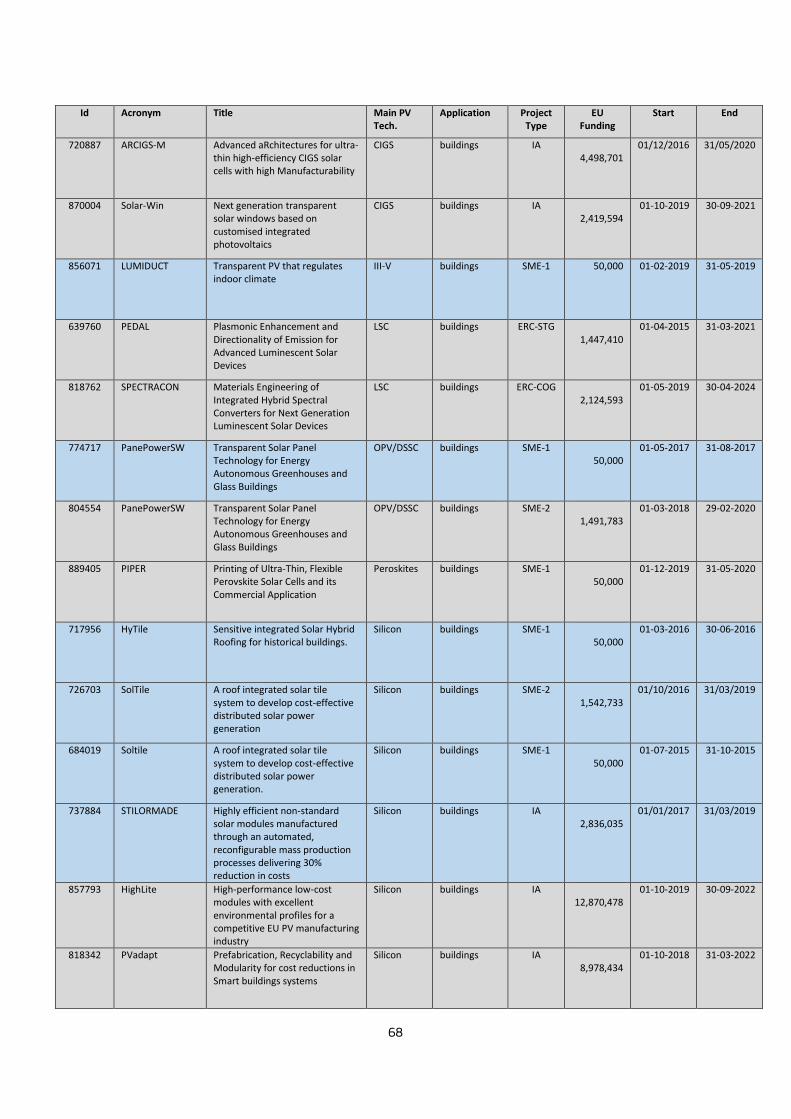
68
Id Acronym Title Main PV Tech.
Application Project Type
EU Funding
Start End
720887 ARCIGS-M Advanced aRchitectures for ultra-thin high-efficiency CIGS solar cells with high Manufacturability
CIGS buildings IA 4,498,701
01/12/2016 31/05/2020
870004 Solar-Win Next generation transparent solar windows based on customised integrated photovoltaics
CIGS buildings IA 2,419,594
01-10-2019 30-09-2021
856071 LUMIDUCT Transparent PV that regulates indoor climate
III-V buildings SME-1 50,000 01-02-2019 31-05-2019
639760 PEDAL Plasmonic Enhancement and Directionality of Emission for Advanced Luminescent Solar Devices
LSC buildings ERC-STG 1,447,410
01-04-2015 31-03-2021
818762 SPECTRACON Materials Engineering of Integrated Hybrid Spectral Converters for Next Generation Luminescent Solar Devices
LSC buildings ERC-COG 2,124,593
01-05-2019 30-04-2024
774717 PanePowerSW Transparent Solar Panel Technology for Energy Autonomous Greenhouses and Glass Buildings
OPV/DSSC buildings SME-1 50,000
01-05-2017 31-08-2017
804554 PanePowerSW Transparent Solar Panel Technology for Energy Autonomous Greenhouses and Glass Buildings
OPV/DSSC buildings SME-2 1,491,783
01-03-2018 29-02-2020
889405 PIPER Printing of Ultra-Thin, Flexible Perovskite Solar Cells and its Commercial Application
Peroskites buildings SME-1 50,000
01-12-2019 31-05-2020
717956 HyTile Sensitive integrated Solar Hybrid Roofing for historical buildings.
Silicon buildings SME-1 50,000
01-03-2016 30-06-2016
726703 SolTile A roof integrated solar tile system to develop cost-effective distributed solar power generation
Silicon buildings SME-2 1,542,733
01/10/2016 31/03/2019
684019 Soltile A roof integrated solar tile system to develop cost-effective distributed solar power generation.
Silicon buildings SME-1 50,000
01-07-2015 31-10-2015
737884 STILORMADE Highly efficient non-standard solar modules manufactured through an automated, reconfigurable mass production processes delivering 30% reduction in costs
Silicon buildings IA 2,836,035
01/01/2017 31/03/2019
857793 HighLite High-performance low-cost modules with excellent environmental profiles for a competitive EU PV manufacturing industry
Silicon buildings IA 12,870,478
01-10-2019 30-09-2022
818342 PVadapt Prefabrication, Recyclability and Modularity for cost reductions in Smart buildings systems
Silicon buildings IA 8,978,434
01-10-2018 31-03-2022

69
Id Acronym Title Main PV Tech.
Application Project Type
EU Funding
Start End
666507 ADVANCED -buildings
New Generation of buildings glass with advanced integration properties
various buildings SME-2 1,887,121
01/04/2015 31/03/2017
817991 BIPVBOOST Bringing down costs of buildings multifunctional solutions and processes along the value chain, enabling widespread nZEBs implementation
various buildings IA 8,844,070
01-10-2018 30-09-2022
767180 Envision ENergy harVesting by Invisible Solar IntegratiON in building skins
various buildings IA 4,900,313
01-10-2017 31-03-2022
691768 PVSITES Building-integrated photovoltaic technologies and systems for large-scale market deployment
various buildings IA 5,467,612
01-01-2016 30-06-2020
875870 SolMate The world’s first “Plug-in and Use-Solar PV with Storage”, designed for small city apartments in the EU.
various buildings SME-1 50,000
01-08-2019 31-01-2020
826002 Tech4Win Disruptive sustainable TECHnologies FOR next generation pvWINdows
various buildings RIA 2,877,045
01-01-2019 30-06-2022
640873 CPVMatch Concentrating Photovoltaic modules using advanced technologies and cells for highest efficiencies
III-V CPV RIA 4,949,596
01/05/2015 31/10/2018
674628 RAYGEN A unique innovative utility scale solar energy technology that utilises a field of low cost heliostat collectors to concentrate sunlight onto an ultra-efficient multijunction photovoltaic cell array
III-V CPV SME-1 50,000
01-05-2015 31-10-2015
683928 REPHLECT Recovering Europe´s PHotovoltaics LEadership through high Concentration Technology
III-V CPV SME-2 1,633,601
01/08/2015 30/04/2018
758885 4SUNS 4-Colours/2-Junctions of III-V semiconductors on Si to use in electronics devices and solar cells
III-V CPV ERC-STG 1,499,719
01-02-2018 31-01-2023
857775 HIPERION Hydrid photovoltaics for efficiency record using optical technology
III-V CPV IA 10,590,511
01-09-2019 31-08-2023
683876 SoHo3X Introducing a novel concept of solar photovoltaic module in the market
Silicon CPV SME-1 50,000
01-07-2015 31-10-2015
641004 Sharc25 Super high efficiency Cu(In,Ga)Se2 thin-film solar cells approaching 25%
CIGS general RIA 4,563,123
01/05/2015 31/10/2018
715027 Uniting PV Applying silicon solar cell technology to revolutionize the design of thin-film solar cells and enhance their efficiency, cost and stability
CIGS general ERC-STG 1,986,125
01-03-2017 28-02-2022
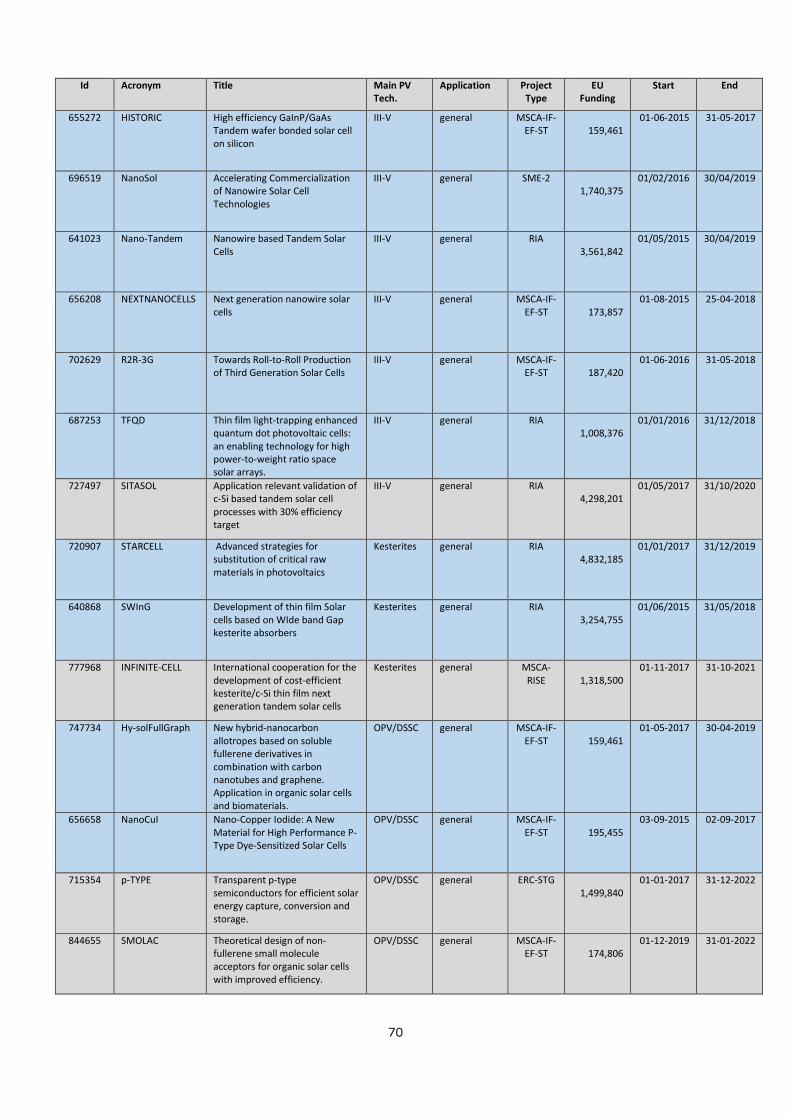
70
Id Acronym Title Main PV Tech.
Application Project Type
EU Funding
Start End
655272 HISTORIC High efficiency GaInP/GaAs Tandem wafer bonded solar cell on silicon
III-V general MSCA-IF-EF-ST
159,461
01-06-2015 31-05-2017
696519 NanoSol Accelerating Commercialization of Nanowire Solar Cell Technologies
III-V general SME-2 1,740,375
01/02/2016 30/04/2019
641023 Nano-Tandem Nanowire based Tandem Solar Cells
III-V general RIA 3,561,842
01/05/2015 30/04/2019
656208 NEXTNANOCELLS Next generation nanowire solar cells
III-V general MSCA-IF-EF-ST
173,857
01-08-2015 25-04-2018
702629 R2R-3G Towards Roll-to-Roll Production of Third Generation Solar Cells
III-V general MSCA-IF-EF-ST
187,420
01-06-2016 31-05-2018
687253 TFQD Thin film light-trapping enhanced quantum dot photovoltaic cells: an enabling technology for high power-to-weight ratio space solar arrays.
III-V general RIA 1,008,376
01/01/2016 31/12/2018
727497 SITASOL Application relevant validation of c-Si based tandem solar cell processes with 30% efficiency target
III-V general RIA 4,298,201
01/05/2017 31/10/2020
720907 STARCELL Advanced strategies for substitution of critical raw materials in photovoltaics
Kesterites general RIA 4,832,185
01/01/2017 31/12/2019
640868 SWInG Development of thin film Solar cells based on WIde band Gap kesterite absorbers
Kesterites general RIA 3,254,755
01/06/2015 31/05/2018
777968 INFINITE-CELL International cooperation for the development of cost-efficient kesterite/c-Si thin film next generation tandem solar cells
Kesterites general MSCA-RISE
1,318,500
01-11-2017 31-10-2021
747734 Hy-solFullGraph New hybrid-nanocarbon allotropes based on soluble fullerene derivatives in combination with carbon nanotubes and graphene. Application in organic solar cells and biomaterials.
OPV/DSSC general MSCA-IF-EF-ST
159,461
01-05-2017 30-04-2019
656658 NanoCuI Nano-Copper Iodide: A New Material for High Performance P-Type Dye-Sensitized Solar Cells
OPV/DSSC general MSCA-IF-EF-ST
195,455
03-09-2015 02-09-2017
715354 p-TYPE Transparent p-type semiconductors for efficient solar energy capture, conversion and storage.
OPV/DSSC general ERC-STG 1,499,840
01-01-2017 31-12-2022
844655 SMOLAC Theoretical design of non-fullerene small molecule acceptors for organic solar cells with improved efficiency.
OPV/DSSC general MSCA-IF-EF-ST
174,806
01-12-2019 31-01-2022

71
Id Acronym Title Main PV Tech.
Application Project Type
EU Funding
Start End
793424 TRIBOSC Towards Radically Innovative Materials for Better and Sustainable Organic Solar Cells
OPV/DSSC general MSCA-IF-EF-ST
183,455
01-10-2018 16-12-2020
843872 WONDER Low-Bandgap Fused Ring Electron Acceptors towards High-Efficiency Organic Solar Cells
OPV/DSSC general MSCA-IF-EF-ST
203,852
01-06-2019 31-05-2021
774686 AlbaSolar Developing perovskite-based solar panels
Peroskites general SME-1 50,000
01-05-2017 30-09-2017
653296 CHEOPS Production technology to achieve low Cost and Highly Efficient phOtovoltaic Perovskite Solar cells
Peroskites general RIA 3,299,095
01/02/2016 31/01/2019
699935 Crystal Tandem Solar
Single-Crystal Perovskite Tandem Solar Cells For High Efficiency and Low Cost
Peroskites general MSCA-IF-GF
269,858
01-01-2017 31-12-2019
687008 GOTSolar New technological advances for the third generation of Solar cells
Peroskites general RIA 2,993,404
01/01/2016 31/12/2018
707168 MatchForSolar Mechanochemical Approach to Inorganic-Organic Hybrid Materials for Perovskite Solar Cells
Peroskites general MSCA-IF-EF-ST
131,565
01-09-2016 28-02-2018
653184 MPerS Sustainable Mixed-ion Layered Perovskite Solar Cells
Peroskites general MSCA-IF-EF-ST
195,455
01-04-2015 31-03-2017
659237 PerovskiteHTM New Hole-Transport Materials to Enhance Perovskite Solar Cells
Peroskites general MSCA-IF-EF-ST
195,455
01-02-2016 31-01-2018
661480 PlasmaPerovSol A full plasma and vacuum integrated process for the synthesis of high efficiency planar and 1D conformal perovskite solar cells
Peroskites general MSCA-IF-EF-ST
158,122
01-01-2016 31-12-2017
747221 POSITS High Performance Wide Bandgap and Stable Perovskite-on-Silicon Tandem Solar Cells
Peroskites general MSCA-IF-EF-ST
175,420
01-06-2017 31-05-2019
727722 PRINTSolar Printable Perovskite Solar Cells with High Efficiency and Stable Performance
Peroskites general ERC-POC 150,000
01-09-2016 28-02-2018
706094 TONSOPS Titanium Oxide Nanocomposites for Scalable Optimized Perovskite Solar cells
Peroskites general MSCA-IF-EF-ST
170,122
16-03-2016 15-03-2018
763989 APOLO SmArt Designed Full Printed Flexible RObust Efficient Organic HaLide PerOvskite solar cells
Peroskites general RIA 4,997,191
01-04-2018 31-03-2022
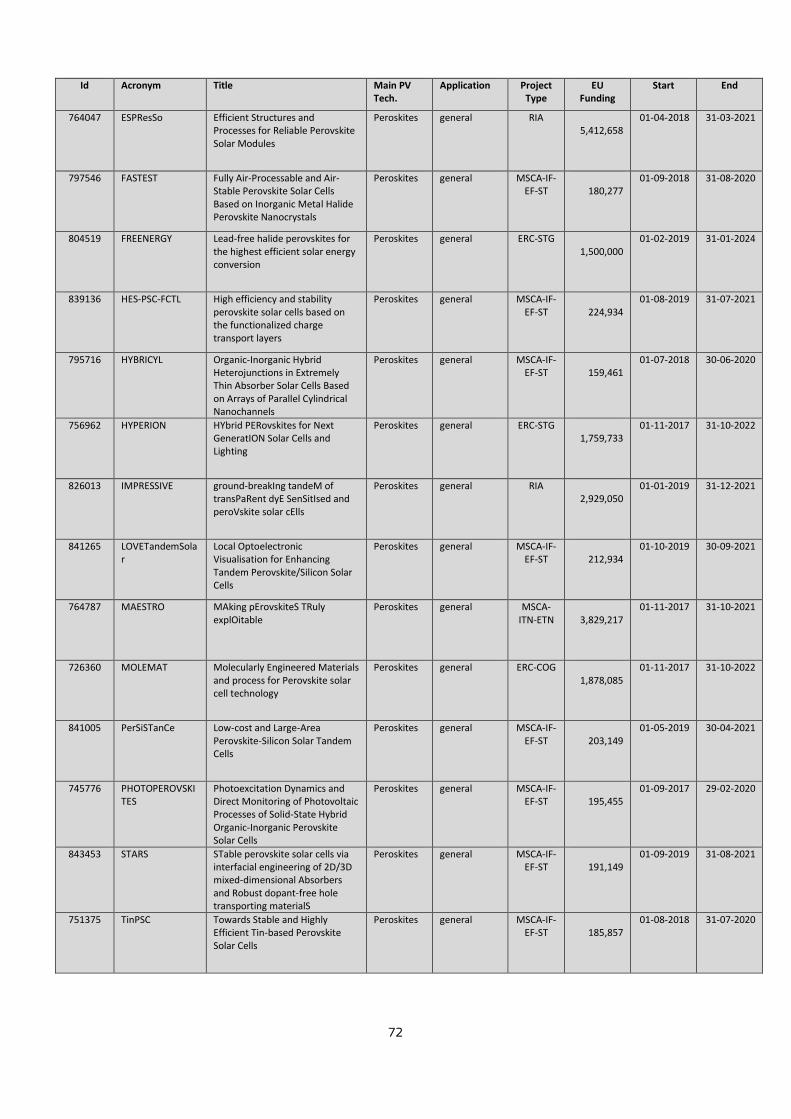
72
Id Acronym Title Main PV Tech.
Application Project Type
EU Funding
Start End
764047 ESPResSo Efficient Structures and Processes for Reliable Perovskite Solar Modules
Peroskites general RIA 5,412,658
01-04-2018 31-03-2021
797546 FASTEST Fully Air-Processable and Air-Stable Perovskite Solar Cells Based on Inorganic Metal Halide Perovskite Nanocrystals
Peroskites general MSCA-IF-EF-ST
180,277
01-09-2018 31-08-2020
804519 FREENERGY Lead-free halide perovskites for the highest efficient solar energy conversion
Peroskites general ERC-STG 1,500,000
01-02-2019 31-01-2024
839136 HES-PSC-FCTL High efficiency and stability perovskite solar cells based on the functionalized charge transport layers
Peroskites general MSCA-IF-EF-ST
224,934
01-08-2019 31-07-2021
795716 HYBRICYL Organic-Inorganic Hybrid Heterojunctions in Extremely Thin Absorber Solar Cells Based on Arrays of Parallel Cylindrical Nanochannels
Peroskites general MSCA-IF-EF-ST
159,461
01-07-2018 30-06-2020
756962 HYPERION HYbrid PERovskites for Next GeneratION Solar Cells and Lighting
Peroskites general ERC-STG 1,759,733
01-11-2017 31-10-2022
826013 IMPRESSIVE ground-breakIng tandeM of transPaRent dyE SenSitIsed and peroVskite solar cElls
Peroskites general RIA 2,929,050
01-01-2019 31-12-2021
841265 LOVETandemSolar
Local Optoelectronic Visualisation for Enhancing Tandem Perovskite/Silicon Solar Cells
Peroskites general MSCA-IF-EF-ST
212,934
01-10-2019 30-09-2021
764787 MAESTRO MAking pErovskiteS TRuly explOitable
Peroskites general MSCA-ITN-ETN
3,829,217
01-11-2017 31-10-2021
726360 MOLEMAT Molecularly Engineered Materials and process for Perovskite solar cell technology
Peroskites general ERC-COG 1,878,085
01-11-2017 31-10-2022
841005 PerSiSTanCe Low-cost and Large-Area Perovskite-Silicon Solar Tandem Cells
Peroskites general MSCA-IF-EF-ST
203,149
01-05-2019 30-04-2021
745776 PHOTOPEROVSKITES
Photoexcitation Dynamics and Direct Monitoring of Photovoltaic Processes of Solid-State Hybrid Organic-Inorganic Perovskite Solar Cells
Peroskites general MSCA-IF-EF-ST
195,455
01-09-2017 29-02-2020
843453 STARS STable perovskite solar cells via interfacial engineering of 2D/3D mixed-dimensional Absorbers and Robust dopant-free hole transporting materialS
Peroskites general MSCA-IF-EF-ST
191,149
01-09-2019 31-08-2021
751375 TinPSC Towards Stable and Highly Efficient Tin-based Perovskite Solar Cells
Peroskites general MSCA-IF-EF-ST
185,857
01-08-2018 31-07-2020

73
Id Acronym Title Main PV Tech.
Application Project Type
EU Funding
Start End
727529 DISC Double side contacted cells with innovative carrier-selective contacts
Silicon general RIA 4,743,519
01/10/2016 30/09/2019
657270 EpiSil-IBC Epitaxial silicon foil solar cells with interdigitated back contacts
Silicon general MSCA-IF-EF-ST
160,800
01-11-2015 31-10-2017
658391 NeutronOPV New neutron techniques to probe bulk heterojunction solar cells with graded morphologies – understanding the link between processing, nanostructure and device performance
Silicon general MSCA-IF-EF-ST
195,455
01-07-2015 30-06-2017
727523 NextBase Next-generation interdigitated back-contacted silicon heterojunction solar cells and modules by design and process innovations
Silicon general RIA 3,800,421
01/10/2016 30/09/2019
684528 PVFINAL Photo Voltaic Fully Integrated and Automated Line
Silicon general SME-1 50,000
01-07-2015 31-12-2015
745601 AMPERE Automated photovoltaic cell and Module industrial Production to regain and secure European Renewable Energy market
Silicon general IA 14,952,065
01/05/2017 30/04/2020
701254 GreenChalcoCell Green and sustainable chalcopyrite and kesterite nanocrystals for inorganic solar cells
various general MSCA-IF-EF-ST
171,461
11-07-2016 17-07-2018
655039 NANOSOLAR HYBRID QUANTUM-DOT/TWO-DIMENSIONAL MATERIALS PHOTOVOLTAIC CELLS
various general MSCA-IF-EF-ST
158,122
02-06-2015 01-06-2017
655852 Quokka Maturation
A mature Quokka for everyone – advancing the capabilities and accessibility of numerical solar cell simulations
various general MSCA-IF-EF-ST
171,461
01-02-2016 31-01-2018
743419 SpinSolar Characterisation method for spin-dependent processes in solar energy technology
various general MSCA-IF-EF-ST
159,461
01-11-2017 31-10-2019
881226 ETC Solarshade Invisible metal contacts for solar cells – boosting power output while cutting costs
various general SME-2 2,032,343
01-10-2019 30-09-2021
725165 HEINSOL Hierarchically Engineered Inorganic Nanomaterials from the atomic to supra-nanocrystalline level as a novel platform for SOLution Processed SOLar cells
various general ERC-COG 2,486,865
01-02-2017 31-01-2022
795206 MolDesign Molecule design for next generation solar cells using machine learning approaches trained on large scale screening databases
various general MSCA-IF-GF
227,166
01-04-2018 31-03-2021
820789 OLEDSOLAR Innovative manufacturing processes and in-line monitoring techniques for the OLED and thin film and organic photovoltaic industries (CIGS and OPV)
various general RIA 7,872,870
01-10-2018 30-09-2021

74
Id Acronym Title Main PV Tech.
Application Project Type
EU Funding
Start End
795079 PhotSol Towards the Photonic Solar Cell - In-Situ Defect Characterization in Metal-Halide Perovskites
various general MSCA-IF-EF-ST
159,461
01-07-2019 30-06-2021
832606 PISCO Photochromic Solar Cells: Towards Photovoltaic Devices with Variable and Self-Adaptable Optical Transmission
various general ERC-ADG 2,497,742
01-09-2019 31-08-2024
647281 SOLACYLIN A preparative approach to geometric effects in innovative solar cell types based on a nanocylindrical structure
various general ERC-COG 1,938,655
01-09-2015 31-08-2020
825142 ZeroR Resistance-free charge spreading for LEDs and solar cells
various general ERC-POC 150,000
01-01-2019 30-06-2020
674502 HySolarKit Converting conventional cars into hybrid and solar vehicles
Silicon integrated apps
SME-1 50,000
01-05-2015 31-10-2015
762726 PLATIO Innovative outdoor solar and kinetic energy harvesting pavement system
silicon integrated apps
SME-1 50,000
01-01-2017 30-04-2017
718003 SolardeSaLt A Renewable Approach for Industrial Water Desalination by using Hybrid Photovolt
Silicon integrated apps
SME-1 50,000
01-02-2016 31-05-2016
878182 ESMOS Efficient, Safe and Multi-Functional Operation of Solar-Roads
Silicon integrated apps
SME-1 50,000
01-08-2019 31-01-2020
850275 HORIZON Redefining solar technology with retractable solar power folding roofs. Unlocking photovoltaics for waste water treatment plants towards self-sufficient plants.
Silicon integrated apps
SME-2 2,488,125
01-03-2019 28-02-2021
728894 CDRONE Towards un-subsidised solar power – Cleandrone, the inspection and cleaning solution
N/A O&M SME-1 50,000
01-06-2016 30-11-2016
790316 DeepSolar Artificial Intelligence-based diagnostic system for Solar PV Plants
N/A O&M SME-1 50,000
01-12-2017 31-03-2018
886287 SecureTracker New-generation bifacial solar tracker with integrated wind protection system for large scale photovoltaic arrays
Silicon O&M SME-1 50,000
01-11-2019 31-03-2020
686116 OptiNanoPro Processing and control of novel nanomaterials in packaging, automotive and solar panel processing lines
various O&M IA 5,516,910
01/10/2015 30/09/2018
651970 POLYSOLAR A light weight, recyclable, tracking support system, for solar photovoltaic modules based on inflatable polymer membranes
various O&M SME-1 50,000
01-10-2014 31-03-2015
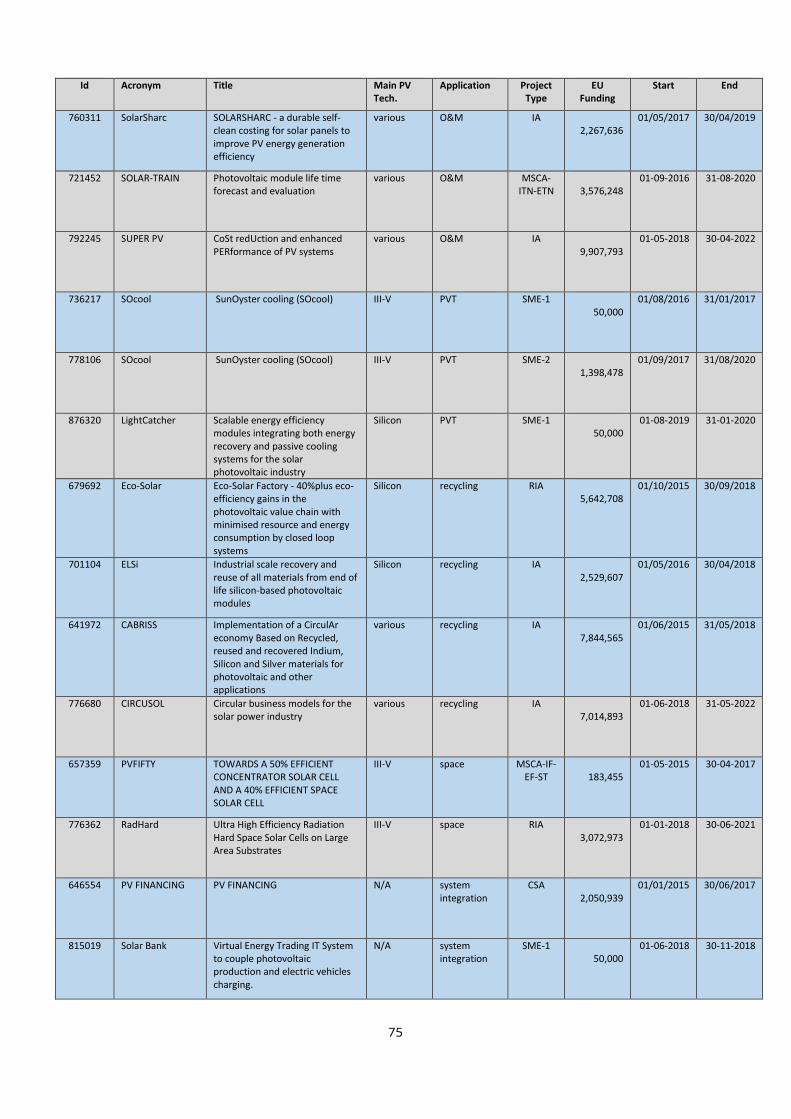
75
Id Acronym Title Main PV Tech.
Application Project Type
EU Funding
Start End
760311 SolarSharc SOLARSHARC - a durable self-clean costing for solar panels to improve PV energy generation efficiency
various O&M IA 2,267,636
01/05/2017 30/04/2019
721452 SOLAR-TRAIN Photovoltaic module life time forecast and evaluation
various O&M MSCA-ITN-ETN
3,576,248
01-09-2016 31-08-2020
792245 SUPER PV CoSt redUction and enhanced PERformance of PV systems
various O&M IA 9,907,793
01-05-2018 30-04-2022
736217 SOcool SunOyster cooling (SOcool) III-V PVT SME-1 50,000
01/08/2016 31/01/2017
778106 SOcool SunOyster cooling (SOcool) III-V PVT SME-2 1,398,478
01/09/2017 31/08/2020
876320 LightCatcher Scalable energy efficiency modules integrating both energy recovery and passive cooling systems for the solar photovoltaic industry
Silicon PVT SME-1 50,000
01-08-2019 31-01-2020
679692 Eco-Solar Eco-Solar Factory - 40%plus eco-efficiency gains in the photovoltaic value chain with minimised resource and energy consumption by closed loop systems
Silicon recycling RIA 5,642,708
01/10/2015 30/09/2018
701104 ELSi Industrial scale recovery and reuse of all materials from end of life silicon-based photovoltaic modules
Silicon recycling IA 2,529,607
01/05/2016 30/04/2018
641972 CABRISS Implementation of a CirculAr economy Based on Recycled, reused and recovered Indium, Silicon and Silver materials for photovoltaic and other applications
various recycling IA 7,844,565
01/06/2015 31/05/2018
776680 CIRCUSOL Circular business models for the solar power industry
various recycling IA 7,014,893
01-06-2018 31-05-2022
657359 PVFIFTY TOWARDS A 50% EFFICIENT CONCENTRATOR SOLAR CELL AND A 40% EFFICIENT SPACE SOLAR CELL
III-V space MSCA-IF-EF-ST
183,455
01-05-2015 30-04-2017
776362 RadHard Ultra High Efficiency Radiation Hard Space Solar Cells on Large Area Substrates
III-V space RIA 3,072,973
01-01-2018 30-06-2021
646554 PV FINANCING PV FINANCING N/A system integration
CSA 2,050,939
01/01/2015 30/06/2017
815019 Solar Bank Virtual Energy Trading IT System to couple photovoltaic production and electric vehicles charging.
N/A system integration
SME-1 50,000
01-06-2018 30-11-2018

76
Id Acronym Title Main PV Tech.
Application Project Type
EU Funding
Start End
649997 Solar Bankability Improving the Financeability and Attractiveness of Sustainable Energy Investments in Photovolatics: Quantifying and Managing the Technical Risk for Current and New Business Models
N/A system integration
CSA 1,355,106
01/03/2015 28/02/2017
764805 EU HEROES EU routes for High pEnentration of solaR PV into lOcal nEtworkS
N/A system integration
CSA 1,230,558
01-09-2017 31-08-2020
764452 iDistributedPV Solar PV on the Distribution Grid: Smart Integrated Solutions of Distributed Generation based on Solar PV, Energy Storage Devices and Active Demand Management
N/A system integration
CSA 2,706,940
01-09-2017 29-02-2020
764786 PV-Prosumers-4Grid
Development of innovative self-consumption and aggregation concepts for PV Prosumers to improve grid load and increase market value of PV
N/A system integration
CSA 2,501,739
01-10-2017 31-03-2020

77
Appendix 4 Listing of SOLAR-ERANET Projects (status 2019)
ACRONYM & TITLE COORDINATOR STATUS
ACCESS-CIGS - Atmospheric Cost Competitive Elemental Sulpho-Selenisation for CIGS
Helmholtz-Zentrum Berlin für Materialien und Energie (DE)
Completed
AER II - Industrialization and System Integration of the Aesthetic Energy Roof Concept
AERspire B.V. (NL) Completed
ALCHEMI - A Low Cost, High Efficiency, Optoelectronic HCPV Module for 1000 Sun Operation
IQE plc (UK) Running (2019)
APPI - Atmospheric Pressure Processing for Industrial Solar Cells
Fraunhofer Institut für Solare Energiesysteme (DE)
Completed
Bifalo - Bifacial PV modules for lowest levelized cost of energy
International Solar Energy Research Center (ISC) Konstanz e.V. (DE)
Running (2019)
BIPVpod - Building Integrated Photovoltaics panels on demand
DLR-Institut für Vernetzte Energiesysteme e. V. (DE)
Running (2019)
BLACK - Black Silicon and Defect Engineering for Highly Efficient Solar Cells and Modules
Aalto University (Aalto) (FI) Completed
CNT-PV - Carbon Nanotube Hole-Transporting and Collecting Layers for Semi-Transparent, Flexible and Low-Cost Solid-State Photovoltaic Cells
Uppsala University (SE) Completed
Cost-Effective Moisture Protection Empa – Swiss Federal Laboratories for Materials Science and Technology (CH)
Completed
DINAMIC - Dilute Nitride Based Concentrator Multijunction Solar Cells, with Efficiencies Over 47%
IQE plc (UK) Running (2019)
DURACIS - Advanced Global Encapsulation Solutions for Long Term Stability in Industrial Flexible Cu(In,Ga)Se2 Photovoltaic Technology
Fundació Institut de Recerca de l’Energia de Catalunya (ES)
Running (2019)
Enhance - Enhanced Rooftop PV Integration through Kinetic Storage and Wide Erea Monitoring
University of Cyprus (CY) Running (2019)
FrontCIGS - Re-Designing Front Window in Flexible CIGS Modules for
Empa – Swiss Federal Laboratories for Materials Science and Technology (CH)
Completed
FunGlass – Multi-Functional Glass for PV Application Fraunhofer Center for Silicon-Photovoltaics CSP (DE)
Completed
HESiTSC - High efficiency silicon based tandem solar cell PV module
Royal Institute of Technology-KTH (SE) Completed
HESTPV - High-Efficiency and Stable Tin-Based Perovskite Solar Cells
Universitat de València Estudi General (ES)
Running (2019)
HighCast - High Performance Silicon Casting and Wafering
Karlstad University (SE) Completed
HIPER - High-Efficiency Si Perovskite Tandem Solar Cells
Universitat de València Estudi General (ES)
Completed
HIPPO - High-Efficiency Poly-Si Passivated Contact Solar Cells and Modules
Fraunhofer Institute for Solar Energy Systems ISE (DE)
Running (2019)
Hvolt-PV - High voltage IBC photovoltaic i-Cells and modules
S’Tile SA (FR) Completed
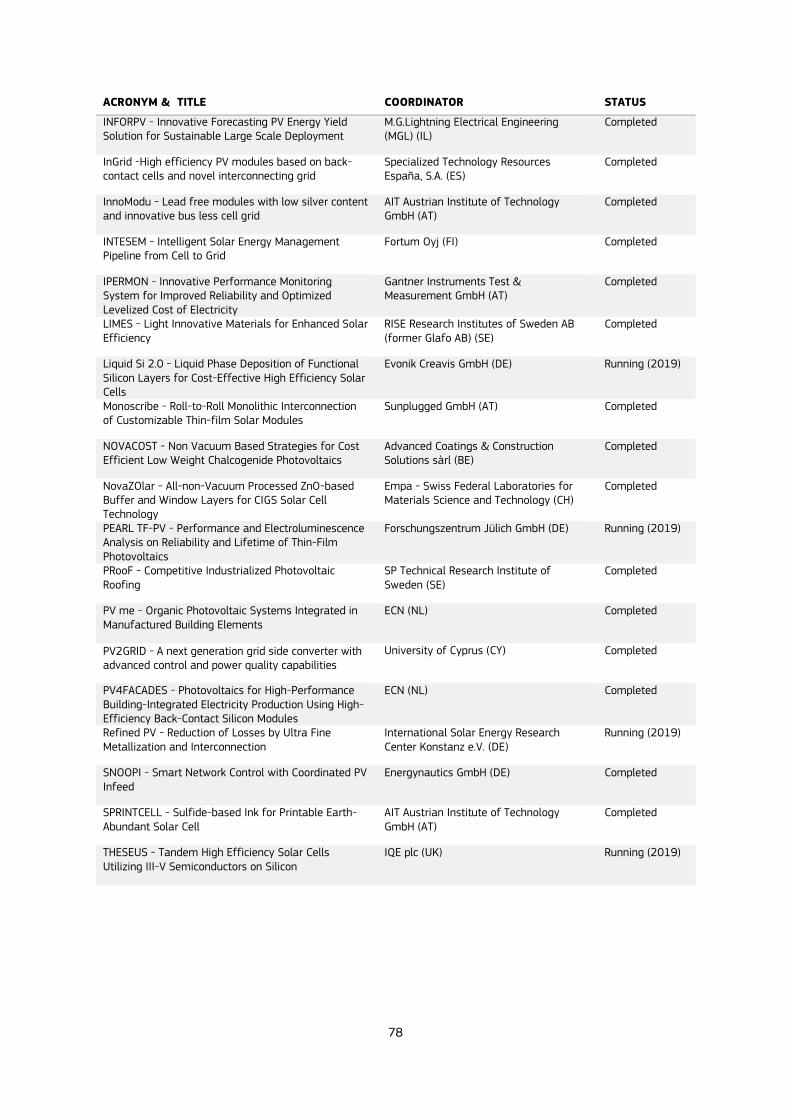
78
ACRONYM & TITLE COORDINATOR STATUS
INFORPV - Innovative Forecasting PV Energy Yield Solution for Sustainable Large Scale Deployment
M.G.Lightning Electrical Engineering (MGL) (IL)
Completed
InGrid -High efficiency PV modules based on back-contact cells and novel interconnecting grid
Specialized Technology Resources España, S.A. (ES)
Completed
InnoModu - Lead free modules with low silver content and innovative bus less cell grid
AIT Austrian Institute of Technology GmbH (AT)
Completed
INTESEM - Intelligent Solar Energy Management Pipeline from Cell to Grid
Fortum Oyj (FI) Completed
IPERMON - Innovative Performance Monitoring System for Improved Reliability and Optimized Levelized Cost of Electricity
Gantner Instruments Test & Measurement GmbH (AT)
Completed
LIMES - Light Innovative Materials for Enhanced Solar Efficiency
RISE Research Institutes of Sweden AB (former Glafo AB) (SE)
Completed
Liquid Si 2.0 - Liquid Phase Deposition of Functional Silicon Layers for Cost-Effective High Efficiency Solar Cells
Evonik Creavis GmbH (DE) Running (2019)
Monoscribe - Roll-to-Roll Monolithic Interconnection of Customizable Thin-film Solar Modules
Sunplugged GmbH (AT) Completed
NOVACOST - Non Vacuum Based Strategies for Cost Efficient Low Weight Chalcogenide Photovoltaics
Advanced Coatings & Construction Solutions sàrl (BE)
Completed
NovaZOlar - All-non-Vacuum Processed ZnO-based Buffer and Window Layers for CIGS Solar Cell Technology
Empa - Swiss Federal Laboratories for Materials Science and Technology (CH)
Completed
PEARL TF-PV - Performance and Electroluminescence Analysis on Reliability and Lifetime of Thin-Film Photovoltaics
Forschungszentrum Jülich GmbH (DE) Running (2019)
PRooF - Competitive Industrialized Photovoltaic Roofing
SP Technical Research Institute of Sweden (SE)
Completed
PV me - Organic Photovoltaic Systems Integrated in Manufactured Building Elements
ECN (NL) Completed
PV2GRID - A next generation grid side converter with advanced control and power quality capabilities
University of Cyprus (CY) Completed
PV4FACADES - Photovoltaics for High-Performance Building-Integrated Electricity Production Using High-Efficiency Back-Contact Silicon Modules
ECN (NL) Completed
Refined PV - Reduction of Losses by Ultra Fine Metallization and Interconnection
International Solar Energy Research Center Konstanz e.V. (DE)
Running (2019)
SNOOPI - Smart Network Control with Coordinated PV Infeed
Energynautics GmbH (DE) Completed
SPRINTCELL - Sulfide-based Ink for Printable Earth-Abundant Solar Cell
AIT Austrian Institute of Technology GmbH (AT)
Completed
THESEUS - Tandem High Efficiency Solar Cells Utilizing III-V Semiconductors on Silicon
IQE plc (UK) Running (2019)

79
Appendix 5 PV-Related Projects supported by KIC-Innoenergy
PROJECT SCOPE CONSORTIUM
Acronym Title Partners
BIPV-Insight
integrated software tool for performance prediction of BIPV and BAPV products.
Tecnalia, Enerbim, TFM Energía Solar Fotovoltaica, Bear Holding, BV, Université Bordeaux 1, Comsa Corporación
EFFIC A back-end interconnection system for thin-films CIGS
Meyer Burger, Centre for Concept in Mechatronics (CCM), TNO, ECN, Avancis
EnThiPV Product that measures the permeability of high and ultra high barrier materials used for thin-film PV
CEA, Amcor, Disatech, Vinci Technologies, ESADE, IREC, UPC, Tecnalia, KIT
Epicomm NEXWAFE’s kerfless wafer technology aims for a drop-in replacement for Cz silicon wafers
NexWafe, Fraunhofer ISE, ISC Konstanz, Ecosolifer
FASCOM Advanced concept of solar streetlight.
SIARQ, Sunplugged, Tecnalia, SECE
POWCELL Powder substrate based photovoltaic cell for thin-film crystalline silicon & 15 MW pilot line
S’tile, CEA, Karlsruher Institut für Technologie, INSA Lyon, SiLiMixt, Tesconsol

GETTING IN TOUCH WITH THE EU
In person
All over the European Union there are hundreds of Europe Direct information centres. You can find the address of the centre nearest you at: https://europa.eu/european-union/contact_en
On the phone or by email
Europe Direct is a service that answers your questions about the European Union. You can contact this service:
- by freephone: 00 800 6 7 8 9 10 11 (certain operators may charge for these calls),
- at the following standard number: +32 22999696, or
- by electronic mail via: https://europa.eu/european-union/contact_en
FINDING INFORMATION ABOUT THE EU
Online
Information about the European Union in all the official languages of the EU is available on the Europa website at: https://europa.eu/european-union/index_en
EU publications You can download or order free and priced EU publications from EU Bookshop at:
https://publications.europa.eu/en/publications. Multiple copies of free publications may be obtained by
contacting Europe Direct or your local information centre (see https://europa.eu/european-
union/contact_en).
KJ-BK-21-005-EN
-N
doi:10.2760/827685
ISBN 978-92-76-27274-8
The European Commission’s science and knowledge service
Joint Research Centre
JRC Mission
As the science and knowledge service
of the European Commission, the Joint
Research Centre’s mission is to support
EU policies with independent evidence
throughout the whole policy cycle.