euro baro metro
DESCRIPTION
Estudio europeoTRANSCRIPT

Special Eurobarometer 419
PUBLIC PERCEPTIONS OF SCIENCE, RESEARCH AND INNOVATION
REPORT
Fieldwork: June 2014
Publication: October 2014
This survey has been requested by the European Commission, Directorate-General for Research &
Innovation (DG RTD) and co-ordinated by the Directorate-General for Communication.
http://ec.europa.eu/public_opinion/index_en.htm
This document does not represent the point of view of the European Commission. The interpretations and opinions contained in it are solely those of the authors
Special Eurobarometer 419 / Wave EB81.5 – TNS Opinion & Social


Special Eurobarometer 419
Public perceptions of science, research and
innovation
Conducted by TNS opinion & social at the request of Directorate-General for Research &
Innovation
Survey co-ordinated by Directorate-General Communication
(DG COMM “Strategy, Corporate Communication Actions and Eurobarometer” Unit)


Project title
Special Eurobarometer 419 “Public perceptions of science, research and innovation”
Linguistic Version EN
Catalogue Number KI-02-14-982-EN-C
ISBN 978-92-79-40609-6
DOI 10.2777/95599
© European Union, 2014


SPECIAL EUROBAROMETER 419 “Public Perceptions of Science, Research
and Innovation”
1
TABLE OF CONTENTS
INTRODUCTION .................................................................................................. 2
EXECUTIVE SUMMARY ........................................................................................ 4
I. PERSONAL SCIENTIFIC BACKGROUND ...................................................... 6
II. PRIORITIES FOR SCIENCE AND TECHNOLOGICAL INNOVATION OVER THE
NEXT 15 YEARS ................................................................................................ 10
III. IMPACT OF PEOPLE'S ACTIONS AND BEHAVIOUR AND SCIENCE AND
TECHNOLOGICAL INNOVATION ON DIFFERENT AREAS OF ACTIVITY ............... 18
1.1. Fight against climate change ............................................................. 23
1.2. Protection of the environment .......................................................... 29
1.3. Security of citizens ............................................................................ 35
1.4. Job creation ...................................................................................... 40
1.5. Energy supply ................................................................................... 45
1.6. Health and medical care .................................................................... 51
1.7. Protection of personal data ............................................................... 56
1.8. Reduction of inequalities ................................................................... 62
1.9. Adaptation of society to an ageing population .................................. 67
1.10. Availability and quality of food .......................................................... 73
1.11. Transport and transport infrastructure ............................................. 79
1.12. Education & skills .............................................................................. 85
1.13. Quality of housing ............................................................................. 91
IV. THREE DIMENSIONAL ANALYSIS ON THE 13 AREAS ................................ 97
V. CONCLUSIONS ......................................................................................... 99
ANNEXES
Technical specifications
Questionnaire
Tables


SPECIAL EUROBAROMETER 419 “Public Perceptions of Science, Research
and Innovation”
2
INTRODUCTION
Fostering science and innovation is a central priority for the European Union, as Europe
advances further towards becoming a knowledge-based society and economy – and as
many of us recognise that science can help answer many of the problems facing the
world in the 21st century.
Through the EU Research and Innovation programme Horizon 2020, the European Union
has committed to spending nearly €80 billion on research and innovation over the next
seven years – a 30 percent increase on the amount spent on scientific research over the
preceding seven-year period, despite a slight reduction in the EU’s overall budget.1
A key objective of this research programme is to help address important societal
challenges that Europe is faced with.
This Special Eurobarometer report will help inform Horizon 2020 by providing insight on
which areas European citizens would like scientific research to focus on, so as to tackle
issues of most concern to them. More generally, this report will help inform forward
looking activities, including foresight, in the European Commission; in particular those
carried out by the Directorate-General for Research & Innovation, by the Bureau of the
European Policy Advisers and by the Chief Scientific Adviser to the President.
The survey first looks at the respondents’ own level of scientific education – whether they
have studied science or technology at school or elsewhere.
It then asks respondents which areas they would like science and innovation to prioritize
over the next 15 years, with areas such as job creation, health and medical care, energy
supply, education and skills, and the fight against climate change among the issues they
are asked to consider.
Having established which issues are seen as most deserving of emphasis, the
respondents then look at whether these issues can realistically be addressed both
through science and technological innovation, and also through people’s actions and
behaviour.
This survey was carried out by TNS Opinion & Social network in the 28 Member States of
the European Union between 14th and 26th of June 2014. Some 27,910 respondents from
different social and demographic groups were interviewed face-to-face at home in their
mother tongue on behalf of Directorate-General for Research & Innovation.
The methodology used is that of Eurobarometer surveys as carried out by the
Directorate-General for Communication (“Strategy, Corporate Communication Actions
and Eurobarometer” Unit)2. A technical note on the manner in which interviews were
conducted by the Institutes within the TNS Opinion & Social network is appended as an
annex to this report. Also included are the interview methods and confidence intervals3.
1 President Barroso's speech at the Euroscience Open Forum: http://europa.eu/rapid/press-release_SPEECH-14-487_en.htm 2 http://ec.europa.eu/public_opinion/index_en.htm 3 The results tables are included in the annex. It should be noted that the total of the percentages in the tables of this report may exceed 100% when the respondent has the possibility of giving several answers to the question.

SPECIAL EUROBAROMETER 419 “Public Perceptions of Science, Research
and Innovation”
3
Note: In this report, countries are referred to by their official abbreviation. The
abbreviations used in this report correspond to:
ABBREVIATIONS BE Belgium LV Latvia BG Bulgaria LU Luxembourg CZ Czech Republic HU Hungary DK Denmark MT Malta DE Germany NL The Netherlands EE Estonia AT Austria EL Greece PL Poland ES Spain PT Portugal FR France RO Romania
HR Croatia SI Slovenia IE Ireland SK Slovakia IT Italy FI Finland CY Republic of Cyprus*** SE Sweden LT Lithuania UK The United Kingdom EU28 European Union – 28 Member States EU15 BE, IT, FR, DE, LU, NL, DK, UK, IE, PT, ES, EL, AT, SE, FI*
NMS13 BG, CZ, EE, HR, CY, LT, LV, MT, HU, PL, RO, SI, SK**
* EU15 refers to the 15 countries forming the European Union before the enlargements of 2004, 2007 and
2013
** The NMS13 are the 13 ‘new Member States’ which joined the European Union during the 2004, 2007 and
2013 enlargements
*** Cyprus as a whole is one of the 28 European Union Member States. However, the ‘acquis communautaire’
has been suspended in the part of the country which is not controlled by the government of the Republic of
Cyprus. For practical reasons, only the interviews carried out in the part of the country controlled by the
government of the Republic of Cyprus are included in the ‘CY’ category and in the EU28 average.
* * * * *
We wish to thank the people throughout Europe who have given their time to take part in
this survey. Without their active participation, this study would not have been possible.

SPECIAL EUROBAROMETER 419 “Public Perceptions of Science, Research
and Innovation”
4
EXECUTIVE SUMMARY
Personal scientific background
More than half of Europeans have studied science or technology.
In 20 Member States an absolute majority of respondents say that they studied
science or technology, with over seven out of 10 respondents saying this in
Estonia (78%), Poland (76%) and the UK (71%); at the other end of the scale
respondents in Slovenia (27%), Slovakia (22%), and the Czech Republic (22%)
are the least likely to have studied science or technology.
People who finished their education at the age of 20 or over are more likely to
have studied science and technology than those who left school aged 15 or under,
by a margin of 75% to 24%.
Nearly two-thirds of people (64%) who consider themselves to be high up on the
social ladder studied science or technology, whereas less than half (47%) of those
who see themselves as low down on the social ladder have done so.
Priorities for science and technological innovation over the next 15 years
Health and medical care, and job creation are seen as the main priorities for
science and technological innovation over the next 15 years.
Job creation is mentioned as the first priority by most respondents in 16 Member
States, while health and medical care is the first priority in 10 countries (Belgium,
Czech Republic, Estonia, Luxembourg, Malta, Netherlands, Austria, Portugal,
Slovakia and United Kingdom).
In the other two countries, Denmark and Sweden, the fight against climate
change is considered the first priority for science and technological innovation.
Impact of society, science and technological innovation on different areas of
activity
Overall, respondents tend to be divided on the impact of people's actions and
behaviour on the various issues under discussion. On several issues and for
several countries, the proportion of the population expecting a negative impact is
close to the proportion of those expecting a positive impact.
More than four out of 10 respondents expect that, 15 years from now, people’s
actions and behaviour will have a positive impact on education and skills
(48%), the protection of the environment (46%), health and medical care (43%),
job creation (42%) and transport and transport infrastructure (41%).
When it comes to science and technological innovation, respondents’ views
are more consensual on expecting it to bring a positive impact in most of the
issues tested.

SPECIAL EUROBAROMETER 419 “Public Perceptions of Science, Research
and Innovation”
5
At least half of the respondents expect that, 15 years from now, science and
technological development will have a positive impact on health and medical
care (65%), education and skills (60%), transport and transport infrastructure
(59%), energy supply (58%), protection of the environment (57%), fight against
climate change (54%) and quality of housing (50%).
On most issues, respondents in all countries are more likely to think that positive
impacts can be achieved through science and innovation than through people’s
actions and behaviour. A notable exception is the reduction of inequalities, which
is seen in most countries as more of an area for human intervention.
There are clear national patterns in terms of the level of expectations that there
will be a positive impact on these issues. Respondents in the Nordic countries,
Ireland, Malta and Spain are noticeably optimistic that both science and
technological innovation and also people’s actions and behaviour can have a
positive impact, whereas relatively few respondents in Austria, Germany, Greece
and Italy are optimistic that positive impacts can be achieved through either
route.
Relationship between three separate attitudes of respondents: priorities for
science and technological innovation, expected impact of people’s actions and
behaviour on the different areas, expected impact of science and technological
innovation on the different areas
Health and medical care, education and skills and the protection of
environment represent a group of issues that respondents mention as being
among the main priorities for science and technological development and on
which, at the same time, respondents expect that science and technological
innovation and people's actions and behaviour, will have a positive impact, 15
years from now.
Job creation is also a high priority issue for respondents but a relatively small
proportion of respondents (compared to other areas) believe science and
technological innovation will have a positive impact on this area.
The reduction of inequalities is an issue for which very few respondents
believe that both science and technological innovation and people’s actions and
behaviour will have a positive impact. At the same time, the reduction of
inequalities is also among the least mentioned as a priority for science and
technological innovation.
Many respondents expect a positive impact from people’s actions and behaviour
and from science and technological innovation on transport and transport
infrastructure, but at the same time, it is an area which is considered by
respondents as a low priority for science and technological innovation.

SPECIAL EUROBAROMETER 419 “Public Perceptions of Science, Research
and Innovation”
6
I. PERSONAL SCIENTIFIC BACKGROUND
– More than half of Europeans have studied science or technology –
To evaluate their own experience in science, all respondents were asked whether they
have ever studied science or technology, and if so in what context. This assessment is
important throughout the report, as the impressions of respondents with a science
background are compared with those without any kind of scientific education.
A majority of Europeans (56%) say that they have studied science or technology. Over
four out of 10 (44%) studied these subjects at school, while 16% studied them at
university or college, and 3% studied them somewhere else.
(MULTIPLE ANSWERS POSSIBLE)
Base: All respondents in EU28 (N= 27,910)

SPECIAL EUROBAROMETER 419 “Public Perceptions of Science, Research
and Innovation”
7
In 20 Member States an absolute majority of respondents say that they studied science
or technology, with over seven out of 10 respondents saying this in Estonia (78%),
Poland (76%) and the UK (71%). At the other end of the scale, in Slovakia (22%), the
Czech Republic (22%) and Slovenia (27%) are the least likely to have studied science or
technology.
In eight countries, at least 50% of respondents say that they have studied science or
technology at school, with Poland (70%), Estonia (61%) and the UK (60%) having the
highest proportions of respondents who have done so. However, in the Netherlands less
than a tenth of respondents (7%) studied science or technology at school, with relatively
few also having done so in Slovakia (13%) and Denmark (14%).
Respondents in Sweden (33%), Latvia (32%), Lithuania (31%) and Estonia (30%) are
the most likely to have studied science or technology at university or college. At the
other end of the scale, less than a tenth have studied science in this context in the Czech
Republic (8%), Malta (8%) and Slovakia (9%).
In four Member States, respondents are most likely to have studied science or
technology at university or college: Sweden (33%), the Netherlands (26%), Denmark
(29%) and Slovenia (16%).

SPECIAL EUROBAROMETER 419 “Public Perceptions of Science, Research
and Innovation”
8
(MULTIPLE ANSWERS POSSIBLE)
Base: All respondents in EU28 (N= 27,910)

SPECIAL EUROBAROMETER 419 “Public Perceptions of Science, Research
and Innovation”
9
The socio-demographic data show that:
Men are more likely than women to have studied science or technology, by a
margin of 62% to 51%.
Younger respondents aged 15-24 years old are more likely than those aged 55
and over to have studied science and technology, by a margin of 76% to 41%.
People who finished their education at the age of 20 or over are more likely to
have studied science and technology than those who left school aged 15 or under,
by a margin of 75% to 24%.
Individuals who live in large towns are more likely to have studied science or
technology than people who live in rural villages (64% vs. 51%).
Nearly two-thirds of people (64%) who consider themselves to be high up on the
social ladder studied science or technology, whereas less than half (47%) of those
who see themselves as low down on the ladder have done so.
Base: All respondents in EU28 (N= 27,910)

SPECIAL EUROBAROMETER 419 “Public Perceptions of Science, Research
and Innovation”
10
II. PRIORITIES FOR SCIENCE AND TECHNOLOGICAL
INNOVATION OVER THE NEXT 15 YEARS
– Health and medical care, and job creation are seen as the main priorities for
science and technological innovation –
Respondents were asked what should be the priorities when it comes to science and
technological innovation over the next 15 years. They were given a list of 13 options, and
were asked to say what should be the first priority, and then the next priorities (for
which a maximum of four answers were allowed).
Health and medical care and job creation are by far the priorities most mentioned by the
respondents. Over half of them believe that health and medical care should be the main
priorities for science and technological innovation (55%) and around half of them think
that it should be job creation (49%).
A third of respondents consider that education and skills (33%) should be the main
priority, followed by the protection of the environment (30%), energy supply and the
availability and quality of food (both 25%), the security of citizens (24%), the reduction
of inequalities (23%) and the fight against climate change (22%).
Less than two in 10 respondents believe that the adaptation of society to an ageing
population (17%) should be the main priority and around one in 10 or less believe this
about the following areas: protection of personal data and quality of housing (both 11%),
and transport and transport infrastructure (9%). 5% of respondents are not able to
express their opinion on this matter.
However, looking at the first priority only, respondents are slightly more likely to answer
job creation (22%) than health and medical care (20%). Less than one in 10
respondents mentions as main priority any of the remaining 11 areas.

SPECIAL EUROBAROMETER 419 “Public Perceptions of Science, Research
and Innovation”
11
(MULTIPLE ANSWERS POSSIBLE)
Base: All respondents in EU28 (N= 27,910)

SPECIAL EUROBAROMETER 419 “Public Perceptions of Science, Research
and Innovation”
12
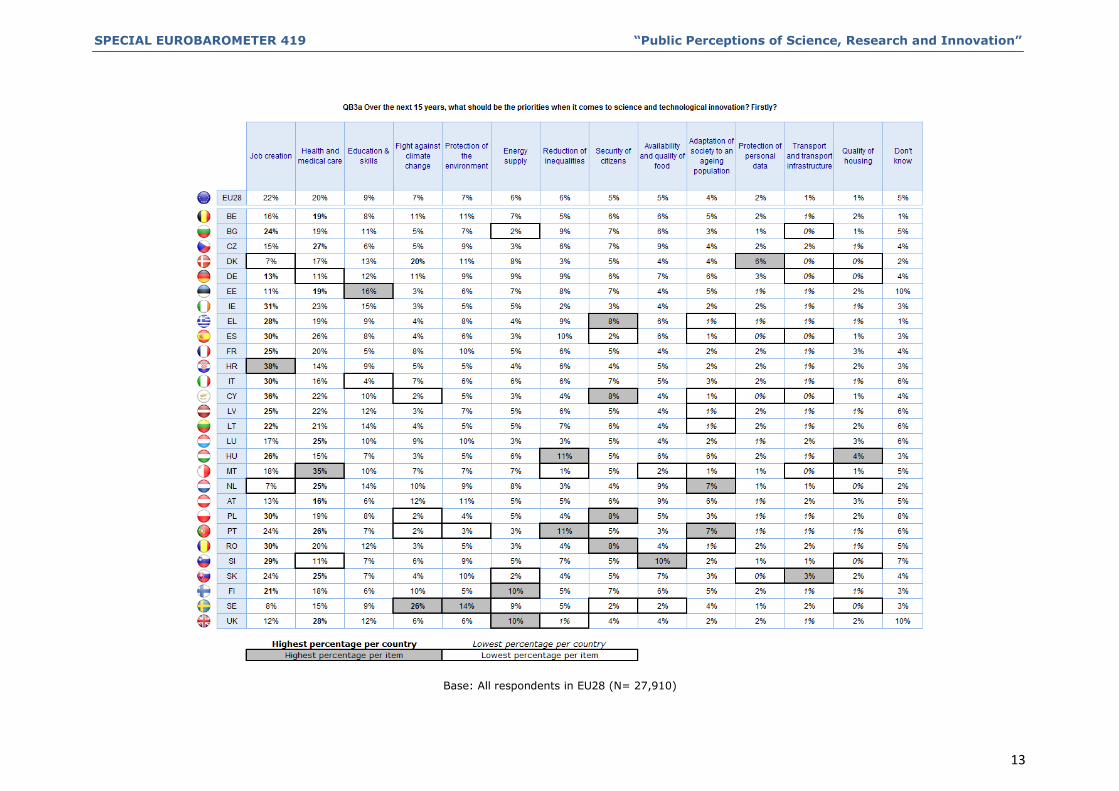
Job creation is seen as the first priority by most respondents in 16 Member States, while
health and medical care is the top priority in 10 countries (Belgium, Czech Republic,
Estonia, Luxembourg, Malta, Netherlands, Austria, Portugal, Slovakia and United
Kingdom). In the other two countries, Denmark and Sweden, the fight against climate
change is considered the first priority when it comes to science and technological
innovation.
Croatia (38%) has the highest proportion of respondents who think that job creation
should be the first priority, followed by Cyprus (36%) and Ireland (31%). However, only
7% of respondents in both Denmark and the Netherlands regard job creation as the top
priority when it comes to science and technological innovation.
Health and medical care is seen as the top priority by 35% of respondents in Malta, as
well as 28% of those in the UK and 27% in the Czech Republic. On the other side, only
11% of respondents in both Germany and Slovenia regard this area as a top priority for
science and technological development.
Sweden (26%) and Denmark (20%) have by far the highest proportion of respondents
who think that the fight against climate change should be the first priority.
SPECIAL EUROBAROMETER 419 “Public Perceptions of Science, Research and Innovation”
13
Base: All respondents in EU28 (N= 27,910)

SPECIAL EUROBAROMETER 419 “Public Perceptions of Science, Research
and Innovation”
14
When cumulating the answers about which areas should be the main priorities for science
and technological innovation over the next 15 years, health and medical care is the most
mentioned priority in 20 Member States (compared with only 10 when looking only at the
first choices). In the remaining eight Member States job creation is the area most
mentioned compared with 16 countries when only taking into account the first choices).
Spain (69%) has the highest proportion of respondents who think that health and
medical care should be a priority, followed by 65% in Cyprus and 64% in Greece and the
Netherlands. However, only 43% of respondents in Germany, and 44% in Italy, give this
answer.
Cyprus (69%), Croatia (68%) and Greece (65%) have the highest proportions of
respondents who identify job creation as a priority, whereas the Netherlands (26%) and
Denmark (28%) have the lowest.
Even though health and medical care and job creation are the most mentioned areas as
priorities in all countries, the survey provided also some other particular results at
country level:
more than half of the respondents think that education and skills are a priority in
Ireland (53%) and the Netherlands (52%),
over half of the respondents in Sweden (52%) consider that the fight against
climate change should be a priority when it comes to science and technological
innovation,
Sweden (45%) and Greece (44%) have the most respondents who think that the
protection of the environment should be a priority,
Germany (40%) has the most respondents who mention energy supply as a
priority,
a relatively high proportion of respondents in the Portugal (43%) think that the
reduction of inequalities should be a priority,
40% of respondents in Cyprus mention the security of citizens as a priority for
science and technological innovation,
39% in the Czech Republic mention the availability and quality of food.

SPECIAL EUROBAROMETER 419 “Public Perceptions of Science, Research and Innovation”
15
(MULTIPLE ANSWERS POSSIBLE)
Base: All respondents in EU28 (N= 27,910)

SPECIAL EUROBAROMETER 419 “Public Perceptions of Science, Research
and Innovation”
16
The socio-demographic data show that:
Women are more likely than men to cite health and medical care, both as the first
priority (22% vs. 17%), and as a general priority (58% vs. 52%).
Younger respondents are more likely to regard education and skills as a general
priority (40% for 15-24 year-olds vs. 29% for respondents aged 55 and over), as
well as the fight against climate change (25% vs. 20%) and protection of the
environment (33% vs. 27%). Older respondents are more inclined to think that
health and medical care (59% vs. 48%) and the adaptation of society to an
ageing population (21% vs. 11%) should be priorities.
Respondents who finished education aged 20 or over are more inclined than those
who left school aged 15 or under to view as priorities the fight against climate
change (27% vs. 16%), protection of the environment (36% vs. 24%), and
education and skills (38% vs. 25%). Those with a lower level of education are
more likely to want to prioritise job creation (53% vs. 45%) and the security of
citizens (27% vs. 20%).

SPECIAL EUROBAROMETER 419 “Public Perceptions of Science, Research and Innovation”
17
(MULTIPLE ANSWERS POSSIBLE)
Base: All respondents in EU28 (N= 27,910)

SPECIAL EUROBAROMETER 419 “Public Perceptions of Science, Research
and Innovation”
18
III. IMPACT OF PEOPLE'S ACTIONS AND BEHAVIOUR AND
SCIENCE AND TECHNOLOGICAL INNOVATION ON DIFFERENT
AREAS OF ACTIVITY
This chapter of the report looks at what impact respondents feel that people’s actions
and behaviour, and also science and technological innovation, will have on the 13 areas
discussed in the previous section in 15 years from now on.
– More than four out of 10 respondents think that, 15 years from now, people’s
actions and behaviour will have a positive impact on five of the 13 areas
discussed –
More than four out of 10 respondents expect that, 15 years from now, people’s actions
and behaviour will have a positive impact on education and skills (48%), the protection
of the environment (46%), health and medical care (43%), job creation (42%) and
transport and transport infrastructure (41%).
For all of the other issues under consideration, with the exception of the protection of
personal data, at least three out of 10 respondents think that people’s actions and
behaviour will have a positive impact.
In four areas, more respondents think that people’s actions and behaviour will have a
positive impact than think it will have no impact or a negative impact. They are:
education and skills (48% positive impact vs. 36% no or negative impact), protection of
the environment (46% vs. 41%), health and medical care (43% vs. 42%), and job
creation (42% vs. 40%).
The protection of personal data is the only issue where more respondents think that
people’s actions and behaviour will have a negative impact than think it will have a
positive impact (30% vs. 28%).
It is worth mentioning that overall in all Member States, respondents had often difficulty
to express an opinion about the impact they expect that people’s actions and behaviour
will have on the different issues discussed, although this difficulty was felt to a different
degree depending on the Member State.
For instance, in the whole EU, 19% of respondents were not able to express any opinion
about the impact they expect people's actions and behaviour will have in the protection
of personal data; in Bulgaria, in particular, this proportion was of 29%.

SPECIAL EUROBAROMETER 419 “Public Perceptions of Science, Research
and Innovation”
19
Base: All respondents in EU28 (N= 27,910)

SPECIAL EUROBAROMETER 419 “Public Perceptions of Science, Research
and Innovation”
20
– At least half of the respondents think that, 15 years from now, science and
technological development will have a positive impact on seven of the 13 areas
discussed –
At least half of the respondents think that, 15 years from now, science and technological
innovation will have a positive impact on health and medical care (65%), education and
skills (60%), transport and transport infrastructure (59%), energy supply (58%),
protection of the environment (57%), the fight against climate change (54%) and the
quality of housing (50%).
On 11 out of 13 issues, more respondents think that science and technological innovation
will have a positive impact than those who think it will have no impact or a negative
impact. The two exceptions are the protection of personal data (37% positive impact vs.
47%% no or negative impact), and the reduction of inequalities (30% positive impact vs.
53%% no or negative impact).
As in the section above, respondents had difficulty to express an opinion about the
impact they expect that science and technological innovation will have on the different
issues discussed, although this difficulty was felt to a different degree depending on the
Member State.
For instance, in the whole EU, 17% of respondents were not able to express an opinion
about the impact they expect science and technological innovation will have in the
reduction of inequalities; in Malta, in particular, this proportion was of 28%.

SPECIAL EUROBAROMETER 419 “Public Perceptions of Science, Research
and Innovation”
21
Base: All respondents in EU28 (N= 27,910)
SPECIAL EUROBAROMETER 419 “Public Perceptions of Science, Research
and Innovation”
22
When comparing the opinion of respondents about the expected impact of people's
actions and behaviour with their opinion about the impact of science and technological
development, there are two noticeable results:
More respondents think that science and technological innovation will have a
positive impact on the various issues under discussion than think that people’s
actions and behaviour will have a positive impact, with only one exception: while
31% of respondents think that people’s actions and behaviour can have a positive
impact on the reduction of inequalities, only 30% think that science and
technological innovation can have a positive impact on this issue.
Overall, respondents tend to be divided on the impact of people's actions and
behaviour on the various issues under discussion. On several issues and for
several countries, the proportion of the population expecting a negative impact is
close to the proportion of those expecting a positive impact.
When it comes to science and technological innovation, respondents’ views
are more consensual on expecting it to have a positive impact on most of the
issues tested.
When it comes to whether people’s actions and behaviour will have a positive
impact, job creation ranks fourth, and energy supply ranks only ninth. But in
terms of whether science and technological innovation will have a positive impact,
these two items effectively switch positions, with energy supply ranking fourth,
and job creation ranking tenth.

SPECIAL EUROBAROMETER 419 “Public Perceptions of Science, Research
and Innovation”
23
1.1. Fight against climate change
In six countries at least half of the respondents think that people’s actions and behaviour
will have a positive influence on the fight against climate change, with respondents in
Sweden (67%) and Finland (60%) being the most likely to share this view. Greece (38%
vs. 33%) is the only country where more respondents think that people’s actions and
behaviour will have a negative impact than a positive impact on this issue. “No impact” is
the most common answer in the Czech Republic (35%), Croatia (33%) and Latvia
(31%).
The rates of ‘don’t know’ are relatively high in most of the Member States and in seven
of them at least two in 10 respondents give this answer with the highest proportion seen
in Estonia (26%).
Base: All respondents in EU28 (N= 27,910)
In contrast, in 19 countries at least half of the respondents think that science and
technological innovation will have a positive impact on the fight against climate change.
“Positive impact” is also the most common answer in all Member States. The proportion
of respondents who think science and technological innovation will have a positive impact
on this issue ranges from 82% in Sweden and 77% in Denmark, to 43% in both the
Czech Republic and Italy.
As above, Estonia is the country with the highest proportion of respondents who answer
‘don’t know’ (23%). In another five countries, at least two in 10 respondents give the
same answer.

SPECIAL EUROBAROMETER 419 “Public Perceptions of Science, Research
and Innovation”
24
Base: All respondents in EU28 (N= 27,910)
In all Member States, more respondents think that science and technological innovation
will have a positive impact on the fight against climate change than think that people’s
actions and behaviour will do so.
At EU level there is a 15 point gap, with 54% saying that science and technological
innovation will have a positive impact, and 39% saying that people’s actions and
behaviour will have a positive impact. A similar difference is seen in most individual
Member States. The gap is widest is Spain (71% vs. 49%) and Lithuania (59% vs. 37%),
and narrowest in Slovakia (47% vs. 38%), Malta (64% vs. 55%) and Romania (46% vs.
37%).

SPECIAL EUROBAROMETER 419 “Public Perceptions of Science, Research
and Innovation”
25
The impact on the fight against climate change
Base: All respondents in EU28 (N= 27,910)
Countries in which a relatively high proportion of respondents think that science and
technological innovation will have a positive impact on the fight against climate change
are also likely to have a relatively high number of respondents who think that people’s
actions and behaviour will have a positive impact. The Nordic countries stand out as the
group having relatively high proportions of respondents who think that both science and
technological innovation and also people’s actions and behaviour will have a positive
impact.
Socio-demographic analysis
Individuals with a higher level of education are more inclined to think that both
science and technological innovation and also people’s actions and behaviour will
have a positive impact on the fight against climate change. 45% of respondents
who left education aged 20 and over think that people’s actions and behaviour will
have a positive impact, versus 33% of respondents who left school aged 15 or
below. The margin of difference is 63% to 46% as to whether science and
technological innovation will have a positive impact on this area.
The proportion of respondents who say that people’s actions and behaviour will
have a positive impact on the fight against climate change also varies across
occupational groups. Managers (47%), students (43%), the self-employed and
other white collar workers (both 41%) are most likely to say that there will be a
positive impact.

SPECIAL EUROBAROMETER 419 “Public Perceptions of Science, Research
and Innovation”
26
Those who struggle to pay their bills most of the time are the least likely to
believe people’s actions will have a positive impact (30%), whilst more than four
in 10 of those who almost or never struggle are the most positive (43%). The
same pattern is observed for the impact of science and technological innovation
(52% vs. 58%).
Base: All respondents in EU28 (N= 27,910)

SPECIAL EUROBAROMETER 419 “Public Perceptions of Science, Research
and Innovation”
27
Base: All respondents in EU28 (N= 27,910)
Other analysis
Respondents who have studied science are more likely than those who have not
to think that people’s actions and behaviour (43% vs. 36%) and science and
technological innovation (59% vs. 49%) will have a positive impact on the fight
against climate change.
Respondents who think that people’s actions and behaviour will have a positive
impact on the fight against climate change are also likely to say that they will
have a positive impact on other areas. For example, 72% of those who say that
people’s impact on the environment will be positive also have the same view
about the fight against climate change. The same is also true for the impact of
science and technology (83%).
There is also a connection with the energy supply, where those who say that
people’s actions (69%) and science and technological innovation (78%) will have
a positive impact are also particularly likely to say the same about the fight
against climate change.

SPECIAL EUROBAROMETER 419 “Public Perceptions of Science, Research
and Innovation”
28
Base: All respondents in EU28 (N= 27,910)
Base: All respondents in EU28 (N= 27,910)

SPECIAL EUROBAROMETER 419 “Public Perceptions of Science, Research
and Innovation”
29
1.2. Protection of the environment
In nine Member States at least half of the respondents think that people’s actions and
behaviour will have a positive impact 15 years from now on the protection of the
environment, with the Nordic countries – Sweden (70%), Denmark (67%) and Finland
(65%) – again having the most respondents who take this view.
Portugal (34%) and Italy (35%) have the lowest proportions of respondents who
anticipate a positive impact, while Greece (38% negative vs. 37% positive) is once again
the only country where more respondents think that people’s actions and behaviour will
have a negative impact than a positive impact. Austria (32%) and Germany (30%) also
have a relatively high proportion of respondents who predict that people’s actions and
behaviour will have a negative impact on the protection of the environment.
At least one in 10 respondents in 21 Member States are not able to give an answer, with
the highest percentages in Slovenia (22%), Finland and Malta (both 20%).
Base: All respondents in EU28 (N= 27,910)
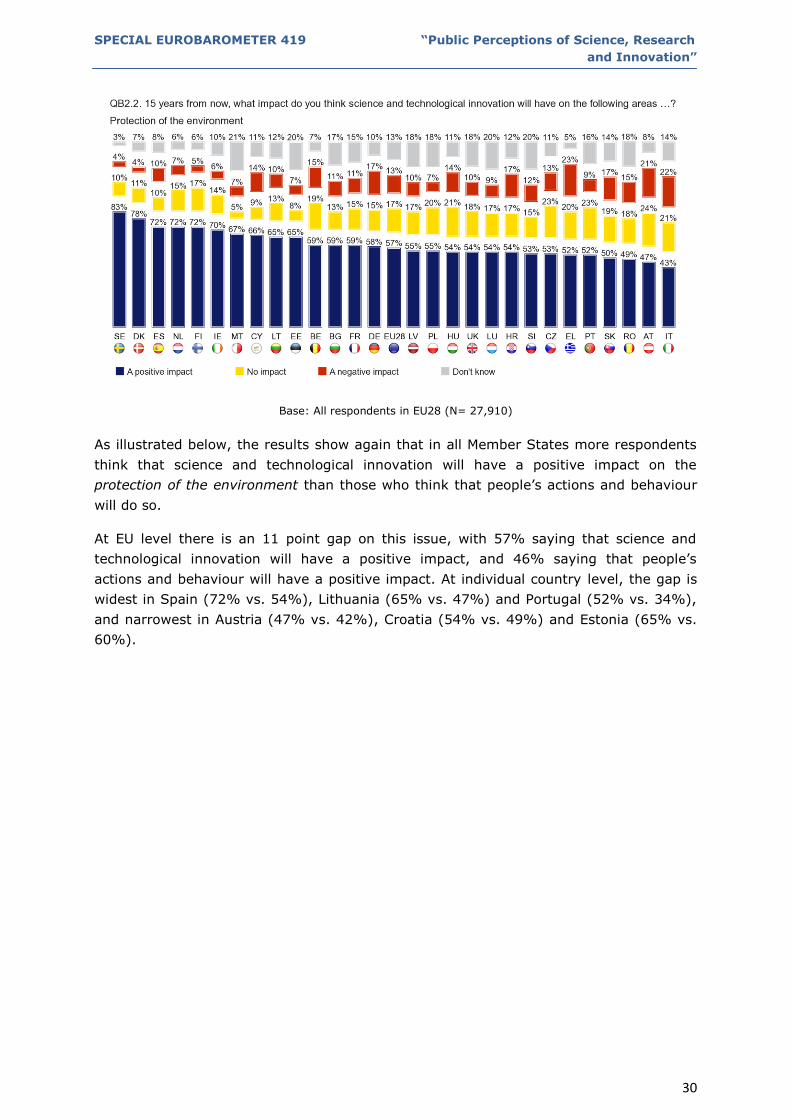
‘Positive impact’ is the most common answer in all Member States when it comes to the
impact of the science and technological innovation on the protection of the environment.
And in all but three countries at least 50% of respondents share this view, with the
highest proportions in Sweden (83%) and Denmark (78%).
Again, at least one in 10 respondents in 21 Member States don’t have an opinion on this
matter, with the highest levels of ‘don’t know’ recorded in Slovenia (22%), Malta and
Estonia (both 20%).
SPECIAL EUROBAROMETER 419 “Public Perceptions of Science, Research
and Innovation”
30
Base: All respondents in EU28 (N= 27,910)
As illustrated below, the results show again that in all Member States more respondents
think that science and technological innovation will have a positive impact on the
protection of the environment than those who think that people’s actions and behaviour
will do so.
At EU level there is an 11 point gap on this issue, with 57% saying that science and
technological innovation will have a positive impact, and 46% saying that people’s
actions and behaviour will have a positive impact. At individual country level, the gap is
widest in Spain (72% vs. 54%), Lithuania (65% vs. 47%) and Portugal (52% vs. 34%),
and narrowest in Austria (47% vs. 42%), Croatia (54% vs. 49%) and Estonia (65% vs.
60%).

SPECIAL EUROBAROMETER 419 “Public Perceptions of Science, Research
and Innovation”
31
The impact on the protection of the environment
Base: All respondents in EU28 (N= 27,910)
As before, it can be noticed that countries in which a relatively high proportion of
respondents think that science and technological innovation will have a positive impact
on the protection of the environment are also likely to have a relatively high number of
respondents who think that people’s actions and behaviour will have a positive impact.
The Nordic countries again stand out as having relatively high proportions of respondents
who think that both science and technological innovation and also people’s actions and
behaviour will have a positive impact.
Socio-demographic analysis
Respondents with a higher level of education are more likely to think that both
people’s actions and behaviour and also science and technological innovation will
have a positive impact on the protection of the environment. 53% of respondents
who finished their education aged 20 and over think that people’s actions and
behaviour will have a positive impact, compared with 38% of respondents who
left school aged 15 or below. The margin of difference is 66% to 49% as to
whether science and technological innovation will have a positive impact.

SPECIAL EUROBAROMETER 419 “Public Perceptions of Science, Research
and Innovation”
32
Respondents who never or almost never struggle to pay bills are most likely to
think that people’s actions (50%) and science and technological innovation (62%)
will have a positive impact on the protection of the environment. Equally, those
who do struggle are much less likely to have this opinion (34% and 46%
respectively).
Base: All respondents in EU28 (N= 27,910)
Base: All respondents in EU28 (N= 27,910)

SPECIAL EUROBAROMETER 419 “Public Perceptions of Science, Research
and Innovation”
33
Other analysis
Respondents who have studied science are more likely than those who have not
done so to think that both people’s actions and behaviour (50% vs. 41%) and
also science and technological innovation (62% vs. 52%) will have a positive
impact on the protection of the environment.
Respondents who think that people’s actions and behaviour, and also science and
technological innovation, will have a positive impact on the protection of the
environment are also likely to say that they will have a positive impact on other
areas. For example, 88% of respondents who expect science and technological
innovation to have a positive impact on the fight against climate change also say
that science and technological innovation will have a positive impact on the
protection of the environment (84% for people’s actions).
The same is true with regard to the energy supply.
Base: All respondents in EU28 (N= 27,910)

SPECIAL EUROBAROMETER 419 “Public Perceptions of Science, Research
and Innovation”
34
Base: All respondents in EU28 (N= 27,910)

SPECIAL EUROBAROMETER 419 “Public Perceptions of Science, Research
and Innovation”
35
1.3. Security of citizens
At least half of the respondents in just five Member States think that people’s actions and
behaviour will have a positive impact 15 years from now on the security of citizens,
namely Ireland (53%), Denmark (53%), Finland (52%), Estonia (52%) and Malta (50%).
On the other side of the scale, respondents in Germany (27%), Austria (28%), Slovenia
and Greece (both 29%) stand out as the least likely to think that people's actions and
behaviour will have a positive impact on the security of citizens, 15 years from now.
At least two in 10 respondents in eight countries could not answer this question, with the
highest levels of ‘don’t know’ recorded, again, in Estonia (26%), Malta and Slovenia
(both 25%). In the remaining 20 countries, at least one in 10 respondents gives this
answer.
Base: All respondents in EU28 (N= 27,910)
In contrast, in 14 countries at least half of the respondents think that science and
technological innovation will have a positive impact on the security of citizens, with
“positive impact” once again the most common answer in all Member States. The
proportion of respondents who believe that science and technological innovation will have
a positive impact on the security of citizens is highest in Finland (64%), Ireland (63%)
and Spain (63%), and lowest in Germany (33%), Austria (35%) and Italy (38%).
Besides Malta (25%) and, Estonia and Slovenia (both 23%), the rates of ‘don’t know’
were also high in Luxembourg (22%), Bulgaria (21%), and the United Kingdom and
Romania (both 20%).

SPECIAL EUROBAROMETER 419 “Public Perceptions of Science, Research
and Innovation”
36
Base: All respondents in EU28 (N= 27,910)
More respondents tend to say that science and technological innovation will have a
positive impact on the security of citizens than people’s actions and behaviour (45% vs.
35% at EU level).
Also, at country level respondents share this view, with the widest gap between the
positive impact of the science and technological innovation and people’s behaviour and
attitudes in Spain (63% vs. 43%), Portugal (50% vs. 30%) and Lithuania (62% vs.
46%), and narrowest in Estonia (58% vs. 52%), Germany (33% vs. 27%) and Malta
(56% vs. 50%).

SPECIAL EUROBAROMETER 419 “Public Perceptions of Science, Research
and Innovation”
37
The impact on the security of citizens
Base: All respondents in EU28 (N= 27,910)
A strong relation can be noticed between the proportion of respondents who think that
science and technological innovation will have a positive impact on the security of
citizens and the proportion who think that people’s actions and behaviour will have a
positive impact.
Socio-demographic analysis
Younger respondents are more likely than older respondents to think that there
will be positive impacts in this area. 41% of 15-24 year-olds think that people’s
actions and behaviour will have a positive impact on the security of citizens,
whereas only 32-33% of people aged 40 and over say this. The margin of
difference is 50% to 43-44% when it comes to whether science and technological
innovation will have a positive impact.
Respondents with a higher level of education are more likely to think that both
people’s actions and behaviour and also science and technological innovation will
have a positive impact on the security of citizens. 38% of people who left
education aged 20 and over think that people’s actions and behaviour will have a
positive impact on this area, as opposed to 29% of people who left school aged 15
or below. The margin of difference is 51% to 38% as to whether science and
technological innovation will have a positive impact.
Difficulties paying bills is also slightly related, where those who never or almost
never struggle to pay their bills are more likely to think that people’s actions
(36% vs 28% who struggle most of the time) and science and technological
innovation (48% vs. 38%) will have a positive impact on security.

SPECIAL EUROBAROMETER 419 “Public Perceptions of Science, Research
and Innovation”
38
Base: All respondents in EU28 (N= 27,910)
Base: All respondents in EU28 (N= 27,910)

SPECIAL EUROBAROMETER 419 “Public Perceptions of Science, Research
and Innovation”
39
Other analysis
Respondents who have studied science are more likely than those who have not
done so to think that both people’s actions and behaviour (38% vs. 31%) and
also science and technological innovation (50% vs. 40%) will have a positive
impact on the security of citizens.
Those who think that people’s actions (71%) and science and technological
innovation (79%) will have a positive impact on the protection of personal data
are also more likely to have similar views about the security of citizens.
Base: All respondents in EU28 (N= 27,910)
Base: All respondents in EU28 (N= 27,910)

SPECIAL EUROBAROMETER 419 “Public Perceptions of Science, Research
and Innovation”
40
1.4. Job creation
In 11 countries, more than half of the respondents expect that people’s actions and
behaviour will have a positive impact 15 years from now on job creation. Ireland (70%),
Denmark (67%), and Finland (64%) again have the most people who take this view,
while Austria (33%), Greece (33%) and Germany (34%) once again have the fewest.
However, on the issue of job creation there are no countries in which more respondents
anticipate a negative impact than a positive impact.
As seen in the previous sections, at least 20% of respondents in nine countries can’t give
an answer to this question, with the highest rate of ‘don’t know’ recorded in Malta
(26%).
Base: All respondents in EU28 (N= 27,910)
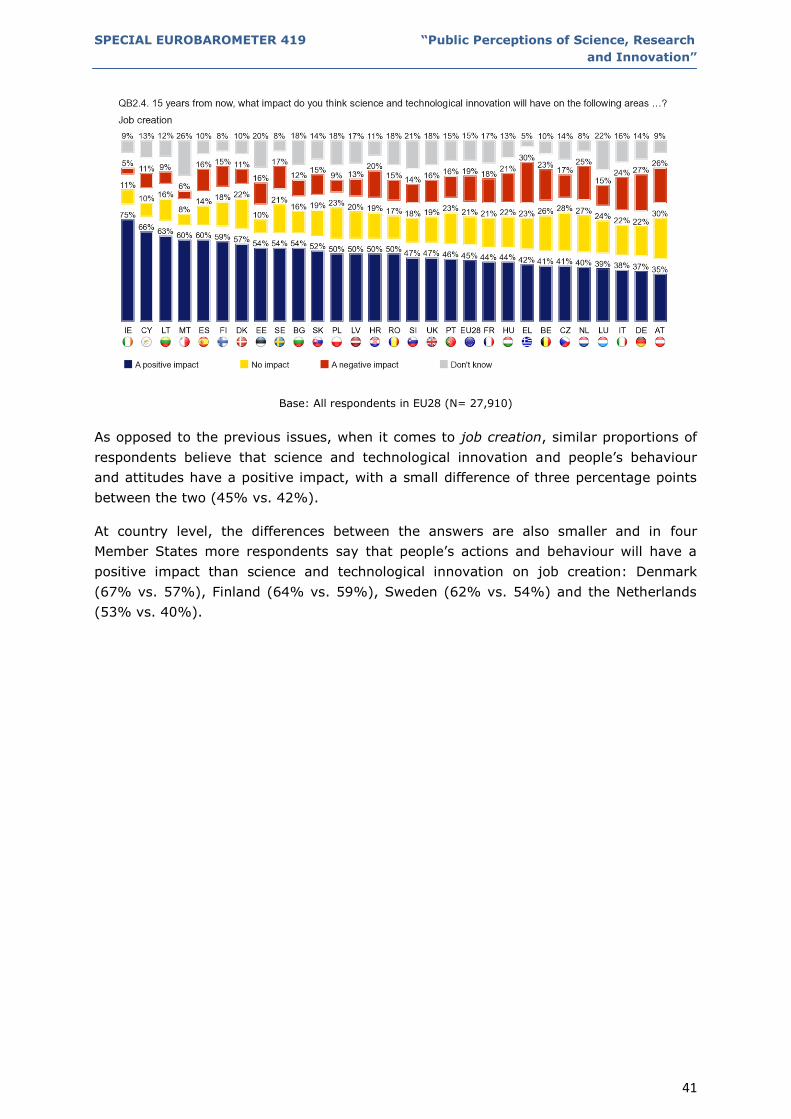
At least half of the respondents in 15 countries believe that science and technological
innovation will have a positive impact on job creation. The proportion of respondents who
believe that science and technological innovation will have a positive impact is highest in
Ireland (75%), Cyprus (66%) and Lithuania (63%), and lowest in Austria (35%),
Germany (37%), and Italy (38%).
At least 20% of respondents in four countries answer ‘don’t know’ to this question, again
the highest percentage being recorded in Malta (26%).
SPECIAL EUROBAROMETER 419 “Public Perceptions of Science, Research
and Innovation”
41
Base: All respondents in EU28 (N= 27,910)
As opposed to the previous issues, when it comes to job creation, similar proportions of
respondents believe that science and technological innovation and people’s behaviour
and attitudes have a positive impact, with a small difference of three percentage points
between the two (45% vs. 42%).
At country level, the differences between the answers are also smaller and in four
Member States more respondents say that people’s actions and behaviour will have a
positive impact than science and technological innovation on job creation: Denmark
(67% vs. 57%), Finland (64% vs. 59%), Sweden (62% vs. 54%) and the Netherlands
(53% vs. 40%).
SPECIAL EUROBAROMETER 419 “Public Perceptions of Science, Research
and Innovation”
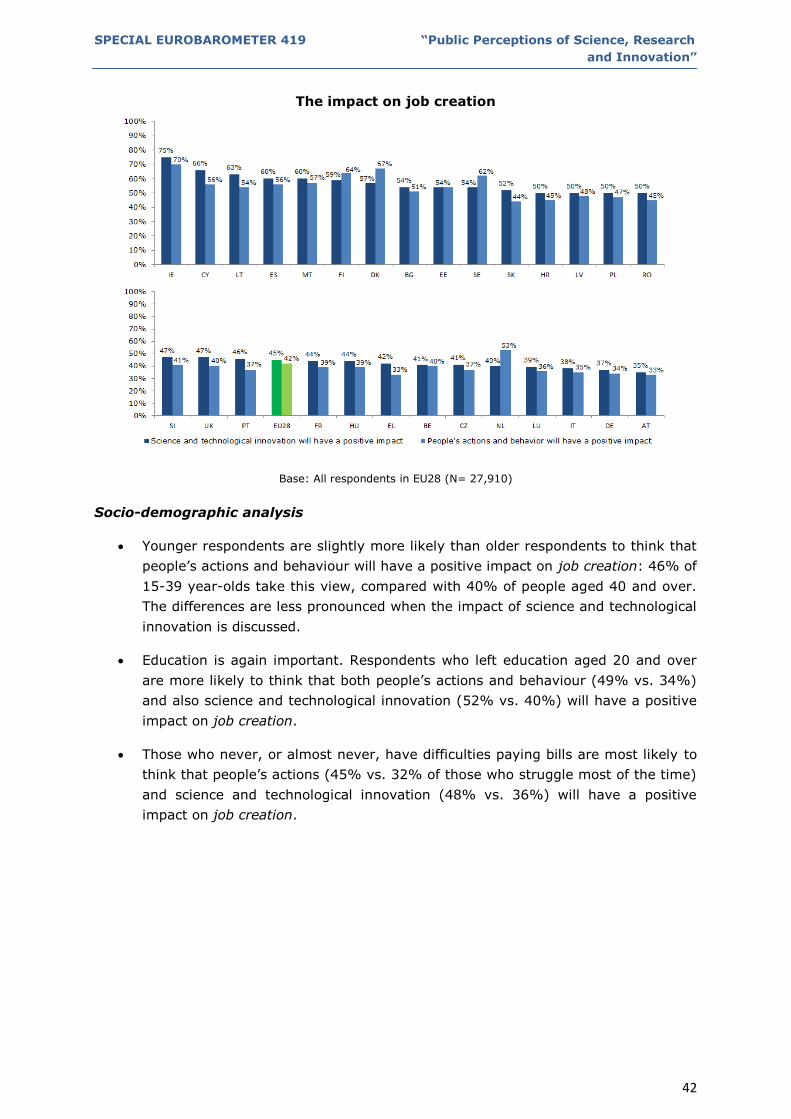
42
The impact on job creation
Base: All respondents in EU28 (N= 27,910)
Socio-demographic analysis
Younger respondents are slightly more likely than older respondents to think that
people’s actions and behaviour will have a positive impact on job creation: 46% of
15-39 year-olds take this view, compared with 40% of people aged 40 and over.
The differences are less pronounced when the impact of science and technological
innovation is discussed.
Education is again important. Respondents who left education aged 20 and over
are more likely to think that both people’s actions and behaviour (49% vs. 34%)
and also science and technological innovation (52% vs. 40%) will have a positive
impact on job creation.
Those who never, or almost never, have difficulties paying bills are most likely to
think that people’s actions (45% vs. 32% of those who struggle most of the time)
and science and technological innovation (48% vs. 36%) will have a positive
impact on job creation.

SPECIAL EUROBAROMETER 419 “Public Perceptions of Science, Research
and Innovation”
43
Base: All respondents in EU28 (N= 27,910)
Base: All respondents in EU28 (N= 27,910)

SPECIAL EUROBAROMETER 419 “Public Perceptions of Science, Research
and Innovation”
44
Other analysis
Respondents who have studied science are more likely than those who have not
done so to think that both people’s actions and behaviour (46% vs. 38%) and
science and technological innovation (50% vs. 41%) will have a positive impact
on job creation.
Respondents who think that people’s actions (68%) and science and technological
innovation (65%) will have a positive impact on education and skills are
particularly likely to have similar views about the impact on job creation.
Base: All respondents in EU28 (N= 27,910)
Base: All respondents in EU28 (N= 27,910)
SPECIAL EUROBAROMETER 419 “Public Perceptions of Science, Research
and Innovation”
45
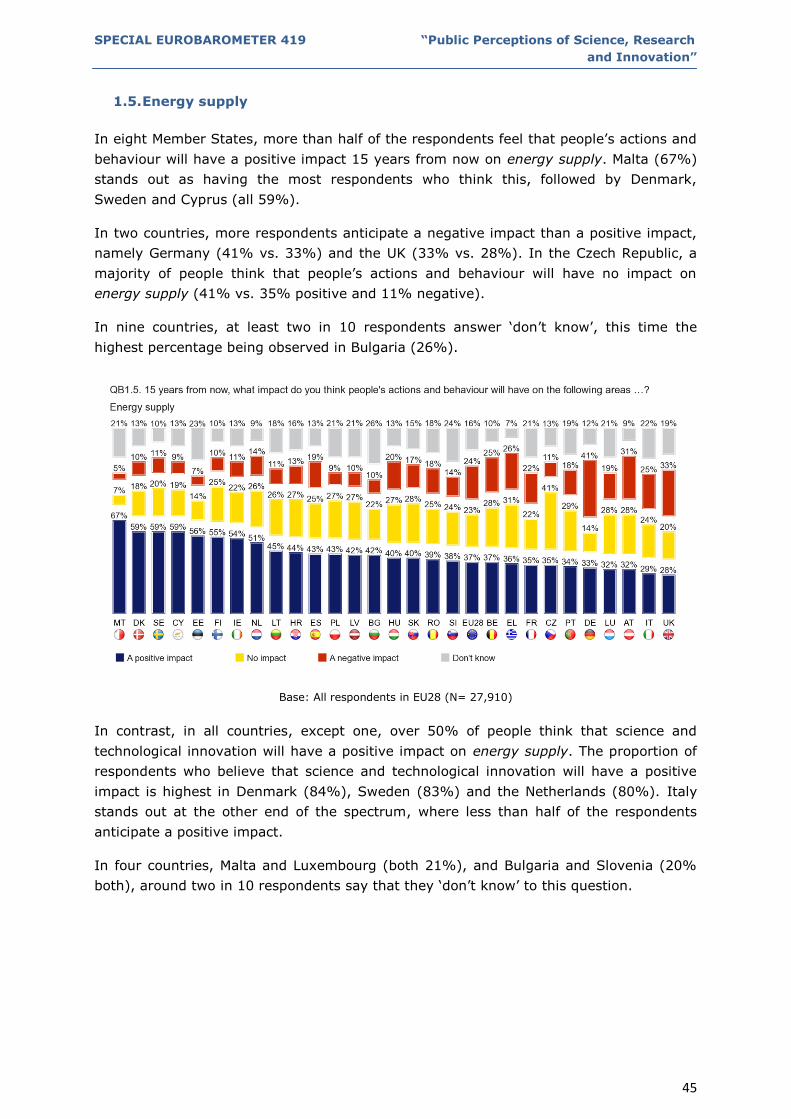
1.5. Energy supply
In eight Member States, more than half of the respondents feel that people’s actions and
behaviour will have a positive impact 15 years from now on energy supply. Malta (67%)
stands out as having the most respondents who think this, followed by Denmark,
Sweden and Cyprus (all 59%).
In two countries, more respondents anticipate a negative impact than a positive impact,
namely Germany (41% vs. 33%) and the UK (33% vs. 28%). In the Czech Republic, a
majority of people think that people’s actions and behaviour will have no impact on
energy supply (41% vs. 35% positive and 11% negative).
In nine countries, at least two in 10 respondents answer ‘don’t know’, this time the
highest percentage being observed in Bulgaria (26%).
Base: All respondents in EU28 (N= 27,910)
In contrast, in all countries, except one, over 50% of people think that science and
technological innovation will have a positive impact on energy supply. The proportion of
respondents who believe that science and technological innovation will have a positive
impact is highest in Denmark (84%), Sweden (83%) and the Netherlands (80%). Italy
stands out at the other end of the spectrum, where less than half of the respondents
anticipate a positive impact.
In four countries, Malta and Luxembourg (both 21%), and Bulgaria and Slovenia (20%
both), around two in 10 respondents say that they ‘don’t know’ to this question.

SPECIAL EUROBAROMETER 419 “Public Perceptions of Science, Research
and Innovation”
46
Base: All respondents in EU28 (N= 27,910)
Respondents consider that the positive impact of science and technological innovation is
much stronger than people’s actions and behaviour on the energy supply (58% vs.
37%).
In all Member States respondents generally share this view. In 14 countries a gap of
more than 20 percentage points is found between the positive impact of the science and
technological innovation and that of people’s actions and behaviour on the topic of
energy supply.
The impact on energy supply
Base: All respondents in EU28 (N= 27,910)
SPECIAL EUROBAROMETER 419 “Public Perceptions of Science, Research
and Innovation”
47
This time a mixture of Nordic and Southern European countries having relatively high
proportions of respondents who think that both science and technological innovation and
also people’s actions and behaviour will have a positive impact, with Ireland and Estonia
joining the Nordic countries, while the UK and Italy stand out as having relatively low
proportions of respondents who think that both science and technological innovation and
also people’s actions and behaviour will have a positive impact.
Socio-demographic analysis
Men are slightly more likely than women to think that both people’s actions and
behaviour (39% vs. 35%) and also science and technological innovation (61% vs.
55%) will have a positive impact on energy supply.
Younger respondents are slightly more likely than older respondents to think that
science and technological innovation will have a positive impact on energy supply:
61% of those aged 39 and under say this, compared with 54% of people aged 55
and over. The differences are less pronounced when looking at the impact of
people’s actions.
Education is once again an important factor. Respondents who left education aged
20 and over are more likely to think that both people’s actions and behaviour
(43% vs. 29%) and also science and technological innovation (69% vs. 47%) will
have a positive impact on energy supply.
Again, difficulties paying bills is closely related to respondent’s assessments.
Those who never or almost never have difficulties are more likely to think that
people’s actions (40% compared with 26% of those who struggle most of the
time) or science and technological innovation (62% vs. 50%) will have a positive
impact on the energy supply.

SPECIAL EUROBAROMETER 419 “Public Perceptions of Science, Research
and Innovation”
48
Base: All respondents in EU28 (N= 27,910)

SPECIAL EUROBAROMETER 419 “Public Perceptions of Science, Research
and Innovation”
49
Base: All respondents in EU28 (N= 27,910)
Other analysis
Respondents who have studied science are more inclined than those who have not
done so to believe that both people’s actions and behaviour (40% vs. 33%) and
also science and technological innovation (63% vs. 52%) will have a positive
impact on energy supply.
People who anticipate positive impacts on energy supply are also much more
likely to expect positive impacts in other areas as well:
o Those who think that people’s actions (65%) and science and technological
innovations (83%) will have a positive impact on the fight against climate
are also more likely to have similar views about the energy supply.
o A similar pattern is also witnessed for the protection of the environment
(63% for people’s actions and 81% for science and technological
innovations).

SPECIAL EUROBAROMETER 419 “Public Perceptions of Science, Research
and Innovation”
50
Base: All respondents in EU28 (N= 27,910)
Base: All respondents in EU28 (N= 27,910)

SPECIAL EUROBAROMETER 419 “Public Perceptions of Science, Research
and Innovation”
51
1.6. Health and medical care
In 13 countries, at least half of the respondents say that people’s actions and behaviour
will have a positive impact 15 years from now on health and medical care, 15 years from
now. Malta (72%) once again stands out as having the most respondents who think this,
followed by Denmark (67%) and Sweden (65%).
Italy (31%) and Slovenia (34%) have the fewest respondents who think that people’s
actions and behaviour will have a positive impact on health and medical care. There are
no countries in which more respondents anticipate a negative impact than a positive
impact, although Germany (31%) and Greece (28%) have relatively high proportions of
respondents who expect the impact to be negative.
At least one fifth of respondents in five countries are not able to give an answer:
Slovenia (24%), Latvia (22%), Estonia and Slovenia (both 21%), and Bulgaria (20%).
Base: All respondents in EU28 (N= 27,910)
In all countries – again, with the exception of Italy – more than half of the respondents
think that science and technological innovation will have a positive impact on health and
medical care. The proportion of respondents who believe that science and technological
innovation will have a positive impact is highest in the Netherlands (84%), Sweden
(83%) and Denmark (82%), and lowest in Italy (43%) and Slovenia (53%).
This time, only in Slovenia (21%) more than two in 10 respondents can’t give an answer
to this question.

SPECIAL EUROBAROMETER 419 “Public Perceptions of Science, Research
and Innovation”
52
Base: All respondents in EU28 (N= 27,910)
Again, more respondents consider that science and technological innovation will have a
positive impact on health and medical care than people’s actions and behaviour.
Respondents in all Member States share this view with a difference of more than 20
percentage points between the answers given for the impact of science and technological
innovation and people’s actions and behaviour in 10 countries. France is the country with
the widest gap on this issue, with a difference of 32 percentage points (72% vs. 40%).
The impact on the health and medical care
Base: All respondents in EU28 (N= 27,910)

SPECIAL EUROBAROMETER 419 “Public Perceptions of Science, Research
and Innovation”
53
Once again, there is a clear relationship between the proportion of respondents who
think that science and technological innovation will have a positive impact and the
proportion who think that people’s actions and behaviour will do so. However, there are
variations: France, for example, stands out as tending towards the side of science and
technological innovation, while Romania tends towards the side of people’s actions and
behaviour.
Socio-demographic analysis
Men are slightly more likely to think that science and technological innovation will
have a positive impact on health and medical care (68% vs. 63%). There is no
significant difference when looking at the impact of people’s actions.
15-24 year-olds are the most likely to think that people’s actions and behaviour
(52% vs. 38% of 40-54 year-olds) and science and technological innovation (70%
vs. 62% of people aged 55 and over) will have a positive impact on health and
medical care.
As is the case in all areas, a higher level of education equates to a higher
likelihood that the respondents will expect positive impacts.
Respondents who never or almost never struggle to pay their bills are more likely
than those who struggle most of the time to think that people’s actions (46% vs.
34%) and science and technological innovation (69% vs. 57%) will have a
positive impact on health and medical care.

SPECIAL EUROBAROMETER 419 “Public Perceptions of Science, Research
and Innovation”
54
Base: All respondents in EU28 (N= 27,910)
Base: All respondents in EU28 (N= 27,910)
SPECIAL EUROBAROMETER 419 “Public Perceptions of Science, Research
and Innovation”
55
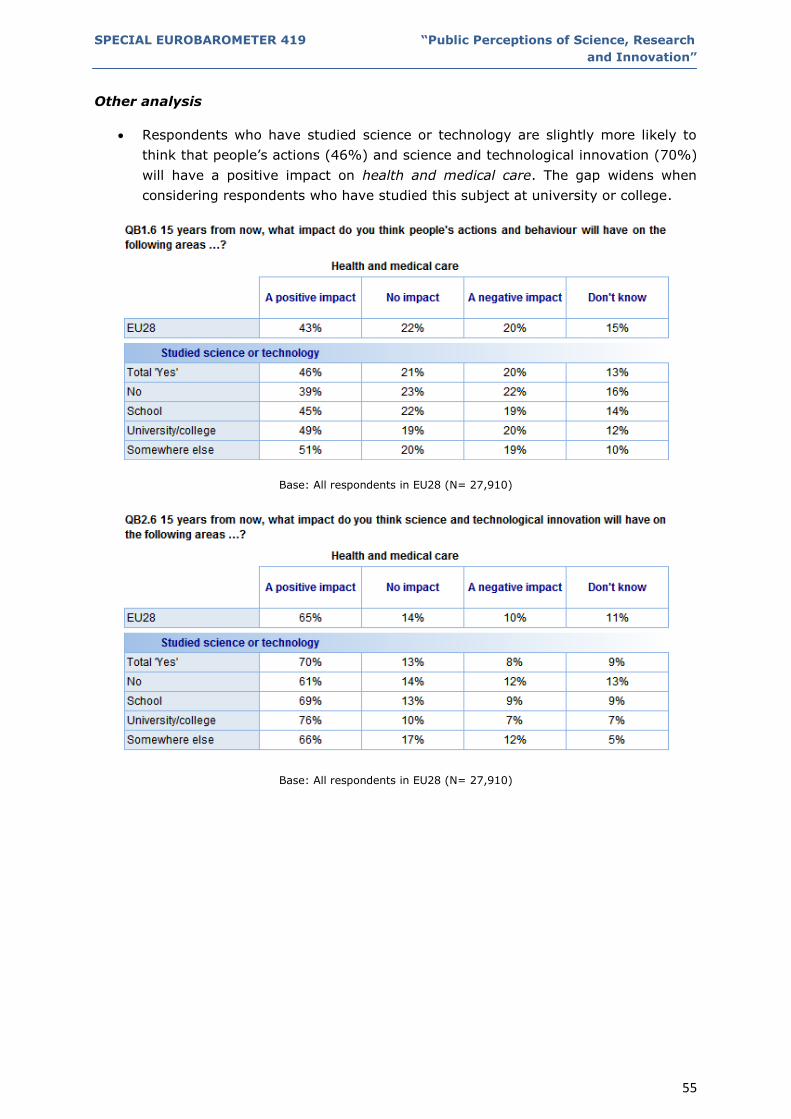
Other analysis
Respondents who have studied science or technology are slightly more likely to
think that people’s actions (46%) and science and technological innovation (70%)
will have a positive impact on health and medical care. The gap widens when
considering respondents who have studied this subject at university or college.
Base: All respondents in EU28 (N= 27,910)
Base: All respondents in EU28 (N= 27,910)

SPECIAL EUROBAROMETER 419 “Public Perceptions of Science, Research
and Innovation”
56
1.7. Protection of personal data
Over half of the respondents in just two countries – Ireland (53%) and Malta (51%) –
think that people’s actions and behaviour will have a positive impact on the protection of
personal data. In contrast, there are seven countries in which more people anticipate a
negative impact than a positive impact. Notable among these are Germany (52%
negative vs. 18% positive), Austria (45% vs. 21%), Greece (38% negative vs. 24%
positive), and the Netherlands (34% negative vs. 32% positive). A majority of
respondents think that people’s actions and behaviour will have no impact on the
protection of personal data in Italy (34% no impact, versus 21% positive and 22%
negative), the Czech Republic (34% vs. 30% and 21%), and Hungary (31% vs. 30% and
26%).
The levels of ‘don’t know’ are generally higher for this issue than for the previous six
already analysed. In two countries almost three in 10 respondents can’t answer this
question: Bulgaria (29%) and Malta (28%). In another 11 countries, at least 20% of
respondents say the same.
Base: All respondents in EU28 (N= 27,910)
As for the impact of the science and technological innovation on the protection of
personal data 15 years from now, in 10 countries, at least half of the respondents think
that it will have a positive impact. The proportion of respondents who believe that
science and technological innovation will have a positive impact is highest in Ireland
(64%), Lithuania (62%), Denmark (60%) and Finland (60%). In three Member States
more respondents anticipate a negative impact than a positive impact, namely Germany
(45% negative vs. 23% positive), Austria (38% vs. 26%), and Greece (36% vs. 29%).
The levels of 'don't know' are again particularly high for this question. Malta (27%) and
Bulgaria (24%) are the countries with the highest rates of ‘don’t know’, followed by
Estonia, Romania, Luxembourg and Slovenia (all 23%), Poland (21%), and the United
Kingdom and France (20%).

SPECIAL EUROBAROMETER 419 “Public Perceptions of Science, Research
and Innovation”
57
Base: All respondents in EU28 (N= 27,910)
The gap between the answers given for the positive impact of science and technology
people’s actions and behaviour on the protection of personal data (9 percentage points;
37% vs. 28%) is at a similar level as the gap in the security of citizens (10 pp) and
protection of the environment (11 pp).
The same trend is seen at country level, where only in Lithuania (62% vs. 40%) there is
a gap of more than 20 percentage points. For the above mentioned issues, there is not
such a difference for any of the countries.

SPECIAL EUROBAROMETER 419 “Public Perceptions of Science, Research
and Innovation”
58
The impact on the protection of personal data
Base: All respondents in EU28 (N= 27,910)
There is a strong relation between the proportion of respondents who think that science
and technological innovation will have a positive impact and the proportion who think
that people’s actions and behaviour will do so, although Lithuania stands out as having a
relatively higher number of people on the side of science and technological innovation.
Socio-demographic analysis
15-24 year-olds are somewhat more likely than people aged 55 and over to think
that science and technological innovation will have a positive impact on the
protection of personal data, by a margin of 41% to 35%.
Individuals with a higher level of education are more inclined to say that people’s
actions and behaviour (33% vs. 24%) and science and technological innovation
(44% vs. 31%) will have a positive impact on the protection of personal data.
Those who use the internet everyday are more likely to think that people’s actions
(31% vs. 25% who never use the internet) and science and technological
innovation (41% vs. 33%) will have a positive impact on the protection of
personal data.
Difficulties with paying bills is once again related but the difference is less
pronounced than in other areas. Generally, those who never or almost never
struggle to pay their bills are more likely than those who always struggle to think
that people’s actions (30% vs. 22%) and science and technological innovation
(39% vs. 31%) will have a positive impact on protecting personal data.

SPECIAL EUROBAROMETER 419 “Public Perceptions of Science, Research
and Innovation”
59
Base: All respondents in EU28 (N= 27,910)

SPECIAL EUROBAROMETER 419 “Public Perceptions of Science, Research
and Innovation”
60
Base: All respondents in EU28 (N= 27,910)
Other analysis
Respondents who have studied science are more likely than those who have not
done so to think that there will be positive impacts on the protection of personal
data from people’s behaviour (31% vs. 25%) and science and technological
innovation (41% vs. 33%).
Those who think that the impact of people’s actions (58%) on the security of
citizens will be positive are also more likely to hold similar views and the
protection of personal data. This difference widens to 65% vs. 9% when asked
about the impact of science and technological innovation.

SPECIAL EUROBAROMETER 419 “Public Perceptions of Science, Research
and Innovation”
61
Base: All respondents in EU28 (N= 27,910)
Base: All respondents in EU28 (N= 27,910)
SPECIAL EUROBAROMETER 419 “Public Perceptions of Science, Research
and Innovation”
62
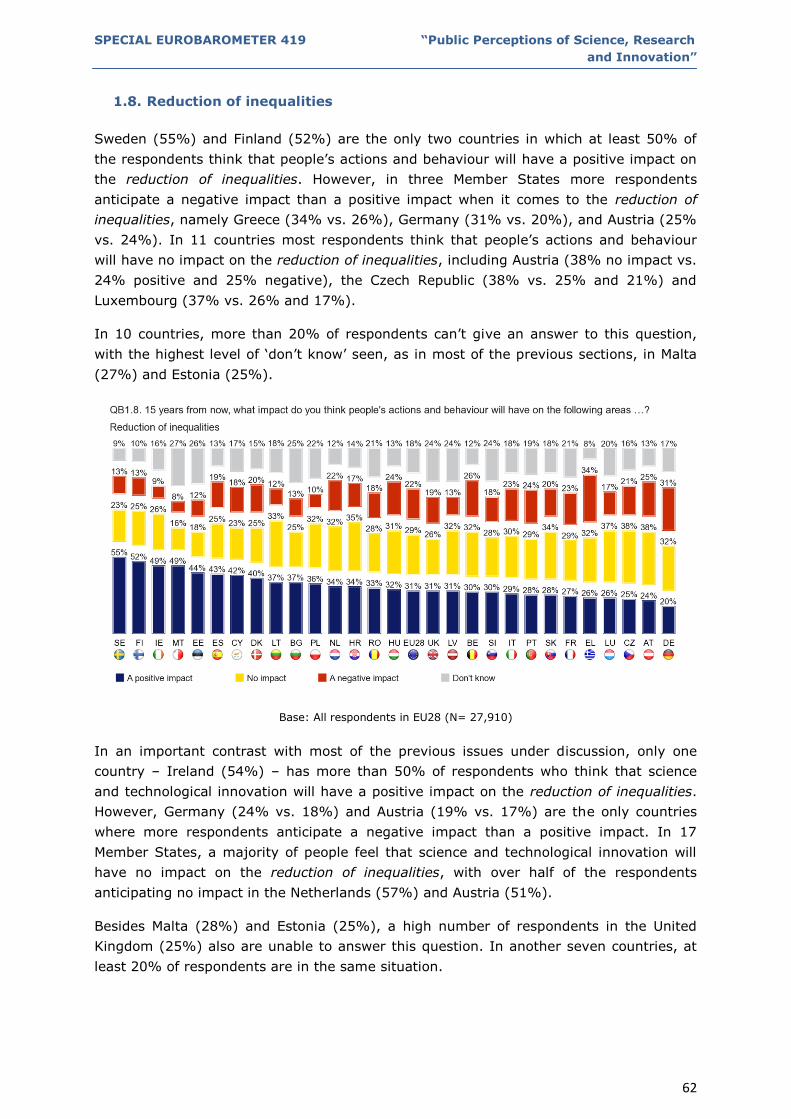
1.8. Reduction of inequalities
Sweden (55%) and Finland (52%) are the only two countries in which at least 50% of
the respondents think that people’s actions and behaviour will have a positive impact on
the reduction of inequalities. However, in three Member States more respondents
anticipate a negative impact than a positive impact when it comes to the reduction of
inequalities, namely Greece (34% vs. 26%), Germany (31% vs. 20%), and Austria (25%
vs. 24%). In 11 countries most respondents think that people’s actions and behaviour
will have no impact on the reduction of inequalities, including Austria (38% no impact vs.
24% positive and 25% negative), the Czech Republic (38% vs. 25% and 21%) and
Luxembourg (37% vs. 26% and 17%).
In 10 countries, more than 20% of respondents can’t give an answer to this question,
with the highest level of ‘don’t know’ seen, as in most of the previous sections, in Malta
(27%) and Estonia (25%).
Base: All respondents in EU28 (N= 27,910)
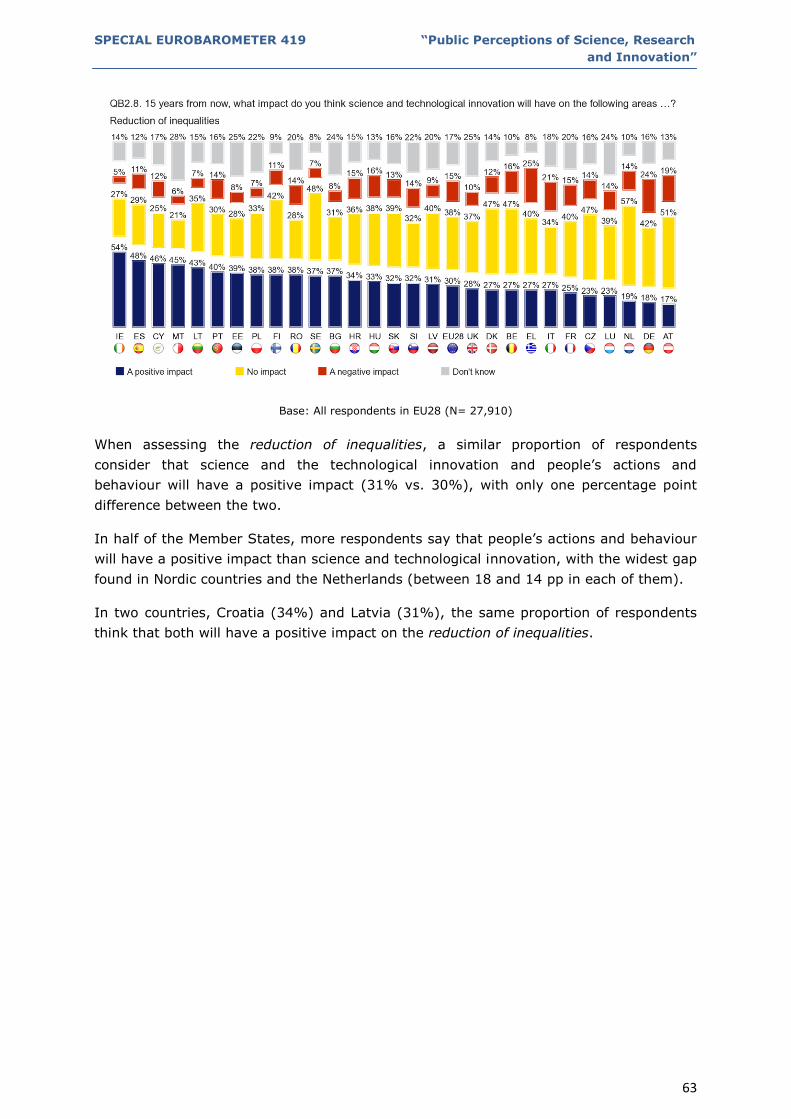
In an important contrast with most of the previous issues under discussion, only one
country – Ireland (54%) – has more than 50% of respondents who think that science
and technological innovation will have a positive impact on the reduction of inequalities.
However, Germany (24% vs. 18%) and Austria (19% vs. 17%) are the only countries
where more respondents anticipate a negative impact than a positive impact. In 17
Member States, a majority of people feel that science and technological innovation will
have no impact on the reduction of inequalities, with over half of the respondents
anticipating no impact in the Netherlands (57%) and Austria (51%).
Besides Malta (28%) and Estonia (25%), a high number of respondents in the United
Kingdom (25%) also are unable to answer this question. In another seven countries, at
least 20% of respondents are in the same situation.
SPECIAL EUROBAROMETER 419 “Public Perceptions of Science, Research
and Innovation”
63
Base: All respondents in EU28 (N= 27,910)
When assessing the reduction of inequalities, a similar proportion of respondents
consider that science and the technological innovation and people’s actions and
behaviour will have a positive impact (31% vs. 30%), with only one percentage point
difference between the two.
In half of the Member States, more respondents say that people’s actions and behaviour
will have a positive impact than science and technological innovation, with the widest gap
found in Nordic countries and the Netherlands (between 18 and 14 pp in each of them).
In two countries, Croatia (34%) and Latvia (31%), the same proportion of respondents
think that both will have a positive impact on the reduction of inequalities.

SPECIAL EUROBAROMETER 419 “Public Perceptions of Science, Research
and Innovation”
64
The impact on the reduction of inequalities
Base: All respondents in EU28 (N= 27,910)
This time there is less of a link between the proportion of respondents that people’s
actions and behaviour will have a positive impact on the reduction of inequalities and the
proportion who think that science and technological innovation will do so. The Nordic
countries, the Netherlands and Austria stand out in particular as having relatively low
numbers of respondents who think that science and technological innovation will have an
impact on this issue relative to people’s actions and behaviour.
Socio-demographic analysis
Generally, the younger respondents are, the more likely they are to think that
people’s actions and behaviour will have a positive impact on the reduction of
inequality. The difference is less significant when looking at the impact of science
and technological innovation.
Individuals with a higher level of education are more inclined to say that people’s
actions and behaviour (35% vs. 25%) will have a positive impact on the reduction
of inequalities. The same pattern applies in the case of science and technological
innovation, but to a lesser extent (32% vs. 28%).
Surprisingly, difficulties with paying bills is only mildly related to the impact of
actions on the reduction of inequalities. Those who never or almost never struggle
to pay their bills are slightly more likely than those who always have difficulties to
say that people’s actions (32% vs. 25%) and science and technological innovation
(30% vs. 25%) will have a positive impact on the reduction of inequalities.

SPECIAL EUROBAROMETER 419 “Public Perceptions of Science, Research
and Innovation”
65
Base: All respondents in EU28 (N= 27,910)
Base: All respondents in EU28 (N= 27,910)

SPECIAL EUROBAROMETER 419 “Public Perceptions of Science, Research
and Innovation”
66
Other analysis
Respondents who have studied science are more likely than those who have not
done so to think that there will be positive impacts on the reduction of inequalities
from people’s behaviour (35% vs. 26%) and science and technological innovation
(32% vs. 26%).
Those who think that people’s actions (60%) and science and technological
innovation (53%) will have a positive impact on the adaptation of society to an
ageing population are also particularly likely to have similar views about the
reduction inequalities.
Base: All respondents in EU28 (N= 27,910)
Base: All respondents in EU28 (N= 27,910)

SPECIAL EUROBAROMETER 419 “Public Perceptions of Science, Research
and Innovation”
67
1.9. Adaptation of society to an ageing population
Ireland (54%), Denmark (52%) and the Netherlands (50%) are the only three Member
States in which at least half of the respondents think that people’s actions and behaviour
will have a positive impact on the adaptation of society to an ageing population 15 years
from now. Greece (31% vs. 23%) and Germany (33% vs. 32%) are the only two
countries where more respondents anticipate a negative impact than a positive impact
when it comes to the adaptation of society to an ageing population.
In four countries a majority of respondents think that people’s actions and behaviour will
have no impact on the adaptation of society to an ageing population, namely Greece
(36% no impact vs. 23% positive and 31% negative), Croatia (35% vs. 32% and 16%),
the Czech Republic (33% vs. 27% and 26%), and Italy (29% vs. 26% and 26%).
In all countries, at least one in 10 respondents are not able to give an answer and in 12
countries, at least two in 10 respondents are in the same situation. The highest levels of
‘don’t know’ are observed once again in Estonia (29%), Bulgaria (28%), Malta and, this
time, Latvia (both 27%).
Base: All respondents in EU28 (N= 27,910)
In nine countries at least half of the respondents believe that science and technological
innovation will have a positive impact when it comes to the adaptation of society to an
ageing population. The proportion of respondents who say this is highest in Ireland
(63%), Spain and Sweden (both 60%), and lowest in Austria (29%), and the Czech
Republic and Italy (both 31%).
While there are no Member States where more people anticipate a negative impact than
anticipate a positive impact, a majority in three countries think that science and
technological innovation will have no impact on the adaptation of society to an ageing
population, namely Austria (43% no impact vs. 29% positive and 17% negative), the
Czech Republic (40% vs. 31% and 15%), and Hungary (35% vs. 33% and 19%).

SPECIAL EUROBAROMETER 419 “Public Perceptions of Science, Research
and Innovation”
68
Again, in 10 countries, at least 20% of respondents answer ‘don’t know’ with the highest
level in Malta and Bulgaria (both 27%).
Base: All respondents in EU28 (N= 27,910)
As in the previous sections, with the exception of the reduction of inequalities, more
respondents think that science and technological innovation will have a positive impact
on the adaptation of the society to an ageing population than people’s actions and
behaviour (44% vs. 34%).
Austria is the only country where more respondents believe that people’s actions and
behaviour will have a positive impact on the adaptation of society to an ageing
population than those who think that science and technological innovation will have a
positive impact, by a tiny margin of 31% to 29%. Elsewhere more people expect science
and technological innovation to have a positive impact than people’s action and
behaviour. The only country where there is a gap of 20 percentage points between the
two is Spain (60% vs. 40%).

SPECIAL EUROBAROMETER 419 “Public Perceptions of Science, Research
and Innovation”
69
The impact on the adaptation of society to an ageing population
Base: All respondents in EU28 (N= 27,910)
Socio-demographic analysis
Individuals with a higher level of education are more likely to think that people’s
actions and behaviour (41% vs. 28%), and also science and innovation (54% vs.
37%), will have a positive impact on the adaptation of society to an ageing
population.
Managers are much more likely than other occupational groups to think that
people’s behaviour (43% vs. 30%-37%) and science and technological innovation
(55% vs. 37%-46%) will have a positive impact on the adaptation of society to an
ageing population.
Difficulties paying bills are once again linked to respondent’s attitudes.
Respondents who never or almost struggle to pay their bills are more positive
than those who have difficulties most of the time, both in regards to people’s
actions (38% vs. 25%) and the impact of science and technological innovation
(48% vs. 36%).
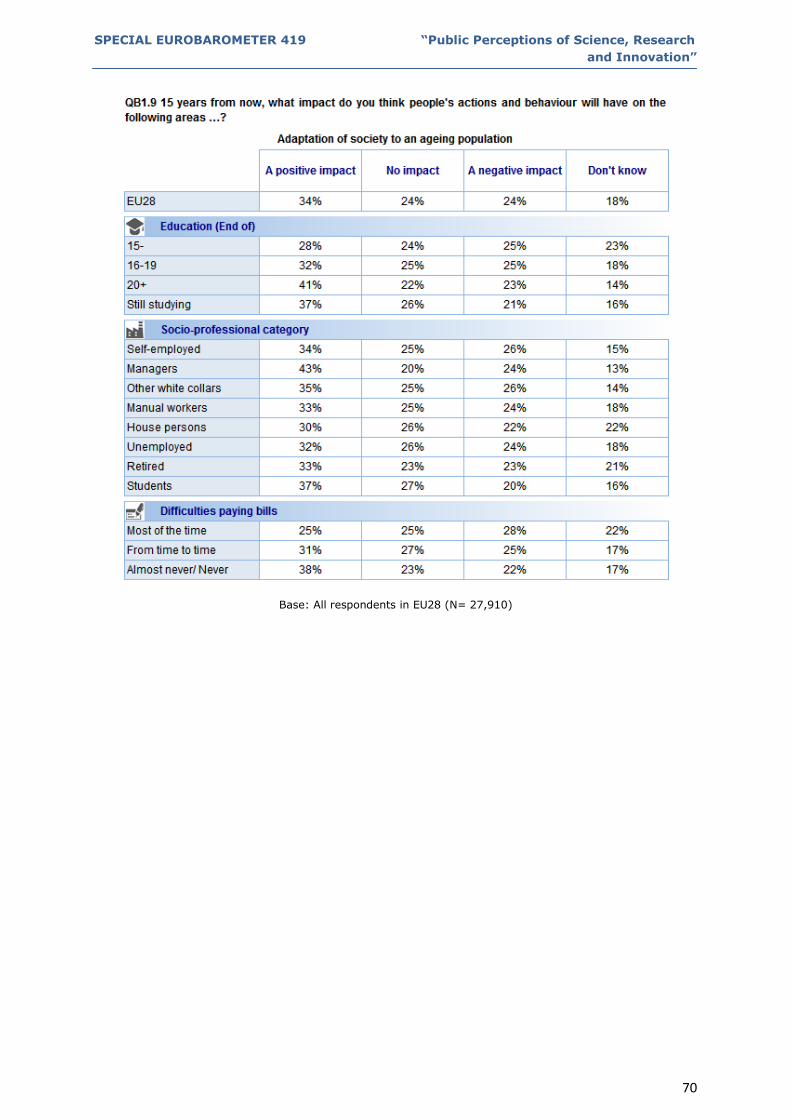
SPECIAL EUROBAROMETER 419 “Public Perceptions of Science, Research
and Innovation”
70
Base: All respondents in EU28 (N= 27,910)

SPECIAL EUROBAROMETER 419 “Public Perceptions of Science, Research
and Innovation”
71
Base: All respondents in EU28 (N= 27,910)
Other analysis
Respondents who have studied science are somewhat more likely than those who
have not done so to think that there will be a positive impact on the adaptation of
society to an ageing population, both from people’s behaviour (38% vs. 30%) and
from science and technological innovation (49% vs. 38%).
Respondents who think that people’s actions and science and technological
innovation will have a positive impact on health and medical care and the
reduction of inequalities are much more likely to hold similar views with regards
to the adaptation of society to an ageing population. However, for both areas the
gap between attitudes widens when science and technological innovation is
discussed.
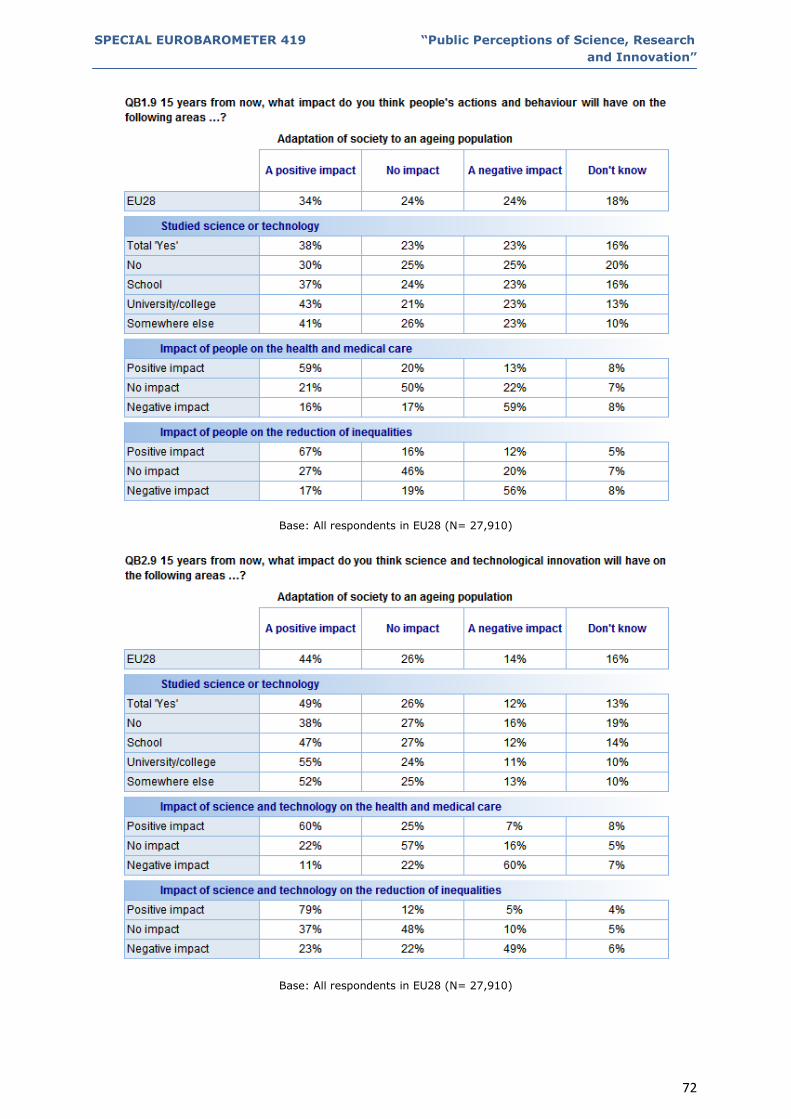
SPECIAL EUROBAROMETER 419 “Public Perceptions of Science, Research
and Innovation”
72
Base: All respondents in EU28 (N= 27,910)
Base: All respondents in EU28 (N= 27,910)

SPECIAL EUROBAROMETER 419 “Public Perceptions of Science, Research
and Innovation”
73
1.10. Availability and quality of food
At least half of the respondents in eight Member States say that people’s actions and
behaviour will have a positive impact on the availability and quality of food 15 years from
now. Sweden (64%), Denmark (62%) and Ireland (62%) have the most respondents
who take this view, while Italy (28%) and Greece (31%) have the fewest. In Greece
equal numbers of respondents anticipate positive, negative and no impacts (31% each).
Only in Malta (23%), Estonia and Slovenia (both 22%) at least one fifth of respondents
say ‘don’t know’, similar to the same situation presented in the protection of the
environment.
Base: All respondents in EU28 (N= 27,910)
In 15 countries at least half of the respondents expect that science and technological
innovation will have a positive impact when it comes to the availability and quality of
food. “Positive impact” is the most common answer in all countries. The proportion of
respondents who say this is highest in Ireland and the Netherlands (both 70%) and
Denmark (69%), and lowest in Italy (35%) and Austria (38%).
The same four countries as seen in the sections on the protection of the environment and
job creation have at least 20% of respondents who cannot give an answer: Malta (23%),
Estonia, Slovenia and Luxembourg (all 21%).

SPECIAL EUROBAROMETER 419 “Public Perceptions of Science, Research
and Innovation”
74
Base: All respondents in EU28 (N= 27,910)
The gap between the answers given for the positive impact of science and technology
and people’s actions and behaviour on the availability and quality of food (10 pp; 48%
vs. 38%) is at a similar level with the gap in the security of citizens (10 pp), protection of
the environment (11 pp) and protection of the personal data (9 pp).
In all Member States more respondents anticipate that science and technological
innovation will have a positive impact on the availability and quality of food 15 years
from now than respondents who think that people’s actions and behaviour will. At
individual country level, the gap is widest in the Netherlands (70% vs. 52%), Portugal
(52% vs. 35%), and Greece (48% vs. 31%).

SPECIAL EUROBAROMETER 419 “Public Perceptions of Science, Research
and Innovation”
75
The impact on the availability and quality of food
Base: All respondents in EU28 (N= 27,910)
The results show a by now familiar pattern, with the Nordic countries, Ireland and the
Netherlands most positive about impact of both science and people, and Greece and Italy
having relatively low proportions of respondents who think that both science and
technological innovation and also people’s actions and behaviour will have a positive
impact.

SPECIAL EUROBAROMETER 419 “Public Perceptions of Science, Research
and Innovation”
76
Socio-demographic analysis
Men are slightly more likely than women (51% vs. 46%) to believe that science
and innovation will have a positive impact on the availability and quality of food.
Age is slightly related where older respondents are slightly less likely to envisage
a positive impact on the availability and quality of food.
Respondents who left education aged 20 or over are more likely than those who
left school aged 15 or below to say that people’s actions and behaviour (42% vs.
34%), and also science and innovation (54% vs. 43%), will have a positive
impact on the availability and quality of food.
Those who never or almost never have difficulties paying their bills are more likely
to think that people’s actions (41% vs. 30%) and science and technological
innovation (51% vs. 39%) will have a positive impact on the availability and
quality of food.
Base: All respondents in EU28 (N= 27,910)

SPECIAL EUROBAROMETER 419 “Public Perceptions of Science, Research
and Innovation”
77
Base: All respondents in EU28 (N= 27,910)

SPECIAL EUROBAROMETER 419 “Public Perceptions of Science, Research
and Innovation”
78
Other analysis
Respondents who have studied science are somewhat more likely than those who
have not done so to think that science and technological innovation will have a
positive impact on the availability and quality of food (52% vs. 45%). This
difference is less pronounced when taking into account the actions of people.
Base: All respondents in EU28 (N= 27,910)
Base: All respondents in EU28 (N= 27,910)

SPECIAL EUROBAROMETER 419 “Public Perceptions of Science, Research
and Innovation”
79
1.11. Transport and transport infrastructure
In 11 Member States, at least half of the respondents say that people’s actions and
behaviour will have a positive impact on the transport and transport infrastructure 15
years from now. Denmark (62%), Ireland (62%) and Finland (61%) have the highest
proportions of respondents who take this view, while Italy and Austria (both 29%) have
the lowest. Austria (35% vs. 29%) is the only country in which more people anticipate a
negative impact than a positive impact on this issue.
In nine countries, at least 20% of respondents can’t give an answer, with the highest
levels of ‘don’t know’ recorded once again in Malta and Slovenia (both 27%).
Base: All respondents in EU28 (N= 27,910)
In all but two countries more than half of the respondents believe that science and
technological innovation will have a positive impact when it comes to transport and
transport infrastructure. The proportion of respondents who say this is highest in Sweden
(81%), Finland (77%) and Denmark (76%). The two exceptions, where less than 50% of
people think the impact will be positive, are Italy (39%) and Austria (46%).
Only in three countries, Malta (25%), Slovenia (22%) and Luxembourg (20%) did the
levels of ‘don’t know’ reach 20% or more.

SPECIAL EUROBAROMETER 419 “Public Perceptions of Science, Research
and Innovation”
80
Base: All respondents in EU28 (N= 27,910)
The gap between the positive impact of science and technological innovation and the
positive impact of people’s actions and behaviour is much wider on transport and
transport infrastructure (18 pp; 59% vs. 41%) when compared to the areas analysed so
far, with the exceptions of health and medical care (22 pp) and energy supply (21 pp).
In every Member State more respondents say that science and technological innovation
will have a positive impact on transport and transport infrastructure 15 years from now
than those who think that people’s actions and behaviour will do so. At country level, this
gap is widens to more than 20 percentage points in nine countries, with the highest
differences noted in the Netherlands (27 pp; 74% vs. 47%), Sweden (25 pp; 81% vs
56%) and Portugal (25 pp; 61% vs. 36%).

SPECIAL EUROBAROMETER 419 “Public Perceptions of Science, Research
and Innovation”
81
The impact on the transport and transport infrastructure
Base: All respondents in EU28 (N= 27,910)
Socio-demographic analysis
Men are somewhat more likely than women to think that people’s actions and
behaviour (44% vs. 39%) and also science and innovation (63% vs. 56%) will
have a positive impact on transport and transport infrastructure.
Respondents who left education aged 20 or over are substantially more likely than
those who left school aged 15 or below to think that people’s actions and
behaviour (48% vs. 30%), and also science and innovation (70% vs. 48%), will
have a positive impact on transport and transport infrastructure.
Younger respondents are more likely to agree both people’s actions and behaviour
and science and technological innovation will positively impact transport and
transport infrastructure.
Occupation of the respondent is also related, with managers most likely to agree
that both people’s actions and behaviour (49%) and science and technology
(73%) will have a positive impact on transport and transport infrastructure. House
persons were least likely to agree, with 33% agreeing that people’s actions and
behaviour will have a positive impact and 46% agreeing that science and
technology will have a positive impact.
Those who never or almost never have difficulty paying bills are more likely than
those who often have difficulty paying bills to agree that people’s actions and
behaviour (44% vs. 33%) and science and technology (64% vs. 49%) will have a
positive impact on transport and transport infrastructure.

SPECIAL EUROBAROMETER 419 “Public Perceptions of Science, Research
and Innovation”
82
Base: All respondents in EU28 (N= 27,910)

SPECIAL EUROBAROMETER 419 “Public Perceptions of Science, Research
and Innovation”
83
Base: All respondents in EU28 (N= 27,910)

SPECIAL EUROBAROMETER 419 “Public Perceptions of Science, Research
and Innovation”
84
Other analysis
Respondents who have studied science are more likely than those who have not
done so to think that there will be a positive impact on transport and transport
infrastructure from people’s actions and behaviour (46% vs. 35%), and also
science and technological innovation (65% vs. 53%).
Base: All respondents in EU28 (N= 27,910)
Base: All respondents in EU28 (N= 27,910)
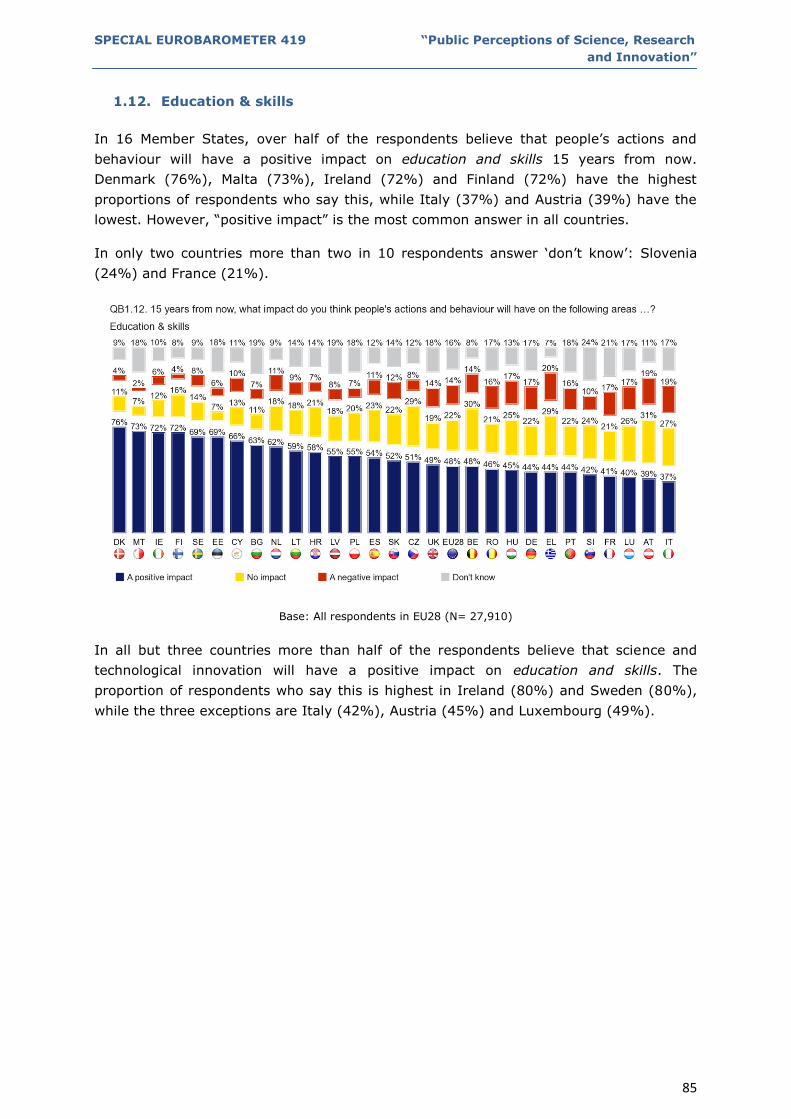
SPECIAL EUROBAROMETER 419 “Public Perceptions of Science, Research
and Innovation”
85
1.12. Education & skills
In 16 Member States, over half of the respondents believe that people’s actions and
behaviour will have a positive impact on education and skills 15 years from now.
Denmark (76%), Malta (73%), Ireland (72%) and Finland (72%) have the highest
proportions of respondents who say this, while Italy (37%) and Austria (39%) have the
lowest. However, “positive impact” is the most common answer in all countries.
In only two countries more than two in 10 respondents answer ‘don’t know’: Slovenia
(24%) and France (21%).
Base: All respondents in EU28 (N= 27,910)
In all but three countries more than half of the respondents believe that science and
technological innovation will have a positive impact on education and skills. The
proportion of respondents who say this is highest in Ireland (80%) and Sweden (80%),
while the three exceptions are Italy (42%), Austria (45%) and Luxembourg (49%).

SPECIAL EUROBAROMETER 419 “Public Perceptions of Science, Research
and Innovation”
86
Base: All respondents in EU28 (N= 27,910)
In all 28 Member States more respondents say that science and technological innovation
will have a positive impact on education and skills 15 years from now than those who
think that people’s actions and behaviour will do so. At EU level there is a 12 point gap
on this issue, with 60% of Europeans saying that science and technological innovation
will have a positive impact, and 48% expecting that people’s actions and behaviour will
have a positive impact. At individual country level, this gap is widest in Greece (63% vs.
44%) and Spain (73% vs. 54%), and narrowest in Denmark (78% vs. 76%), Estonia
(73% vs. 69%) and Malta (77% vs. 73%).
Only two countries have at least a fifth of respondents who cannot give an answer to this
question: Slovenia (21%) and Luxembourg (20%).

SPECIAL EUROBAROMETER 419 “Public Perceptions of Science, Research
and Innovation”
87
The impact on the education & skills
Base: All respondents in EU28 (N= 27,910)
Once again, more respondents tend to think that the science and technological
innovation will have a positive impact than people’s actions and behaviour, this time on
education and skills (60% vs. 48%).
This pattern is observed in all Member States. The Nordic countries, Malta and Ireland
are again prominent as having relatively high proportions of respondents who think that
both science and technological innovation and also people’s actions and behaviour will
have a positive impact.
Socio-demographic analysis
Respondents who left education aged 20 or over are more inclined than those who
left school aged 15 or below to think that people’s actions and behaviour (55% vs.
40%), and also science and innovation (67% vs. 51%), will have a positive
impact on education and skills.
The age of respondents has some relation, where older respondents are slightly
less likely to feel that people’s actions and behaviour and science and technology
will positively impact education and skills.
Managers and students are more likely than respondents in other occupation to
think that both people’s actions and behaviour (54%; 56%) and science and
technology (68%; 66%) will have a positive impact in the future on education and
skills.
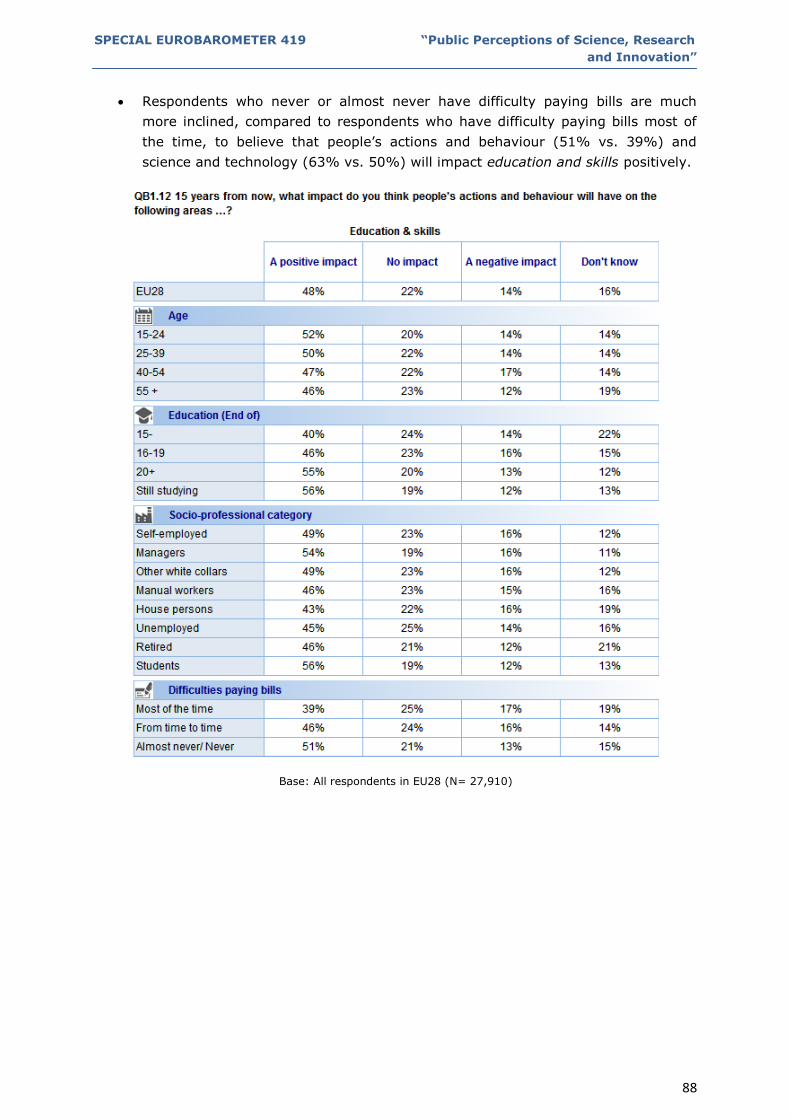
SPECIAL EUROBAROMETER 419 “Public Perceptions of Science, Research
and Innovation”
88
Respondents who never or almost never have difficulty paying bills are much
more inclined, compared to respondents who have difficulty paying bills most of
the time, to believe that people’s actions and behaviour (51% vs. 39%) and
science and technology (63% vs. 50%) will impact education and skills positively.
Base: All respondents in EU28 (N= 27,910)
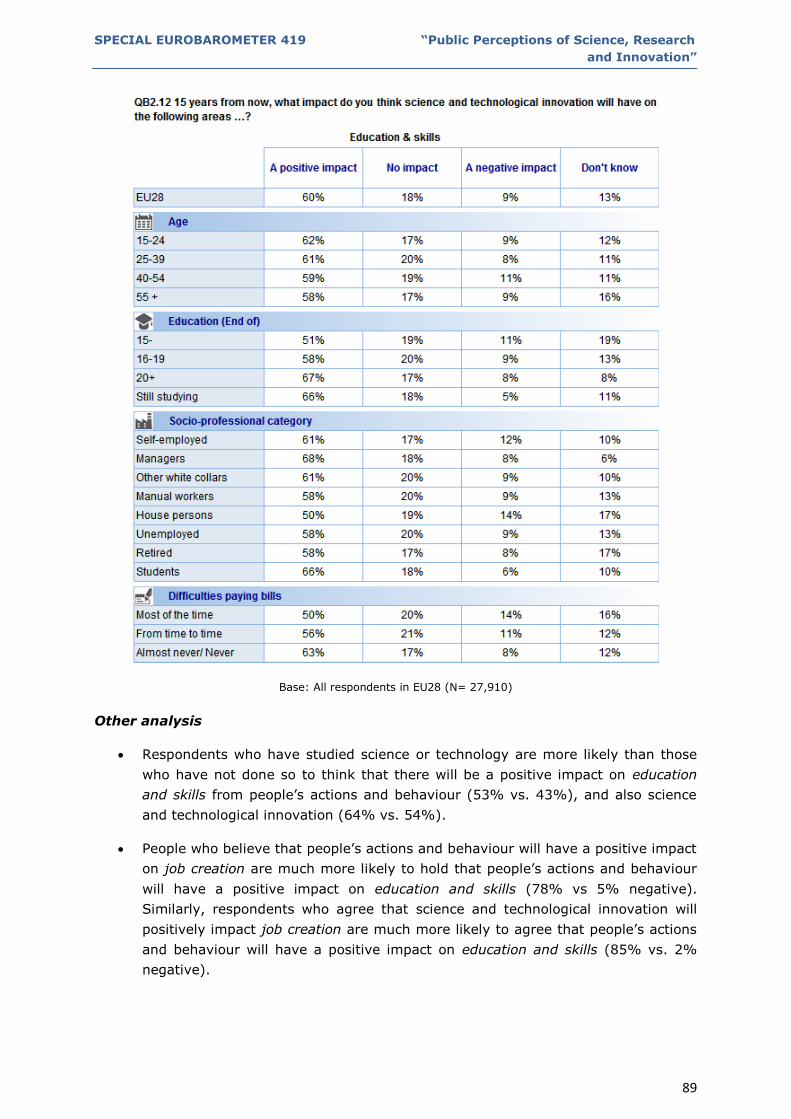
SPECIAL EUROBAROMETER 419 “Public Perceptions of Science, Research
and Innovation”
89
Base: All respondents in EU28 (N= 27,910)
Other analysis
Respondents who have studied science or technology are more likely than those
who have not done so to think that there will be a positive impact on education
and skills from people’s actions and behaviour (53% vs. 43%), and also science
and technological innovation (64% vs. 54%).
People who believe that people’s actions and behaviour will have a positive impact
on job creation are much more likely to hold that people’s actions and behaviour
will have a positive impact on education and skills (78% vs 5% negative).
Similarly, respondents who agree that science and technological innovation will
positively impact job creation are much more likely to agree that people’s actions
and behaviour will have a positive impact on education and skills (85% vs. 2%
negative).

SPECIAL EUROBAROMETER 419 “Public Perceptions of Science, Research
and Innovation”
90
Base: All respondents in EU28 (N= 27,910)
Base: All respondents in EU28 (N= 27,910)
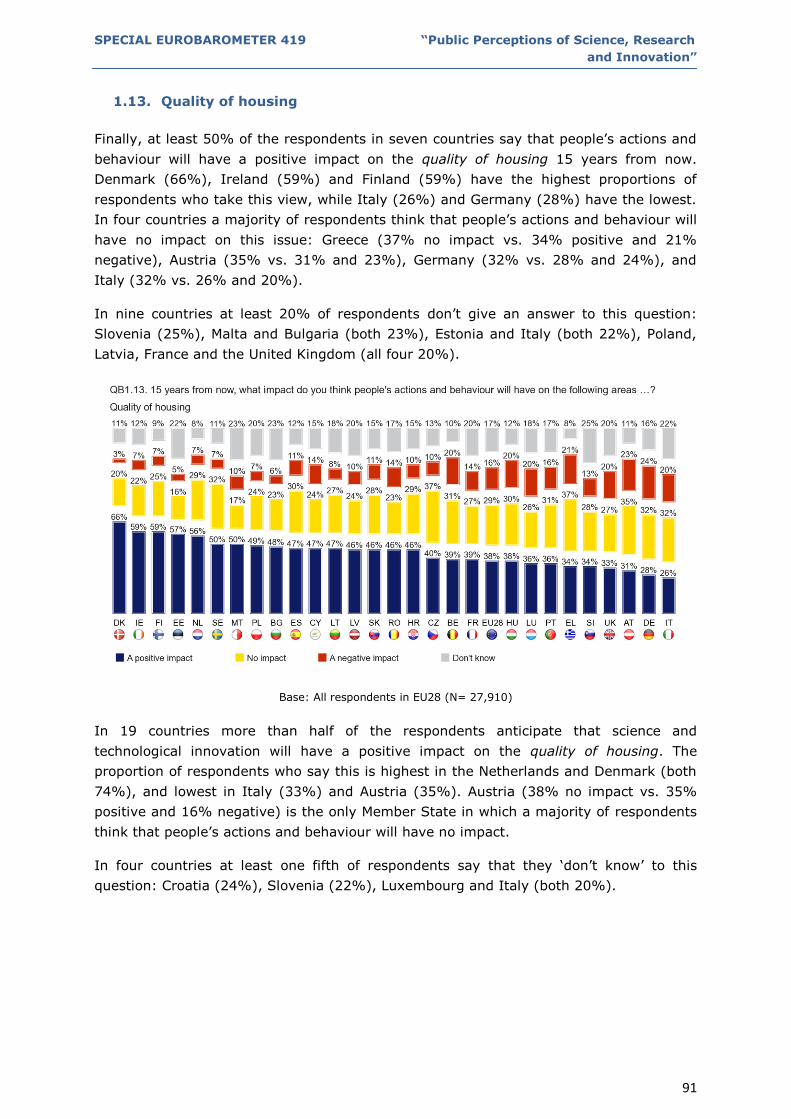
SPECIAL EUROBAROMETER 419 “Public Perceptions of Science, Research
and Innovation”
91
1.13. Quality of housing
Finally, at least 50% of the respondents in seven countries say that people’s actions and
behaviour will have a positive impact on the quality of housing 15 years from now.
Denmark (66%), Ireland (59%) and Finland (59%) have the highest proportions of
respondents who take this view, while Italy (26%) and Germany (28%) have the lowest.
In four countries a majority of respondents think that people’s actions and behaviour will
have no impact on this issue: Greece (37% no impact vs. 34% positive and 21%
negative), Austria (35% vs. 31% and 23%), Germany (32% vs. 28% and 24%), and
Italy (32% vs. 26% and 20%).
In nine countries at least 20% of respondents don’t give an answer to this question:
Slovenia (25%), Malta and Bulgaria (both 23%), Estonia and Italy (both 22%), Poland,
Latvia, France and the United Kingdom (all four 20%).
Base: All respondents in EU28 (N= 27,910)
In 19 countries more than half of the respondents anticipate that science and
technological innovation will have a positive impact on the quality of housing. The
proportion of respondents who say this is highest in the Netherlands and Denmark (both
74%), and lowest in Italy (33%) and Austria (35%). Austria (38% no impact vs. 35%
positive and 16% negative) is the only Member State in which a majority of respondents
think that people’s actions and behaviour will have no impact.
In four countries at least one fifth of respondents say that they ‘don’t know’ to this
question: Croatia (24%), Slovenia (22%), Luxembourg and Italy (both 20%).

SPECIAL EUROBAROMETER 419 “Public Perceptions of Science, Research
and Innovation”
92
Base: All respondents in EU28 (N= 27,910)
As noticed in all sections, except for the reduction of the inequalities, more respondents
tend to think that science and technological innovation will have a positive impact than
people’s actions and behaviour, this time on the quality of the housing (50% vs. 38%).
In all countries more respondents say that science and technological innovation will have
a positive impact on the quality of housing 15 years from now than those who think that
people’s actions and behaviour will have a positive impact. At country level, the gap
between the two is widest in Spain (67% vs. 47%), Cyprus (65% vs. 47%) and the
Netherlands (74% vs. 56%).
The impact on the quality of housing
Base: All respondents in EU28 (N= 27,910)
SPECIAL EUROBAROMETER 419 “Public Perceptions of Science, Research
and Innovation”
93
Again, there is a clear relationship between the proportion of respondents who expect
positive impacts from science and technological innovation and from people’s actions and
behaviour on this issue. The Nordic countries, the Netherlands, Ireland and Estonia again
stand out as having relatively high proportions of respondents who think that both
science and technological innovation and also people’s actions and behaviour will have a
positive impact, while Italy, Austria and Germany are at the other extreme, having
relatively low proportions of respondents who think that both science and technological
innovation and also people’s actions and behaviour will have a positive impact.
Socio-demographic analysis
Men are somewhat more likely than women to believe that science and innovation
will have a positive impact on the quality of housing, by a margin of 53% to 47%.
Respondents who left education aged 20 or over are more inclined than those who
left school aged 15 or below to think that people’s actions and behaviour (43% vs.
33%), and also science and innovation (58% vs. 42%), will have a positive
impact on the quality of housing.
Younger respondents are slightly more optimistic that people’s actions and
behaviour and science and technological innovation will have a positive impact on
housing quality in the future.
Respondents who almost never or never have trouble paying bills are more likely
to agree that quality of housing will be positively impacted by people’s actions and
behaviour (41% vs. 31%) and by science and technological innovation (53% vs.
42%).

SPECIAL EUROBAROMETER 419 “Public Perceptions of Science, Research
and Innovation”
94
Base: All respondents in EU28 (N= 27,910)

SPECIAL EUROBAROMETER 419 “Public Perceptions of Science, Research
and Innovation”
95
Base: All respondents in EU28 (N= 27,910)
Other analysis
Respondents who have studied science and technology are more likely than those who
have not done so to say there will be a positive impact on the quality of housing from
people’s actions and behaviour (41% vs. 35%), and also science and technological
innovation (55% vs. 45%).

SPECIAL EUROBAROMETER 419 “Public Perceptions of Science, Research
and Innovation”
96
Base: All respondents in EU28 (N= 27,910)
Base: All respondents in EU28 (N= 27,910)


SPECIAL EUROBAROMETER 419 “Public Perceptions of Science, Research
and Innovation”
97
IV. THREE DIMENSIONAL ANALYSIS ON THE 13 AREAS
This chapter presents the results of a three- dimensional analysis on the 13 areas
discussed in the previous chapters. This analysis aims to present the relationship
between three separate attitudes of respondents:
The level of priority that respondents think science and technological innovation
should be given to each of the 13 areas in discussion.
The positive impact that respondents expect people’s actions and behaviour will
have on each area.
The positive impact respondents expect science and technological innovation to
have on each area.
In the following chart, each bubble is associated with one of the 13 areas in discussion,
and the size of the bubble represents the level of priority that respondents think should
be given by science and technological innovation to this area (issue discussed in chapter
2). The level of positive impact that respondents think people's actions and behaviour will
have in each area is displayed on the horizontal axis and the level of positive impact that
respondents think science and technologic innovation will have in each area is on the
vertical axis.
Health and medical care, education and skills, and the protection of the
environment all appear in the top right quadrant, demonstrating that a relatively high
proportion of respondents think that both people’s actions and behaviour and science and
technological innovation will have a positive impact in these areas. These three issues
are also represented by large bubbles, meaning that relatively high proportions of
respondents regard them also as priority issues.
Job creation is also a high priority issue (large bubble), but it appears in the bottom
right quadrant of the graph. This means that while a high proportion of respondents
consider job creation a priority for science and technological innovation, a relatively small
proportion of respondents (compared to other areas) believe science and technological
innovation will have a positive impact on this area. The reduction of inequalities
appears in the very bottom left of the graph, showing that few respondents think that
both science and technological innovation and people’s actions and behaviour will have a
positive impact on this area. Furthermore, the reduction of inequalities is not an area
that is mentioned by respondents as a priority for science and technological innovation
(according to the size of the bubble).
Transport and transport infrastructure appears in the top right of the graphic,
showing that many respondents expect a positive impact from people’s actions and
behaviour and from science and technological innovation, but at the same time, it is an
area which is considered as a low priority for science and technological innovation
(according to the size of the bubble).

SPECIAL EUROBAROMETER 419 “Public Perceptions of Science, Research
and Innovation”
98
It is worth mentioning that areas that are directly or indirectly connected to the
protection of the environment are grouped together to a certain degree. These areas
include the fight against climate change, energy supply, and transport and transport
infrastructure.
Base: all respondents in EU28 (n= 27,910)

SPECIAL EUROBAROMETER 419 “Public Perceptions of Science, Research
and Innovation”
99
V. CONCLUSIONS
The main findings of this Special Eurobarometer survey suggest that a large proportion
of Europeans believe that science and technological innovation will have a positive impact
in addressing most of the issues facing society in the next 15 years.
On most issues, respondents in all countries are more likely to think that positive impacts
can be achieved through science and innovation than through people’s actions and
behaviour. A notable exception is the reduction of inequalities, which is seen in most
countries as more of an area for human intervention.
The issue of job creation is one of the two most prioritized by Europeans when they are
asked which issues science and technology innovation should focus on over the next 15
years. However, respondents in some countries tend to believe less in the capacity of
science and technological innovation to have a positive impact on this issue.
On the other side, health and medical care stands out as one of the two most prioritised
issues, but in this case a significant proportion of respondents expect science and
technological innovation to have a positive impact on this field.
Education and skills, and the protection of the environment are also regarded as high
priorities. Additionally, in those cases, a relatively high proportion of respondents also
believe that science and technological innovation will have a positive impact in those
areas.
Respondents have a high degree of assurance that science and technological innovation
can help address these problems: at least 50% of respondents think that seven of the 13
issues can be positively addressed through science and innovation, and over 40% think
that 11 of them can be positively addressed. This represents a better picture in
comparison to the proportion of respondents who think that people’s actions and
behaviour can have a positive impact on these issues: there are no examples where
more than 50% of respondents think positive impacts can be achieved in this way, and
for only five of the 13 issues, over 40% of respondents think that they will be positively
addressed through people's behaviour and actions.
However, there are substantial differences from country to country when it comes to the
expectation of whether science and innovation, and also people’s actions and behaviour,
can have positive impacts. Respondents in some countries are very optimistic about
these issues, notably those in the Nordic countries, Ireland, Malta and Spain.
On the other hand, respondents in Austria, the Czech Republic, Germany, Greece and
Italy have consistently lower expectations that there will be positive changes over the
next 15 years either through science and technological innovation or through the
behaviour of citizens. Thus, this may also reflect a general level of optimism/pessimism
for the future in different Member States.

SPECIAL EUROBAROMETER 419 “Public Perceptions of Science, Research
and Innovation”
100
Yet even in the latter countries, on almost all of the issues under discussion, there is a
general trend that positive outcomes are more likely to be achieved through the
application of science and new technological innovation than through people’s actions
and behaviour.
Certain groups of respondents are more inclined to think that both science and
technological innovation and also people’s actions and behaviour will have a positive
impact on most of the areas discussed. In most cases, these are represented by
respondents with a higher level of education and respondents who have studied science
or technology. In some cases, men are more likely than women and younger
respondents are more likely than older respondents to expect a positive impact from
both roles.
Furthermore, respondents who expect a positive impact on a specific area are more likely
to expect a positive impact on other areas as well. There is also a strong relationship
between the likelihood of expecting a positive impact from people’s actions and
behaviour and from science and technological innovation.

ANNEXES


TECHNICAL SPECIFICATIONS


SPECIAL EUROBAROMETER 419 “Public Perceptions of Science, Research
and Innovation”
SPECIAL EUROBAROMETER 419
Public perceptions of science, research and innovation
TECHNICAL SPECIFICATIONS
Between the 14th and the 26th of June 2014, TNS opinion & social, a consortium created between TNS political &
social, TNS UK and TNS opinion, carried out the wave 81.5 of the EUROBAROMETER survey, on request of the
EUROPEAN COMMISSION, Directorate-General for Communication, “Strategy, Corporate Communication Actions
and Eurobarometer” unit.
The special Eurobarometer survey 419 is part of the wave 81.5 and covers the population of the respective
nationalities of the European Union Member States, resident in each of the Member States and aged 15 years and
over.
The basic sample design applied in all states is a multi-stage, random (probability) one. In each country, a
number of sampling points was drawn with probability proportional to population size (for a total coverage of the
country) and to population density.
In order to do so, the sampling points were drawn systematically from each of the "administrative regional units",
after stratification by individual unit and type of area. They thus represent the whole territory of the countries
surveyed according to the EUROSTAT NUTS II (or equivalent) and according to the distribution of the resident
population of the respective nationalities in terms of metropolitan, urban and rural areas. In each of the selected
sampling points, a starting address was drawn, at random. Further addresses (every Nth address) were selected
by standard "random route" procedures, from the initial address. In each household, the respondent was drawn,
at random (following the "closest birthday rule"). All interviews were conducted face-to-face in people's homes
and in the appropriate national language. As far as the data capture is concerned, CAPI (Computer Assisted
Personal Interview) was used in those countries where this technique was available.
For each country a comparison between the sample and the universe was carried out. The Universe description
was derived from Eurostat population data or from national statistics offices. For all countries surveyed, a national
weighting procedure, using marginal and intercellular weighting, was carried out based on this Universe
description. In all countries, gender, age, region and size of locality were introduced in the iteration procedure.
For international weighting (i.e. EU averages), TNS Opinion & Social applies the official population figures as
provided by EUROSTAT or national statistic offices. The total population figures for input in this post-weighting
procedure are listed below.
TS1

SPECIAL EUROBAROMETER 419 “Public Perceptions of Science, Research
and Innovation”
Readers are reminded that survey results are estimations, the accuracy of which, everything being equal, rests
upon the sample size and upon the observed percentage. With samples of about 1,000 interviews, the real
percentages vary within the following confidence limits:
various sample sizes are in rows various observed results are in columns
5% 10% 15% 20% 25% 30% 35% 40% 45% 50%
95% 90% 85% 80% 75% 70% 65% 60% 55% 50%
N=50 6,0 8,3 9,9 11,1 12,0 12,7 13,2 13,6 13,8 13,9 N=50
N=500 1,9 2,6 3,1 3,5 3,8 4,0 4,2 4,3 4,4 4,4 N=500
N=1000 1,4 1,9 2,2 2,5 2,7 2,8 3,0 3,0 3,1 3,1 N=1000
N=1500 1,1 1,5 1,8 2,0 2,2 2,3 2,4 2,5 2,5 2,5 N=1500
N=2000 1,0 1,3 1,6 1,8 1,9 2,0 2,1 2,1 2,2 2,2 N=2000
N=3000 0,8 1,1 1,3 1,4 1,5 1,6 1,7 1,8 1,8 1,8 N=3000
N=4000 0,7 0,9 1,1 1,2 1,3 1,4 1,5 1,5 1,5 1,5 N=4000
N=5000 0,6 0,8 1,0 1,1 1,2 1,3 1,3 1,4 1,4 1,4 N=5000
N=6000 0,6 0,8 0,9 1,0 1,1 1,2 1,2 1,2 1,3 1,3 N=6000
N=7000 0,5 0,7 0,8 0,9 1,0 1,1 1,1 1,1 1,2 1,2 N=7000
N=7500 0,5 0,7 0,8 0,9 1,0 1,0 1,1 1,1 1,1 1,1 N=7500
N=8000 0,5 0,7 0,8 0,9 0,9 1,0 1,0 1,1 1,1 1,1 N=8000
N=9000 0,5 0,6 0,7 0,8 0,9 0,9 1,0 1,0 1,0 1,0 N=9000
N=10000 0,4 0,6 0,7 0,8 0,8 0,9 0,9 1,0 1,0 1,0 N=10000
N=11000 0,4 0,6 0,7 0,7 0,8 0,9 0,9 0,9 0,9 0,9 N=11000
N=12000 0,4 0,5 0,6 0,7 0,8 0,8 0,9 0,9 0,9 0,9 N=12000
N=13000 0,4 0,5 0,6 0,7 0,7 0,8 0,8 0,8 0,9 0,9 N=13000
N=14000 0,4 0,5 0,6 0,7 0,7 0,8 0,8 0,8 0,8 0,8 N=14000
N=15000 0,3 0,5 0,6 0,6 0,7 0,7 0,8 0,8 0,8 0,8 N=15000
5% 10% 15% 20% 25% 30% 35% 40% 45% 50%
95% 90% 85% 80% 75% 70% 65% 60% 55% 50%
Statistical Margins due to the sampling process
(at the 95% level of confidence)
TS2

SPECIAL EUROBAROMETER 419 “Public Perceptions of Science, Research
and Innovation”
TS3


QUESTIONNAIRE


SPECIAL EUROBAROMETER 419 “Public Perceptions of Science, Research
and Innovation”
QB1
12345678910111213
QB2
12345678910111213
QB3a
QB3b
QB4
1,2,3,45
Yes, somewhere elseNoDKNEW (FROM EB40.1)
NEW
QB4: CODES 4 AND 5 ARE EXCLUSIVEHave you ever studied science or technology at school, at university, at college or anywhere else?
(SHOW SCREEN – READ OUT – MULTIPLE ANSWERS POSSIBLE)Yes, at schoolYes, at university or college
Quality of housing 13 13,DK 14
Transport and transport infrastructure 11 11,Education & skills 12 12,
Adaptation of society to an ageing population 9 9,Availability and quality of food 10 10,
Protection of personal data 7 7,Reduction of inequalities 8 8,
Energy supply 5 5,Health and medical care 6 6,
Security of citizens 3 3,Job creation 4 4,
Fight against climate change 1 1,Protection of the environment 2 2,
QB3b: MAX. 4 ANSWERSQB3b: CODE 14 IS EXCLUSIVE
And then?(SHOW SCREEN – READ OUT – MULTIPLE ANSWERS POSSIBLE)
QB3a QB3bFIRSTLY AND THEN
QB3a: ROTATE ANSWERS 1 TO 13
Over the next 15 years, what should be the priorities when it comes to science and technological innovation? Firstly?(SHOW SCREEN – READ OUT – ONE ANSWER ONLY)
QB3b: AN ANSWER MENTIONNED IN QB3a CANNOT BE PROPOSED IN QB3bQB3b: IF QB3a=14 THEN QB3b IS NOT ASKEDQB3b: ROTATE ANSWERS 1 TO 13
Quality of housing 1 2 3 4NEW
Transport and transport infrastructure 1 2 3 4Education & skills 1 2 3 4
Adaptation of society to an ageing population 1 2 3 4Availability and quality of food 1 2 3 4
Protection of personal data 1 2 3 4Reduction of inequalities 1 2 3 4
Energy supply 1 2 3 4Health and medical care 1 2 3 4
Security of citizens 1 2 3 4Job creation 1 2 3 4
Fight against climate change 1 2 3 4Protection of the environment 1 2 3 4
QB2: ROTATE ITEMS 1 TO 1315 years from now, what impact do you think science and technological innovation will have on the following areas …?(SHOW SCREEN – READ OUT – ONE ANSWER PER LINE)
A positive impact
No impact A negative impact
DK
Quality of housing 1 2 3 4NEW
Transport and transport infrastructure 1 2 3 4Education & skills 1 2 3 4
Adaptation of society to an ageing population 1 2 3 4Availability and quality of food 1 2 3 4
Protection of personal data 1 2 3 4Reduction of inequalities 1 2 3 4
Energy supply 1 2 3 4Health and medical care 1 2 3 4
Security of citizens 1 2 3 4Job creation 1 2 3 4
Fight against climate change 1 2 3 4Protection of the environment 1 2 3 4
B. SCIENCE, RESEARCH AND INNOVATION
QB1: ROTATE ITEMS 1 TO 1315 years from now, what impact do you think people's actions and behaviour will have on the following areas …? (SHOW SCREEN – READ OUT – ONE ANSWER PER LINE)
A positive impact
No impact A negative impact
DK


TABLES


SPECIAL EUROBAROMETER 419 “Public Perceptions of Science, Research
and Innovation”
%
EU 28
BE
BG
CZ
DK
DE
EE
IE
EL
ES
FR
HR
IT
CY
LV
LT
LU
HU
MT
NL
AT
PL
PT
RO
SI
SK
FI
SE
UK
QB1.1 Welche Auswirkungen werden Ihrer Meinung nach das Handeln und Verhalten der Menschen in 15 Jahren auf
folgende Bereiche haben? (ROTIEREN)
Kampf gegen den Klimawandel
Un impact
positif
Un impact
négatif
QB1.1 D’ici15 ans, quel impact pensez-vous que les actions et le comportement des gens auront dans les domaines
suivants … ? (ROTATION)
La lutte contre le changement climatique
QB1.1 15 years from now, what impact do you think people's actions and behaviour will have on the following areas …?
(ROTATE)
Fight against climate change
NSP
DK
WN
EB
81.5
A positive
impact
Positive
Auswirkungen
EB
81.5
Pas d’impact
No impact
Keine
Auswirkungen
39 23 22 16
A negative
impact
Negative
Auswirkungen
EB
81.5
EB
81.5
38 23 17 22
41 26 25 8
56 17 19 8
32 35 18 15
41 18 28 13
35 25 14 26
33 23 38 6
54 24 9 13
37 24 20 19
49 21 20 10
32 23 26 19
32 33 19 16
28 31 18 23
40 18 25 17
39 23 19 19
37 25 23 15
55 8 13 24
35 28 24 13
37 22 32 9
53 24 15 8
31 27 22 20
39 28 13 20
37 23 17 23
37 22 22 19
60 20 12 8
38 24 22 16
34 28 20 18
67 13 14 6
T1

SPECIAL EUROBAROMETER 419 “Public Perceptions of Science, Research
and Innovation”
%
EU 28
BE
BG
CZ
DK
DE
EE
IE
EL
ES
FR
HR
IT
CY
LV
LT
LU
HU
MT
NL
AT
PL
PT
RO
SI
SK
FI
SE
UK
QB1.2 Welche Auswirkungen werden Ihrer Meinung nach das Handeln und Verhalten der Menschen in 15 Jahren auf
folgende Bereiche haben? (ROTIEREN)
Schutz der Umwelt
Un impact
positif
Un impact
négatif
QB1.2 D’ici15 ans, quel impact pensez-vous que les actions et le comportement des gens auront dans les domaines
suivants … ? (ROTATION)
La protection de l’environnement
QB1.2 15 years from now, what impact do you think people's actions and behaviour will have on the following areas …?
(ROTATE)
Protection of the environment
NSP
DK
WN
EB
81.5
A positive
impact
Positive
Auswirkungen
EB
81.5
Pas d’impact
No impact
Keine
Auswirkungen
46 18 23 13
A negative
impact
Negative
Auswirkungen
EB
81.5
EB
81.5
45 15 23 17
45 21 27 7
67 11 15 7
45 25 19 11
46 14 30 10
60 8 12 20
37 20 38 5
60 18 10 12
46 16 21 17
54 16 20 10
35 22 27 16
49 22 18 11
46 17 18 19
56 13 20 11
44 23 16 17
47 18 21 14
61 7 12 20
44 21 24 11
42 19 32 7
58 17 17 8
34 25 23 18
48 21 12 19
43 18 17 22
43 19 21 17
65 16 11 8
42 20 24 14
41 21 21 17
70 11 14 5
T2

SPECIAL EUROBAROMETER 419 “Public Perceptions of Science, Research
and Innovation”
%
EU 28
BE
BG
CZ
DK
DE
EE
IE
EL
ES
FR
HR
IT
CY
LV
LT
LU
HU
MT
NL
AT
PL
PT
RO
SI
SK
FI
SE
UK
QB1.3 Welche Auswirkungen werden Ihrer Meinung nach das Handeln und Verhalten der Menschen in 15 Jahren auf
folgende Bereiche haben? (ROTIEREN)
Sicherheit der Bürger
Un impact
positif
Un impact
négatif
QB1.3 D’ici15 ans, quel impact pensez-vous que les actions et le comportement des gens auront dans les domaines
suivants … ? (ROTATION)
La sécurité des citoyens
QB1.3 15 years from now, what impact do you think people's actions and behaviour will have on the following areas …?
(ROTATE)
Security of citizens
NSP
DK
WN
EB
81.5
A positive
impact
Positive
Auswirkungen
EB
81.5
Pas d’impact
No impact
Keine
Auswirkungen
35 25 22 18
A negative
impact
Negative
Auswirkungen
EB
81.5
EB
81.5
44 21 12 23
35 32 23 10
52 18 16 14
35 31 21
52 11 11 26
13
27 27 28 18
29 29 33 9
53 23 9 15
30 24 24 22
43 25 19 13
31 26 26 17
37 31 17 15
41 22 14 23
47 15 20 18
34 25 22 19
46 24 15 15
50 14 11 25
32 29 26 13
28 31 31 10
47 24 19 10
30 28 23 19
46 23 11 20
29 28 18 25
39 21 22 18
52 21 17 10
36 27 22 15
31 23 22 24
42 26 18 14
T3

SPECIAL EUROBAROMETER 419 “Public Perceptions of Science, Research
and Innovation”
%
EU 28
BE
BG
CZ
DK
DE
EE
IE
EL
ES
FR
HR
IT
CY
LV
LT
LU
HU
MT
NL
AT
PL
PT
RO
SI
SK
FI
SE
UK
QB1.4 Welche Auswirkungen werden Ihrer Meinung nach das Handeln und Verhalten der Menschen in 15 Jahren auf
folgende Bereiche haben? (ROTIEREN)
Schaffung von Arbeitsplätzen
Un impact
positif
Un impact
négatif
QB1.4 D’ici15 ans, quel impact pensez-vous que les actions et le comportement des gens auront dans les domaines
suivants … ? (ROTATION)
La création d’emplois
QB1.4 15 years from now, what impact do you think people's actions and behaviour will have on the following areas …?
(ROTATE)
Job creation
NSP
DK
WN
EB
81.5
A positive
impact
Positive
Auswirkungen
EB
81.5
Pas d’impact
No impact
Keine
Auswirkungen
42 23 17 18
A negative
impact
Negative
Auswirkungen
EB
81.5
EB
81.5
51 18 8 23
40 27 20 13
67 16 5 12
37 32 17
54 13 10 23
14
34 27 20 19
33 31 28 8
70 14 5 11
39 22 18 21
56 19 13 12
35 23 24 18
45 28 14 13
48 20 10 22
56 19 11 14
36 24 19 21
54 20 10 16
57 12 5 26
39 25 22 14
33 29 27 11
53 25 10 12
37 27 19 17
47 24 9 20
41 23 11 25
45 21 17 17
64 19 8 9
44 24 16 16
40 22 16 22
62 18 9 11
T4
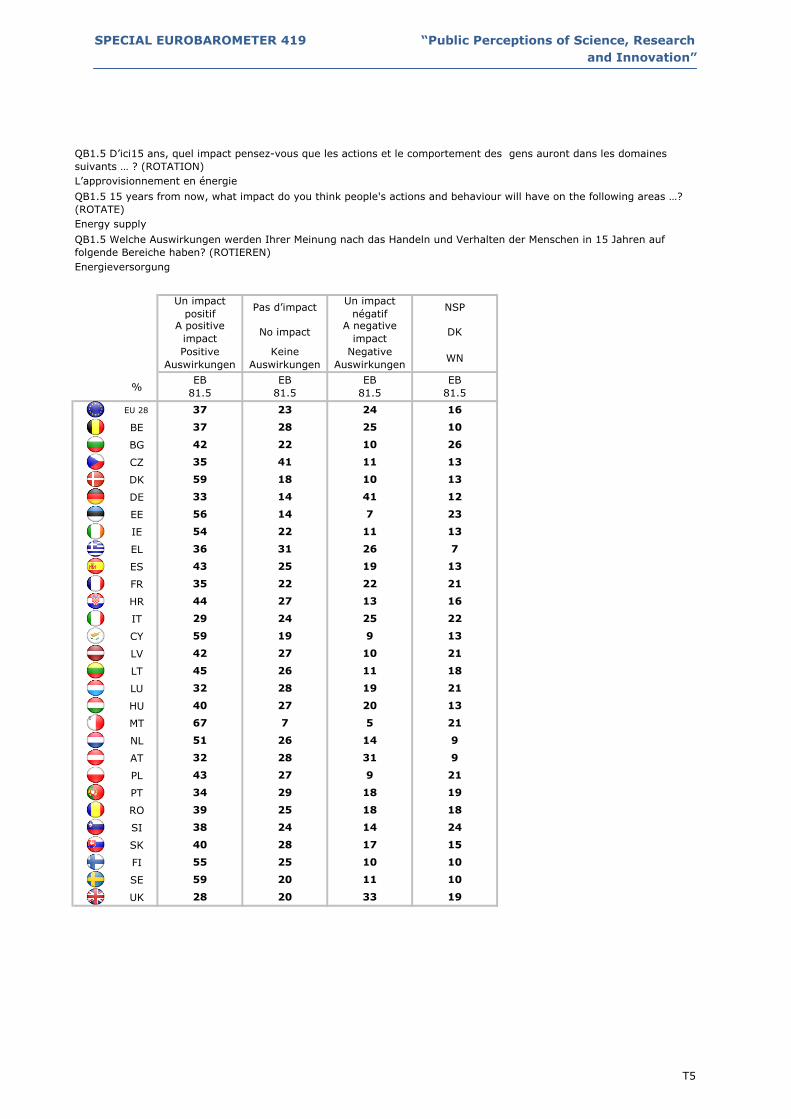
SPECIAL EUROBAROMETER 419 “Public Perceptions of Science, Research
and Innovation”
%
EU 28
BE
BG
CZ
DK
DE
EE
IE
EL
ES
FR
HR
IT
CY
LV
LT
LU
HU
MT
NL
AT
PL
PT
RO
SI
SK
FI
SE
UK
QB1.5 Welche Auswirkungen werden Ihrer Meinung nach das Handeln und Verhalten der Menschen in 15 Jahren auf
folgende Bereiche haben? (ROTIEREN)
Energieversorgung
Un impact
positif
Un impact
négatif
QB1.5 D’ici15 ans, quel impact pensez-vous que les actions et le comportement des gens auront dans les domaines
suivants … ? (ROTATION)
L’approvisionnement en énergie
QB1.5 15 years from now, what impact do you think people's actions and behaviour will have on the following areas …?
(ROTATE)
Energy supply
NSP
DK
WN
EB
81.5
A positive
impact
Positive
Auswirkungen
EB
81.5
Pas d’impact
No impact
Keine
Auswirkungen
37 23 24 16
A negative
impact
Negative
Auswirkungen
EB
81.5
EB
81.5
42 22 10 26
37 28 25 10
59 18 10 13
35 41 11
56 14 7 23
13
33 14 41 12
36 31 26 7
54 22 11 13
35 22 22 21
43 25 19 13
29 24 25 22
44 27 13 16
42 27 10 21
59 19 9 13
32 28 19 21
45 26 11 18
67 7 5 21
40 27 20 13
32 28 31 9
51 26 14 9
34 29 18 19
43 27 9 21
38 24 14 24
39 25 18 18
55 25 10 10
40 28 17 15
28 20 33 19
59 20 11 10
T5

SPECIAL EUROBAROMETER 419 “Public Perceptions of Science, Research
and Innovation”
%
EU 28
BE
BG
CZ
DK
DE
EE
IE
EL
ES
FR
HR
IT
CY
LV
LT
LU
HU
MT
NL
AT
PL
PT
RO
SI
SK
FI
SE
UK
QB1.6 Welche Auswirkungen werden Ihrer Meinung nach das Handeln und Verhalten der Menschen in 15 Jahren auf
folgende Bereiche haben? (ROTIEREN)
Gesundheitswesen und medizinische Versorgung
Un impact
positif
Un impact
négatif
QB1.6 D’ici15 ans, quel impact pensez-vous que les actions et le comportement des gens auront dans les domaines
suivants … ? (ROTATION)
La santé et les soins médicaux
QB1.6 15 years from now, what impact do you think people's actions and behaviour will have on the following areas …?
(ROTATE)
Health and medical care
NSP
DK
WN
EB
81.5
A positive
impact
Positive
Auswirkungen
EB
81.5
Pas d’impact
No impact
Keine
Auswirkungen
43 22 20 15
A negative
impact
Negative
Auswirkungen
EB
81.5
EB
81.5
54 18 8 20
52 26 14 8
67 14 11 8
47 30 11
61 8 10 21
12
37 20 31 12
37 28 28 7
59 19 11 11
40 22 20 18
52 22 15 11
31 28 24 17
47 28 13 12
47 18 13 22
60 18 9 13
50 21 11 18
53 22 10 15
72 9 2 17
38 30 20 12
41 28 23 8
56 17 19 8
45 21 16 18
45 23 12 20
34 26 16 24
47 19 18 16
61 20 12 7
47 23 16 14
42 17 23 18
65 16 10 9
T6

SPECIAL EUROBAROMETER 419 “Public Perceptions of Science, Research
and Innovation”
%
EU 28
BE
BG
CZ
DK
DE
EE
IE
EL
ES
FR
HR
IT
CY
LV
LT
LU
HU
MT
NL
AT
PL
PT
RO
SI
SK
FI
SE
UK
QB1.7 Welche Auswirkungen werden Ihrer Meinung nach das Handeln und Verhalten der Menschen in 15 Jahren auf
folgende Bereiche haben? (ROTIEREN)
Schutz persönlicher Daten
Un impact
positif
Un impact
négatif
QB1.7 D’ici15 ans, quel impact pensez-vous que les actions et le comportement des gens auront dans les domaines
suivants … ? (ROTATION)
La protection des données personnelles
QB1.7 15 years from now, what impact do you think people's actions and behaviour will have on the following areas …?
(ROTATE)
Protection of personal data
NSP
DK
WN
EB
81.5
A positive
impact
Positive
Auswirkungen
EB
81.5
Pas d’impact
No impact
Keine
Auswirkungen
28 23 30 19
A negative
impact
Negative
Auswirkungen
EB
81.5
EB
81.5
37 21 13 29
29 28 32 11
47 15 26 12
30 34 21
47 9 18 26
15
18 16 52 14
24 30 38 8
53 19 14 14
26 16 34 24
38 24 20 18
21 34 22 23
32 27 26 15
37 20 20 23
40 20 20 20
30 21 27 22
40 20 21 19
51 9 12 28
30 31 26 13
21 24 45 10
32 24 34 10
27 26 24 23
35 29 15 21
27 25 23 25
32 24 18 26
48 25 17 10
31 28 23 18
31 18 29 22
38 22 27 13
T7

SPECIAL EUROBAROMETER 419 “Public Perceptions of Science, Research
and Innovation”
%
EU 28
BE
BG
CZ
DK
DE
EE
IE
EL
ES
FR
HR
IT
CY
LV
LT
LU
HU
MT
NL
AT
PL
PT
RO
SI
SK
FI
SE
UK
QB1.8 Welche Auswirkungen werden Ihrer Meinung nach das Handeln und Verhalten der Menschen in 15 Jahren auf
folgende Bereiche haben? (ROTIEREN)
Verringerung von Ungleichheiten
Un impact
positif
Un impact
négatif
QB1.8 D’ici15 ans, quel impact pensez-vous que les actions et le comportement des gens auront dans les domaines
suivants … ? (ROTATION)
La réduction des inégalités
QB1.8 15 years from now, what impact do you think people's actions and behaviour will have on the following areas …?
(ROTATE)
Reduction of inequalities
NSP
DK
WN
EB
81.5
A positive
impact
Positive
Auswirkungen
EB
81.5
Pas d’impact
No impact
Keine
Auswirkungen
31 29 22 18
A negative
impact
Negative
Auswirkungen
EB
81.5
EB
81.5
37 25 13 25
30 32 26 12
40 25 20 15
25 38 21
44 18 12 26
16
20 32 31 17
26 32 34 8
49 26 9 16
27 29 23 21
43 25 19 13
29 30 23 18
34 35 17 14
31 32 13 24
42 23 18 17
26 37 17 20
37 33 12 18
49 16 8 27
32 31 24 13
24 38 25 13
34 32 22 12
28 29 24 19
36 32 10 22
30 28 18 24
33 28 18 21
52 25 13 10
28 34 20 18
31 26 19 24
55 23 13 9
T8

SPECIAL EUROBAROMETER 419 “Public Perceptions of Science, Research
and Innovation”
%
EU 28
BE
BG
CZ
DK
DE
EE
IE
EL
ES
FR
HR
IT
CY
LV
LT
LU
HU
MT
NL
AT
PL
PT
RO
SI
SK
FI
SE
UK
QB1.9 Welche Auswirkungen werden Ihrer Meinung nach das Handeln und Verhalten der Menschen in 15 Jahren auf
folgende Bereiche haben? (ROTIEREN)
Anpassung der Gesellschaft an eine alternde Bevölkerung
Un impact
positif
Un impact
négatif
QB1.9 D’ici15 ans, quel impact pensez-vous que les actions et le comportement des gens auront dans les domaines
suivants … ? (ROTATION)
L’adaptation de la société à une population vieillissante
QB1.9 15 years from now, what impact do you think people's actions and behaviour will have on the following areas …?
(ROTATE)
Adaptation of society to an ageing population
NSP
DK
WN
EB
81.5
A positive
impact
Positive
Auswirkungen
EB
81.5
Pas d’impact
No impact
Keine
Auswirkungen
34 24 24 18
A negative
impact
Negative
Auswirkungen
EB
81.5
EB
81.5
34 24 14 28
38 24 26 12
52 18 17 13
27 33 26
37 16 18 29
14
32 19 33 16
23 36 31 10
54 21 10 15
37 21 20 22
40 27 20 13
26 29 26 19
32 35 16 17
31 26 16 27
30 20 24 26
36 23 20 21
35 30 14 21
44 13 16 27
31 28 27 14
31 31 27 11
50 18 21 11
29 26 27 18
35 27 17 21
33 26 15 26
29 24 23 24
49 24 15 12
32 27 23 18
36 20 23 21
49 23 18 10
T9

SPECIAL EUROBAROMETER 419 “Public Perceptions of Science, Research
and Innovation”
%
EU 28
BE
BG
CZ
DK
DE
EE
IE
EL
ES
FR
HR
IT
CY
LV
LT
LU
HU
MT
NL
AT
PL
PT
RO
SI
SK
FI
SE
UK
QB1.10 Welche Auswirkungen werden Ihrer Meinung nach das Handeln und Verhalten der Menschen in 15 Jahren auf
folgende Bereiche haben? (ROTIEREN)
Verfügbarkeit und Qualität von Nahrungsmitteln
Un impact
positif
Un impact
négatif
QB1.10 D’ici15 ans, quel impact pensez-vous que les actions et le comportement des gens auront dans les domaines
suivants … ? (ROTATION)
La disponibilité et la qualité de la nourriture
QB1.10 15 years from now, what impact do you think people's actions and behaviour will have on the following areas …?
(ROTATE)
Availability and quality of food
NSP
DK
WN
EB
81.5
A positive
impact
Positive
Auswirkungen
EB
81.5
Pas d’impact
No impact
Keine
Auswirkungen
38 24 23 15
A negative
impact
Negative
Auswirkungen
EB
81.5
EB
81.5
45 18 18 19
38 26 27 9
62 16 12 10
43 29 17
52 14 12 22
11
33 24 30 13
31 31 31 7
62 18 9 11
33 20 29 18
47 26 14 13
28 28 26 18
38 27 23 12
39 19 23 19
53 17 17 13
36 23 23 18
45 23 18 14
53 13 11 23
36 30 21 13
37 24 31 8
52 22 18 8
35 26 21 18
42 25 15 18
34 22 22 22
37 20 25 18
59 19 13 9
43 23 19 15
36 24 21 19
64 15 14 7
T10

SPECIAL EUROBAROMETER 419 “Public Perceptions of Science, Research
and Innovation”
%
EU 28
BE
BG
CZ
DK
DE
EE
IE
EL
ES
FR
HR
IT
CY
LV
LT
LU
HU
MT
NL
AT
PL
PT
RO
SI
SK
FI
SE
UK
QB1.11 Welche Auswirkungen werden Ihrer Meinung nach das Handeln und Verhalten der Menschen in 15 Jahren auf
folgende Bereiche haben? (ROTIEREN)
Verkehr und Verkehrsinfrastruktur
Un impact
positif
Un impact
négatif
QB1.11 D’ici15 ans, quel impact pensez-vous que les actions et le comportement des gens auront dans les domaines
suivants … ? (ROTATION)
Le transport et les infrastructures de transport
QB1.11 15 years from now, what impact do you think people's actions and behaviour will have on the following areas …?
(ROTATE)
Transport and transport infrastructure
NSP
DK
WN
EB
81.5
A positive
impact
Positive
Auswirkungen
EB
81.5
Pas d’impact
No impact
Keine
Auswirkungen
41 24 18 17
A negative
impact
Negative
Auswirkungen
EB
81.5
EB
81.5
55 16 8 21
39 28 22 11
62 19 7 12
38 35 14
58 13 5 24
13
33 19 32 16
39 35 17 9
62 20 6 12
45 22 12 21
50 29 9 12
29 29 22 20
48 27 8 17
48 23 9 20
52 22 8 18
41 25 14 20
50 23 9 18
54 10 9 27
43 28 17 12
29 27 35 9
47 27 11 15
36 29 16 19
50 22 7 21
36 26 11 27
46 21 15 18
61 21 9 9
49 21 15 15
39 21 19 21
56 18 14 12
T11

SPECIAL EUROBAROMETER 419 “Public Perceptions of Science, Research
and Innovation”
%
EU 28
BE
BG
CZ
DK
DE
EE
IE
EL
ES
FR
HR
IT
CY
LV
LT
LU
HU
MT
NL
AT
PL
PT
RO
SI
SK
FI
SE
UK
QB1.12 Welche Auswirkungen werden Ihrer Meinung nach das Handeln und Verhalten der Menschen in 15 Jahren auf
folgende Bereiche haben? (ROTIEREN)
Bildung und Kompetenzen
Un impact
positif
Un impact
négatif
QB1.12 D’ici15 ans, quel impact pensez-vous que les actions et le comportement des gens auront dans les domaines
suivants … ? (ROTATION)
L’éducation et les compétences
QB1.12 15 years from now, what impact do you think people's actions and behaviour will have on the following areas …?
(ROTATE)
Education & skills
NSP
DK
WN
EB
81.5
A positive
impact
Positive
Auswirkungen
EB
81.5
Pas d’impact
No impact
Keine
Auswirkungen
48 22 14 16
A negative
impact
Negative
Auswirkungen
EB
81.5
EB
81.5
63 11 7 19
48 30 14 8
76 11 4 9
51 29 8
69 7 6 18
12
44 22 17 17
44 29 20 7
72 12 6 10
41 21 17 21
54 23 11 12
37 27 19 17
58 21 7 14
55 18 8 19
66 13 10 11
40 26 17 17
59 18 9 14
73 7 2 18
45 25 17 13
39 31 19 11
62 18 11 9
44 22 16 18
55 20 7 18
42 24 10 24
46 21 16 17
72 16 4 8
52 22 12 14
49 19 14 18
69 14 8 9
T12

SPECIAL EUROBAROMETER 419 “Public Perceptions of Science, Research
and Innovation”
%
EU 28
BE
BG
CZ
DK
DE
EE
IE
EL
ES
FR
HR
IT
CY
LV
LT
LU
HU
MT
NL
AT
PL
PT
RO
SI
SK
FI
SE
UK
QB1.13 Welche Auswirkungen werden Ihrer Meinung nach das Handeln und Verhalten der Menschen in 15 Jahren auf
folgende Bereiche haben? (ROTIEREN)
Qualität des Wohnraums
Un impact
positif
Un impact
négatif
QB1.13 D’ici15 ans, quel impact pensez-vous que les actions et le comportement des gens auront dans les domaines
suivants … ? (ROTATION)
La qualité du logement
QB1.13 15 years from now, what impact do you think people's actions and behaviour will have on the following areas …?
(ROTATE)
Quality of housing
NSP
DK
WN
EB
81.5
A positive
impact
Positive
Auswirkungen
EB
81.5
Pas d’impact
No impact
Keine
Auswirkungen
38 29 16 17
A negative
impact
Negative
Auswirkungen
EB
81.5
EB
81.5
48 23 6 23
39 31 20 10
66 20 3 11
40 37 10
57 16 5 22
13
28 32 24 16
34 37 21 8
59 22 7 12
39 27 14 20
47 30 11 12
26 32 20 22
46 29 10 15
46 24 10 20
47 24 14 15
36 26 20 18
47 27 8 18
50 17 10 23
38 30 20 12
31 35 23 11
56 29 7 8
36 31 16 17
49 24 7 20
34 28 13 25
46 23 14 17
59 25 7 9
46 28 11 15
33 27 20 20
50 32 7 11
T13

SPECIAL EUROBAROMETER 419 “Public Perceptions of Science, Research
and Innovation”
%
EU 28
BE
BG
CZ
DK
DE
EE
IE
EL
ES
FR
HR
IT
CY
LV
LT
LU
HU
MT
NL
AT
PL
PT
RO
SI
SK
FI
SE
UK
QB2.1 Welche Auswirkungen werden Ihrer Meinung nach Wissenschaft und technische Innovation in 15 Jahren auf folgende
Bereiche haben? (ROTIEREN)
Kampf gegen den Klimawandel
Un impact
positif
Un impact
négatif
QB2.1 D’ici 15 ans, quel impact pensez-vous que la science et l’innovation technologique auront dans les domaines suivants
… ? (ROTATION)
La lutte contre le changement climatique
QB2.1 15 years from now, what impact do you think science and technological innovation will have on the following areas
…? (ROTATE)
Fight against climate change
NSP
DK
WN
EB
81.5
A positive
impact
Positive
Auswirkungen
EB
81.5
Pas d’impact
No impact
Keine
Auswirkungen
54 19 13 14
A negative
impact
Negative
Auswirkungen
EB
81.5
EB
81.5
58 15 8 19
61 18 13 8
77 11 5 7
43 31 12
53 18 6 23
14
54 18 17 11
49 22 23 6
69 15 4 12
54 20 10 16
71 11 9 9
43 20 21 16
47 24 16 13
46 24 10 20
57 13 14 16
52 17 11 20
59 16 11 14
64 11 4 21
49 25 14 12
47 24 20 9
69 18 7 6
50 25 9 16
51 25 6 18
51 17 12 20
46 19 14 21
73 15 4 8
47 22 17 14
51 21 9 19
82 10 4 4
T14

SPECIAL EUROBAROMETER 419 “Public Perceptions of Science, Research
and Innovation”
%
EU 28
BE
BG
CZ
DK
DE
EE
IE
EL
ES
FR
HR
IT
CY
LV
LT
LU
HU
MT
NL
AT
PL
PT
RO
SI
SK
FI
SE
UK
QB2.2 Welche Auswirkungen werden Ihrer Meinung nach Wissenschaft und technische Innovation in 15 Jahren auf folgende
Bereiche haben? (ROTIEREN)
Schutz der Umwelt
Un impact
positif
Un impact
négatif
QB2.2 D’ici 15 ans, quel impact pensez-vous que la science et l’innovation technologique auront dans les domaines suivants
… ? (ROTATION)
La protection de l’environnement
QB2.2 15 years from now, what impact do you think science and technological innovation will have on the following areas
…? (ROTATE)
Protection of the environment
NSP
DK
WN
EB
81.5
A positive
impact
Positive
Auswirkungen
EB
81.5
Pas d’impact
No impact
Keine
Auswirkungen
57 17 13 13
A negative
impact
Negative
Auswirkungen
EB
81.5
EB
81.5
59 13 11 17
59 19 15 7
78 11 4 7
53 23 13
65 8 7 20
11
58 15 17 10
52 20 23 5
70 14 6 10
59 15 11 15
72 10 10 8
43 21 22 14
54 17 17 12
55 17 10 18
66 9 14 11
54 17 9 20
65 13 10 12
67 5 7 21
54 21 14 11
47 24 21 8
72 15 7 6
52 23 9 16
55 20 7 18
53 15 12 20
49 18 15 18
72 17 5 6
50 19 17 14
54 18 10 18
83 10 4 3
T15
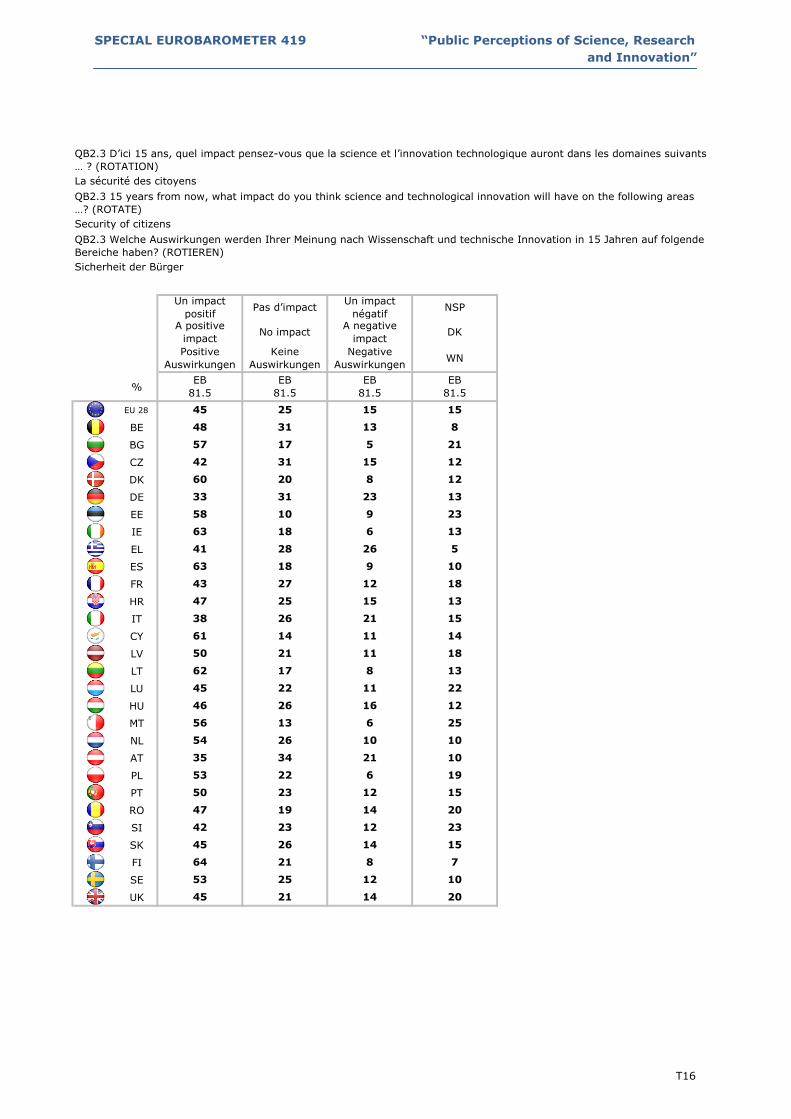
SPECIAL EUROBAROMETER 419 “Public Perceptions of Science, Research
and Innovation”
%
EU 28
BE
BG
CZ
DK
DE
EE
IE
EL
ES
FR
HR
IT
CY
LV
LT
LU
HU
MT
NL
AT
PL
PT
RO
SI
SK
FI
SE
UK
QB2.3 Welche Auswirkungen werden Ihrer Meinung nach Wissenschaft und technische Innovation in 15 Jahren auf folgende
Bereiche haben? (ROTIEREN)
Sicherheit der Bürger
Un impact
positif
Un impact
négatif
QB2.3 D’ici 15 ans, quel impact pensez-vous que la science et l’innovation technologique auront dans les domaines suivants
… ? (ROTATION)
La sécurité des citoyens
QB2.3 15 years from now, what impact do you think science and technological innovation will have on the following areas
…? (ROTATE)
Security of citizens
NSP
DK
WN
EB
81.5
A positive
impact
Positive
Auswirkungen
EB
81.5
Pas d’impact
No impact
Keine
Auswirkungen
45 25 15 15
A negative
impact
Negative
Auswirkungen
EB
81.5
EB
81.5
57 17 5 21
48 31 13 8
60 20 8 12
42 31 15
58 10 9 23
12
33 31 23 13
41 28 26 5
63 18 6 13
43 27 12 18
63 18 9 10
38 26 21 15
47 25 15 13
50 21 11 18
61 14 11 14
45 22 11 22
62 17 8 13
56 13 6 25
46 26 16 12
35 34 21 10
54 26 10 10
50 23 12 15
53 22 6 19
42 23 12 23
47 19 14 20
64 21 8 7
45 26 14 15
45 21 14 20
53 25 12 10
T16

SPECIAL EUROBAROMETER 419 “Public Perceptions of Science, Research
and Innovation”
%
EU 28
BE
BG
CZ
DK
DE
EE
IE
EL
ES
FR
HR
IT
CY
LV
LT
LU
HU
MT
NL
AT
PL
PT
RO
SI
SK
FI
SE
UK
QB2.4 Welche Auswirkungen werden Ihrer Meinung nach Wissenschaft und technische Innovation in 15 Jahren auf folgende
Bereiche haben? (ROTIEREN)
Schaffung von Arbeitsplätzen
Un impact
positif
Un impact
négatif
QB2.4 D’ici 15 ans, quel impact pensez-vous que la science et l’innovation technologique auront dans les domaines suivants
… ? (ROTATION)
La création d’emplois
QB2.4 15 years from now, what impact do you think science and technological innovation will have on the following areas
…? (ROTATE)
Job creation
NSP
DK
WN
EB
81.5
A positive
impact
Positive
Auswirkungen
EB
81.5
Pas d’impact
No impact
Keine
Auswirkungen
45 21 19 15
A negative
impact
Negative
Auswirkungen
EB
81.5
EB
81.5
54 16 12 18
41 26 23 10
57 22 11 10
41 28 17
54 10 16 20
14
37 22 27 14
42 23 30 5
75 11 5 9
44 21 18 17
60 14 16 10
38 22 24 16
50 19 20 11
50 20 13 17
66 10 11 13
39 24 15 22
63 16 9 12
60 8 6 26
44 22 21 13
35 30 26 9
40 27 25 8
46 23 16 15
50 23 9 18
47 18 14 21
50 17 15 18
59 18 15 8
52 19 15 14
47 19 16 18
54 21 17 8
T17

SPECIAL EUROBAROMETER 419 “Public Perceptions of Science, Research
and Innovation”
%
EU 28
BE
BG
CZ
DK
DE
EE
IE
EL
ES
FR
HR
IT
CY
LV
LT
LU
HU
MT
NL
AT
PL
PT
RO
SI
SK
FI
SE
UK
QB2.5 Welche Auswirkungen werden Ihrer Meinung nach Wissenschaft und technische Innovation in 15 Jahren auf folgende
Bereiche haben? (ROTIEREN)
Energieversorgung
Un impact
positif
Un impact
négatif
QB2.5 D’ici 15 ans, quel impact pensez-vous que la science et l’innovation technologique auront dans les domaines suivants
… ? (ROTATION)
L’approvisionnement en énergie
QB2.5 15 years from now, what impact do you think science and technological innovation will have on the following areas
…? (ROTATE)
Energy supply
NSP
DK
WN
EB
81.5
A positive
impact
Positive
Auswirkungen
EB
81.5
Pas d’impact
No impact
Keine
Auswirkungen
58 16 12 14
A negative
impact
Negative
Auswirkungen
EB
81.5
EB
81.5
62 13 5 20
64 16 12 8
84 8 1 7
55 25 7
72 7 3 18
13
52 14 23 11
60 22 13 5
71 14 4 11
60 14 9 17
72 11 8 9
43 19 20 18
63 15 8 14
61 17 5 17
77 8 4 11
53 16 10 21
71 14 3 12
73 3 3 21
57 20 11 12
54 24 13 9
80 10 5 5
60 19 7 14
56 21 5 18
61 13 6 20
54 18 10 18
79 12 2 7
57 20 9 14
54 16 13 17
83 11 2 4
T18

SPECIAL EUROBAROMETER 419 “Public Perceptions of Science, Research
and Innovation”
%
EU 28
BE
BG
CZ
DK
DE
EE
IE
EL
ES
FR
HR
IT
CY
LV
LT
LU
HU
MT
NL
AT
PL
PT
RO
SI
SK
FI
SE
UK
QB2.6 Welche Auswirkungen werden Ihrer Meinung nach Wissenschaft und technische Innovation in 15 Jahren auf folgende
Bereiche haben? (ROTIEREN)
Gesundheitswesen und medizinische Versorgung
Un impact
positif
Un impact
négatif
QB2.6 D’ici 15 ans, quel impact pensez-vous que la science et l’innovation technologique auront dans les domaines suivants
… ? (ROTATION)
La santé et les soins médicaux
QB2.6 15 years from now, what impact do you think science and technological innovation will have on the following areas
…? (ROTATE)
Health and medical care
NSP
DK
WN
EB
81.5
A positive
impact
Positive
Auswirkungen
EB
81.5
Pas d’impact
No impact
Keine
Auswirkungen
65 14 10 11
A negative
impact
Negative
Auswirkungen
EB
81.5
EB
81.5
72 10 4 14
76 12 6 6
82 9 3 6
66 17 7
74 5 5 16
10
63 11 17 9
60 18 18 4
75 11 4 10
72 9 7 12
79 8 6 7
43 24 19 14
66 15 9 10
66 13 5 16
78 9 3 10
65 13 3 19
77 9 3 11
78 4 1 17
58 20 12 10
63 18 11 8
84 6 5 5
67 14 7 12
59 19 6 16
53 18 8 21
56 17 10 17
78 12 5 5
62 16 9 13
69 12 7 12
83 9 3 5
T19

SPECIAL EUROBAROMETER 419 “Public Perceptions of Science, Research
and Innovation”
%
EU 28
BE
BG
CZ
DK
DE
EE
IE
EL
ES
FR
HR
IT
CY
LV
LT
LU
HU
MT
NL
AT
PL
PT
RO
SI
SK
FI
SE
UK
QB2.7 Welche Auswirkungen werden Ihrer Meinung nach Wissenschaft und technische Innovation in 15 Jahren auf folgende
Bereiche haben? (ROTIEREN)
Schutz persönlicher Daten
Un impact
positif
Un impact
négatif
QB2.7 D’ici 15 ans, quel impact pensez-vous que la science et l’innovation technologique auront dans les domaines suivants
… ? (ROTATION)
La protection des données personnelles
QB2.7 15 years from now, what impact do you think science and technological innovation will have on the following areas
…? (ROTATE)
Protection of personal data
NSP
DK
WN
EB
81.5
A positive
impact
Positive
Auswirkungen
EB
81.5
Pas d’impact
No impact
Keine
Auswirkungen
37 22 25 16
A negative
impact
Negative
Auswirkungen
EB
81.5
EB
81.5
50 17 9 24
38 25 27 10
60 13 18 9
38 30 18
53 9 15 23
14
23 21 45 11
29 29 36 6
64 13 11 12
37 15 28 20
54 17 15 14
27 30 24 19
40 22 26 12
50 18 13 19
55 12 16 17
41 14 22 23
62 12 13 13
52 11 10 27
41 28 17 14
26 26 38 10
42 19 33 6
43 22 17 18
44 25 10 21
36 21 20 23
41 20 16 23
60 20 13 7
42 25 16 17
40 19 21 20
43 23 24 10
T20

SPECIAL EUROBAROMETER 419 “Public Perceptions of Science, Research
and Innovation”
%
EU 28
BE
BG
CZ
DK
DE
EE
IE
EL
ES
FR
HR
IT
CY
LV
LT
LU
HU
MT
NL
AT
PL
PT
RO
SI
SK
FI
SE
UK
QB2.8 Welche Auswirkungen werden Ihrer Meinung nach Wissenschaft und technische Innovation in 15 Jahren auf folgende
Bereiche haben? (ROTIEREN)
Verringerung von Ungleichheiten
Un impact
positif
Un impact
négatif
QB2.8 D’ici 15 ans, quel impact pensez-vous que la science et l’innovation technologique auront dans les domaines suivants
… ? (ROTATION)
La réduction des inégalités
QB2.8 15 years from now, what impact do you think science and technological innovation will have on the following areas
…? (ROTATE)
Reduction of inequalities
NSP
DK
WN
EB
81.5
A positive
impact
Positive
Auswirkungen
EB
81.5
Pas d’impact
No impact
Keine
Auswirkungen
30 38 15 17
A negative
impact
Negative
Auswirkungen
EB
81.5
EB
81.5
37 31 8 24
27 47 16 10
27 47 12 14
23 47 14
39 28 8 25
16
18 42 24 16
27 40 25 8
54 27 5 14
25 40 15 20
48 29 11 12
27 34 21 18
34 36 15 15
31 40 9 20
46 25 12 17
23 39 14 24
43 35 7 15
45 21 6 28
33 38 16 13
17 51 19 13
19 57 14 10
40 30 14 16
38 33 7 22
32 32 14 22
38 28 14 20
38 42 11 9
32 39 13 16
28 37 10 25
37 48 7 8
T21

SPECIAL EUROBAROMETER 419 “Public Perceptions of Science, Research
and Innovation”
%
EU 28
BE
BG
CZ
DK
DE
EE
IE
EL
ES
FR
HR
IT
CY
LV
LT
LU
HU
MT
NL
AT
PL
PT
RO
SI
SK
FI
SE
UK
QB2.9 Welche Auswirkungen werden Ihrer Meinung nach Wissenschaft und technische Innovation in 15 Jahren auf folgende
Bereiche haben? (ROTIEREN)
Anpassung der Gesellschaft an eine alternde Bevölkerung
Un impact
positif
Un impact
négatif
QB2.9 D’ici 15 ans, quel impact pensez-vous que la science et l’innovation technologique auront dans les domaines suivants
… ? (ROTATION)
L’adaptation de la société à une population vieillissante
QB2.9 15 years from now, what impact do you think science and technological innovation will have on the following areas
…? (ROTATE)
Adaptation of society to an ageing population
NSP
DK
WN
EB
81.5
A positive
impact
Positive
Auswirkungen
EB
81.5
Pas d’impact
No impact
Keine
Auswirkungen
44 26 14 16
A negative
impact
Negative
Auswirkungen
EB
81.5
EB
81.5
35 30 8 27
50 30 11 9
59 21 10 10
31 40 15
49 20 7 24
14
37 28 21 14
37 36 19 8
63 21 4 12
53 21 10 16
60 20 9 11
31 31 21 17
39 32 13 16
39 32 7 22
44 19 13 24
45 21 11 23
49 28 5 18
55 12 6 27
33 35 19 13
29 43 17 11
57 26 10 7
42 26 17 15
44 26 9 21
40 29 9 22
36 26 14 24
54 28 9 9
37 32 14 17
48 22 10 20
60 25 7 8
T22

SPECIAL EUROBAROMETER 419 “Public Perceptions of Science, Research
and Innovation”
%
EU 28
BE
BG
CZ
DK
DE
EE
IE
EL
ES
FR
HR
IT
CY
LV
LT
LU
HU
MT
NL
AT
PL
PT
RO
SI
SK
FI
SE
UK
QB2.10 Welche Auswirkungen werden Ihrer Meinung nach Wissenschaft und technische Innovation in 15 Jahren auf
folgende Bereiche haben? (ROTIEREN)
Verfügbarkeit und Qualität von Nahrungsmitteln
Un impact
positif
Un impact
négatif
QB2.10 D’ici 15 ans, quel impact pensez-vous que la science et l’innovation technologique auront dans les domaines
suivants … ? (ROTATION)
La disponibilité et la qualité de la nourriture
QB2.10 15 years from now, what impact do you think science and technological innovation will have on the following areas
…? (ROTATE)
Availability and quality of food
NSP
DK
WN
EB
81.5
A positive
impact
Positive
Auswirkungen
EB
81.5
Pas d’impact
No impact
Keine
Auswirkungen
48 22 16 14
A negative
impact
Negative
Auswirkungen
EB
81.5
EB
81.5
52 15 15 18
54 22 17 7
69 15 6 10
50 26 13
60 10 9 21
11
44 22 23 11
48 24 23 5
70 14 6 10
40 23 21 16
63 17 9 11
35 27 22 16
42 24 20 14
46 21 17 16
64 14 10 12
39 21 19 21
57 16 14 13
57 9 11 23
48 25 16 11
38 27 25 10
70 15 8 7
52 23 10 15
49 22 12 17
41 19 19 21
43 21 18 18
62 23 8 7
49 20 16 15
52 22 10 16
67 18 8 7
T23
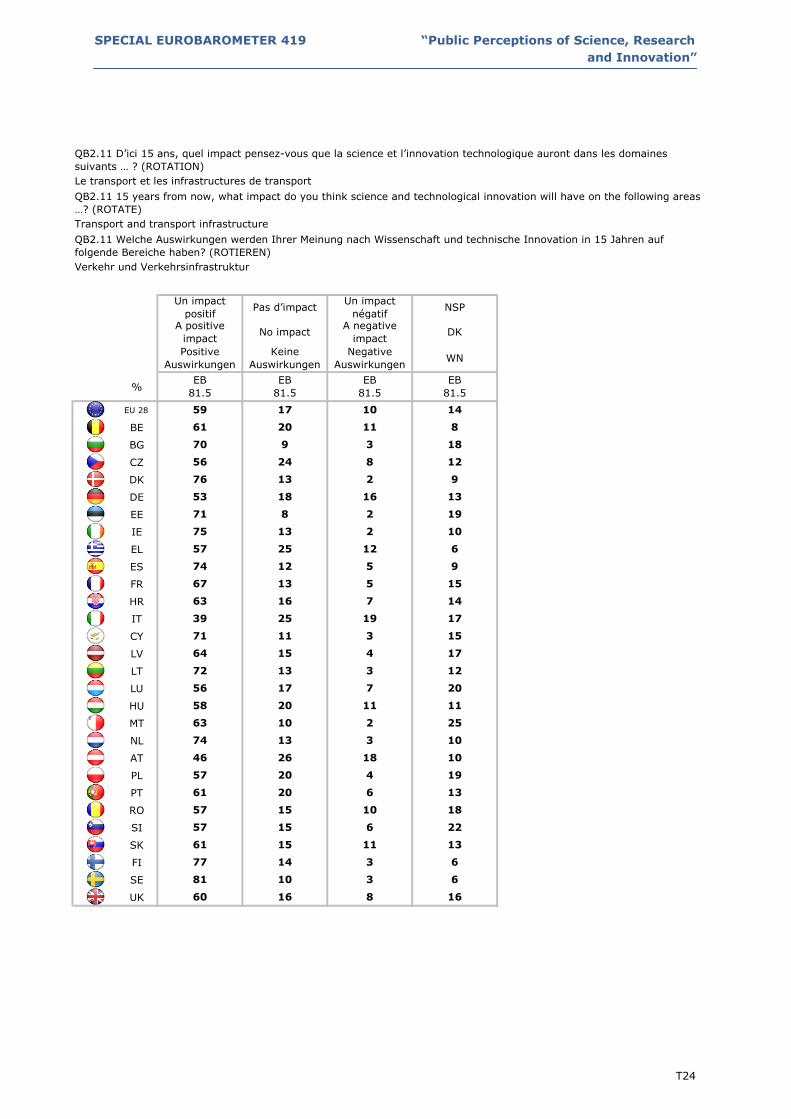
SPECIAL EUROBAROMETER 419 “Public Perceptions of Science, Research
and Innovation”
%
EU 28
BE
BG
CZ
DK
DE
EE
IE
EL
ES
FR
HR
IT
CY
LV
LT
LU
HU
MT
NL
AT
PL
PT
RO
SI
SK
FI
SE
UK
QB2.11 Welche Auswirkungen werden Ihrer Meinung nach Wissenschaft und technische Innovation in 15 Jahren auf
folgende Bereiche haben? (ROTIEREN)
Verkehr und Verkehrsinfrastruktur
Un impact
positif
Un impact
négatif
QB2.11 D’ici 15 ans, quel impact pensez-vous que la science et l’innovation technologique auront dans les domaines
suivants … ? (ROTATION)
Le transport et les infrastructures de transport
QB2.11 15 years from now, what impact do you think science and technological innovation will have on the following areas
…? (ROTATE)
Transport and transport infrastructure
NSP
DK
WN
EB
81.5
A positive
impact
Positive
Auswirkungen
EB
81.5
Pas d’impact
No impact
Keine
Auswirkungen
59 17 10 14
A negative
impact
Negative
Auswirkungen
EB
81.5
EB
81.5
70 9 3 18
61 20 11 8
76 13 2 9
56 24 8
71 8 2 19
12
53 18 16 13
57 25 12 6
75 13 2 10
67 13 5 15
74 12 5 9
39 25 19 17
63 16 7 14
64 15 4 17
71 11 3 15
56 17 7 20
72 13 3 12
63 10 2 25
58 20 11 11
46 26 18 10
74 13 3 10
61 20 6 13
57 20 4 19
57 15 6 22
57 15 10 18
77 14 3 6
61 15 11 13
60 16 8 16
81 10 3 6
T24

SPECIAL EUROBAROMETER 419 “Public Perceptions of Science, Research
and Innovation”
%
EU 28
BE
BG
CZ
DK
DE
EE
IE
EL
ES
FR
HR
IT
CY
LV
LT
LU
HU
MT
NL
AT
PL
PT
RO
SI
SK
FI
SE
UK
QB2.12 Welche Auswirkungen werden Ihrer Meinung nach Wissenschaft und technische Innovation in 15 Jahren auf
folgende Bereiche haben? (ROTIEREN)
Bildung und Kompetenzen
Un impact
positif
Un impact
négatif
QB2.12 D’ici 15 ans, quel impact pensez-vous que la science et l’innovation technologique auront dans les domaines
suivants … ? (ROTATION)
L’éducation et les compétences
QB2.12 15 years from now, what impact do you think science and technological innovation will have on the following areas
…? (ROTATE)
Education & skills
NSP
DK
WN
EB
81.5
A positive
impact
Positive
Auswirkungen
EB
81.5
Pas d’impact
No impact
Keine
Auswirkungen
60 18 9 13
A negative
impact
Negative
Auswirkungen
EB
81.5
EB
81.5
73 10 3 14
62 23 8 7
78 13 2 7
62 21 6
73 5 5 17
11
55 20 12 13
63 20 12 5
80 9 3 8
55 20 9 16
73 14 5 8
42 24 19 15
68 15 7 10
65 16 5 14
78 10 3 9
49 24 7 20
74 12 2 12
77 4 3 16
57 23 9 11
45 32 11 12
75 14 4 7
61 19 6 14
61 19 4 16
58 16 5 21
56 15 11 18
78 13 3 6
62 19 7 12
63 16 7 14
80 12 3 5
T25

SPECIAL EUROBAROMETER 419 “Public Perceptions of Science, Research
and Innovation”
%
EU 28
BE
BG
CZ
DK
DE
EE
IE
EL
ES
FR
HR
IT
CY
LV
LT
LU
HU
MT
NL
AT
PL
PT
RO
SI
SK
FI
SE
UK
QB2.13 Welche Auswirkungen werden Ihrer Meinung nach Wissenschaft und technische Innovation in 15 Jahren auf
folgende Bereiche haben? (ROTIEREN)
Qualität des Wohnraums
Un impact
positif
Un impact
négatif
QB2.13 D’ici 15 ans, quel impact pensez-vous que la science et l’innovation technologique auront dans les domaines
suivants … ? (ROTATION)
La qualité du logement
QB2.13 15 years from now, what impact do you think science and technological innovation will have on the following areas
…? (ROTATE)
Quality of housing
NSP
DK
WN
EB
81.5
A positive
impact
Positive
Auswirkungen
EB
81.5
Pas d’impact
No impact
Keine
Auswirkungen
50 26 10 14
A negative
impact
Negative
Auswirkungen
EB
81.5
EB
81.5
61 18 3 18
52 30 10 8
74 16 2 8
46 37 5
62 16 3 19
12
38 34 15 13
47 32 15 6
67 20 3 10
56 22 7 15
67 17 6 10
33 29 18 20
57 24 7 12
57 22 5 16
65 17 6 12
45 24 11 20
58 24 2 16
57 16 3 24
46 32 11 11
35 38 16 11
74 18 3 5
52 27 7 14
55 23 6 16
45 26 7 22
53 19 10 18
69 22 2 7
57 22 7 14
47 25 10 18
64 27 3 6
T26

SPECIAL EUROBAROMETER 419 “Public Perceptions of Science, Research
and Innovation”
%
EU 28
BE
BG
CZ
DK
DE
EE
IE
EL
ES
FR
HR
IT
CY
LV
LT
LU
HU
MT
NL
AT
PL
PT
RO
SI
SK
FI
SE
UK
QB3a Dans les 15 prochaines années, quelles devraient être les priorités pour la science et l’innovation technologique? En
premier ? (ROTATION)
QB3a Over the next 15 years, what should be the priorities when it comes to science and technological innovation? Firstly?
(ROTATE)
QB3a Welche Themen sollten Ihrer Meinung nach im Bereich Wissenschaft und technische Innovation in den nächsten 15
Jahren Priorität haben? Erstens? (ROTIEREN)
La protection de
l’environnement
Protection of the
environment
La création
d’emplois
Job creation
La santé et les
soins médicaux
Health and medical
care
Schutz der
Umwelt
EB
81.5
La lutte contre
le changement
climatique
Fight against
climate change
Kampf gegen
den
Klimawandel
EB
81.5
Schaffung von
Arbeitsplätzen
EB
81.5
La sécurité des
citoyens
Security of
citizens
Sicherheit der
Bürger
EB
81.5
Gesundheitswesen
und medizinische
Versorgung
EB
81.5
L’approvisionnement
en énergie
Energy supply
Energieversorgung
EB
81.5
6 207 7 5 22
11 11 6 16 7 19
5 7 7 24 2 19
5 9 7 15 3 27
20 11 5 7 8 17
11 9 6 13 9 11
3 6 7 11 7 19
3 5 3 31 5 23
4 8 8 28 4 19
4 6 2 30 3 26
8 10 5 25 5 20
5 5 4 38 4 14
7 6 7 30 6 16
2 5 8 36 3 22
3 7 5 25 5 22
4 5 6 22 5 21
9 10 5 17 3 25
3 5 5 26 6 15
7 7 5 18 7 35
10 9 4 7 8 25
12 11 6 13 5 16
2 4 8 30 5 19
2 3 5 24 3 26
3 5 8 30 3 20
6 9 5 29 5 11
4 10 5 24 2 25
10 5 7 21 10 18
26 14 2 8 9 15
6 6 4 12 10 28
T27

SPECIAL EUROBAROMETER 419 “Public Perceptions of Science, Research
and Innovation”
%
EU 28
BE
BG
CZ
DK
DE
EE
IE
EL
ES
FR
HR
IT
CY
LV
LT
LU
HU
MT
NL
AT
PL
PT
RO
SI
SK
FI
SE
UK
La protection des
données personnelles
La réduction des
inégalités
L’adaptation de la
société à une
population vieillissante
La disponibilité et la
qualité de la nourriture
Schutz persönlicher
Daten
Verringerung von
Ungleichheiten
Anpassung der
Gesellschaft an eine
alternde Bevölkerung
Verfügbarkeit und
Qualität von
Nahrungsmitteln
Adaptation of society to
an ageing population
Availability and quality
of food
Protection of personal
data
Reduction of
inequalities
2 6 4 5
EB
81.5
EB
81.5
EB
81.5
EB
81.5
1 9 3 6
5 62 5
6 3 4 4
4 92 6
1 8 5 4
3 9 6 7
1 9 1 6
2 42 2
2 6 2 4
1 60 10
2 6 3 5
2 52 6
2 6 1 4
1 40 4
1 3 2 4
1 42 7
1 1 1 2
6 62 11
1 5 6 9
7 91 3
1 11 7 3
3 51 4
1 7 2 10
1 42 4
5
2 5 5 6
3 70 4
QB3a Welche Themen sollten Ihrer Meinung nach im Bereich Wissenschaft und technische Innovation in den
nächsten 15 Jahren Priorität haben? Erstens? (ROTIEREN)
QB3a Over the next 15 years, what should be the priorities when it comes to science and technological innovation?
Firstly? (ROTATE)
QB3a Dans les 15 prochaines années, quelles devraient être les priorités pour la science et l’innovation
technologique? En premier ? (ROTATION)
2 1 2 4
4 21
T28

SPECIAL EUROBAROMETER 419 “Public Perceptions of Science, Research
and Innovation”
%
EU 28
BE
BG
CZ
DK
DE
EE
IE
EL
ES
FR
HR
IT
CY
LV
LT
LU
HU
MT
NL
AT
PL
PT
RO
SI
SK
FI
SE
UK
La qualité du logement NSP
Le transport et les
infrastructures de
transport
L’éducation et les
compétences
Qualität des Wohnraums WNVerkehr und
Verkehrsinfrastruktur
Bildung und
Kompetenzen
Transport and transport
infrastructureEducation & skills Quality of housing DK
1 51 9
EB
81.5
EB
81.5
EB
81.5
EB
81.5
1 50 11
1 8 2 1
0 20 13
2 6 1 4
2 101 16
0 40 12
1 11 9
1 15 1 3
3 41 5
0 8 1 3
1 61 4
1 9 2 3
1 61 12
0 10 1 4
3 62 10
1 14 2 6
1 50 10
1 7 4 3
3 52 6
1 14 0 2
1 61 7
1 8 2 8
0 71 7
2 12 1 5
3
1 31 6
3 7 2 4
2 10
QB3a Dans les 15 prochaines années, quelles devraient être les priorités pour la science et l’innovation technologique?
En premier ? (ROTATION)
QB3a Over the next 15 years, what should be the priorities when it comes to science and technological innovation?
Firstly? (ROTATE)
QB3a Welche Themen sollten Ihrer Meinung nach im Bereich Wissenschaft und technische Innovation in den nächsten
15 Jahren Priorität haben? Erstens? (ROTIEREN)
1 12
2 9 0
T29

SPECIAL EUROBAROMETER 419 “Public Perceptions of Science, Research
and Innovation”
%
EU 28
BE
BG
CZ
DK
DE
EE
IE
EL
ES
FR
HR
IT
CY
LV
LT
LU
HU
MT
NL
AT
PL
PT
RO
SI
SK
FI
SE
UK
QB3b Et ensuite ? (ROTATION - MAX. 4 REPONSES)
QB3b And then? (ROTATE - MAX. 4 ANSWERS)
QB3b Und dann? (ROTIEREN - MAX. 4 ANTWORTEN)
La protection de
l’environnement
Protection of the
environment
La création
d’emplois
Job creation
La santé et les
soins médicaux
Health and medical
care
Schutz der
Umwelt
EB
81.5
La lutte contre
le changement
climatique
Fight against
climate change
Kampf gegen
den
Klimawandel
EB
81.5
Schaffung von
Arbeitsplätzen
EB
81.5
La sécurité des
citoyens
Security of
citizens
Sicherheit der
Bürger
EB
81.5
Gesundheitswesen
und medizinische
Versorgung
EB
81.5
L’approvision-
nement en énergie
Energy supply
Energieversorgung
EB
81.5
19 3716 24 20 29
16 22 17 29 19 29
14 27 23 34 10 41
14 23 21 28 11 34
25 30 20 21 24 39
23 30 20 23 32 33
6 21 22 26 16 43
11 16 17 32 20 40
18 36 30 38 18 45
17 26 11 37 14 45
17 27 22 35 18 43
12 20 17 31 11 37
14 24 25 27 15 30
8 26 34 34 15 45
7 20 22 30 13 43
11 20 21 35 23 38
15 21 19 32 16 33
12 22 18 32 20 39
12 24 18 32 23 26
23 27 20 19 24 39
22 27 20 33 24 39
9 15 22 29 13 38
10 20 29 36 14 37
9 18 27 30 10 41
18 29 14 32 21 36
18 27 23 33 14 35
23 23 21 34 21 40
27 31 11 28 27 42
11 16 14 21 20 32
T30

SPECIAL EUROBAROMETER 419 “Public Perceptions of Science, Research
and Innovation”
%
EU 28
BE
BG
CZ
DK
DE
EE
IE
EL
ES
FR
HR
IT
CY
LV
LT
LU
HU
MT
NL
AT
PL
PT
RO
SI
SK
FI
SE
UK
La protection des données
personnelles
La réduction des
inégalités
L’adaptation de la société
à une population
vieillissante
La disponibilité et la
qualité de la nourriture
Schutz persönlicher DatenVerringerung von
Ungleichheiten
Anpassung der
Gesellschaft an eine
alternde Bevölkerung
Verfügbarkeit und
Qualität von
Nahrungsmitteln
Adaptation of society to
an ageing population
Availability and quality of
food
Protection of personal
dataReduction of inequalities
9 18 14 21
EB
81.5
EB
81.5
EB
81.5
EB
81.5
6 22 9 25
13 158 13
16 12 16 22
16 3110 13
9 17 7 18
16 18 19 21
12 28 8 24
8 137 10
11 24 17 21
11 233 24
6 17 12 22
8 207 15
11 19 6 23
5 217 18
8 13 11 15
7 2511 18
4 4 11 12
16 208 23
14 16 16 30
21 2811 11
11 33 19 23
13 207 18
6 18 10 27
7 177 15
18
9 17 16 26
10 267 16
QB3b Et ensuite ? (ROTATION - MAX. 4 REPONSES)
QB3b And then? (ROTATE - MAX. 4 ANSWERS)
QB3b Und dann? (ROTIEREN - MAX. 4 ANTWORTEN)
7 9 11 15
15 209
T31

SPECIAL EUROBAROMETER 419 “Public Perceptions of Science, Research
and Innovation”
%
EU 28
BE
BG
CZ
DK
DE
EE
IE
EL
ES
FR
HR
IT
CY
LV
LT
LU
HU
MT
NL
AT
PL
PT
RO
SI
SK
FI
SE
UK
La qualité du logement NSP
Le transport et les
infrastructures de
transport
L’éducation et les
compétences
Qualität des
WohnraumsWN
Verkehr und
Verkehrsinfrastruktur
Bildung und
Kompetenzen
Transport and transport
infrastructureEducation & skills Quality of housing DK
10 29 25
EB
81.5
EB
81.5
EB
81.5
EB
81.5
5 28 27
8 21 12 1
3 110 31
9 23 6 1
5 38 32
5 110 21
10 06 33
9 39 11 2
16 211 25
5 33 13 2
8 28 19
4 26 11 1
8 28 28
2 35 18 1
13 38 25
8 23 15 2
3 36 34
9 19 16 1
11 212 22
8 39 4 1
10 28 26
8 21 9 3
6 55 24
14 27 10 2
1
9 29 25
11 20 15 1
12 6
QB3b Et ensuite ? (ROTATION - MAX. 4 REPONSES)
QB3b And then? (ROTATE - MAX. 4 ANSWERS)
QB3b Und dann? (ROTIEREN - MAX. 4 ANTWORTEN)
9 28
17 31 3
T32

SPECIAL EUROBAROMETER 419 “Public Perceptions of Science, Research
and Innovation”
%
EU 28
BE
BG
CZ
DK
DE
EE
IE
EL
ES
FR
HR
IT
CY
LV
LT
LU
HU
MT
NL
AT
PL
PT
RO
SI
SK
FI
SE
UK
QB3T - Dans les 15 prochaines années, quelles devraient être les priorités pour la science et l’innovation technologique?
TOTAL
QB3T - Over the next 15 years, what should be the priorities when it comes to science and technological innovation?
TOTAL
QB3T - Welche Themen sollten Ihrer Meinung nach im Bereich Wissenschaft und technische Innovation in den nächsten 15
Jahren Priorität haben? GESAMT
La protection de
l’environnement
Protection of the
environment
La création
d’emplois
Job creation
La santé et les
soins médicaux
Health and
medical care
Schutz der
Umwelt
EB
81.5
La lutte contre
le changement
climatique
Fight against
climate change
Kampf gegen
den
Klimawandel
EB
81.5
Schaffung von
Arbeitsplätzen
EB
81.5
La sécurité des
citoyens
Security of
citizens
Sicherheit der
Bürger
EB
81.5
Gesundheitswesen
und medizinische
Versorgung
EB
81.5
L’approvision-
nement en énergie
Energy supply
Energieversorgung
EB
81.5
25 5522 30 24 49
27 33 23 45 26 48
19 33 28 56 12 57
18 32 27 42 13 60
44 41 24 28 31 55
33 37 25 35 40 43
8 25 28 35 21 58
14 20 19 63 24 62
22 44 37 65 21 64
21 31 13 66 16 69
24 36 26 58 23 62
16 25 21 68 15 50
20 29 30 56 20 44
10 30 40 69 18 65
9 26 25 53 17 62
14 24 25 55 26 56
24 30 23 47 19 55
15 27 22 56 26 53
19 30 22 48 29 60
32 35 24 26 31 64
32 37 26 44 28 53
10 18 29 56 17 55
11 22 32 58 15 61
11 22 34 58 12 59
23 36 17 59 24 45
21 36 28 56 16 59
33 27 27 54 31 57
52 45 12 35 35 56
16 20 17 31 28 58
T33

SPECIAL EUROBAROMETER 419 “Public Perceptions of Science, Research
and Innovation”
%
EU 28
BE
BG
CZ
DK
DE
EE
IE
EL
ES
FR
HR
IT
CY
LV
LT
LU
HU
MT
NL
AT
PL
PT
RO
SI
SK
FI
SE
UK
La protection des
données personnelles
La réduction des
inégalités
L’adaptation de la
société à une
population vieillissante
La disponibilité et la
qualité de la nourriture
Schutz persönlicher
Daten
Verringerung von
Ungleichheiten
Anpassung der
Gesellschaft an eine
alternde Bevölkerung
Verfügbarkeit und
Qualität von
Nahrungsmitteln
Adaptation of society
to an ageing population
Availability and quality
of food
Protection of personal
data
Reduction of
inequalities
11 23 17 25
EB
81.5
EB
81.5
EB
81.5
EB
81.5
6 30 11 30
18 2010 17
22 15 19 26
19 3911 18
9 23 12 20
19 26 24 27
13 37 8 30
10 179 12
13 29 18 25
12 283 33
7 22 14 25
10 259 21
12 24 7 25
6 247 22
9 15 13 18
8 2812 24
4 5 12 13
22 2510 32
14 20 21 38
28 3611 14
11 43 25 25
14 238 21
6 24 11 35
8 209 18
23
10 21 21 31
13 328 19
QB3T - Dans les 15 prochaines années, quelles devraient être les priorités pour la science et l’innovation
technologique? TOTAL
QB3T - Over the next 15 years, what should be the priorities when it comes to science and technological
innovation? TOTAL
QB3T - Welche Themen sollten Ihrer Meinung nach im Bereich Wissenschaft und technische Innovation in den nächsten
15 Jahren Priorität haben? GESAMT
8 10 12 17
19 219
T34

SPECIAL EUROBAROMETER 419 “Public Perceptions of Science, Research
and Innovation”
%
EU 28
BE
BG
CZ
DK
DE
EE
IE
EL
ES
FR
HR
IT
CY
LV
LT
LU
HU
MT
NL
AT
PL
PT
RO
SI
SK
FI
SE
UK
La qualité du
logementNSP
Le transport et les
infrastructures de
transport
L’éducation et les
compétences
Qualität des
WohnraumsWN
Verkehr und
Verkehrsinfrastruktur
Bildung und
Kompetenzen
Transport and
transport
infrastructure
Education & skills Quality of housing DK
11 59 33
EB
81.5
EB
81.5
EB
81.5
EB
81.5
6 58 36
9 29 15 1
3 210 43
12 28 6 4
7 108 44
5 410 33
11 16 42
10 53 12 3
18 412 29
5 40 14 3
9 68 22
5 34 13 3
9 69 39
3 43 18 4
15 69 34
8 36 16 6
4 56 42
10 25 20 3
13 513 27
8 52 4 2
10 68 32
8 28 10 8
6 76 29
16 38 11 5
3
10 210 30
14 26 17 4
13 10
QB3T - Dans les 15 prochaines années, quelles devraient être les priorités pour la science et l’innovation
technologique? TOTAL
QB3T - Over the next 15 years, what should be the priorities when it comes to science and technological
innovation? TOTAL
QB3T - Welche Themen sollten Ihrer Meinung nach im Bereich Wissenschaft und technische Innovation in den
nächsten 15 Jahren Priorität haben? GESAMT
9 37
18 40 3
T35

SPECIAL EUROBAROMETER 419 “Public Perceptions of Science, Research
and Innovation”
%
EU 28
BE
BG
CZ
DK
DE
EE
IE
EL
ES
FR
HR
IT
CY
LV
LT
LU
HU
MT
NL
AT
PL
PT
RO
SI
SK
FI
SE
UK
Oui, à l’école
Yes, at school
Ja, in der Schule
EB
81.5
QB4 Avez-vous étudié les sciences ou les technologies à l’école, à l’université, dans l'enseignement supérieur ou
ailleurs ? (PLUSIEURS REPONSES POSSIBLES)
QB4 Have you ever studied science or technology at school, at university, at college or anywhere else?
(MULTIPLE ANSWERS POSSIBLE)
QB4 Haben Sie jemals Wissenschaft oder Technik als Schulfach gehabt oder an einer Universität, einer
Hochschule oder irgendwo anders studiert? (MEHRFACHNENNUNGEN MÖGLICH)
Oui, ailleurs
Yes, somewhere
elseNo
Nein
EB
81.5
Ja, woanders
EB
81.5
Oui, à l’université
ou dans
l’enseignement
supérieur
Yes, at university
or college
Ja, in der
Universität oder
Hochschule
EB
81.5
144 16 3 43
NSP
DK
WN
EB
81.5
Non
142 20 1 41
39 17 3 49 1
114 29 5 58
15 8 2 77 1
161 30 7 21
126 16 2 60
035 24 4 46
49 16 1 40 0
050 15 4 37
50 19 3 39 0
254 9 3 34
50 15 12 29 2
133 32 8 40
55 20 9 31 0
243 12 3 44
42 31 5 39 0
044 8 1 49
22 11 6 62 0
220 13 4 63
7 26 3 65 0
145 11 4 46
70 15 3 21 3
015 16 2 72
46 10 3 40 5
048 15 5 35
13 9 1 77 1
160 22 2 28
32 33 5 37 0
T36
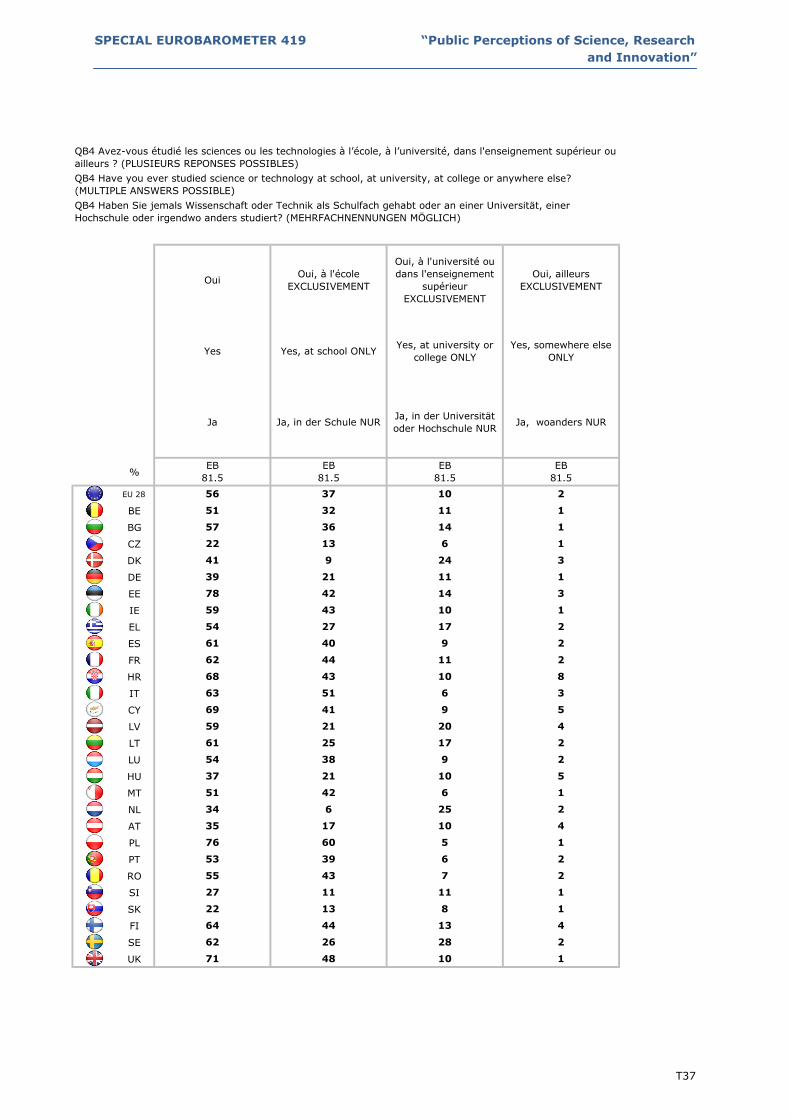
SPECIAL EUROBAROMETER 419 “Public Perceptions of Science, Research
and Innovation”
%
EU 28
BE
BG
CZ
DK
DE
EE
IE
EL
ES
FR
HR
IT
CY
LV
LT
LU
HU
MT
NL
AT
PL
PT
RO
SI
SK
FI
SE
UK
Oui, à l'école
EXCLUSIVEMENT
Oui, à l'université ou
dans l'enseignement
supérieur
EXCLUSIVEMENT
Oui, ailleurs
EXCLUSIVEMENT
EB
81.5
EB
81.5
EB
81.5
Oui
Yes, at university or
college ONLY
Yes, somewhere else
ONLY
Ja Ja, in der Schule NURJa, in der Universität
oder Hochschule NUR
37 10 2
51 32
Yes Yes, at school ONLY
56
Ja, woanders NUR
EB
81.5
1
22 13 6 1
11 1
57 36 14
78
139 21 11
9 24 341
10 1
54 27 17
42 14 3
59 43
62
2
61 40 9 2
10 8
63 51 6
44 11 2
68 43
59
3
69 41 9 5
17 2
54 38 9
21 20 4
61 25
51
2
37 21 10 5
25 2
35 17 10
42 6 1
34 6
53
4
76 60 5 1
7 2
27 11 11
39 6 2
55 43
13 4
62 26
64
1
22 13 8 1
1
QB4 Avez-vous étudié les sciences ou les technologies à l’école, à l’université, dans l'enseignement supérieur ou
ailleurs ? (PLUSIEURS REPONSES POSSIBLES)
QB4 Have you ever studied science or technology at school, at university, at college or anywhere else?
(MULTIPLE ANSWERS POSSIBLE)
QB4 Haben Sie jemals Wissenschaft oder Technik als Schulfach gehabt oder an einer Universität, einer
Hochschule oder irgendwo anders studiert? (MEHRFACHNENNUNGEN MÖGLICH)
28 2
71 48 10
44
T37