eurocom worldwide technology survey 2008 findings february 2008
TRANSCRIPT

Eurocom WorldwideTechnology Survey 2008
Findings
February 2008

Introduction
Each year Eurocom Worldwide surveys hundreds of IT business leaders and senior
industry executives around the globe measuring the sentiments and confidence levels of
professionals in the technology sector. This year over 350 senior executives responded to
our survey. The survey was conducted via the Internet, and field work ended in December
2007.

About Eurocom Worldwide
Eurocom Worldwide is a global alliance of independent, privately owned communications
agencies offering unrivalled expertise in international communications campaigns
executed by local people. Eurocom Worldwide has 29 member agencies comprising over
1,400 communications specialists and consultants in 64 national capitals and centres of
commerce around the globe. For more information, visit www.eurocompr.com

Confidence Levels
More 53.3%
The same 42.8%
Less Confident3.9%
Less Confident 3.9%
More Confident 53.3%
The same 42.8%
Question: Are you more confident or less confident about the tech sector compared to 12 months ago?
65.4%
30.8%
3.8%
2008 2007

Fears of Credit Difficulties?
Yes 26.5%
No 54.5%
Don't know 19.0%
No 54.5%
Yes 26.5%
Don’t know 19.0%
Question: Does the upheaval in global financial markets in mid 2007 caused by fears of global credit difficulties affect your outlook for 2008?

RevenuesQuestion: Over the next twelve months do you expect revenues of the company you work for to:
Increase 88.2%
Decrease 1.7%
Remain the same10.10%
Increase 88.2%
Remain the same 10.10%
Decrease 1.7%
2008 2007
91.2%
1.2%
7.5%

Employment/Jobs
Increase 68.5%
Remain theSame 25.9%
Decrease 5.6%
Increase 68.5%
Remain the Same 25.9%
Decrease 5.6%
Question: Over the next twelve months do you expect employment/jobs in your company to:
63.5%
32.4%
4.1%
2008 2007

More Difficult to Recruit?Question: In your opinion is it easier or more difficult to recruit IT people now compared to 12 months ago?
38.4%
52%
9.6%
2008 2007More Difficult48%
About the same48%
Less Difficult4.0%
More Difficult 48%
About the same 48%
Less Difficult 4.0%

Skills Shortage.
Question: In the table below is a number of different job types. Please mark from 1 to 3 (where 1 is the most difficult to recruit 2 is the second most difficult to recruit and 2 is the third most difficult to recruit) which type you think you will have the most difficulty recruiting in 2008.
45%
43%
33%
17%
35%
23%
20072008
0.00%
10.00%
20.00%
30.00%
40.00%
50.00%
60.00%
SoftwareEnginners 53.6%
InternationalSales 37.7%
Domestic Sales34.1%
InternationalMarketing 28.1%
ProjectManagement
27.5%
Telesales 25.6%
Software Enginners 53.6%
International Sales 37.7%
Domestic Sales 34.1%
International Marketing28.1%
Project Management 27.5%
Telesales 25.6%

Tech manufacturing jobs
0.00%
10.00%
20.00%
30.00%
40.00%
50.00%
60.00%
70.00%
80.00%
China 72.9%
North America 50.0%
India 48.0%
South America 31.8%
Central & Eastern Europe26.8%
Rest of Asia Pacific 17.1%
Western Europe 8.3%
Middle East 0%
Question: Which of the following regions/countries do you think are likely to record the highest growth in technology manufacturing jobs over the next three years?
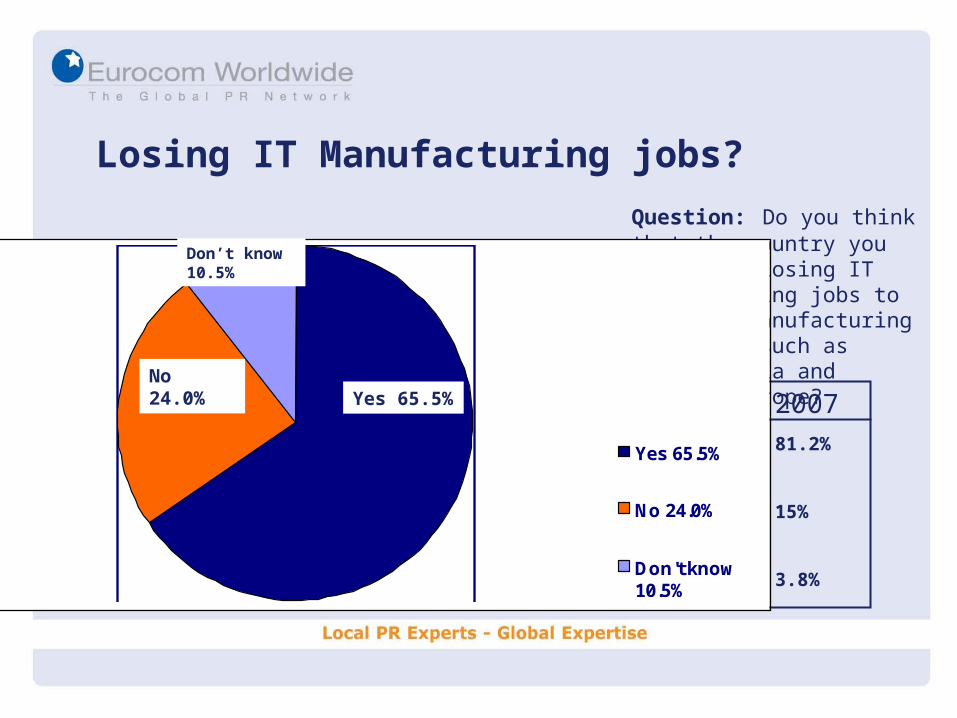
Losing IT Manufacturing jobs?
Question: Do you think that the country you are in is losing IT manufacturing jobs to low cost manufacturing locations such as China, India and Eastern Europe?
81.2%
15%
3.8%
2008 2007
Yes 65.5%
No 24.0%
Don't know10.5%
Yes 65.5%
No 24.0%
Don’t know 10.5%

Losing IT Services jobs?
Yes 49.8%
No 43.4%
Don't know 6.8%
Yes 49.8%No
43.4%
Don’t know 6.8%
Question: Do you think the country you are in is losing IT services jobs to lower cost locations such as China, India and Eastern Europe?
57.9%
35.3%
6.8%
2008 2007

Growth Markets (region)
0.00%
5.00%
10.00%
15.00%
20.00%
25.00%
30.00%
35.00%
WesternEurope30.2%
China17.4%
Central &EasternEurope13.6%
SouthAmerica
11.3%
NorthAmerica
9.8%
Western Europe 30.2%
China 17.4%
Central & Eastern Europe 13.6%
South America 11.3%
North America 9.8%
Question: Which region of the world do you expect will see most growth for your company in 2008?

Threats to growth
Question: In the table below is a number of possible threats to growth in the technology industry. Indicate which ones you consider the most threatening.
0.00%
5.00%
10.00%
15.00%
20.00%
25.00%
30.00%
35.00%
40.00%
45.00%
50.00% Slowdown in the US economy 47.8%
Skills shortage 42.4%
Oil price increases 36.6%
Poor health of telecommunicationssector 34.8%
Poor health of financial services sector(sub prime lending) 34.2%
Deterioration in Middle East eg. Iran,Iraq 32.3%
Global slowdon, global property market23.1%
Interest Rate increases 17.1%
Fear of another terrorist attack 7.70%

Outlook for NASDAQ
Increase 37.6%
Remain thesame 38.5%
Decrease 23.9%
Remain the same 38.5%
Increase 37.6%
Decrease 23.9%
Question: Over the next 12 months do you expect the US technology stock index – NASDAQ to:
43.5%
42.7%
13.7%
20072008

Outlook for US Economy
More confident11.9%
About the same39.3%
Less Confident48.9%
Less Confident 48.9%
About the same 39.3%
More confident 11.9%
Question: Are you more confident or less confident about the growth prospects for the US economy than you were 12 months ago?
19.1%
48.1%
32.8%
2008 2007

Growth Markets (Sectors)
Question: In the table below is a number of technology areas. Indicate which
ones you believe have the most growth potential over the next 12 months.
0.00%
5.00%
10.00%
15.00%
20.00%
25.00%
30.00%
35.00%
40.00%
Software as a service/Ondemand computing 39.3%
CRM (CustomerRelationship Management)38.6%Mobile Services 37.5%
IT Security 35%
IT Outsourcing 28.9%
Storage 17.9%

Best Marketing Value for Money.
0%
5%
10%
15%
20%
25%
30%
35%
40%
45%Internet Marketing43%
Public Relations42.4%
CorporateHospitality 40.7%
Advertising 33.3%
Direct Mail 26.9%
Shows/exhibitions13.0%
Question: In the table below is a number of communications disciplines. Indicate which ones you believe offer the best value for money in terms of marketing spend.
39%
44%
38%
26%
17%
24%
20072008

Increase marketing spend per discipline?
0.00%
10.00%
20.00%
30.00%
40.00%
50.00%
60.00%
70.00%
Internet Marketing61.0%
Corporate Hospitality34.7%
Advertising 32.9%
Public Relations27.1%
Shows/Exhibtions25.9%
Direct Mail 13.4%
Question: In which of the following disciplines do you expect to most increase marketing spend over the next 12 months?

Internet Advertising?
Yes 62%
No 38%
Yes 62%
No 38%
Question: Do you advertise on the Internet (eg Google AdWords)?

Expectations for Internet Advertising
Increase 59.1%
Remain the same39.1%
Decrease 1.9%
Increase 59.1%
Remain the same 39.1%
Decrease 1.9%
Question: Do you expect to increase or decrease the expenditure on Internet advertising in 2008?

Blogging Popularity
Yes, already have one28.2%
Yes, will have one nextyear 15.9%
No 47.3%
Don't know 8.6%
No 47.3%
Yes, already have one 28.2%
Yes, will have one next year 15.9%
Don’t know 8.6%
Question: Do you or your company have a blog or are you considering to create one in 2008?
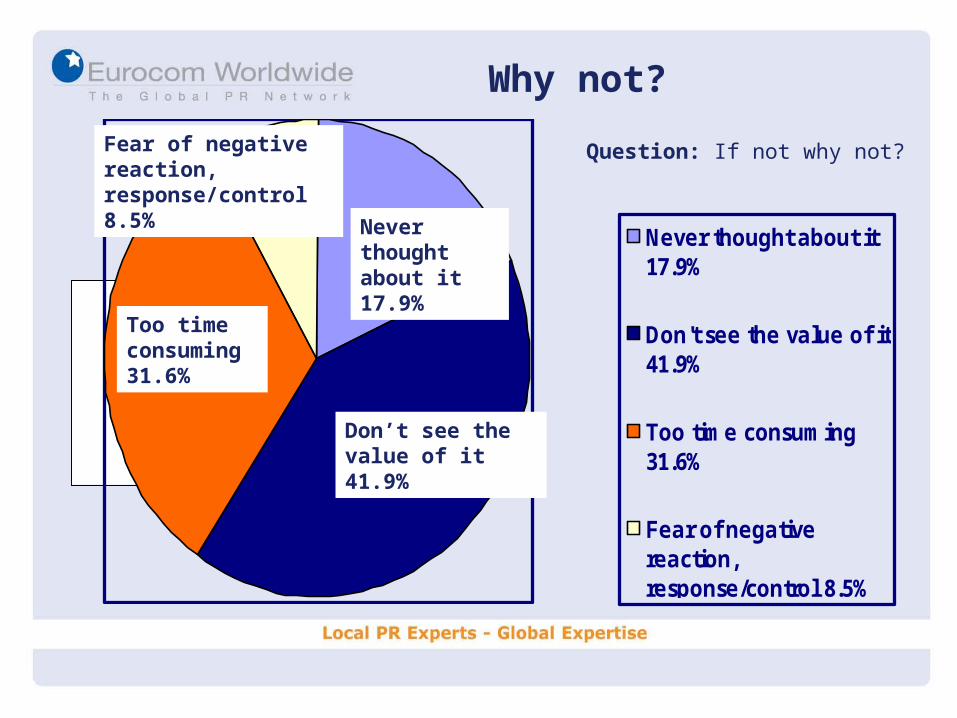
Why not?
Never thought about it17.9%
Don't see the value of it41.9%
Too time consuming31.6%
Fear of negativereaction,response/control 8.5%
Don’t see the value of it 41.9%
Too time consuming 31.6%
Never thought about it 17.9%
Fear of negative reaction, response/control 8.5%
Question: If not why not?

Why is Blogging popular? Question: If yes why do you
have (or are considering) one?
To improve interactionwith public/customers50.0%
To participate in industrydebate/issues 21.4%
To raise profile 18.8%
To boost search engineoptimisation 9.8%
To improve interaction with public/customers 50.0%
To participate in industry debate/issues 21.4%
To raise profile 18.8%
To boost search engine optimisation 9.8%

Search Engines
Agree Strongly 33.9%
Agree Somewhat44.8%
Neither agree nordisagree 13.1%
Disagree Somewhat5.9%
Disagree Strongly2.3%
Agree Strongly 33.9%
Agree Somewhat 44.8%
Neither agree nor disagree 13.1%
Disagree Somewhat 5.9%
Disagree Strongly 2.3%
Question: Do you agree or disagree with the following statement? Search engines (eg Google, Yahoo) is the most important development in marketing in the last 10 years.

About Eurocom Worldwide
Eurocom Worldwide is a global alliance of independent, privately owned communications
agencies offering unrivalled expertise in international communications campaigns
executed by local people. Eurocom Worldwide has 29 member agencies comprising over
1,400 communications specialists and consultants in 64 national capitals and centres of
commerce around the globe. For more information, visit www.eurocompr.com