eurocontrol · the boeing method 2 ... index (of hc co or nox) ... and the meteorological variables...
TRANSCRIPT

EUROCONTROLExperimental Centre
EUROCONTROL
The Advanced Emission Model (AEMIII) Version 1.5
APPENDICES A, B and C
to the
Validation Report EEC / SEE / 2004 / 004
Frank Jelinek,Sandrine Carlier,
James Smith
ii
The Advanced Emission Model (AEM3) -Validation Report - Appendices A, B and C -
Society Environmental Economy EUROCONTROL Experimental Centre EEC / SEE / 2004 / 004
© European Organisation for the Safety of Air Navigation EUROCONTROL
This document is published by EUROCONTROL in the interest of the exchange of information. It may be copied in whole or in part providing that the copyright notice and disclaimer are included.
The information contained in this document may not be modified without prior written permission from EUROCONTROL. EUROCONTROL makes no warranty, either implied or express, for the information contained in this document,
RREEPPOORRTT DDOOCCUUMMEENNTTAATTIIOONN PPAAGGEE
Reference: EEC / SEE / 2004 / 004
Security Classification: Unclassified
Originator: EEC / SEE / Society Environment Economy
Originator (Corporate Author) Name/Location: EUROCONTROL Experimental Centre Centre de Bois des Bordes B.P.15 91222 BRETIGNY SUR ORGE CEDEX France Telephone: +33 1 69 88 75 00
Sponsor: EEC / SEE /
Sponsor (Contract Authority) Name/Location: EUROCONTROL Agency Rue de la Fusée, 96 B –1130 BRUXELLES Telephone: +32 2 729 90 11
TITLE: The Advanced Emission Model (AEM3) - Validation Report
Authors : Fran Jelinek (EEC), Sandrine Carlier, James Smith
Date 31/12
Pages 65
Figures
Tables
Appendix
References
EATMP Task Specification -
Project AEM3v1.5 - Validation
Task No. Sponsor -
Period 2002/2003
Distribution Statement: (a) Controlled by: EUROCONTROL Project Manager (b) Special Limitations: None (c) Copy to NTIS: YES / NO
Descriptors (keywords): Global Emissions - AEM - NOx - CO - HC - CO2 - H2O - SOx - Benefits - EEC - etc
Abstract: This document contains the appendicies A,B and C of the validation repoprt of the Advanced Emission Model (AEMIII) Version v 1.5. The Advanced Emission Model has been developed at the EUROCONTROL Experimental Centre and has been used in first studies to estimate aviation emissions and fuel burn. It is using ICAO Engine Exhaust Emissions Data bank (05/2003), the Eurocontrol Base of Aircraft Data (BADAv3.5) and an improved version (EEC-BM2) of the Boeing Method2 (BM2) trying to produce most reliable emission estimations for all phases of flight.


v
TTaabbllee ooff CCoonntteennttss
Table of Contents ..........................................................................................................................v
Appendix A: Sensitivity of the Boeing 2 Method for Calculating Aircraft Emissions to Temperature and Humidity Changes.............................................................................................7
Table 1: Percentage difference of Boeing 2 Emission calculation with temperature variation from ISA for CO and HC ...................................................................................................................................8 Table 2: Percentage difference of Boeing 2 Emission calculation with temperature variation from ISA for NOx with Ambient Relative Humidity = 0....................................................................................9 Table 3: Percentage difference of Boeing 2 Emission calculation with temperature variation from ISA for NOx with Ambient Relative Humidity = 10................................................................................10 Table 4: Percentage difference of Boeing 2 Emission calculation with temperature variation from ISA for NOx with Ambient Relative Humidity = 20................................................................................11 Table 5: Percentage difference of Boeing 2 Emission calculation with temperature variation from ISA for NOx with Ambient Relative Humidity = 30................................................................................12 Table 6: Percentage difference of Boeing 2 Emission calculation with temperature variation from ISA for NOx with Ambient Relative Humidity = 40................................................................................13 Table 7: Percentage difference of Boeing 2 Emission calculation with temperature variation from ISA for NOx with Ambient Relative Humidity = 50................................................................................14 Table 8: Percentage difference of Boeing 2 Emission calculation with temperature variation from ISA for NOx with Ambient Relative Humidity = 60................................................................................15 Table 9: Percentage difference of Boeing 2 Emission calculation with temperature variation from ISA for NOx with Ambient Relative Humidity = 70................................................................................16 Table 10: Percentage difference of Boeing 2 Emission calculation with temperature variation from ISA for NOx with Ambient Relative Humidity = 80................................................................................17 Table 11: Percentage difference of Boeing 2 Emission calculation with temperature variation from ISA for NOx with Ambient Relative Humidity = 90................................................................................18 Table 12: Percentage difference of Boeing 2 Emission calculation with temperature variation from ISA for NOx with Ambient Relative Humidity = 100..............................................................................19 Table 13: Percentage difference of Boeing 2 Emission calculation with relative humidity variation from ISA for NOx.....................................................................................................................................20
The Boeing 2 Method .....................................................................................................................................21 Methodology ...................................................................................................................................................21 EUROCONTROL corrected Boeing 2 Method ...........................................................................................23
Appendix B: Case Studies Using Actual Meteorology in AEM3 in Comparison to International Standard Atmosphere ..................................................................................................................25
ICAO International Standard Atmosphere .................................................................................................25 Case 1: January 07 2003 morning between Airports K and H – Aircraft A320-DAC.............................27 Case 3: September 2 2003 morning between Airports K and H – Aircraft A321-DAC ..........................29 Case 7: November 11 2003 morning between Airports T and K – Aircraft A340...................................33 Case 1: January 07 2003 morning between Airports K and H – Aircraft A320-DAC.............................34 Case 2: June 11 2003 evening between Airports H and K - Aircraft A319-DAC....................................38 Case 3: September 2 2003 morning between Airports K and H – Aircraft A321-DAC ..........................42 Case 4: September 23 2003 morning between Airports K and B – Aircraft A320-SAC .........................46 Case 5: November 18 2002 morning between Airports K and D – Aircraft A330 ..................................50 Case 6: November 9 2003 morning between Airports K and T – Aircraft A340.....................................54

vi
Case 7: November 11 2003 morning between Airports T and K – Aircraft A340.................................. 57 Appendix C: AEM3 aircraft database vs. European traffic samples .......................................... 61

7
AAppppeennddiixx AA:: SSeennssiittiivviittyy ooff tthhee BBooeeiinngg 22 MMeetthhoodd ffoorr CCaallccuullaattiinngg AAiirrccrraafftt EEmmiissssiioonnss ttoo
TTeemmppeerraattuurree aanndd HHuummiiddiittyy CChhaannggeess..
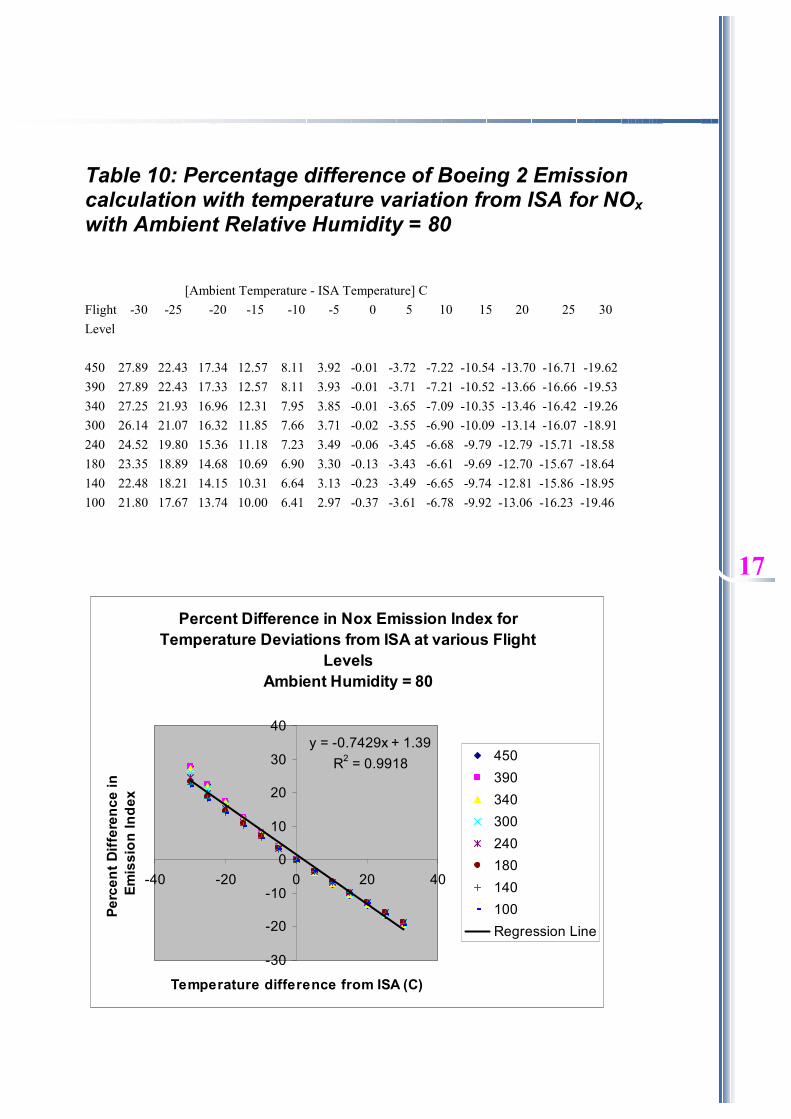
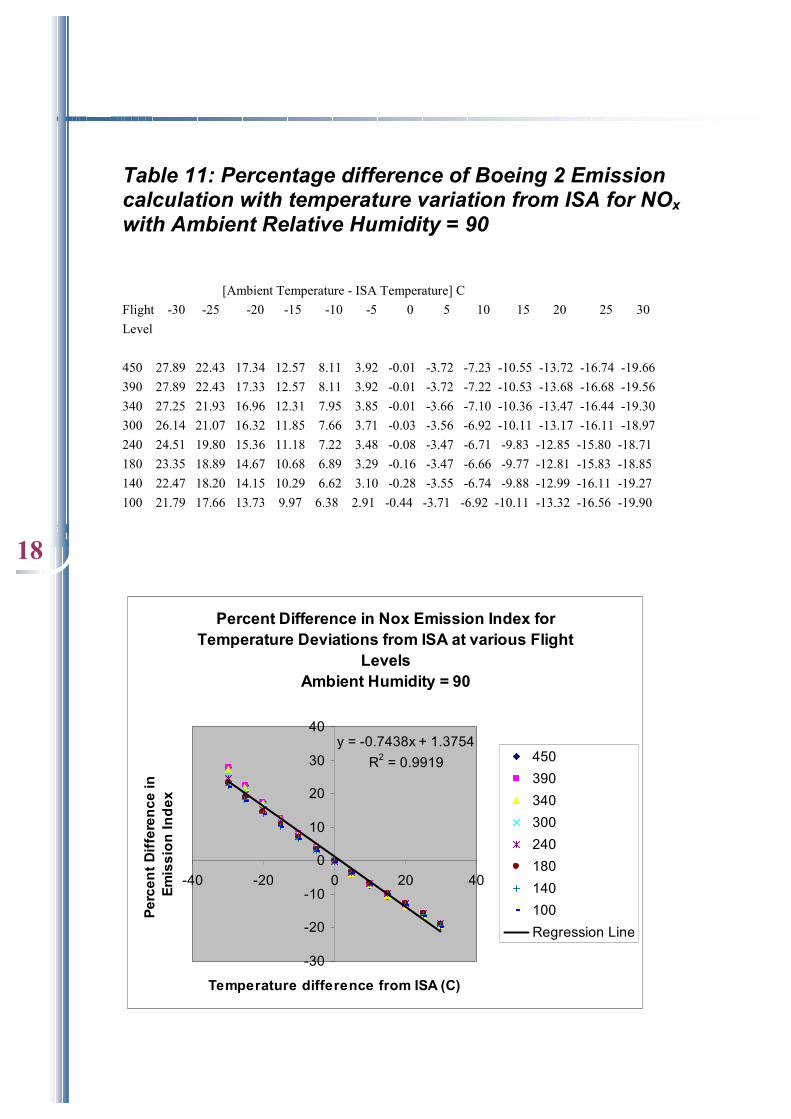
The Boeing method 2 (BM2) algorithms are used in AEM3 for the adjustment of the ICAO NOx, CO and HC engine emission indices to allow for changes in temperature, pressure and relative humidity at altitude. In the current version (1.5) of AEM3 the ICAO Standard Atmosphere (ISA) is used as the meteorological data for the BM2 algorithms. The sensitivity of the BM2 algorithms to deviations of atmospheric data from the ISA parameters was examined by calculating. A series of tables have been produced. Each of these tables contains the percentage difference of the emission index (of HC CO or NOx) calculated by BM2 from the same emission index as calculated by BM2 at ISA (ISO Standard Atmosphere) at different flight levels. The first table titled "Percentage difference of BM2 Emission calculation with temperature variation from ISA HC and CO" calculates the percentage change of the HC and CO emission indices with a change in temperature. The top axis is the [Ambient temperature - ISA temperature] and the side axis is Flight Level. This shows an increase in HC and CO emission index (of ~1.4 %) for each degree increase in temperature (C) (roughly) and vice-versa. The next 11 tables calculates the same thing for NOx with each of the tables using a different value for ambient relative humidity, the first with humidity = 0% the second with 10% etc. This shows a decrease in NOx emission index (of ~0.7%) for each degree increase in temperature (C) (roughly) and vice-versa. The last table shows the percentage difference of the emission of NOx calculated by BM2 from the emission as calculated by BM2 at ISA (International Standard Atmosphere) at different flight levels with a change in humidity. The temperature in this last table is kept at ISA and the ambient humidity is changed. This shows very little change in NOx emission index with a change in humidity. Pressure from ISA was not varied since this is used as the flight level (altimeters use pressure reading for height) and the meteorological variables are on constant pressure surfaces (flight levels). These tables indicate that the ratio of NOx to HC and CO will change with changes in temperature since NOx goes down while HC and CO go up with an increase in temperature and NOx goes up and HC and CO go down with a decrease in temperature.

8
Table 1: Percentage difference of Boeing 2 Emission calculation with temperature variation from ISA for CO and HC [Ambient Temperature - ISA Temperature] C Flight -30 -25 -20 -15 -10 -5 0 5 10 15 20 25 30 Level 450 -38.85 -33.28 -27.36 -21.08 -14.44 -7.42 0.00 7.82 16.06 24.72 33.83 43.39 53.41 390 -38.85 -33.28 -27.36 -21.08 -14.44 -7.42 0.00 7.82 16.06 24.72 33.83 43.39 53.41 340 -38.23 -32.73 -26.89 -20.71 -14.18 -7.28 0.00 7.67 15.74 24.22 33.12 42.46 52.25 300 -37.13 -31.76 -26.07 -20.06 -13.72 -7.04 0.00 7.40 15.17 23.33 31.88 40.83 50.21 240 -35.46 -30.28 -24.82 -19.08 -13.03 -6.67 0.00 7.00 14.33 22.01 30.03 38.42 47.18 180 -34.19 -29.17 -23.89 -18.34 -12.51 -6.40 0.00 6.70 13.71 21.03 28.67 36.64 44.95 140 -33.18 -28.29 -23.14 -17.75 -12.10 -6.19 0.00 6.47 13.22 20.26 27.61 35.26 43.22 100 -32.36 -27.56 -22.54 -17.28 -11.77 -6.01 0.00 6.28 12.82 19.65 26.75 34.14 41.83
Percent Difference in HC and CO Emission Indices for Temperature Deviations from ISA at various
Flight Levels
y = 1.4518x + 2.5415R2 = 0.9932
-60
-40
-20
0
20
40
60
-40 -20 0 20 40
Temperature difference from ISA (C)
Per
cent
Diff
eren
ce in
Em
issi
on
Inde
x
450390340300240180140100Regression Line

9
Table 2: Percentage difference of Boeing 2 Emission calculation with temperature variation from ISA for NOx with Ambient Relative Humidity = 0 [Ambient Temperature - ISA Temperature] C Flight -30 -25 -20 -15 -10 -5 0 5 10 15 20 25 30 Level 450 27.89 22.43 17.34 12.58 8.12 3.94 0.01 -3.69 -7.17 -10.45 -13.55 -16.48 -19.26 390 27.89 22.43 17.34 12.57 8.12 3.93 0.01 -3.69 -7.17 -10.45 -13.55 -16.48 -19.26 340 27.25 21.93 16.96 12.31 7.95 3.86 0.01 -3.62 -7.04 -10.27 -13.32 -16.21 -18.95 300 26.14 21.07 16.32 11.86 7.67 3.73 0.01 -3.49 -6.81 -9.94 -12.91 -15.72 -18.39 240 24.52 19.81 15.38 11.21 7.27 3.55 0.04 -3.29 -6.44 -9.43 -12.27 -14.97 -17.54 180 23.37 18.91 14.71 10.75 7.00 3.45 0.08 -3.11 -6.15 -9.03 -11.77 -14.38 -16.87 140 22.51 18.25 14.23 10.42 6.81 3.39 0.14 -2.95 -5.89 -8.68 -11.35 -13.90 -16.32 100 21.85 17.75 13.87 10.19 6.70 3.38 0.22 -2.78 -5.65 -8.38 -10.98 -13.47 -15.85
Percent Difference in Nox Emission Index for Temperature Deviations from ISA at various Flight
LevelsAmbient Humidity = 0
y = -0.7359x + 1.5031R2 = 0.9907
-30
-20
-10
0
10
20
30
40
-40 -20 0 20 40
Temperature difference from ISA (C)
Per
cent
Diff
eren
ce in
Em
issi
on
Inde
x
450390340300240180140100Regression Line

10
Table 3: Percentage difference of Boeing 2 Emission calculation with temperature variation from ISA for NOx with Ambient Relative Humidity = 10 [Ambient Temperature - ISA Temperature] C Flight -30 -25 -20 -15 -10 -5 0 5 10 15 20 25 30 Level 450 27.89 22.43 17.34 12.58 8.12 3.93 0.00 -3.69 -7.18 -10.46 -13.57 -16.51 -19.30 390 27.89 22.43 17.34 12.57 8.11 3.93 0.00 -3.69 -7.18 -10.46 -13.57 -16.51 -19.29 340 27.25 21.93 16.96 12.31 7.95 3.86 0.00 -3.62 -7.05 -10.28 -13.34 -16.24 -18.99 300 26.14 21.07 16.32 11.86 7.67 3.73 0.01 -3.50 -6.82 -9.96 -12.94 -15.77 -18.46 240 24.52 19.81 15.38 11.20 7.26 3.54 0.03 -3.31 -6.47 -9.48 -12.34 -15.06 -17.67 180 23.36 18.91 14.71 10.74 6.98 3.43 0.05 -3.15 -6.20 -9.11 -11.89 -14.55 -17.10 140 22.50 18.25 14.22 10.41 6.79 3.36 0.09 -3.02 -5.98 -8.82 -11.53 -14.14 -16.66 100 21.85 17.74 13.86 10.17 6.66 3.33 0.15 -2.89 -5.79 -8.57 -11.24 -13.82 -16.31
Percent Difference in Nox Emission Index for Temperature Deviations from ISA at various Flight
LevelsAmbient Humidity = 10
y = -0.7368x + 1.4885R2 = 0.9908
-30
-20
-10
0
10
20
30
40
-40 -20 0 20 40
Temperature difference from ISA (C)
Perc
ent D
iffer
ence
in E
mis
sion
In
dex
450390340300240180140100Regression Line

11
Table 4: Percentage difference of Boeing 2 Emission calculation with temperature variation from ISA for NOx with Ambient Relative Humidity = 20 [Ambient Temperature - ISA Temperature] C Flight -30 -25 -20 -15 -10 -5 0 5 10 15 20 25 30 Level 450 27.89 22.43 17.34 12.58 8.12 3.93 0.00 -3.70 -7.18 -10.47 -13.59 -16.54 -19.35 390 27.89 22.43 17.34 12.57 8.11 3.93 0.00 -3.70 -7.18 -10.47 -13.58 -16.53 -19.33 340 27.25 21.93 16.96 12.31 7.95 3.86 0.00 -3.63 -7.05 -10.29 -13.36 -16.26 -19.03 300 26.14 21.07 16.32 11.86 7.67 3.72 0.00 -3.51 -6.83 -9.98 -12.97 -15.81 -18.52 240 24.52 19.81 15.38 11.20 7.26 3.54 0.01 -3.33 -6.50 -9.52 -12.40 -15.16 -17.80 180 23.36 18.91 14.70 10.73 6.97 3.41 0.03 -3.19 -6.26 -9.19 -12.00 -14.71 -17.32 140 22.50 18.24 14.21 10.39 6.77 3.33 0.05 -3.08 -6.08 -8.95 -11.72 -14.39 -16.99 100 21.84 17.73 13.84 10.14 6.62 3.27 0.07 -2.99 -5.93 -8.77 -11.51 -14.17 -16.76
Percent Difference in Nox Emission Index for Temperature Deviations from ISA at various Flight
LevelsAmbient Humidity = 20
y = -0.7377x + 1.4738R2 = 0.991
-30
-20
-10
0
10
20
30
40
-40 -20 0 20 40
Temperature difference from ISA (C)
Per
cent
Diff
eren
ce in
Em
issi
on
Inde
x
450390340300240180140100Regression Line

12
Table 5: Percentage difference of Boeing 2 Emission calculation with temperature variation from ISA for NOx with Ambient Relative Humidity = 30 [Ambient Temperature - ISA Temperature] C Flight -30 -25 -20 -15 -10 -5 0 5 10 15 20 25 30 Level 450 27.89 22.43 17.34 12.57 8.11 3.93 0.00 -3.70 -7.19 -10.49 -13.61 -16.57 -19.39 390 27.89 22.43 17.34 12.57 8.11 3.93 0.00 -3.70 -7.19 -10.48 -13.59 -16.55 -19.36 340 27.25 21.93 16.96 12.31 7.95 3.85 0.00 -3.63 -7.06 -10.30 -13.37 -16.29 -19.07 300 26.14 21.07 16.32 11.86 7.67 3.72 0.00 -3.52 -6.84 -10.00 -13.00 -15.85 -18.59 240 24.52 19.81 15.37 11.20 7.25 3.53 0.00 -3.35 -6.53 -9.56 -12.47 -15.25 -17.93 180 23.36 18.91 14.70 10.73 6.96 3.39 0.00 -3.23 -6.32 -9.28 -12.12 -14.87 -17.54 140 22.50 18.23 14.20 10.38 6.75 3.29 0.00 -3.15 -6.17 -9.08 -11.90 -14.64 -17.32 100 21.83 17.72 13.82 10.12 6.59 3.22 0.00 -3.09 -6.07 -8.96 -11.77 -14.51 -17.22
Percent Difference in Nox Emission Index for Temperature Deviations from ISA at various Flight
LevelsAmbient Humidity = 30
y = -0.7386x + 1.46R2 = 0.9911
-30
-20
-10
0
10
20
30
40
-40 -20 0 20 40
Temperature difference from ISA (C)
Per
cent
Diff
eren
ce in
Em
issi
on
Inde
x
450390340300240180140100Regression Line

13
Table 6: Percentage difference of Boeing 2 Emission calculation with temperature variation from ISA for NOx with Ambient Relative Humidity = 40 [Ambient Temperature - ISA Temperature] C Flight -30 -25 -20 -15 -10 -5 0 5 10 15 20 25 30 Level 450 27.89 22.43 17.34 12.57 8.11 3.93 -0.00 -3.70 -7.20 -10.50 -13.63 -16.60 -19.44 390 27.89 22.43 17.33 12.57 8.11 3.93 -0.00 -3.70 -7.19 -10.49 -13.61 -16.57 -19.39 340 27.25 21.93 16.96 12.31 7.95 3.85 -0.00 -3.64 -7.07 -10.31 -13.39 -16.31 -19.11 300 26.14 21.07 16.32 11.86 7.67 3.72 -0.00 -3.52 -6.85 -10.02 -13.02 -15.90 -18.65 240 24.52 19.81 15.37 11.19 7.25 3.52 -0.01 -3.37 -6.56 -9.61 -12.53 -15.34 -18.06 180 23.36 18.90 14.70 10.72 6.95 3.37 -0.03 -3.27 -6.38 -9.36 -12.24 -15.03 -17.76 140 22.49 18.23 14.19 10.36 6.73 3.26 -0.05 -3.22 -6.27 -9.22 -12.08 -14.88 -17.65 100 21.83 17.71 13.81 10.09 6.55 3.17 -0.07 -3.20 -6.22 -9.15 -12.03 -14.86 -17.67
Percent Difference in Nox Emission Index for Temperature Deviations from ISA at various Flight
LevelsAmbient Humidity = 40
y = -0.7394x + 1.4477R2 = 0.9913
-30
-20
-10
0
10
20
30
40
-40 -20 0 20 40
Temperature difference from ISA (C)
Per
cent
Diff
eren
ce in
Em
issi
on
Inde
x
450390340300240180140100Regression Line

14
Table 7: Percentage difference of Boeing 2 Emission calculation with temperature variation from ISA for NOx with Ambient Relative Humidity = 50 [Ambient Temperature - ISA Temperature] C Flight -30 -25 -20 -15 -10 -5 0 5 10 15 20 25 30 Level 450 27.89 22.43 17.34 12.57 8.11 3.93 -0.00 -3.71 -7.20 -10.51 -13.64 -16.63 -19.48 390 27.89 22.43 17.33 12.57 8.11 3.93 -0.00 -3.70 -7.20 -10.50 -13.62 -16.59 -19.43 340 27.25 21.93 16.96 12.31 7.95 3.85 -0.00 -3.64 -7.07 -10.32 -13.41 -16.34 -19.15 300 26.14 21.07 16.32 11.86 7.66 3.72 -0.01 -3.53 -6.87 -10.04 -13.05 -15.94 -18.71 240 24.52 19.80 15.37 11.19 7.24 3.51 -0.03 -3.39 -6.59 -9.65 -12.59 -15.43 -18.19 180 23.36 18.90 14.69 10.71 6.94 3.36 -0.05 -3.31 -6.43 -9.44 -12.35 -15.19 -17.98 140 22.49 18.22 14.18 10.35 6.70 3.23 -0.09 -3.28 -6.36 -9.35 -12.26 -15.13 -17.98 100 21.82 17.70 13.79 10.07 6.52 3.12 -0.15 -3.30 -6.36 -9.35 -12.29 -15.20 -18.12
Percent Difference in Nox Emission Index for Temperature Deviations from ISA at various Flight
LevelsAmbient Humidity = 50
y = -0.7403x + 1.4323R2 = 0.9914
-30
-20
-10
0
10
20
30
40
-40 -20 0 20 40
Temperature difference from ISA (C)
Perc
ent D
iffer
ence
in
Emis
sion
Inde
x
450390340300240180140100Regression Line

15
Table 8: Percentage difference of Boeing 2 Emission calculation with temperature variation from ISA for NOx with Ambient Relative Humidity = 60 [Ambient Temperature - ISA Temperature] C Flight -30 -25 -20 -15 -10 -5 0 5 10 15 20 25 30 Level 450 27.89 22.43 17.34 12.57 8.11 3.93 -0.01 -3.71 -7.21 -10.52 -13.66 -16.66 -19.53 390 27.89 22.43 17.33 12.57 8.11 3.93 -0.01 -3.71 -7.20 -10.50 -13.64 -16.62 -19.46 340 27.25 21.93 16.96 12.31 7.95 3.85 -0.01 -3.64 -7.08 -10.33 -13.42 -16.37 -19.18 300 26.14 21.07 16.32 11.86 7.66 3.71 -0.01 -3.54 -6.88 -10.05 -13.08 -15.98 -18.78 240 24.52 19.80 15.37 11.19 7.24 3.50 -0.04 -3.41 -6.62 -9.70 -12.66 -15.53 -18.32 180 23.36 18.90 14.69 10.70 6.93 3.34 -0.08 -3.35 -6.49 -9.52 -12.47 -15.35 -18.20 140 22.49 18.22 14.17 10.34 6.68 3.20 -0.14 -3.35 -6.46 -9.48 -12.44 -15.38 -18.30 100 21.81 17.69 13.77 10.05 6.48 3.07 -0.22 -3.40 -6.50 -9.54 -12.54 -15.54 -18.57
Percent Difference in Nox Emission Index for Temperature Deviations from ISA at various Flight
LevelsAmbient Humidity = 60
y = -0.7411x + 1.4185R2 = 0.9915
-30
-20
-10
0
10
20
30
40
-40 -20 0 20 40
Temperature difference from ISA (C)
Perc
ent D
iffer
ence
in
Emis
sion
Inde
x
450390340300240180140100Regression Line

16
Table 9: Percentage difference of Boeing 2 Emission calculation with temperature variation from ISA for NOx with Ambient Relative Humidity = 70 [Ambient Temperature - ISA Temperature] C Flight -30 -25 -20 -15 -10 -5 0 5 10 15 20 25 30 Level 450 27.89 22.43 17.34 12.57 8.11 3.93 -0.01 -3.72 -7.22 -10.53 -13.68 -16.69 -19.57 390 27.89 22.43 17.33 12.57 8.11 3.93 -0.01 -3.71 -7.21 -10.51 -13.65 -16.64 -19.49 340 27.25 21.93 16.96 12.31 7.95 3.85 -0.01 -3.65 -7.09 -10.34 -13.44 -16.39 -19.22 300 26.14 21.07 16.32 11.86 7.66 3.71 -0.02 -3.55 -6.89 -10.07 -13.11 -16.03 -18.84 240 24.52 19.80 15.37 11.18 7.23 3.50 -0.05 -3.43 -6.65 -9.74 -12.72 -15.62 -18.45 180 23.35 18.89 14.68 10.70 6.92 3.32 -0.11 -3.39 -6.55 -9.60 -12.58 -15.51 -18.42 140 22.48 18.21 14.16 10.32 6.66 3.17 -0.19 -3.42 -6.55 -9.61 -12.63 -15.62 -18.63 100 21.81 17.68 13.76 10.02 6.45 3.02 -0.29 -3.50 -6.64 -9.73 -12.80 -15.89 -19.01
Percent Difference in Nox Emission Index for Temperature Deviations from ISA at various Flight
LevelsAmbient Humidity = 70
y = -0.742x + 1.4038R2 = 0.9917
-30
-20
-10
0
10
20
30
40
-40 -20 0 20 40
Temperature difference from ISA (C)
Perc
ent D
iffer
ence
in
Emis
sion
Inde
x
450390340300240180140100Regression Line
17
Table 10: Percentage difference of Boeing 2 Emission calculation with temperature variation from ISA for NOx with Ambient Relative Humidity = 80 [Ambient Temperature - ISA Temperature] C Flight -30 -25 -20 -15 -10 -5 0 5 10 15 20 25 30 Level 450 27.89 22.43 17.34 12.57 8.11 3.92 -0.01 -3.72 -7.22 -10.54 -13.70 -16.71 -19.62 390 27.89 22.43 17.33 12.57 8.11 3.93 -0.01 -3.71 -7.21 -10.52 -13.66 -16.66 -19.53 340 27.25 21.93 16.96 12.31 7.95 3.85 -0.01 -3.65 -7.09 -10.35 -13.46 -16.42 -19.26 300 26.14 21.07 16.32 11.85 7.66 3.71 -0.02 -3.55 -6.90 -10.09 -13.14 -16.07 -18.91 240 24.52 19.80 15.36 11.18 7.23 3.49 -0.06 -3.45 -6.68 -9.79 -12.79 -15.71 -18.58 180 23.35 18.89 14.68 10.69 6.90 3.30 -0.13 -3.43 -6.61 -9.69 -12.70 -15.67 -18.64 140 22.48 18.21 14.15 10.31 6.64 3.13 -0.23 -3.49 -6.65 -9.74 -12.81 -15.86 -18.95 100 21.80 17.67 13.74 10.00 6.41 2.97 -0.37 -3.61 -6.78 -9.92 -13.06 -16.23 -19.46
Percent Difference in Nox Emission Index for Temperature Deviations from ISA at various Flight
LevelsAmbient Humidity = 80
y = -0.7429x + 1.39R2 = 0.9918
-30
-20
-10
0
10
20
30
40
-40 -20 0 20 40
Temperature difference from ISA (C)
Perc
ent D
iffer
ence
in
Emis
sion
Inde
x
450390340300240180140100Regression Line
18
Table 11: Percentage difference of Boeing 2 Emission calculation with temperature variation from ISA for NOx with Ambient Relative Humidity = 90 [Ambient Temperature - ISA Temperature] C Flight -30 -25 -20 -15 -10 -5 0 5 10 15 20 25 30 Level 450 27.89 22.43 17.34 12.57 8.11 3.92 -0.01 -3.72 -7.23 -10.55 -13.72 -16.74 -19.66 390 27.89 22.43 17.33 12.57 8.11 3.92 -0.01 -3.72 -7.22 -10.53 -13.68 -16.68 -19.56 340 27.25 21.93 16.96 12.31 7.95 3.85 -0.01 -3.66 -7.10 -10.36 -13.47 -16.44 -19.30 300 26.14 21.07 16.32 11.85 7.66 3.71 -0.03 -3.56 -6.92 -10.11 -13.17 -16.11 -18.97 240 24.51 19.80 15.36 11.18 7.22 3.48 -0.08 -3.47 -6.71 -9.83 -12.85 -15.80 -18.71 180 23.35 18.89 14.67 10.68 6.89 3.29 -0.16 -3.47 -6.66 -9.77 -12.81 -15.83 -18.85 140 22.47 18.20 14.15 10.29 6.62 3.10 -0.28 -3.55 -6.74 -9.88 -12.99 -16.11 -19.27 100 21.79 17.66 13.73 9.97 6.38 2.91 -0.44 -3.71 -6.92 -10.11 -13.32 -16.56 -19.90
Percent Difference in Nox Emission Index for Temperature Deviations from ISA at various Flight
LevelsAmbient Humidity = 90
y = -0.7438x + 1.3754R2 = 0.9919
-30
-20
-10
0
10
20
30
40
-40 -20 0 20 40
Temperature difference from ISA (C)
Perc
ent D
iffer
ence
in
Emis
sion
Inde
x
450390340300240180140100Regression Line

19
Table 12: Percentage difference of Boeing 2 Emission calculation with temperature variation from ISA for NOx with Ambient Relative Humidity = 100 [Ambient Temperature - ISA Temperature] C Flight -30 -25 -20 -15 -10 -5 0 5 10 15 20 25 30 Level 450 27.89 22.43 17.34 12.57 8.11 3.92 -0.02 -3.73 -7.24 -10.57 -13.74 -16.77 -19.70 390 27.89 22.43 17.33 12.57 8.11 3.92 -0.01 -3.72 -7.22 -10.54 -13.69 -16.70 -19.59 340 27.25 21.93 16.96 12.31 7.95 3.84 -0.02 -3.66 -7.11 -10.37 -13.49 -16.47 -19.34 300 26.14 21.07 16.31 11.85 7.66 3.70 -0.03 -3.57 -6.93 -10.13 -13.20 -16.16 -19.03 240 24.51 19.80 15.36 11.18 7.22 3.47 -0.09 -3.49 -6.74 -9.87 -12.92 -15.90 -18.84 180 23.35 18.89 14.67 10.67 6.88 3.27 -0.19 -3.51 -6.72 -9.85 -12.93 -15.99 -19.07 140 22.47 18.19 14.14 10.28 6.60 3.07 -0.33 -3.62 -6.84 -10.01 -13.17 -16.35 -19.60 100 21.79 17.65 13.71 9.95 6.34 2.86 -0.51 -3.81 -7.06 -10.31 -13.57 -16.90 -20.34
Percent Difference in Nox Emission Index for Temperature Deviations from ISA at various Flight
LevelsAmbient Humidity = 100
y = -0.7446x + 1.36R2 = 0.9921
-30
-20
-10
0
10
20
30
40
-40 -20 0 20 40
Temperature difference from ISA (C)
Perc
ent D
iffer
ence
in
Emis
sion
Inde
x
450390340300240180140100Regression Line

20
Table 13: Percentage difference of Boeing 2 Emission calculation with relative humidity variation from ISA for NOx [Ambient humidity - ISA Humidity] C Flight -30 -20 -10 0 10 20 30 40 50 60 70 Level 450 0.01 0.00 0.00 0.00 -0.00 -0.00 -0.01 -0.01 -0.01 -0.01 -0.02 390 0.01 0.00 0.00 0.00 -0.00 -0.00 -0.01 -0.01 -0.01 -0.01 -0.01 340 0.01 0.00 0.00 0.00 -0.00 -0.00 -0.01 -0.01 -0.01 -0.01 -0.02 300 0.01 0.01 0.00 0.00 -0.00 -0.01 -0.01 -0.02 -0.02 -0.03 -0.03 240 0.04 0.03 0.01 0.00 -0.01 -0.03 -0.04 -0.05 -0.06 -0.08 -0.09 180 0.08 0.05 0.03 0.00 -0.03 -0.05 -0.08 -0.11 -0.13 -0.16 -0.19 140 0.14 0.09 0.05 0.00 -0.05 -0.09 -0.14 -0.19 -0.23 -0.28 -0.33 100 0.22 0.15 0.07 0.00 -0.07 -0.15 -0.22 -0.29 -0.37 -0.44 -0.51
Percent Difference in Nox Emission Index for Relative Humidity Deviations from ISA at various
Flight Levels
y = -0.0027x - 0.0002R2 = 0.999
-0.6
-0.5
-0.4
-0.3
-0.2
-0.1
0
0.1
0.2
0.3
-50 0 50 100
Temperature difference from ISA (C)
Perc
ent D
iffer
ence
in E
mis
sion
In
dex
450390340300240180140100Regression Line
21
The Boeing 2 Method The Advanced Emission Model 3 (AEM3) uses a modified version of the Boeing Method 2 (BM2) to estimate emission calculations (NOx, CO and HC). The International Civil Aviation Organization (ICAO) has established standards and recommended practices (Annex 16 to the ICAO Conference, "Environmental Protection") for the testing of aircraft emissions on turbojet and turbofan engines. The world's jet engine manufacturers have been required to report to ICAO the results of required testing procedures, which pertain to aircraft emissions. ICAO regulations require reporting of emissions testing data on the following gaseous emittants: NOx, HC, CO and smoke. In addition to this, ICAO requires that information be reported on the rate of fuel flow at various phases of flight. Hence, ICAO maintains a database of this where information is available to find out this information for each of the phases of flight as ICAO defines them: Operating Mode Throttle Setting (percent of maximum rated output) Take off 100% Climb out 85% Approach 30% Taxi/ground idle 7% The Boeing Aircraft Company conducted an extensive study for NASA on emission inventories for scheduled civil aircraft worldwide (see Baugham et al., 1996). The Boeing 2 Method is an empirical procedure developed for this study which computes in-flight aircraft emissions using, as a base, the measured fuel flow and the engine ICAO data sheets. Whereas the first Boeing method took into account ambient pressure, temperature and humidity, the second method was more complicated (and accurate). This new method allowed for ambient pressure, temperature and humidity as well as Mach number.
Methodology The Boeing Method uses English units and not S.I. therefore the first step is to convert the Fuel Flow (Wf) from the ICAO data for a specific engine from kg/s to lbs/hr (multiply by 7936). The Emission Index (EI) values from ICAO are to be read as lbs/1000 lbs (same number as g/kg). The ICAO fuel flow values are then to be modified by a correction for aircraft installation effects (Wf): Take off 1.010 Climb out 1.013 Approach 1.020 Taxi/ground idle 1.100 STEP 1: Curve fitting the Data The Emission Indices (NOx, HC, CO) are to be plotted (log-log) against the corrected fuel flow (Wf). STEP 2: Fuel Flow Factor

22
a) Calculate the values ∂amb (ambient pressure correction factor) and θamb (ambient temperature correction factor) where: ∂amb = Pamb/14.696 (Pamb = ambient (inlet) pressure) and θamb = (Tamb + 273.15)/288.15 (Tamb = ambient (inlet) temperature) b) The fuel flow values are further modified by the ambient values: Wff = (Wf /∂amb) θamb
3.8 exp (0.2 M2), where M is the Mach number. c) Calculate the humidity correction factor H: H = -19.0 (ω - 0.0063), ω = specific humidity, ω = (0.62198 (Φ) Pv)/( Pamb - (Φ) Pv), where Φ is relative humidity and Pv = saturation vapour pressure in psia. For a correction to this formula, please see the EUROCONTROL corrected Boeing 2 Method below. Pv = (0.014504)10β and, β = 7.90298(1- 373.16/( Tamb + 273.16)) + 3.00571 + (5.02808)log(373.16/( Tamb + 273.16)) + 1.3816 x 10⁻⁷ [ 1- 10 11.344(1- (Tamb + 273.16)/373.16)] + 8.1328 x 10⁻³ [10 3.49149(1- 373.16/( Tamb + 273.16)) -1] STEP 3: Compute EI Calculate the emission indices of HC, CO and NOx: EIHC = REIHC θamb
3.3/∂amb1.02
EICO = REICO θamb3.3/∂amb
1.02 EINOX = REINOX (∂amb
1.02/θamb3.3) 0.5 exp H
Where the REIHC, REICO, and REINOX values are read off the graph (STEP 1) by substituting Wff for Wf. STEP 4: Total Emission Total (HC, CO, NOx) = Number of Engines x ∑i (EIHC, EICO, EINOX)i x Wfi x timei x 10 –3, in lbs. Bibliography: ICAO Engine Exhaust Emissions Data Bank, First Edition 1995, ICAO, Doc 9646 AN/493 Steven L. Baughcum, Terrance G. Tritz, Stephen C. Henderson, and David C. Pickett, Scheduled Civil Aircraft Emission Inventories for 1992: Database Development and Analysis. Nasa Contract Report 4700. 1996.

23
EUROCONTROL corrected Boeing 2 Method Eurocontrol has implemented a slightly modified version of the Boeing 2 method as part of its AEM3 emission calculations. It should be noted that there is a mistake within the published Boeing 2 specific humidity calculation. The formula for the humidity correction factor should read: ω = (0.62198 (Φ) Pv)/( Pamb – 0.37802 (Φ) Pv) The reason is that specific humidity, ω, is defined as the ratio of the mass of water vapor in a sample of moist air to the total mass of moist air. i.e. ω = Mw / (Mw + Md) where Mw is the mass of water vapor and Md is the mass of dry air. Specific humidity can also be calculated from the actual vapour pressure (Pa) and ambient Pressure (Pamb) as: ω = e * Pa / (Pamb – ((1 – e) * Pa)) The factor e is the ratio of the mole weight of water vapour to that of air (18.016 / 28.966 - both in g/mol) = 0.62198 (a dimensionless quantity). Please note also that actual vapour pressure (Pa) is related to relative humidity (Φ) and the saturation vapour pressure (Pv) by the formula: Φ = Pa / Pv Therefore the correct formula for specific humidity is ω = (0.62198 (Φ) Pv)/( Pamb – 0.37802 (Φ) Pv) Note that the factor 0.37802 appearing is 1 – e = 1 – 0.62198 (= 0.37802) and must be included in the formula. This correction has been implemented as the EUROCONTROL corrected Boeing 2 Method.


25
AAppppeennddiixx BB:: CCaassee SSttuuddiieess UUssiinngg AAccttuuaall MMeetteeoorroollooggyy iinn AAEEMM33 iinn CCoommppaarriissoonn ttoo
IInntteerrnnaattiioonnaall SSttaannddaarrdd AAttmmoosspphheerree
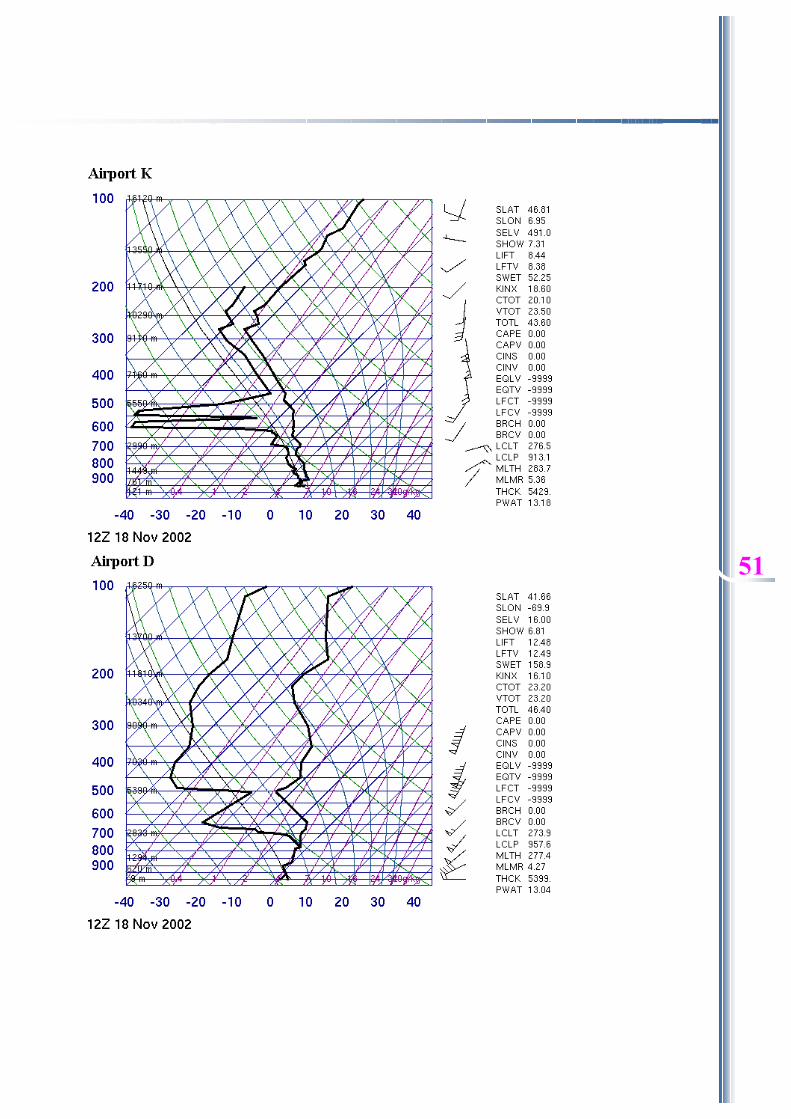
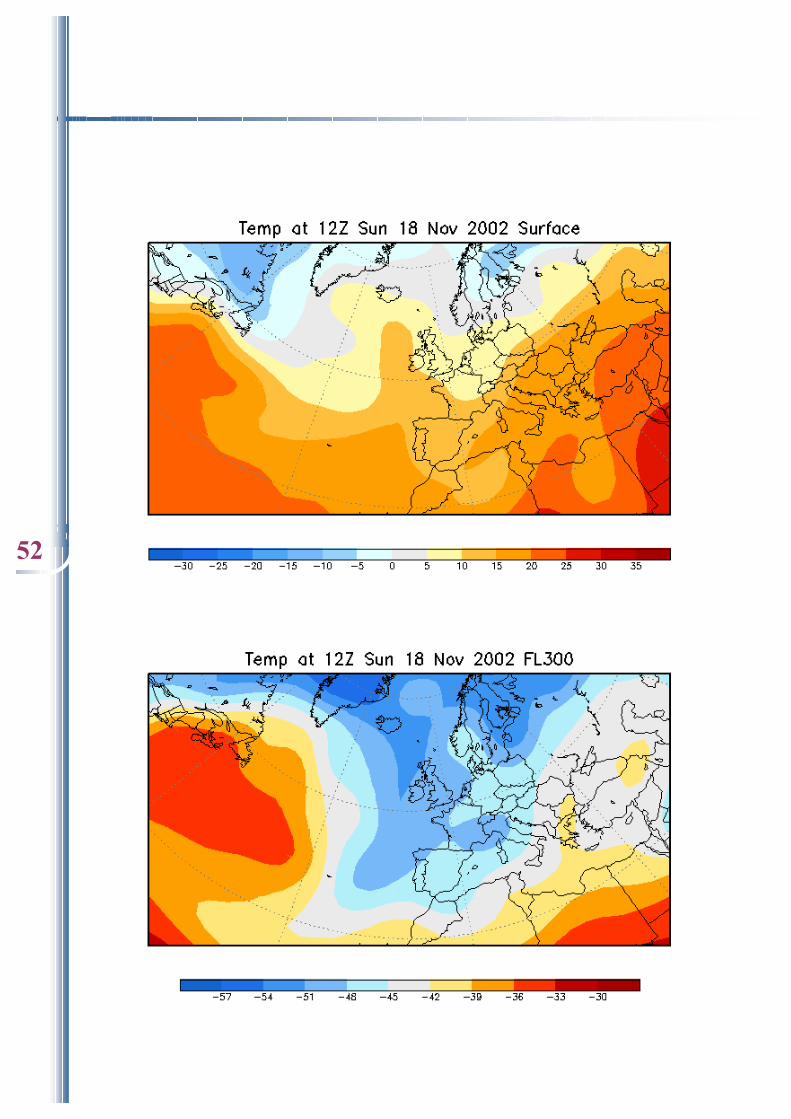
Seven test cases were examined to see the effect of using actual meteorology in AEM3 rather than the ICAO International Standard Atmosphere. Actual meteorology was collected and analysed to produce a meteorological data set valid for the duration of each of the test cases. Synoptic analyses were consulted as well as the Reanalysis data and radiosonde data from the airports involved (See section below entitled Meteorological charts of cases studies). AEM3 was run twice for each test case: once with standard atmosphere and the second time using the actual meteorology. The data, presented here, shows an increase of as much as 4% NOx for cold days and an increase of CO and HC of as much as 10% for warm days.
ISA Met. % diff. General NOx CO HC NOx CO HC NOx CO HC Weather
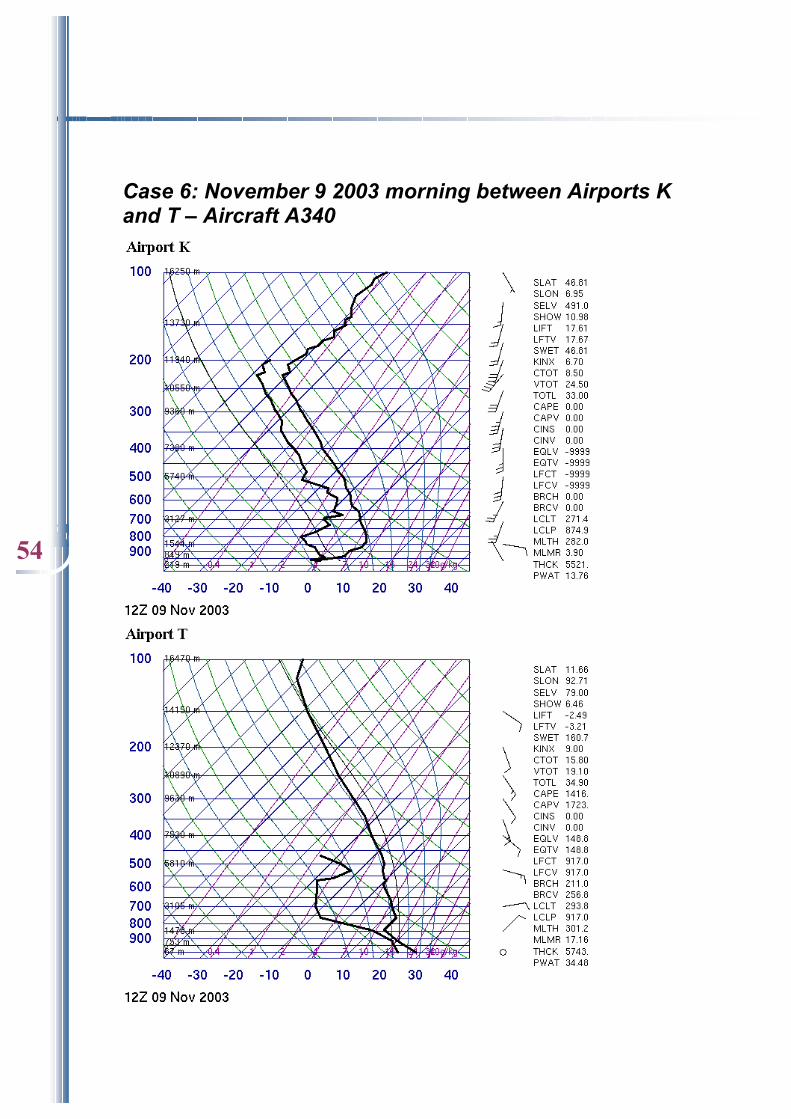
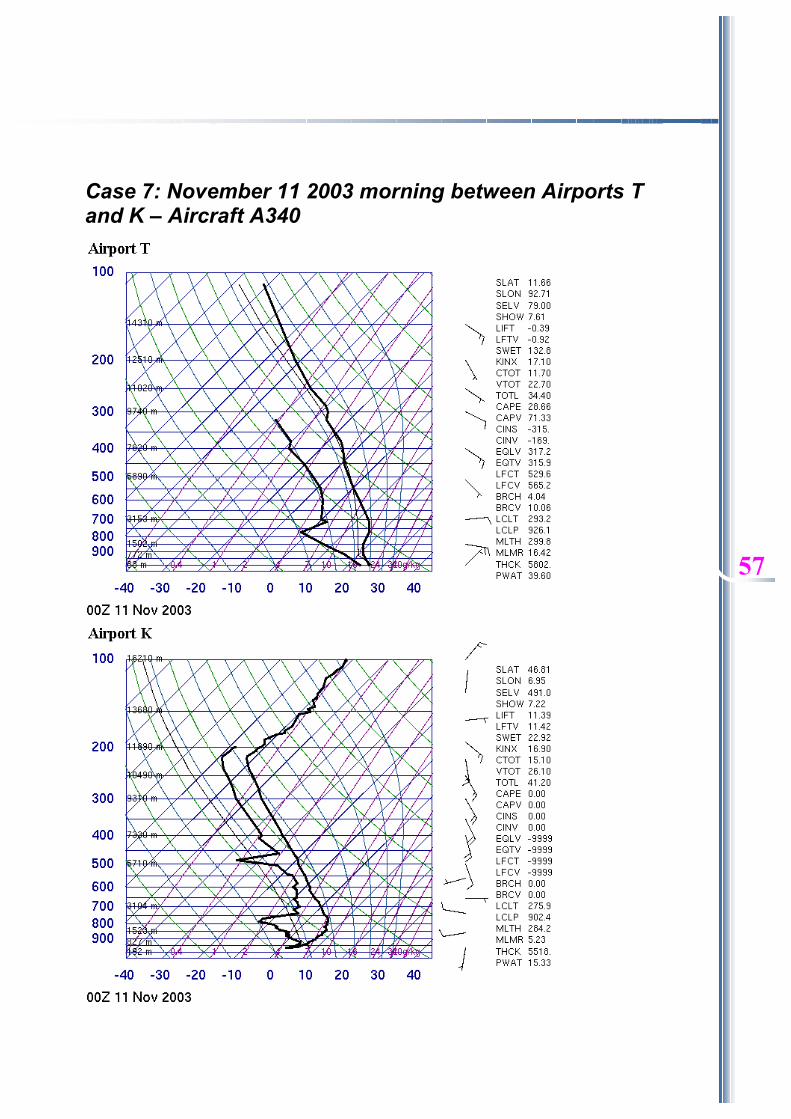
Case 1 42.56 17.14 0.27 44.28 16.34 0.25 4.05 -4.70 -5.13 Colder Case 2 34.95 15.48 1.74 32.70 17.07 1.93 -6.42 10.30 10.88 Much Warmer Case 3 37.85 24.36 2.76 36.96 25.34 2.87 -2.35 4.01 4.03 Warmer Case 4 54.20 44.99 5.95 53.05 47.28 6.23 -2.12 5.09 4.76 Warmer Case 5 217.29 130.72 6.83 208.65 140.93 7.26 -3.98 7.81 6.26 Warmer Case 6 470.42 186.68 17.05 476.56 183.44 16.95 1.31 -1.74 -0.56 Slightly Colder Case 7 118.60 50.49 7.09 114.71 51.85 7.30 -3.27 2.69 2.91 Warmer
ICAO International Standard Atmosphere The ICAO (International Civil Aviation Organization) has created the ISA (International Standard Atmosphere). The ISA is a "model" of the atmosphere, designed to allow for standardized comparison of conditions on a given day. Comparisons can be made of the actual air pressure, or air temperature on a given day to the pressure or temperature in the ISA. If the density at your altitude is the same as the density at 10,000' in the ISA we say you are at a Density altitude of 10,000'. If the pressure at your altitude is the same as the pressure at 5000' in the ISA we say you are at a pressure altitude of 5000'. Each of the preceding is true regardless of the actual altitude you are at. The ISA contains standard measures for pressure, density, viscosity, temperature, etc. The values are listed in the figures below:

26

27
Case 1: January 07 2003 morning between Airports K and H – Aircraft A320-DAC
Case Study 1: NOx, CO and HC Emission
0
5
10
15
20
25
30
35
40
45
50
NOx CO HC
Pollutant
Em
issi
on (k
g)
Standard AtmosphereActual Meteorology
Case Study 1: NOx, Co and HC % difference using Actual Meteorology
-6
-4
-2
0
2
4
6
NOx CO HC
Pollutant
Per
cent
age
Diffe
renc
e fr
om IS
A (%
)

28
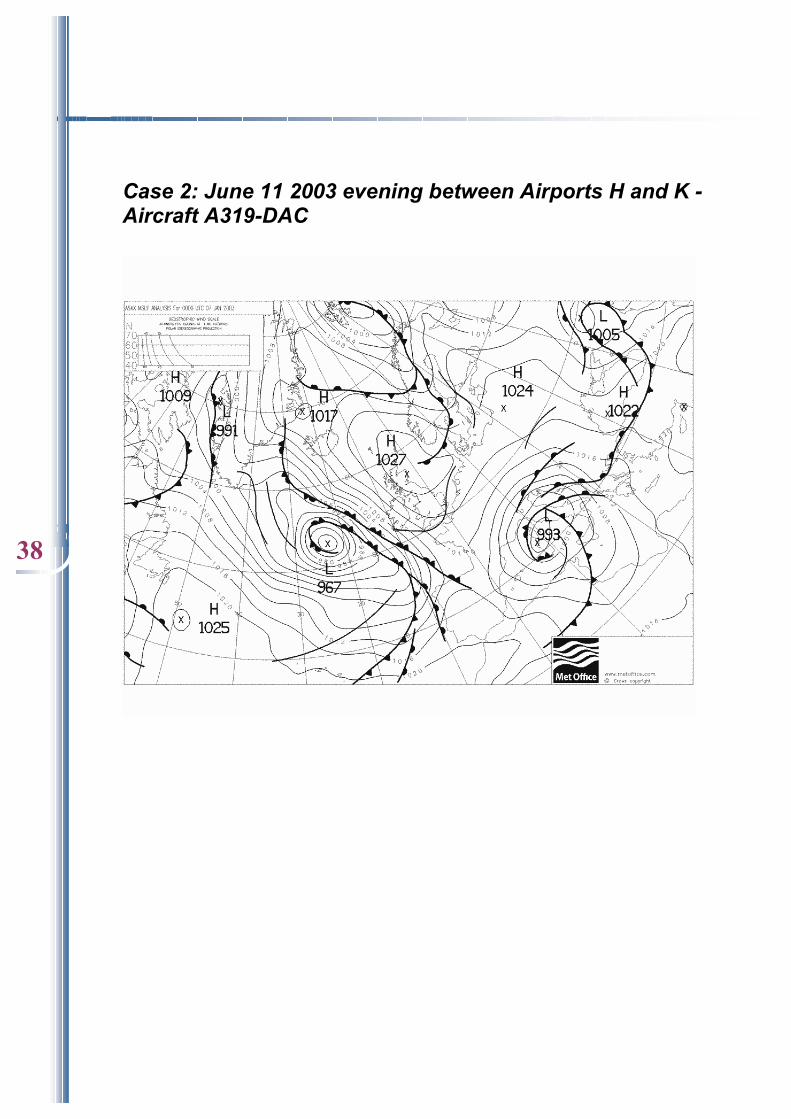
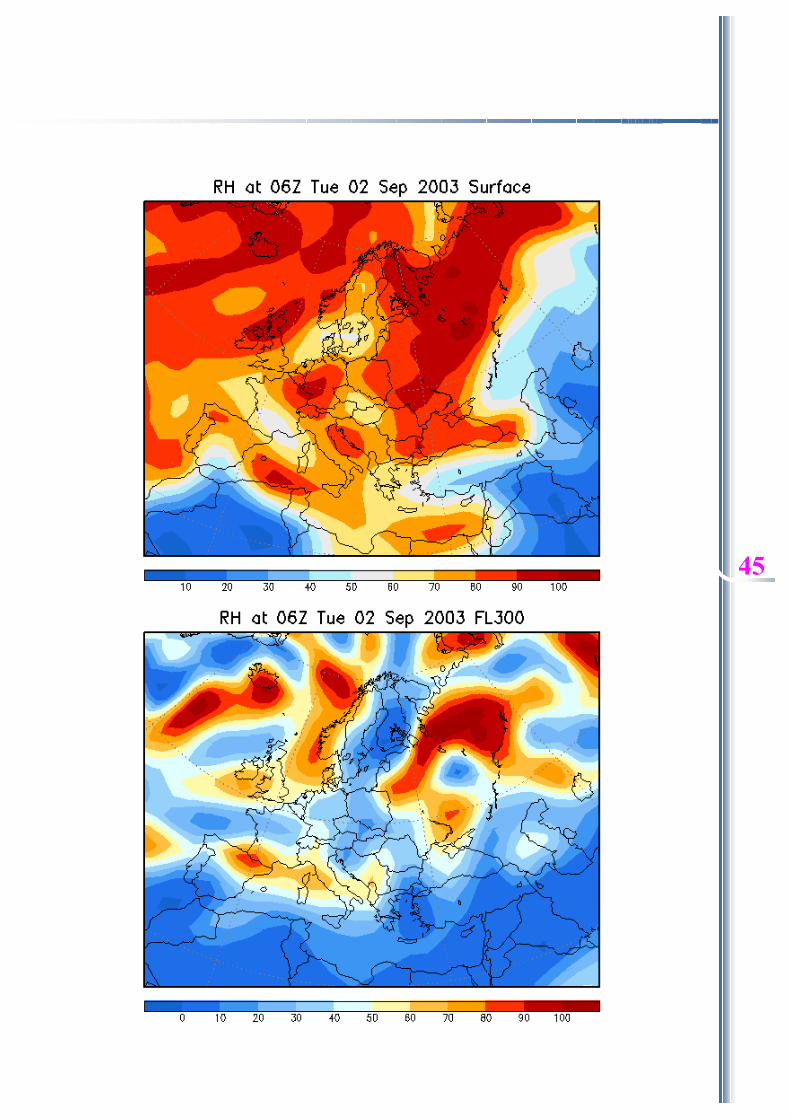
Case 2: June 11 2003 evening between Airports H and K - Aircraft A319-DAC
Case Study 2: NOx, CO and HC Emission
0
5
10
15
20
25
30
35
40
NOx CO HC
Pollutant
Emis
sion
(kg)
Standard AtmosphereActual Meteorology
Case Study 2: NOx, Co and HC % difference using Actual Meteorology
-8
-6
-4
-2
0
2
4
6
8
10
12
NOx CO HC
Pollutant
Perc
enta
ge D
iffer
ence
from
ISA
(%)

29
Case 3: September 2 2003 morning between Airports K and H – Aircraft A321-DAC
Case Study 3: NOx, CO and HC Emission
0
5
10
15
20
25
30
35
40
NOx CO HC
Pollutant
Em
issi
on (k
g)
Standard AtmosphereActual Meteorology
Case Study 3: NOx, Co and HC % difference using Actual Meteorology
-3
-2
-1
0
1
2
3
4
5
NOx CO HC
Pollutant
Perc
enta
ge D
iffer
ence
from
ISA
(%)

30
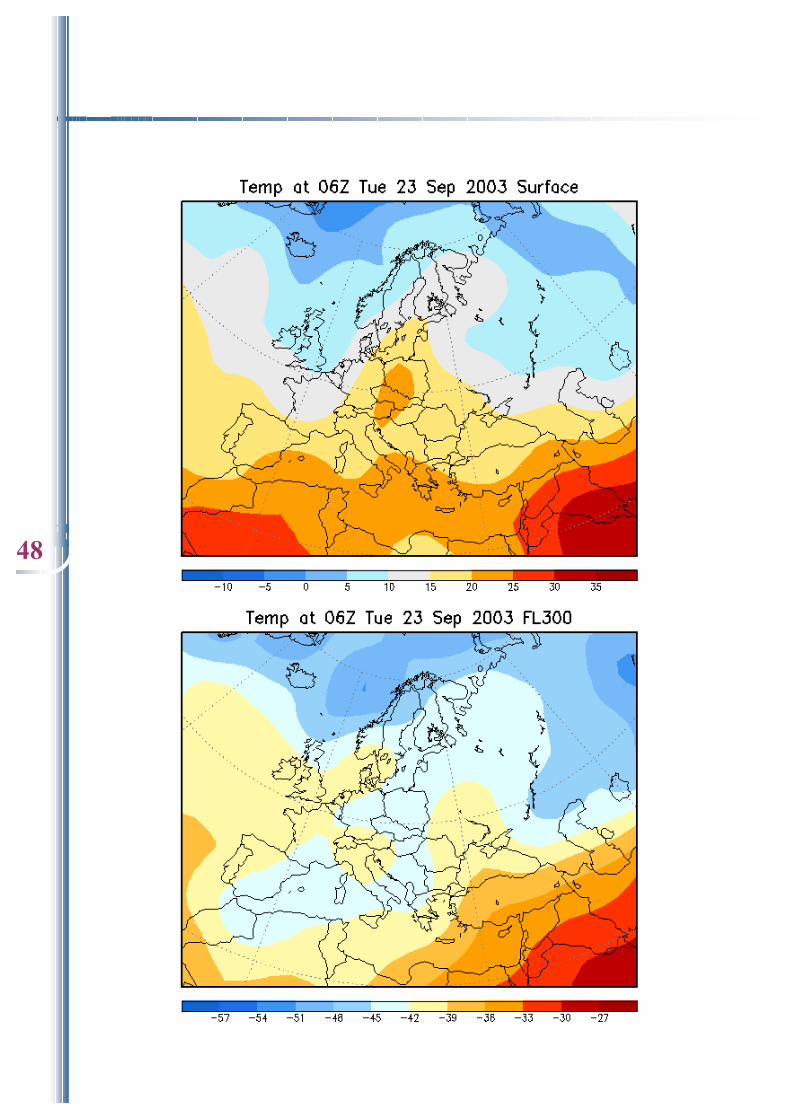
Case 4: September 23 2003 morning between Airports K and B – Aircraft A320-SAC
Case Study 4: NOx, CO and HC Emission
0
10
20
30
40
50
60
NOx CO HC
Pollutant
Emis
sion
(kg)
Standard AtmosphereActual Meteorology
Case Study 4: NOx, Co and HC % difference using Actual Meteorology
-3
-2
-1
0
1
2
3
4
5
6
NOx CO HC
Pollutant
Perc
enta
ge D
iffer
ence
from
ISA
(%)

31
Case 5: November 18 2002 morning between Airports K and D – Aircraft A330
Case Study 5: NOx, CO and HC Emission
0
50
100
150
200
250
NOx CO HC
Pollutant
Emis
sion
(kg)
Standard AtmosphereActual Meteorology
Case Study 5: NOx, Co and HC % difference using Actual Meteorology
-6
-4
-2
0
2
4
6
8
10
NOx CO HC
Pollutant
Perc
enta
ge D
iffer
ence
from
ISA
(%)

32
Case 6: November 9 2003 morning between Airports K and T – Aircraft A340
Case Study 6: NOx, CO and HC Emission
0
100
200
300
400
500
600
NOx CO HC
Pollutant
Em
issi
on (k
g)
Standard AtmosphereActual Meteorology
Case Study 6: NOx, Co and HC % difference using Actual Meteorology
-2
-1.5
-1
-0.5
0
0.5
1
1.5
NOx CO HC
Pollutant
Per
cent
age
Diff
eren
ce fr
om IS
A (%
)

33
Case 7: November 11 2003 morning between Airports T and K – Aircraft A340
Case Study 7: NOx, CO and HC Emission
0
20
40
60
80
100
120
140
NOx CO HC
Pollutant
Em
issi
on (k
g)
Standard AtmosphereActual Meteorology
Case Study 7: NOx, Co and HC % difference using Actual Meteorology
-4
-3
-2
-1
0
1
2
3
4
NOx CO HC
Pollutant
Per
cent
age
Diffe
renc
e fr
om IS
A (%
)

34
MMeetteeoorroollooggiiccaall CChhaarrttss ooff CCaassee SSttuuddiieess Case 1: January 07 2003 morning between Airports K and H – Aircraft A320-DAC

35

36

37
38
Case 2: June 11 2003 evening between Airports H and K - Aircraft A319-DAC

39

40

41

42
Case 3: September 2 2003 morning between Airports K and H – Aircraft A321-DAC

43

44
45

46
Case 4: September 23 2003 morning between Airports K and B – Aircraft A320-SAC

47
48

49

50
Case 5: November 18 2002 morning between Airports K and D – Aircraft A330
51
52

53
54
Case 6: November 9 2003 morning between Airports K and T – Aircraft A340

55

56
57
Case 7: November 11 2003 morning between Airports T and K – Aircraft A340

58

59


61
AAppppeennddiixx CC:: AAEEMM33 aaiirrccrraafftt ddaattaabbaassee vvss.. EEuurrooppeeaann ttrraaffffiicc ssaammpplleess
The following table shows flights made by Aircraft types for which there are no known equivalents within the AEM3 database. The sample data selected was for the period 1-March 2003 to 1-June 2003. The percentage of these flights to the total number of flights for the period is very small (<0.3%). Since the majority of the aircraft types are single piston engine aircraft it can be assumed the error level in terms of fuel burn and emissions is even less significant.
Total ALL Flights from 1-Mar-2003 to 1-Jun-2003
Total flights ICAO Aircraft unknown in AEM
Percentage of unknown to Total
2088398 4211 0.201637810417363000
ICAO Code Number of flights % of total flights A1 5 0.000239417965349517 A140 382 0.018291532552703100 A225 10 0.000478835930699033 A270 2 0.000095767186139807 A3 1 0.000047883593069903 AC56 1 0.000047883593069903 ALO2 1 0.000047883593069903 AN22 51 0.002442063246565070 AN70 4 0.000191534372279613 ARVA 7 0.000335185151489323 AT8T 5 0.000239417965349517 B06 94 0.004501057748570910 B105 30 0.001436507792097100 B14A 2 0.000095767186139807 B209 2 0.000095767186139807 B24 1 0.000047883593069903 B412 103 0.004932010086200040 B430 16 0.000766137489118453 B74R 3 0.000143650779209710 BE17 1 0.000047883593069903 BE32 1 0.000047883593069903 BE50 2 0.000095767186139807 BE77 1 0.000047883593069903 BE80 2 0.000095767186139807 BK17 187 0.008954231904071920 BSTP 32 0.001532274978236910 C10T 56 0.002681481211914590 C120 2 0.000095767186139807 C170 1 0.000047883593069903 C188 2 0.000095767186139807 C27J 6 0.000287301558419420 C295 124 0.005937565540668010 C320 1 0.000047883593069903 C411 1 0.000047883593069903 C97 1 0.000047883593069903 CL2P 5 0.000239417965349517 CL41 16 0.000766137489118453 CMD1 1 0.000047883593069903

62
CNBR 21 0.001005555454467970 COL3 26 0.001244973419817490 D253 4 0.000191534372279613 DH85 1 0.000047883593069903 DHC5 21 0.001005555454467970 DIMO 1 0.000047883593069903 DO28 43 0.002058994502005840 DOVE 3 0.000143650779209710 DR10 8 0.000383068744559227 DR30 3 0.000143650779209710 E2 23 0.001101322640607780 E314 63 0.003016666363403910 E45X 1 0.000047883593069903 E6 2 0.000095767186139807 EC35 142 0.006799470215926270 EC45 11 0.000526719523768937 EH10 27 0.001292857012887390 EXPL 39 0.001867460129726230 F2 1 0.000047883593069903 F8L 1 0.000047883593069903 FOUG 5 0.000239417965349517 FREL 22 0.001053439047537870 G115 55 0.002633597618844680 G120 2 0.000095767186139807 G202 1 0.000047883593069903 G2GL 1 0.000047883593069903 G73T 2 0.000095767186139807 GA20 1 0.000047883593069903 GLAS 10 0.000478835930699033 GLST 9 0.000430952337629130 H46 2 0.000095767186139807 IR23 2 0.000095767186139807 JABI 1 0.000047883593069903 JU52 1 0.000047883593069903 KA27 2 0.000095767186139807 KE3 5 0.000239417965349517 L29 1 0.000047883593069903 L90 2 0.000095767186139807 LEG2 3 0.000143650779209710 LNC2 30 0.001436507792097100 LNCE 6 0.000287301558419420 LYNX 38 0.001819576536656330 M18 1 0.000047883593069903 M200 10 0.000478835930699033 M203 1 0.000047883593069903 M21 1 0.000047883593069903 M22 6 0.000287301558419420 M5 3 0.000143650779209710 M55 5 0.000239417965349517 M7 11 0.000526719523768937

63
M7T 1 0.000047883593069903 MI24 2 0.000095767186139807 MI26 8 0.000383068744559227 MI8 37 0.001771692943586420 MICO 5 0.000239417965349517 N260 1 0.000047883593069903 NAVI 4 0.000191534372279613 NOMA 5 0.000239417965349517 P149 15 0.000718253896048550 P337 4 0.000191534372279613 P39 2 0.000095767186139807 P40 1 0.000047883593069903 PA18 8 0.000383068744559227 PA20 1 0.000047883593069903 PA22 3 0.000143650779209710 PA36 1 0.000047883593069903 PC6P 2 0.000095767186139807 PC9 58 0.002777248398054390 PICO 1 0.000047883593069903 PINO 84 0.004022221817871880 PNR3 1 0.000047883593069903 PRM1 403 0.019297088007171000 R22 3 0.000143650779209710 R722 16 0.000766137489118453 RF4 4 0.000191534372279613 RF6 14 0.000670370302978647 RFAL 5 0.000239417965349517 RV4 2 0.000095767186139807 S200 1 0.000047883593069903 S208 9 0.000430952337629130 S210 1 0.000047883593069903 S2P 2 0.000095767186139807 S2T 95 0.004548941341640820 S3 8 0.000383068744559227 S360 6 0.000287301558419420 S58P 1 0.000047883593069903 S61R 2 0.000095767186139807 S65C 7 0.000335185151489323 SB91 5 0.000239417965349517 SBR2 9 0.000430952337629130 SEEE 1 0.000047883593069903 SR20 202 0.009672485800120480 SR22 130 0.006224867099087430 SU17 7 0.000335185151489323 SU24 1 0.000047883593069903 SU26 1 0.000047883593069903 SUBA 2 0.000095767186139807 SV4 4 0.000191534372279613 T28 4 0.000191534372279613 T34T 1 0.000047883593069903

64
T38 9 0.000430952337629130 TBM 1 0.000047883593069903 TEX2 29 0.001388624199027200 TJJJ 1 0.000047883593069903 TS11 11 0.000526719523768937 TU95 1 0.000047883593069903 VK3P 2 0.000095767186139807 W3 1 0.000047883593069903 WA40 3 0.000143650779209710 WA50 2 0.000095767186139807 YK52 3 0.000143650779209710 YS11 41 0.001963227315866040 Z43 40 0.001915343722796130 ZZZZ 1035 0.049559518827350000

For more information about the EEC Society Environment Economy Research Area
please contact:
Ted ELLIFF Society Environment Economy
Research Area Manager EUROCONTROL Experimental Centre
ZI Les Bordes, 91222 Brétigny s/ Orge Cedex, FRANCE Tel: 01 69 88 73 36 Fax: 01 69 88 72 11
E-Mail: [email protected] or visit http://www.eurocontrol.fr/