european central bank · * european central bank.the opinions expressed in this paper are those of...
TRANSCRIPT

E U R O P E A N C E N T R A L B A N K
WO R K I N G PA P E R S E R I E S
WORKING PAPER NO. 54
ASSESSMENT CRITERIA FOROUTPUT GAP ESTIMATES
BYGONZALO CAMBA-MENDEZ
AND DIEGO RODRIGUEZ-PALENZUELA
April 2001


E U R O P E A N C E N T R A L B A N K
WO R K I N G PA P E R S E R I E S
* European Central Bank.The opinions expressed in this paper are those of the authors and do not necessarily reflect the views of the European Central Bank.We are grateful to Günter Coenen, Gabriel Fagan and Gabriel Pérez Quirós for helpful comments.
WORKING PAPER NO. 54
ASSESSMENT CRITERIA FOROUTPUT GAP ESTIMATES
BYGONZALO CAMBA-MENDEZ
AND DIEGO RODRIGUEZ-PALENZUELA*
April 2001

© European Central Bank, 2001
Address Kaiserstrasse 29
D-60311 Frankfurt am Main
Germany
Postal address Postfach 16 03 19
D-60066 Frankfurt am Main
Germany
Telephone +49 69 1344 0
Internet http://www.ecb.int
Fax +49 69 1344 6000
Telex 411 144 ecb d
All rights reserved.
Reproduction for educational and non-commercial purposes is permitted provided that the source is acknowledged.
The views expressed in this paper are those of the authors and do not necessarily reflect those of the European Central Bank.
ISSN 1561-0810

3ECB Working Paper No 54 � April 2001
Contents
Abstract 5
1 Introduction 7
2 The Multivariate Models 10
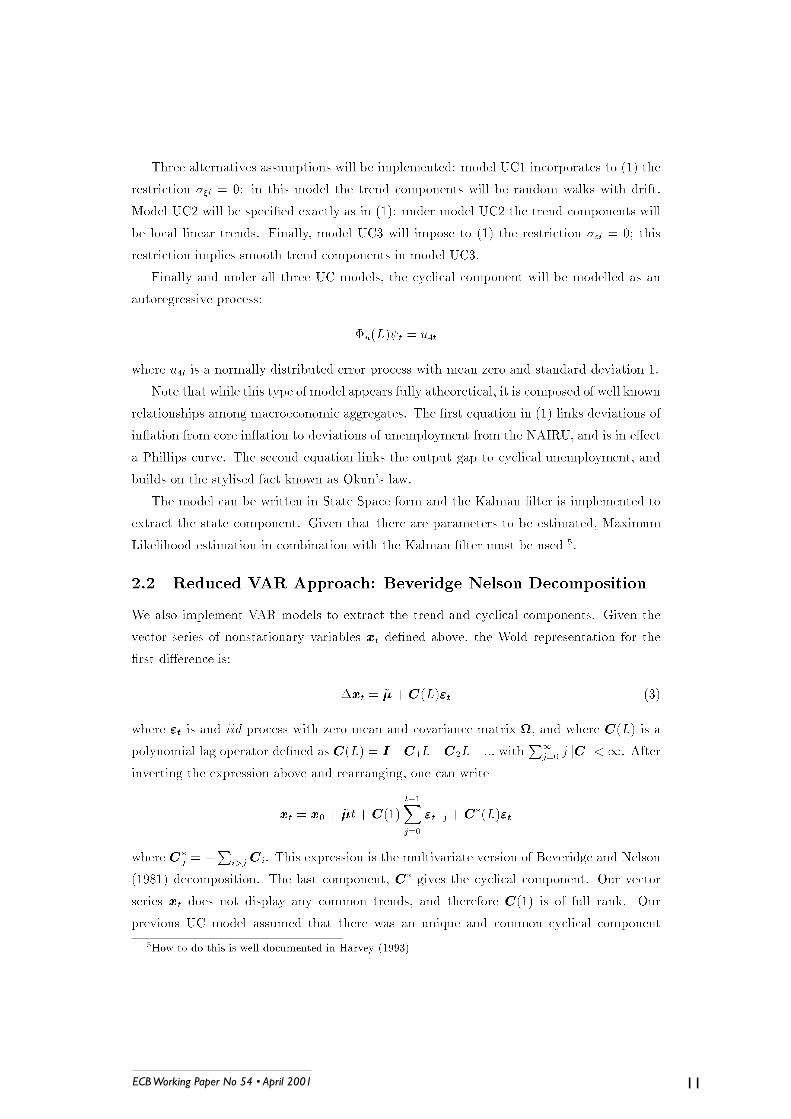
2.1 An Unobserved Component (UC) Model 102.2 Reduced VAR Approach: Beveridge Nelson Decomposition 112.3 Reduced VAR Approach: Blanchard and Quah Decomposition 12
3 Model Assessment 14
3.1 Measures of Forecasting Performance 143.2 Measures of Consistency of Output Gap Estimates 15
4 Empirical Results 16
4.1 Euro wide Data Results 164.2 US Data Results 18
5 Conclusion 20
References 22
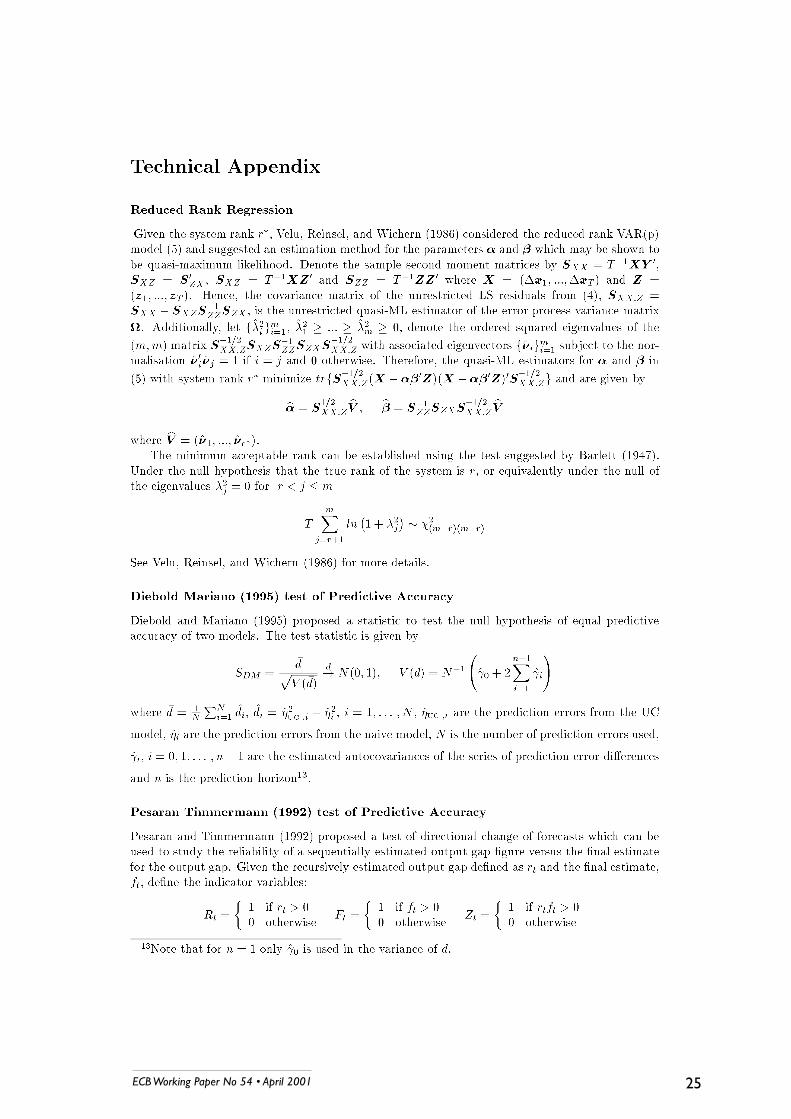
Technical Appendix 25
Tables and figures 27
European Central Bank Working Paper Series 39

4 ECB Working Paper No 54 � April 2001

5ECB Working Paper No 54 � April 2001

6 ECB Working Paper No 54 � April 2001

7ECB Working Paper No 54 � April 2001

8 ECB Working Paper No 54 � April 2001

9ECB Working Paper No 54 � April 2001

10 ECB Working Paper No 54 � April 2001
11ECB Working Paper No 54 � April 2001

12 ECB Working Paper No 54 � April 2001

13ECB Working Paper No 54 � April 2001

14 ECB Working Paper No 54 � April 2001

15ECB Working Paper No 54 � April 2001

16 ECB Working Paper No 54 � April 2001

17ECB Working Paper No 54 � April 2001

18 ECB Working Paper No 54 � April 2001

19ECB Working Paper No 54 � April 2001
20 ECB Working Paper No 54 � April 2001

21ECB Working Paper No 54 � April 2001

22 ECB Working Paper No 54 � April 2001

23ECB Working Paper No 54 � April 2001

24 ECB Working Paper No 54 � April 2001
25ECB Working Paper No 54 � April 2001

26 ECB Working Paper No 54 � April 2001

27ECB Working Paper No 54 � April 2001
Table 1Forecasting Accuracy: Euro-wide Data. a

28 ECB Working Paper No 54 � April 2001
Table 2Consistency of Sequential Cycles Estimates. Euro-wide Dataa

29ECB Working Paper No 54 � April 2001
Table 3Correlation between Capacity Utilisation and Output Gap: Euro-wide Data

30 ECB Working Paper No 54 � April 2001
Table 4Forecasting Accuracy: US Data a

31ECB Working Paper No 54 � April 2001
Table 5Consistency of Sequential Cycles Estimates: US Data a

32 ECB Working Paper No 54 � April 2001
Table 6Correlation between Capacity Utilisation and Output Gap: US Data

33ECB W
orking Paper No 54 � April 2001
Cyclical Inflation UC1
-4
-3
-2
-1
0
1
2
3
1980 1982 1984 1986 1988 1990 1992 1994 1996 1998
Cyclical Inflation UC2
-3
-2
-1
0
1
2
3
4
1980 1982 1984 1986 1988 1990 1992 1994 1996 1998
Cyclical Inflation UC3
-2
-1.5
-1
-0.5
0
0.5
1
1.5
2
2.5
3
1980 1982 1984 1986 1988 1990 1992 1994 1996 1998
Output Gap UC1
-0.05
-0.04
-0.03
-0.02
-0.01
0
0.01
0.02
0.03
0.04
1980 1982 1984 1986 1988 1990 1992 1994 1996 1998
Cyclical Unemployment UC1
-2
-1.5
-1
-0.5
0
0.5
1
1.5
2
2.5
1980 1982 1984 1986 1988 1990 1992 1994 1996 1998
Output Gap UC2
-0.04
-0.03
-0.02
-0.01
0
0.01
0.02
0.03
0.04
0.05
1980 1982 1984 1986 1988 1990 1992 1994 1996 1998
Output Gap UC3
-0.03
-0.02
-0.01
0
0.01
0.02
0.03
0.04
0.05
1980 1982 1984 1986 1988 1990 1992 1994 1996 1998
Cyclical Unemployment UC2
-2
-1.5
-1
-0.5
0
0.5
1
1980 1982 1984 1986 1988 1990 1992 1994 1996 1998
Cyclical Unemployment UC3
-1
-0.8
-0.6
-0.4
-0.2
0
0.2
0.4
0.6
0.8
1
1980 1982 1984 1986 1988 1990 1992 1994 1996 1998
Figure 1 Final (solid line) vs Recursive (dashed line) Cycle Estimates. Euro area � UC Models

34ECB W
orking Paper No 54 � April 2001
Cyclical Inflation BN1
-3
-2
-1
0
1
2
3
1980 1982 1984 1986 1988 1990 1992 1994 1996 1998
Cyclical Inflation BN2
-3
-2.5
-2
-1.5
-1
-0.5
0
0.5
1
1.5
2
2.5
1980 1982 1984 1986 1988 1990 1992 1994 1996 1998
Cyclical Inflation BN3
-3
-2.5
-2
-1.5
-1
-0.5
0
0.5
1
1.5
2
2.5
1980 1982 1984 1986 1988 1990 1992 1994 1996 1998
Output Gap BN1
-0.008
-0.006
-0.004
-0.002
0
0.002
0.004
0.006
0.008
0.01
1980 1982 1984 1986 1988 1990 1992 1994 1996 1998
Cyclical Unemployment BN1
-0.8
-0.6
-0.4
-0.2
0
0.2
0.4
0.6
1980 1982 1984 1986 1988 1990 1992 1994 1996 1998
Output Gap BN2
-0.02
-0.015
-0.01
-0.005
0
0.005
0.01
0.015
0.02
1980 1982 1984 1986 1988 1990 1992 1994 1996 1998
Output Gap BN3
-0.02
-0.015
-0.01
-0.005
0
0.005
0.01
0.015
0.02
1980 1982 1984 1986 1988 1990 1992 1994 1996 1998
Cyclical Unemployment BN2
-1
-0.8
-0.6
-0.4
-0.2
0
0.2
0.4
0.6
0.8
1980 1982 1984 1986 1988 1990 1992 1994 1996 1998
Cyclical Unemployment BN3
-1
-0.8
-0.6
-0.4
-0.2
0
0.2
0.4
0.6
0.8
1980 1982 1984 1986 1988 1990 1992 1994 1996 1998
Figure 2Final (solid line) vs Recursive (dashed line) Cycle Estimates. Euro Area � BN Models

35ECB W
orking Paper No 54 � April 2001
Cyclical Inflation BQ1
-3
-2.5
-2
-1.5
-1
-0.5
0
0.5
1
1.5
2
2.5
1980 1982 1984 1986 1988 1990 1992 1994 1996 1998
Cyclical Inflation BQ2
-3
-2.5
-2
-1.5
-1
-0.5
0
0.5
1
1.5
2
2.5
1980 1982 1984 1986 1988 1990 1992 1994 1996 1998
Cyclical Inflation BQ3
-3
-2.5
-2
-1.5
-1
-0.5
0
0.5
1
1.5
2
2.5
1980 1982 1984 1986 1988 1990 1992 1994 1996 1998
Output Gap BQ1
-5.00E-03
-4.00E-03
-3.00E-03
-2.00E-03
-1.00E-03
0.00E+00
1.00E-03
2.00E-03
3.00E-03
4.00E-03
5.00E-03
1980 1982 1984 1986 1988 1990 1992 1994 1996 1998
Output Gap BQ2
-0.008
-0.006
-0.004
-0.002
0
0.002
0.004
0.006
1980 1982 1984 1986 1988 1990 1992 1994 1996 1998
Output Gap BQ3
-0.008
-0.006
-0.004
-0.002
0
0.002
0.004
0.006
1980 1982 1984 1986 1988 1990 1992 1994 1996 1998
Figure 3Final (solid line) vs Recursive (dashed line) Cycle Estimates. Euro Area � BQ Models

36ECB W
orking Paper No 54 � April 2001
Cyclical Inflation UC1
-2.5
-2
-1.5
-1
-0.5
0
0.5
1
1.5
2
1980 1982 1984 1986 1988 1990 1992 1994 1996 1998
Cyclical Inflation UC2
-2.5
-2
-1.5
-1
-0.5
0
0.5
1
1.5
2
1980 1982 1984 1986 1988 1990 1992 1994 1996 1998
Cyclical Inflation UC3
-6
-5
-4
-3
-2
-1
0
1
2
3
4
5
1980 1982 1984 1986 1988 1990 1992 1994 1996 1998
Output Gap UC1
-0.08
-0.06
-0.04
-0.02
0
0.02
0.04
1980 1982 1984 1986 1988 1990 1992 1994 1996 1998
Cyclical Unemployment UC1
-2
-1
0
1
2
3
4
1980 1982 1984 1986 1988 1990 1992 1994 1996 1998
Output Gap UC2
-0.06
-0.05
-0.04
-0.03
-0.02
-0.01
0
0.01
0.02
0.03
0.04
1980 1982 1984 1986 1988 1990 1992 1994 1996 1998
Output Gap UC3
-0.1
-0.08
-0.06
-0.04
-0.02
0
0.02
0.04
0.06
0.08
1980 1982 1984 1986 1988 1990 1992 1994 1996 1998
Cyclical Unemployment UC2
-2
-1.5
-1
-0.5
0
0.5
1
1.5
2
2.5
3
1980 1982 1984 1986 1988 1990 1992 1994 1996 1998
Cyclical Unemployment UC3
-8
-6
-4
-2
0
2
4
6
8
1980 1982 1984 1986 1988 1990 1992 1994 1996 1998
Figure 4Final (solid line) vs Recursive (dashed line) Cycle Estimates. US Data � UC Models

37ECB W
orking Paper No 54 � April 2001
Figure 5Final (solid line) vs Recursive (dashed line) Cycle Estimates. US Data � BN Models
38ECB W
orking Paper No 54 � April 2001
Cyclical Inflation BQ1
-2
-1.5
-1
-0.5
0
0.5
1
1.5
2
2.5
3
1980 1982 1984 1986 1988 1990 1992 1994 1996 1998
Cyclical Inflation BQ2
-2
-1.5
-1
-0.5
0
0.5
1
1.5
2
2.5
1980 1982 1984 1986 1988 1990 1992 1994 1996 1998
Cyclical Inflation BQ3
-2
-1.5
-1
-0.5
0
0.5
1
1.5
2
2.5
1980 1982 1984 1986 1988 1990 1992 1994 1996 1998
Output Gap BQ1
-0.01
-0.008
-0.006
-0.004
-0.002
0
0.002
0.004
0.006
1980 1982 1984 1986 1988 1990 1992 1994 1996 1998
Output Gap BQ2
-1.00E-02
-8.00E-03
-6.00E-03
-4.00E-03
-2.00E-03
0.00E+00
2.00E-03
4.00E-03
6.00E-03
1980 1982 1984 1986 1988 1990 1992 1994 1996 1998
Output Gap BQ3
-1.00E-02
-8.00E-03
-6.00E-03
-4.00E-03
-2.00E-03
0.00E+00
2.00E-03
4.00E-03
6.00E-03
1980 1982 1984 1986 1988 1990 1992 1994 1996 1998
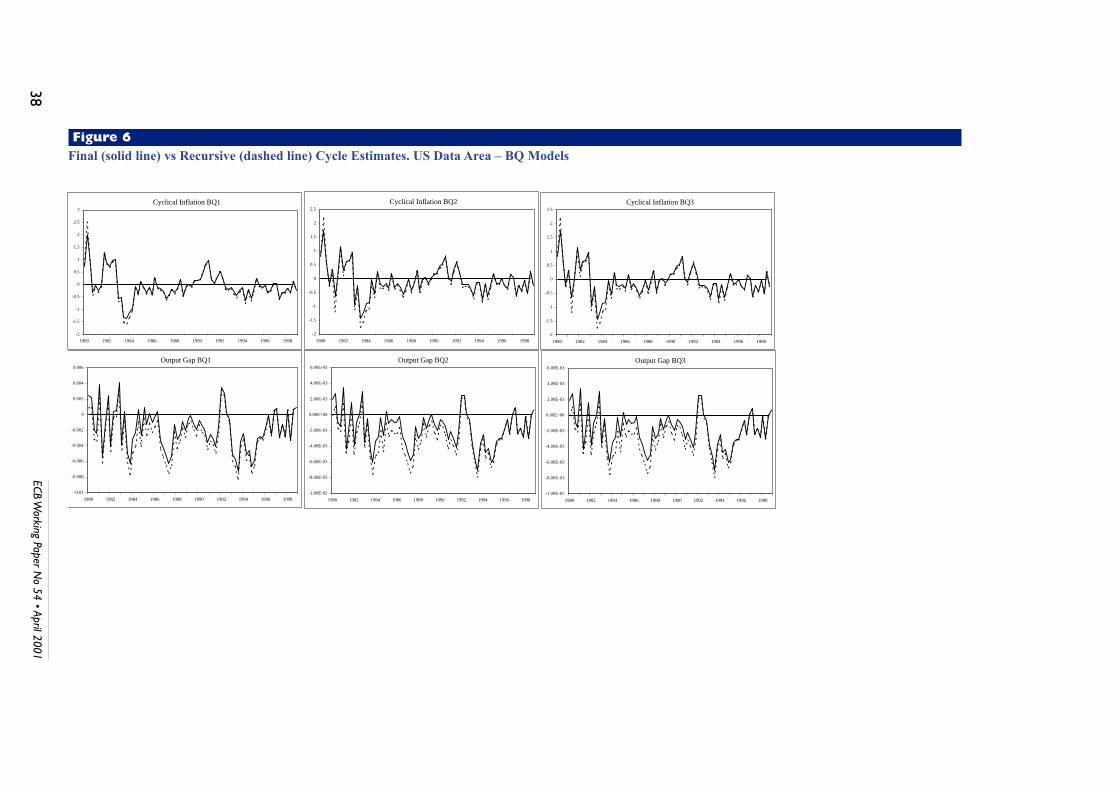
Figure 6Final (solid line) vs Recursive (dashed line) Cycle Estimates. US Data Area � BQ Models

European Central Bank Working Paper Series
1 �A global hazard index for the world foreign exchange markets� by V. Brousseau and F. Scacciavillani, May 1999.
2 �What does the single monetary policy do? A SVAR benchmark for the European CentralBank� by C. Monticelli and O.Tristani, May 1999.
3 �Fiscal policy effectiveness and neutrality results in a non-Ricardian world� by C. Detken,May 1999.
4 �From the ERM to the euro: new evidence on economic and policy convergence among EU countries� by I.Angeloni and L. Dedola, May 1999.
5 �Core inflation: a review of some conceptual issues� by M.Wynne, May 1999.
6 �The demand for M3 in the euro area� by G. Coenen and J.-L.Vega, September 1999.
7 �A cross-country comparison of market structures in European banking� by O. de Bandt and E. P. Davis, September 1999.
8 �Inflation zone targeting� by A. Orphanides and V.Wieland, October 1999.
9 �Asymptotic confidence bands for the estimated autocovariance and autocorrelationfunctions of vector autoregressive models� by G. Coenen, January 2000.
10 �On the effectiveness of sterilized foreign exchange intervention� by R. Fatum,February 2000.
11 �Is the yield curve a useful information variable for the Eurosystem?� by J. M. Berk and P. van Bergeijk, February 2000.
12 �Indicator variables for optimal policy� by L. E. O. Svensson and M. Woodford,February 2000.
13 �Monetary policy with uncertain parameters� by U. Söderström, February 2000.
14 �Assessing nominal income rules for monetary policy with model and data uncertainty� by G. D. Rudebusch, February 2000.
15 �The quest for prosperity without inflation� by A. Orphanides, March 2000.
16 �Estimating the implied distribution of the future short term interest rate using theLongstaff-Schwartz model� by P. Hördahl, March 2000.
17 �Alternative measures of the NAIRU in the euro area: estimates and assessment� by S. Fabiani and R. Mestre, March 2000.
18 �House prices and the macroeconomy in Europe: Results from a structural VAR analysis� by M. Iacoviello,April 2000.
39ECB Working Paper No 54 � April 2001

19 �The euro and international capital markets� by C. Detken and P. Hartmann,April 2000.
20 �Convergence of fiscal policies in the euro area� by O. De Bandt and F. P. Mongelli,May 2000.
21 �Firm size and monetary policy transmission: evidence from German business survey data� by M. Ehrmann, May 2000.
22 �Regulating access to international large value payment systems� by C. Holthausenand T. Rønde, June 2000.
23 �Escaping Nash inflation� by In-Koo Cho and T. J. Sargent, June 2000.
24 �What horizon for price stability� by F. Smets, July 2000.
25 �Caution and conservatism in the making of monetary policy� by P. Schellekens, July 2000.
26 �Which kind of transparency? On the need for clarity in monetary policy-making� by B.Winkler,August 2000.
27 �This is what the US leading indicators lead� by M. Camacho and G. Perez-Quiros,August 2000.
28 �Learning, uncertainty and central bank activism in an economy with strategic interactions�by M. Ellison and N.Valla,August 2000.
29 �The sources of unemployment fluctuations: an empirical application to the Italian case� by S. Fabiani,A. Locarno, G. Oneto and P. Sestito, September 2000.
30 �A small estimated euro area model with rational expectations and nominal rigidities� by G. Coenen and V. Wieland, September 2000.
31 �The disappearing tax base: Is foreign direct investment eroding corporate income taxes?� by R. Gropp and K. Kostial, September 2000.
32 �Can indeterminacy explain the short-run non-neutrality of money?� by F. De Fiore,September 2000.
33 �The information content of M3 for future inflation� by C. Trecroci and J. L. Vega,October 2000.
34 �Capital market development, corporate governance and the credibility of exchange ratepegs� by O. Castrén and T.Takalo, October 2000.
35 �Systemic risk:A survey� by O. De Bandt and P. Hartmann, November 2000.
36 �Measuring core inflation in the euro area� by C. Morana, November 2000.
37 �Business fixed investment: Evidence of a financial accelerator in Europe� by P.Vermeulen,November 2000.
40 ECB Working Paper No 54 � April 2001

38 �The optimal inflation tax when taxes are costly to collect� by F. De Fiore, November 2000.
39 �A money demand system for euro area M3� by C. Brand and N. Cassola, November 2000.
40 �Financial structure and the interest rate channel of ECB monetary policy� by B. Mojon,November 2000.
41 �Why adopt transparency? The publication of central bank forecasts� by P. M. Geraats,January 2001.
42 �An area-wide model (AWM) for the euro area� by G. Fagan, J. Henry and R. Mestre,January 2001.
43 �Sources of economic renewal: from the traditional firm to the knowledge firm� by D. R. Palenzuela, February 2001.
44 �The supply and demand for eurosystem deposits � The first 18 months� by U. Bindseil andF. Seitz, February 2001.
45 �Testing the Rank of the Hankel matrix: a statistical approach� by G. Camba-Mendez and G. Kapetanios, February 2001.
46 �A two-factor model of the German term structure of interest rates� by N. Cassola and J. B. Luís, February 2001.
47 �Deposit insurance and moral hazard: does the counterfactual matter?� by R. Gropp and J.Vesala, February 2001.
48 �Financial market integration in Europe: on the effects of EMU on stock markets� by M. Fratzscher, March 2001.
49 �Business cycle and monetary policy analysis in a structural sticky-price model of the euroarea� by M. Casares, March 2001.
50 �Employment and productivity growth in service and manufacturing sectors in France,Germany and the US� by T. von Wachter, March 2001.
51 �The functional form of the demand for euro area M1� by L. Stracca, March 2001.
52 �Are the effects of monetary policy in the euro area greater in recessions than in booms?�by G. Peersman and F. Smets.
53 �An evaluation of some measures of core inflation for the euro area� by J.-L. Vega and M.A.Wynne,April 2001.
54 �Assessment criteria for output gap estimates� by G. Camba-Méndez and D. R. Palenzuela,April 2001.
41ECB Working Paper No 54 � April 2001