european circular economy stakeholder platform (ecesp
TRANSCRIPT

European Circular Economy Stakeholder Platform
(ECESP) Coordination Group
Leadership Group on Construction
Orientation paper
Lead: Laura Cutaia (ENEA) Participants: INEC, ACR+, European Environmental Bureau, ECOPRENEUR
July 2020

Contents
Introduction ............................................................................................................................................................................. 3
EU policy background .............................................................................................................................................................. 4
EU policies for the construction sector ................................................................................................................................ 5
EU policies and initiatives for raw materials, mining and quarrying .................................................................................... 5
Contribution of the B&C to the achievement of EU carbon neutrality ................................................................................ 6
Database & certification schemes ........................................................................................................................................... 7
Description of focus & topics ................................................................................................................................................... 7
Integrated policies and governance between construction & extractive sectors to integrate secondary supply and urban
planning. .............................................................................................................................................................................. 7
Development of integrated metrics for construction .......................................................................................................... 8
Integrated tools to foster interconnections among construction/extractive and other sectors ......................................... 9
Territorial initiatives to close the loop in the value chain .................................................................................................. 10
Educational initiatives to form experts at any needed level with an integrated approach and awareness-raising
initiatives ........................................................................................................................................................................... 10
Citizens awareness raising initiatives ................................................................................................................................. 11
Proposed activities for 2020 .................................................................................................................................................. 12
Planning for 2020 .................................................................................................................................................................. 12
Construction ...................................................................................................................................................................... 13
Enterprises - number ..................................................................................................................................................... 13
Production value - million euro ..................................................................................................................................... 13
Value added at factor cost - million euro....................................................................................................................... 14
GDP in construction, output approach, per cent share of GVA ..................................................................................... 14
Volume index of production % change on previous period ........................................................................................... 15
Mining & Quarrying (B081 - Quarrying of stone, sand and clay) ....................................................................................... 16
Enterprises – number .................................................................................................................................................... 16
Production value - million euro ..................................................................................................................................... 16
Value added at factor cost - million euro....................................................................................................................... 17
Employees – number ..................................................................................................................................................... 17
Scraps from the sectors ..................................................................................................................................................... 18
Material flow for the EU. ............................................................................................................................................... 18
Total waste Construction – tonnes ................................................................................................................................ 18
Treatment of Mineral waste from construction and demolition, hazardousness and waste management operations –
tonnes ............................................................................................................................................................................ 19
Import – export C&D Hazardous Wastes ....................................................................................................................... 19
3
Introduction
The construction sector is responsible for nearly 50% of the material use in EU by weight and the building sector consumes 40% of the EU energy and represents 35% of our GHG emissions (without counting the embodied emissions).
The largest contributors to these figures are the main carbon-intensive value chains: steel, cement, plastics, paper, glass and non-ferrous metals. Building and construction (B&C) policies therefore have and increasing relevance to reduce both emissions from industry and the direct emissions of the sector. Opportunities for emissions savings through reduced use of virgin materials and more productive use of materials should be unleashed through the economic policies addressing the whole value chains of B&C sector and deserve a
central place in EU climate and environmental policies.

4
EU policy background
The EU Green Deal1 is the ambitious plan of the European Commission for an integrated political framework aimed to boost the efficient use of resources by promoting their circular use, to restore biodiversity and to cut pollution.
The construction sector plays an important role in the recent EU Green Deal. Indeed, it calls for a renovation wave for the building sector in 2020 and for a revision of the construction products regulation promoting a design of new and renovated buildings oriented towards the circular use of resources. Moreover, several policies falling under the umbrella of the EU Green Deal are strictly linked with the construction sector and its closely interconnected sectors, such as the mining quarrying and the waste management.
In the Circular Economy Action Plan2, the European Commission has committed to launch a comprehensive Strategy for a Sustainable Built Environment in 2021. Beside the revision of the construction product regulation, this Strategy foresees to strengthen the circular use of materials through the improvement of the durability and adaptability of the built assets, the integration of life cycle assessment (LCA) into public procurements, the revision of material recovery targets with a focus on insulation materials, and the safe and circular use of excavated soil to reduce soil sealing. In addition, the EU Circular Economy Action Plan highlights the connection with the EU Bioeconomy Strategy3, promoting the circular use of bio-based resources. These policy initiatives will also contribute to achieve EU carbon neutrality by 2050, one of the goals of the EU Climate Law4.
The importance to address the sustainability of
1 Communication from the Commission to the European Parliament, the European Council, the Council, the European Economic and Social Committee and the Committee of the Regions. The European Green Deal. COM/2019/640 final 2 Communication from the Commission to the European Parliament, the Council, the European Economic and Social Committee and The Committee of the Regions. A new Circular Economy Action Plan For a cleaner and more competitive Europe. COM/2020/98 final 3 Communication from the Commission to the European Parliament, the Council, the European Economic and Social Committee and the Committee of the Regions. A sustainable Bioeconomy for Europe: Strengthening the connection between economy, society and the environment. COM/2018/673 final 4 Proposal for a Regulation of the European Parliament and of the Council establishing the framework for achieving climate neutrality and amending Regulation (EU) 2018/1999 (European Climate Law). COM/2020/80 final 5 Communication from the Commission to the European Parliament, the European Council, the Council, the European Economic and Social Committee and the Committee of the Regions. A New Industrial Strategy for Europe. COM/2020/102 final 6 Communication from the Commission to the European Parliament, the Council, the European Economic and Social Committee and the Committee of the Regions. EU Biodiversity Strategy for 2030 Bringing nature back into our lives. COM/2020/380 final 7 Communication from the Commission to the European Parliament, the European Council, the Council, the European Economic and Social Committee and the Committee of the Regions. The EU budget powering the recovery plan for Europe. COM/2020/442 final
construction products and improve the energy efficiency of the EU building stock to achieve carbon neutrality is also mentioned in the EU Industrial Strategy5.
The extraction of raw materials may also be a cause of loss of biodiversity and natural capital. To this end, in its EU Biodiversity Strategy6 the European Commission has highlighted the importance of including considerations on biodiversity in decision-making processes at all levels. Methods, criteria, and standards based on life cycle approach and natural capital accounting will be developed in 2021 to describe the essential features of biodiversity, its services, values, and sustainable use. Moreover, construction activities are listed in the EU Biodiversity Strategy as drivers of soil degradation, which is causing considerable environmental and economic consequences in the EU. Hence, healthy eco-systems, green infrastructures and nature-based solutions should be integrated in urban planning.
During the COVID-19 pandemic, the European Commission has put forward an ambitious recovery plan aimed to kick-start the European economy, boost the green and digital transitions, and make it fairer, more resilient and more sustainable for future generations7. The upcoming renovation wave, foreseen by the EU Green Deal, is seen as an opportunity for job-creation in construction, renovation and other labour-intensive industries. The European Commission will provide financial and regulatory support to this renovation wave of the building stock with the aim to at least double the yearly renovation rate of existing building stock. A boost to the renovation sector has been recently provided also at the national scale. For example, in May 2020, Italy has incentivised the refurbishment of the existing building stock through tax cut for interventions related to improvement of buildings energy efficiency and seismic adaptation.

5
EU policies for the construction sector
Besides the abovementioned overarching policies, there are other EU policies and initiatives that interest the building and construction sector.
According to the European Waste Framework Directive8 , amended in 2018, Member States are asked to support selective demolition techniques to ensure proper handling of hazardous substance as well as to facilitate re-use and high quality recycling, and to ensure the establishment of sorting systems for specific waste streams, i.e. wood, mineral fractions, metals, glass, plastic and plasters. In addition, the European Commission is asked to explore the possibility of defining targets for preparing for re-use and recycling of construction and demolition waste by 2024.
The European Commission has also provided non-binding guidance on the management of construction and demolition waste as well as for the audits before demolition and renovation works of buildings.
The EU construction and demolition waste protocol and guidelines9 addresses different actors of the building sector, such as industry practitioners, public authorities, certification bodies, and clients using recycling materials, and it is aimed to increase confidence in the construction and demolition (C&D) waste management process and the trust in the quality recycled C&D materials. The document Guidelines for the waste audits before demolition and renovation works of buildings10 is aimed to promote a proper planning and implementation of demolition and renovation activities, during which the safety of workers is ensured and waste streams are managed correctly.
8 Directive (EU) 2018/851 of the European Parliament and of the Council of 30 May 2018 amending Directive 2008/98/EC on waste 9 European Commission, 2018. EU Construction and Demolition Waste Protocol and Guidelines. 10 European Commission, 2018. Guidelines for the waste audits before demolition and renovation works of buildings 11 https://ec.europa.eu/environment/eussd/buildings.htm#toolkit. Accessed in June 2020 12 Communication from the Commission to the European Parliament and the Council - The raw materials initiative: meeting our critical needs for growth and jobs in Europe {SEC(2008) 2741}. COM/2008/0699 final 13 https://rmis.jrc.ec.europa.eu/. Accessed in June 2020 14 Directive 2006/21/EC of the European Parliament and of the Council of 15 March 2006 on the management of waste from extractive industries and amending Directive 2004/35/EC - Statement by the European Parliament, the Council and the Commission 15 REPORT FROM THE COMMISSION TO THE EUROPEAN PARLIAMENT, THE COUNCIL, THE EUROPEAN ECONOMIC AND SOCIAL COMMITTEE AND THE COMMITTEE OF THE REGIONS on the implementation of Directive 2006/21/EC on the management of waste from extractive industries and amending Directive 2004/35/EC. COM/2016/0553 final 16 JRC, 2018. Best Available Techniques (BAT) Reference Document for the Management of Waste from Extractive Industries, in accordance with Directive 2006/21/EC; EUR 28963 EN 17 Directive 2012/18/EU of the European Parliament and of the Council of 4 July 2012 on the control of major-accident hazards involving dangerous substances, amending and subsequently repealing Council Directive 96/82/EC
In addition, the European Commission has put in place a voluntary reporting framework to improve the sustainability of buildings, called LEVEL(s)11. The LEVEL(s) framework comprehends a tool supporting the design and the construction of sustainable buildings, improving energy and material efficiency.
EU policies and initiatives for raw materials, mining and quarrying
The mining and quarrying sector is closely interlinked with the construction sector.
In 2008, the European Commission adopted the Raw Materials initiative12 aimed to ensure a fair and sustainable supply of raw materials from the global market, a sustainable supply of raw materials within the EU borders, and an efficient use of resource use through recycling. In addition, the European Commission has developed a Raw Materials Information System (RMIS)13 , a web-based platform reporting information on non-fuel, non-agricultural materials from primary and secondary sources.
The mining and quarrying sector is responsible for the generation of a considerable quantity of waste stream in the EU. A specific legislative framework for the management of waste from the extractive industries has been put in place by the EU to complement applicable horizontal legislation. This framework includes the Extractive Waste Directive14 , a report on the implementation of this directive15, a document on Best Available Techniques for the management of waste from extractive industries16, and the Seveso III Directive17 which includes in its scope operational tailings disposal facilities.
6
Contribution of the B&C to the achievement of EU carbon neutrality
The combined approach of circular economy provisions and digital innovation will deliver as much as 296Mtons of GHG emissions18 from heavy industry alone (56%) and create markets for the industry to apply product and process innovation and investment opportunities towards climate neutrality production and reuse and recycling of materials. Valorisation of different types of waste streams and improved materials efficiency will be relevant across most industries. Material recirculation could lead to save up to 178Mtons of CO2 (mostly in the plastic sector)19. Production improvement can lead to products with a lower material footprint (better use of materials, better design) and process rationalisation also play a major role: i.e. 15% of building materials are wasted during construction. Combined measures would have a potential of 56Mtons of CO2 reduction. Finally the extension of lifespan of products (i.e. via multipurpose design of buildings) and a better and more intense use of these (European office buildings are only used 40% of their capacity, even during office time) will contribute up to an additional 64Mtons of CO2 reduction, as less products will be needed.
These efforts are needed to achieve European and global climate targets: the 2C scenario of IPCC calculated that a budget of 800Gt (billions of tons of CO2 equivalent emissions) is available within this century. As construction needs are currently growing, embedded emissions in the main B&C related products alone can lead to 900Gt of emission in the same time. This is because much carbon is either built into the products themselves and then released at their end of life (plastics) or is inherent to the current chemistry and production process (steel, cement).
From these figures it is quite evident that carbon neutrality cannot be achieved without tacking embedded emissions and that these emissions are mostly concentrated in the energy intensive sectors producing materials and intermediary products related to B&C: metals, plastics, cement. One of the most promising and cost-competitive paths to decarbonise these products is the circular economy.
18 The Circular Economy: a powerful source for climate mitigation, Material Economics, 2019. 19 ibidem
The obvious conclusion is that no carbon neutrality target will ever be achieved if circular economy provisions will not be put at the heart of B&C sectorial policies.
7
Database and certification schemes
Green building codes, standards and rating systems (environmental labels / environmental certifications) have adopted LCA provisions as an important step towards bringing a performance basis to sustainable design. In all the applications, data reliability and comparability are fundamental requirements. Recent studies have highlighted the presence of uncertainty factors in the comparative assessments of construction products making the harmonization of datasets a priority. At EU level, there are several initiatives in this direction. The European Commission launched Level(s); a foundational framework of common European indicators to measure the sustainable performance of buildings across their whole life cycle. It is currently in its test phase, and its ambition is to create a ‘common European language’ for the whole sector value chain, that can help build data, empower debate and drive action. In this context, the development of national databases for construction products becomes a priority in order to support the development and regulation of public policies and promote the acquisition of environmental labels/certifications (Environmental Product Declaration - EPD, Product Environmental Footprint - PEF, Made Green in Italy, LEED, BREEAM). To date initiatives of national databases on construction sector are active in Germany, France and Italy.
Ökobau.dat is a German database for construction materials and building services provided by the Federal Ministry for the Environment, Nature Conservation, Building and Nuclear Safety (BMUB).
Base-Carbone is a France LCA database that include also construction sector.
Arcadia Project is started to develop an Italian LCA database for 15 supply chains including some for the construction sector.
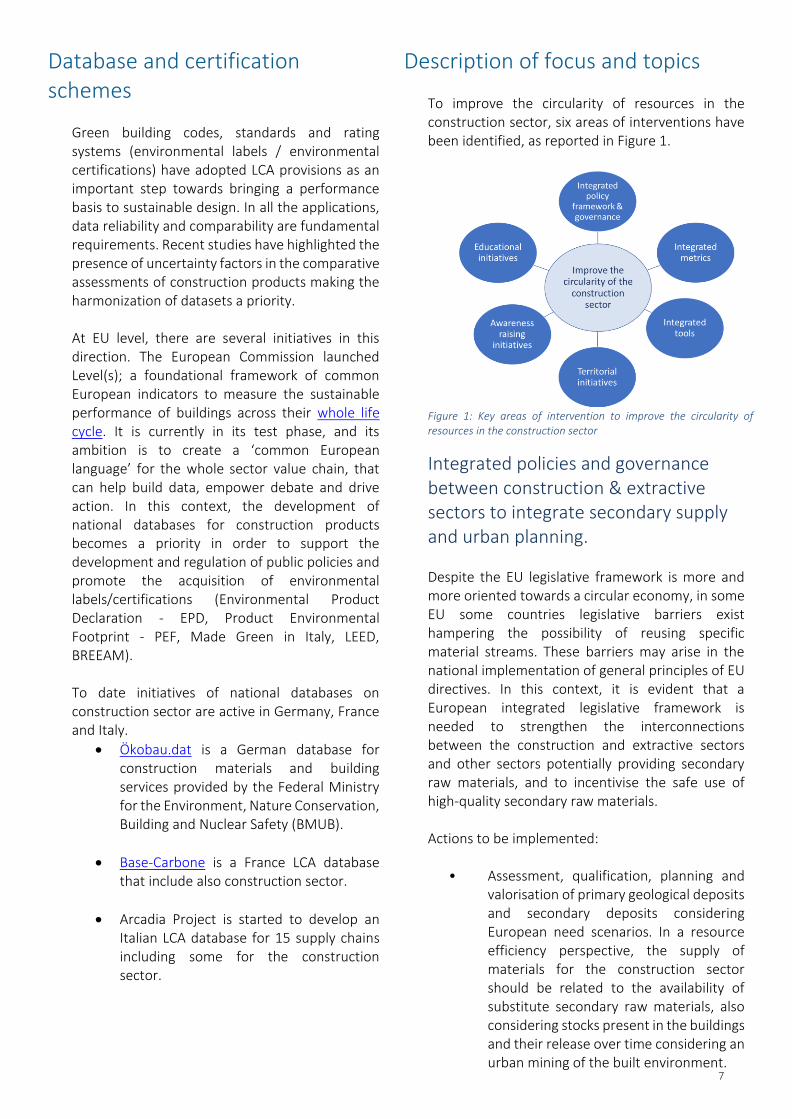
Description of focus and topics To improve the circularity of resources in the construction sector, six areas of interventions have been identified, as reported in Figure 1.
Figure 1: Key areas of intervention to improve the circularity of resources in the construction sector
Integrated policies and governance between construction & extractive sectors to integrate secondary supply and urban planning. Despite the EU legislative framework is more and more oriented towards a circular economy, in some EU some countries legislative barriers exist hampering the possibility of reusing specific material streams. These barriers may arise in the national implementation of general principles of EU directives. In this context, it is evident that a European integrated legislative framework is needed to strengthen the interconnections between the construction and extractive sectors and other sectors potentially providing secondary raw materials, and to incentivise the safe use of high-quality secondary raw materials. Actions to be implemented:
• Assessment, qualification, planning and valorisation of primary geological deposits and secondary deposits considering European need scenarios. In a resource efficiency perspective, the supply of materials for the construction sector should be related to the availability of substitute secondary raw materials, also considering stocks present in the buildings and their release over time considering an urban mining of the built environment.

8
• Creation of cross connections between
construction and extractive sectors and others. Resource efficiency policies should guide and promote the use of all the available resources including raw materials, products and by-products but also residues and wastes both from construction and also from extractive and other sectors. The potential substitution of raw materials by residues produced in other industrial sectors should be investigated and pursued in order to identify the current reuse rate, the potential not yet exploited as well as the operational constrains and the critical issues20 .
• Application of the hierarchy of use (from most wanted to least wanted): re-use of existing under-used buildings (repurposing), avoiding waste generation by privileging building for deconstruction and re-use, recycling of not re-usable C&D material, backfilling.
• Adoption of a comprehensive perspective, based life cycle thinking approach for sustainable assessment. This allows to take into account impacts along the entire supply chain, including embedded emissions, and to consider multiple environmental impacts, highlighting possible trade-offs.
• Support to the circular use of bio-based products in the C&D sector. Bio-based products, indeed, can play an important role in reaching carbon neutrality. However, they can be responsible for other environmental impacts, such as land use and biodiversity loss. Therefore, a sustainable supply of bio-based products should be ensured.
• Promote the development and the implementation of GPP – Green Public Procurement and certification systems: o Circular public procurement.
20 Luciano A., Reale P., Cutaia L., Carletti R., Pentassuglia R., Elmo G., Mancini G. (2018) Resources Optimization and Sustainable Waste Management in Construction Chain in Italy: Toward a Resource Efficiency Plan. Waste Biomass Valor. https://doi.org/10.1007/s12649-018-0533-1 21 Luciano A., Reale P., Cutaia L., Carletti R., Pentassuglia R., Elmo G., Mancini G. (2018) Resources Optimization and Sustainable Waste Management in Construction Chain in Italy: Toward a Resource Efficiency Plan. Waste Biomass Valor. https://doi.org/10.1007/s12649-018-0533-1
Awarding criteria or technical specifications about minimum recycled content, shortening of the supply chain, etc. taking into account life cycle approaches (e.g. Life Cycle Assessment, Life Cycle Costs Analysis Material Flow Analysis).
o Circular schemes. Set up certification schemes mobilizing the local stakeholders to trigger circularity by certifying operations such as selective demolition in order to increase transparency about the quality of the recycled materials.
Development of integrated metrics for construction In all the applications related to green building codes, standards and rating systems, data reliability and comparability are fundamental requirements. The development of sectorial and integrated policies (e.g. resource efficiency plans) also requires a complete knowledge on materials/resource/by-products/waste flows within the construction chain and other interrelated sectors21. In this context, the implementation of integrated metrics for construction become a priority. These metrics requires the development and the implementation of indicators, dataset based on primary data and integrated tools for the whole value chain. Actions to be implemented:
• Definition of indicators for circular economy in the C&D value chain, already available or to be built, for representing the performance of the system according to the circular economy scheme (inputs, product as service, sharing, lifetime extension, outputs). These indicators, if developed at supply chain level, will be very useful to measure and monitor economic circularity and the efficient use of resources.
• Creation of datasets about construction &

9
extractive sectors to measure the circularity in terms of Life Cycle Thinking (LCT). Given the presence of uncertainty factors in the comparative assessments of construction products, as highlighted in recent studies, the development of national dataset and LCA databases and their harmonization become a priority. This will support the development and regulation of public policies promoting the acquisition of environmental labels/certifications (Environmental Product Declaration - EPD, Product Environmental Footprint - PEF, Made Green in Italy, LEED, BREEAM). Another priority is given by the implementation of datasets on materials/resource/waste flows.
• Use of existing indicators, such as the Consumer and other useful footprints measure environmental performances with the aim of reducing environmental impacts taking into account supply chain activities (from extraction of raw materials, through production and use, to final waste management). The Consumer Footprint is a set of life cycle-based indicators assessing the environmental impacts of an average EU citizen developed by the Joint Research Centre22. The approach of the Consumer Footprint can be used to evaluate the effects of policy-relevant scenarios related to the circular use of resources, highlighting hotspots along the supply chain as well as trade-offs between different environmental indicators. Product Environmental Footprint (PEF) and Organisation Environmental Footprint (OEF) allow measuring the environmental performances along the life cycle of products and services respectively. These measures can be used for predictive process optimization, eco-design, identification of significant impacts, environmental declaration and dissemination of environmental information.
Integrated tools to foster
22 Sala S., Beylot A., Corrado S., Crenna E., Sanyé-Mengual E, Secchi M. (2019) Indicators and Assessment of the environmental impact of EU consumption. Consumption and Consumer Footprint for assessing and monitoring EU policies with Life Cycle Assessment, Luxembourg: Publications Office of the European Union, ISBN 978-92-79-99672-6, doi:10.2760/40326
interconnections among construction/extractive and other sectors To ensure a circular use of materials, it is necessary to create interconnections between the construction/extractive sectors, other sectors producing potential secondary raw materials and, more in general, all the actors involved in the value chain. Despite the construction & extractive sectors are interconnected industries and interact also with input–output relationships, there is a lack in the approach to the management of the entire value chain. This is confirmed also in the difficulty of finding uniform data for the value chain in official statistics. A holistic approach to the management of the construction value chain helps to develop a set of criteria for closed-loop cycle materials and components. Actions to be implemented:
• Development and promotion of innovative tools for RMs traceability and identity card of complex products in order to implement an efficient and effective material detection and separation and a safe and efficient product dismantling and sorting enabling highly selective recycling. This brings to a safe and efficient processes for depolluting and disassembling complex products and buildings.
• Development and promotion of platforms for data sharing, stakeholder platforms, Industrial Data Platforms (IDPs). Multi-user platform and multi data platforms designed and developed to manage the entire value chain provide support to all those involved throughout the various stages of construction activities. Such a platform should include technical standards, environmental law; databases; tools to facilitate and transparently manage trading of natural, artificial, and recycled aggregates; interactive catalogues with declarations of building
10
products; and interactive maps for the geolocation of treatment plants, producers, and construction sites23.
• Development and promotion of platforms to create and support the market of building materials (raw and secondary materials). A platform that represents a meeting point between supply and demand comparing also products for technical and environmental performance allows to reduce environmental impacts, promote an informed and transparent use of recycled products, and to encourage a more sustainable use of natural resources.
• Development and promotion of tools and guidelines to make workers of the public sector and policy aware about benefits and possible criticalities of circular use of resources.
• Development and promotion of information Management Systems (IMS) incorporating concepts such as material passports, key performance circular indicators liaising with the EU LEVEL initiative, Building Information Modelling, can effectively support the transition to a green and digital economy and pull the market of the second raw materials. IMS can also trigger reuse schemes when it comes to building components. At a larger scale, such IMS can support urban planning processes, also in terms of mitigation and adaptation to climate change. The IMS can also contribute to properly design and implement economic instruments.
Territorial initiatives to close the loop in the value chain Creating synergies between industries is essential to increase the circularity of the system. For this reason, it is important that territorial initiatives are put in place to support the creation of industrial symbiosis at the local level. Actions to be implemented:
23 Luciano, A., Cutaia, L., Cioffi, F., & Sinibaldi, C. (2020). Demolition and construction recycling unified management: the DECORUM platform
for improvement of resource efficiency in the construction sector. Environmental Science and Pollution Research, 1-12.
Support to local ecosystems, such as
o The ICT platform developed in the H2020 FISSAC project is meant to facilitate the establishment of industrial symbiosis creating local ecosystem with the various stakeholders across the value chain. It is a web-based participatory decision support tool that allows the assessment of different scenarios in terms of environmental, economic and social performances.
o Italian Platform for Industrial Symbiosis , as a support to SMEs to individuate symbiosis opportunities at territorial scale. The Industrial Symbiosis Platform has been addressed in particular to small medium enterprises (SMEs) and other local operators to enable the transfer of resources (materials, energy products, water, services and expertise) and to offer other operational instruments (legal database, tools LCA and Ecodesign, Best practices database, etc.)
• Analysis of secondary materials and scraps from extractive sector. Assessment of resources that can be recovered from scraps from extractive sector (quarries and mines), from active and abandoned sites.
Educational initiatives to form experts at any needed level with an integrated approach and awareness-raising initiatives Despite the increasing interest in the circular use of resource, there is a lack of experts with a comprehensive knowledge of the raw materials management who can efficiently support the implementation of circularity principles in the construction supply chain. In this context, the creation of educational initiatives aimed to define new professional figures would be beneficial. Education initiatives to be implemented:

11
• Promotion of lifelong learning, especially
focused on issues related to main educational gaps, such as the recovery of materials and metals from industrial waste and to entrepreneurial and managerial education24
• Promotion of courses aimed to high-level professional qualifications, ensuring that managers have the appropriate knowledge and skills to tackle the complex challenge of resource circularity in the construction sector. An example of this type of initiatives is the Raw materials manager course proposed by the EIT RawMaterials Academy25.
• Definition of specific school programs on the sustainable management of raw materials, at different education levels, i.e. high schools, university courses (e.g. degree in engineering of resources, economy of resources), and PhD courses.
Citizens awareness raising initiatives It would be important to make citizens aware of the environmental impacts of their consumption choices as well as of the possible benefits associated with circular consumption. While the scope of circular consumption is wide, ranging from transport to housing, food to leisure, products and services related to B&C can also be associated to system-changing consumption patterns, though the peculiarity of this market of course may limit the available choices for consumers and need specific focus and policies. Actions to be implemented: Support campaigns and initiatives aimed to make consumers aware on the environmental impacts of the C&D sector, considering the following increasing trends:
• Made to last o Consumers preferring dwellings
24 Ceruti F., Gavinelli L., Chierici R., Mazzucchelli A., 2019. Lifelong Learning in Europe: An Analysis of Raw Materials Professionals’ Learning Needs. In Entrepreneurial Decisions, Ed. Springer Nature 25 https://rcgreece.labmet.ntua.gr/rms-manager-raw-materials-manager-course-train-future-managers/. Accessed in June 2020
made to last (i.e. with a long warranty period) with low carbon, long-lasting raw materials;
o Consumers buying properties that were designed to be easily repaired, maintained, upgraded, reused and/or repurposed;
o Consumers buying refurbished real estate.
• Disown ownership o Consumers sharing properties that
are not used/lived intensively (office swaps, co-working);
o Consumers renting or leasing instead of buying;
o Consumers co-housing, in order to optimise common spaces.
• Get local o Consumers buying local sustainable
building materials (i.e. tiles, timbers, bricks) when building new properties.
• Get clean o Consumers choosing building
techniques that do not imply more materials consumption than strictly needed (i.e. steel) and limit waste during the construction phase (i.e. reusing bricks during renovations);
o Consumers avoiding construction materials with toxic components at procurement phase– e.g. building with certified toxic free products.
In order to complement the above illustrative directions, additional approaches as well as respective barriers and opportunities could be further explored. Further investigation is needed to assess what type of information should be made available and/or required along the supply chain down to the final user, based on integrated metrics discussed above. This information schemes such as the energy and CO2 label, market incentives and permitting measures could help to streamline sustainable circular consumption patterns in the C&D sector.

12
There is room for exploring what are the marketing approaches that could nudge towards such consumption patterns in the C&D sector. How to open the eyes and the choice of final users on the merits of more sustainable housing remains the ultimate question related to circular consumption in the B&C sector.
Proposed activities for 2020
Position paper
Workshop
Planning for 2020
1 July - strategy paper (outlining the sector situation and activities for what needs to be done to improve circularity) to be shared internally among CG members
15 July – publication of papers online
15 September – preparation of workshop content and format
Autumn – presentation of papers as a basis for the workshops at the annual conference
3-4 November – Annual conference o 4 November – Workshop

13
Annex: the sectors in number
Construction Enterprises – number
Source 1: Source: EUROSTAT (2020)
Production value - million euro
Source 2: Source: EUROSTAT (2020)
GEO/TIME 2009 2010 2011 2012 2013 2014 2015 2016 2017 2018
European Union - 27 countries (from 2020) : : 3.025.382 3.045.057 3.027.669 3.174.834 3.118.683 3.197.745 3.193.012 3.265.623
European Union - 28 countries (2013-2020) : : 3.290.721 3.302.249 3.290.255 3.445.604 3.409.659 3.512.568 3.523.557 3.607.215
European Union - 27 countries (2007-2013) 3.177.088 3.292.331 : : : : : : : :
Austria 29.878 31.196 31.573 32.174 33.518 34.227 34.564 35.078 36.157 35.349
Belgium 81.796 92.203 95.117 95.549 96.791 105.998 102.699 106.444 114.645 103.653
Bosnia and Herzegovina : : 2.343 2.137 2.019 3.503 3.618 3.791 4.003 :
Bulgaria 23.606 21.164 19.543 19.068 18.738 18.908 19.367 19.526 19.889 20.537
Croatia 27.083 24.671 21.987 20.170 19.236 18.359 17.575 17.598 17.994 18.823
Cyprus 9.888 9.599 9.266 8.640 7.603 7.197 7.399 7.330 7.886 8.452
Czechia 163.097 173.872 176.251 175.799 170.494 170.806 172.479 174.910 177.390 180.261
Denmark 33.135 31.588 31.575 31.300 30.707 31.281 31.197 31.973 32.643 33.378
Estonia 7.911 7.446 7.888 8.376 8.870 9.029 9.500 10.167 10.931 :
Finland 42.444 42.485 42.785 42.781 42.844 41.827 41.616 40.891 41.110 40.681
France 403.863 456.747 464.125 512.864 536.488 575.733 494.099 507.048 468.974 470.884
Germany 240.747 238.924 243.115 274.002 267.849 338.535 332.411 358.919 338.475 338.080
Greece 112.952 : 92.699 86.873 84.622 86.992 74.337 77.229 61.833 62.736
Hungary 69.611 67.354 65.322 60.284 55.471 56.765 60.724 63.871 69.658 77.412
Iceland : : : : : : 4.614 5.023 5.328 5.332
Ireland 57.472 52.607 50.256 49.530 48.502 47.349 50.546 51.568 57.255 57.255
Italy 623.355 607.771 590.555 572.412 549.846 529.103 511.405 508.696 502.775 :
Latvia 7.137 6.874 6.579 8.000 8.767 9.424 11.057 11.752 11.590 11.606
Liechtenstein : : : : : : : : : :
Lithuania 12.112 12.201 16.995 20.242 22.736 27.543 29.067 31.151 31.708 32.319
Luxembourg 3.106 3.220 3.300 3.365 3.512 3.542 3.634 3.760 3.930 3.821
Malta 3.592 4.034 3.924 3.835 3.623 3.758 3.646 3.949 3.906 4.255
Netherlands 112.193 127.684 128.189 134.589 152.519 154.748 160.728 167.022 173.775 187.652
North Macedonia : : 3.774 3.909 3.982 3.959 4.133 4.408 4.483 4.928
Norway 49.135 49.283 50.566 52.763 54.064 55.150 56.654 57.377 57.964 58.429
Poland 226.387 233.019 239.232 233.731 223.794 230.497 244.361 264.440 281.953 326.052
Portugal 116.686 105.463 97.980 87.592 81.335 77.844 77.906 78.866 81.629 83.248
Romania 60.135 49.348 43.503 44.607 45.382 47.813 48.341 49.717 52.792 55.978
Serbia : : : : : : : 7.622 7.281 7.562
Slovakia 5.474 91.432 90.886 86.412 81.902 85.907 85.016 87.665 95.114 98.411
Slovenia 19.499 19.190 18.940 18.392 18.066 18.133 18.289 18.706 18.668 19.220
Spain 377.029 371.025 342.257 320.872 320.086 346.822 377.795 367.601 376.235 382.547
Sweden 81.258 87.119 91.540 93.598 94.368 96.694 98.925 101.868 104.097 99.307
Switzerland 20.290 20.033 19.905 20.078 21.065 21.661 21.576 21.364 21.425 21.340
Turkey 106.878 : : : : : : : : :
United Kingdom 275.968 265.336 265.339 257.192 262.586 270.770 290.976 314.823 330.545 341.592
GEO/TIME 2009 2010 2011 2012 2013 2014 2015 2016 2017 2018
European Union - 27 countries (from 2020) : : 1.342.149 1.299.579 1.251.449 1.298.892 1.322.160 1.350.000 1.449.657 1.565.939
European Union - 28 countries (2013-2020) : : 1.555.108 1.528.574 1.486.501 1.571.084 1.648.588 1.640.000 1.738.037 1.881.688
European Union - 27 countries (2007-2013) 1.580.264 1.566.513 : : : : : : : :
Austria 39.374 38.790 40.267 42.190 42.335 43.374 44.959 46.388 48.498 52.014
Belgium 49.160 53.419 58.122 56.614 56.018 59.023 63.745 69.259 71.018 88.124
Bosnia and Herzegovina : : 1.300 1.389 1.317 1.693 1.478 1.592 1.643 :
Bulgaria 9.866 6.775 6.554 6.596 6.493 7.641 9.128 5.916 6.878 8.050
Croatia 9.528 6.945 6.062 5.384 5.160 5.128 5.615 5.641 5.929 6.479
Cyprus 3.961 3.802 3.255 2.638 1.894 1.716 1.757 2.147 2.839 3.341
Czechia 30.490 31.877 30.667 27.482 25.336 24.981 27.184 25.788 28.684 32.594
Denmark 25.645 22.982 25.358 26.458 25.804 27.502 30.067 32.357 35.267 37.616
Estonia 1.924 1.677 2.241 2.707 2.805 2.766 2.684 2.923 3.413 :
Finland 23.875 24.372 27.258 29.047 28.721 29.315 30.593 33.587 37.763 38.195
France 247.284 254.942 272.497 284.008 282.296 290.927 276.935 281.544 293.685 297.556
Germany 167.641 173.472 197.709 213.720 217.858 242.724 244.677 255.588 273.989 295.404
Greece 15.656 : 11.398 10.858 10.238 9.423 9.731 8.793 9.393 9.504
Hungary 7.903 7.371 6.982 6.477 7.313 8.357 8.930 7.932 10.537 13.893
Iceland : : : : : : 1.101 1.634 2.145 2.103
Ireland 19.956 14.049 13.532 7.904 9.758 14.103 15.604 19.965 25.588 30.203
Italy 206.943 227.625 210.383 202.693 181.368 168.117 165.208 162.870 165.334 166.919
Latvia 3.289 2.712 3.170 3.871 4.259 4.155 4.019 3.047 3.882 4.745
Liechtenstein : : : : : : : : : :
Lithuania 2.712 2.740 3.436 3.570 3.998 4.840 4.833 4.563 5.218 6.176
Luxembourg 3.915 3.913 4.123 4.352 4.349 4.808 5.118 5.547 5.853 6.047
Malta 767 750 757 802 816 961 1.113 : 1.214 1.367
Netherlands 91.735 84.743 88.944 81.883 77.554 77.125 80.310 86.482 96.054 106.057
North Macedonia : : 959 962 1.088 1.019 1.213 1.398 1.317 1.242
Norway 35.016 38.784 45.758 54.640 55.014 54.114 53.776 55.969 59.517 62.060
Poland 46.629 50.415 57.351 49.363 49.061 59.975 60.106 57.494 64.090 71.104
Portugal 32.790 32.111 27.611 20.839 18.295 16.899 17.256 16.440 18.262 20.179
Romania 18.721 18.067 19.087 18.134 17.983 16.727 18.413 17.190 17.685 21.132
Serbia : : : : : : : 4.181 4.928 6.006
Slovakia 6.345 8.483 8.372 7.227 6.233 7.396 9.578 8.877 9.967 10.965
Slovenia 6.640 5.670 4.856 4.486 4.194 4.536 4.321 4.063 4.625 5.579
Spain 271.777 198.417 156.058 119.303 99.206 103.533 111.564 115.839 124.556 149.865
Sweden 40.713 48.257 56.099 60.976 62.106 62.839 68.711 72.326 79.437 79.417
Switzerland 43.137 46.326 55.000 57.843 59.343 60.629 68.078 66.214 66.096 67.826
Turkey 44.091 : : : : : : : : :
United Kingdom 208.131 208.807 212.959 228.995 235.052 272.193 326.428 288.860 288.381 315.749

14
Value added at factor cost - million euro
Source 3: Source: EUROSTAT (2020)
GDP in construction, output approach, per cent share of GVA
GEO/TIME 2009 2010 2011 2012 2013 2014 2015 2016 2017
European Union - 27 countries (from 2020) : : 419.552 404.937 395.663 405.715 409.728 430.000 461.633
European Union - 28 countries (2013-2020) : : 499.759 492.429 487.013 510.323 534.432 540.000 570.937
European Union - 27 countries (2007-2013) 508.332 496.073 : : : : : : :
Austria 14.176 13.907 14.285 14.992 15.083 15.663 15.898 16.779 17.602
Belgium 14.237 14.854 15.992 15.687 15.712 16.518 16.427 16.723 18.249
Bosnia and Herzegovina : : 403 500 402 491 486 544 530
Bulgaria 2.226 1.339 1.327 1.243 1.175 1.367 1.692 1.385 1.591
Croatia 2.840 2.205 1.707 1.415 1.547 1.593 1.711 1.706 1.871
Cyprus 1.738 1.484 1.219 936 592 494 498 617 795
Czechia 6.724 6.659 6.493 6.025 5.529 5.463 6.242 5.971 6.633
Denmark 9.113 8.134 8.583 8.864 9.087 9.605 10.314 11.178 11.605
Estonia 604 505 711 916 916 878 877 1.027 1.141
Finland 8.337 8.121 8.710 9.437 9.257 9.326 9.591 10.587 11.539
France 82.860 85.539 87.650 86.460 86.689 88.666 82.456 83.354 91.548
Germany 61.516 67.434 75.258 79.087 81.035 90.490 94.089 101.464 109.329
Greece 4.085 5.370 3.893 4.542 4.337 2.380 2.698 2.033 2.452
Hungary 2.572 2.386 2.367 2.195 2.407 2.757 3.035 2.549 3.548
Iceland : : : : : : 583 875 1.189
Ireland 4.068 1.804 1.845 3.232 4.184 5.599 5.797 6.922 9.227
Italy 59.281 60.489 58.410 53.409 48.764 46.551 47.419 48.009 48.891
Latvia 611 502 575 757 832 867 851 740 903
Liechtenstein : : : : : : : : :
Lithuania 736 665 823 952 1.089 1.327 1.352 1.404 1.521
Luxembourg 1.857 1.886 1.963 2.108 2.067 2.315 2.421 2.624 2.789
Malta 214 265 255 261 270 284 323 : 437
Netherlands 27.914 27.018 27.267 25.217 24.041 24.533 25.188 26.907 28.193
North Macedonia : : 284 323 366 322 386 454 449
Norway 12.185 13.331 15.122 17.725 18.011 17.723 17.502 17.677 18.837
Poland 15.350 13.468 16.981 13.325 15.545 14.114 12.812 13.349 14.934
Portugal 9.345 8.531 7.242 5.799 5.322 5.189 5.260 5.234 5.807
Romania 5.158 4.696 4.607 4.156 5.842 4.715 3.726 4.212 4.511
Serbia : : : : : : : 956 1.064
Slovakia 1.299 2.477 2.317 2.467 1.526 1.660 2.044 1.930 2.317
Slovenia 1.735 1.379 1.309 1.241 1.152 1.320 1.278 1.252 1.432
Spain 78.408 62.992 49.404 40.579 31.793 31.708 34.371 36.951 38.709
Sweden 13.686 16.155 18.362 19.635 19.874 20.333 21.358 22.486 24.061
Switzerland 19.646 21.593 25.420 26.144 25.109 26.510 29.459 29.454 28.676
Turkey 8.753 : : : : : : : :
United Kingdom 78.267 78.850 80.207 87.493 91.351 104.608 124.705 111.851 109.304

15
Source 4: Source: UNECE (2020)
Volume index of production % change on previous period
Source 5: Source: EUROSTAT (2020) * Seasonally and calendar adjusted data
GEO/TIME 2009 2010 2011 2012 2013 2014 2015 2016 2017 2018 2019
Albania 17,3 14,9 14,6 13,1 11,8 9,9 10,1 10,1 10,4 10,3 9,7
Austria 6,8 6,5 6,3 6,4 6,4 6,4 6,2 6,3 6,5 6,7 6,9
Belgium 5,6 5,4 5,6 5,4 5,3 5,3 5,2 5,2 5,2 5,4 5,4
Bosnia and Herzegovina 6,1 5,1 4,8 4,6 4,5 4,7 4,6 4,6 4,7 4,7 ..
Bulgaria 9,6 7,2 6,3 5,9 4,9 4,4 4,4 4,0 4,2 4,2 4,6
Croatia 8,0 6,2 5,7 5,0 5,0 5,0 5,0 5,0 5,1 5,2 5,4
Cyprus 9,6 8,4 7,0 6,0 4,8 4,2 4,0 4,6 5,3 6,3 7,0
Czechia 6,7 6,9 6,2 5,9 5,7 5,5 5,6 5,5 5,3 5,6 5,9
Denmark 5,1 4,4 4,6 4,6 4,5 4,6 5,0 5,5 5,5 6,3 6,2
Estonia 7,1 5,8 6,9 7,4 7,0 6,2 6,1 6,6 6,8 7,4 6,9
Finland 6,8 6,6 6,6 6,8 6,7 6,5 6,6 7,1 7,2 7,3 7,6
France 6,2 6,0 6,0 5,8 5,9 5,7 5,5 5,4 5,5 5,6 5,8
Germany 4,1 4,3 4,4 4,5 4,4 4,5 4,5 4,7 4,7 5,0 5,5
Greece 5,0 4,5 3,5 3,4 2,9 2,4 2,1 2,5 2,3 2,5 2,7
Hungary 4,9 4,2 4,1 3,9 4,0 4,2 4,3 3,6 4,4 5,4 6,5
Iceland 4,7 4,5 4,3 4,5 4,8 5,5 5,6 6,9 7,4 7,8 7,3
Ireland 2,7 1,5 1,0 1,7 2,2 2,5 2,1 2,3 2,7 2,9 3,0
Italy 6,0 5,7 5,6 5,3 4,9 4,5 4,4 4,3 4,3 4,3 4,3
Latvia 7,9 4,9 6,1 6,5 6,6 6,8 6,5 5,4 5,8 6,6 6,8
Liechtenstein .. .. .. .. .. .. .. .. .. .. ..
Lithuania 6,6 5,8 6,5 6,1 6,7 7,4 7,3 6,7 6,7 7,0 7,3
Luxembourg 5,8 5,3 5,5 5,2 5,1 5,7 5,5 5,7 5,7 6,1 6,0
Malta 4,6 4,7 4,7 4,4 4,4 4,0 3,8 3,6 3,6 3,6 3,8
Montenegro 6,6 6,0 5,9 5,6 4,5 4,2 4,5 6,7 6,9 7,0 ..
Netherlands 6,0 5,3 5,1 4,6 4,3 4,3 4,3 4,4 4,5 4,8 5,1
North Macedonia 6,5 6,5 6,1 6,6 8,2 8,0 8,1 8,0 7,5 6,2 ..
Norway 5,6 5,3 5,4 5,7 5,8 6,0 6,3 6,6 6,6 6,5 6,7
Poland 8,5 8,5 8,7 8,0 7,4 7,8 8,0 7,0 7,0 7,6 7,7
Portugal 6,3 5,8 5,5 4,9 4,5 4,2 4,1 4,0 4,1 4,3 4,5
Romania 11,8 8,9 7,2 8,4 7,9 7,1 6,7 6,7 5,7 6,1 7,1
Serbia 4,3 4,1 4,5 4,5 3,6 3,8 4,5 4,7 5,0 5,4 6,8
Slovakia 9,5 8,7 8,8 8,9 7,5 7,9 7,9 7,6 8,2 7,9 7,7
Slovenia 7,8 6,4 5,9 5,8 5,3 5,7 5,4 5,2 5,4 5,7 5,8
Spain 10,7 8,8 7,5 6,6 5,8 5,6 5,8 5,9 6,0 6,2 6,5
Sweden 5,9 5,7 5,9 6,1 6,0 6,1 6,3 6,4 6,8 6,8 6,8
Switzerland 5,3 5,4 5,6 5,6 5,7 5,3 5,5 5,5 5,4 5,3 5,3
Turkey 6,3 6,9 8,2 8,5 9,2 9,2 9,3 9,7 .. .. ..
United Kingdom 5,7 5,6 5,7 5,8 5,9 6,0 6,3 6,2 6,2 6,2 6,2
GEO/TIME 2015M01 2015M06 2016M01 2016M06 2017M01 2017M06 2018M01 2018M06 2019M01 2019M06 2020M01
European Union - 27 countries (from 2020) 0,6 -0,8 2,2 -0,1 -3,1 -0,1 -0,6 0,7 -2,4 0,2 3,3
European Union - 28 countries (2013-2020) 0,8 -0,8 1,6 -0,2 -1,8 -0,2 -1,2 0,6 -1,3 -0,2 2,5
Euro area - 19 countries (from 2015) 0,5 -0,7 3,1 -0,1 -3,4 -0,4 -0,9 0,4 -3,2 0,5 3,8
Austria 6,3 2,2 3,7 -0,9 -1,8 -1,3 -0,4 0,3 -2,9 1,0 4,0
Belgium 0,7 -1,1 5,1 1,1 -4,8 -0,5 1,8 -0,1 -3,0 -0,6 1,6
Bulgaria 3,5 1,4 -19,7 2,2 -14,5 0,6 4,5 0,2 0,9 -0,5 0,3
Croatia -1,2 0,5 1,1 -1,0 -11,1 1,5 -6,7 0,0 3,9 -0,4 2,6
Czechia 9,7 0,6 0,7 -1,9 -7,3 1,0 -0,6 -0,9 2,3 1,0 2,5
Denmark 2,5 1,2 1,6 2,1 -1,2 0,0 -0,6 4,1 -0,8 -3,9 1,7
Finland -0,6 0,3 0,0 0,5 4,1 -1,3 1,3 1,5 -4,7 -0,6 2,3
France 1,8 -1,1 6,4 -0,5 0,1 -2,5 -5,6 3,9 -4,8 1,1 2,2
Germany -0,6 -1,9 2,3 0,7 -5,6 -0,2 -1,6 -2,1 -3,2 1,0 5,8
Hungary 4,2 -2,9 -25,8 8,1 0,7 -0,6 3,7 7,7 6,2 0,5 1,7
Italy -0,4 -0,9 -0,7 1,4 -6,3 -2,2 -0,8 1,6 -1,2 0,3 7,8
Luxembourg 0,3 -2,7 7,1 0,1 -15,9 -1,6 9,9 -2,1 -6,5 6,3 3,9
Netherlands -1,2 3,1 1,9 -1,4 0,1 2,3 0,6 1,0 -0,8 -1,0 1,8
North Macedonia -2,8 2,7 3,1 -5,7 -7,3 -33,3 -14,9 -11,3 -5,1 46,5 2,9
Poland -0,4 -3,4 -5,1 -4,5 -2,8 2,4 6,7 3,2 -3,5 0,0 8,9
Portugal -0,5 -0,3 0,5 -1,5 3,1 0,6 1,7 0,3 1,1 -0,6 -0,9
Romania -6,8 2,2 -18,4 -2,9 9,7 2,7 5,1 -4,1 8,4 -3,4 22,4
Slovakia 6,3 0,4 -7,3 0,0 3,2 2,9 6,2 4,5 -6,0 -1,4 4,3
Slovenia -1,2 -1,8 -7,2 -0,2 -24,4 16,1 9,8 -2,0 6,8 -6,9 10,2
Spain 0,8 -0,1 4,6 -1,8 -6,5 4,0 7,2 -2,3 -3,4 0,4 -0,2
Sweden 0,5 -2,4 2,1 0,5 2,0 2,6 -2,4 1,2 1,1 -1,6 -9,6
United Kingdom 1,5 -0,8 -0,3 -0,5 1,9 -0,1 -2,6 0,9 2,6 -1,4 0,2

16
Mining & Quarrying (B081 - Quarrying of stone, sand and clay) Enterprises – number
Production value - million euro
GEO/TIME 2010 2011 2012 2013 2014 2015 2016 2017 2018
European Union - 27 countries (2007-2013) 15.895 : : : : : : : :
European Union - 27 countries (from 2020) : 14.861 : 13.586 14.000 13.848 : : 13.000
European Union - 28 countries (2013-2020) : 15.351 : 14.020 14.000 14.264 : 13.000 :
Austria 323 320 322 315 309 311 313 308 270
Belgium 234 : 166 169 171 177 168 195 126
Bosnia and Herzegovina : 165 140 141 138 140 145 142 :
Bulgaria 261 254 259 266 246 259 245 231 226
Croatia 276 255 243 224 212 205 199 196 204
Cyprus : : : : : : : : :
Czechia 245 257 270 271 290 280 298 301 303
Denmark 139 144 136 129 120 127 127 127 123
Estonia 84 68 69 83 88 86 88 88 :
Finland 345 344 343 334 340 331 325 378 351
France 1.520 1.454 1.403 1.462 1.393 1.285 1.189 854 787
Germany 1.581 1.476 1.593 1.450 1.642 1.541 1.468 1.379 1.383
Greece 444 : : 353 660 569 585 516 530
Hungary 348 343 319 328 318 311 292 270 246
Iceland : : : : : 24 24 28 25
Ireland 263 261 : : : 247 : : :
Italy 2.243 2.225 2.119 2.025 2.032 1.968 1.926 1.736 :
Latvia 140 137 162 168 157 159 156 163 167
Liechtenstein : : : : : : : : :
Lithuania 51 56 61 68 86 86 97 99 99
Luxembourg 10 10 10 10 10 10 10 10 10
Malta 46 : : : : : : : 48
Netherlands 117 120 114 128 123 126 124 115 112
North Macedonia : 89 86 96 88 104 117 : 141
Norway 575 610 610 623 629 646 646 636 630
Poland 1.365 1.519 1.433 1.177 1.330 1.443 1.435 1.465 1.877
Portugal 1.212 1.143 1.057 1.026 945 912 879 886 900
Romania 940 882 852 828 846 836 810 777 777
Slovakia 63 95 81 106 114 103 123 111 142
Slovenia 92 90 88 86 84 80 76 78 72
Spain 2.288 2.165 2.074 1.729 1.720 1.839 1.679 1.751 1.698
Sweden 497 500 495 479 470 461 446 459 378
Switzerland 186 182 180 202 197 197 195 188 194
Total : : : : : : : : :
Turkey : : : 2.366 2.188 : : : :
United Kingdom 513 490 458 434 423 416 402 395 380
GEO/TIME 2010 2011 2012 2013 2014 2015 2016 2017 2018
European Union - 27 countries (2007-2013) 26.842 : : : : : : : :
European Union - 27 countries (from 2020) : 25.200 23.231 22.106 22.479 22.146 : 21.075 20.893
European Union - 28 countries (2013-2020) : 28.697 27.549 28.316 28.769 29.405 : 27.374 27.544
Austria 801 792 817 858 865 839 849 883 865
Belgium 825 : 779 716 796 609 678 709 447
Bosnia and Herzegovina : 65 66 67 66 61 66 68 :
Bulgaria 114 121 118 118 129 228 202 204 219
Croatia 164 187 137 145 160 138 138 166 196
Cyprus : : : : : : : : :
Czechia 582 596 556 529 527 584 572 611 678
Denmark 165 249 265 237 222 286 264 317 332
Estonia 45 60 : : 63 65 : : :
Finland 419 483 424 376 339 308 317 345 378
France 5.543 5.886 5.750 5.894 5.161 4.591 4.581 3.163 3.184
Germany 4.210 4.875 4.861 4.621 5.410 5.576 5.407 5.699 5.077
Greece 618 : : 341 410 384 280 390 401
Hungary 168 144 132 154 206 191 162 193 248
Iceland : : : : : 20 26 36 34
Ireland 295 270 : : : 304 : : :
Italy 2.733 3.065 2.368 2.196 2.356 2.346 2.223 2.162 2.131
Latvia 34 56 64 66 : 65 51 67 78
Liechtenstein : : : : : : : : :
Lithuania 50 71 67 93 99 84 91 115 122
Luxembourg 69 74 75 75 71 74 75 77 84
Malta 11 : : : : : : : 17
Netherlands 482 457 431 370 418 438 516 489 502
North Macedonia : : 36 39 : : 44 61 :
Norway 834 960 1.098 1.075 1.052 1.003 956 1.033 1.045
Poland 1.557 1.876 1.670 1.429 1.344 1.381 1.221 1.418 1.890
Portugal 686 647 520 482 461 472 461 521 541
Romania : : : : : : : : 423
Slovakia 117 131 108 136 127 154 168 186 211
Slovenia 127 122 117 127 145 152 142 161 173
Spain 2.580 2.294 1.865 1.556 1.558 1.641 1.514 1.518 1.451
Sweden 776 872 945 859 861 712 718 755 723
Switzerland 1.286 : 1.646 : : : : : :
Total : : : : : : : : :
Turkey : : : 2.387 2.577 : : : :
United Kingdom 3.309 3.497 4.318 6.210 6.290 7.258 6.085 6.299 6.652

17
Value added at factor cost - million euro
Employees – number
GEO/TIME 2010 2011 2012 2013 2014 2015 2016 2017 2018
European Union - 27 countries (2007-2013) 9.231 : : : : : : : :
European Union - 27 countries (from 2020) : 8.938 7.878 7.593 7.772 7.847 7.634 7.633 :
European Union - 28 countries (2013-2020) : 9.872 9.034 9.425 9.752 10.178 9.718 9.531 :
Austria 326 321 319 354 365 350 358 378 :
Belgium 266 : 256 242 269 211 242 263 :
Bosnia and Herzegovina : 25 24 27 25 28 31 29 :
Bulgaria 42 40 42 40 49 85 81 77 :
Croatia 57 63 53 47 71 56 56 63 :
Cyprus : : : : : : : : :
Czechia 203 194 176 169 179 203 202 218 :
Denmark 67 85 85 74 79 103 106 107 :
Estonia 15 20 : : 23 27 : : :
Finland 121 131 120 111 103 93 101 104 :
France 1.876 1.901 1.766 1.786 1.442 1.341 1.332 912 :
Germany 1.695 1.889 1.926 1.797 2.160 2.146 2.057 2.149 :
Greece 272 : : 170 191 207 146 219 :
Hungary 69 61 55 68 86 88 75 95 :
Iceland : : : : : 10 11 17 :
Ireland 87 89 : : : 100 : : :
Italy 981 1.044 740 724 768 833 838 811 :
Latvia 13 22 22 23 : 20 16 23 :
Liechtenstein : : : : : : : : :
Lithuania 20 29 28 39 37 37 43 53 :
Luxembourg 33 36 32 32 30 27 31 33 :
Malta 3 : : : : : : : :
Netherlands 189 157 114 110 126 145 142 163 :
North Macedonia : : 19 22 : : 22 32 :
Norway 264 321 367 371 381 376 352 371 :
Poland 433 756 551 438 474 526 469 555 :
Portugal 257 227 181 175 163 178 173 192 :
Romania : : : : : : : : :
Slovakia 36 48 34 35 42 49 55 60 :
Slovenia 46 42 39 40 49 50 50 56 :
Spain 979 869 697 606 570 575 545 556 :
Sweden 202 257 267 249 252 230 228 243 :
Switzerland 536 : 629 : : : : : :
Total : : : : : : : : :
Turkey : : : 616 628 : : : :
United Kingdom 869 934 1.156 1.832 1.979 2.331 2.084 1.898 :
GEO/TIME 2010 2011 2012 2013 2014 2015 2016 2017 2018
European Union - 27 countries (2007-2013) 169.400 : : : : : : : :
European Union - 27 countries (from 2020) : 150.907 141.893 134.921 130.000 : 128.871 125.379 :
European Union - 28 countries (2013-2020) : 167.261 164.815 152.297 150.000 149.211 144.712 142.851 :
Austria 4.019 3.846 3.917 3.893 3.926 3.917 4.026 4.165 :
Belgium 2.643 : 2.473 2.350 2.501 2.301 2.297 2.324 :
Bosnia and Herzegovina : 1.979 1.745 1.703 1.662 1.566 1.680 2.014 :
Bulgaria 3.938 3.851 3.832 3.770 3.414 4.599 4.490 3.994 :
Croatia 2.587 2.349 2.156 2.128 2.016 1.877 1.854 1.840 :
Cyprus : : : : : : : : :
Czechia 5.678 5.505 5.423 5.185 4.938 4.958 5.001 4.960 :
Denmark 641 860 825 772 779 805 705 708 :
Estonia 739 712 : : 686 695 : : :
Finland 1.776 1.795 1.579 1.498 1.387 1.302 1.307 1.424 :
France 23.037 22.039 21.129 20.581 18.068 16.150 15.562 11.122 :
Germany 25.748 26.381 25.352 25.042 27.448 28.308 26.597 28.244 :
Greece 4.176 : : 2.852 2.915 2.454 1.970 2.369 :
Hungary 2.919 2.603 2.356 2.407 2.593 2.518 2.400 2.479 :
Iceland : : : : : 94 116 113 :
Ireland 1.522 1.334 : : : 1.448 : : :
Italy 14.551 13.759 12.621 12.027 12.147 11.817 11.364 10.721 :
Latvia 643 724 784 895 949 1.021 894 888 :
Liechtenstein : : : : : : : : :
Lithuania 1.008 1.173 1.158 1.229 1.311 1.358 1.352 1.433 :
Luxembourg 284 285 275 266 252 248 261 272 :
Malta 145 : : : : : : : :
Netherlands 852 861 781 786 756 724 728 807 :
North Macedonia : 1.227 : 1.111 1.100 1.085 1.267 : :
Norway 2.723 2.860 2.996 2.978 2.911 3.010 3.091 3.153 :
Poland 18.241 18.136 17.214 15.605 14.906 15.130 15.164 15.199 :
Portugal 9.260 8.552 7.435 6.759 6.456 6.362 6.266 6.416 :
Romania 7.741 7.626 7.934 7.431 7.210 8.179 8.177 7.617 :
Slovakia 1.690 1.843 1.682 1.820 1.524 1.524 1.734 1.682 :
Slovenia 920 897 836 777 781 854 861 907 :
Spain 18.485 15.864 13.897 11.781 11.117 11.055 11.175 10.899 :
Sweden 2.665 2.532 2.567 2.484 2.382 1.856 1.838 1.908 :
Switzerland : : : : : : : : :
Total : : : : : : : : :
Turkey : : : 42.726 39.934 : : : :
United Kingdom 14.234 16.354 22.922 17.376 16.649 : 15.841 17.472 :

18
Scraps from the sectors Material flow for the EU.
Source 6: Source: EUROSTAT (2020)
Total waste Construction – tonnes
Source 7: Source: EUROSTAT (2020)
GEO/TIME 2004 2006 2008 2010 2012 2014 2016
European Union - 27 countries (from 2020) 667.020.000 726.740.000 763.450.000 757.070.000 729.810.000 739.970.000 787.480.000
European Union - 28 countries (2013-2020) 766.250.000 836.290.000 864.450.000 875.980.000 843.940.000 870.250.000 923.670.000
Albania : : : : : : :
Austria 27.935.266 31.321.626 31.389.803 20.927.070 33.468.558 40.265.570 44.914.816
Belgium 11.037.080 13.089.651 15.441.861 16.852.673 17.132.768 18.347.257 19.573.150
Bosnia and Herzegovina : : : : 0 : :
Bulgaria 2.998.621 1.023.303 1.828.761 78.880 1.032.651 1.340.467 2.089.131
Croatia 646.282 18.820 129.223 7.656 674.661 618.158 1.291.506
Cyprus 488.499 298.346 431.231 1.068.282 965.177 634.801 876.525
Czechia 8.130.735 8.379.849 10.650.635 9.353.673 8.592.900 9.409.944 10.141.985
Denmark 4.273.801 5.802.368 5.674.326 3.142.215 7.454.350 11.263.066 12.224.799
Estonia 488.537 717.105 1.099.100 436.289 657.089 671.347 1.173.517
Finland 20.842.637 23.145.712 24.455.231 24.645.393 16.033.874 16.296.811 13.825.168
France 210.041.309 225.310.888 252.979.840 260.699.131 246.702.428 227.607.180 224.355.946
Germany (until 1990 former territory of the FRG)191.562.719 196.536.165 197.206.500 190.990.217 197.527.868 206.466.169 220.499.432
Greece 3.324.000 6.829.161 6.828.051 2.086.080 812.519 479.999 610.638
Hungary 1.735.609 3.045.335 3.240.063 4.072.214 4.038.081 3.439.941 3.591.723
Iceland 18.500 : : 12.289 10.820 32.832 43.112
Ireland 11.286.882 16.599.466 13.547.588 1.609.762 1.132.275 1.884.390 1.521.590
Italy 49.150.771 52.315.620 69.731.942 59.340.134 52.965.743 51.670.600 54.576.762
Kosovo (under United Nations Security Council Resolution 1244/99): : : : 0 4.516 167.645
Latvia 8.243 19.339 12.040 21.551 7.509 454.281 111.133
Liechtenstein : : 247 31 106.623 516.704 441.557
Lithuania 357.380 348.968 412.045 356.772 419.136 434.737 505.758
Luxembourg 6.979.984 6.774.547 8.282.055 8.866.757 7.079.473 5.979.235 7.614.894
Malta 2.810.774 2.492.522 1.698.659 988.070 1.044.088 1.241.079 1.354.892
Montenegro : : : : 0 107.036 630.654
Netherlands 49.619.394 56.716.248 58.886.879 78.063.887 79.166.644 90.734.851 98.551.957
North Macedonia : : : 0 7 9.491 87
Norway 1.101.407 1.252.051 1.498.376 1.542.803 1.880.543 2.572.427 3.056.136
Poland 1.677.539 14.141.031 6.929.512 20.818.234 15.367.995 17.010.251 18.890.577
Portugal 2.625.939 3.607.449 1.364.419 1.287.140 1.087.141 1.185.489 1.710.703
Romania 91.397 33.740 318.097 734.946 1.325.341 1.048.011 320.811
Serbia : : : 0 363.706 274.769 547.473
Slovakia 1.403.965 916.228 1.301.760 1.786.430 806.184 1.386.685 967.275
Slovenia 907.963 994.886 1.376.225 1.509.476 535.154 815.010 543.690
Spain 46.319.660 47.323.392 44.926.463 37.946.523 26.129.151 20.418.071 35.827.923
Sweden 10.271.183 8.943.363 3.310.326 9.381.226 7.655.935 8.866.720 9.810.987
Switzerland : : : : : : :
Turkey : : 0 : : : :
United Kingdom 99.234.124 109.545.987 100.999.493 118.910.602 114.120.793 130.284.145 136.196.492

19
Treatment of Mineral waste from construction and demolition, hazardousness and waste management operations – tonnes
*The amount of C&DW generated is calculated as the sum of waste categories W061 ferrous metal wastes, W062 non-ferrous metal wastes, W063 mixed ferrous and non-ferrous metal-wastes, W071 glass wastes, W074 plastic wastes, W075 wood wastes, and total of waste category W121 mineral waste from construction and demolition.
Source: EUROSTAT (2020)
Import – export C&D Hazardous Wastes Import C&D Hazardous Wastes - tonnes
Source 8: Source: EUROSTAT (2020) * This table includes raw data as reported directly to The Basel Convention on the Control of Transboundary Movements of Hazardous Wastes and their Disposal.
Export C&D Hazardous Wastes – tonnes
Source 9: Source: EUROSTAT (2020) * This table includes raw data as reported directly to The Basel Convention on the Control of Transboundary Movements of Hazardous Wastes and their Disposal.
GEO/TIME 2010 2012 2014 2016
European Union - 27 countries (from 2020) 387.100.000 389.420.000 368.240.000 386.150.000
European Union - 28 countries (2013-2020) 461.850.000 459.510.000 444.300.000 467.160.000
Albania : : 0 :
Austria 9.048.253 10.119.988 13.924.473 15.559.258
Belgium 3.801.437 5.348.034 4.904.358 5.354.837
Bosnia and Herzegovina : : : :
Bulgaria 1.375.189 1.630.337 2.174.205 2.048.311
Croatia 340.193 612.746 795.946 674.338
Cyprus 330.553 159.543 123.859 197.338
Czechia 5.316.105 6.193.268 6.141.543 7.730.658
Denmark 3.627.729 3.575.918 4.032.136 4.460.828
Estonia 1.351.489 1.286.420 1.161.507 948.549
Finland 36.334.239 17.011.929 5.180.025 5.625.586
France 84.477.076 81.138.535 80.041.437 83.679.541
Germany 99.300.970 102.589.195 104.772.325 111.916.338
Greece 4.323.698 2.419.594 689.646 1.800.590
Hungary 3.521.110 2.842.826 3.396.764 3.837.036
Iceland 71.551 65.926 421.751 574.155
Ireland 827.278 556.587 999.345 969.379
Italy 51.918.786 52.345.528 53.416.972 57.125.970
Kosovo : : : 0
Latvia 211.237 395.449 343.715 233.012
Liechtenstein : : : :
Lithuania 699.834 706.768 881.963 1.046.445
Luxembourg 3.740.933 3.253.577 2.957.673 3.168.668
Malta 756.746 508.558 1.068.406 1.172.248
Montenegro : : 4.131 3.331
Netherlands 24.414.123 24.488.630 23.587.291 24.193.633
North Macedonia 311.869 60.926 16.687 :
Norway 1.385.876 3.319.438 4.066.467 4.593.101
Poland 15.495.589 16.814.312 19.902.270 15.063.461
Portugal 1.711.840 1.809.012 2.255.812 2.539.382
Romania 5.198.579 5.666.727 5.601.883 6.171.941
Serbia 47.640 415.340 614.553 728.003
Slovakia 1.352.761 1.440.122 1.181.299 1.765.956
Slovenia 1.890.004 1.418.981 1.490.875 1.432.238
Spain 21.382.390 41.071.138 22.560.184 21.022.138
Sweden 4.345.864 4.012.741 4.650.103 6.399.941
Turkey 1.687.996 : 14.654.343 25.092.143
United Kingdom 74.762.248 70.104.133 76.070.727 81.017.934
Austria Denmark Finland Ireland Italy Luxembourg Netherlands Norway Switzerland
Estonia 30.475
Germany 942 7.939 212 27.539 37.279 57 65.016
Sweden 3.672
United Kingdom 11.922
Austria Belgium Denmark Estonia France Germany Netherlands Poland United Kingdom
Finland 30.262
Germany 3.249 149.521 62.796 18.032
Republic of Ireland 12 3 2.694
Sweden 4.312 5
United Kingdom 1.960