european civic citizenship and inclusion index
DESCRIPTION
The first edition of the Index, also known as MIPEX I (Migrant Integration Policy Index)TRANSCRIPT

The need for immigrant inclusion in Europe isunavoidable. 13 million EU residents in the fifteen old Member States (3.4% of the population) are non-naturalized immigrants. Globalization, labour marketand demographic pressures make inward migration a fact of life for the EU Member States. If Europe is to meet its Lisbon targets on employment and jobs,maintain cohesive healthy societies and live up to its founding values of equality and openness then it must take a close look at its policies governinginclusion and civic citizenship.
The European Civic Citizenship and Inclusion Indexhas been conceived to fill a knowledge gap on civiccitizenship policies and inclusion at a European level.It is important for Member States to think aboutissues of immigrant inclusion in a Europeanperspective, in order to keep up with the reality of EU-level policymaking and the rapidly emerging EUCommon Space of Justice, Freedom and Security.This is the first attempt to present the EU’s policiesgoverning civic citizenship and inclusion in a conciseand comparable format.
The European Civic Citizenship and Inclusion Indexwas conceived and managed by British CouncilBrussels, Foreign Policy Centre and MigrationPolicy Group. The research was designed and co-ordinated by Professor Andrew Geddes(University of Sheffield) and Jan Niessen (MigrationPolicy Group), and carried out by the Europe in theWorld Centre (University of Liverpool), andMigration Policy Group. The project has beenfinanced by the Barrow-Cadbury Charitable Trust,Joseph Rowntree Charitable Trust and the British Council.
Europ
ean Civic C
itizenship and
Inclusion Ind
ex 20
04
Research designed and co-ordinated by Professor Andrew Geddes and Jan Niessen, with Alex Balch, Claire Bullen and María José Peiro
Compiled by Laura Citron and Richard Gowanwww.britishcouncil.org/brussels-europe-inclusion-index.htm
European CivicCitizenship and Inclusion Index
35950.NJ.COVERS 18/3/05 1:37 PM Page 1

European Civic Citizenship and Inclusion Index
Research designed and co-ordinated by ProfessorAndrew Geddes and Jan Niessen, with Alex Balch, Claire Bullen and María José Peiro
Compiled by Laura Citron and Richard Gowan
35950 I-50 V2 18/3/05 1:41 PM Page 1

First published in 2005 byBritish Council BrusselsLeopold Plaza108 rue du TroneB-1050 BrusselsBelgium
Email [email protected]
© British Council BrusselsForeign Policy Centre and Migration Policy Group 2005
All rights reserved
35950 I-50 V2 18/3/05 1:41 PM Page 2

iii
The Index Team
Kate Arthurs British Council
Alex Balch Research Fellow, Europe in the WorldCentre, University of Liverpool
Claire BullenFormer Research Fellow, Europe in the World Centre,University of Liverpool
Laura CitronProject Manager, Europe Programme,British Council Brussels
Professor Andrew GeddesUniversity of Sheffield
Richard GowanEurope Researcher,Foreign Policy Centre
Sharon MemisHead Europe Programme,British Council Brussels
Jan NiessenDirector, Migration Policy Group
Edward PearceUniversity of Liverpool
María José PeiroResearch Assistant, Migration Policy Group
Yongmi SchiebelProgramme Officer, Migration Policy Group
Julia SmithPress and Communications Officer,British Council Brussels
35950 I-50 V2 18/3/05 1:41 PM Page iii
iv
Emma Bonino MEP
Yasmin Alibhai-Brown The Independent
Jo Leinen MEP Chair, Constitution Committee
Claude Moraes MEP
Cem Özdemir MEP
John Monks Chair, European Trade UnionsConfederation
Mary Robinson Former UN High Commissioner for Human Rights, former President ofIreland
Lord Simon of Highbury Director, Unilever and Suez Group;former Chair BP
Phillip Whitehead MEPChair, Internal Market& Consumer Protection Committee
35950 I-50 V2 18/3/05 1:41 PM Page iv

v
Foreword
Citizenship and inclusion have become key issues in Europeanpolitical debate. There is an ever greater need for objectiveinformation by which to compare our countries’ policies and situations.
Over the last five years, the EU’s members have moved towardscreating common policies on justice and home affairs. The EuropeanCommission has established a significant role in promoting newlegislation, from anti-discrimination to civic citizenship. It isimportant that governmental and non-governmental actors,governments and civil society remain fully engaged with theseEuropean developments, for which the European Civic Citizenshipand Inclusion Index is a major instrument and is welcomed bypoliticians, civil servants and NGOs across Europe.
The Index shows that member-states still have very differentapproaches to migration and civic citizenship questions, withconsiderable variation in the areas of economic migration andfamily migration and social inclusion. This is in spite of a series of commitments by all member-states to move towards commonstandards in these areas. We must address these variations if we are to achieve not only more equal societies, but also a fully-functioning European Union. The Index allows us to identify best practices among the member-states, and we must all followthese examples.
The Index will be published annually, allowing us to monitordevelopments in Europe’s attitudes to rights, citizenship andeconomic fairness. In supporting this first edition of the Index, wejoin in calling for strong and consistent efforts by both the EuropeanCommission and the member-states to promote the developmentand implementation of high legal standards and inclusion policies in this area.
35950 I-50 V2 18/3/05 1:41 PM Page v

vi
The Index team would like to thank all those who have contributedto the development of the Index over the past 18 months. Inparticular, thanks is due to Rainer Bauböck, Bernhard Perchinig,Carmen Claudín, Sir Bernard Crick,Vera Egenberger, Gilles Keppel,Marco Martiniello, Claude Moraes, Joaquim Nunes de Almeida,John Monks, Cem Ozdemir, Trevor Phillips, Francesco Rutelli,Catherine de Wenden, Giovanna Zincone, Kate Nosowska,Han Entzinger and Sandra Schmidt for their contributions to theinitial seminars on citizenship, political participation and labourmarket inclusion. Shamit Saggar, Michelynn Lafleche, Martin Ruhs,Jérôme Vignon, Jana Kotalik, Kay Hailbronner, Elspeth Guild,Helene Urth and Isabelle Maquet Engstead shared valuable insightsand constructive criticism at the Index consultations in Brussels.
We are also very grateful to Kate Arthurs, Mark Leonard,Phoebe Griffiths and Rob Blackhurst for their initial vision and hard work in the early days. The support of Frédéric Charillon at Sciences Po was extremely valuable in the initial phases of the project.
The research teams would like to thank Sandra Schmidt andIketina Danso of the Commission for Racial Equality, Caterina Cartaand The Raxen network for help in providing data.
The team would also like to thank Sukhvinder Stubbs of theBarrow Cadbury Charitable Trust and Stephen Pittam of the JosephRowntree Charitable Trust for their support, without which theproject would not have been possible.
Special thanks go to Edward Pearce for the stunning charts; andto Gerben van Lent for his help with the statistics.
Special thanks also to Alex Balch and María José Peiro for their outstanding research assistance; and to Laura Citron, RichardGowan, Kalvin Bahia for their huge contribution to the final text.
Acknowledgements
DisclaimerThe views in thispaper are notnecessarily those of the British Council or ForeignPolicy Centre.
35950 I-50 V2 18/3/05 1:41 PM Page vi

vii
The British Council is an independent, non-political organisationincorporated by Royal Charter. With offices in 110 countriesworldwide, it works to build mutually beneficial relationshipsbetween people in the UK and other countries and increaseappreciation of the UK’s creative ideas and achievements. Itsextensive European network of offices means that it is uniquelyplaced to develop creative links between the UK and the rest ofEurope. The British Council in Brussels plays a key role in thisEuropean strategy. For more information, visitwww.britishcouncil.be.
The Foreign Policy Centre is a leading European think tanklaunched under the patronage of the British Prime Minister TonyBlair to develop a vision of a fair and rule-based world order.Through its research, events and publications, it aims to develop anddisseminate innovative policy ideas which promote:� Effective multilateral solutions to global problems� Democratic and well-governed states as the foundation of orderand development � Partnerships with the private sector to deliver public goods� Support for progressive policy through effective public diplomacy� Inclusive definitions of citizenship to underpin internationalistpolicies. For more information, please visit www.fpc.org.uk.
About the Partners
35950 I-50 V2 18/3/05 1:41 PM Page vii

viii
Migration Policy Group (MPG) is an independent organisationcommitted to policy development on migration and mobility, anddiversity and anti-discrimination by facilitating the exchangebetween stakeholders from all sectors of society, with the aim ofcontributing to innovative and effective responses to the challengesposed by migration and diversity. For more information, please visitwww.migpolgroup.com
Barrow Cadbury Charitable Trust The project has been part fundedby the Barrow Cadbury Trust, a foundation that provides grants toprojects that encourage social change in the areas of inclusivecommunities and global exchange, amongst others. BarrowCadbury Trust is committed to building bridges between policymakers and grassroots communities, and to identifying best practiceto achieve change, principles that are reflected in the design of theEuropean Civic Citizenship and Inclusion Index.
Joseph Rowntree Charitable Trust The Joseph Rowntree CharitableTrust is a UK grantmaking foundation which supports initiativespromoting justice and equality within the structures of social andpolitical life. It makes grants of approximately €7 million a yearthrough programmes relating to peace and global security;democracy and corporate responsibility; and migration, asylum andintegration; and through two geographically based programmes inSouth Africa and Ireland (with a special focus on the conflict inNorthern Ireland). The Trust mainly funds work in the UK, butsupports some projects in its fields of interest relating to policy at theEU level.
35950 I-50 V2 18/3/05 1:41 PM Page viii

ix
The need for immigrant inclusion in Europe is unavoidable. 13million EU residents in the fifteen old Member States (3.4% of thepopulation) are non-naturalized immigrants. Globalization, labourmarket and demographic pressures make inward migration a fact oflife for the EU Member States. If Europe is to meet its Lisbon targetson employments and jobs; maintain cohesive, healthy societies; andlive up to its founding values of equality and openness, then it musttake a close look at its policies governing inclusion and civiccitizenship.
The European Civic Citizenship and Inclusion Index was conceivedto fill a knowledge gap on civic citizenship policies and inclusion at aEuropean level. It is important for Member States to think aboutissues of immigrant inclusion in a European perspective, in order tokeep up with the reality of EU-level policymaking, and the rapidlyemerging EU Common Space of Justice, Freedom and Security. Thisis the first attempt to present the EU’s policies governing civiccitizenship and inclusion in a concise and comparable format.
Executive Summary
Background
Rationale
35950 I-50 V2 18/3/05 1:41 PM Page ix

x
1. To present data on civic citizenship and inclusion policies in the EUin a way that allows for comparison between Member States andagainst EU averages.2. To enable monitoring of the extent to which Member States areimplementing principles of civic citizenship and inclusion agreed toby all of them.3. To identify examples of good practice amongst Member States.4. To allow for comparison over time, by updating the Indexannually.
The Member States’ policies were compared to a common normativeframework. The normative framework sets out a formulation of thebasis for immigrant inclusion, which argues that immigrantinclusion requires: 1. Labour Market Inclusion 2. Family Reunion 3.Long Term Residence 4. Naturalization and 5. Anti-Discrimination.In each of these five areas, a number of specific policy indicators weredeveloped, and each Member State scored against each policyindicator. The indicators were based on the existing commitments ofMember States to give immigrants rights and obligations comparableto EU citizens. There are almost 100 policy indicators. The data toscore the EU-15 against the policy indicators was collected frommigration experts in the EU-15.
1. There is a glaring lack of data collected by Member States in thearea of immigrant inclusion and citizenship.2. The Member States implement their common commitments indiverse ways.3. Member States tend to score consistently across the five areas.4. There are no major differences in policy between countries withlong and short migration histories.5.Although statuses for immigrants are relatively difficult to acquireand weakly protected, they have significant rights associated with them.6. Although comprehensive anti-discrimination legislation has been
Method
Key findings
Aims
35950 I-50 V2 18/3/05 1:41 PM Page x
xi
adopted, its implementation is lagging behind and discriminationbased on nationality is badly covered.7. Naturalization remains one of the most problematic areas forMember States. This reflects the ongoing debate over whethermigration should be seen as a long-term or temporary phenomenon.
The European Civic Citizenship and Inclusion Index was conceivedand managed by British Council Brussels, Foreign Policy Centreand Migration Policy Group. The research was designed and co-ordinated by Professor Andrew Geddes (University of Sheffield)and Jan Niessen (Migration Policy Group), and carried out by theEurope in the World Centre (University of Liverpool), andMigration Policy Group. The project has been financed by theBarrow-Cadbury Charitable Trust, Joseph Rowntree CharitableTrust and the British Council.
Project partners
35950 I-50 V2 18/3/05 1:41 PM Page xi

Preface Rt Hon Lord Kinnock of Bedwellty
1 Introduction
2 Index Structure
3 Methodology
4 Key Findings
5 EU-15 Results
6 Country Results and ProfilesAustriaBelgiumDenmarkFinlandFranceGermanyGreeceIrelandItalyLuxembourgNetherlandsPortugalSpainSwedenUnited Kingdom
Annex I – Indicators and Options
Contents
1
2
14
21
24
29
3843526068768492100108114122130139148156
164
35950 I-50 V2 18/3/05 1:41 PM Page xiii
1
Pre
face
The inclusion of immigrants in our European societies is vital if weare to achieve ambitious Lisbon Agenda targets on employment andcompetitiveness, and to have the benefit of socially cohesive andeconomically vibrant communities. I am therefore proud tointroduce this first European Civic Citizenship and InclusionIndex. The Index will contribute solid facts to a public debate whichhas too often been riddled with inaccuracies, fear andmisunderstanding. It is part of the British Council Brusselsprogramme of engagement with EU issues and an expression of ourdetermination to contribute intelligent objectivity and to promotefresh, reasoned thinking.
The British Council’s international reputation forprofessionalism and integrity is built upon our rigorously nonpartisan, non sectarian approach. The Index does not represent,therefore, governmental views and is not motivated by any intentionto ‘name and shame’ countries. Rather, the Index contributes to acomplex area by providing simple, accurate, accessible information.The results highlight the diversity of practice on inclusion policywithin the EU, rather than pointing out ‘winners’ or ‘losers.’We givethe facts.You make your own conclusions.
Rt Hon Lord Kinnock of BedwelltyChair, British Council
Preface
35950 I-50 V2 18/3/05 1:41 PM Page 1

2
There is a pressing need for European countries to ensure that theyare open and inclusive, not only for the development of theireconomies, but to build cohesive societies. There are already 13million immigrants resident in the EU, and inward migration will bea fact of life for European countries in the 21st century. Thepertinent question is therefore not whether or not Europe acceptsmigration, but how Europe manages the inclusion of immigrants inEuropean societies. Experience has shown that the incorporation ofprevious waves of immigrants was not straightforward. ManyEuropean countries are still faced with persistent and structuraldifficulties in terms of the economic, social and political inclusion oftheir immigrant populations. Social exclusion presents a tragic wasteof potential, while threatening the values of equality and opennessupon which the EU is founded. Meanwhile, the context for debatesabout immigrant inclusion policy is changing as the Europeaneconomic and political spaces – centred on the Single Market andCommon Space for Justice, Freedom and Security – are everintegrating and enlarging to new Members.
It is vital that Europe’s migrants are included in the labour market.In 2000, the EU’s Member States set themselves the ambitious targetsof creating “the most competitive and dynamic knowledge-basedeconomy in the world, capable of sustainable economic growth withmore and better jobs and greater social cohesion”.1The EU’sachievement of these targets is threatened if the EU’s immigrantpopulation is not included in the labour market. It is crucial that thetalent and entrepreneurship of the EU’s immigrant population is notwasted, but rather contributes to a vibrant and competitiveeconomy.
It is also important that the EU’s irregular migrant workers are
1 Introduction
1 PresidencyConclusions, 2000 LisbonEuropean Council,23–24 March
35950 I-50 V2 18/3/05 1:41 PM Page 2
3
included in the labour market. Restrictive, closed labour marketsforce the EU’s existing immigrants into the informal economy. Thismakes irregular workers more vulnerable to exploitation, and fuelsa grey economy that is difficult to regulate. A large irregular labourmarket for unskilled workers may also be a disadvantage for mostvulnerable Member State nationals, whose labour costs are higher.Furthermore, the lack of channels for legal migration forces labourmigrants into asylum channels, which are overstretched.
The Lisbon Agenda has thrown up a debate about the need toencourage labour migration into the EU, given the backdrop ofcurrent labour shortages and skills gaps. Many argue that labourmigration could be part of the solution to the problems of an agingEuropean population, sectoral skills shortages and a lack of vitality.However, labour migration can only be a credible solution toEurope’s demographic problems if the new migrants aresuccessfully included in the labour market and wider society.
Europe’s immigrants also need adequate civic citizenship rightsto be fully included in our societies. Labour market inclusion isonly a first step towards integration into Europe’s societies.Immigrants need adequate civic citizenship rights so as to engage insocial and political life, and become active citizens.
The EU currently has a legal ‘underclass’ of Third CountryNationals, who do not enjoy the same rights as EU citizens.Europe is building a ‘Common Space’ of Freedom, Justice andSecurity2 based on the values of openness and equality, from whichimmigrants are partly excluded. There is a need to address thispersistent inequality, and EU Member States have indeedcommitted to the principle of equivalent rights for migrants in theTampere declaration.3 If migrants do not enjoy the same rights asEU nationals, they are more likely to be excluded. We must combatsocial and political exclusion to create vibrant, active societies.Active, cohesive societies depend on the responsibilities of citizenstowards society. The responsibilities accepted by immigrants inEurope must be linked to the entitlements they enjoy.
2 The AmsterdamTreaty set out thefoundations for aEuropean ‘CommonSpace’ for Freedom,Justice and Security. Within the‘Common Space’,there is a singlestandard of EUcitizenship, withstandard rights and obligationsassociated with it.This was followed up at the TampereSummit, seePresidencyConclusions, 1999Tampere EuropeanCouncil, 15-16October. 3 PresidencyConclusions, 1999Tampere EuropeanCouncil, 15-16October In
tro
du
ctio
n
35950 I-50 V2 18/3/05 1:41 PM Page 3

4
Box 1 Civic Citizenship
Civic citizenship would guarantee a number of core rights to third-country nationals who are long-term residents in the EU, such thatthey are treated in a comparable way to nationals of their host state.Civic citizenship uses EU citizenship as benchmark for rights. Apartfrom basic non-discrimination principles, civic citizenship includesthe following rights:
� Right of residence � Protection against expulsion� Access to employment and self-employment� Access to family reunification � Access to education, vocational training and recognition ofqualifications.� Access to social security and social assistance� Right of association and membership including trade unions� Right of participation in political life at (at least local level).� Right to vote in European Parliament elections.� Right of movement for work and study purposes to any state inthe EU.
Civic citizenship fits with the aims of the Tampere EuropeanCouncil (October 1999), to grant long-term residents ‘rights whichare as near as possible to those enjoyed by EU citizens’.
The concept of ‘civic citizenship’ has become widely used inEuropean policy circles. For example, it has been discussed by boththe former and current European Commissioners for Justice andHome Affairs:� Former Commissioner Vitorino advocated an EU as acommunity of citizens and called for the extension of civiccitizenship to third country nationals pointing at the EU Charter ofFundamental Rights as a reference document for this.� Commissioner Frattini has said recently that ‘civic citizenship(…) is important for the integration process and can enhanceimmigrants’ feeling of belonging’ and that it can be ‘a means ofpromoting [a] common policy for integration of immigrants’.
Civic citizenship is gradually being incorporated into national law.The Directive on the status of long-term residents (November
35950 I-50 V2 18/3/05 1:41 PM Page 4

5
Intr
od
uct
ion
2003), regulating access to and protection of a long-term residencestatus for third-country nationals, is one of various recent directiveswhich represent a significant step forward in the direction of civiccitizenship. However, much still remains to be done.
Civic citizenship would be a common baseline for all residents inthe EU. It would be part of a European framework forintegration for policies towards third-country nationals. Suchintegration policies would contribute to social cohesion andeconomic competitiveness, whilst remaining faithful to theUnion’s basic principles of legal and political equality and socialinclusion.
The EU’s Member States have much to gain from seeing migrationas a common EU issue. There is an ongoing process to create acommon EU economic and social space, within which to promotemobility and equality. The cornerstone is the development of acommon standard of inclusive citizenship which gradually extendsthe responsibilities and entitlements of EU citizenship to all legallyresiding residents. It follows that, in a context of increasinginterdependence and mobility, EU states would benefit from co-ordinating standards with respect to the immigrants within itsborders. Common standards for citizenship would strengthen theEU’s claim to be a truly inclusive Common Space for Justice,Freedom and Security. EU Member States already have the basis for acommon framework for such a citizenship and inclusion policy – forexample, The Maastricht and Amsterdam Treaties, the TampereDeclaration, the Lisbon, Thessaloniki and Hague Agendas, as well asCouncil of Europe human rights and equality standards. By usingtools such as target-setting, peer review, benchmarking andidentifying good practice, EU Member States can profit from thepromising opportunities to work towards sustainable economies andcohesive societies.
Box 2 A Brief History of Migration Policy in the EU
1957 The Rome Treaty � Introduced the right of freedom of movement of persons
Treaties
35950 I-50 V2 18/3/05 1:41 PM Page 5
6
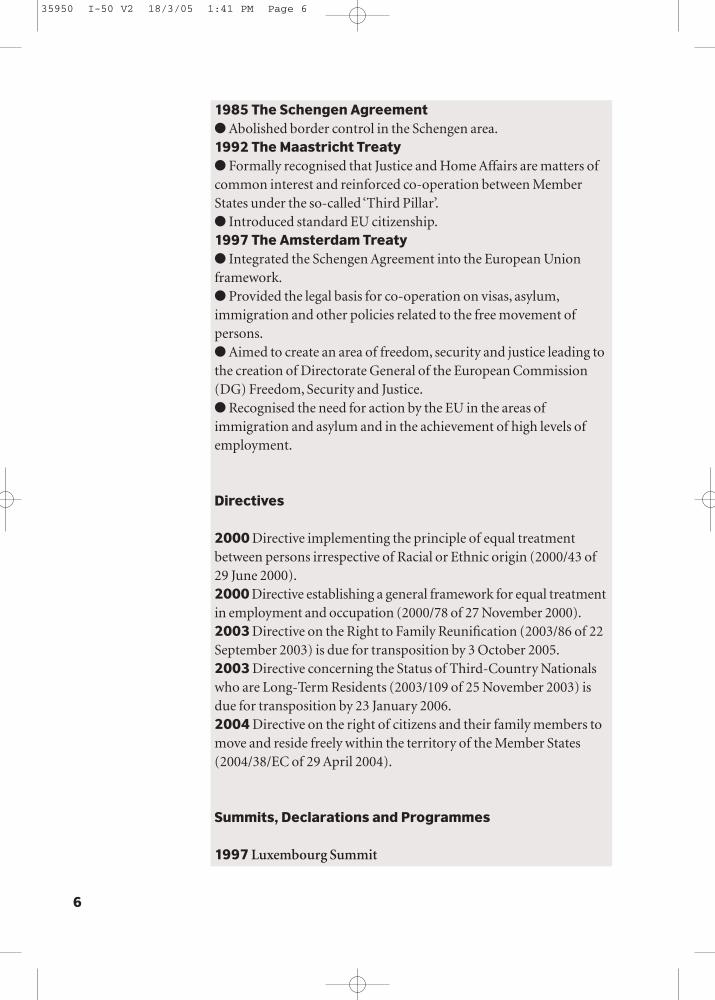
1985 The Schengen Agreement � Abolished border control in the Schengen area.1992 The Maastricht Treaty � Formally recognised that Justice and Home Affairs are matters ofcommon interest and reinforced co-operation between MemberStates under the so-called ‘Third Pillar’.� Introduced standard EU citizenship.1997 The Amsterdam Treaty � Integrated the Schengen Agreement into the European Unionframework.� Provided the legal basis for co-operation on visas, asylum,immigration and other policies related to the free movement ofpersons.� Aimed to create an area of freedom, security and justice leading tothe creation of Directorate General of the European Commission(DG) Freedom, Security and Justice.� Recognised the need for action by the EU in the areas ofimmigration and asylum and in the achievement of high levels ofemployment.
2000 Directive implementing the principle of equal treatmentbetween persons irrespective of Racial or Ethnic origin (2000/43 of29 June 2000).2000 Directive establishing a general framework for equal treatmentin employment and occupation (2000/78 of 27 November 2000).2003 Directive on the Right to Family Reunification (2003/86 of 22September 2003) is due for transposition by 3 October 2005.2003 Directive concerning the Status of Third-Country Nationalswho are Long-Term Residents (2003/109 of 25 November 2003) isdue for transposition by 23 January 2006.2004 Directive on the right of citizens and their family members tomove and reside freely within the territory of the Member States(2004/38/EC of 29 April 2004).
1997 Luxembourg Summit
Directives
Summits, Declarations and Programmes
35950 I-50 V2 18/3/05 1:41 PM Page 6

7
Intr
od
uct
ion
� Set the European Employment Strategy.1999 Tampere SummitThe ‘Tampere Programme’ (1999-2004) set out four strands of EUmigration policy:1 Fair treatment of Third Country Nationals: commitment to ensurethey enjoy ‘rights comparable’ to those of Member State nationals.2 Management of migration flows.3 Partnership with countries of origin.4 Common European asylum regime.2000 Lisbon Summit� The ‘Lisbon Agenda’ was a commitment to create “the mostcompetitive and dynamic knowledge-based economy in the world,capable of sustainable economic growth with more and better jobsand greater social cohesion.”� Pioneered use of the Open Method of Coordination as a tool toshare information and monitor progress.2001 – Laeken Summit � Introduced ‘Loyalty clause’, committing Member States not toadopt legal measures on asylum and migration which are in conflictwith EU recommendations.2002 – Seville Summit� Reinforced the importance of migration issues to EU foreignpolicy.2003 – Thessaloniki Summit � Made migration and immigrant integration a joint responsibilityof Social Affairs and Employment as well as Justice and Home Affairsministries and Directorates General.2004 – The Hague Summit � Launched the ‘Hague Programme’ to build on the previousTampere Programme. The Hague Programme (for 2004-9) identifiesfive main areas of work:1 Asylum (common asylum procedure and a uniform status).2 Irregular migration (reinforcement of partnerships with thirdcountries, policy to expel and return illegal immigrants, use ofbiometrics and information systems, etc.).3 Integration (establishment of a European framework of commonbasic principles).4 Legal migration (call for measures enabling foreigners to legallywork in the EU in accordance with labour market needs).5 Judicial cooperation.
35950 I-50 V2 18/3/05 1:41 PM Page 7
8
There are limitations to the EU’s response to the new challengesand opportunities of migration. An important limitation to theEU’s response is a lack of good data. This makes it impossible to tellwhether Member States are achieving their own targets, and whetherthey are living up to the commitments they have made. Whilstcountries systematically collect data on every cow and chicken in theEU as part of the Common Agricultural Policy (CAP), migration isapparently too politically sensitive, and Member States too different,for systematic, comprehensible data to be collected. Where data hasbeen collected, it demonstrates that in many areas Member States arenot fulfilling their promises - there is a gap between intent andimplementation.
The lack of transparent information makes it difficult tomonitor the implementation of Member States’ obligations (see Boxon transposition). Furthermore, the Lisbon targets are far frombeing met. Tools such as benchmarking, peer review, good practiceand target setting to achieve social objectives could be used morevigorously toward this end. This requires clear, transparent andcomparable data on Member States immigrant citizenship andinclusion policies.
Non-institutional actors would benefit from proper datacollection enabling them to also step up their efforts and identifyparticular areas of concern. The public discourse, fuelled largely bymass media, is riddled with inconsistencies and misinformation.
In this context, the aims of the Index are:1 To present data on civic citizenship and inclusion policies in theEU in a way that allows for comparison between Member States andagainst EU averages.2 To enable monitoring of the extent to which EU-15 Member Statesare implementing principles of inclusion and citizenship agreed toby all of them.3 To identify examples of good practice amongst Member States.4 To allow for comparison over time, by updating the Index annuallyand to extend the Index to all EU-25.
The Index is a systematic attempt to present how favourableMember States policies are to immigrant inclusion. The Indexpresents a formulation of the basis for immigrant inclusion, whichargues that inclusion requires labour market inclusion; familyreunion; long-term residence; naturalization and anti-discrimination. This structure reflects the accrual of rights over time
35950 I-50 V2 18/3/05 1:41 PM Page 8

9
Intr
od
uct
ion
– starting from the point at which immigrants enter the labourmarket, the Index follows the progression towards full citizenship.TheIndex takes each of these five areas of immigrant inclusion,andcompares Member States’commitments to their actual policies.TheIndex is therefore holding Member States to their word – are they doingwhat they said they would do at Tampere,Lisbon and The Hague?
The Index is an opportunity for Member States, the Europeaninstitutions and NGOs to evaluate their response to thecontemporary challenges of migration. The Index will allowcountries to see clearly the ‘menu’ of inclusion policies available tothem, and to identify specific areas with opportunity forimprovement. This will enable Member States to level standards upto a highest common denominator, thus avoiding a minimuminterpretation of their European commitments. It is an opportunityfor Member States to identify and exchange good practice onimmigrant inclusion, in an environment of transparent informationand positive competition. The Index will help the Europeaninstitutions to stimulate and monitor the countries’ inclusionpolicies, and to understand its impact. (See Box 3 on Transpositionand Infringement). Finally, the Index should facilitate a reasoned,objective dialogue on immigrant citizenship and inclusion acrossborders and interest groups in the EU.
We fully recognise the limitations of the Index. It isimportant to state explicitly those areas that the Indexdoes not, or cannot, address.
Firstly, which categories of migrants does the Index cover? Themedia reporting on migration often does not make the crucialdistinctions between asylum seekers, refugees and other migrants.Asylum seekers are persons seeking refuge from persecution – theduty to offer them protection is basic to civilised and humanenations, and clearly set out in various international instruments.4
The vast majority of immigrants are not asylum-seekers or refugees,but are rather ‘economic’ or ‘labour’ migrants, and their familymembers. The Index is concerned with these legal labour migrantsand family members, who are often referred to as ‘legally residentThird Country Nationals’5 (TCNs). The Index also does not coverethnic minorities who hold EU citizenship. For example, immigrantswho have naturalised or subsequent generations of migrants who aregiven EU citizenship at birth are not covered in the Index.
4 For example, the1951 United NationsConvention Relatingto the Status ofRefugees (known asthe ‘GenevaConvention’)5 Third CountryNationals arepersons who do nothold the citizenshipof any EU country.
35950 I-50 V2 18/3/05 1:41 PM Page 9

10
The Index does not at present say anything about the culturalintegration or political participation of migrants. The Indexmeasures policies in the EU Member States, specifically the policiesthat concern civic citizenship and the labour market. The Indextherefore does not illustrate, for example, to what extent migrants areincluded in their local community, or to what extent they participatepolitically. Political participation is undoubtedly crucial to migrantinclusion. Although the intention of this project had been to includeindicators of political participation, the lack of data and limitedresources precluded this. As the Index continues to develop over thecoming years, we hope to add data on political participation.
The Index does not imply any causal relationship betweenpolicies and the conditions of migrants. The Index measurespolicies, not outcomes. The normative framework upon which theIndex is built sets out transparently the policies that, we argue, willcreate favourable conditions for migrant inclusion. However, thisdoes not mean that there will be a direct causality between a strongperformance on policies measured in the Index, and the actualconditions of migrants in a given Member State. This is because theactual condition of migrants depends on many factors other thanpolicy alone. For example, a group of migrants may have very lowemployment rates, despite favourable policy on labour marketinclusion in that country. This could be the result of any number offactors, including skill levels, education, cultural attitudes towardswomen working etc. Every Member State has a unique migrationhistory and migrant communities, which will interact with itspolicies in a unique way. However, this is no reason to abandonpolicy. Legal equality and the protection of basic rights are theminimum standards upon which pro-active inclusion work can takeplace. Social inclusion, of course, takes place at the level of the localcommunity. But without strong legislation to ensure that migrantsare equal in the law, such work will be frustrated.
It is also important to clarify what the Index is not aiming to do.
The Index is not a ‘naming and shaming’ exercise. Rather, the aim isthat by providing transparent, comparable information, actors willbe better able to co-ordinate, monitor and improve their policies. Inan atmosphere of positive competition, Member States will then beable to review areas of relative strength and weakness.
35950 I-50 V2 18/3/05 1:41 PM Page 10
11
Intr
od
uct
ion
The Index is not making a case for more or less immigration.There is a vociferous debate in Europe over whether migrationshould be encouraged as a solution to skills shortages and thelooming pensions crisis, and what systems should be put in place tocontrol this inward migration.6 The Index does not offer any answersto these questions. Rather, it focuses on how migration should bestbe managed once immigrants have arrived. We argue that there is a need to ‘think backwards’ – from inclusion to migration.If Europe is to gain economically from migration whilst maintaining strong, cohesive societies, there needs to be an effectiveinclusion system in place. We need to look beyond technical debates about how to control migrants at our borders, and focusinstead on how we manage immigrant inclusion to ensure inclusivesocieties.
The Index is not a legal basis for infringement proceedings.
Box3 Transposition of EU Directives
What is a Directive?� The EU issues all manner of Declarations, Communiqués,Conclusions, Green Papers, Directives, Regulations and otherstatements. It is important to understand the status of these variousinstruments.� When we talk about the legal commitments of EU Member Statesin the area of immigrant inclusion, we are referring to the Directivesthat Member States have signed up to. The Member States also makeless binding commitments to looser principles or values, such as theTampere or Lisbon Declarations.
Which Directives are relevant?� The Council has so far adopted a number of Directives pertainingto immigration and inclusion:– Directive on the Right to Family Reunification (2003/86 of22 September 2003) is due for transposition by 3 October 2005.– Directive concerning the Status of Third-Country Nationals whoare Long-Term Residents (2003/109 of 25 November 2003) is due fortransposition by 23 January 2006.– Directive on the right of citizens and their family members to move
6 See EuropeanCommission COM(2004) 811, GreenPaper on an EUapproach tomanaging economicmigration
35950 I-50 V2 18/3/05 1:41 PM Page 11
12
and reside freely within the territory of the Member States(2004/58/EC of 29 April 2004).� The Council has adopted two Directives on anti-discrimination,both supposed to be incorporated into national law in 2003:– Directive implementing the principle of equal treatment betweenpersons irrespective of Racial or Ethnic origin (2003/43 of 29 June2000).– Directive establishing a general framework for equal treatment inemployment and occupation (2000/78 of 27 November 2000).
What does this mean for Member State policy?� There are two types of legal commitment – Regulations andDirectives. A regulation implies the adoption by Member States ofCommunity law with direct effect. However, a Directive is onlybinding ‘as to the result to be achieved’. In other words, a Directivehas to be transposed into national law, but the choice of form andmethods for its transposition is left up to the national authorities(Art. 249 of the EC Treaty).� In transposing a Directive (putting it into national law), MemberStates must make sure that the aims of the Directive are fullyeffective, and that there is maximum clarity and certainty in legalsituations (C-190/90, Jur. 1992 p. I-3265). The legislativeinstruments used must have the same legal status as those regulatingthe subject beforehand. Regulation through administrative practiceis not sufficient. Adaptation of existing national provisions oradoption of transitional measures may be necessary.� The transposition of directives still leaves Member States aconsiderable margin of action to Member States. This is particularlythe case with the Directives on migration above, which containnumerous derogations and flexible wording. Close monitoring atnational and European level of the transposition process of theDirectives is vital for a timely and favourable implementation.Regular collections of data like this Index can contributesignificantly to this monitoring task.
Box 4 Infringement Procedures
� The European Commission is the guardian of the EuropeanTreaty. It therefore has the power to control the implementation ofDirectives (Art. 211 EC Treaty) and to initiate infringement
35950 I-50 V2 18/3/05 1:41 PM Page 12

13
Intr
od
uct
ion
procedures against Member States when implementation is notcompleted correctly or in time (Art. 226 EC Treaty).� There may be delays in the implementation of a Directive for anumber of reasons: an anticipated change of government;administrative shortcomings; difficulties with interpretation;linkages with controversial legal or political decisions; or tacit protestby Member States, unhappy with the adoption of the Directive.� The Commission verifies both that the deadline forimplementation has been respected and that the measures andprovisions adopted comply with the terms of the Directive. Themeasures adopted must be a correct and complete implementationof the aims of the Directive. Failure in either of these respects canbring about ‘infringement procedures’.� The Commission can only initiate ‘infringement procedures’ afterobtaining relevant information pointing at a violation of theobligations of transposition. The Commission may detect such aninfringement itself, or, as is often the case, the Commission may beinformed by private complainants or by being asked questions bymembers of the European Parliament.� Exercises such as this Index are no legal basis for such proceduresbut can help the Commission, individuals and advocacy groupsidentify possible infringements.
35950 I-50 V2 18/3/05 1:41 PM Page 13

14
The Index sets out a formulation of inclusion based on labourmarket inclusion and civic citizenship. It sets out a comprehensiveset of policies that Member States can use to facilitate immigrantinclusion. Inclusion requires more than just access to the labourmarket. Work is not enough – for immigrants to be includedsuccessfully into society, they need to feel secure, and to feel that theircontribution over time is valued. The policies that can create thesefavourable conditions over the long term are in the areas of labourmarket inclusion, long term residence; family reunion;naturalization and anti-discrimination. Together, long-termresidence, family reunion, naturalization and anti-discriminationcontribute to what is often called ‘civic citizenship.’
The Index presents data that illustrates to what extent Member Statesare living up to the commitments they have made in these five vitalareas of immigrant inclusion. The Index measures to what extent theEU-15 are making concrete their promises of equality.
We have constructed a common analytical framework,informed by a set of normative criteria that are derived largely fromMember State commitments. The normative criteria allow us tobuild a common framework against which to hold Member States upfor comparison. This framework allows us to compare countries intwo respects. Firstly, it allows us to compare countries against theframework of desirable policy, in other words, the spirit of pastpromises. Secondly, it allows us to compare countries against eachother’s performance.
The normative framework sets out the policy conditions that are
2 Index Structure
The normative framework
35950 I-50 V2 18/3/05 1:41 PM Page 14
15
Ind
ex S
tru
ctu
re
most favourable to immigrant inclusion. The measures are aboutcreating favourable policy conditions for immigrant inclusion - theydo not describe immigrants’ actual position in society or policyeffectiveness. That would require a different type of indicator. Theindicators do not establish whether or not inclusion has beensuccessful, but whether or not favourable conditions in policy andlaw have been created. The normative framework is based on existingEU legislation, international conventions and NGO proposals.7
There are almost 100 indicators, categorised over five strands for thefive areas of immigrant inclusion policy.
The normative framework is, of course, based on certain valuejudgements. This is necessary to create a common framework toscore policies. The normative judgements are based on mainstreamarguments in the inclusion discourse about equal treatment andinclusion.8 The normative framework has been rigorously developedand checked at a series of high-level expert consultations, involvingEurope’s leading migration experts. In some countries, certainaspects of the normative framework may not fit with the publicphilosophy of integration. This is likely to be limited to a very smallnumber of the almost 100 indicators, as most are based on policiesagreed to by all Member States at EU level. Nevertheless, thenormative framework for each area is transparently and explicitlyincluded here, and in detail for each indicator in Annex 1.
Labour market inclusion – Lack of access to employment has beenidentified in the majority of countries as the most important barrierto integration and therefore the most urgent political priority fornational integration policies.9 Restricting access to employment isexclusionary, hinders mobility, and leads to a loss of skills in theeconomy.
Residence – Long-term residence can be secured by givingimmigrants the status of Long Term Resident, which grants them asequal treatment as possible with EU citizens. The status enables themto contribute to society whilst maintaining their links with theircountry of origin and to move freely within the EU. As legallyresiding Third Country Nationals, immigrants should obtain a secureresidence status as soon as possible.Within this limited number ofyears, they should be allowed to be absent for short periods.
Family Reunion is a basic human right and is vitally important for
7 Two EU directives on anti-discrimination of2000, EU Directiveon the Status ofLong-TermResidents of 2003,EU Directive onFamily Reunificationof 2003, Council ofEurope Conventionon Nationality, MPGand ILPA’sAmsterdamProposals and theStarting Line.8 For example,please see RitaSüssmuth andWerner Weidenfeld(eds.) (2004).ManagingIntegration. TheEuropean Union’sresponsibilitiestowards immigrants;Groenendijk, Guild,Barzilay (2000) Thelegal status of thirdcountry nationalswho are long termresidents in amember State of theEuropean Union;InternationalFederation forEuropean Law,Migration andAsylum Law andPolicy in theEuropean Union(2004) FIDE 2004National Reports,edited by ImeldaHiggins, GeneralRapporteur KayHailbronner, CUP.9 EuropeanCommission COM(2004) 508 FirstAnnual Report onMigration andIntegration
35950 I-50 V2 18/3/05 1:41 PM Page 15
16
immigrants’ life and life planning. It also contributes to familystability and thus to cohesive societies. An immigration policy that ispartly based on family migration may also help to address the ageimbalances of Europe’s population. Immigrants should be entitled tobring in their family members as soon as possible. Family membersshould include spouse and dependent and possibly other familymembers in ascending and descending line.
Naturalization puts immigrants on a par with EU citizens in terms ofrights and obligations, allowing them to become active citizens.Immigrants are to be encouraged to naturalise and policies shouldprovide easy access to nationality while making a distinctionbetween first and subsequent generations of immigrants.Immigrants and their family members should have access tonationality after a limited number of years, and the second andsubsequent generations should acquire nationality automatically atbirth.
Anti-discrimination promotes equality, a basic human right commonto all Member States. It applies to immigrants and citizensirrespective of their (immigrant) background and to relationsbetween and within various groups in society. It helps to eliminatethe obstacles for active economic, social and cultural participation ofall citizens in society. The grounds of anti-discrimination shouldinclude race and ethnicity, religion and belief, as well as nationalorigin and nationality. It should cover, at least, employment,provision of public and private services, education and training.
So far, we have divided inclusion policy according to the five strands– or areas – described above. The Index also uses a second level ofdivision – it examines the different dimensions of policies. For eachof the five areas of immigrant inclusion policy, the Index examinesfour important dimensions of the statuses and protections thatimmigrants enjoy. Thus, each of the five strands is further dividedinto four dimensions.Dimension 1 What are the eligibility requirements for the status? What is the scope of anti-discrimination legislation? How easy is access to the
The Dimensions of Policy
35950 I-50 V2 18/3/05 1:41 PM Page 16
17
Ind
ex S
tru
ctu
re
labour market?Dimension 2 What are the conditions that immigrants need to fulfil to access thestatus? What are the remedies available in cases of discrimination?How secure is employment?Dimension 3How secure is the status? How strong are the equality agencies whichmonitor anti-discrimination? What labour market integrationmeasures exist to facilitate migrants’ inclusion? Dimension 4 What are the rights associated with the status? What are the pro-activepolicies in place to combat discrimination?
The normative framework describes the best direction that policycould take to create favourable conditions for immigrant inclusion.The Index is built up from almost 100 indicators, each relating to avery specific policy in one of the five strands. For each indicator, thenormative framework is translated into three options, which reflectthe most to least favourable policy for immigrant inclusion. Thethree options reflect the favourable, less favourable and leastfavourable conditions for immigrant inclusion. The ‘favourable’option summarises NGO proposals and the more liberal provisionsin existing international instruments (in particular Free Movementof EU Citizens, Long Term Residence Directive, Family ReunionDirective and Nationality Convention). The ‘less favourable’ and‘least favourable’ options are rephrased versions of the morerestrictive provisions of the directives. For each indicator, eachcountry was therefore given a score of 1, 2 or 3 to reflect howfavourable its policy is in the given indicator area. Thus, a score of 3for a given indicator means that the specific policy the indicatorrefers to is favourable to immigrant inclusion in that particularMember State.10
In a small number of cases, there were no policies or legalprovisions at all for a certain indicator. In most of these cases (andwith the agreement of the expert for that country), the country wasgiven a default value of 1 for this indicator. Having no policy equatesto having no guarantee, no protection, no entitlement or at best anad hoc approach, which the normative framework does not favour.
The Scoring System
10 In the anti-discriminationstrand, theindicators could also have a score of1, 2 or 3, but thisdepended on thenumber of groundsof discriminationcovered by themeasure. 3 pointswere given when ananti-discriminationmeasure coveredthree discriminationgrounds, namelyrace/ethnicity,religion/belief andnationality. 2 pointswere given when theindicators coveredtwo out of threediscriminationgrounds. 1 point was givenwhen the indicatorscovered only one discriminationground or inexceptional cases none.
35950 I-50 V2 18/3/05 1:41 PM Page 17
18
In other words, the lack of policies on important issues was classifiedas an unfavourable condition.
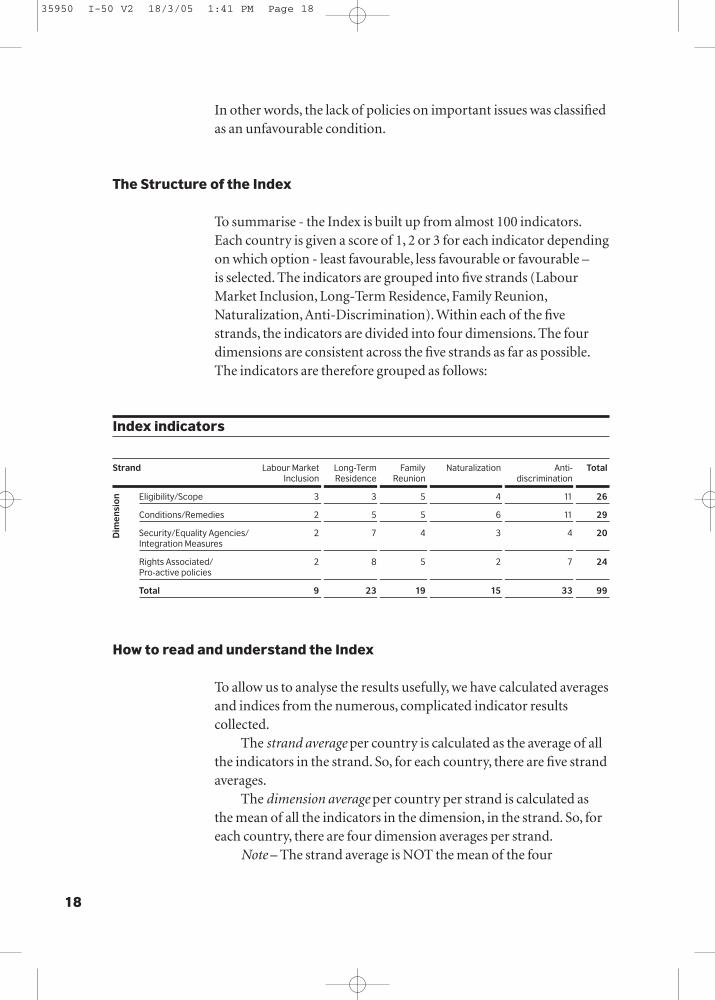
To summarise - the Index is built up from almost 100 indicators.Each country is given a score of 1, 2 or 3 for each indicator dependingon which option - least favourable, less favourable or favourable – is selected. The indicators are grouped into five strands (LabourMarket Inclusion, Long-Term Residence, Family Reunion,Naturalization, Anti-Discrimination). Within each of the fivestrands, the indicators are divided into four dimensions. The fourdimensions are consistent across the five strands as far as possible.The indicators are therefore grouped as follows:
To allow us to analyse the results usefully, we have calculated averagesand indices from the numerous, complicated indicator resultscollected.
The strand average per country is calculated as the average of allthe indicators in the strand. So, for each country, there are five strandaverages.
The dimension average per country per strand is calculated asthe mean of all the indicators in the dimension, in the strand. So, foreach country, there are four dimension averages per strand.
Note – The strand average is NOT the mean of the four
The Structure of the Index
How to read and understand the Index
Index indicators
Strand Labour Market Long-Term Family Naturalization Anti- TotalInclusion Residence Reunion discrimination
Eligibility/Scope 3 3 5 4 11 26
Conditions/Remedies 2 5 5 6 11 29
Security/Equality Agencies/ 2 7 4 3 4 20Integration Measures
Rights Associated/ 2 8 5 2 7 24Pro-active policies
Total 9 23 19 15 33 99
Dim
ensi
on
35950 I-50 V2 18/3/05 1:41 PM Page 18

19
Ind
ex S
tru
ctu
re
dimension averages. This is important, as the dimensions each have adifferent number of indicators. If the strand average were simplycalculated as the mean of the four dimensions, each indicator wouldhold a different weight in the strand average. Therefore, eachindicator holds an equal weight in the strand average.
For each strand, the EU average is calculated, as a simplearithmetic mean of the 15 scores.
The results are presented in two equivalent formats – score valuesand index values.
The score values compare countries to the normative framework,and describe how favourable (from favourable to least favourable)their civic citizenship and inclusion policies are.For each indicator, each country is given a score of 1, 2 or 3. Oncethese scores have been aggregated into the strands and dimensions(i.e. once the averages have been calculated), there are many moredegrees of variation between the countries. This is obvious, as wehave moved from 3 degrees of variation at the indicator level (thereare only three options for each indicator!) to an average of almost100 indicators. The average is given to 2 decimal places. It is thereforepossible to take a more nuanced reading of the score values, by takinga more detailed look at the differences between the countries’ scores.The meaning of the score, in terms of its favourableness forimmigrant integration, is described on the table below. Thesedescriptions should be read as the ‘key’ to the assessment of MemberState performance – they explain what a given score really means interms of immigrant inclusion policy.
Description Range
Unfavourable 1 – 1,25
Modestly unfavourable 1,25 – 1,75
Less favourable 1,75 – 2,25
Modestly favourable 2,25 – 2,75
Favourable 2,75 – 3
The index values compare countries to each other. This 1-3 rangeof scores is converted into an Index, standardising to a base of 100 =
Index values and score values
35950 I-50 V2 18/3/05 1:41 PM Page 19

20
EU Average 2004 for every dimension, strand and the overall result.A score over 100 means that a country is exceeding the EU averagefor a given strand; whilst a score below 100 means that a country isfalling short of the EU average. For example, a score of 107.5 on theAnti-Discrimination strand means that the Member State’s policieson anti-discrimination are just above the EU average in terms oftheir favourableness to immigrant inclusion.
The Index scores are given to 2 decimal places. We can calculatewhen a difference between two scores is significant. 11
11 The criterion used for this analysis is: two country outcomes are significantly different if thedifference is equal to a difference caused by an average score difference of 1 for one of their sets.There is, however, one complication, because the strand means are calculated as the average of allindicator values belonging to the strand and not as the average of the four dimension means perstrand, a dimension difference of 1 score point therefore has a different weight (more indicatorsmeans more weight) depending on the table. In defining significant difference the model is usedthat approximates the strand mean by working with the mean of four dimension values per strand.There are 4 dimensions per strand. Therefore, the criterion effect on a strand mean is 0.25.There are 20 dimensions per country (5 strands of 4 dimensions); therefore the criterion effect on acountry mean is 0.05. In conclusion: two countries have a significant mean difference if tworespective strand means differ more than 0.25. Two countries have a significant country meandifference if the respective means differ more than 0.05. Two countries have a significant countryindex difference if their country index differs more than 2.5 points.
35950 I-50 V2 18/3/05 1:41 PM Page 20
21
Me
tho
do
log
y
It is not easy to develop comparable data between countries. Itentails the danger of (over) simplifying complex policies. Policies areadopted in different situations and responding to differentcircumstances, but must be reduced to the point that they can becompared.
Nevertheless, the policies of different countries are oftencompared. In academic circles comparative research is verycommon. Good research not only stimulates academic discussionsbut also informs policy debates. Profound scientific research or moresimple inventories may precede the formulation of concrete policyproposals. A European level example is the practice of the EuropeanCommission making inventories or commissioning summaries ofMember State policies before proposing directives.12
The project was designed such that the results would beaccessible to a wide group of stakeholders. The research undertakenfor this project benefited greatly from existing research and adds in aspecific way to the body of knowledge of the EU-15’s policies oncitizenship and labour market inclusion13. The methodology wasdesigned such that the output would be useful for a wide group ofstakeholders. This informed the choice of format – the aim is toprovide accessible, comprehensible and transparent information.The idea was not to write fifteen lengthy country reports describingpolicies in detail, but to summarise them into a quick referencedocument. The information summarised in the Index was allprobably available before, given enough searching around forscattered information over many books and research reports. Whatthe Index offers, for the first time, is a simplified, unified format forthe EU-15’s complex immigrant inclusion policies.
The data on Family Reunion, Long Term Residence,Naturalization and Anti-Discrimination was collected by
3 Methodology
12 See for example,Kees Groenendijk,Elspeth Guild, RobinBarzilay, The legalstatus of thirdcountry nationalswho are long-termresidents in aMember State of theEuropean Union(Nijmegen, Centrefor Migration Law,2000)13 See InternationalFederation forEuropean Law,Migration andAsylum Law andPolicy in theEuropean Union,FIDE 2004 NationalReports, Edited byImelda Higgins,General RapporteurKay Hailbronner, CUP2004. For anti-discrimination see,Isabelle, Chopin,Janet Cormack andJan Niessen (eds),The implementationof European anti-discriminationlegislation: work inprogress (MPG,2004).
35950 I-50 V2 18/3/05 1:41 PM Page 21

22
independent experts. Once the list of approximately one hundredindicators had been agreed, and the three options for each indicatorformulated, they were sent as a questionnaire to a group ofindependent experts (in all but one case to two experts per MemberState).14 Given the distinctive policy fields, one expert was asked todeal with the first three areas and the other with anti-discrimination.The experts determined for all indicators which option applied fortheir country, describing the situation in October 2004.15
Who were the experts? The experts are well-known scientistsand experienced migration and anti-discrimination lawpractitioners. Their names and more background on the researchundertaken for this project can be found in a separate publication16.
The data on Labour Market Inclusion was collected from avariety of sources. Some was collected from experts listed above, andsome from a second network of experts (The Raxen network).However, much of the data was freely available from various sources(such as country legislation and various reports), and was thereforecollated by the research team.
Policies are changing continuously. Policies changecontinuously, partly as a result of the transposition of Europeandirectives and the ratification of international conventions. Despitethe fact the deadlines for the transposition of the Anti-discrimination Directives have passed, not all Member States havecompleted transposition in time, or transposed the directivescorrectly. Ongoing debates in the states concerned and possibleinfringement procedures started by the European Commission willlead to further changes in national law. The deadline for thetransposition of the Family Reunion and Long-Term residenceDirectives is October 2005 and January 2006, respectively and onemay therefore expect that the relevant national laws will undergochanges in the near future.
The indicators are about law and the options are legal options.They are not about practices and how the law is (not) applied.Constitutional provisions were not considered a sufficient basis foranswers. Only more detailed legislative or administrative provisionswere accepted as an option.
The answers and comments of the experts were reviewed indetail to ensure that choices were consistently made, and thescoring robust. Where indicators appeared to be problematic theywere discussed with the experts. For example, where there were twotypes of residence status comparable with the long-term residence
14 For morebackground on theresearch and the listof experts see JanNiessen, María JoséPeiro and YongmiSchibel, Civiccitizenship andimmigrant inclusion .A guide for theimplementation ofcivic citizenshippolicies (MPG, 2005). 15 Jan Niessen,María José Peiro and Yongmi Schibel,(2005).
35950 I-50 V2 18/3/05 1:41 PM Page 22

23
Me
tho
do
log
y
status as introduced by the Long-term Residence Directive, thechoice was made for the one that comes closest to the one of theDirective. When it was difficult to make a choice for an optionbecause none of them reflected reality, the third (and unfavourable)option was taken as a default answer. This occurred in a few instancesand it is clearly specified in the comments. In the few cases where theviews of the experts and the research team were not the same, theviews of the experts prevailed.
It was not always easy to bring the complex realities of policyand law back to the selected indicators and policy options. Indeed,some experts had some uncertainties over certain indicators, wherethey felt that nuances in the law could not properly be reflected in theoptions available. Therefore, the experts added comments to theiranswers so as to explain such nuances. The answers to thequestionnaire and the comments are made available in a separatepublication16 and the author of this publication is fully responsiblefor the conclusions drawn from the answers and comments.
Nevertheless, the results are robust and succeed in the aim ofoffering an indication of countries’ policies with respect toimmigrant inclusion. The whole exercise is designed to provideindications of how a country’s inclusion policies look, and not toprovide a comprehensive assessment of Member States’ immigrationpolicies and law. Although complex realities were inevitably notentirely done justice, in practice policies and law arguably work outin quite simple and direct ways for the immigrants concerned. Aresidence status, permission for family reunion, or nationality isacquired after a number of years; there are different levels ofprotection of the status and there are specific rights attached to astatus and others are not, etc. Without wishing to portray the legaland policy landscape in black and white terms, it can be maintainedthat the outcome of the exercise is a helpful contribution to thedebates around civic citizenship and inclusion, precisely because theindicators are robust.
16 See Niessen,Peiro and Schibel
35950 I-50 V2 18/3/05 1:41 PM Page 23

24
At this point, it is worth re-stating clearly which groups arecovered by the Index. The ‘cleanest’ data set available is that for non-EU ‘third country nationals’ (TCNs) resident in EU-15 MemberStates. It is this population group upon which we focus. The expertswere explicitly asked to exclude asylum seekers from their results.Nevertheless, the 13 million people (3.4 % of the EU-15 population)who are covered by the Index are extremely diverse, often due toparticularities in the countries’ citizenship policies.18
Every Member State has a unique migration history, which isreflected in their policy choices and the condition of migrants inthe economy and society. Academics have often attempted tocompare countries in terms of their immigration histories, dividingthem into broad categories. One such categorisation dividesindustrialised countries into three groups.19 The first groupcomprises countries where mass immigration played an importantpart in nation building and is closely linked to the formation ofnational identity, for example the US, Canada, New Zealand andAustralia. The second group is made up of European countries thatexperienced significant immigration following the Second WorldWar. These ‘guestworker’ and post-colonial countries (such asGermany, France and Britain) allowed large numbers of foreignworkers from Southern Europe or ex-colonies to enter and fill labourshortages, but then acted to halt the flows in the late 1960s and 1970s.The final group are ‘newer’ countries of migration - SouthernEuropean countries such as Spain, Italy, Greece and Portugal, andmore recently countries such as Ireland and Finland - that haverecently shifted from sending workers abroad to receiving significantnumbers of migrants themselves.20
The migration policies of a given country must be viewed incontext. The migration history is one important contextual factor.
4 Key Findings
18 In Member Statewhere theacquisition ofnationality isrelativelystraightforward,many immigrants arenaturalised,including the vastmajority of secondand subsequentgenerationimmigrants. In suchcountries, theimmigrants fallinginto the TCNcategory are eitherrelatively recentlyarrived, or for somereason not choosingto naturalise. This isquite different to acountry in whichcitizenship is difficultto acquire. In suchcountries, secondand even thirdgenerationimmigrants may nothold the citizenshipof the country oftheir birth, and aretherefore classifiedas TCNs.
35950 I-50 V2 18/3/05 1:41 PM Page 24

25
Key
Fin
din
gs
We must also consider the following results in the light of otherfactors, such as the country’s integration concepts and the structureof its welfare state and labour market, for example. For each country, the Index results are preceded by a brief synopsis of themigration history of the country, and a set of situational data thatdescribe the real conditions of migrants in the labour market today.This short background should help to ‘set the scene’ of the migrationpolicies.
Nevertheless, it is important to remember that the Index ismeasuring policy, not effectiveness. It does not reflect how wellimmigrants are actually included into Europe’s economies andsocieties.
Box 5 Why is the collection of data so varied?
The collection (or not) of data on migrants is not accidental. Forexample, countries such as France eschew the collection of officialdata on the ethnic origin of its population while the Netherlands andthe UK have developed policies that target ethnic minorities whoseorigins lie in migration. These divergences are not simply questionsof data. The responses in these countries also reflect divergent publicphilosophies of integration. To this philosophical dimension can beadded a temporal dimension because, for some EU Member States,immigration is a relatively new issue with policy measures andinstruments that are of more recent provenance than those that existin Europe’s older immigration countries. Beyond this, there exists along-running dispute over the categorisation of immigrants – someargue that they should be categorised by nationality, others bycountry of birth. This deadlock over terminology, underlying whichis a serious philosophical disagreement about the nature ofintegration and citizenship, is one of the factors preventingthorough, comparable data collection in this area.
There is a need to enhance the collection, monitoring andcomparison of data. This will require an end to the disagreementover the categorization of immigrants in the EU (see box 3 on datacollection). The lack of transparent, comparable data - which thisIndex hopefully goes some way to address - is itself a political issue.The area of migration compares badly with other areas of Europeanactivity, such as agriculture and even social inclusion. This lack ofinformation hinders EU-level debate by non-governmental actors.The result is that the migration discourse remains at national level,
19 For exampleFreeman, G. (1995). "Modes of ImmigrationPolitics in LiberalDemocratic States."InternationalMigration Review29(4): 881-902.20 King, R. (2000)."Southern Europe in the ChangingGlobal Map ofMigration", in King, R.Lazaridis, G. andTsardanidis, C. (Eds)Eldorado orFortress? Migrationin Southern Europe.asingstoke,Macmillan
35950 I-50 V2 18/3/05 1:41 PM Page 25
26
despite a common EU level policy-making framework. The lack ofinformation also hinders policymakers’ attempts to identify andshare good practice, and to track their progress in an EU context.
1 Diverse migration experiences are no longer a sufficientexplanation for the lack of comparable data on migration policyand conditions. Whilst Member States systematically collect data onevery cow and chicken in the EU as part of the CAP, migration isapparently too sensitive, and migrants too diverse, for systematic,comprehensible data to be collected. But how can we monitorinclusion policies across the EU, if we do not collect data at EU level?The EU-15 do indeed have diverse migration histories. However,they systematically collect and share data on a range of social policyin which they have equally diverse contexts.
2 A Common legislative framework, basic principles, statements,declarations and good intentions does exist at EU level. ButMember States are implementing their inclusion policyinconsistently. There is a great deal of variation between countries,in all strands. This illustrates that inclusion policy is not common toEU Member States, despite their common commitments. The strandin which countries showed the most consistent policy wasnationality. The greatest range in policy was found in anti-discrimination, with a full 1.5 points between the highest and lowestscore.
The issue of monitoring and comparing data at EU level couldbe resolved through reform of the Open Methods of Coordination(OMC).22 Some aspects of the inclusion of migrants are included inthe Social Inclusion and Employment OMCs as part of the LisbonStrategy. However, the policies relating to migrants are not handledsystematically and comprehensively in these instruments. Wepropose that there are two alternative solutions. Either, the SocialInclusion and Employment OMCs could be overhauled tocomprehensively and systematically refer to the inclusion ofmigrants. Alternatively, a new, separate OMC could be developed torefer specifically to policies relating to migrants.
3 There are clear opportunities for Member States to create morefavourable conditions for immigrant inclusion. Overall, the EU-15scores in the ‘less favourable’ category for all of the strands. The
22 The EuropeanCommission hasdeveloped themechanism of ‘Open Methods ofCoordination’ tomonitor and improvethe performance ofMember States in agiven area, whilstleaving individualMember States thefreedom to designand implement theirown policies. Open Methods ofCoordination arebased on agreedcommon objectives,and use indicatorsand periodicreporting to monitorprogress. The Open Method ofCoordinationpromotes peerreview, transnationalexchange of goodpractice and policycooperation.
35950 I-50 V2 18/3/05 1:41 PM Page 26
27
Key
Fin
din
gs
strongest policy area for the EU-15 (according to EU averages) isLong Term Residence, but there is no significant difference withresults for Labour Market Inclusion, or Family Reunion; and anti-discrimination lies very close behind. Performance of Member Statesin these areas is rather similar. In contrast, the weakest policy area byfar is Nationality. There is a clear opportunity for Member States toimprove their policy on immigrant inclusion. The framework fordoing so already exists; Member States now need the political will tofurther implement their commitments.
4 Member States tend to score consistently high or consistentlylow across the five areas of policy. This highlights that MemberStates’ inclusion policies, or lack of them, are not due to accident orneglect. Rather, they reflect the deliberate policy choices of countrieswith respect to the migrants who live within their borders.
5 There are no major differences in policy between countries withlong and short migration histories. As discussed, the EU-15 havediverse migration histories. Some countries, such as Finland andIreland, have only very recently become countries of net inwardmigration. Other countries, such as Italy, Spain, Portugal and Greecein the pat 10-15 years have moved from being countries ofemigration to countries of immigration. Further back, countriessuch as France, Germany and the UK have experienced massimmigration since the Second World War . However, the Index doesnot show any correlation between the migration history of aMember State and its inclusion policy today.
6 Although statuses (or rights) for migrants in the EU arerelatively difficult to acquire and weakly protected, they havesignificant rights associated with them. An analysis of thedimensions shows us that countries of the EU-15 tend to confergenerous rights on a status (such as Long Term Residence, forexample), but that the status itself is relatively difficult to acquire.Anti-discrimination bucks this trend – the legislation tends to covera great breadth of areas (with the exception of discrimination on thebasis of nationality), but yet is rather weak on enforcement.
7 Naturalization is one of the most problematic areas for MemberStates. The lowest EU-15 average of all the policy areas isnaturalization. Naturalization is also, however, the area with the
35950 I-50 V2 18/3/05 1:41 PM Page 27

28
weakest Treaty base, and therefore the area in which the EU’scompetencies are weakest. This reflects the ongoing debate in the EU– Member States have not yet decided whether to view migration as atemporary solution to labour market gaps; or as a permanentphenomenon with positive benefits to, for example, the pensionsystem. They are therefore undecided on whether to createlegislation to give labour migrants a more permanent status, orwhether to continue with short-term statuses. We should expect tosee developments in this indicator as this issue is resolved over thecoming few years.
35950 I-50 V2 18/3/05 1:41 PM Page 28

29
EU
-15
Re
sult
s
The tables below set out the results for each of the five policy areas ofthe Index. As discussed, there are two types of equivalent result –score values and index values. The tables below use index values, toenable a simple comparison between countries. The detailed analysisper country, in the following section, uses score values whichcompare countries to the normative framework.
Table 5.01 – Index Scores Summary Results
Labour Market Inclusion Long-term Residence
1 Spain 127.55 1 Netherlands 113.40
2 Belgium 122.45 2= Belgium 111.41
3 Netherlands 117.35 France 111.41
4 Portugal 112.24 4 Spain 109.42
5 Sweden 107.14 5= Finland 107.43
6= Finland 102.04 Sweden 107.43
Italy 102.04 7 Denmark 103.45
UK 102.04 Europe 100.00
Europe 100.00 8= Germany 99.47
9 France 96.94 Portugal 99.47
10 Germany 91.84 UK 99.47
11= Austria 86.73 11 Italy 95.49
Ireland 86.73 12 Austria 93.50
13= Denmark 81.63 13 Luxembourg 91.51
Greece 81.63 14 Greece 81.56
Luxembourg 81.63 15 Ireland 75.60
5 EU-15 Results
35950 I-50 V2 18/3/05 1:41 PM Page 29
30
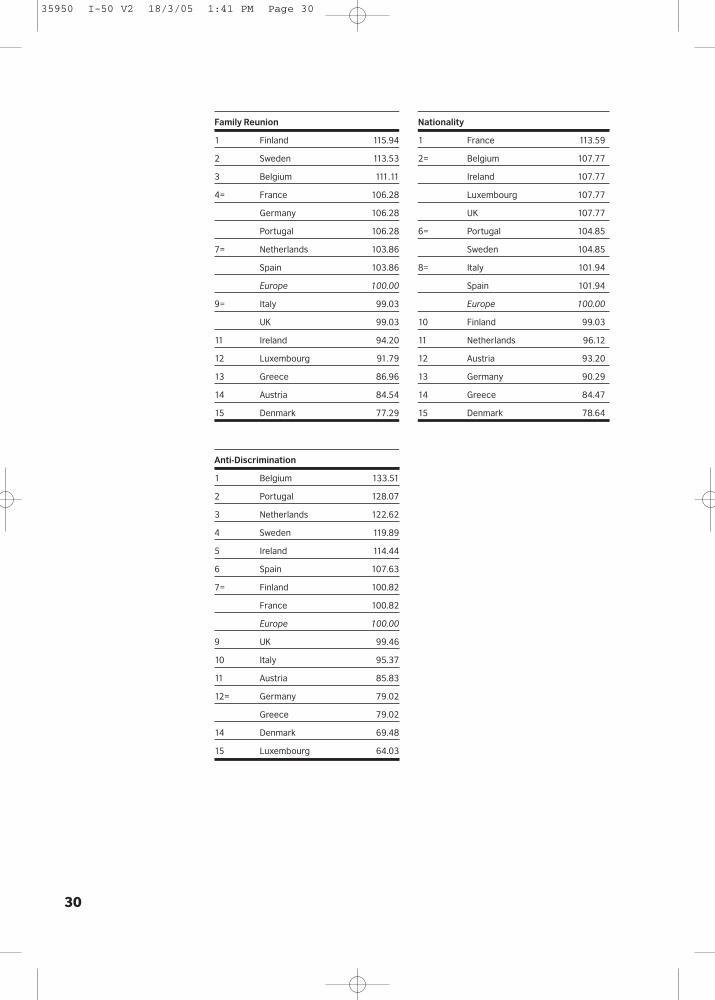
Family Reunion Nationality
1 Finland 115.94 1 France 113.59
2 Sweden 113.53 2= Belgium 107.77
3 Belgium 111.11 Ireland 107.77
4= France 106.28 Luxembourg 107.77
Germany 106.28 UK 107.77
Portugal 106.28 6= Portugal 104.85
7= Netherlands 103.86 Sweden 104.85
Spain 103.86 8= Italy 101.94
Europe 100.00 Spain 101.94
9= Italy 99.03 Europe 100.00
UK 99.03 10 Finland 99.03
11 Ireland 94.20 11 Netherlands 96.12
12 Luxembourg 91.79 12 Austria 93.20
13 Greece 86.96 13 Germany 90.29
14 Austria 84.54 14 Greece 84.47
15 Denmark 77.29 15 Denmark 78.64
Anti-Discrimination
1 Belgium 133.51
2 Portugal 128.07
3 Netherlands 122.62
4 Sweden 119.89
5 Ireland 114.44
6 Spain 107.63
7= Finland 100.82
France 100.82
Europe 100.00
9 UK 99.46
10 Italy 95.37
11 Austria 85.83
12= Germany 79.02
Greece 79.02
14 Denmark 69.48
15 Luxembourg 64.03
35950 I-50 V2 18/3/05 1:41 PM Page 30
31
EU
-15
Re
sult
s
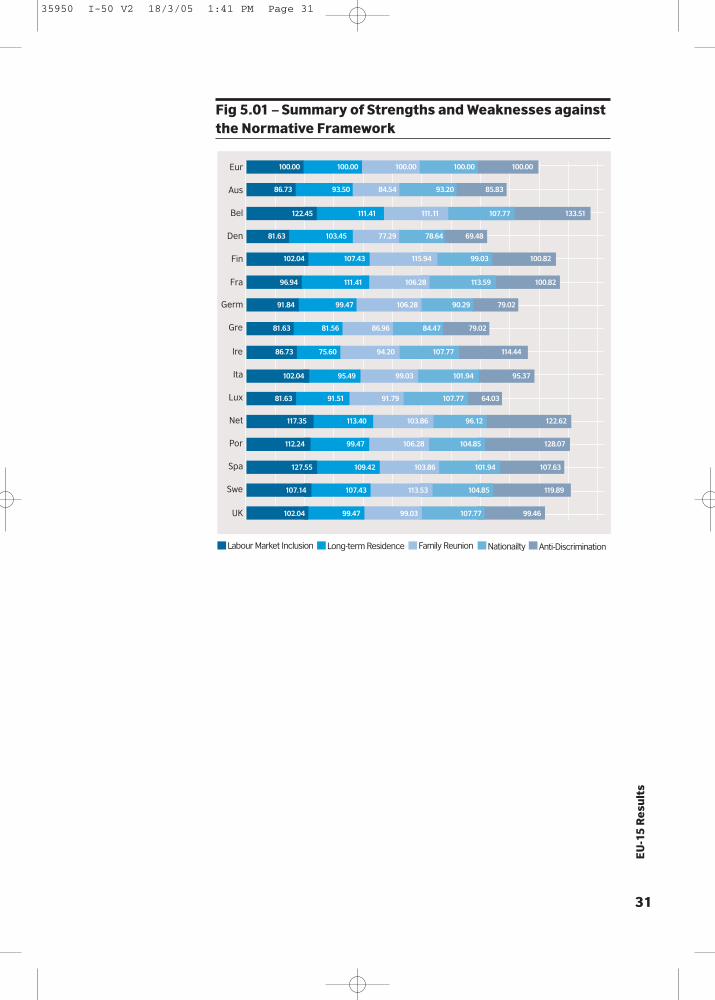
Fig 5.01 – Summary of Strengths and Weaknesses againstthe Normative Framework
Gre
Germ
Fin
Fra
Den
Bel
Aus
Eur
Swe
UK
Spa
Por
Net
Lux
Ita
Ire
Labour Market Inclusion Long-term Residence Nationailty Anti-DiscriminationFamily Reunion
100.00 100.00 100.00 100.00 100.00
86.73 93.50 84.54 93.20 85.83
122.45 111.41 111.11 107.77 133.51
81.63 103.45 78.6477.29 69.48
102.04 107.43 99.03115.94 100.82
96.94 111.41 113.59106.28 100.82
91.84 99.47 90.29106.28 79.02
81.63 81.56 84.4786.96 79.02
86.73 75.60 107.7794.20 114.44
102.04 95.49 101.9499.03 95.37
81.63 91.51 107.7791.79 64.03
117.35 113.40 96.12103.86 122.62
112.24 99.47 104.85106.28 128.07
127.55 109.42 101.94103.86 107.63
107.14 107.43 104.85113.53 119.89
102.04 99.47 107.7799.03 99.46
35950 I-50 V2 18/3/05 1:41 PM Page 31
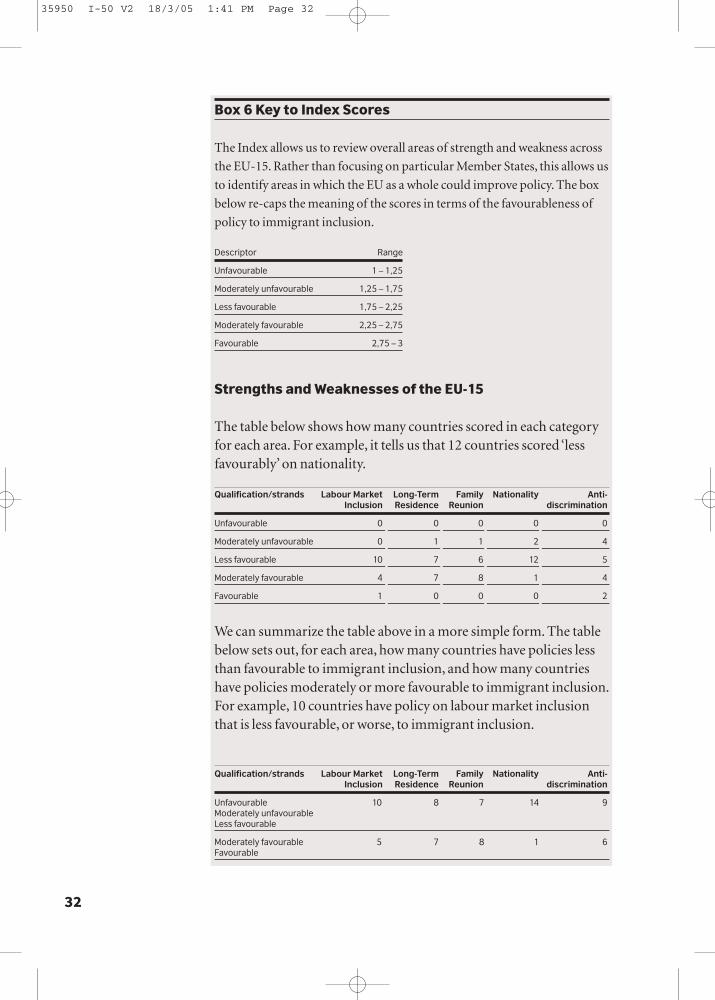
32
Box 6 Key to Index Scores
The Index allows us to review overall areas of strength and weakness across
the EU-15. Rather than focusing on particular Member States, this allows us
to identify areas in which the EU as a whole could improve policy. The box
below re-caps the meaning of the scores in terms of the favourableness of
policy to immigrant inclusion.
Descriptor Range
Unfavourable 1 – 1,25
Moderately unfavourable 1,25 – 1,75
Less favourable 1,75 – 2,25
Moderately favourable 2,25 – 2,75
Favourable 2,75 – 3
The table below shows how many countries scored in each categoryfor each area. For example, it tells us that 12 countries scored ‘lessfavourably’ on nationality.
Qualification/strands Labour Market Long-Term Family Nationality Anti-Inclusion Residence Reunion discrimination
Unfavourable 0 0 0 0 0
Moderately unfavourable 0 1 1 2 4
Less favourable 10 7 6 12 5
Moderately favourable 4 7 8 1 4
Favourable 1 0 0 0 2
We can summarize the table above in a more simple form. The tablebelow sets out, for each area, how many countries have policies lessthan favourable to immigrant inclusion, and how many countrieshave policies moderately or more favourable to immigrant inclusion.For example, 10 countries have policy on labour market inclusionthat is less favourable, or worse, to immigrant inclusion.
Qualification/strands Labour Market Long-Term Family Nationality Anti-Inclusion Residence Reunion discrimination
Unfavourable 10 8 7 14 9Moderately unfavourable Less favourable
Moderately favourable 5 7 8 1 6Favourable
Strengths and Weaknesses of the EU-15
35950 I-50 V2 18/3/05 1:41 PM Page 32
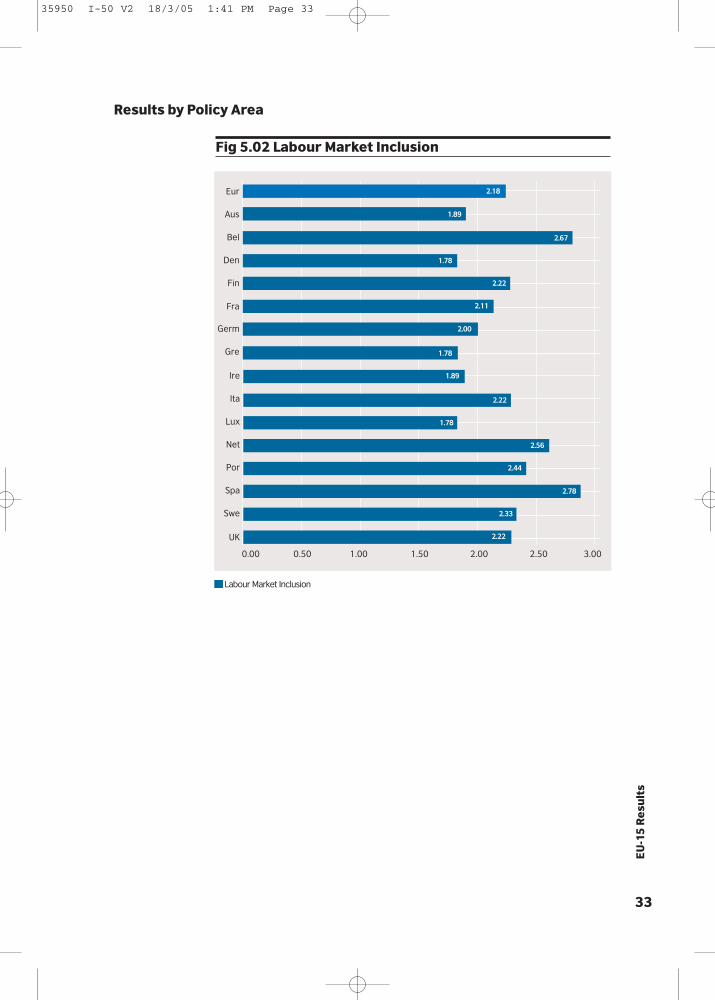
33
EU
-15
Re
sult
s
Fig 5.02 Labour Market Inclusion
Results by Policy Area
Swe
UK
0.00 0.50 1.00 1.50 2.00 2.50 3.00
Spa
Por
Net
Lux
Ita
Ire
Labour Market Inclusion
81.63Gre
Germ
Fin
Fra
Den
Bel
Aus
Eur
2.22
2.33
2.78
2.44
2.56
1.78
2.22
1.89
1.78
2.00
2.11
2.22
1.78
2.67
1.89
2.18
35950 I-50 V2 18/3/05 1:41 PM Page 33
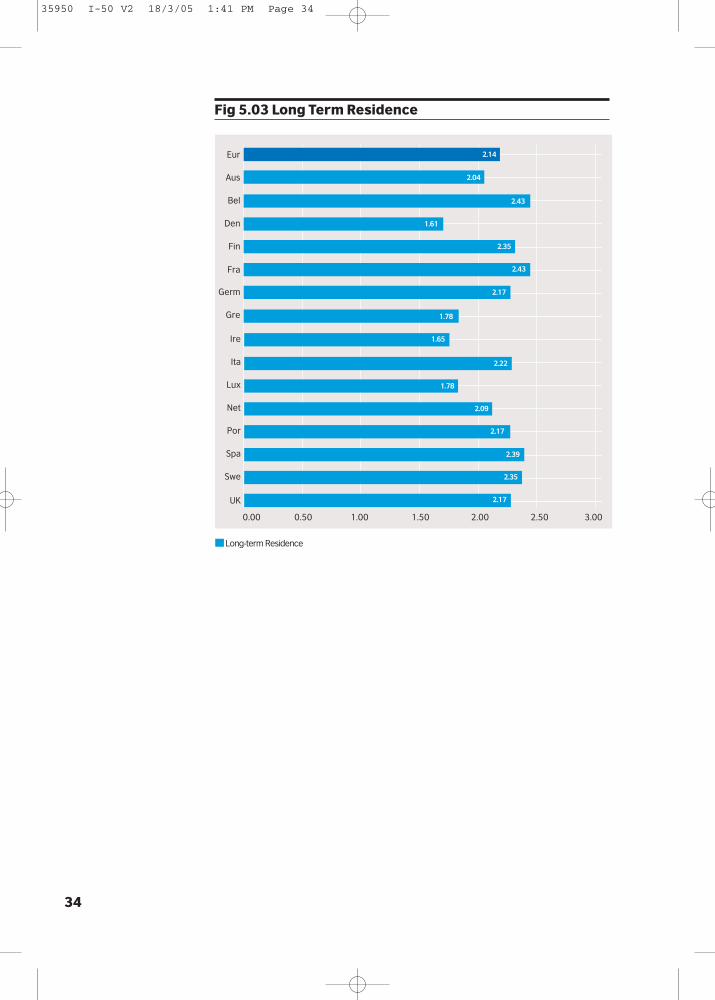
34
Fig 5.03 Long Term Residence
Swe
UK
0.00 0.50 1.00 1.50 2.00 2.50 3.00
Spa
Por
Net
Lux
Ita
Ire
Long-term Residence
81.63Gre
Germ
Fin
Fra
Den
Bel
Aus
Eur
2.17
2.35
2.39
2.17
2.09
1.78
2.22
1.65
1.78
2.17
2.43
2.35
1.61
2.43
2.04
2.14
35950 I-50 V2 18/3/05 1:41 PM Page 34

35
EU
-15
Re
sult
s
Fig 5.04 Family Reunion
Swe
UK
0.00 0.50 1.00 1.50 2.00 2.50 3.00
Spa
Por
Net
Lux
Ita
Ire
Family Reunion
81.63Gre
Germ
Fin
Fra
Den
Bel
Aus
Eur
2.16
2.47
2.26
2.32
2.26
2.00
2.16
2.05
1.89
2.32
2.32
2.53
1.47
2.42
1.84
2.16
35950 I-50 V2 18/3/05 1:41 PM Page 35

36
Fig 5.05 Nationality
Swe
UK
0.00 0.50 1.00 1.50 2.00 2.50 3.00
Spa
Por
Net
Lux
Ita
Ire
Nationailty
81.63Gre
Germ
Fin
Fra
Den
Bel
Aus
Eur
2.18
2.06
2.26
2.12
1.94
2.18
2.06
2.18
1.71
1.82
2.29
2.00
1.53
2.18
1.88
2.02
35950 I-50 V2 18/3/05 1:41 PM Page 36

37
EU
-15
Re
sult
s
Fig 5.06 Anti-Discrimination
Swe
UK
0.00 0.50 1.00 1.50 2.00 2.50 3.00
Spa
Por
Net
Lux
Ita
Ire
Anti-Discrimination
81.63Gre
Germ
Fin
Fra
Den
Bel
Aus
Eur
2.15
2.59
2.32
2.76
2.65
1.38
2.06
2.47
1.71
1.71
2.18
2.18
1.47
2.88
1.85
2.16
35950 I-50 V2 18/3/05 1:41 PM Page 37
38
Having compared the performance of states across different strands,it is necessary to analyse their situations and performances moreclosely to understand the origins of the discrepancies between them.This chapter focuses on both the economic circumstances of third-country nationals (TCNs) in individual states, and on the policies ofthose states. Its goal is not to give a comprehensive account of eachstate’s choices and challenges – but rather to profile countriesaccording to two sets of information:
� Comparable data on the economic situations of TCNs relative tomember-state nationals (MSNs), suggesting positive andproblematic areas for governments to consider� The policy indicators, described in previous chapters, used toprovide a common framework for analysing their policy regimes.
While this chapter is not intended to replicate or replace the detaileddomestic analyses needed to mould specific policy choices, it offers aset of criteria with which to address and compare those choices. Eachcountry profile is divided into three parts:
� A short note on background issues in a given state’s immigrationand inclusion policies, pointing to significant demographic, politicaland legal factors� An overview of the labour market statistics as provided by theEuropean Labour Force Survey (LFS) relevant to TCNs in the state,with particular reference to rates of employment, unemployment,contractual situations and training� An analysis of the policy indicators for the state, highlightingareas of particular strength and weakness within the strandsdiscussed in Chapter 5.
6 Country Results and Profiles
35950 I-50 V2 18/3/05 1:41 PM Page 38

39
Co
un
try
Re
sult
s an
d P
rofi
les
The statistics used here are drawn from the European Labour ForceSurvey (LFS), but this is the first time that they have been collatedand presented in this fashion. The lack of such accessible,comparable data is arguably a deficiency for policy-makers to resolveper se. It is an issue that can and should be addressed at the Europeanlevel.
In this survey, there are two levels of analysis. First, we discussaggregate employment and unemployment rates for TCNs andMSNs over the last three years, then we attempt to provide furtherinsights through an examination of a breakdown of the data for onequarter, in both cases using the categories and definitions asprovided by the LFS. It is perhaps useful to briefly clarify some ofthese terms here:
1 Employment rates – the percentage of individuals between 15 and64 years that are either employed or self-employed2 Participation rates – the percentage of each group that iseconomically active be they employed, self-employed or registeredunemployed3 Unemployment rates - the percentage of registered as unemployed4 Long-term unemployment rates - the percentage experiencingunemployment for longer than 12 months5 Skill levels – numbers employed in either low-skilled, medium-skilled and high-skilled work23
6 Contract type - the percentages holding permanent andtemporary contracts7 Training - the percentage who received training in the four weeksprior to the survey
The LFS breaks down nationality in the following manner: Nationals(those holding citizenship of the Member State), Other EU-15(nationals of one of the other EU (15) member states), Non-EU 15(Third Country Nationals).
These statistics give a picture of the relative level of access ofTCNs to a given labour market, their economic security within it,and some of the opportunities they receive within it. It cannot, ofcourse, allow for those TCNs who work illegally within a country. Asis noted in a number of cases below, this group is liable to expand
Labour market statistics
23 Eurostat has acomplicated set ofdefinitions in orderto categorise low-skilled, medium-skilled and high-skilled work,contract type etc.For moreinformation, visithttp://epp.eurostat.cec.eu.int
35950 I-50 V2 18/3/05 1:41 PM Page 39
40
where legal opportunities are restricted.It should also be noted that the EU expanded to 25 countries
during this period, and nationals of the new accession states nowexperience a complex patchwork of mobility rights and access toemployment across the old EU 15, which while of great interest whenexamining migration and employment is beyond the scope of thisproject.
However, these statistics can tell us the extent to which TCNsplay a part in a country’s formal economic framework. Thepresentation here emphasises their experience relative to MSNs(and, to a lesser extent, other EU citizens) so as to gauge thecorrelation between overall labour market situations and those ofTCNs. Comments on exclusion and inclusion within the labourmarket should thus take into account prevailing economiccircumstances. This connection should be understood in terms ofour previous argument that inclusion within the labour marketshould be seen as corollary of economic competitiveness moregenerally.
The more detailed data has largely been drawn from a singlequarter – the second of 2003. It thus represents a “snapshot”of thecircumstances TCNs and policy-makers face, and the discrepanciesnoted will clearly vary over time. In the case of employment andunemployment rates, we have included graphs showing thisvariation, which can (as in the case of Portugal) be significant.However, the “snapshot” technique should allow for concretecomparisons between countries in similar economic circumstances,opening new paths for research and analysis.
In analysing the policy indicators discussed in Chapter 5, ourcountry profiles focus on their constituent elements:� Within labour market inclusion: access and eligibility; security ofemployment status; labour market integration measures; and rightsassociated with labour market participation.� Within long-term residence: eligibility; conditions for acquisitionof status; security of status; and rights associated with status� Within family reunion: eligibility; conditions for acquisition ofstatus; security of status; and rights associated with status� Within nationality: eligibility; conditions for acquisition of
Policy indicators
35950 I-50 V2 18/3/05 1:41 PM Page 40
41
Co
un
try
Re
sult
s an
d P
rofi
les
status; security of status; and rights associated with status� Within anti-discrimination: definitions and scope; remedies andsanctions; equality agencies and pro-active policies.
Each country’s overall strand score, as shown in Chapter 5, isbased on the average of the four constituent elements within it. Atthe simplest level, these country profiles permit the reader to see howa score was reached. Each profile includes bar graphs for each strand,showing how a country performed on each element. These arepresented relative to European averages and the scale ofunfavourable to favourable scores set out in the previous chapter.The country profiles thus allow us to apply our normativeframework at a greater level of detail than before.
But it is possible to present the normative indicators in ways thatprovide a stronger sense of each country’s position. As previouslynoted, each strand (with the partial exception of anti-discrimination) can be understood as containing a pathway fromeligibility, via acquisition and security of status, to particular rights.There will be considerable differences between these: in some cases, ahigh degree of eligibility may lead to only limited security and rights,or vice versa.
The experience of a migrant in a given country will befundamentally affected by the nature of the legal pathways open tohim or her. Each profile thus contains a graph showing each strandin linear form. The shape of these lines offers a clearer indication ofweaknesses and strengths within a strand – and how these mightaffect individuals over time.
It is further possible to combine these lines into a single imagethat indicates a country’s overall performance on policy indicators.Each profile opens with a radar graph, in which the elements ofpolicy indicators are shown in terms of a continuous line betweenpoints within a circle. Each point represents a constituent element ofan indicator, and the edge of the circle represents the most favourablescore (3.00) possible for each element.
Overall, the radar graph allows the reader to see the balancewithin a country’s performance on policy indicators. It may reachtowards the edge of the circle in one area, but not in others,suggesting where there is particular need for policy reform. Ourradar graphs thus provide the clearest statement of a country’sperformance on policy relative to our normative framework.
35950 I-50 V2 18/3/05 1:41 PM Page 41

42
35950 I-50 V2 18/3/05 1:41 PM Page 42

43
Austria country profile
0.00
1.00
2.00
3.00
EligibilitySecurity of Employment Status
Labour Market Integration Measures
Rights Associated with Labour Market Participation
Eligibility for Status
Conditions for Acquisition of Status
Security of Status
Rights Associated with Status
Eligibility for Status
Conditions for Acquisition of Status
Security of StatusRights Associated with Status
Eligibility for Status
Conditions for Acquisition of Status
Security of Status
Dual Nationality
Definitions and Scope
Remedies and Sanctions
Equality Agencies
Pro-active Policies
Labour Market Inclusion Long-term Residence
Nationailty Anti-Discrimination
Family Reunion
Figure 6.01 Overview of Austria’s Indicators
In 2001, Austria was host to 764,000 foreigners (9.3% of thepopulation), including 329,000 foreign workers (10.5% of theworkforce).24 Of the overall foreign population, more than four-fifths were nationals of states beyond the then borders of the EU. Themain sources of foreign workers were Croatia, Bosnia and Turkey.
The Austrian political debate has recently has had a strongemphasis on “integration”, the implementation of which devolves in
Background
24 Data in thisparagraph is drawnfrom OECD, Trends in InternationalMigration, AnnualReport 2003 (Paris,2003), pp158-161. A
ust
ria
cou
ntr
y p
rofi
le
35950 I-50 V2 18/3/05 1:41 PM Page 43

44
large part to the regional level.25
Austrian law regarding the temporary and permanentemployment and residence for TCNs underwent a comprehensiverevision in 2002. Immigration is controlled through a quota systemthat emphasises a clear distinction between the rights of highly-skilled workers admissible for permanent residence and otherworkers admissible for temporary residence and employment. Inthis context:
The reform of the Aliens Act of 2002 above all reduced immigrationfor economic purposes to key personnel and highly qualified employeesand self-employed persons. No further immigration includingpermanent residence is possible for other types of employment.26
Aside from these skilled groups, and certain other exceptionalcategories of workers, TCNs may receive temporary six-month workand residence permits, renewable for a further six months. Thosewith such permits do not have access to certain rights, such as familyreunion.
Overall, employment and unemployment rates for TCNs in Austriaare relatively close to those of Austrian nationals. However, it isobservable that the TCN employment has declined relative to a fairlystatic overall employment rate. Recent trends show a significantworsening of the labour market situation for TCNs withsimultaneously decreasing employment rates (falling from 67.5% in2002 to 58.5% in 2004) and increasing unemployment rates (justunder 10% in 2002 to over 13% in 2004).
Employment of people between 15 and 64 years old (%)
Labour market statistics27
Total Nationals Non EU15 Other EU15
2002q01 2003q01 2004q01
50
55
60
65
70
7525 The followingparagraphs arebased on K.Königand B. Perchinig,Austria, in the EU andUS Approaches tothe Management ofImmigration series(Migration PolicyGroup, Brussels,2003).26 Ibid., p16.27 EUROSTAT,Labour Force Survey
35950 I-50 V2 18/3/05 1:41 PM Page 44
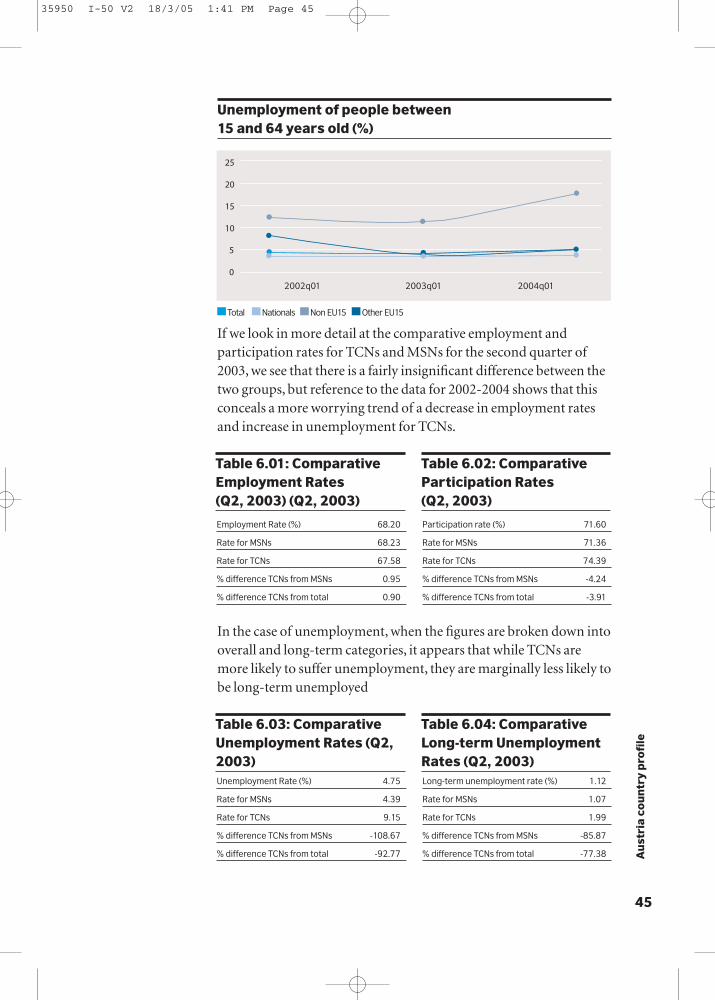
45
Au
stri
a co
un
try
pro
file
Unemployment of people between 15 and 64 years old (%)
If we look in more detail at the comparative employment andparticipation rates for TCNs and MSNs for the second quarter of2003, we see that there is a fairly insignificant difference between thetwo groups, but reference to the data for 2002-2004 shows that thisconceals a more worrying trend of a decrease in employment ratesand increase in unemployment for TCNs.
In the case of unemployment, when the figures are broken down intooverall and long-term categories, it appears that while TCNs aremore likely to suffer unemployment, they are marginally less likely tobe long-term unemployed
Table 6.01: ComparativeEmployment Rates (Q2, 2003) (Q2, 2003)
Table 6.02: ComparativeParticipation Rates (Q2, 2003)
Employment Rate (%) 68.20
Rate for MSNs 68.23
Rate for TCNs 67.58
% difference TCNs from MSNs 0.95
% difference TCNs from total 0.90
Participation rate (%) 71.60
Rate for MSNs 71.36
Rate for TCNs 74.39
% difference TCNs from MSNs -4.24
% difference TCNs from total -3.91
Unemployment Rate (%) 4.75
Rate for MSNs 4.39
Rate for TCNs 9.15
% difference TCNs from MSNs -108.67
% difference TCNs from total -92.77
Long-term unemployment rate (%) 1.12
Rate for MSNs 1.07
Rate for TCNs 1.99
% difference TCNs from MSNs -85.87
% difference TCNs from total -77.38
Total Nationals Non EU15 Other EU15
2002q01 2003q01 2004q01
0
5
10
15
20
25
Table 6.03: ComparativeUnemployment Rates (Q2,2003)
Table 6.04: ComparativeLong-term UnemploymentRates (Q2, 2003)
35950 I-50 V2 18/3/05 1:41 PM Page 45

46
However, these aggregate statistics further conceal significantvariations between levels of registered unemployment and different categories of employment and skill level. Looking in greaterdetail at types of employment for TCN’s, there is an over-representation in lower-skilled and, to a lesser extent, medium-skilled employment – while conversely they are under-represented in high-skilled employment (Table 6.05). These differences may be related to the present legal framework for work and residence rights:
Table 6.05: Comparative Rates for Employment accordingto Skill (figures for Q2, 2003)
Low Medium High
Total employment rate 46.90 73.69 84.42
Rate for MSNs 45.07 73.51 84.84
Rate for TCNs 57.60 78.81 76.14
% difference TCNs from MSNs -27.80 -7.20 10.26
% difference TCNs from total -22.81 -6.94 9.80
The differences between TCN experience in types of employmentmay further be linked to contrasts between TCN and Austriannationals in permanent and temporary employment. While thedifference between rates of TCNs and Austrian nationals in terms ofpermanent contract-holders is relatively slight, there is a moremarked contrast in the rates of temporary contract-holders:
Table 6.06: Comparison of Employment by Type of Contract(Q2, 2003)
Permanent Contract Temporary Contract
Total % in type of contract 92.79 7.21
% of MSNs in type of contract 92.95 7.05
% of TCNs in type of contract 91.91 8.09
% difference TCNs from MSNs 1.12 -14.79
% difference TCNs from total 0.95 -12.26
Austria policy-makers may, therefore, wish to address potentialquestions over the links between types of work and residence and theprofile of TCN employment. A clue is given when we look atnumbers receiving training – while a significant number of TCNs arerecorded as receiving training in the four weeks prior to the labourforce survey, the rate is below that of Austrian nationals:
35950 I-50 V2 18/3/05 1:41 PM Page 46

47
Au
stri
a co
un
try
pro
file
Table 6.07: Proportion of workers having receivedtraining in 4 weeks previous to survey (Q2, 2003)
Country-wide proportion receiving training in previous 4 wks 16.87
Percentage of MSNs receiving training in last 4 wks 17.19
Percentage of TCNs receiving training in last 4 wks 12.28
Percentage difference TCNs from MSNs 28.57
Percentage difference TCNs from total 27.24
Overall, therefore, we see a picture of relatively good but decliningemployment rates for TCNs with an increase in the rate ofunemployment confirming structural difficulties in Austria with theincorporation of migrants into the economy. A more detailedexamination of employment data shows that TCNs areproportionally more highly represented in lower skilled occupationscombined with lower levels of training which might suggest possiblecauses for the greater exposure to unemployment for this groupwhen compared with Austrian nationals.
Overall performanceAustria’s performance over all five strands of policy indicators isbelow the European average for each strand. It is closest to theaverage in terms of long-term residence, and furthest from theaverage in terms of labour market inclusion.
Judged against our normative framework, Austria can be said todemonstrate less favourable performances in all strands.
Figure 6.03 Comparative Performance: Austria and EU Averages
Policy indicators
0.00
2.192.18 2.182.02
2.16
0.50
1.00
1.50
2.00
2.50
3.00
Eur Aus
Labour Market Inclusion Long-term Residence Nationailty Anti-DiscriminationFamily Reunion
1.892.04
1.84 1.88 1.85
35950 I-50 V2 18/3/05 1:41 PM Page 47

48
Austria typically offers relatively high levels of security in each strand(although its anti-discrimination performance is more generallylow). However, it tends to be below the European average either interms of the conditions necessary to achieve a given status, or therights associated with status.
On labour market inclusion, Austria is most obviously beneaththe European average in terms of access and eligibility (where itsscore is moderately unfavourable), although also below-average onother strands. It nonetheless has a moderately favourableperformance on security of employment status.
In terms of eligibility for long-term residence, as well assecurity of status, Austria is above the European average. However, interms of conditions and rights associated with long-term residence,it is marginally below the average – all its scores in this strand fallinto the less favourable category.
Above the European average in terms of both eligibility forfamily reunion and security of status (on which it scores particularlywell), it performs notably poorly on both the conditions and rightsassociated with family reunion. In terms of conditions for theacquisition of status, Austria’s performance is unfavourable.
Austria performs moderately favourably in terms of security ofnationality, but has areas of weakness in terms of eligibility andconditions for acquisition of nationality.Anti-discrimination is an area of particular weakness, withperformance below the European average across all sections, mostclearly pro-active policies, definitions and scope. In all cases,Austria’s scores are less favourable or moderately unfavourable.
35950 I-50 V2 18/3/05 1:41 PM Page 48

49
Au
stri
a co
un
try
pro
file
Labour market inclusion
Figure 6.04: Labour Market Inclusion: Austrian Indicatorsand EU Averages
Long-term residence
Figure 6.05: Long-term Residence: Austrian Indicatorsand EU Averages
0.00
0.50
1.00
1.50
2.00
2.50
3.00
Labour MarketInclusion
Eligibility Security ofEmployment
Status
Integration measures inthe Labour
Market
Rights Associatedwith Labour Market
Participation
Eur Aus
2.18
1.891.82
1.33
2.632.50
2.17
2.00
2.27
2.00
0.00
0.50
1.00
1.50
2.00
2.50
3.00
Long-term Residence
Eligibilityfor Status
Conditionsfor Acquisition
of Status
Security of Status
Rights Associatedwith Status
Eur Aus
2.182.04
1.892.00
2.13
1.80
2.17 2.142.34
2.13
35950 I-50 V2 18/3/05 1:41 PM Page 49
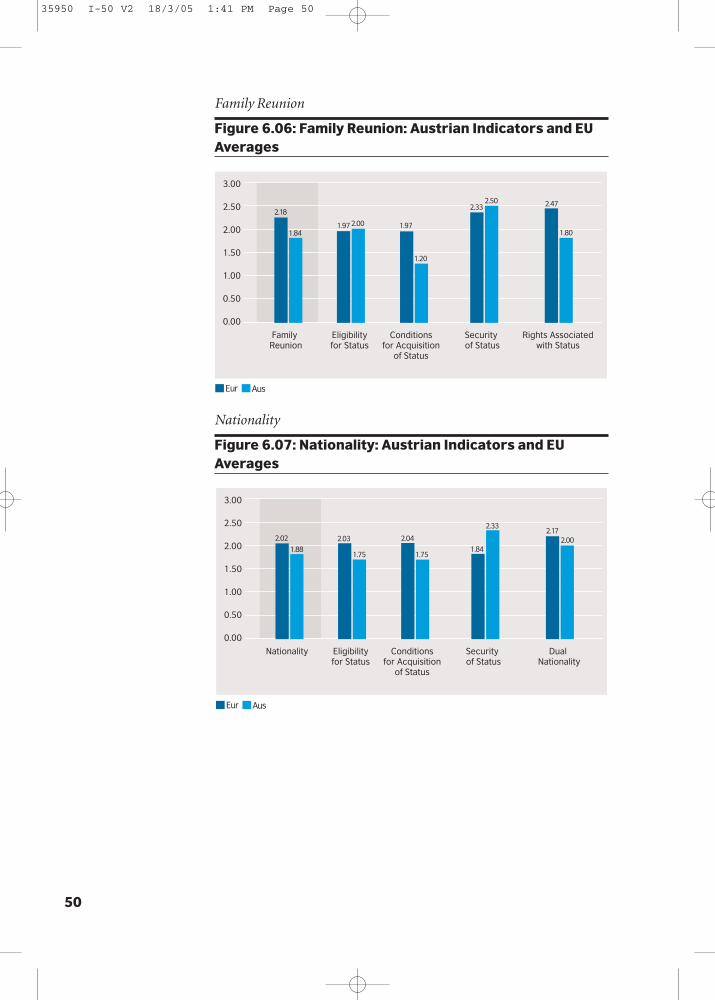
50
Family Reunion
Figure 6.06: Family Reunion: Austrian Indicators and EUAverages
Nationality
Figure 6.07: Nationality: Austrian Indicators and EUAverages
0.00
0.50
1.00
1.50
2.00
2.50
3.00
Nationality Eligibilityfor Status
Conditionsfor Acquisition
of Status
Security of Status
Dual Nationality
Eur Aus
2.02
1.88 1.84
2.03
1.75 1.75
2.04
2.332.17
2.00
0.00
0.50
1.00
1.50
2.00
2.50
3.00
Family Reunion
Eligibilityfor Status
Conditionsfor Acquisition
of Status
Security of Status
Rights Associatedwith Status
Eur Aus
2.18
1.841.97 1.972.00
1.20
2.332.50 2.47
1.80
35950 I-50 V2 18/3/05 1:41 PM Page 50

51
Au
stri
a co
un
try
pro
file
Anti-Discrimination
Figure 6.08: Anti-Discrimination: Austrian Indicators andEU Averages
0.00
0.50
1.00
1.50
2.00
2.50
3.00
Anti-Discrimination
Definitionsand scope
Remediesand
Sanctions
EqualityAgencies
Pro-activePolicies
Eur Aus
2.16
1.85 1.83
2.35
2.00 2.00
2.19
1.60
2.04
1.57
35950 51-176 18/3/05 1:51 PM Page 51
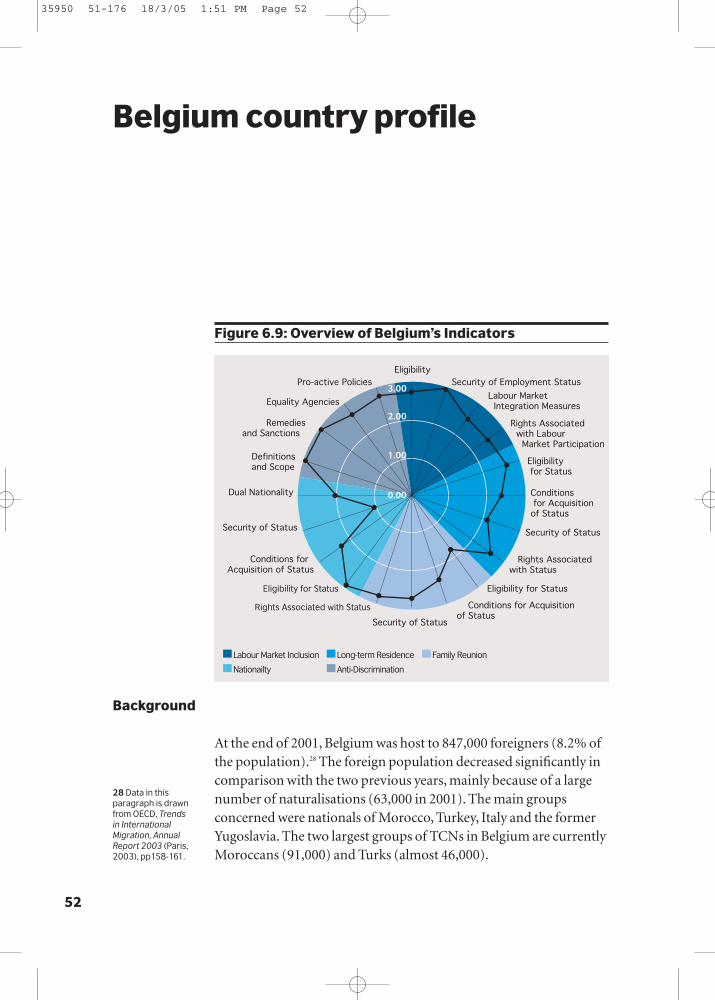
52
At the end of 2001, Belgium was host to 847,000 foreigners (8.2% ofthe population).28 The foreign population decreased significantly incomparison with the two previous years, mainly because of a largenumber of naturalisations (63,000 in 2001). The main groupsconcerned were nationals of Morocco, Turkey, Italy and the formerYugoslavia. The two largest groups of TCNs in Belgium are currentlyMoroccans (91,000) and Turks (almost 46,000).
Belgium country profile
0.00
1.00
2.00
3.00
EligibilitySecurity of Employment Status
Labour Market Integration Measures
Rights Associated with Labour Market Participation
Eligibility for Status
Conditions for Acquisition of Status
Security of Status
Rights Associated with Status
Eligibility for Status
Conditions for Acquisition of Status
Security of StatusRights Associated with Status
Eligibility for Status
Conditions for Acquisition of Status
Security of Status
Dual Nationality
Definitions and Scope
Remedies and Sanctions
Equality Agencies
Pro-active Policies
Labour Market Inclusion Long-term Residence
Nationailty Anti-Discrimination
Family Reunion
Figure 6.9: Overview of Belgium’s Indicators
Background
28 Data in thisparagraph is drawnfrom OECD, Trends in InternationalMigration, AnnualReport 2003 (Paris,2003), pp158-161.
35950 51-176 18/3/05 1:51 PM Page 52

53
Be
lgiu
m c
ou
ntr
y p
rofi
le
Belgium’s policies towards TCNs have been significantly affected bythe country’s high degree of devolution to its French and Dutch-speaking parts. 29 Indeed, it is arguable that “there is no such thing asa Belgian integration policy”. At the federal level, access to citizenshiphas been seen as an important way to create some coherence in thisarea. In 2000, legislation was introduced to make access tocitizenship and naturalisation easier – some questions remain overits implementation.
The Belgian work permit system for TCNs is based on the needsof employers: permits should only be given where there are insufficientworkers available for the sector or specialisation in question.
TCNs in Belgium face a number of economic challenges. Theyexperience considerably lower rates of employment andparticipation than Belgian nationals. Figures for the last three yearsreveal this to be a constant and relatively unchanging pattern,suggesting that this reflects structural problems in terms of thelabour market inclusion of the migrant population.
Figure 6.10: Employment trendsEmployment of people between 15 & 64 years old (%)
Again, the unemployment rates for TCNs and MSNs shows apersistent pattern of difference over the last few years, although thequarterly data reveals fluctuations that may reflect seasonalemployment patterns for this group.
Labour market statistics
Total Nationals Non EU15 Other EU15
2002q01 2002q02 2002q03 2002q04 2003q01 2003q02 2003q03 2003q04 2004q012004q02
0
10
20
30
40
50
60
70
29 The followingparagraphs arebased on S. Gsir, M. Martiniello and J. Wets, Belgium, in the EU and USApproaches to the Management of Immigrationseries (MigrationPolicy Group,Brussels, 2003).
35950 51-176 18/3/05 1:51 PM Page 53
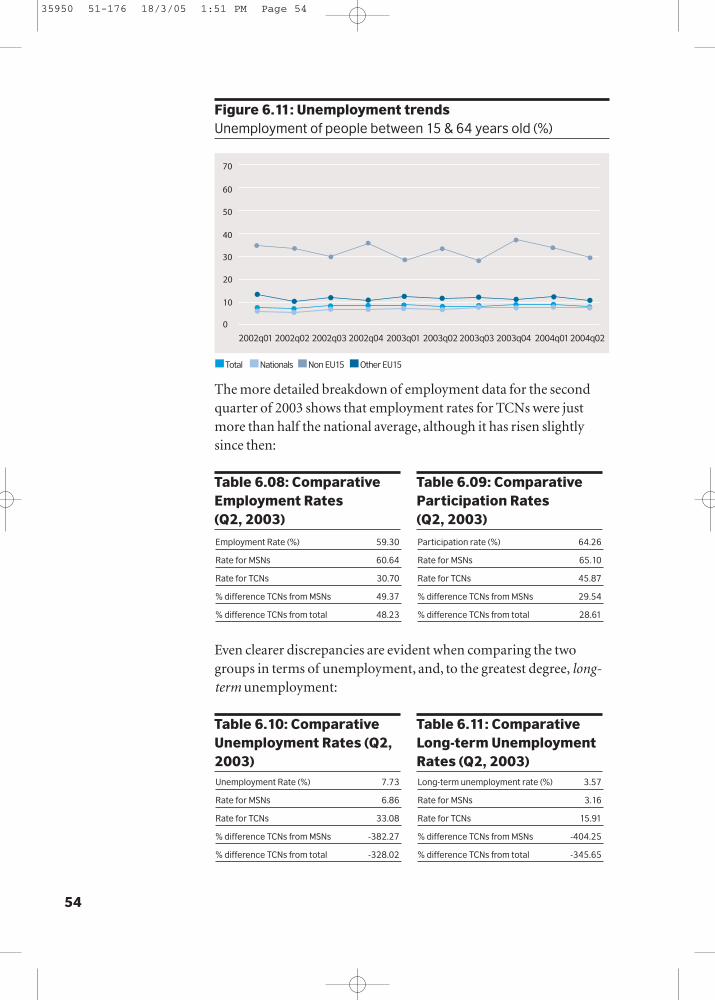
54
Figure 6.11: Unemployment trendsUnemployment of people between 15 & 64 years old (%)
The more detailed breakdown of employment data for the secondquarter of 2003 shows that employment rates for TCNs were justmore than half the national average, although it has risen slightlysince then:
Even clearer discrepancies are evident when comparing the twogroups in terms of unemployment, and, to the greatest degree, long-term unemployment:
Total Nationals Non EU15 Other EU15
2002q01 2002q02 2002q03 2002q04 2003q01 2003q02 2003q03 2003q04 2004q012004q02
0
10
20
30
40
50
60
70
Table 6.08: ComparativeEmployment Rates (Q2, 2003)
Table 6.09: ComparativeParticipation Rates (Q2, 2003)
Employment Rate (%) 59.30
Rate for MSNs 60.64
Rate for TCNs 30.70
% difference TCNs from MSNs 49.37
% difference TCNs from total 48.23
Participation rate (%) 64.26
Rate for MSNs 65.10
Rate for TCNs 45.87
% difference TCNs from MSNs 29.54
% difference TCNs from total 28.61
Unemployment Rate (%) 7.73
Rate for MSNs 6.86
Rate for TCNs 33.08
% difference TCNs from MSNs -382.27
% difference TCNs from total -328.02
Long-term unemployment rate (%) 3.57
Rate for MSNs 3.16
Rate for TCNs 15.91
% difference TCNs from MSNs -404.25
% difference TCNs from total -345.65
Table 6.10: ComparativeUnemployment Rates (Q2,2003)
Table 6.11: ComparativeLong-term UnemploymentRates (Q2, 2003)
35950 51-176 18/3/05 1:51 PM Page 54
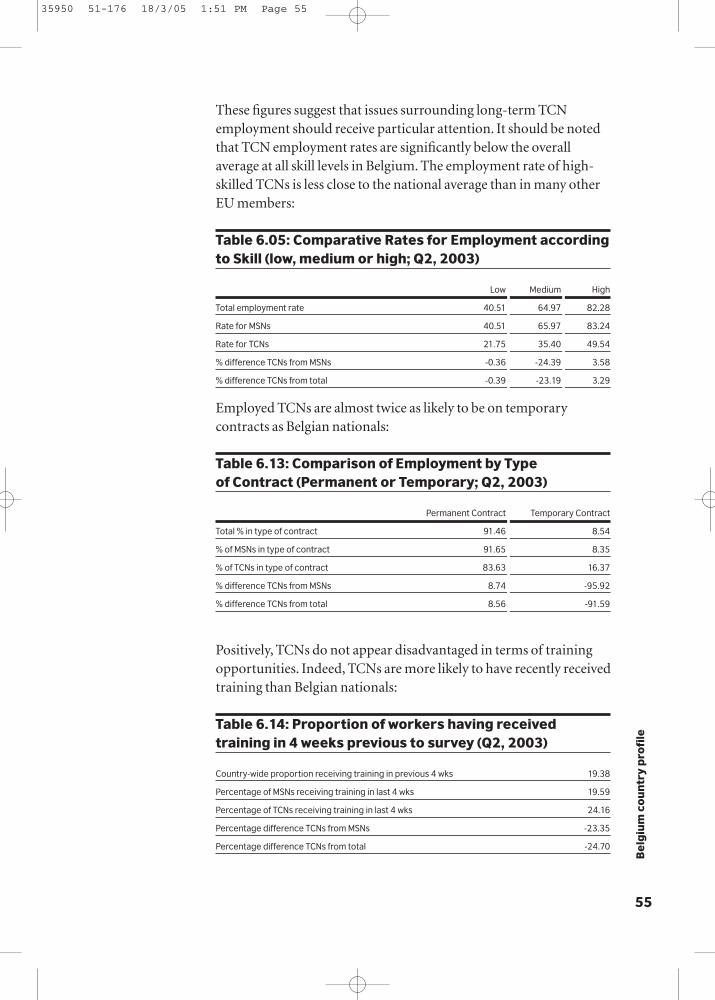
55
Be
lgiu
m c
ou
ntr
y p
rofi
le
These figures suggest that issues surrounding long-term TCNemployment should receive particular attention. It should be notedthat TCN employment rates are significantly below the overallaverage at all skill levels in Belgium. The employment rate of high-skilled TCNs is less close to the national average than in many otherEU members:
Table 6.05: Comparative Rates for Employment accordingto Skill (low, medium or high; Q2, 2003)
Low Medium High
Total employment rate 40.51 64.97 82.28
Rate for MSNs 40.51 65.97 83.24
Rate for TCNs 21.75 35.40 49.54
% difference TCNs from MSNs -0.36 -24.39 3.58
% difference TCNs from total -0.39 -23.19 3.29
Employed TCNs are almost twice as likely to be on temporarycontracts as Belgian nationals:
Table 6.13: Comparison of Employment by Type of Contract (Permanent or Temporary; Q2, 2003)
Permanent Contract Temporary Contract
Total % in type of contract 91.46 8.54
% of MSNs in type of contract 91.65 8.35
% of TCNs in type of contract 83.63 16.37
% difference TCNs from MSNs 8.74 -95.92
% difference TCNs from total 8.56 -91.59
Positively, TCNs do not appear disadvantaged in terms of trainingopportunities. Indeed, TCNs are more likely to have recently receivedtraining than Belgian nationals:
Table 6.14: Proportion of workers having receivedtraining in 4 weeks previous to survey (Q2, 2003)
Country-wide proportion receiving training in previous 4 wks 19.38
Percentage of MSNs receiving training in last 4 wks 19.59
Percentage of TCNs receiving training in last 4 wks 24.16
Percentage difference TCNs from MSNs -23.35
Percentage difference TCNs from total -24.70
35950 51-176 18/3/05 1:51 PM Page 55
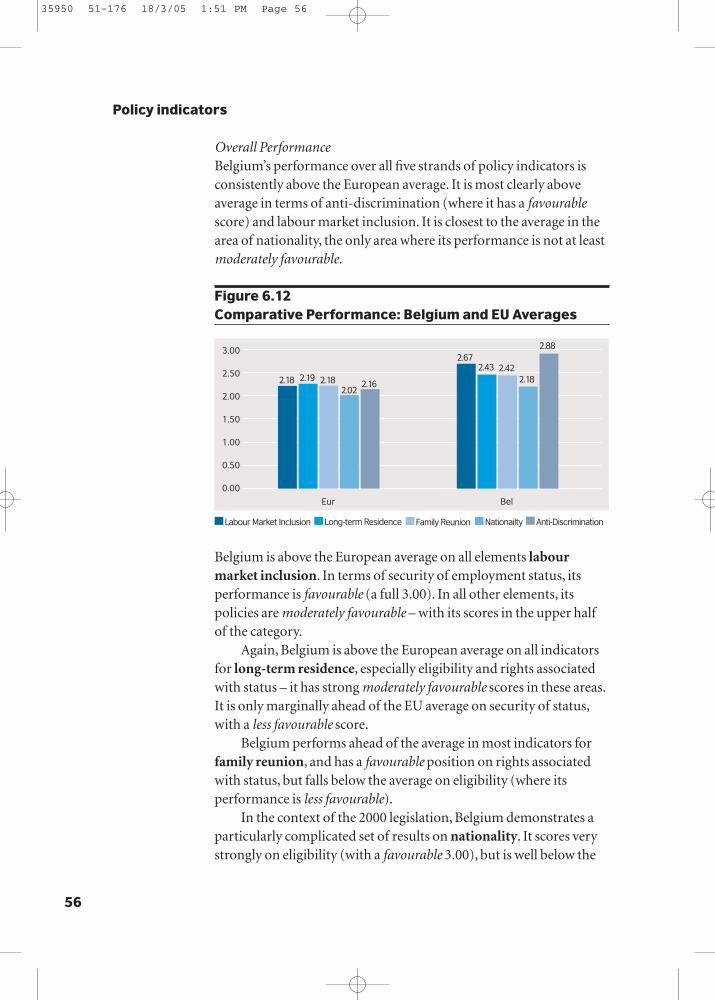
56
Overall Performance Belgium’s performance over all five strands of policy indicators isconsistently above the European average. It is most clearly aboveaverage in terms of anti-discrimination (where it has a favourablescore) and labour market inclusion. It is closest to the average in thearea of nationality, the only area where its performance is not at leastmoderately favourable.
Figure 6.12 Comparative Performance: Belgium and EU Averages
Belgium is above the European average on all elements labourmarket inclusion. In terms of security of employment status, itsperformance is favourable (a full 3.00). In all other elements, itspolicies are moderately favourable – with its scores in the upper halfof the category.
Again, Belgium is above the European average on all indicatorsfor long-term residence, especially eligibility and rights associatedwith status – it has strong moderately favourable scores in these areas.It is only marginally ahead of the EU average on security of status,with a less favourable score.
Belgium performs ahead of the average in most indicators forfamily reunion, and has a favourable position on rights associatedwith status, but falls below the average on eligibility (where itsperformance is less favourable).
In the context of the 2000 legislation, Belgium demonstrates aparticularly complicated set of results on nationality. It scores verystrongly on eligibility (with a favourable 3.00), but is well below the
Policy indicators
0.00
2.192.18 2.182.02
2.16
0.50
1.00
1.50
2.00
2.50
3.00
Eur Bel
Labour Market Inclusion Long-term Residence Nationailty Anti-DiscriminationFamily Reunion
2.672.43 2.42
2.18
2.88
35950 51-176 18/3/05 1:51 PM Page 56
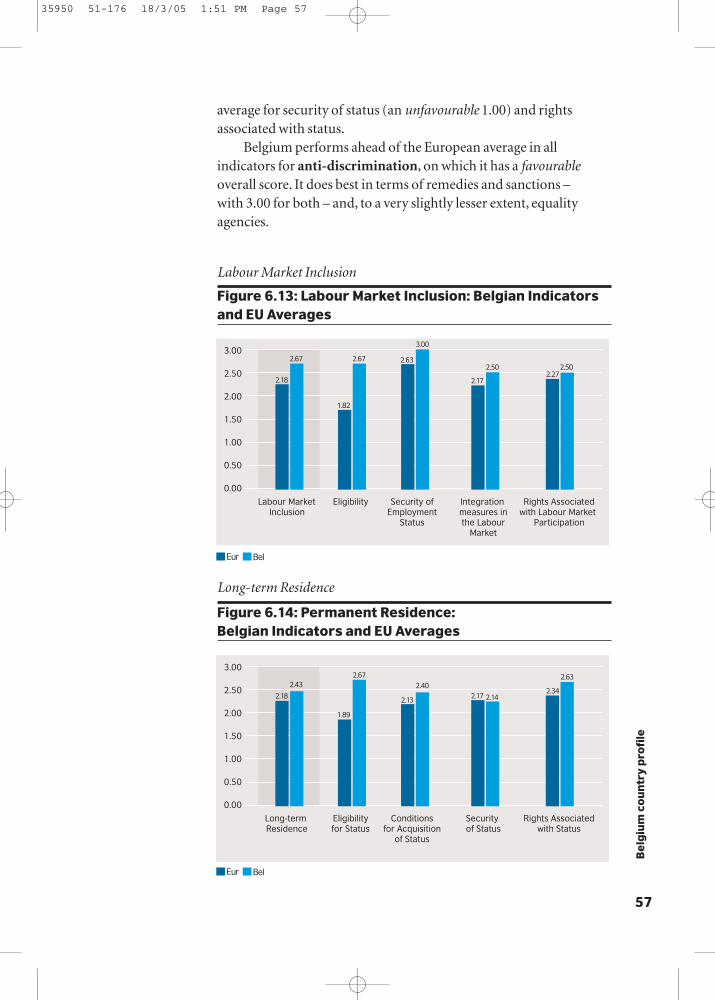
57
Be
lgiu
m c
ou
ntr
y p
rofi
le
average for security of status (an unfavourable 1.00) and rightsassociated with status.
Belgium performs ahead of the European average in allindicators for anti-discrimination, on which it has a favourableoverall score. It does best in terms of remedies and sanctions – with 3.00 for both – and, to a very slightly lesser extent, equalityagencies.
Labour Market Inclusion
Figure 6.13: Labour Market Inclusion: Belgian Indicatorsand EU Averages
Long-term Residence
Figure 6.14: Permanent Residence:Belgian Indicators and EU Averages
0.00
0.50
1.00
1.50
2.00
2.50
3.00
Labour MarketInclusion
Eligibility Security ofEmployment
Status
Integration measures inthe Labour
Market
Rights Associatedwith Labour Market
Participation
Eur Bel
2.18
2.67 2.67
1.82
2.63
3.00
2.17
2.50 2.502.27
0.00
0.50
1.00
1.50
2.00
2.50
3.00
Long-term Residence
Eligibilityfor Status
Conditionsfor Acquisition
of Status
Security of Status
Rights Associatedwith Status
Eur Bel
2.18
2.43
1.89
2.67
2.13
2.402.17 2.14
2.34
2.63
35950 51-176 18/3/05 1:51 PM Page 57
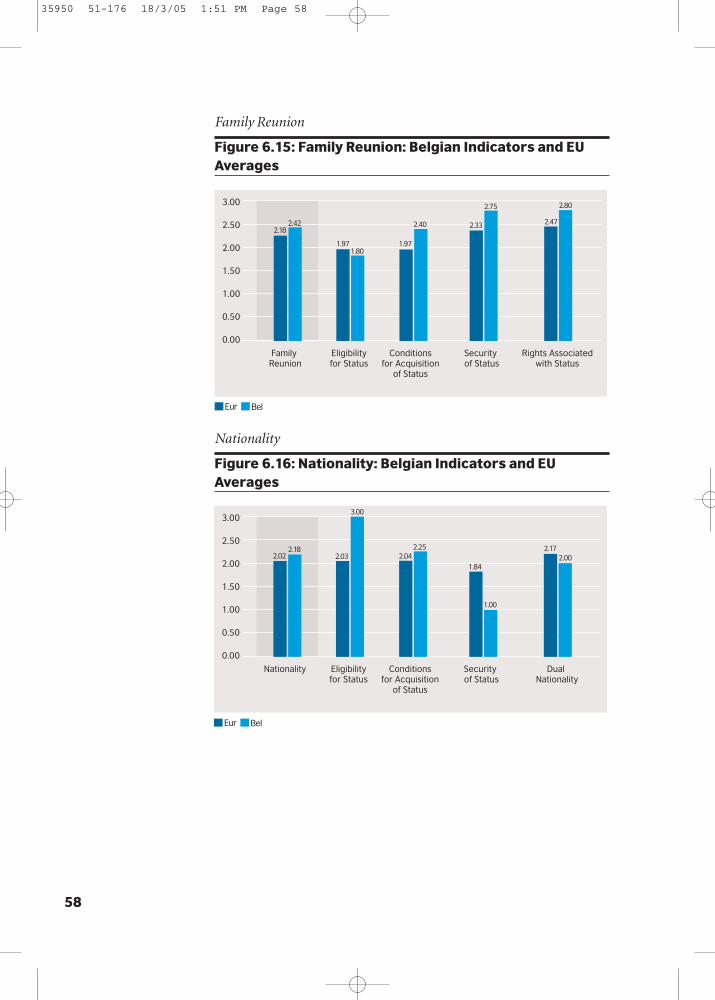
58
Family Reunion
Figure 6.15: Family Reunion: Belgian Indicators and EUAverages
Nationality
Figure 6.16: Nationality: Belgian Indicators and EUAverages
0.00
0.50
1.00
1.50
2.00
2.50
3.00
Family Reunion
Eligibilityfor Status
Conditionsfor Acquisition
of Status
Security of Status
Rights Associatedwith Status
Eur Bel
2.182.42
1.97 1.971.80
2.40 2.33
2.75
2.47
2.80
0.00
0.50
1.00
1.50
2.00
2.50
3.00
Nationality Eligibilityfor Status
Conditionsfor Acquisition
of Status
Security of Status
Dual Nationality
Eur Bel
2.022.18
1.84
2.03
3.00
2.252.04
1.00
2.172.00
35950 51-176 18/3/05 1:51 PM Page 58

59
Be
lgiu
m c
ou
ntr
y p
rofi
le
Anti-Discrimination
Figure 6.17: Anti-Discrimination: Belgian Indicators andEU Averages
0.00
0.50
1.00
1.50
2.00
2.50
3.00
Anti-Discrimination
Definitionsand scope
Remediesand
Sanctions
EqualityAgencies
Pro-activePolicies
Eur Bel
2.16
2.88
1.83
2.35
3.00 3.00
2.19
2.60
2.04
2.71
35950 51-176 18/3/05 1:51 PM Page 59

60
At the end of 2001, Denmark was host to 266,700 foreigners (5% ofthe population).30 EU nationals accounted for a fifth of the foreignpopulation, followed by nationals from the former Yugoslavia(13%), Turkey (12%), and Iraq (6%). There were also 415,000immigrants (including those who had been naturalised) anddescendants of immigrants living in Denmark (7.7% of thepopulation).
The 1992 Danish opt-out in the sector of Justice and Home
Denmark country profile
0.00
1.00
2.00
3.00
EligibilitySecurity of Employment Status
Labour Market Integration Measures
Rights Associated with Labour Market Participation
Eligibility for Status
Conditions for Acquisition of Status
Security of Status
Rights Associated with Status
Eligibility for Status
Conditions for Acquisition of Status
Security of StatusRights Associated with Status
Eligibility for Status
Conditions for Acquisition of Status
Security of Status
Dual Nationality
Definitions and Scope
Remedies and Sanctions
Equality Agencies
Pro-active Policies
Labour Market Inclusion Long-term Residence
Nationailty Anti-Discrimination
Family Reunion
Figure 6.18: Overview of Denmark’s Indicators
Background
30 Data in thisparagraph is drawnfrom OECD, Trends in InternationalMigration, AnnualReport 2003 (Paris,2003), pp158-161.
35950 51-176 18/3/05 1:51 PM Page 60

61
De
nm
ark
cou
ntr
y p
rofi
le
Affairs – coupled with an opt-out on European citizenship – affectscommentary on migration and inclusion issues considerably.31 Whilethe Danish Presidency of the EU made a positive reference to theeconomic and social inclusion of TCNs in 2002, this remains anextremely sensitive area in domestic political debate.
Some highly-skilled and specialised workers aside, TCNswishing to work in Denmark must apply for short-term renewable work-permits, and applications are subject to rigorous scrutiny. Permanent residence may become possible after seven years.
TCNs experience significant problems within the labour marketrelative to Danish citizens.In the period 2002-2004, the TCNemployment rates were constantly below those of Danish nationalsand other EU-15 nationals, although there is significant fluctuationfor this group along with that of other EU-15 while the total forDenmark remained relatively flat. This could be explained by therelatively small number of foreign nationals resident in Denmarkresulting in more statistical variation for these groups.
Figure 6.19: Employment trendsEmployment of people between 15 & 64 years old (%)
The employment rate for TCNs for the second quarter of 2003 wasonly just more than 50% of that for Danes, while there was also aclear discrepancy in terms of participation:
Labour market statistics
Total Nationals Non EU15 Other EU15
2002q01 2002q02 2002q03 2002q04 2003q01 2003q02 2003q03 2003q04 2004q012004q02
40
50
60
70
80
90
100
31 The followingparagraphs arebased on H. Stenum,Denmark, in the EUand US Approachesto the Managementof Immigration series(Migration PolicyGroup, Brussels,2003).
35950 51-176 18/3/05 1:51 PM Page 61

In terms of unemployment, the discrepancies are clearer still, withTCN unemployment rates at more than three times the national rate.Observed over 2002-2004, moreover, the TCN unemployment ratehas risen significantly against the national rate:
Figure 6.20: Unemployment trendsUnemployment of people between 15 & 64 years old (%)
For the second quarter of 2003, the percentage difference for long-term unemployment is greater still, although relative to a low overallrate:
62
Table 6.15: ComparativeEmployment Rates (Q2, 2003)
Table 6.16: ComparativeParticipation Rates (Q2, 2003)
Employment Rate (%) 75.11
Rate for MSNs 75.97
Rate for TCNs 47.83
% difference TCNs from MSNs 37.05
% difference TCNs from total 36.32
Participation rate (%) 79.45
Rate for MSNs 80.08
Rate for TCNs 58.71
% difference TCNs from MSNs 26.68
% difference TCNs from total 26.10
Total Nationals Non EU15
2002q01 2002q02 2002q03 2002q04 2003q01 2003q02 2003q03 2003q04 2004q012004q02
0
5
10
15
20
25
Unemployment Rate (%) 5.46
Rate for MSNs 5.13
Rate for TCNs 18.54
% difference TCNs from MSNs -261.61
% difference TCNs from total -239.69
Long-term unemployment rate (%) 1.07
Rate for MSNs 0.96
Rate for TCNs 4.90
% difference TCNs from MSNs -411.22
% difference TCNs from total -356.28
Table 6.17: ComparativeUnemployment Rates (Q2, 2003)
Table 6.18: ComparativeLong-term UnemploymentRates (Q2, 2003)
35950 51-176 18/3/05 1:51 PM Page 62

63
De
nm
ark
cou
ntr
y p
rofi
le
While there are discrepancies at all levels of employment, it is notablethat TCNs are least disadvantaged in terms of medium-skilled work,and most disadvantaged in the low-skilled sector:
Table 6.19: Comparative Rates for Employment accordingto Skill (low, medium or high; Q2, 2003)
Low Medium High
Total employment rate 57.53 78.73 84.80
Rate for MSNs 58.50 79.30 85.85
Rate for TCNs 37.02 56.12 53.60
% difference TCNs from MSNs 36.72 29.23 37.57
% difference TCNs from total 35.66 28.71 36.79
In terms of contract type, TCNs are significantly less likely to holdpermanent contracts than Danish nationals, with a third holdingtemporary positions:
Table 6.20: Comparison of Employment by Type of Contract (Permanent or Temporary; Q2, 2003)
Permanent Contract Temporary Contract
Total % in type of contract 90.44 9.44
% of MSNs in type of contract 90.90 8.98
% of TCNs in type of contract 67.31 32.38
% difference TCNs from MSNs 25.95 -260.37
% difference TCNs from total 25.58 -243.02
Training is an area of strength for Denmark. While Danish nationalsenjoy a high degree of training, an even higher percentage of TCNsreceive it. While there are clear challenges to the position of TCNswithin the Danish labour market, therefore, there are some factors toredress them:
Table 6.21: Proportion of workers having receivedtraining in 4 weeks previous to survey (Q2, 2003)
Country-wide proportion receiving training in previous 4 wks 27.67
Percentage of MSNs receiving training in last 4 wks 27.28
Percentage of TCNs receiving training in last 4 wks 42.88
Percentage difference TCNs from MSNs -57.20
Percentage difference TCNs from total -55.00
35950 51-176 18/3/05 1:51 PM Page 63
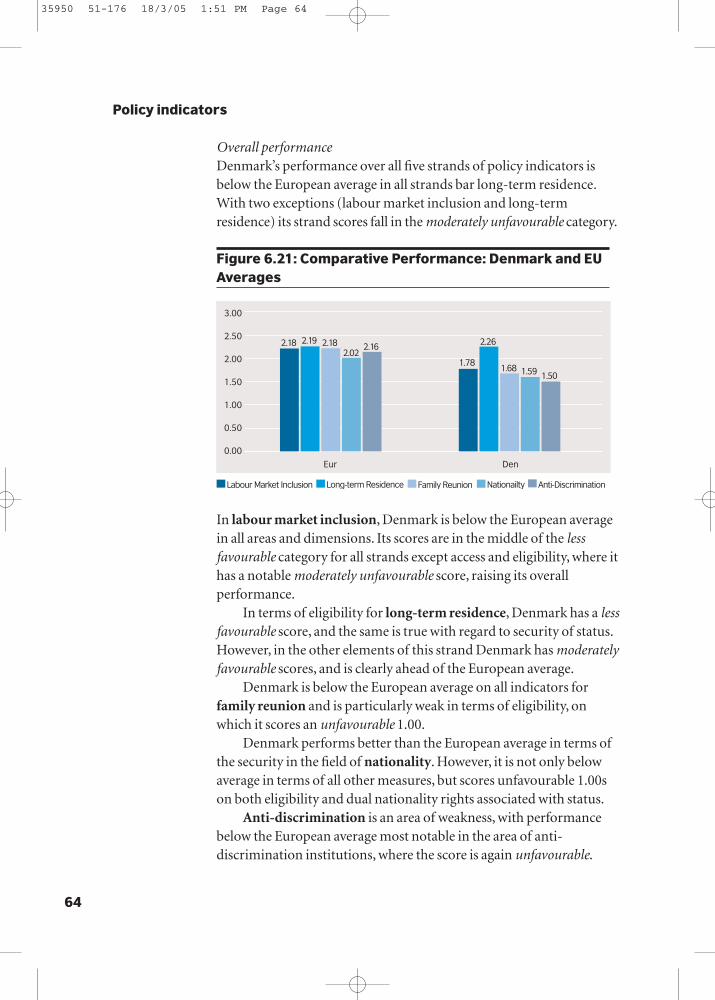
64
Overall performanceDenmark’s performance over all five strands of policy indicators isbelow the European average in all strands bar long-term residence.With two exceptions (labour market inclusion and long-termresidence) its strand scores fall in the moderately unfavourable category.
Figure 6.21: Comparative Performance: Denmark and EUAverages
In labour market inclusion, Denmark is below the European averagein all areas and dimensions. Its scores are in the middle of the lessfavourable category for all strands except access and eligibility, where ithas a notable moderately unfavourable score, raising its overallperformance.
In terms of eligibility for long-term residence, Denmark has a lessfavourable score, and the same is true with regard to security of status.However, in the other elements of this strand Denmark has moderatelyfavourable scores, and is clearly ahead of the European average.
Denmark is below the European average on all indicators forfamily reunion and is particularly weak in terms of eligibility, onwhich it scores an unfavourable 1.00.
Denmark performs better than the European average in terms ofthe security in the field of nationality. However, it is not only belowaverage in terms of all other measures, but scores unfavourable 1.00son both eligibility and dual nationality rights associated with status.
Anti-discrimination is an area of weakness, with performancebelow the European average most notable in the area of anti-discrimination institutions, where the score is again unfavourable.
Policy indicators
0.00
2.192.18 2.182.02
2.16
0.50
1.00
1.50
2.00
2.50
3.00
Eur Den
Labour Market Inclusion Long-term Residence Nationailty Anti-DiscriminationFamily Reunion
1.78
2.26
1.68 1.59 1.50
35950 51-176 18/3/05 1:51 PM Page 64

65
De
nm
ark
cou
ntr
y p
rofi
le
Labour market inclusion
Figure 6.22: Labour Market Inclusion: Denmark’sIndicators and EU Averages
Long-term residence
Figure 6.23: Long-term Residence: Denmark’s Indicatorsand EU Averages
0.00
0.50
1.00
1.50
2.00
2.50
3.00
Long-term Residence
Eligibilityfor Status
Conditionsfor Acquisition
of Status
Security of Status
Rights Associatedwith Status
Eur Den
2.19 2.26
1.891.67
2.13
2.60
2.17
1.86
2.34
2.63
0.00
0.50
1.00
1.50
2.00
2.50
3.00
Labour MarketInclusion
Eligibility Security ofEmployment
Status
Integration measures inthe Labour
Market
Rights Associatedwith Labour Market
Participation
Eur Den
2.18
1.78
1.33
1.82
2.63
2.00
2.17
2.00 2.00
2.27
35950 51-176 18/3/05 1:51 PM Page 65

66
Family Reunion
Figure 6.24: Family Reunion: Denmark’s Indicators and EUAverages
Nationality
Figure 6.25: Nationality: Denmark’s Indicators and EUAverages
0.00
0.50
1.00
1.50
2.00
2.50
3.00
Family Reunion
Eligibilityfor Status
Conditionsfor Acquisition
of Status
Security of Status
Rights Associatedwith Status
Eur Den
2.18
1.68
1.97 1.97
1.00
1.80
2.33
1.75
2.47
2.20
0.00
0.50
1.00
1.50
2.00
2.50
3.00
Nationality Eligibilityfor Status
Conditionsfor Acquisition
of Status
Security of Status
Dual Nationality
Eur Den
2.02
1.591.84
2.03
1.00
1.75
2.04
2.33 2.17
1.00
35950 51-176 18/3/05 1:51 PM Page 66

67
De
nm
ark
cou
ntr
y p
rofi
le
Anti-Discrimination
Figure 6.26: Anti-Discrimination: Denmark’s Indicatorsand EU Averages
0.00
0.50
1.00
1.50
2.00
2.50
3.00
Anti-Discrimination
Definitionsand scope
Remediesand
Sanctions
EqualityAgencies
Pro-activePolicies
Eur Den
2.16
1.50
1.83
2.35
1.82
1.45
2.19
1.00
2.04
1.43
35950 51-176 18/3/05 1:51 PM Page 67
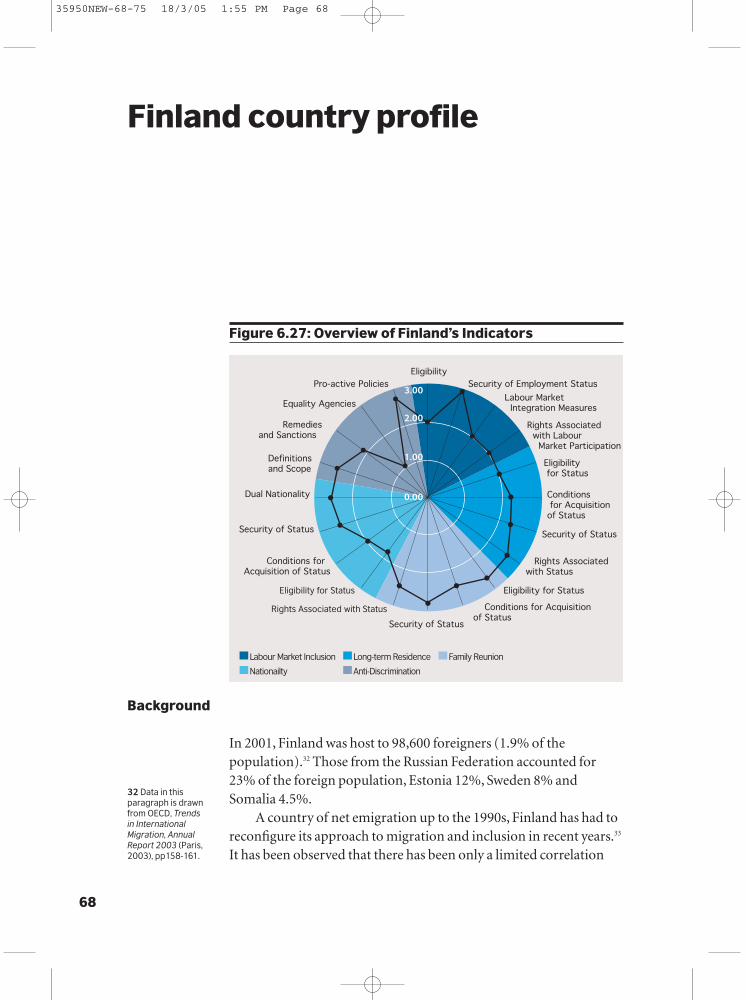
68
In 2001, Finland was host to 98,600 foreigners (1.9% of thepopulation).32 Those from the Russian Federation accounted for23% of the foreign population, Estonia 12%, Sweden 8% andSomalia 4.5%.
A country of net emigration up to the 1990s, Finland has had toreconfigure its approach to migration and inclusion in recent years.33
It has been observed that there has been only a limited correlation
Finland country profile
0.00
1.00
2.00
3.00
EligibilitySecurity of Employment Status
Labour Market Integration Measures
Rights Associated with Labour Market Participation
Eligibility for Status
Conditions for Acquisition of Status
Security of Status
Rights Associated with Status
Eligibility for Status
Conditions for Acquisition of Status
Security of StatusRights Associated with Status
Eligibility for Status
Conditions for Acquisition of Status
Security of Status
Dual Nationality
Definitions and Scope
Remedies and Sanctions
Equality Agencies
Pro-active Policies
Labour Market Inclusion Long-term Residence
Nationailty Anti-Discrimination
Family Reunion
Figure 6.27: Overview of Finland’s Indicators
Background
32 Data in thisparagraph is drawnfrom OECD, Trends in InternationalMigration, AnnualReport 2003 (Paris,2003), pp158-161.
35950NEW-68-75 18/3/05 1:55 PM Page 68
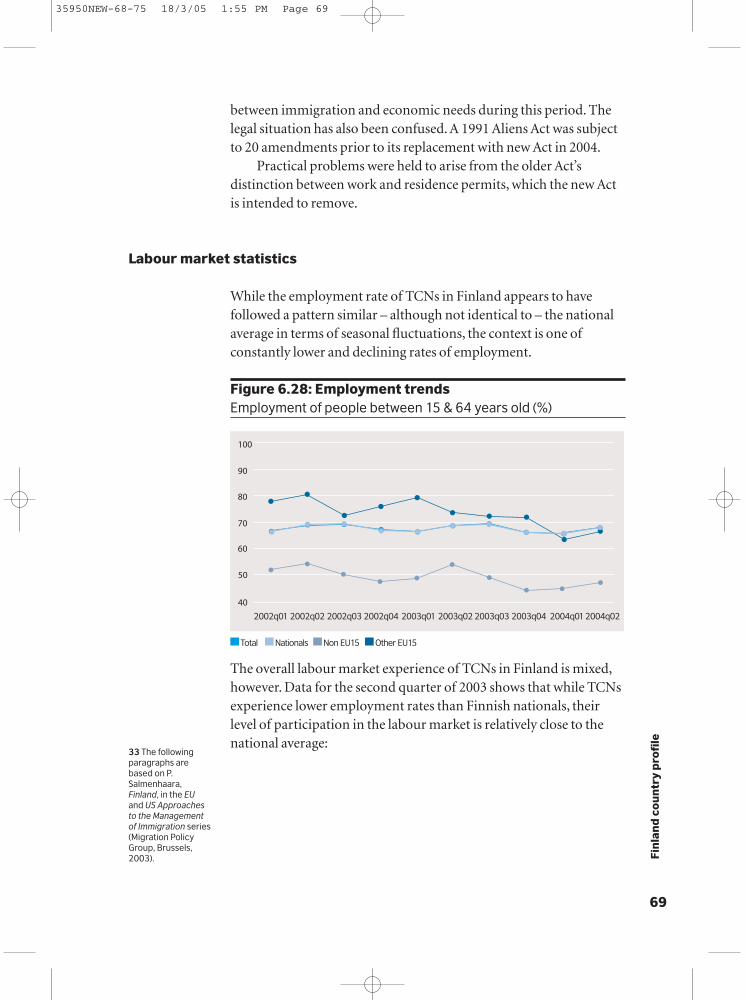
69
Fin
lan
d c
ou
ntr
y p
rofi
le
between immigration and economic needs during this period. Thelegal situation has also been confused. A 1991 Aliens Act was subjectto 20 amendments prior to its replacement with new Act in 2004.
Practical problems were held to arise from the older Act’sdistinction between work and residence permits, which the new Actis intended to remove.
While the employment rate of TCNs in Finland appears to havefollowed a pattern similar – although not identical to – the nationalaverage in terms of seasonal fluctuations, the context is one ofconstantly lower and declining rates of employment.
Figure 6.28: Employment trendsEmployment of people between 15 & 64 years old (%)
The overall labour market experience of TCNs in Finland is mixed,however. Data for the second quarter of 2003 shows that while TCNsexperience lower employment rates than Finnish nationals, theirlevel of participation in the labour market is relatively close to thenational average:
Labour market statistics
Total Nationals Non EU15 Other EU15
2002q01 2002q02 2002q03 2002q04 2003q01 2003q02 2003q03 2003q04 2004q012004q02
40
50
60
70
80
90
100
33 The followingparagraphs arebased on P.Salmenhaara,Finland, in the EUand US Approachesto the Managementof Immigration series(Migration PolicyGroup, Brussels,2003).
35950NEW-68-75 18/3/05 1:55 PM Page 69
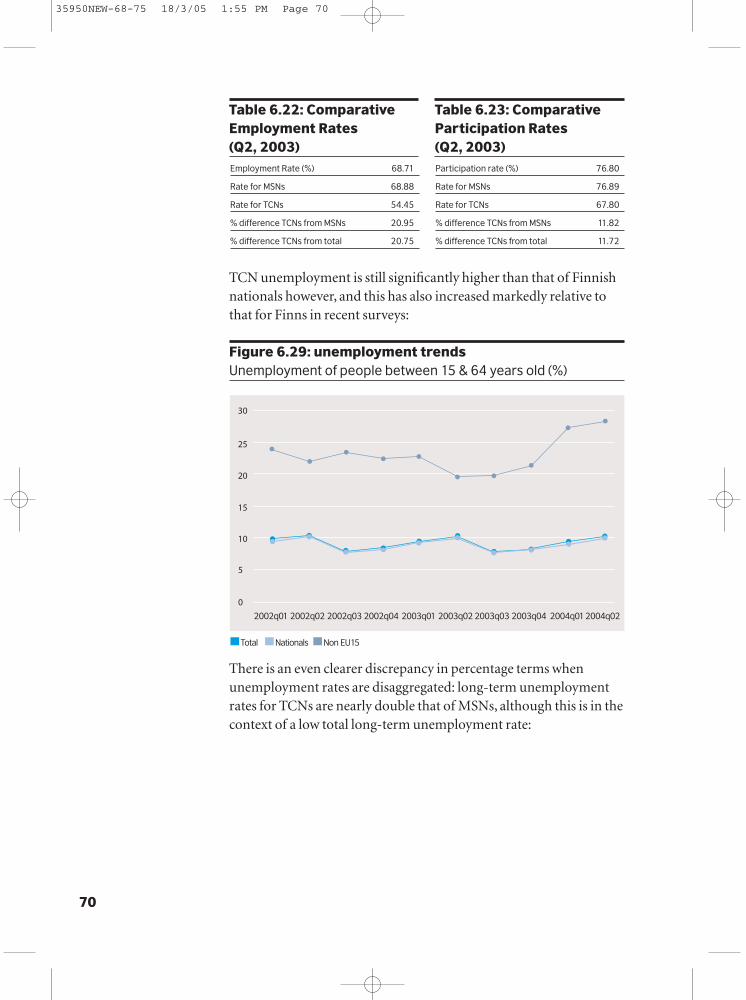
TCN unemployment is still significantly higher than that of Finnishnationals however, and this has also increased markedly relative tothat for Finns in recent surveys:
Figure 6.29: unemployment trendsUnemployment of people between 15 & 64 years old (%)
There is an even clearer discrepancy in percentage terms whenunemployment rates are disaggregated: long-term unemploymentrates for TCNs are nearly double that of MSNs, although this is in thecontext of a low total long-term unemployment rate:
70
Table 6.22: ComparativeEmployment Rates (Q2, 2003)
Table 6.23: ComparativeParticipation Rates (Q2, 2003)
Employment Rate (%) 68.71
Rate for MSNs 68.88
Rate for TCNs 54.45
% difference TCNs from MSNs 20.95
% difference TCNs from total 20.75
Participation rate (%) 76.80
Rate for MSNs 76.89
Rate for TCNs 67.80
% difference TCNs from MSNs 11.82
% difference TCNs from total 11.72
Total Nationals Non EU15
2002q01 2002q02 2002q03 2002q04 2003q01 2003q02 2003q03 2003q04 2004q012004q02
0
5
10
15
20
25
30
35950NEW-68-75 18/3/05 1:55 PM Page 70

71
Fin
lan
d c
ou
ntr
y p
rofi
le
These figures also obscure the significantly varying experiences ofTCNs at differing skill levels. The difference in employment rates forlow-skilled TCN and Finnish workers is relatively small, while thatfor medium-skilled workers is even narrower. However, thediscrepancy in terms of high-skilled work is very large, suggesting anarea for particular attention:
Table 6.26: Comparative Rates for Employment accordingto Skill (low, medium or high; Q2, 2003)
Low Medium High
Total employment rate 48.26 72.37 84.88
Rate for MSNs 48.35 72.40 85.24
Rate for TCNs 42.02 69.46 45.12
% difference TCNs from MSNs 13.09 4.07 47.07
% difference TCNs from total 12.92 4.02 46.84
While a relatively large number of Finns hold temporary contracts (a national issue that should be noted before making judgements onlabour market standards), TCNs are even more likely to do so:
Table 6.27: Comparison of Employment by Type of Contract (Permanent or Temporary; Q2, 2003)
Permanent Contract Temporary Contract
Total % in type of contract 82.05 17.87
% of MSNs in type of contract 82.20 17.72
% of TCNs in type of contract 68.66 31.34
% difference TCNs from MSNs 16.47 -76.89
% difference TCNs from total 16.32 -75.38
In terms of training, TCNs are relatively well-provided for in Finland,with a higher percentage having received recent training than Finnishnationals. The levels of both nationals and TCNs having received
Unemployment Rate (%) 10.54
Rate for MSNs 10.42
Rate for TCNs 19.69
% difference TCNs from MSNs -88.97
% difference TCNs from total -86.77
Long-term unemployment rate (%) 2.23
Rate for MSNs 2.16
Rate for TCNs 7.31
% difference TCNs from MSNs -238.43
% difference TCNs from total -228.38
Table 6.24: ComparativeUnemployment Rates (Q2, 2003)
Table 6.25: ComparativeLong-term UnemploymentRates (Q2, 2003)
35950NEW-68-75 18/3/05 1:55 PM Page 71

such training is relatively high overall, suggesting an area of strength:
Table 6.28: Proportion of workers having receivedtraining in 4 weeks previous to survey (Q2, 2003)
Country-wide proportion receiving training in previous 4 wks 26.28
Percentage of MSNs receiving training in last 4 wks 26.23
Percentage of TCNs receiving training in last 4 wks 31.11
Percentage difference TCNs from MSNs -18.57
Percentage difference TCNs from total -18.34
While the participation and training rates of TCNs in Finland canthus be reported positively, employment issues remain open toenhancement, especially in the high-skilled sector.
Overall performanceFinland’s performance over all five strands of policy indicators isabove or (in the case of nationality) almost identical to the Europeanaverage. It is closest to the average in terms of nationality and anti-discrimination, and farthest above the average in terms of familyreunion. In no strand is its performance moderately (or fully)unfavourable:
Figure 6.30: Comparative Performance: Finland and EU Averages
In labour market inclusion, Finland is above the European averagein terms of access, eligibility and security, although below the average
72
Policy indicators
0.00
2.192.18 2.182.02
2.16
0.50
1.00
1.50
2.00
2.50
3.00
Eur Fin
Labour Market Inclusion Long-term Residence Nationailty Anti-DiscriminationFamily Reunion
2.222.35
2.53
2.002.18
35950NEW-68-75 18/3/05 1:55 PM Page 72

73
Fin
lan
d c
ou
ntr
y p
rofi
le
on market integration measures and rights associated with thelabour status. Its scores are largely within the less favourable range,but on security of employment it has a favourable 3.00.
In terms of eligibility for long-term residence, as well as securityof status, Finland is above the European average, as in all othermeasures. In terms of rights associated with long-term residence, it ismore conspicuously above the average, with a strong moderatelyfavourable score.
Finland is well above the European average in terms of botheligibility for family reunion and security of status, it is at near-parity with the average for rights associated with the status. It has amoderately favourable performance across all areas in this strand.
In terms of nationality, Finland performs strongly in terms ofsecurity of status and associated rights, but has areas of weakness interms of eligibility and conditions for acquisition of nationality – onthese it has less favourable scores.
Anti-discrimination is an area where Finland is very close to theEuropean average, although it has an unfavourable 1.00 in the area ofequality agencies. By contrast, it scores well above the average forpolicies in this area, with a moderately favourable result.
Labour market inclusion
Figure 6.31: Labour Market Inclusion: Finland’s Indicators and EU Averages
0.00
0.50
1.00
1.50
2.00
2.50
3.00
Labour MarketInclusion
Eligibility Security ofEmployment
Status
Integration measures inthe Labour
Market
Rights Associatedwith Labour Market
Participation
Eur Fin
2.182.22
2.00
1.82
2.63
3.00
2.17
2.00 2.00
2.27
35950NEW-68-75 18/3/05 1:55 PM Page 73

Long-term residence
Figure 6.32: Long-term Residence: Finland’s Indicatorsand EU Averages
Family Reunion
Figure 6.33: Family Reunion: Finland’s Indicators and EU Averages
74
0.00
0.50
1.00
1.50
2.00
2.50
3.00
Family Reunion
Eligibilityfor Status
Conditionsfor Acquisition
of Status
Security of Status
Rights Associatedwith Status
Eur Fin
2.18
2.53
1.97 1.97
2.602.40
2.33
2.75
2.47 2.40
0.00
0.50
1.00
1.50
2.00
2.50
3.00
Long-term Residence
Eligibilityfor Status
Conditionsfor Acquisition
of Status
Security of Status
Rights Associatedwith Status
Eur Fin
2.192.35
1.892.00
2.13 2.20 2.17 2.29 2.34
2.63
35950NEW-68-75 18/3/05 1:55 PM Page 74

75
Fin
lan
d c
ou
ntr
y p
rofi
le
Nationality
Figure 6.34: Nationality: Finland’s Indicators and EU Averages
Anti-Discrimination
Figure 6.35: Anti-Discrimination: Finland’s Indicators and EU Averages
0.00
0.50
1.00
1.50
2.00
2.50
3.00
Nationality Eligibilityfor Status
Conditionsfor Acquisition
of Status
Security of Status
Dual Nationality
Eur Fin
2.02 2.001.84
2.03
1.751.88
2.04
2.33 2.17
2.50
0.00
0.50
1.00
1.50
2.00
2.50
3.00
Anti-Discrimination
Definitionsand scope
Remediesand
Sanctions
EqualityAgencies
Pro-activePolicies
Eur Fin
2.16 2.18
1.83
2.352.45
1.452.19
1.00
2.04
2.71
35950NEW-68-75 18/3/05 1:55 PM Page 75

76
In 2001, France was host to 2,903,900 foreigners (9.3% of thepopulation), including 1,317,100 foreign workers.34 Of the overallforeign population, more than two fifths were nationals from Africaand another two fifths were EU citizens.
France is a well-established hub for immigration, although thesubject is a matter for strong political debate, often with reference tosecurity.35 A clear distinction is maintained between two main types
France country profile
0.00
1.00
2.00
3.00
EligibilitySecurity of Employment Status
Labour Market Integration Measures
Rights Associated with Labour Market Participation
Eligibility for Status
Conditions for Acquisition of Status
Security of Status
Rights Associated with Status
Eligibility for Status
Conditions for Acquisition of Status
Security of StatusRights Associated with Status
Eligibility for Status
Conditions for Acquisition of Status
Security of Status
Dual Nationality
Definitions and Scope
Remedies and Sanctions
Equality Agencies
Pro-active Policies
Labour Market Inclusion Long-term Residence
Nationailty Anti-Discrimination
Family Reunion
Figure 6.36: Overview of France’s
Background
34 Data in thisparagraph is drawnfrom OECD, Trends in InternationalMigration, AnnualReport 2003 (Paris,2003), pp158-161.
35950 51-176 18/3/05 1:51 PM Page 76
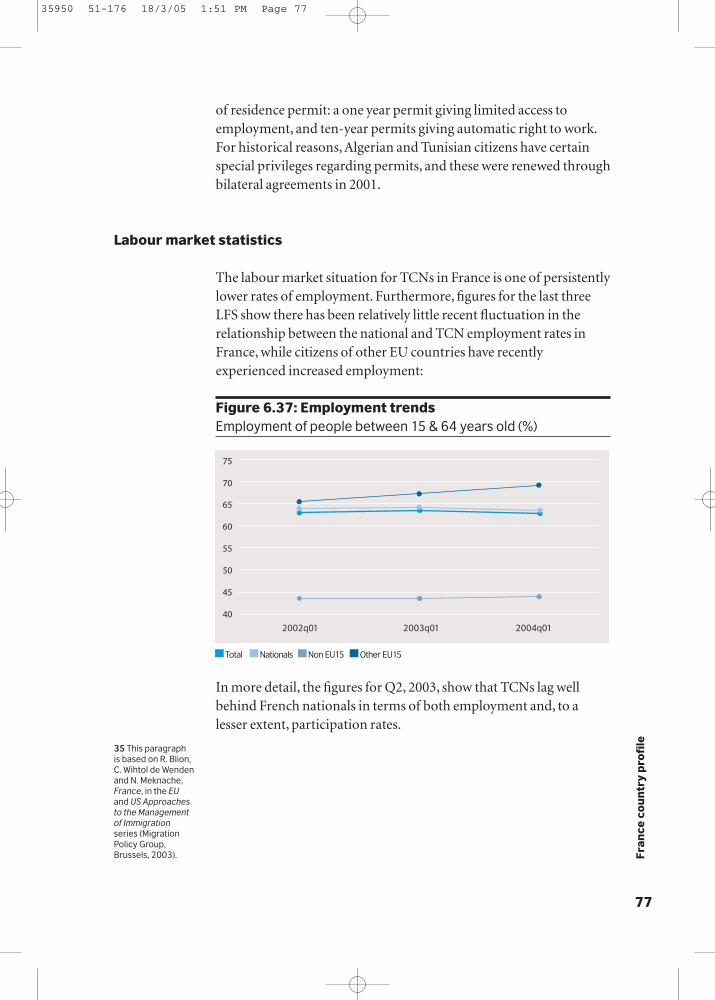
77
Fran
ce c
ou
ntr
y p
rofi
le
of residence permit: a one year permit giving limited access toemployment, and ten-year permits giving automatic right to work.For historical reasons, Algerian and Tunisian citizens have certainspecial privileges regarding permits, and these were renewed throughbilateral agreements in 2001.
The labour market situation for TCNs in France is one of persistentlylower rates of employment. Furthermore, figures for the last threeLFS show there has been relatively little recent fluctuation in therelationship between the national and TCN employment rates inFrance, while citizens of other EU countries have recentlyexperienced increased employment:
Figure 6.37: Employment trendsEmployment of people between 15 & 64 years old (%)
In more detail, the figures for Q2, 2003, show that TCNs lag wellbehind French nationals in terms of both employment and, to alesser extent, participation rates.
Labour market statistics
Total Nationals Non EU15 Other EU15
2002q01 2003q01 2004q01
40
45
50
55
60
65
70
75
35 This paragraph is based on R. Blion,C. Wihtol de Wendenand N. Meknache,France, in the EUand US Approachesto the Managementof Immigrationseries (MigrationPolicy Group,Brussels, 2003).
35950 51-176 18/3/05 1:51 PM Page 77
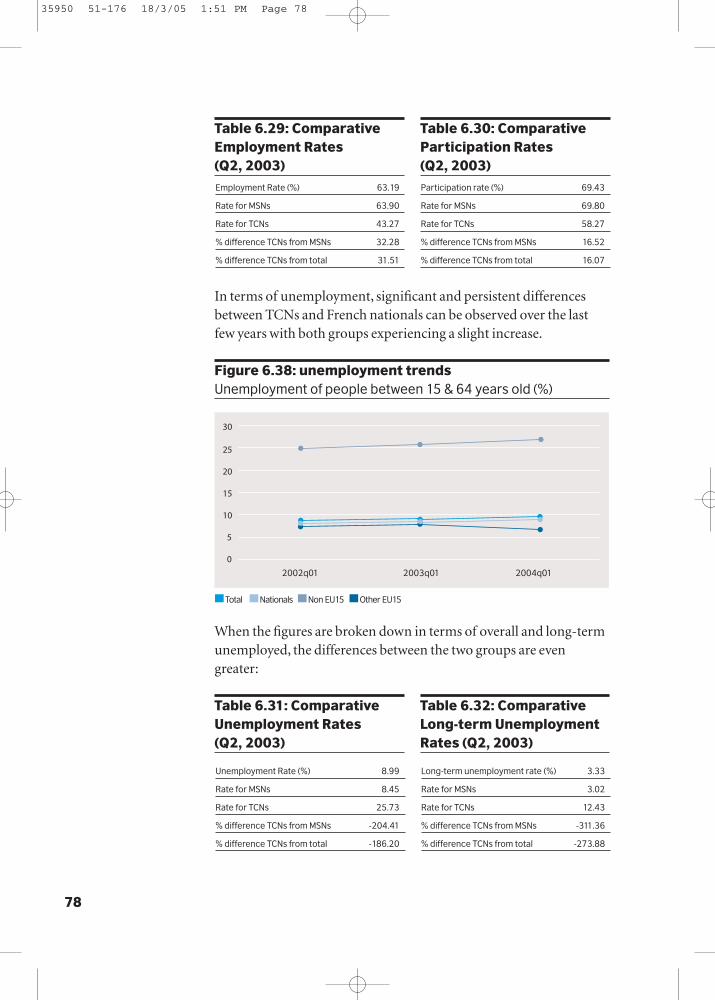
78
In terms of unemployment, significant and persistent differencesbetween TCNs and French nationals can be observed over the lastfew years with both groups experiencing a slight increase.
Figure 6.38: unemployment trendsUnemployment of people between 15 & 64 years old (%)
When the figures are broken down in terms of overall and long-termunemployed, the differences between the two groups are evengreater:
Total Nationals Non EU15 Other EU15
2002q01 2003q01 2004q01
0
5
10
15
20
25
30
Unemployment Rate (%) 8.99
Rate for MSNs 8.45
Rate for TCNs 25.73
% difference TCNs from MSNs -204.41
% difference TCNs from total -186.20
Long-term unemployment rate (%) 3.33
Rate for MSNs 3.02
Rate for TCNs 12.43
% difference TCNs from MSNs -311.36
% difference TCNs from total -273.88
Table 6.31: ComparativeUnemployment Rates (Q2, 2003)
Table 6.32: ComparativeLong-term UnemploymentRates (Q2, 2003)
Table 6.29: ComparativeEmployment Rates (Q2, 2003)
Table 6.30: ComparativeParticipation Rates (Q2, 2003)
Employment Rate (%) 63.19
Rate for MSNs 63.90
Rate for TCNs 43.27
% difference TCNs from MSNs 32.28
% difference TCNs from total 31.51
Participation rate (%) 69.43
Rate for MSNs 69.80
Rate for TCNs 58.27
% difference TCNs from MSNs 16.52
% difference TCNs from total 16.07
35950 51-176 18/3/05 1:51 PM Page 78
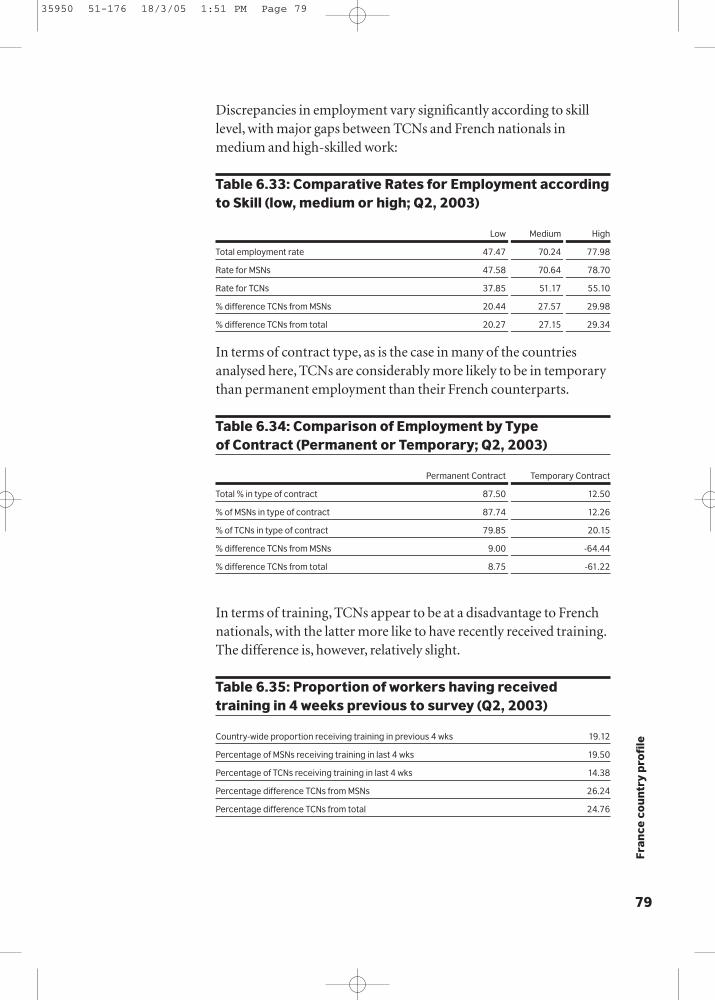
79
Fran
ce c
ou
ntr
y p
rofi
le
Discrepancies in employment vary significantly according to skilllevel, with major gaps between TCNs and French nationals inmedium and high-skilled work:
Table 6.33: Comparative Rates for Employment accordingto Skill (low, medium or high; Q2, 2003)
Low Medium High
Total employment rate 47.47 70.24 77.98
Rate for MSNs 47.58 70.64 78.70
Rate for TCNs 37.85 51.17 55.10
% difference TCNs from MSNs 20.44 27.57 29.98
% difference TCNs from total 20.27 27.15 29.34
In terms of contract type, as is the case in many of the countriesanalysed here, TCNs are considerably more likely to be in temporarythan permanent employment than their French counterparts.
Table 6.34: Comparison of Employment by Type of Contract (Permanent or Temporary; Q2, 2003)
Permanent Contract Temporary Contract
Total % in type of contract 87.50 12.50
% of MSNs in type of contract 87.74 12.26
% of TCNs in type of contract 79.85 20.15
% difference TCNs from MSNs 9.00 -64.44
% difference TCNs from total 8.75 -61.22
In terms of training, TCNs appear to be at a disadvantage to Frenchnationals, with the latter more like to have recently received training.The difference is, however, relatively slight.
Table 6.35: Proportion of workers having receivedtraining in 4 weeks previous to survey (Q2, 2003)
Country-wide proportion receiving training in previous 4 wks 19.12
Percentage of MSNs receiving training in last 4 wks 19.50
Percentage of TCNs receiving training in last 4 wks 14.38
Percentage difference TCNs from MSNs 26.24
Percentage difference TCNs from total 24.76
35950 51-176 18/3/05 1:51 PM Page 79

80
Thus, as with several of the other “older”countries of immigrationamong the EU-15, labour market data illustrates that in France thereis a significant structural discrepancy in terms of employment rates,unemployment rates, contractual and training situations for TCNs.
Overall performance
France’s performance in four of five strands of indicators is above theEuropean average - in labour market inclusion it is below-average. Inall cases, the variation is not great, with the biggest discrepancy beingin the area of long-term residence:
Figure 6.39: Comparative Performance: France and EU Averages
Within strands, France varies more significantly from Europeanaverages. It scores well above average on eligibility for long termresidence, but scores well below average on eligibility for labourinclusion. France is markedly below the average on specialisedequality agencies, though well above the average for rights associatedwith nationality status, residency status and family reunion.
In labour market inclusion, France is ahead of the Europeanaverage on labour market integration issues and rights associatedwith labour status. It is most obviously below the European averagein terms of access and eligibility (where it has a moderatelyunfavourable score), and slightly below it on labour market inclusionand security of employment status.
In terms of eligibility for long-term residence, as well as security
Policy indicators
0.00
2.192.18 2.182.02
2.16
0.50
1.00
1.50
2.00
2.50
3.00
Eur Fra
Labour Market Inclusion Long-term Residence Nationailty Anti-DiscriminationFamily Reunion
2.112.43 2.32 2.29 2.18
35950 51-176 18/3/05 1:51 PM Page 80
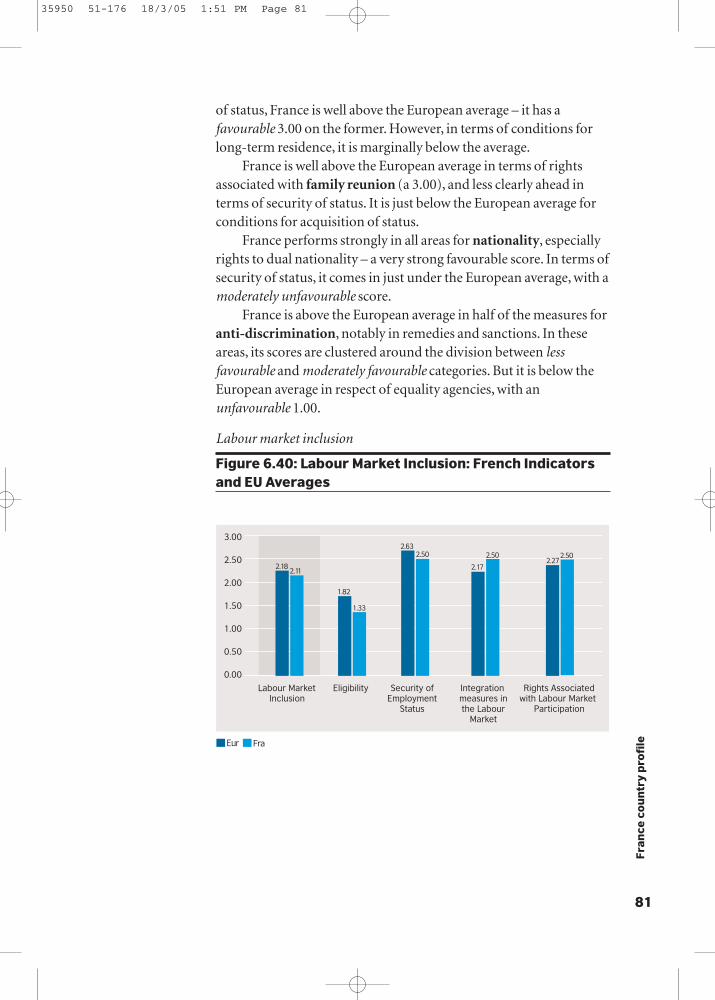
81
Fran
ce c
ou
ntr
y p
rofi
le
of status, France is well above the European average – it has afavourable 3.00 on the former. However, in terms of conditions forlong-term residence, it is marginally below the average.
France is well above the European average in terms of rightsassociated with family reunion (a 3.00), and less clearly ahead interms of security of status. It is just below the European average forconditions for acquisition of status.
France performs strongly in all areas for nationality, especiallyrights to dual nationality – a very strong favourable score. In terms ofsecurity of status, it comes in just under the European average, with amoderately unfavourable score.
France is above the European average in half of the measures foranti-discrimination, notably in remedies and sanctions. In theseareas, its scores are clustered around the division between lessfavourable and moderately favourable categories. But it is below theEuropean average in respect of equality agencies, with anunfavourable 1.00.
Labour market inclusion
Figure 6.40: Labour Market Inclusion: French Indicatorsand EU Averages
0.00
0.50
1.00
1.50
2.00
2.50
3.00
Labour MarketInclusion
Eligibility Security ofEmployment
Status
Integration measures inthe Labour
Market
Rights Associatedwith Labour Market
Participation
Eur Fra
2.182.11
1.33
1.82
2.632.50
2.17
2.50 2.502.27
35950 51-176 18/3/05 1:51 PM Page 81

82
Long-term residence
Figure 6.41: Long-term Residence: French Indicators and EU Averages
Family Reunion
Figure 6.42: Family Reunion: French Indicators and EU Averages
0.00
0.50
1.00
1.50
2.00
2.50
3.00
Family Reunion
Eligibilityfor Status
Conditionsfor Acquisition
of Status
Security of Status
Rights Associatedwith Status
Eur Fra
2.182.32
1.97 1.972.001.80
2.332.50 2.47
3.00
0.00
0.50
1.00
1.50
2.00
2.50
3.00
Long-term Residence
Eligibilityfor Status
Conditionsfor Acquisition
of Status
Security of Status
Rights Associatedwith Status
Eur Fra
2.192.43
1.89
3.00
2.13
1.80
2.17
2.71
2.34 2.38
35950 51-176 18/3/05 1:51 PM Page 82

83
Fran
ce c
ou
ntr
y p
rofi
le
Nationality
Figure 6.43: Nationality: French Indicators and EU Averages
Anti-Discrimination
Figure 6.44: Anti-Discrimination: French Indicators and EU Averages
0.00
0.50
1.00
1.50
2.00
2.50
3.00
Nationality Eligibilityfor Status
Conditionsfor Acquisition
of Status
Security of Status
Dual Nationality
Eur Fra
2.02
2.29
1.84
2.03
2.502.25
2.04
1.67
2.17
3.00
0.00
0.50
1.00
1.50
2.00
2.50
3.00
Anti-Discrimination
Definitionsand scope
Remediesand
Sanctions
EqualityAgencies
Pro-activePolicies
Eur Fra
2.16 2.18
1.83
2.35 2.27
2.64
2.19
1.00
2.042.14
35950 51-176 18/3/05 1:51 PM Page 83

At the end of 2001, Germany was host to just over 7.3 millionforeigners (8.9% of the population), including 3.6 million foreignworkers.36 Slightly more than a quarter of all resident foreigners wereEuropean Union citizens. The most important national groups in theforeign population were from Turkey (26.3%), the former Yugoslavia(8.4%) and Italy (8.4%). Nearly a third of all foreigners had lived inGermany for more than 20 years.
84
Germany country profile
0.00
1.00
2.00
3.00
EligibilitySecurity of Employment Status
Labour Market Integration Measures
Rights Associated with Labour Market Participation
Eligibility for Status
Conditions for Acquisition of Status
Security of Status
Rights Associated with Status
Eligibility for Status
Conditions for Acquisition of Status
Security of StatusRights Associated with Status
Eligibility for Status
Conditions for Acquisition of Status
Security of Status
Dual Nationality
Definitions and Scope
Remedies and Sanctions
Equality Agencies
Pro-active Policies
Labour Market Inclusion Long-term Residence
Nationailty Anti-Discrimination
Family Reunion
Figure 6.45: Overview of Germany’s Indicators
Background
36 Data in thisparagraph is drawnfrom OECD, Trends in InternationalMigration, AnnualReport 2003 (Paris,2003), pp158–161.
35950 51-176 18/3/05 1:51 PM Page 84

85
Ge
rman
y co
un
try
pro
file
Historically, immigration and inclusion issues in Germany havebeen affected by a high degree of diversity in policies and practicesresulting from the country’s federal constitution.37 The first nationalimmigration law only came into force in 2003. While it has beenobserved that TCNs have enjoyed relatively high levels of rights inGermany, they have often faced a confusing legal situation – until2003, for example, five varieties of residence permit were available.
The new, national, law has simplified this state of affairs,introducing just two types of permit – temporary and unlimited.There has also been a new emphasis on integration, although itsimplementation has been affected by resource issues at the regionaland local levels.
In many areas of the German labour market, the experience of TCNsis relatively close to that of German nationals, although by no meansidentical. However, employment (and particularly high-skilled)employment issues are significant. Data has historically been morelimited for Germany with regards to the situation of differentnational groups (Munz 2004). However, data from the LFS since2002 reveals evidence of a slight decline in the TCN employment raterelative to a wider national decline:
Figure 6.46: Employment trendsEmployment of people between 15 & 64 years old (%)
A closer look at employment and participation rates for Q2, 2003shows that TCNs experience lower rates than German nationals:
Labour market statistics
40
45
50
55
60
65
70
75
Total Nationals non EU-15 other EU-15
2002q02 2003q02
37 The followingparagraphs arebased on N. Cyrusand D. Vogel,Germany, in the EUand US Approachesto the Managementof Immigration series(Migration PolicyGroup, Brussels,2003).
35950 51-176 18/3/05 1:51 PM Page 85

In terms of unemployment, TCNs are at a disadvantage relative toGerman nationals and also appear to have recently experienced asharper rise in unemployment than nationals:
Figure 6.47: Unemployment trendsUnemployment of people between 15 & 64 years old (%)
When the data is split in terms of overall and long-term unemployed,we can see that the percentage of TCNs suffering the latter is fairlylow relative to the national rate and the rates observed in many otherEU members:
86
Table 6.36: ComparativeEmployment Rates (Q2, 2003)
Table 6.37: ComparativeParticipation Rates (Q2, 2003)
Employment Rate (%) 64.95
Rate for MSNs 66.12
Rate for TCNs 49.50
% difference TCNs from MSNs 25.14
% difference TCNs from total 23.79
Participation rate (%) 72.06
Rate for MSNs 72.86
Rate for TCNs 61.50
% difference TCNs from MSNs 15.54
% difference TCNs from total 14.65
0
2
4
6
8
10
12
14
16
18
20
Total Nationals non EU-15 other EU-15
2002q02 2003q02
Unemployment Rate (%) 9.87
Rate for MSNs 9.19
Rate for TCNs 19.52
% difference TCNs from MSNs -112.28
% difference TCNs from total -97.71
Long-term unemployment rate (%) 4.87
Rate for MSNs 4.53
Rate for TCNs 9.85
% difference TCNs from MSNs -117.21
% difference TCNs from total -102.19
Table 6.38: ComparativeUnemployment Rates (Q2, 2003)
Table 6.39: ComparativeLong-term UnemploymentRates (Q2, 2003)
35950 51-176 18/3/05 1:51 PM Page 86
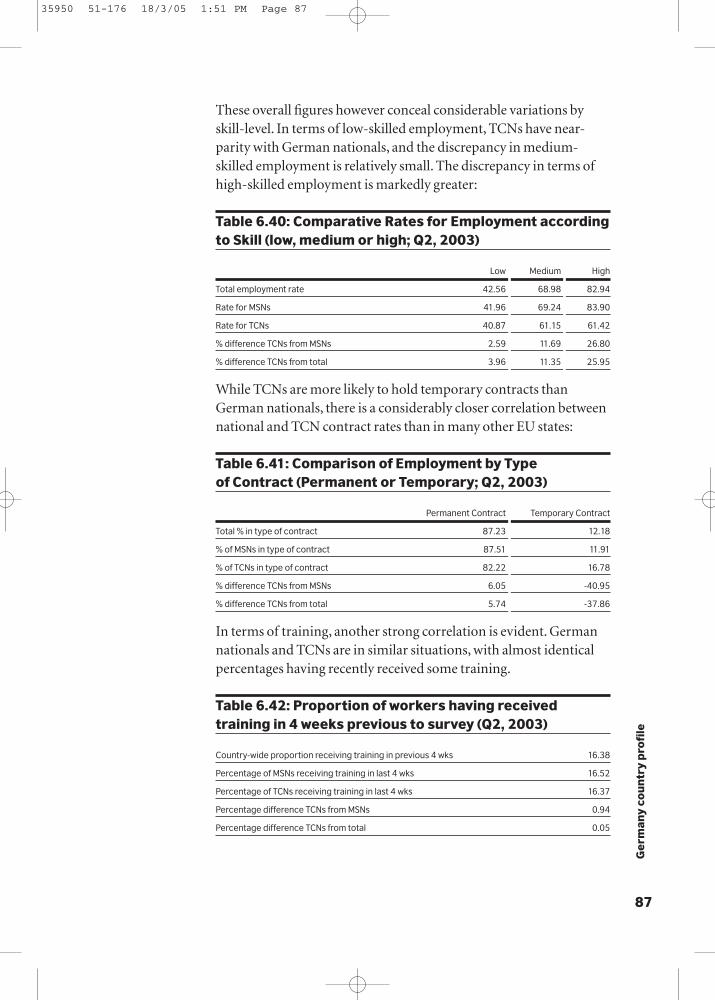
87
Ge
rman
y co
un
try
pro
file
These overall figures however conceal considerable variations byskill-level. In terms of low-skilled employment, TCNs have near-parity with German nationals, and the discrepancy in medium-skilled employment is relatively small. The discrepancy in terms ofhigh-skilled employment is markedly greater:
Table 6.40: Comparative Rates for Employment accordingto Skill (low, medium or high; Q2, 2003)
Low Medium High
Total employment rate 42.56 68.98 82.94
Rate for MSNs 41.96 69.24 83.90
Rate for TCNs 40.87 61.15 61.42
% difference TCNs from MSNs 2.59 11.69 26.80
% difference TCNs from total 3.96 11.35 25.95
While TCNs are more likely to hold temporary contracts thanGerman nationals, there is a considerably closer correlation betweennational and TCN contract rates than in many other EU states:
Table 6.41: Comparison of Employment by Type of Contract (Permanent or Temporary; Q2, 2003)
Permanent Contract Temporary Contract
Total % in type of contract 87.23 12.18
% of MSNs in type of contract 87.51 11.91
% of TCNs in type of contract 82.22 16.78
% difference TCNs from MSNs 6.05 -40.95
% difference TCNs from total 5.74 -37.86
In terms of training, another strong correlation is evident. Germannationals and TCNs are in similar situations, with almost identicalpercentages having recently received some training.
Table 6.42: Proportion of workers having receivedtraining in 4 weeks previous to survey (Q2, 2003)
Country-wide proportion receiving training in previous 4 wks 16.38
Percentage of MSNs receiving training in last 4 wks 16.52
Percentage of TCNs receiving training in last 4 wks 16.37
Percentage difference TCNs from MSNs 0.94
Percentage difference TCNs from total 0.05
35950 51-176 18/3/05 1:51 PM Page 87
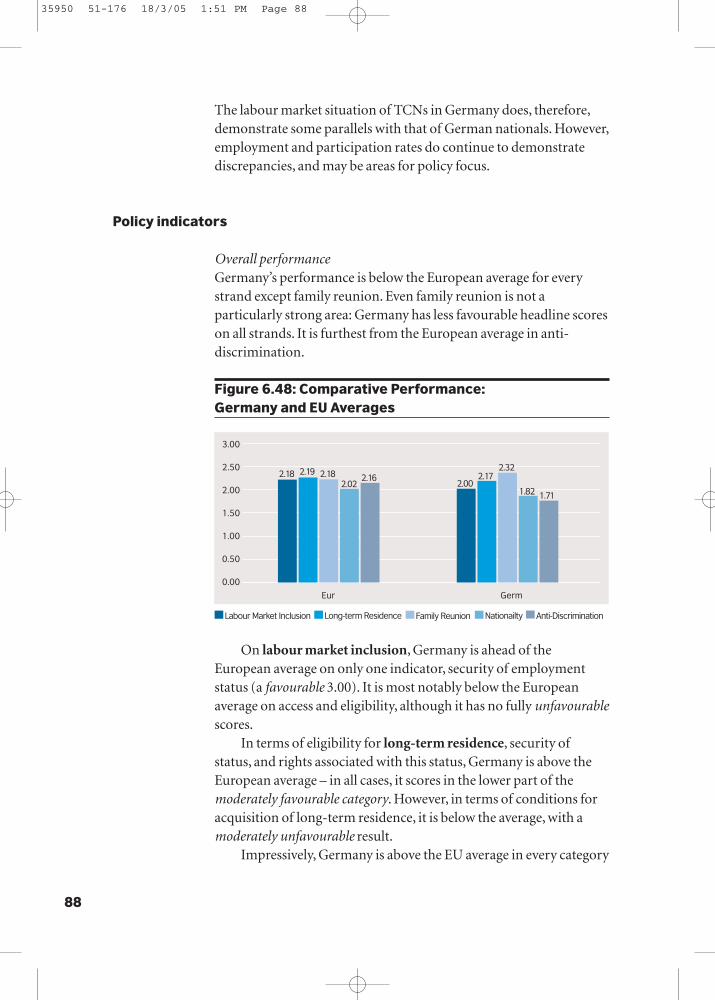
The labour market situation of TCNs in Germany does, therefore,demonstrate some parallels with that of German nationals. However,employment and participation rates do continue to demonstratediscrepancies, and may be areas for policy focus.
Overall performanceGermany’s performance is below the European average for everystrand except family reunion. Even family reunion is not aparticularly strong area: Germany has less favourable headline scoreson all strands. It is furthest from the European average in anti-discrimination.
Figure 6.48: Comparative Performance: Germany and EU Averages
On labour market inclusion, Germany is ahead of theEuropean average on only one indicator, security of employmentstatus (a favourable 3.00). It is most notably below the Europeanaverage on access and eligibility, although it has no fully unfavourablescores.
In terms of eligibility for long-term residence, security ofstatus, and rights associated with this status, Germany is above theEuropean average – in all cases, it scores in the lower part of themoderately favourable category. However, in terms of conditions foracquisition of long-term residence, it is below the average, with amoderately unfavourable result.
Impressively, Germany is above the EU average in every category
88
Policy indicators
0.00
2.192.18 2.182.02
2.16
0.50
1.00
1.50
2.00
2.50
3.00
Eur Germ
Labour Market Inclusion Long-term Residence Nationailty Anti-DiscriminationFamily Reunion
2.172.32
1.822.00
1.71
35950 51-176 18/3/05 1:51 PM Page 88
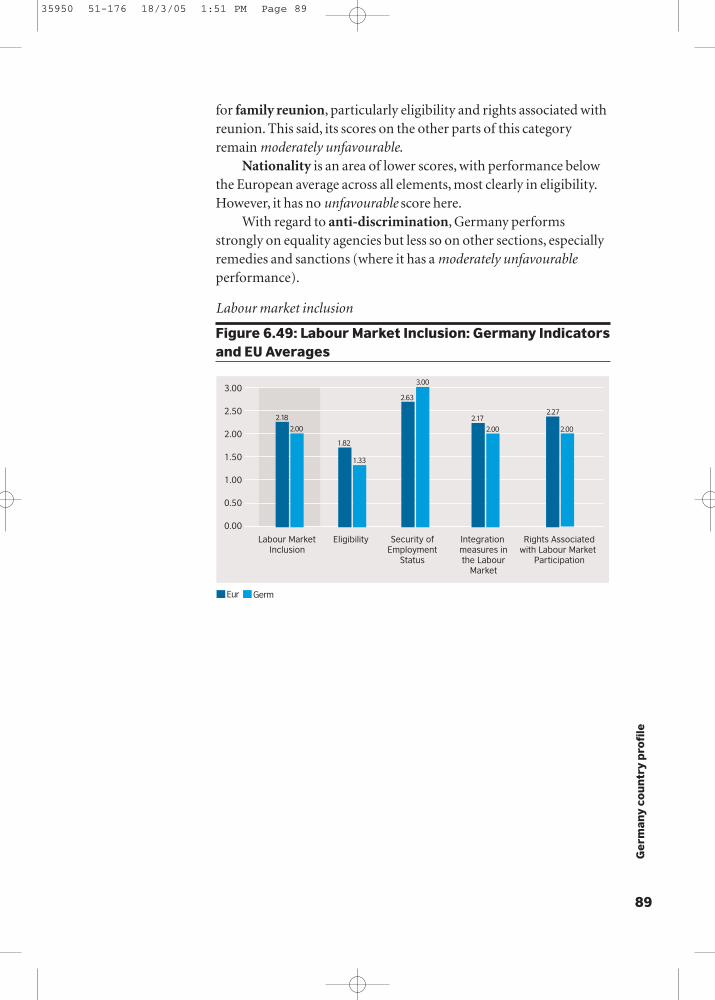
89
Ge
rman
y co
un
try
pro
file
for family reunion, particularly eligibility and rights associated withreunion. This said, its scores on the other parts of this categoryremain moderately unfavourable.
Nationality is an area of lower scores, with performance belowthe European average across all elements, most clearly in eligibility.However, it has no unfavourable score here.
With regard to anti-discrimination, Germany performsstrongly on equality agencies but less so on other sections, especiallyremedies and sanctions (where it has a moderately unfavourableperformance).
Labour market inclusion
Figure 6.49: Labour Market Inclusion: Germany Indicatorsand EU Averages
0.00
0.50
1.00
1.50
2.00
2.50
3.00
Labour MarketInclusion
Eligibility Security ofEmployment
Status
Integration measures inthe Labour
Market
Rights Associatedwith Labour Market
Participation
Eur Germ
2.18
2.00
1.33
1.82
2.63
3.00
2.17
2.00 2.00
2.27
35950 51-176 18/3/05 1:51 PM Page 89
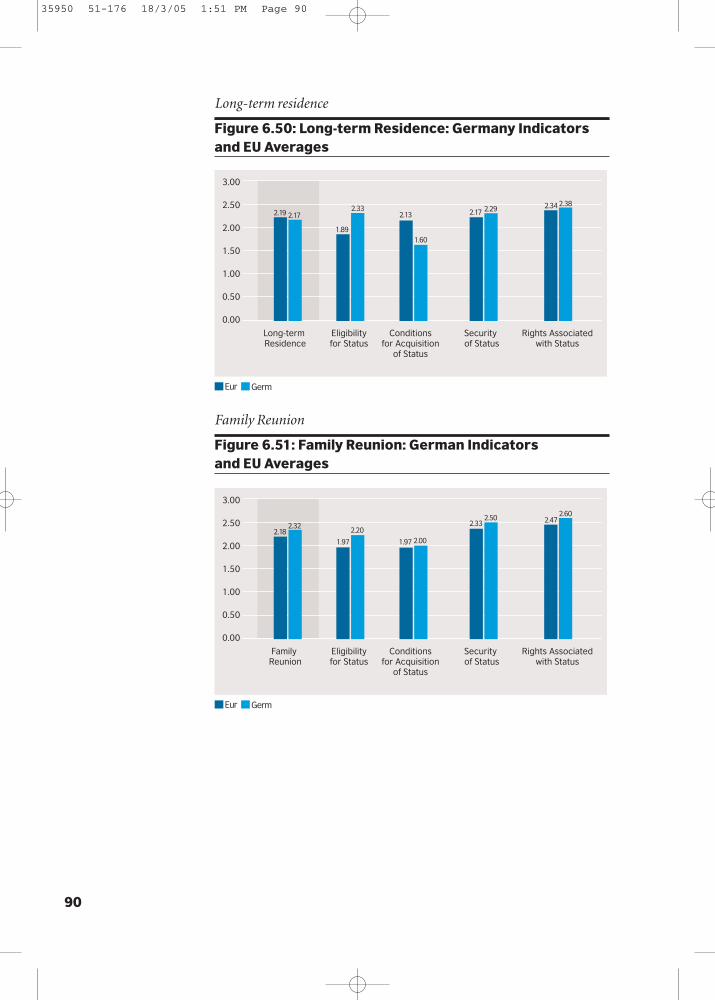
Long-term residence
Figure 6.50: Long-term Residence: Germany Indicators and EU Averages
Family Reunion
Figure 6.51: Family Reunion: German Indicators and EU Averages
90
0.00
0.50
1.00
1.50
2.00
2.50
3.00
Long-term Residence
Eligibilityfor Status
Conditionsfor Acquisition
of Status
Security of Status
Rights Associatedwith Status
Eur Germ
2.19 2.17
1.89
2.332.13
1.60
2.17 2.29 2.34 2.38
0.00
0.50
1.00
1.50
2.00
2.50
3.00
Family Reunion
Eligibilityfor Status
Conditionsfor Acquisition
of Status
Security of Status
Rights Associatedwith Status
Eur Germ
2.182.32
1.97 1.97
2.202.00
2.332.50 2.47
2.60
35950 51-176 18/3/05 1:51 PM Page 90
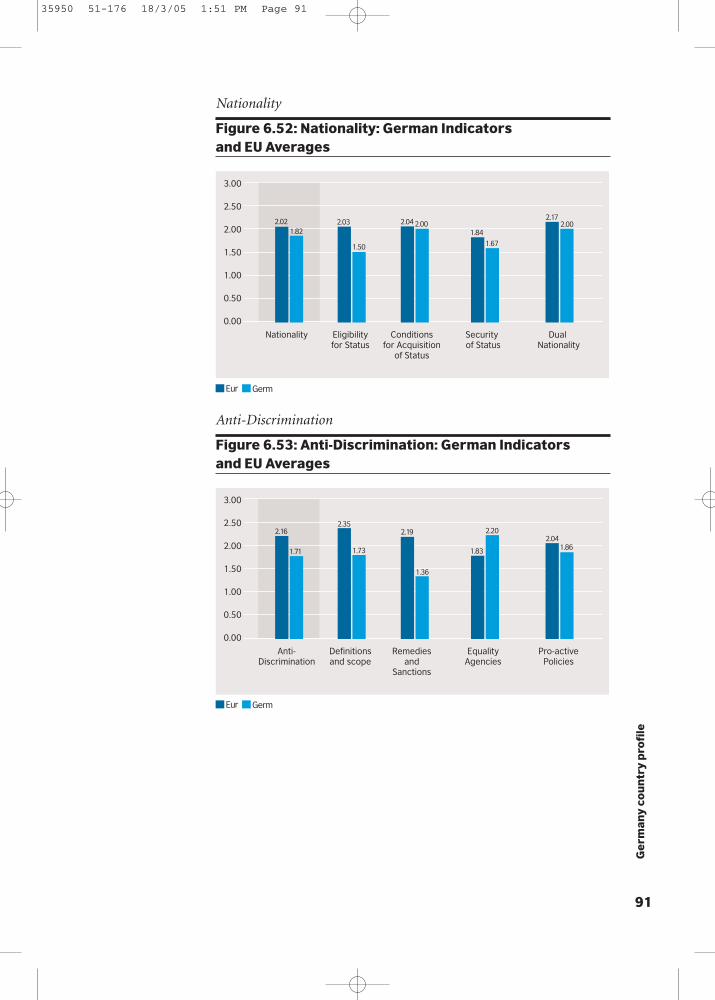
91
Ge
rman
y co
un
try
pro
file
Nationality
Figure 6.52: Nationality: German Indicators and EU Averages
Anti-Discrimination
Figure 6.53: Anti-Discrimination: German Indicators and EU Averages
0.00
0.50
1.00
1.50
2.00
2.50
3.00
Nationality Eligibilityfor Status
Conditionsfor Acquisition
of Status
Security of Status
Dual Nationality
Eur Germ
2.021.82 1.84
2.03
1.50
2.002.04
1.67
2.172.00
0.00
0.50
1.00
1.50
2.00
2.50
3.00
Anti-Discrimination
Definitionsand scope
Remediesand
Sanctions
EqualityAgencies
Pro-activePolicies
Eur Germ
2.16
1.71 1.83
2.35
1.73
1.36
2.19 2.202.04
1.86
35950 51-176 18/3/05 1:51 PM Page 91

92
In 2001, Greece was host to 762,200 foreigners (7% of thepopulation), including 413,000 foreign workers.38 However, therewere also over 300,000 illegal immigrants that were detected,significantly higher than in previous years. Of the legal foreignpopulation, over half were from Albania. Bulgaria (4.6%), Georgia(3%) and Romania (2.9%) made up the other largest elements. Themain sources of foreign workers were Albania (again over half),
Greece country profile
0.00
1.00
2.00
3.00
EligibilitySecurity of Employment Status
Labour Market Integration Measures
Rights Associated with Labour Market Participation
Eligibility for Status
Conditions for Acquisition of Status
Security of Status
Rights Associated with Status
Eligibility for Status
Conditions for Acquisition of Status
Security of StatusRights Associated with Status
Eligibility for Status
Conditions for Acquisition of Status
Security of Status
Dual Nationality
Definitions and Scope
Remedies and Sanctions
Equality Agencies
Pro-active Policies
Labour Market Inclusion Long-term Residence
Nationailty Anti-Discrimination
Family Reunion
Figure 6.54: Overview of Greece’s Indicators
Background
38 Data in thisparagraph is drawnfrom OECD, Trends in InternationalMigration, AnnualReport 2003 (Paris,2003), pp158-161.
35950 51-176 18/3/05 1:51 PM Page 92

93
Gre
ece
co
un
try
pro
file
Bulgaria and Romania.In the 1990s, Greece experienced a shift from being a country of
emigration to one of immigration.39 Its approach to immigrationand inclusion remains centred on economic concerns – with theneed for labour shaping the distribution of residence permits. Policydebate remains focussed on low-skilled labour, with six-monthtemporary permits for workers.
Both politically and legally, long-term residence has beenoverlooked: the legislation on this area is very limited, in spite of thefact that a new immigration law came into force in 2001.
While data from the LFS is useful in comparing the situation oflegally resident TCNs with MSNs, there needs to be a health warningin terms capacity of the survey to capture irregular workingpractices, which are known to be a feature of some economies.Bearing this in mind, therefore, in terms of legal employment andparticipation in the labour market, TCNs in Greece experiencemarkedly higher rates of employment and participation than Greeknationals. Moreover, the TCN employment rate has fluctuated in linewith that for Greeks, in contrast to a marginally more volatile rate forother EU nationals.
Figure 6.55: Employment trendsEmployment of people between 15 & 64 years old (%)
Labour market statistics
Total Nationals Non EU15 Other EU15
2002q01 2002q02 2002q03 2002q04 2003q01 2003q02 2003q03 2003q04
40
45
50
55
60
65
70
75
39 The followingparagraphs arebased on K.Lykovardi and E.Petroula, Greece, in the EU and USApproaches to theManagement ofImmigration series(Migration PolicyGroup, Brussels,2003).
35950 51-176 18/3/05 1:51 PM Page 93

94
TCNs also have a remarkably similar unemployment rate to Greeknationals with both groups appearing to experience similar temporalfluctuations.
Figure 6.56: Unemployment trendsUnemployment of people between 15 & 64 years old (%)
When broken down into overall and long-term unemployment,however, data from Q2, 2003 shows that TCNs are less likely to sufferunemployment beyond 12 months:
Table 6.43: ComparativeEmployment Rates (Q2, 2003)
Table 6.44: ComparativeParticipation Rates (Q2, 2003)
Employment Rate (%) 57.95
Rate for MSNs 57.48
Rate for TCNs 67.63
% difference TCNs from MSNs -17.65
% difference TCNs from total -16.69
Participation rate (%) 63.76
Rate for MSNs 63.25
Rate for TCNs 74.34
% difference TCNs from MSNs -17.50
% difference TCNs from total -16.59
Total Nationals Non EU15
2002q01 2002q02 2002q03 2002q04 2003q01 2003q02 2003q03 2003q04
0
2
4
6
8
10
12
14
16
20
18
Unemployment Rate (%) 9.11
Rate for MSNs 9.13
Rate for TCNs 9.03
% difference TCNs from MSNs 1.06
% difference TCNs from total 0.87
Long-term unemployment rate (%) 5.14
Rate for MSNs 5.25
Rate for TCNs 3.50
% difference TCNs from MSNs 33.45
% difference TCNs from total 32.06
Table 6.45: ComparativeUnemployment Rates (Q2, 2003)
Table 6.46: ComparativeLong-term UnemploymentRates (Q2, 2003)
35950 51-176 18/3/05 1:51 PM Page 94

95
Gre
ece
co
un
try
pro
file
In terms of different types of labour, Greek nationals only enjoy abetter employment rate than TCNs in high-skilled work. While theGreek employment rate varies significantly across types ofemployment, it is worth noting that the rate for TCNs is veryconsistent:
Table 6.47: Comparative Rates for Employment according to Skill (low, medium or high; Q2, 2003)
Low Medium High
Total employment rate 50.19 58.09 80.89
Rate for MSNs 49.27 57.66 81.36
Rate for TCNs 67.01 67.73 69.91
% difference TCNs from MSNs -36.02 -17.46 14.07
% difference TCNs from total -33.53 -16.60 13.57
However, TCNs are almost twice as likely as Greek nationals to holdtemporary contracts, and are concomitantly less well-represented interms of permanent contracts:
Table 6.48: Comparison of Employment by Type of Contract (Permanent or Temporary; Q2, 2003)
Permanent Contract Temporary Contract
Total % in type of contract 88.93 11.07
% of MSNs in type of contract 89.69 10.31
% of TCNs in type of contract 80.60 19.40
% difference TCNs from MSNs 10.14 -88.26
% difference TCNs from total 9.38 -75.36
In the area of training, TCNs fare less well than Greek nationals,although the overall number of those who have recently receivedtraining is relatively low:
Table 6.49: Proportion of workers having receivedtraining in 4 weeks previous to survey (Q2, 2003)
Country-wide proportion receiving training in previous 4 wks 14.76
Percentage of MSNs receiving training in last 4 wks 14.91
Percentage of TCNs receiving training in last 4 wks 11.92
Percentage difference TCNs from MSNs 20.03
Percentage difference TCNs from total 19.21
35950 51-176 18/3/05 1:51 PM Page 95

96
While legally resident TCNs evidently have a high degree of access tothe Greek labour market, therefore, contractual and training issuesmay still need to be addressed. In addition to this, the LFS provideslittle in the way of data for those immigrants that hold an irregularstatus.
Overall performanceGreece’s performance over all five strands of policy indicators isbelow the European average. It is closest to the average in terms offamily reunion, and furthest from the average in terms of anti-discrimination.
Figure 6.57: Comparative Performance: Greece and EU Averages
Greece’s scores are thus less favourable in the cases of labour marketinclusion, long-term residence and family reunion, and moderatelyunfavourable on nationality and anti-discrimination.
In labour market inclusion, Greece is above the Europeanaverage in access and eligibility but below the European average onother strands, especially rights associated with labour marketparticipation.
Long-term residence is an area of low scores, with performancebelow the European average across all sections, and moderatelyunfavourable in terms of eligibility.
While marginally above the European average in terms of bothsecurity and rights (where it enjoys solid moderately favourable
Policy indicators
0.00
2.192.18 2.182.02
2.16
0.50
1.00
1.50
2.00
2.50
3.00
Eur Gre
Labour Market Inclusion Long-term Residence Nationailty Anti-DiscriminationFamily Reunion
1.78 1.781.89
1.71 1.71
35950 51-176 18/3/05 1:51 PM Page 96

97
Gre
ece
co
un
try
pro
file
scores), Greece performs poorly in the other areas of family reunion.Nationality is another area weakness, as Greece performs below
the European average in all indicators. This is most noticeable insecurity of status, an unfavourable 1.00.
In terms of anti-discrimination, Greece performs well inequality agencies, but it is below the European average in all otherstrands:
Labour market inclusion
Figure 6.58: Labour Market Inclusion: Greek Indicators and EU Averages
Long-term residence
Figure 6.59: Long-term Residence: Greek Indicators and EU Averages
0.00
0.50
1.00
1.50
2.00
2.50
3.00
Labour MarketInclusion
Eligibility Security ofEmployment
Status
Integration measures inthe Labour
Market
Rights Associatedwith Labour Market
Participation
Eur Gre
2.18
1.782.00
1.82
2.63
2.002.17
1.50 1.50
2.27
0.00
0.50
1.00
1.50
2.00
2.50
3.00
Long-term Residence
Eligibilityfor Status
Conditionsfor Acquisition
of Status
Security of Status
Rights Associatedwith Status
Eur Gre
2.19
1.78 1.89
1.33
2.13
1.60
2.172.00
2.34
1.88
35950 51-176 18/3/05 1:51 PM Page 97
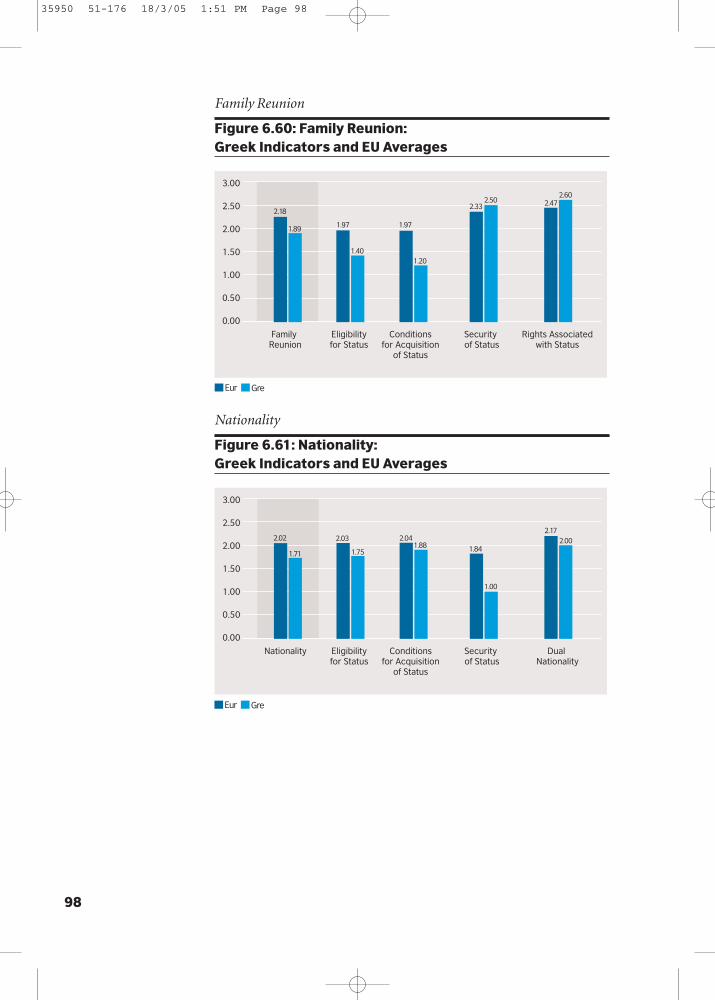
98
Family Reunion
Figure 6.60: Family Reunion: Greek Indicators and EU Averages
Nationality
Figure 6.61: Nationality: Greek Indicators and EU Averages
0.00
0.50
1.00
1.50
2.00
2.50
3.00
Family Reunion
Eligibilityfor Status
Conditionsfor Acquisition
of Status
Security of Status
Rights Associatedwith Status
Eur Gre
2.18
1.89 1.97 1.97
1.401.20
2.332.50 2.47
2.60
0.00
0.50
1.00
1.50
2.00
2.50
3.00
Nationality Eligibilityfor Status
Conditionsfor Acquisition
of Status
Security of Status
Dual Nationality
Eur Gre
2.02
1.711.84
2.03
1.751.88
2.04
1.00
2.172.00
35950 51-176 18/3/05 1:51 PM Page 98

99
Gre
ece
co
un
try
pro
file
Anti-Discrimination
Figure 6.62: Anti-Discrimination: Greek Indicators and EU Averages
0.00
0.50
1.00
1.50
2.00
2.50
3.00
Anti-Discrimination
Definitionsand scope
Remediesand
Sanctions
EqualityAgencies
Pro-activePolicies
Eur Gre
2.16
1.71 1.83
2.35
1.73 1.73
2.19
2.60
2.04
1.00
35950 51-176 18/3/05 1:51 PM Page 99

100
In 2002, Ireland was host to 182,000 foreigners (4.7% of thepopulation), including 95,300 foreign workers (5.4% of theworkforce).40 Of the overall foreign population, the majority are EUpassport holders (just over 100,000), though the number of non-EUnationals has been growing rapidly (52,000 to 80,000 from 2001 to2002). The main sources of foreign workers remained EU countries,especially the UK.
Ireland country profile
0.00
1.00
2.00
3.00
EligibilitySecurity of Employment Status
Labour Market Integration Measures
Rights Associated with Labour Market Participation
Eligibility for Status
Conditions for Acquisition of Status
Security of Status
Rights Associated with Status
Eligibility for Status
Conditions for Acquisition of Status
Security of StatusRights Associated with Status
Eligibility for Status
Conditions for Acquisition of Status
Security of Status
Dual Nationality
Definitions and Scope
Remedies and Sanctions
Equality Agencies
Pro-active Policies
Labour Market Inclusion Long-term Residence
Nationailty Anti-Discrimination
Family Reunion
Figure 6.63: Overview of Ireland’s Indicators
Background
40 Data in thisparagraph is drawnfrom OECD, Trends in InternationalMigration, AnnualReport 2003 (Paris,2003), pp158-161.
35950 51-176 18/3/05 1:51 PM Page 100
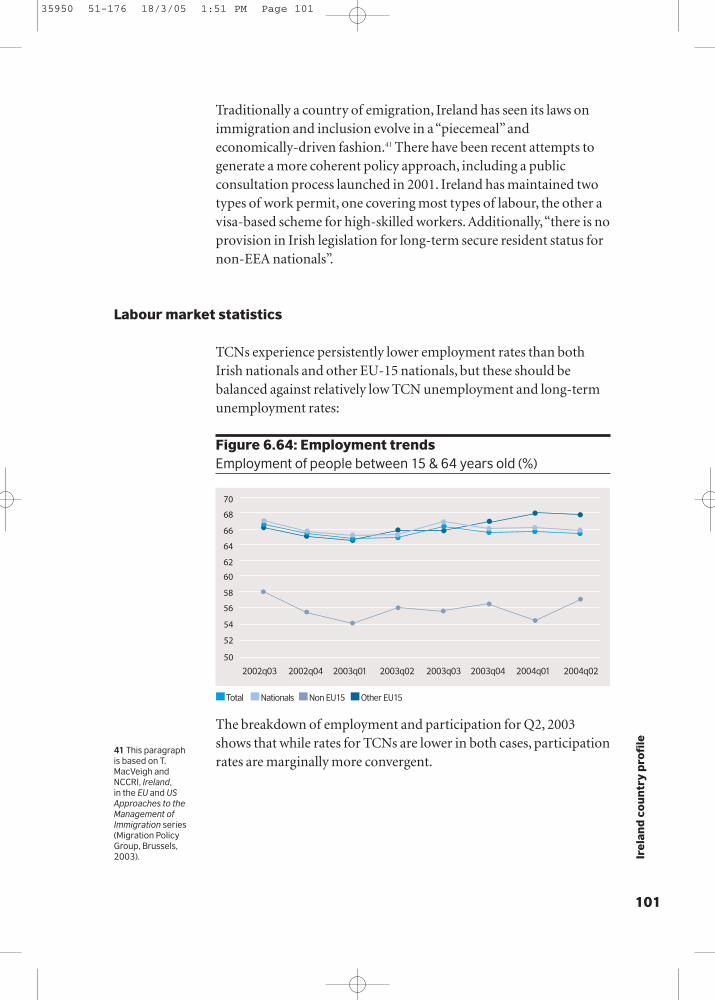
101
Ire
lan
d c
ou
ntr
y p
rofi
le
Traditionally a country of emigration, Ireland has seen its laws onimmigration and inclusion evolve in a “piecemeal”andeconomically-driven fashion.41 There have been recent attempts togenerate a more coherent policy approach, including a publicconsultation process launched in 2001. Ireland has maintained twotypes of work permit, one covering most types of labour, the other avisa-based scheme for high-skilled workers. Additionally,“there is noprovision in Irish legislation for long-term secure resident status fornon-EEA nationals”.
TCNs experience persistently lower employment rates than bothIrish nationals and other EU-15 nationals, but these should bebalanced against relatively low TCN unemployment and long-termunemployment rates:
Figure 6.64: Employment trendsEmployment of people between 15 & 64 years old (%)
The breakdown of employment and participation for Q2, 2003shows that while rates for TCNs are lower in both cases, participationrates are marginally more convergent.
Labour market statistics
Total Nationals Non EU15 Other EU15
2002q03 2002q04 2003q01 2003q02 2003q03 2003q04 2004q01 2004q02
50
54
52
56
60
58
64
62
66
70
68
41 This paragraph is based on T.MacVeigh andNCCRI, Ireland, in the EU and USApproaches to theManagement ofImmigration series(Migration PolicyGroup, Brussels,2003).
35950 51-176 18/3/05 1:51 PM Page 101
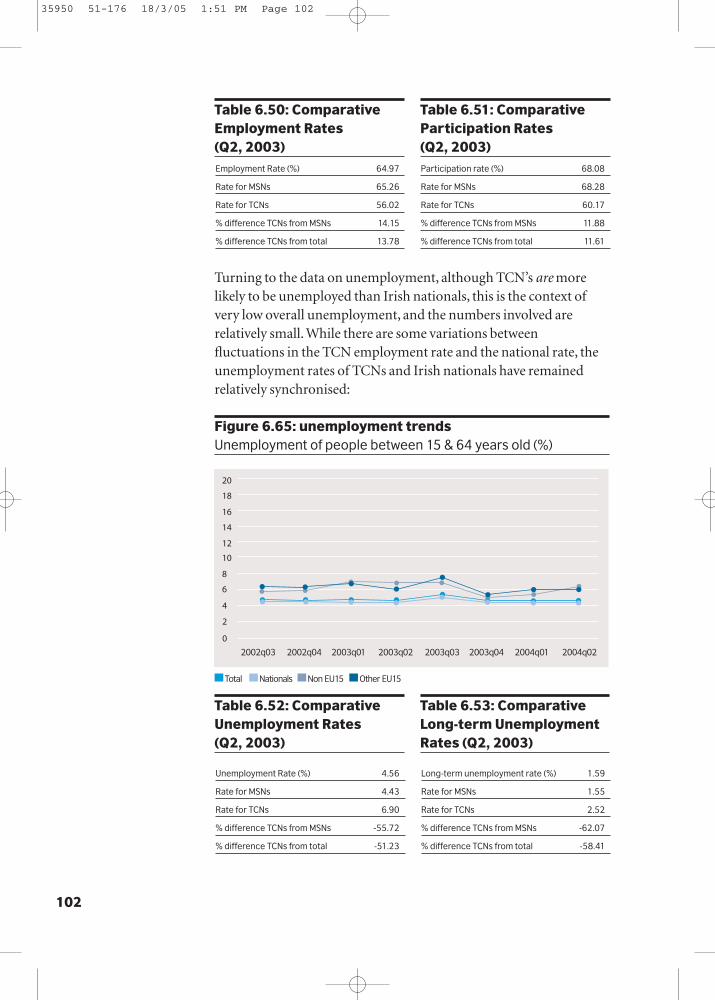
102
Turning to the data on unemployment, although TCN’s are morelikely to be unemployed than Irish nationals, this is the context ofvery low overall unemployment, and the numbers involved arerelatively small. While there are some variations betweenfluctuations in the TCN employment rate and the national rate, theunemployment rates of TCNs and Irish nationals have remainedrelatively synchronised:
Figure 6.65: unemployment trendsUnemployment of people between 15 & 64 years old (%)
Table 6.50: ComparativeEmployment Rates (Q2, 2003)
Table 6.51: ComparativeParticipation Rates (Q2, 2003)
Employment Rate (%) 64.97
Rate for MSNs 65.26
Rate for TCNs 56.02
% difference TCNs from MSNs 14.15
% difference TCNs from total 13.78
Participation rate (%) 68.08
Rate for MSNs 68.28
Rate for TCNs 60.17
% difference TCNs from MSNs 11.88
% difference TCNs from total 11.61
Total Nationals Non EU15 Other EU15
2002q03 2002q04 2003q01 2003q02 2003q03 2003q04 2004q01 2004q02
0
4
2
6
10
8
14
12
16
20
18
Unemployment Rate (%) 4.56
Rate for MSNs 4.43
Rate for TCNs 6.90
% difference TCNs from MSNs -55.72
% difference TCNs from total -51.23
Long-term unemployment rate (%) 1.59
Rate for MSNs 1.55
Rate for TCNs 2.52
% difference TCNs from MSNs -62.07
% difference TCNs from total -58.41
Table 6.52: ComparativeUnemployment Rates (Q2, 2003)
Table 6.53: ComparativeLong-term UnemploymentRates (Q2, 2003)
35950 51-176 18/3/05 1:51 PM Page 102

103
Ire
lan
d c
ou
ntr
y p
rofi
le
In terms of types of employment, however, there remain distinctdiscrepancies between TCNs and Irish nationals at all levels, mostclearly in middle and higher-skilled employment rates:
Table 6.54: Comparative Rates for Employment according to Skill (low, medium or high; Q2, 2003)
Low Medium High
Total employment rate 47.73 70.65 84.71
Rate for MSNs 47.92 71.24 86.24
Rate for TCNs 36.46 52.41 65.26
% difference TCNs from MSNs 23.91 26.44 24.32
% difference TCNs from total 23.61 25.82 22.96
While relatively few Irish nationals hold temporary contracts, theseare more common among TCNs, who are significantly less likely tohold permanent contracts than the national average:
Table 6.55: Comparison of Employment by Type of Contract (Permanent or Temporary; Q2, 2003
Permanent Contract Temporary Contract
Total % in type of contract 88.72 4.76
% of MSNs in type of contract 89.32 4.54
% of TCNs in type of contract 75.33 10.88
% difference TCNs from MSNs 15.66 -139.70
% difference TCNs from total 15.09 -128.35
Both Irish nationals and TCNs enjoy high rates of training relative toother EU member-states, with TCNs more likely to have recentlyreceived training. This is an apparent area of strength:
Table 6.56: Proportion of workers having receivedtraining in 4 weeks previous to survey (Q2, 2003)
Country-wide proportion receiving training in previous 4 wks 22.32
Percentage of MSNs receiving training in last 4 wks 22.31
Percentage of TCNs receiving training in last 4 wks 25.96
Percentage difference TCNs from MSNs -16.36
Percentage difference TCNs from total -16.30
Overall, the experience of TCNs in Ireland is thus reasonably positivein terms of comparative unemployment and training rates, butquestions remain over access to permanent contracts and higher-skilled employment.
35950 51-176 18/3/05 1:51 PM Page 103
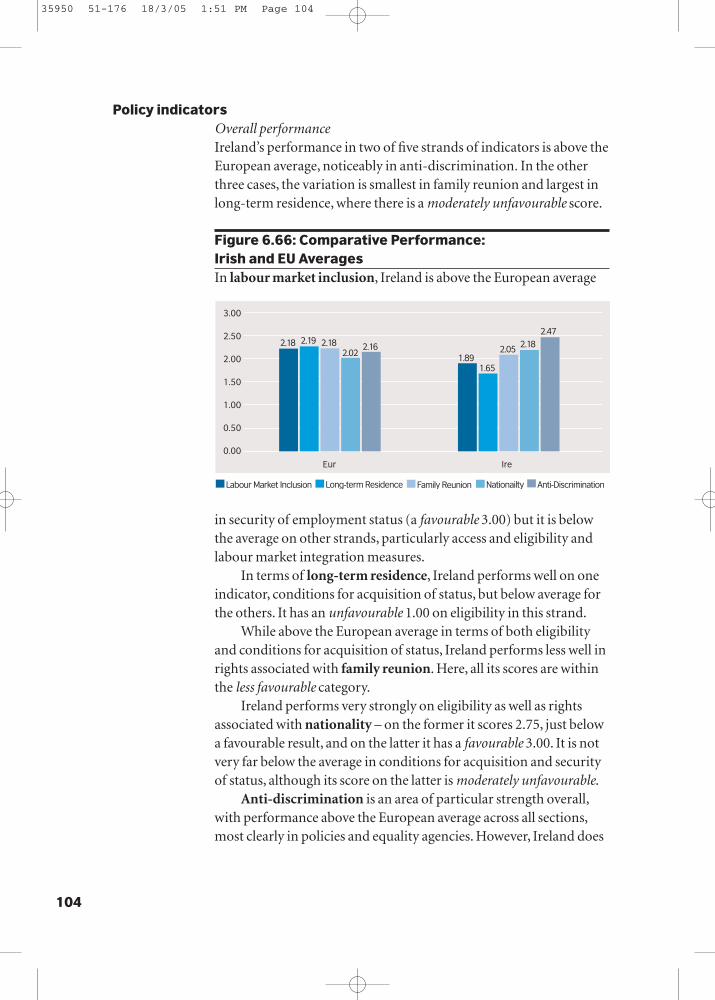
104
Overall performanceIreland’s performance in two of five strands of indicators is above theEuropean average, noticeably in anti-discrimination. In the otherthree cases, the variation is smallest in family reunion and largest inlong-term residence, where there is a moderately unfavourable score.
Figure 6.66: Comparative Performance: Irish and EU AveragesIn labour market inclusion, Ireland is above the European average
in security of employment status (a favourable 3.00) but it is belowthe average on other strands, particularly access and eligibility andlabour market integration measures.
In terms of long-term residence, Ireland performs well on oneindicator, conditions for acquisition of status, but below average forthe others. It has an unfavourable 1.00 on eligibility in this strand.
While above the European average in terms of both eligibilityand conditions for acquisition of status, Ireland performs less well inrights associated with family reunion. Here, all its scores are withinthe less favourable category.
Ireland performs very strongly on eligibility as well as rightsassociated with nationality – on the former it scores 2.75, just belowa favourable result, and on the latter it has a favourable 3.00. It is notvery far below the average in conditions for acquisition and securityof status, although its score on the latter is moderately unfavourable.
Anti-discrimination is an area of particular strength overall,with performance above the European average across all sections,most clearly in policies and equality agencies. However, Ireland does
Policy indicators
0.00
2.192.18 2.182.02
2.16
0.50
1.00
1.50
2.00
2.50
3.00
Eur Ire
Labour Market Inclusion Long-term Residence Nationailty Anti-DiscriminationFamily Reunion
1.891.65
2.05 2.182.47
35950 51-176 18/3/05 1:51 PM Page 104

105
Ire
lan
d c
ou
ntr
y p
rofi
le
not have any outstanding favourable scores in this strand.
Labour market inclusion
Figure 6.67: Labour Market Inclusion: Irish Indicators and EU Averages
Long-term residence
Figure 6.68: Long-term Residence: Irish Indicators and EU Averages
0.00
0.50
1.00
1.50
2.00
2.50
3.00
Labour MarketInclusion
Eligibility Security ofEmployment
Status
Integration measures inthe Labour
Market
Rights Associatedwith Labour Market
Participation
Eur Ire
2.18
1.89
1.33
1.82
2.63
3.00
2.17
1.50
2.00
2.27
0.00
0.50
1.00
1.50
2.00
2.50
3.00
Long-term Residence
Eligibilityfor Status
Conditionsfor Acquisition
of Status
Security of Status
Rights Associatedwith Status
Eur Ire
2.19
1.651.89
1.00
2.13 2.20 2.17
1.57
2.34
1.63
35950 51-176 18/3/05 1:51 PM Page 105
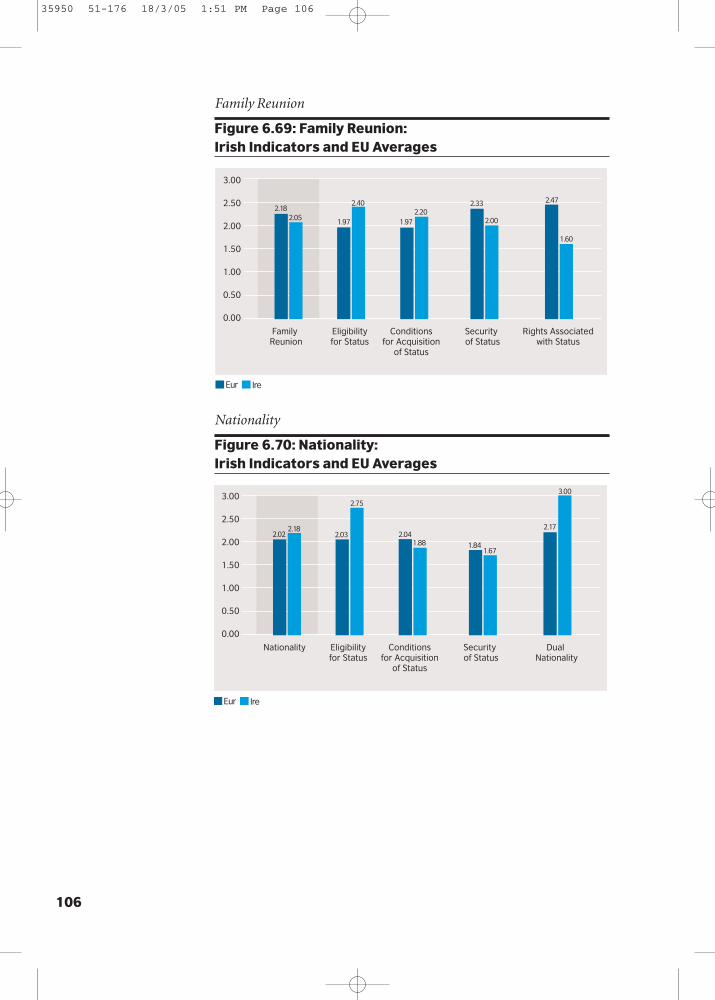
106
Family Reunion
Figure 6.69: Family Reunion: Irish Indicators and EU Averages
Nationality
Figure 6.70: Nationality: Irish Indicators and EU Averages
0.00
0.50
1.00
1.50
2.00
2.50
3.00
Family Reunion
Eligibilityfor Status
Conditionsfor Acquisition
of Status
Security of Status
Rights Associatedwith Status
Eur Ire
2.182.05
1.97 1.97
2.402.20
2.33
2.00
2.47
1.60
0.00
0.50
1.00
1.50
2.00
2.50
3.00
Nationality Eligibilityfor Status
Conditionsfor Acquisition
of Status
Security of Status
Dual Nationality
Eur Ire
2.022.18
1.84
2.03
2.75
1.882.04
1.67
2.17
3.00
35950 51-176 18/3/05 1:51 PM Page 106

107
Ire
lan
d c
ou
ntr
y p
rofi
le
Anti-Discrimination
Figure 6.71: Anti-Discrimination: Irish Indicators and EU Averages
0.00
0.50
1.00
1.50
2.00
2.50
3.00
Anti-Discrimination
Definitionsand scope
Remediesand
Sanctions
EqualityAgencies
Pro-activePolicies
Eur Ire
2.162.47
1.83
2.35
2.64
2.272.19
2.60
2.04
2.43
35950 51-176 18/3/05 1:51 PM Page 107

108
In 2001, Italy was host to 1,362,000 foreigners (9.3% of thepopulation), including 803,100 foreign workers, the majority ofwhom live in the northern regions (773,400).42 Of the overall foreignpopulation, most were European (563,900) The main non-EUnationalities of TCNs are Moroccans, Albanians, Romanians,Filipinos and Chinese.
Italy first encountered significant net immigration in the later
Italy country profile
0.00
1.00
2.00
3.00
EligibilitySecurity of Employment Status
Labour Market Integration Measures
Rights Associated with Labour Market Participation
Eligibility for Status
Conditions for Acquisition of Status
Security of Status
Rights Associated with Status
Eligibility for Status
Conditions for Acquisition of Status
Security of StatusRights Associated with Status
Eligibility for Status
Conditions for Acquisition of Status
Security of Status
Dual Nationality
Definitions and Scope
Remedies and Sanctions
Equality Agencies
Pro-active Policies
Labour Market Inclusion Long-term Residence
Nationailty Anti-Discrimination
Family Reunion
Figure 6.72: Overview of Italy’s Indicators
Background
42 Data in thisparagraph is drawnfrom OECD, Trends in InternationalMigration, AnnualReport 2003 (Paris,2003), pp158-161.
35950 51-176 18/3/05 1:51 PM Page 108
109
Ital
y co
un
try
pro
file
1980s, and it has been argued that it has been relatively slow toformulate a long-term policy response.43 Since 1990, new legislationin this area has been common, with a 1998 framework law receivingsignificant updating in 2002.
Italian migration policy includes a quota system that favourscertain (mainly Mediterranean) countries, but TCNs access to workpermits is based on the specific needs of employers. The 1998 lawintroduced a long-term residence permit, currently open to TCNswho have been in Italy for six years, for the first time.
Italy does not as yet publish data comparable to that of the othercountries analysed here, although this might change in the nearfuture. ISTAT, the national statistical body which providesinformation for the European Labour Force Survey, reportedrecently that is has modified its format of enquiry “in line with thedispositions of the EU”.44
In the absence of LFS data, we therefore resort to the variousreports on migrants provided by civil society organisations such asCARITAS (a Catholic organisation), INAIL (workers’ insuranceassociation), and IRES (union-funded research institute). Each ofthese organisations focuses on different aspects according to theirrespective interests, but at least provide some details of the labourmarket experience of immigrants in Italy.
As with other Southern European countries, there are also highestimates of irregular working in Italy, which render any statisticalaccounts of the labour market situation for immigrants lesscomplete, although still valuable. As is the case with Greece, forexample, data shows lower rates of unemployment for immigrants.The annual report on immigration produced by CARITAS45 reportedthat for 2001 the unemployment rate for immigrants was 7.4%,which is lower than the national rate of 9.5%. Data from INAIL alsosuggests that immigrants are less likely to be employed in temporaryor fixed term contracts than Italian nationals. The percentage ofimmigrants employed in fixed term contracts was 25.4% comparedwith a national rate of 32.8%.
Labour market statistics
43 The followingparagraphs arebased on J. Chaloff,Italy, in the EU andUS Approaches tothe Management of Immigration series(Migration PolicyGroup, Brussels,2003).44 Posted on theISTAT website, 28September 2004http://www.istat.it/Imprese/Storico/index.htm.45 http://www.caritasroma.it/immigrazione/
35950 51-176 18/3/05 1:51 PM Page 109

110
Overall performanceItaly’s performance in two of five strands, labour market inclusionand nationality, is above the European average. Its strand scores areall in the upper part of the less favourable category.
Figure 6.73: Comparative Performance: Italy and EU Averages
Italy’s performance across labour market indicators is extremelyvaried. In terms of both security of employment status and rights, ithas favourable 3.00 scores well above the European average.Yet itscores an unfavourable 1.00 on access and eligibility, balancing thesestrong scores.
In terms of long-term residence, Italy again has anunfavourable performance on eligibility, but does well elsewhere. Inmost elements, there is little variation between the Italian andEuropean averages.
There is a similar lack of variation from the European averages,across all sections within family reunion – its performance in termsof associated rights in this area is marginally weaker than other partsof this strand.
Though it has moderately unfavourable scores on rights and, toa lesser extent, security of status, Italy is above the European averageon the other indicators for nationality.
Italy’s performance on anti-discrimination is extremely varied,with a particularly strong moderately favourable performance ondefinitions and scope. Conversely, it scores an unfavourable 1.00 onequality agencies and a moderately unfavourable 1.57 on policies.
Policy indicators
0.00
2.192.18 2.182.02
2.16
0.50
1.00
1.50
2.00
2.50
3.00
Eur Ita
Labour Market Inclusion Long-term Residence Nationailty Anti-DiscriminationFamily Reunion
2.222.09 2.16 2.06 2.06
35950 51-176 18/3/05 1:51 PM Page 110
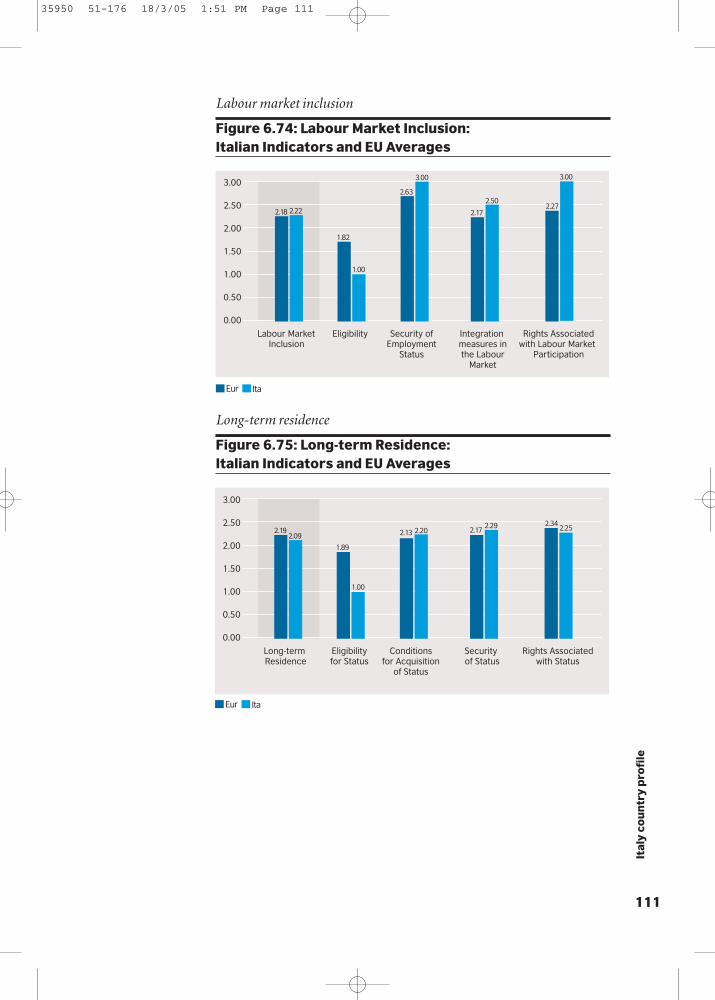
111
Ital
y co
un
try
pro
file
Labour market inclusion
Figure 6.74: Labour Market Inclusion: Italian Indicators and EU Averages
Long-term residence
Figure 6.75: Long-term Residence: Italian Indicators and EU Averages
0.00
0.50
1.00
1.50
2.00
2.50
3.00
Labour MarketInclusion
Eligibility Security ofEmployment
Status
Integration measures inthe Labour
Market
Rights Associatedwith Labour Market
Participation
Eur Ita
2.18 2.22
1.00
1.82
2.63
3.00
2.17
2.50
3.00
2.27
0.00
0.50
1.00
1.50
2.00
2.50
3.00
Long-term Residence
Eligibilityfor Status
Conditionsfor Acquisition
of Status
Security of Status
Rights Associatedwith Status
Eur Ita
2.192.09
1.89
1.00
2.13 2.20 2.172.29 2.34
2.25
35950 51-176 18/3/05 1:51 PM Page 111
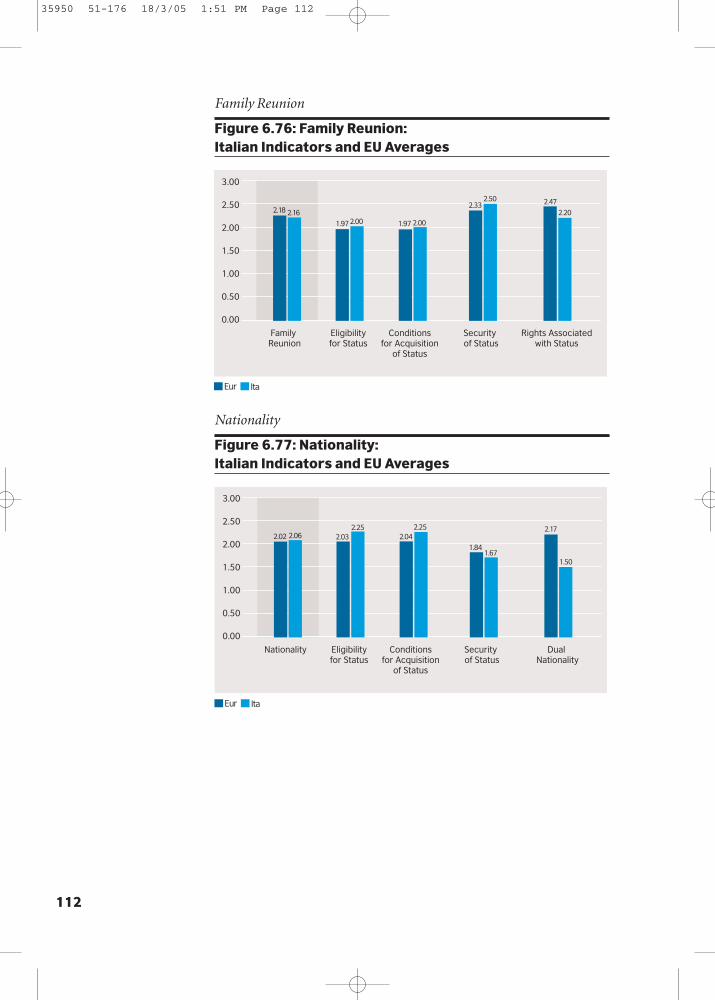
112
Family Reunion
Figure 6.76: Family Reunion: Italian Indicators and EU Averages
Nationality
Figure 6.77: Nationality: Italian Indicators and EU Averages
0.00
0.50
1.00
1.50
2.00
2.50
3.00
Family Reunion
Eligibilityfor Status
Conditionsfor Acquisition
of Status
Security of Status
Rights Associatedwith Status
Eur Ita
2.18 2.16
1.97 1.972.00 2.00
2.332.50 2.47
2.20
0.00
0.50
1.00
1.50
2.00
2.50
3.00
Nationality Eligibilityfor Status
Conditionsfor Acquisition
of Status
Security of Status
Dual Nationality
Eur Ita
2.02 2.06
1.84
2.032.25 2.25
2.04
1.67
2.17
1.50
35950 51-176 18/3/05 1:51 PM Page 112

113
Ital
y co
un
try
pro
file
Anti-Discrimination
Figure 6.78: Anti-Discrimination: Italian Indicators and EU Averages
0.00
0.50
1.00
1.50
2.00
2.50
3.00
Anti-Discrimination
Definitionsand scope
Remediesand
Sanctions
EqualityAgencies
Pro-activePolicies
Eur Ita
2.162.06
1.83
2.35
2.73
2.182.19
1.00
2.04
1.57
35950 51-176 18/3/05 1:51 PM Page 113

114
In 2001, Luxembourg was host to 166,720 foreigners (37% of thepopulation), and 170,700 foreign workers (61% of the workforce).101,300 of these were made up of cross-border workers, including52,900 from France.46 Of the overall foreign population, 78% are EUnationals, with the Portuguese community accounting for more thana third of this (13.4% of the total population). Foreigners frombordering countries (France, Belgium and Germany) accounted for
Luxembourg country profile
0.00
1.00
2.00
3.00
EligibilitySecurity of Employment Status
Labour Market Integration Measures
Rights Associated with Labour Market Participation
Eligibility for Status
Conditions for Acquisition of Status
Security of Status
Rights Associated with Status
Eligibility for Status
Conditions for Acquisition of Status
Security of StatusRights Associated with Status
Eligibility for Status
Conditions for Acquisition of Status
Security of Status
Dual Nationality
Definitions and Scope
Remedies and Sanctions
Equality Agencies
Pro-active Policies
Labour Market Inclusion Long-term Residence
Nationailty Anti-Discrimination
Family Reunion
Figure 6.79: Overview of Luxembourg’s Indicators
Background
46 Data in thisparagraph is drawnfrom OECD, Trends in InternationalMigration, AnnualReport 2003 (Paris,2003), pp158-161.
35950 51-176 18/3/05 1:51 PM Page 114
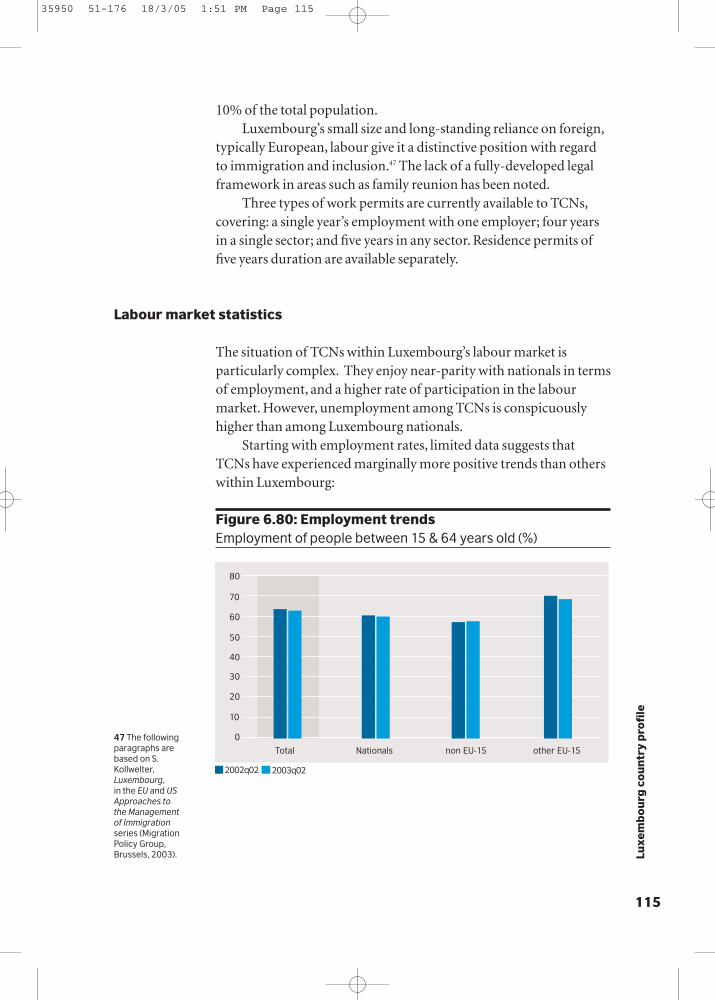
115
Luxe
mb
ou
rg c
ou
ntr
y p
rofi
le
10% of the total population.Luxembourg’s small size and long-standing reliance on foreign,
typically European, labour give it a distinctive position with regardto immigration and inclusion.47 The lack of a fully-developed legalframework in areas such as family reunion has been noted.
Three types of work permits are currently available to TCNs,covering: a single year’s employment with one employer; four yearsin a single sector; and five years in any sector. Residence permits offive years duration are available separately.
The situation of TCNs within Luxembourg’s labour market isparticularly complex. They enjoy near-parity with nationals in termsof employment, and a higher rate of participation in the labourmarket. However, unemployment among TCNs is conspicuouslyhigher than among Luxembourg nationals.
Starting with employment rates, limited data suggests thatTCNs have experienced marginally more positive trends than otherswithin Luxembourg:
Figure 6.80: Employment trendsEmployment of people between 15 & 64 years old (%)
Labour market statistics
0
20
30
40
50
60
70
10
80
Total Nationals non EU-15 other EU-15
2002q02 2003q02
47 The followingparagraphs arebased on S.Kollwelter,Luxembourg, in the EU and USApproaches to the Management of Immigrationseries (MigrationPolicy Group,Brussels, 2003).
35950 51-176 18/3/05 1:51 PM Page 115

116
Conversely, a look at trends in unemployment rates demonstrates amarkedly less positive trend for TCNs when compared with MSNs.The LFS shows that for the last two years TCNs have experiencedmuch higher rates than other nationalities, and this trend isincreasing within the context of rising total unemployment:
Figure 6.81: Unemployment trendsUnemployment of people between 15 & 64 years old (%)
When the figures are broken down to overall and long-term rates, wecan see that long-term unemployment for TCNs is significantlyhigher in percentage terms than for MSNs, although this is in thecontext of very low long-term unemployment overall:
Table 6.57: ComparativeEmployment Rates (Q2, 2003)
Table 6.58: ComparativeParticipation Rates (Q2, 2003)
Employment Rate (%) 62.72
Rate for MSNs 59.55
Rate for TCNs 57.37
% difference TCNs from MSNs 3.65
% difference TCNs from total 8.52
Participation rate (%) 65.12
Rate for MSNs 61.04
Rate for TCNs 64.25
% difference TCNs from MSNs -5.25
% difference TCNs from total 1.34
0
2
4
6
8
10
12
14
16
18
20
Total Nationals non EU-15 other EU-15
2002q02 2003q02
35950 51-176 18/3/05 1:51 PM Page 116
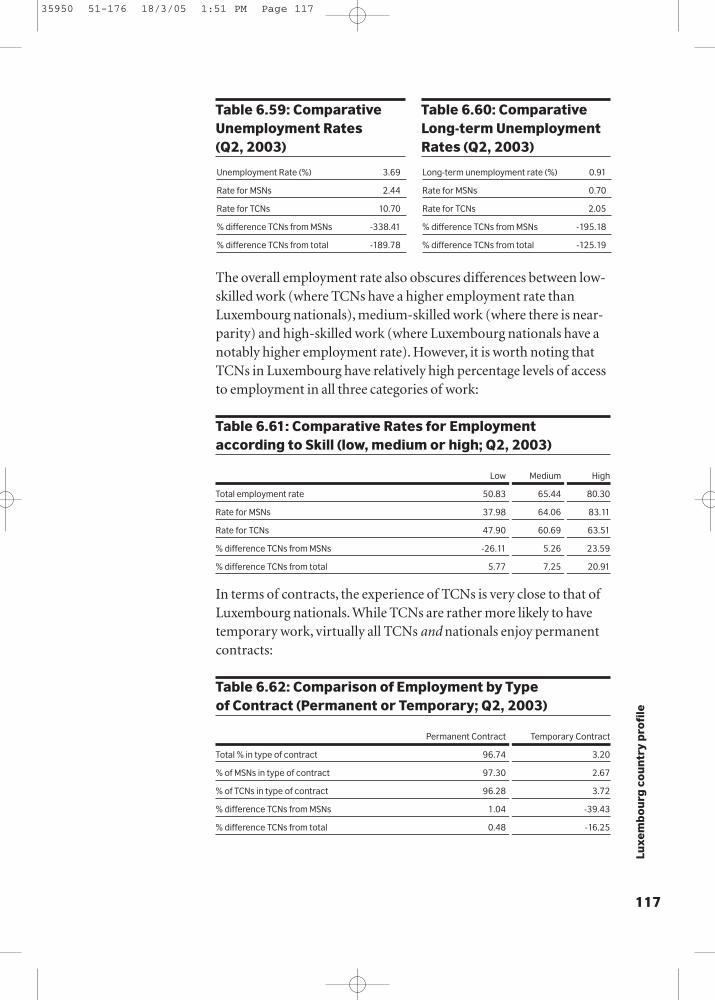
117
Luxe
mb
ou
rg c
ou
ntr
y p
rofi
le
The overall employment rate also obscures differences between low-skilled work (where TCNs have a higher employment rate thanLuxembourg nationals), medium-skilled work (where there is near-parity) and high-skilled work (where Luxembourg nationals have anotably higher employment rate). However, it is worth noting thatTCNs in Luxembourg have relatively high percentage levels of accessto employment in all three categories of work:
Table 6.61: Comparative Rates for Employment according to Skill (low, medium or high; Q2, 2003)
Low Medium High
Total employment rate 50.83 65.44 80.30
Rate for MSNs 37.98 64.06 83.11
Rate for TCNs 47.90 60.69 63.51
% difference TCNs from MSNs -26.11 5.26 23.59
% difference TCNs from total 5.77 7.25 20.91
In terms of contracts, the experience of TCNs is very close to that ofLuxembourg nationals. While TCNs are rather more likely to havetemporary work, virtually all TCNs and nationals enjoy permanentcontracts:
Table 6.62: Comparison of Employment by Type of Contract (Permanent or Temporary; Q2, 2003)
Permanent Contract Temporary Contract
Total % in type of contract 96.74 3.20
% of MSNs in type of contract 97.30 2.67
% of TCNs in type of contract 96.28 3.72
% difference TCNs from MSNs 1.04 -39.43
% difference TCNs from total 0.48 -16.25
Unemployment Rate (%) 3.69
Rate for MSNs 2.44
Rate for TCNs 10.70
% difference TCNs from MSNs -338.41
% difference TCNs from total -189.78
Long-term unemployment rate (%) 0.91
Rate for MSNs 0.70
Rate for TCNs 2.05
% difference TCNs from MSNs -195.18
% difference TCNs from total -125.19
Table 6.59: ComparativeUnemployment Rates (Q2, 2003)
Table 6.60: ComparativeLong-term UnemploymentRates (Q2, 2003)
35950 51-176 18/3/05 1:51 PM Page 117

118
Similarly, TCNs and Luxembourg nationals have near-parity interms of access to training, with only marginally more nationalshaving been recently trained:
Table 6.63: Proportion of workers having receivedtraining in 4 weeks previous to survey (Q2, 2003)
Country-wide proportion receiving training in previous 4 wks 17.24
Percentage of MSNs receiving training in last 4 wks 18.90
Percentage of TCNs receiving training in last 4 wks 18.20
Percentage difference TCNs from MSNs 3.71
Percentage difference TCNs from total -5.52
Luxembourg’s small labour market seems, therefore, to offersignificant opportunities to TCNs within it. The relatively high levelof TCN unemployment should, nonetheless, be noted.
Overall performanceLuxembourg performs above the European average on nationalityand below on all others, with a markedly low score on anti-discrimination, where it has a moderately unfavourable score:
Figure 6.82: Comparative Performance: Luxembourg and EU Averages
In labour market inclusion, Luxembourg is above the Europeanaverage on rights associated with labour market participation butwell below the average in all other aspects, save labour market
Policy indicators
0.00
2.192.18 2.182.02
2.16
0.50
1.00
1.50
2.00
2.50
3.00
Eur Lux
Labour Market Inclusion Long-term Residence Nationailty Anti-DiscriminationFamily Reunion
2.00 2.002.18
1.78
1.38
35950 51-176 18/3/05 1:51 PM Page 118
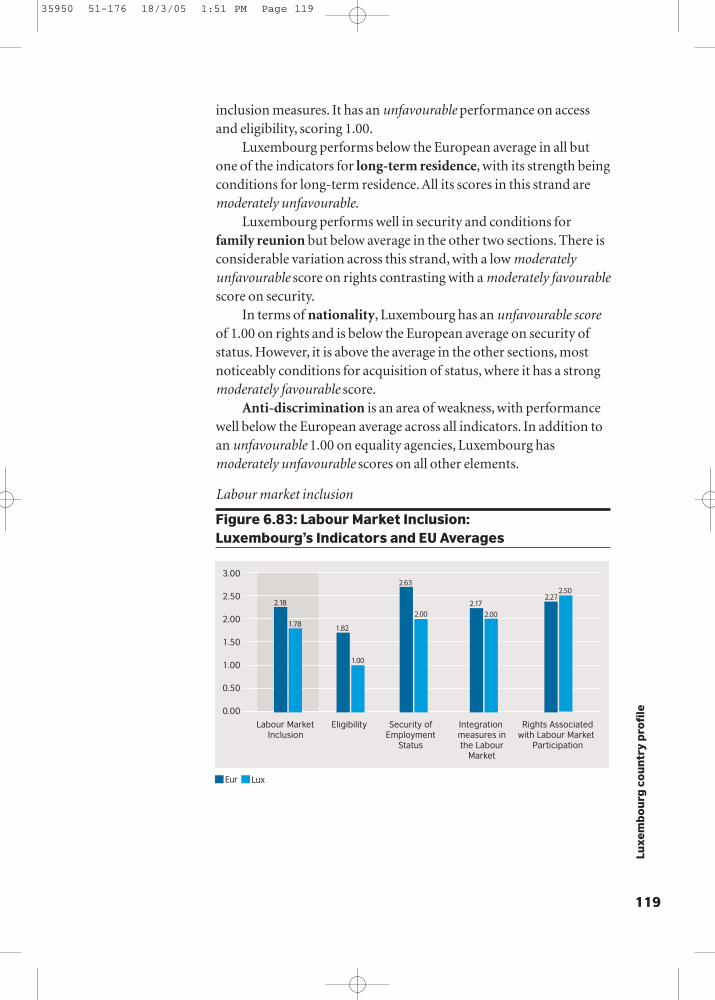
119
Luxe
mb
ou
rg c
ou
ntr
y p
rofi
le
inclusion measures. It has an unfavourable performance on accessand eligibility, scoring 1.00.
Luxembourg performs below the European average in all butone of the indicators for long-term residence, with its strength beingconditions for long-term residence. All its scores in this strand aremoderately unfavourable.
Luxembourg performs well in security and conditions forfamily reunion but below average in the other two sections. There isconsiderable variation across this strand, with a low moderatelyunfavourable score on rights contrasting with a moderately favourablescore on security.
In terms of nationality, Luxembourg has an unfavourable scoreof 1.00 on rights and is below the European average on security ofstatus. However, it is above the average in the other sections, mostnoticeably conditions for acquisition of status, where it has a strongmoderately favourable score.
Anti-discrimination is an area of weakness, with performancewell below the European average across all indicators. In addition toan unfavourable 1.00 on equality agencies, Luxembourg hasmoderately unfavourable scores on all other elements.
Labour market inclusion
Figure 6.83: Labour Market Inclusion: Luxembourg’s Indicators and EU Averages
0.00
0.50
1.00
1.50
2.00
2.50
3.00
Labour MarketInclusion
Eligibility Security ofEmployment
Status
Integration measures inthe Labour
Market
Rights Associatedwith Labour Market
Participation
Eur Lux
2.18
1.78
1.00
1.82
2.63
2.00
2.17
2.00
2.502.27
35950 51-176 18/3/05 1:51 PM Page 119

120
Long-term residence
Figure 6.84: Long-term Residence: Luxembourg’s Indicators and EU Averages
Family Reunion
Figure 6.85: Family Reunion: Luxembourg’s Indicators and EU Averages
0.00
0.50
1.00
1.50
2.00
2.50
3.00
Family Reunion
Eligibilityfor Status
Conditionsfor Acquisition
of Status
Security of Status
Rights Associatedwith Status
Eur Lux
2.182.00 1.97 1.97
1.80
2.40 2.332.50 2.47
1.40
0.00
0.50
1.00
1.50
2.00
2.50
3.00
Long-term Residence
Eligibilityfor Status
Conditionsfor Acquisition
of Status
Security of Status
Rights Associatedwith Status
Eur Lux
2.192.00
1.891.67
2.13
2.402.17
1.71
2.34
2.13
35950 51-176 18/3/05 1:51 PM Page 120
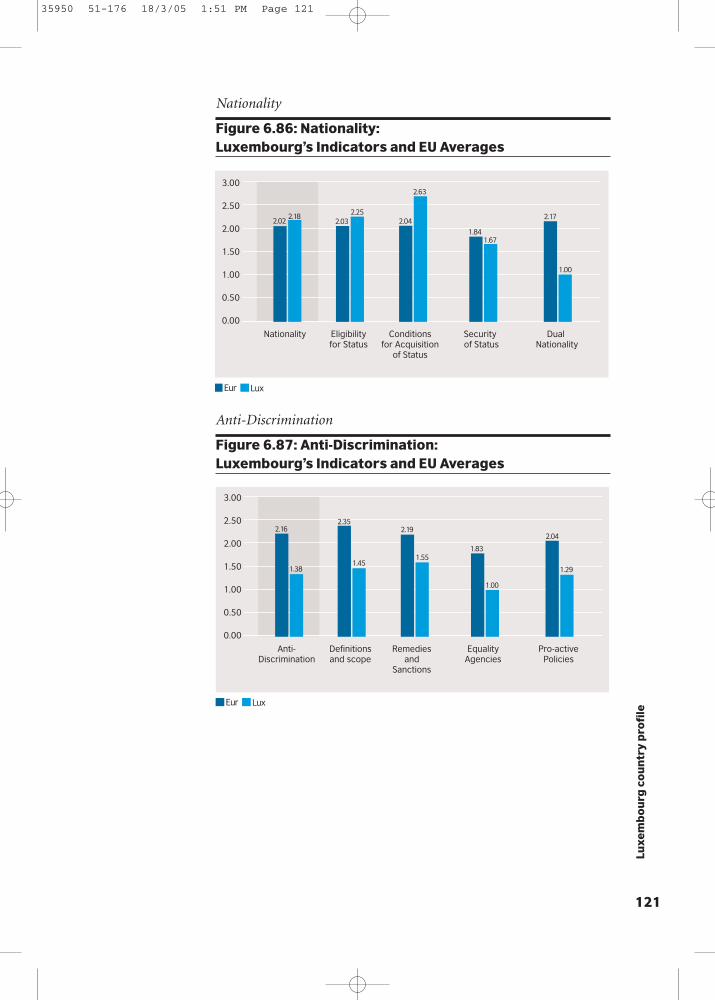
121
Luxe
mb
ou
rg c
ou
ntr
y p
rofi
le
Nationality
Figure 6.86: Nationality: Luxembourg’s Indicators and EU Averages
Anti-Discrimination
Figure 6.87: Anti-Discrimination: Luxembourg’s Indicators and EU Averages
0.00
0.50
1.00
1.50
2.00
2.50
3.00
Nationality Eligibilityfor Status
Conditionsfor Acquisition
of Status
Security of Status
Dual Nationality
Eur Lux
2.022.18
1.84
2.032.25
2.63
2.04
1.67
2.17
1.00
0.00
0.50
1.00
1.50
2.00
2.50
3.00
Anti-Discrimination
Definitionsand scope
Remediesand
Sanctions
EqualityAgencies
Pro-activePolicies
Eur Lux
2.16
1.38
1.83
2.35
1.451.55
2.19
1.00
2.04
1.29
35950 51-176 18/3/05 1:51 PM Page 121

In 2001, the Netherlands was host to 690,000 foreigners (4.3% of thepopulation).48 Of the overall foreign population, a third were fromthe European Union whilst Turkish and Moroccan citizens eachrepresented 15%.
Immigration and inclusion are currently the subject of heatedpolitical debate within the Netherlands.49 Migration and inclusionhave been the subject of relatively recent legislative activity, with the
122
Netherlands country profile
0.00
1.00
2.00
3.00
EligibilitySecurity of Employment Status
Labour Market Integration Measures
Rights Associated with Labour Market Participation
Eligibility for Status
Conditions for Acquisition of Status
Security of Status
Rights Associated with Status
Eligibility for Status
Conditions for Acquisition of Status
Security of StatusRights Associated with Status
Eligibility for Status
Conditions for Acquisition of Status
Security of Status
Dual Nationality
Definitions and Scope
Remedies and Sanctions
Equality Agencies
Pro-active Policies
Labour Market Inclusion Long-term Residence
Nationailty Anti-Discrimination
Family Reunion
Figure 6.88: Overview of Netherlands’ Indicators
Background
48 Data in thisparagraph is drawnfrom OECD, Trends inInternationalMigration, AnnualReport 2003 (Paris,2003), pp158-161.
35950 51-176 18/3/05 1:51 PM Page 122
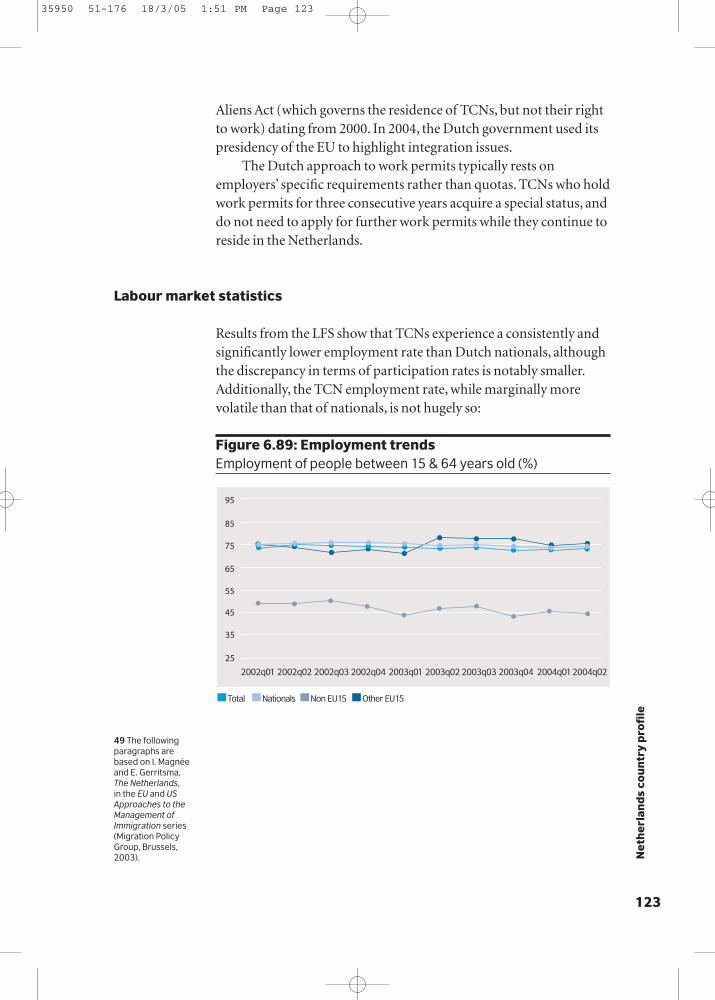
123
Ne
the
rlan
ds
cou
ntr
y p
rofi
le
Aliens Act (which governs the residence of TCNs, but not their rightto work) dating from 2000. In 2004, the Dutch government used itspresidency of the EU to highlight integration issues.
The Dutch approach to work permits typically rests onemployers’ specific requirements rather than quotas. TCNs who holdwork permits for three consecutive years acquire a special status, anddo not need to apply for further work permits while they continue toreside in the Netherlands.
Results from the LFS show that TCNs experience a consistently andsignificantly lower employment rate than Dutch nationals, althoughthe discrepancy in terms of participation rates is notably smaller.Additionally, the TCN employment rate, while marginally morevolatile than that of nationals, is not hugely so:
Figure 6.89: Employment trendsEmployment of people between 15 & 64 years old (%)
Labour market statistics
Total Nationals Non EU15 Other EU15
2002q01 2002q02 2002q03 2002q04 2003q01 2003q02 2003q03 2003q04 2004q012004q02
25
35
45
55
75
65
85
95
49 The followingparagraphs arebased on I. Magnéeand E. Gerritsma,The Netherlands, in the EU and USApproaches to theManagement ofImmigration series(Migration PolicyGroup, Brussels,2003).
35950 51-176 18/3/05 1:51 PM Page 123
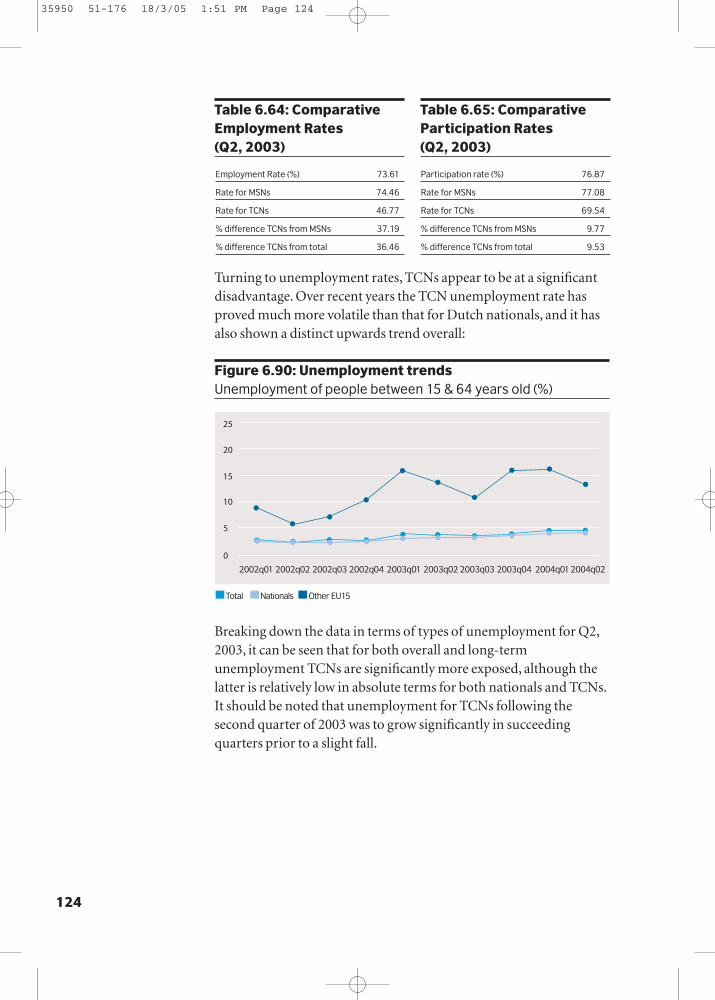
Turning to unemployment rates, TCNs appear to be at a significantdisadvantage. Over recent years the TCN unemployment rate hasproved much more volatile than that for Dutch nationals, and it hasalso shown a distinct upwards trend overall:
Figure 6.90: Unemployment trendsUnemployment of people between 15 & 64 years old (%)
Breaking down the data in terms of types of unemployment for Q2,2003, it can be seen that for both overall and long-termunemployment TCNs are significantly more exposed, although thelatter is relatively low in absolute terms for both nationals and TCNs.It should be noted that unemployment for TCNs following thesecond quarter of 2003 was to grow significantly in succeedingquarters prior to a slight fall.
124
Total Nationals Other EU15
2002q01 2002q02 2002q03 2002q04 2003q01 2003q02 2003q03 2003q04 2004q012004q02
0
5
10
15
20
25
Table 6.64: ComparativeEmployment Rates (Q2, 2003)
Table 6.65: ComparativeParticipation Rates (Q2, 2003)
Employment Rate (%) 73.61
Rate for MSNs 74.46
Rate for TCNs 46.77
% difference TCNs from MSNs 37.19
% difference TCNs from total 36.46
Participation rate (%) 76.87
Rate for MSNs 77.08
Rate for TCNs 69.54
% difference TCNs from MSNs 9.77
% difference TCNs from total 9.53
35950 51-176 18/3/05 1:51 PM Page 124
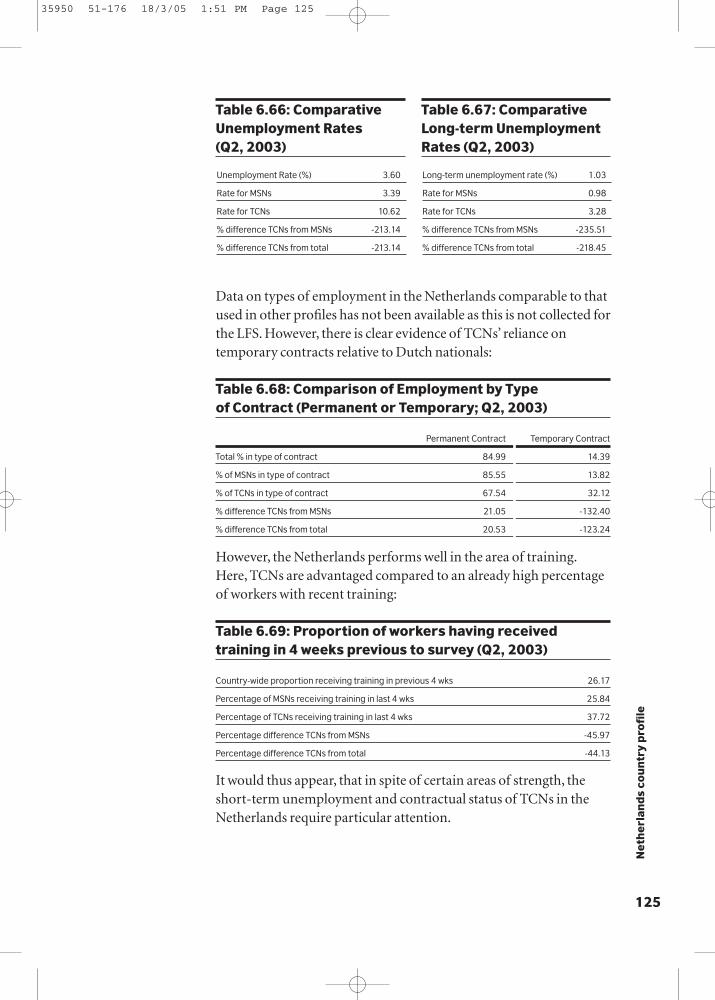
Data on types of employment in the Netherlands comparable to thatused in other profiles has not been available as this is not collected forthe LFS. However, there is clear evidence of TCNs’ reliance ontemporary contracts relative to Dutch nationals:
Table 6.68: Comparison of Employment by Type of Contract (Permanent or Temporary; Q2, 2003)
Permanent Contract Temporary Contract
Total % in type of contract 84.99 14.39
% of MSNs in type of contract 85.55 13.82
% of TCNs in type of contract 67.54 32.12
% difference TCNs from MSNs 21.05 -132.40
% difference TCNs from total 20.53 -123.24
However, the Netherlands performs well in the area of training.Here, TCNs are advantaged compared to an already high percentageof workers with recent training:
Table 6.69: Proportion of workers having receivedtraining in 4 weeks previous to survey (Q2, 2003)
Country-wide proportion receiving training in previous 4 wks 26.17
Percentage of MSNs receiving training in last 4 wks 25.84
Percentage of TCNs receiving training in last 4 wks 37.72
Percentage difference TCNs from MSNs -45.97
Percentage difference TCNs from total -44.13
It would thus appear, that in spite of certain areas of strength, theshort-term unemployment and contractual status of TCNs in theNetherlands require particular attention.
125
Ne
the
rlan
ds
cou
ntr
y p
rofi
le
Unemployment Rate (%) 3.60
Rate for MSNs 3.39
Rate for TCNs 10.62
% difference TCNs from MSNs -213.14
% difference TCNs from total -213.14
Long-term unemployment rate (%) 1.03
Rate for MSNs 0.98
Rate for TCNs 3.28
% difference TCNs from MSNs -235.51
% difference TCNs from total -218.45
Table 6.66: ComparativeUnemployment Rates (Q2, 2003)
Table 6.67: ComparativeLong-term UnemploymentRates (Q2, 2003)
35950 51-176 18/3/05 1:51 PM Page 125

Overall performanceThe Netherlands’ performance over four of the five strands of policyindicators is above the European average, anti-discrimination beingan area of particular strength. It does fall below the average innationality, although by a relatively small margin. Nationality aside,its performances are consistently moderately favourable:
Figure 6.91: Comparative Performance: Dutch and EU Averages
Labour market inclusion is an area of strength for the Netherlandsas it is well above the European average in all indicators, withmoderately favourable scores in three areas, and a favourable 3.00 onsecurity of employment status.
The Netherlands similarly performs above average across allsections for long-term residence, with a particular strength ineligibility and rights associated with status (on both it scores in theupper half of the moderately favourable category). On conditions foracquisition of status, it has moderately unfavourable score, if by asmall margin.
The Netherlands is very close to the European average in two ofthe indicators for family reunion. It is below average in security ofstatus but well above in terms of rights, where it has a favourablescore of 3.00.
With regard to nationality, the Netherlands performs aboveaverage in rights and eligibility but it is below average in other areas.Except on dual nationality, where there is a moderately favourablescore, there are moderately unfavourable scores throughout this
126
Policy indicators
0.00
2.192.18 2.182.02
2.16
0.50
1.00
1.50
2.00
2.50
3.00
Eur Net
Labour Market Inclusion Long-term Residence Nationailty Anti-DiscriminationFamily Reunion
2.56 2.482.26
1.94
2.65
35950 51-176 18/3/05 1:51 PM Page 126

127
Ne
the
rlan
ds
cou
ntr
y p
rofi
le
strand.Anti-discrimination is another area of strength, with figures
well above the European averages in all sections bar policies (wherethe moderately unfavourable score is relatively close to the Europeanaverage). On both definitions and scope, and remedies andsanctions, the Netherlands has favourable scores.
Labour market inclusion
Figure 6.92: Labour Market Inclusion: Dutch Indicators and EU Averages
Long-term residence
Figure 6.93: Long-term Residence: Dutch Indicators and EU Averages
0.00
0.50
1.00
1.50
2.00
2.50
3.00
Labour MarketInclusion
Eligibility Security ofEmployment
Status
Integration measures inthe Labour
Market
Rights Associatedwith Labour Market
Participation
Eur Net
2.18
2.562.33
1.82
2.63
3.00
2.17
2.50 2.502.27
0.00
0.50
1.00
1.50
2.00
2.50
3.00
Long-term Residence
Eligibilityfor Status
Conditionsfor Acquisition
of Status
Security of Status
Rights Associatedwith Status
Eur Net
2.192.48
1.89
2.67
2.13 2.20 2.17 2.29 2.34
2.75
35950 51-176 18/3/05 1:51 PM Page 127

Family Reunion
Figure 6.94: Family Reunion: Dutch Indicators and EU Averages
Nationality
Figure 6.95: Nationality: Dutch Indicators and EU Averages
128
0.00
0.50
1.00
1.50
2.00
2.50
3.00
Family Reunion
Eligibilityfor Status
Conditionsfor Acquisition
of Status
Security of Status
Rights Associatedwith Status
Eur Net
2.18 2.26
1.97 1.972.00 2.00
2.33
2.00
2.47
3.00
0.00
0.50
1.00
1.50
2.00
2.50
3.00
Nationality Eligibilityfor Status
Conditionsfor Acquisition
of Status
Security of Status
Dual Nationality
Eur Net
2.021.94
1.84
2.032.25
1.75
2.04
1.67
2.17
2.50
35950 51-176 18/3/05 1:51 PM Page 128

129
Ne
the
rlan
ds
cou
ntr
y p
rofi
le
Anti-Discrimination
Figure 6.96: Anti-Discrimination: Dutch Indicators and EU Averages
0.00
0.50
1.00
1.50
2.00
2.50
3.00
Anti-Discrimination
Definitionsand scope
Remediesand
Sanctions
EqualityAgencies
Pro-activePolicies
Eur Net
2.16
2.65
1.83
2.35
2.823.00
2.19
2.60
2.041.86
35950 51-176 18/3/05 1:51 PM Page 129

In 2002, Portugal was host to 405,000 foreigners (3.4% of thepopulation, but foreign workers made up 4.5% of the workforce).50
Of the overall foreign population, the majority comes from Europeand Africa, though the relative share of nationals from EastEuropean countries and Russia is growing.
Portugal’s status as a new immigration country searching for anenhanced legal framework was confirmed by its 2003 adoption of a
130
Portugal country profile
0.00
1.00
2.00
3.00
EligibilitySecurity of Employment Status
Labour Market Integration Measures
Rights Associated with Labour Market Participation
Eligibility for Status
Conditions for Acquisition of Status
Security of Status
Rights Associated with Status
Eligibility for Status
Conditions for Acquisition of Status
Security of StatusRights Associated with Status
Eligibility for Status
Conditions for Acquisition of Status
Security of Status
Dual Nationality
Definitions and Scope
Remedies and Sanctions
Equality Agencies
Pro-active Policies
Labour Market Inclusion Long-term Residence
Nationailty Anti-Discrimination
Family Reunion
Figure 6.97: Overview of Portugal’s Indicators
Background
50 Data in thisparagraph is drawnfrom OECD, Trends in InternationalMigration, AnnualReport 2003 (Paris,2003), pp158-161.
35950 51-176 18/3/05 1:51 PM Page 130

131
Po
rtu
gal
co
un
try
pro
file
new law on the rights of foreigners.51 This included the transpositionof a number of European directives and political recognition of theeconomic advantages of legal migration – coupled with an emphasison integration.
Portuguese law currently allows for two types of work visas forTCNs, short-term and long-term. While some questions regardingthe transposition of directives remain, Portugal’s efforts to expandthe rights of longer-term residents in particular have been noted.
According to the LFS data, TCNs in Portugal have a very high level ofaccess to work, but it tends to be of a temporary nature, with a heavyemphasis on low-skilled labour. As with many countries included inthis survey, however, Portugal is a country with a high level ofestimated irregular working, which is an important aspect of thelabour market which is not captured by the LFS, which by its verynature only records the formal labour market.
LFS data shows that TCNs have experienced a marginally higheremployment rate than Portuguese nationals in the context of anoverall convergence in recent years. The breakdown for the secondquarter of 2003 also shows that TCNs enjoy a markedly higherparticipation rate:
Figure 6.98: Employment trendsEmployment of people between 15 & 64 years old (%)
Labour market statistics
Total Nationals Non EU15 Other EU15
2002q02 2002q03 2002q04 2003q01 2003q02 2003q03 2003q04 2004q01 2004q02
50
60
55
65
70
80
75
85
90
95
100
51 The followingparagraphs arebased on A. Esteves,M.L. Fonseca and J.Malheiros, TheNetherlands, in the EU and USApproaches to theManagement ofImmigration series(Migration PolicyGroup, Brussels,2003).
35950 51-176 18/3/05 1:51 PM Page 131
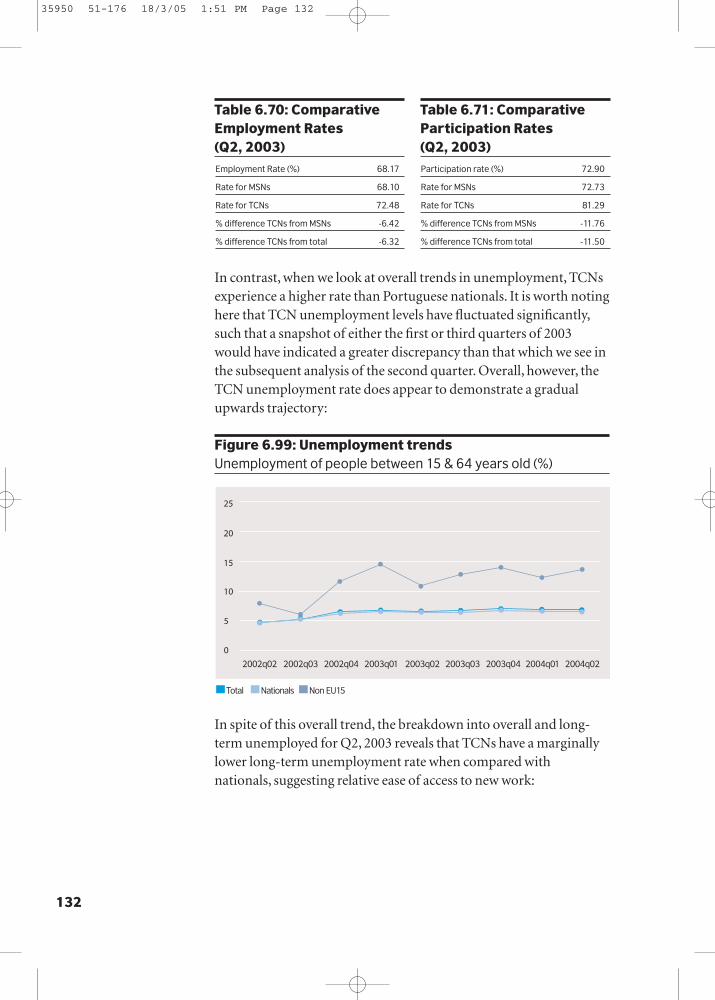
In contrast, when we look at overall trends in unemployment, TCNsexperience a higher rate than Portuguese nationals. It is worth notinghere that TCN unemployment levels have fluctuated significantly,such that a snapshot of either the first or third quarters of 2003would have indicated a greater discrepancy than that which we see inthe subsequent analysis of the second quarter. Overall, however, theTCN unemployment rate does appear to demonstrate a gradualupwards trajectory:
Figure 6.99: Unemployment trendsUnemployment of people between 15 & 64 years old (%)
In spite of this overall trend, the breakdown into overall and long-term unemployed for Q2, 2003 reveals that TCNs have a marginallylower long-term unemployment rate when compared withnationals, suggesting relative ease of access to new work:
132
Table 6.70: ComparativeEmployment Rates (Q2, 2003)
Table 6.71: ComparativeParticipation Rates (Q2, 2003)
Employment Rate (%) 68.17
Rate for MSNs 68.10
Rate for TCNs 72.48
% difference TCNs from MSNs -6.42
% difference TCNs from total -6.32
Participation rate (%) 72.90
Rate for MSNs 72.73
Rate for TCNs 81.29
% difference TCNs from MSNs -11.76
% difference TCNs from total -11.50
Total Nationals Non EU15
2002q02 2002q03 2002q04 2003q01 2003q02 2003q03 2003q04 2004q01 2004q02
0
5
10
20
15
25
35950 51-176 18/3/05 1:51 PM Page 132

133
Po
rtu
gal
co
un
try
pro
file
The availability of low-skilled employment for TCNs is highlightedby the near-parity between TCN and national employment rates inthis area. It is, however, also worth noting that the TCN employmentrate in medium-skilled work is very high. By contrast, thediscrepancy between the national and TCN high-skilledemployment rates is broad:
Table 6.74: Comparative Rates for Employment according to Skill (low, medium or high; Q2, 2003)
Low Medium High
Total employment rate 66.79 63.76 82.28
Rate for MSNs 66.82 63.14 83.24
Rate for TCNs 67.06 78.54 49.54
% difference TCNs from MSNs -0.36 -24.39 3.58
% difference TCNs from total -0.39 -23.19 3.29
The contrast between TCNs and Portuguese nationals in terms ofcontracts is particularly striking. Portugal and Spain are the onlycountries in which a majority of TCNs are registered as holdingtemporary contracts, confirming the working-pattern suggestedabove:
Table 6.75: Comparison of Employment by Type of Contract (Permanent or Temporary; Q2, 2003)
Permanent Contract Temporary Contract
Total % in type of contract 79.36 20.64
% of MSNs in type of contract 80.64 19.36
% of TCNs in type of contract 33.61 66.39
% difference TCNs from MSNs 58.33 -243.00
% difference TCNs from total 57.65 -221.67
Unemployment Rate (%) 6.49
Rate for MSNs 6.36
Rate for TCNs 10.84
% difference TCNs from MSNs -70.33
% difference TCNs from total -66.87
Long-term unemployment rate (%) 2.12
Rate for MSNs 2.12
Rate for TCNs 2.09
% difference TCNs from MSNs 1.34
% difference TCNs from total 1.34
Table 6.72: ComparativeUnemployment Rates (Q2, 2003)
Table 6.73: ComparativeLong-term UnemploymentRates (Q2, 2003)
35950 51-176 18/3/05 1:51 PM Page 133

In terms of training, TCNs are only marginally less likely to haverecently received training than Portuguese nationals:
Table 6.76: Proportion of workers having receivedtraining in 4 weeks previous to survey (Q2, 2003)
Country-wide proportion receiving training in previous 4 wks 13.75
Percentage of MSNs receiving training in last 4 wks 13.75
Percentage of TCNs receiving training in last 4 wks 13.25
Percentage difference TCNs from MSNs 3.65
Percentage difference TCNs from total 3.60
The experience of TCNs in the Portuguese labour market is thusunusual (if, not surprisingly, comparable with the situation inSpain). While reflecting the Portuguese economic climate, thebalance between types of employment and contracts may be asubject for particular focus.
Overall performancePortugal’s performance over all five strands of policy indicators isabove the European average. It is significantly closer to the Europeanaverage with regard to anti-discrimination and much closer to theaverage in the other areas:
Figure 6.100: Comparative Performance: Portuguese and EU Averages
134
Policy indicators
0.00
2.192.18 2.182.02
2.16
0.50
1.00
1.50
2.00
2.50
3.00
Eur Por
Labour Market Inclusion Long-term Residence Nationailty Anti-DiscriminationFamily Reunion
2.442.17
2.322.12
2.76
35950 51-176 18/3/05 1:51 PM Page 134

135
Po
rtu
gal
co
un
try
pro
file
Notably, Portugal has moderately favourable scores on both labourmarket inclusion and family reunion, and a favourable performanceon anti-discrimination.
With the exception of labour market integration measures,Portugal performs above the European average in all other indicatorsfor labour market inclusion. It has a significantly higher score thanthe European average in access and eligibility (a favourable 3.00) andsecurity of employment status.
In long-term residence, Portugal performs above the Europeanaverage in all but one indicator, eligibility, though it is consistentlyclose to the European average. In the case of eligibility, Portugal has amoderately unfavourable score.
Portugal performs below the European average on security offamily reunion, and scores moderately unfavourable scores in allareas bar associated rights. On this latter area, Portugal has afavourable performance of 3.00.
Similarly, Portugal has a favourable score on rights associatedwith nationality, while again performing less well on other elementsof the strand. It is below average in terms of eligibility and, to a lesserextent, conditions for acquisition, with moderately unfavourablescores.
Anti-discrimination is Portugal’s strongest area as it performswell above average across all sections – it has favourable scores onboth definitions and scope and remedies, and moderately favourablescores in other elements.
35950 51-176 18/3/05 1:51 PM Page 135

Labour market inclusion
Figure 6.101: Labour Market Inclusion: Portuguese Indicators and EU Averages
Long-term residence
Figure 6.102: Long-term Residence: Portuguese Indicators and EU Averages
136
0.00
0.50
1.00
1.50
2.00
2.50
3.00
Labour MarketInclusion
Eligibility Security ofEmployment
Status
Integration measures inthe Labour
Market
Rights Associatedwith Labour Market
Participation
Eur Por
2.18
2.442.33
1.82
2.63
3.00
2.17
2.00
2.502.27
0.00
0.50
1.00
1.50
2.00
2.50
3.00
Long-term Residence
Eligibilityfor Status
Conditionsfor Acquisition
of Status
Security of Status
Rights Associatedwith Status
Eur Por
2.19 2.17
1.891.67
2.13 2.20 2.17 2.142.34 2.38
35950 51-176 18/3/05 1:51 PM Page 136
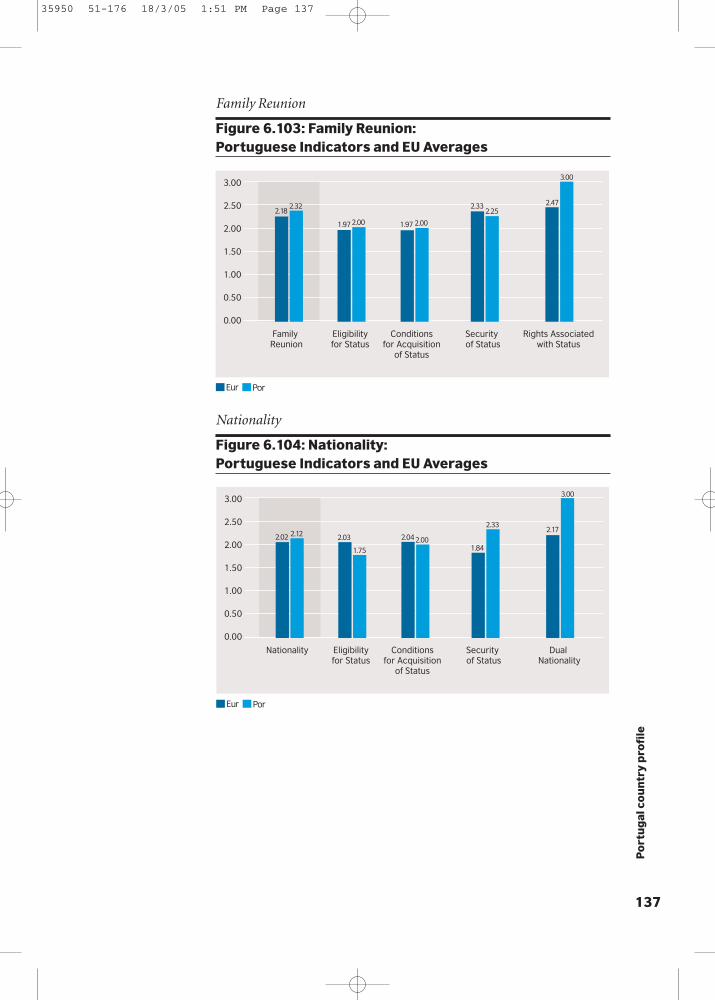
137
Po
rtu
gal
co
un
try
pro
file
Family Reunion
Figure 6.103: Family Reunion: Portuguese Indicators and EU Averages
Nationality
Figure 6.104: Nationality: Portuguese Indicators and EU Averages
0.00
0.50
1.00
1.50
2.00
2.50
3.00
Family Reunion
Eligibilityfor Status
Conditionsfor Acquisition
of Status
Security of Status
Rights Associatedwith Status
Eur Por
2.182.32
1.97 1.972.00 2.00
2.332.25
2.47
3.00
0.00
0.50
1.00
1.50
2.00
2.50
3.00
Nationality Eligibilityfor Status
Conditionsfor Acquisition
of Status
Security of Status
Dual Nationality
Eur Por
2.02 2.12
1.84
2.03
1.752.002.04
2.332.17
3.00
35950 51-176 18/3/05 1:51 PM Page 137

Anti-Discrimination
Figure 6.105: Anti-Discrimination: Portuguese Indicators and EU Averages
138
0.00
0.50
1.00
1.50
2.00
2.50
3.00
Anti-Discrimination
Definitionsand scope
Remediesand
Sanctions
EqualityAgencies
Pro-activePolicies
Eur Por
2.16
2.76
1.83
2.35
2.272.82
2.19
2.60
2.04
2.43
35950 51-176 18/3/05 1:51 PM Page 138
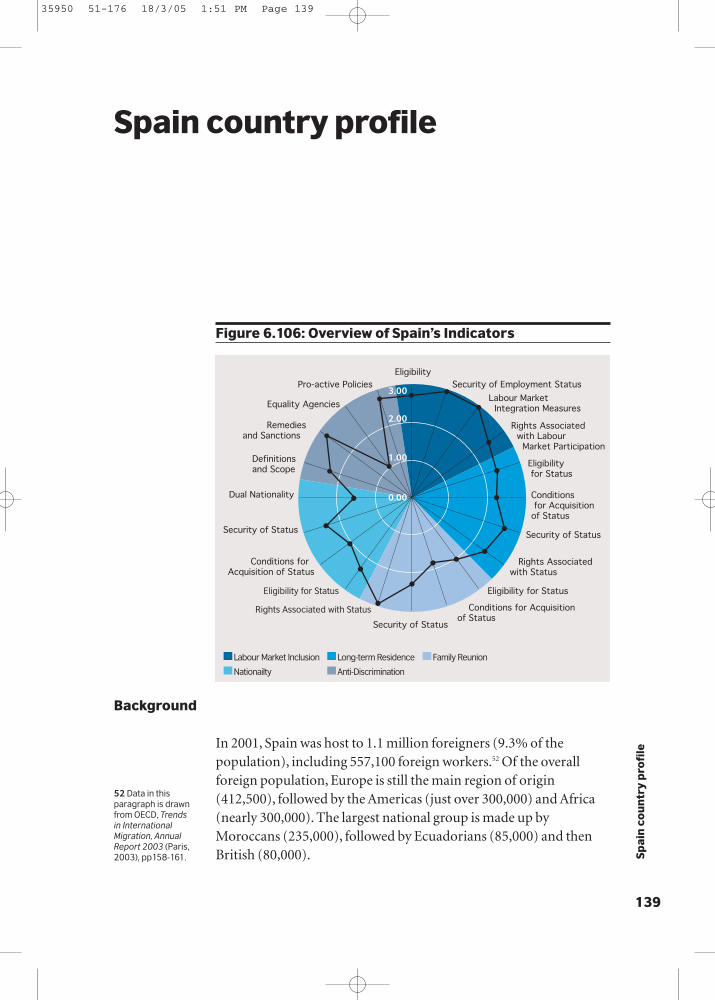
139
Spai
n c
ou
ntr
y p
rofi
leIn 2001, Spain was host to 1.1 million foreigners (9.3% of thepopulation), including 557,100 foreign workers.52 Of the overallforeign population, Europe is still the main region of origin(412,500), followed by the Americas (just over 300,000) and Africa(nearly 300,000). The largest national group is made up byMoroccans (235,000), followed by Ecuadorians (85,000) and thenBritish (80,000).
Spain country profile
0.00
1.00
2.00
3.00
EligibilitySecurity of Employment Status
Labour Market Integration Measures
Rights Associated with Labour Market Participation
Eligibility for Status
Conditions for Acquisition of Status
Security of Status
Rights Associated with Status
Eligibility for Status
Conditions for Acquisition of Status
Security of StatusRights Associated with Status
Eligibility for Status
Conditions for Acquisition of Status
Security of Status
Dual Nationality
Definitions and Scope
Remedies and Sanctions
Equality Agencies
Pro-active Policies
Labour Market Inclusion Long-term Residence
Nationailty Anti-Discrimination
Family Reunion
Figure 6.106: Overview of Spain’s Indicators
Background
52 Data in thisparagraph is drawnfrom OECD, Trends in InternationalMigration, AnnualReport 2003 (Paris,2003), pp158-161.
35950 51-176 18/3/05 1:51 PM Page 139

Spanish attitudes to TCNs and migration have recently undergone aperiod of change, with 2000 seeing a “discovery”of immigration as asocial and political issue.53 This was reflected in a bout of legislationintended to reform migration and foreigner’s rights issues. Althoughone goal of this reform was to slow the immigration rate, this hascontinued to be high. Local and regional authorities have asignificant degree of responsibility in this policy area.
Currently, TCNs wishing to reside and work in Spain may holdshort or long-term permits, both subject to quota restrictions. After2000, significant efforts were made to ensure that these quotas weremaintained, but this has reportedly resulted in an increasing numberof TCNs working without permits of either type.
Data from the LFS suggests that TCNs in Spain experience bothhigher employment and participation rates than Spanish nationals.Although problems of unemployment and a lack of trainingopportunities remain, Spain is also notable for a high rate of TCNemployment in higher-skilled work. However, as with Portugal,Greece and Italy, high estimates of irregular working practices meanthat data from the LFS provides only a partial picture of the labourmarket, which should be taken into consideration throughout thefollowing analysis.
Starting with employment rates, data from the LFS shows thatwhile the TCN employment rate has fluctuated a little more thanthat for Spanish nationals, although in the context of an overallconvergence. The rates for non-Spanish (TCN and non-Spanish EUnationals) have typically risen and fallen in unison which perhapsreflects the importance of tourism-related seasonal employment:
140
Labour market statistics
53 The followingparagraphs arebased on R.Zapata-Barrero, Spain, in the EU and USApproaches to theManagement ofImmigration series(Migration PolicyGroup, Brussels,2003).
35950 51-176 18/3/05 1:51 PM Page 140
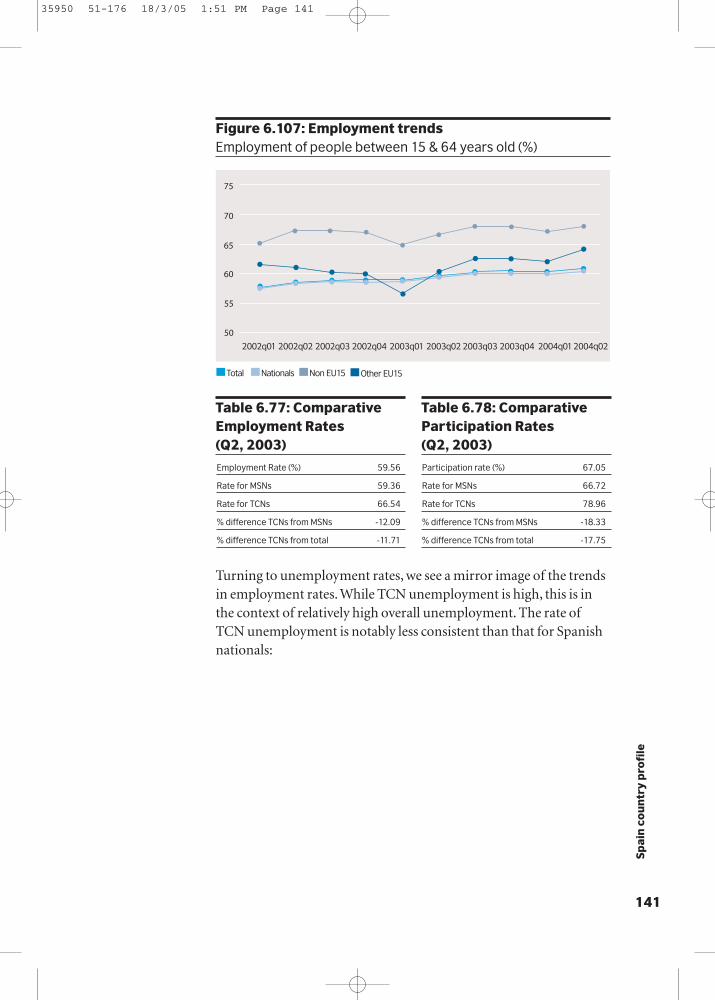
141
Spai
n c
ou
ntr
y p
rofi
le
Figure 6.107: Employment trendsEmployment of people between 15 & 64 years old (%)
Turning to unemployment rates, we see a mirror image of the trendsin employment rates. While TCN unemployment is high, this is inthe context of relatively high overall unemployment. The rate ofTCN unemployment is notably less consistent than that for Spanishnationals:
Total Nationals Non EU15
50
55
60
70
65
75
Other EU15
2002q01 2002q02 2002q03 2002q04 2003q01 2003q02 2003q03 2003q04 2004q012004q02
Table 6.77: ComparativeEmployment Rates (Q2, 2003)
Table 6.78: ComparativeParticipation Rates (Q2, 2003)
Employment Rate (%) 59.56
Rate for MSNs 59.36
Rate for TCNs 66.54
% difference TCNs from MSNs -12.09
% difference TCNs from total -11.71
Participation rate (%) 67.05
Rate for MSNs 66.72
Rate for TCNs 78.96
% difference TCNs from MSNs -18.33
% difference TCNs from total -17.75
35950 51-176 18/3/05 1:51 PM Page 141
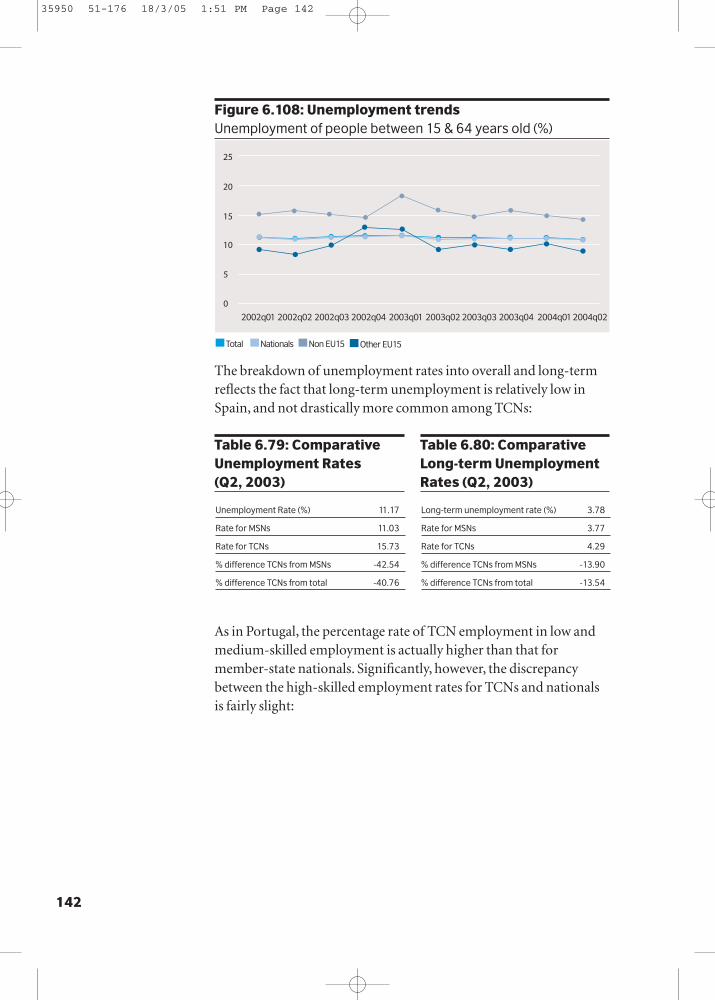
Figure 6.108: Unemployment trendsUnemployment of people between 15 & 64 years old (%)
The breakdown of unemployment rates into overall and long-termreflects the fact that long-term unemployment is relatively low inSpain, and not drastically more common among TCNs:
As in Portugal, the percentage rate of TCN employment in low andmedium-skilled employment is actually higher than that formember-state nationals. Significantly, however, the discrepancybetween the high-skilled employment rates for TCNs and nationalsis fairly slight:
142
Unemployment Rate (%) 11.17
Rate for MSNs 11.03
Rate for TCNs 15.73
% difference TCNs from MSNs -42.54
% difference TCNs from total -40.76
Long-term unemployment rate (%) 3.78
Rate for MSNs 3.77
Rate for TCNs 4.29
% difference TCNs from MSNs -13.90
% difference TCNs from total -13.54
Table 6.79: ComparativeUnemployment Rates (Q2, 2003)
Table 6.80: ComparativeLong-term UnemploymentRates (Q2, 2003)
Total Nationals Non EU15
0
5
10
20
15
25
Other EU15
2002q01 2002q02 2002q03 2002q04 2003q01 2003q02 2003q03 2003q04 2004q012004q02
35950 51-176 18/3/05 1:51 PM Page 142

143
Spai
n c
ou
ntr
y p
rofi
le
Table 6.81: Comparative Rates for Employment according to Skill (low, medium or high; Q2, 2003)
Low Medium High
Total employment rate 53.55 59.99 78.57
Rate for MSNs 53.29 59.56 78.81
Rate for TCNs 64.12 71.46 71.31
% difference TCNs from MSNs -20.31 -19.99 9.51
% difference TCNs from total -19.73 -19.13 9.23
While temporary contracts are widespread in the Spanish labourmarket as a whole, they are particularly preponderant among TCNs:
Table 6.82: Comparison of Employment by Type of Contract (Permanent or Temporary; Q2, 2003)
Permanent Contract Temporary Contract
Total % in type of contract 69.36 30.64
% of MSNs in type of contract 70.49 29.51
% of TCNs in type of contract 37.81 62.19
% difference TCNs from MSNs 46.36 -110.75
% difference TCNs from total 45.48 -102.97
In contrast to Portugal, there is a notable gap between the percentageof TCNs who have had recent access to training and the figure forSpanish nationals:
Table 6.83: Proportion of workers having receivedtraining in 4 weeks previous to survey (Q2, 2003)
Country-wide proportion receiving training in previous 4 wks 16.24
Percentage of MSNs receiving training in last 4 wks 16.44
Percentage of TCNs receiving training in last 4 wks 10.08
Percentage difference TCNs from MSNs 38.66
Percentage difference TCNs from total 37.93
While there are outstanding questions over training and the balanceof temporary and permanent work for TCNs, the Spanish labourmarket does contain a variety of opportunities for TCNs.
35950 51-176 18/3/05 1:51 PM Page 143
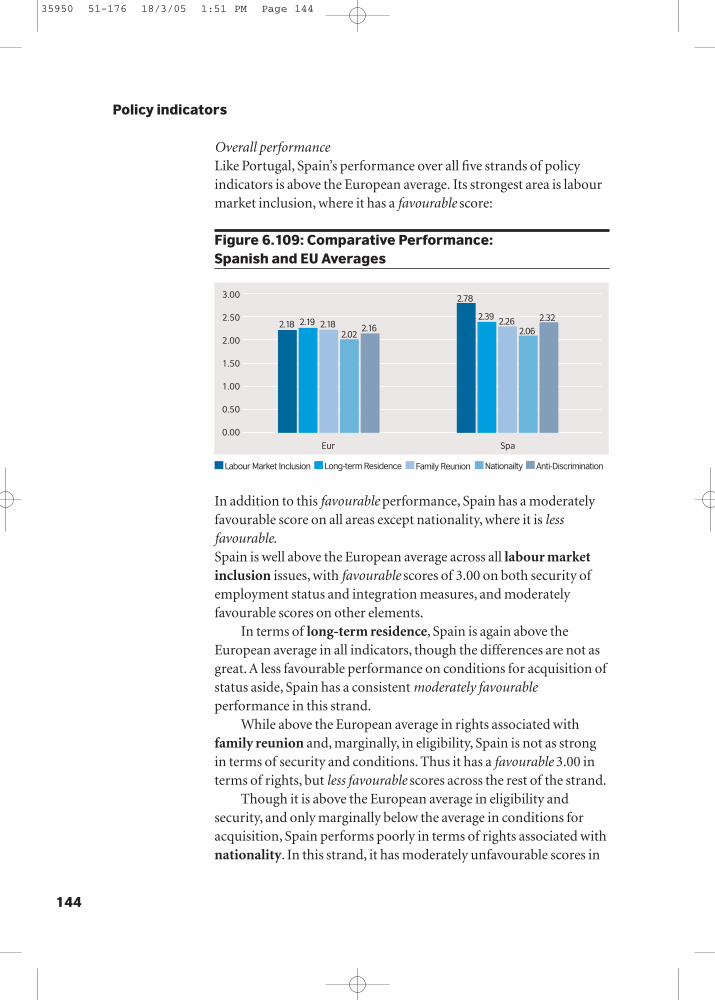
Overall performanceLike Portugal, Spain’s performance over all five strands of policyindicators is above the European average. Its strongest area is labourmarket inclusion, where it has a favourable score:
Figure 6.109: Comparative Performance: Spanish and EU Averages
In addition to this favourable performance, Spain has a moderatelyfavourable score on all areas except nationality, where it is lessfavourable.Spain is well above the European average across all labour marketinclusion issues, with favourable scores of 3.00 on both security ofemployment status and integration measures, and moderatelyfavourable scores on other elements.
In terms of long-term residence, Spain is again above theEuropean average in all indicators, though the differences are not asgreat. A less favourable performance on conditions for acquisition ofstatus aside, Spain has a consistent moderately favourableperformance in this strand.
While above the European average in rights associated withfamily reunion and, marginally, in eligibility, Spain is not as strongin terms of security and conditions. Thus it has a favourable 3.00 interms of rights, but less favourable scores across the rest of the strand.
Though it is above the European average in eligibility andsecurity, and only marginally below the average in conditions foracquisition, Spain performs poorly in terms of rights associated withnationality. In this strand, it has moderately unfavourable scores in
144
0.00
2.192.18 2.182.02
2.16
0.50
1.00
1.50
2.00
2.50
3.00
Eur Spa
Labour Market Inclusion Long-term Residence Nationailty Anti-DiscriminationFamily Reunion
2.78
2.39 2.262.06
2.32
Policy indicators
35950 51-176 18/3/05 1:51 PM Page 144
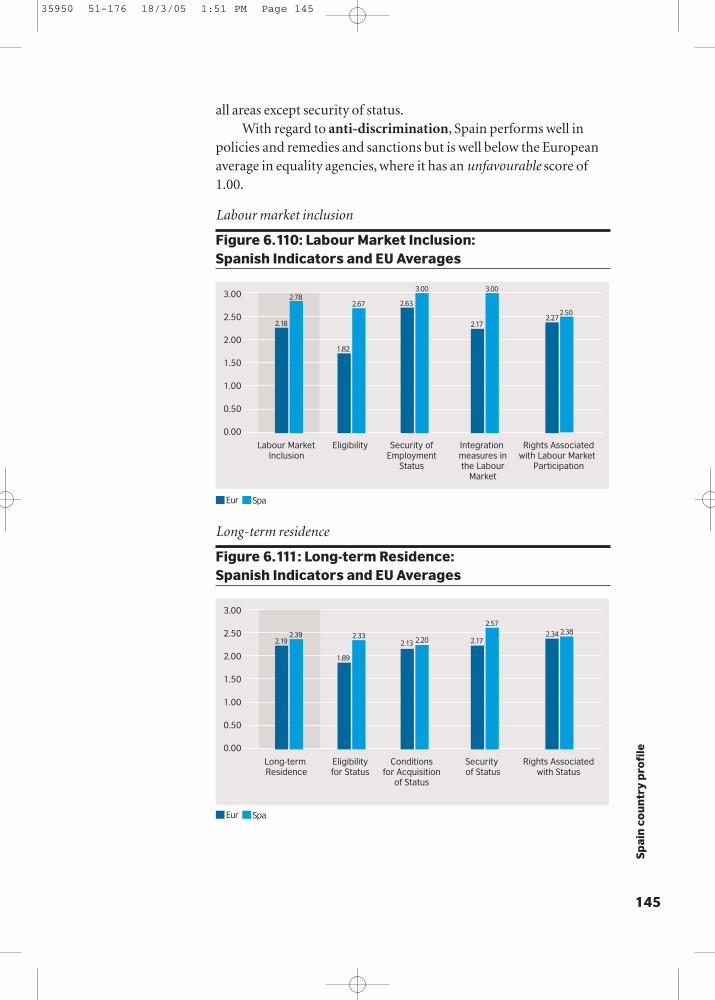
145
Spai
n c
ou
ntr
y p
rofi
le
all areas except security of status.With regard to anti-discrimination, Spain performs well in
policies and remedies and sanctions but is well below the Europeanaverage in equality agencies, where it has an unfavourable score of1.00.
Labour market inclusion
Figure 6.110: Labour Market Inclusion: Spanish Indicators and EU Averages
Long-term residence
Figure 6.111: Long-term Residence: Spanish Indicators and EU Averages
0.00
0.50
1.00
1.50
2.00
2.50
3.00
Labour MarketInclusion
Eligibility Security ofEmployment
Status
Integration measures inthe Labour
Market
Rights Associatedwith Labour Market
Participation
Eur Spa
2.18
2.782.67
1.82
2.63
3.00
2.17
3.00
2.502.27
0.00
0.50
1.00
1.50
2.00
2.50
3.00
Long-term Residence
Eligibilityfor Status
Conditionsfor Acquisition
of Status
Security of Status
Rights Associatedwith Status
Eur Spa
2.192.39
1.89
2.332.13 2.20 2.17
2.57
2.34 2.38
35950 51-176 18/3/05 1:51 PM Page 145

Family Reunion
Figure 6.112: Family Reunion: Spanish Indicators and EU Averages
Nationality
Figure 6.113: Nationality: Spanish Indicators and EU Averages
146
0.00
0.50
1.00
1.50
2.00
2.50
3.00
Family Reunion
Eligibilityfor Status
Conditionsfor Acquisition
of Status
Security of Status
Rights Associatedwith Status
Eur Spa
2.182.26
1.97 1.972.001.80
2.332.25
2.47
3.00
0.00
0.50
1.00
1.50
2.00
2.50
3.00
Nationality Eligibilityfor Status
Conditionsfor Acquisition
of Status
Security of Status
Dual Nationality
Eur Spa
2.02 2.06
1.84
2.032.25
2.002.04
2.33 2.17
1.50
35950 51-176 18/3/05 1:51 PM Page 146
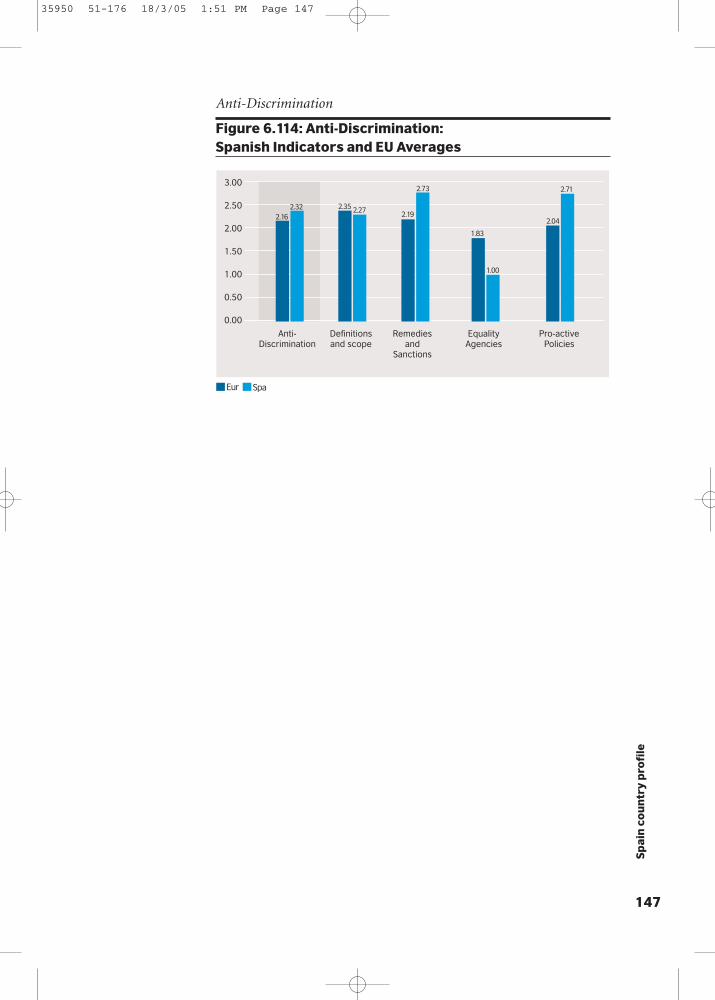
Anti-Discrimination
Figure 6.114: Anti-Discrimination: Spanish Indicators and EU Averages
147
Spai
n c
ou
ntr
y p
rofi
le
0.00
0.50
1.00
1.50
2.00
2.50
3.00
Anti-Discrimination
Definitionsand scope
Remediesand
Sanctions
EqualityAgencies
Pro-activePolicies
Eur Spa
2.162.32
1.83
2.35 2.27
2.73
2.19
1.00
2.04
2.71
35950 51-176 18/3/05 1:51 PM Page 147

In 2001, Sweden was host to 476,000 foreigners (5.3% of thepopulation), including 222,000 foreign workers.54 Of the overallforeign population, just over a third came from Nordic countries.The biggest groups of non-EU nationals were from Iraq (36,200),the former Yugoslavia (20,700) and Iran (13,500).
As these places of origin suggest, the presence of TCNs inSweden often reflects international crises as much as domestic
148
Sweden country profile
0.00
1.00
2.00
3.00
EligibilitySecurity of Employment Status
Labour Market Integration Measures
Rights Associated with Labour Market Participation
Eligibility for Status
Conditions for Acquisition of Status
Security of Status
Rights Associated with Status
Eligibility for Status
Conditions for Acquisition of Status
Security of StatusRights Associated with Status
Eligibility for Status
Conditions for Acquisition of Status
Security of Status
Dual Nationality
Definitions and Scope
Remedies and Sanctions
Equality Agencies
Pro-active Policies
Labour Market Inclusion Long-term Residence
Nationailty Anti-Discrimination
Family Reunion
Figure 6.115: Overview of Sweden’s Indicators
Background
54 Data in thisparagraph is drawnfrom OECD, Trends in InternationalMigration, AnnualReport 2003 (Paris,2003), pp158-161.
35950 51-176 18/3/05 1:51 PM Page 148
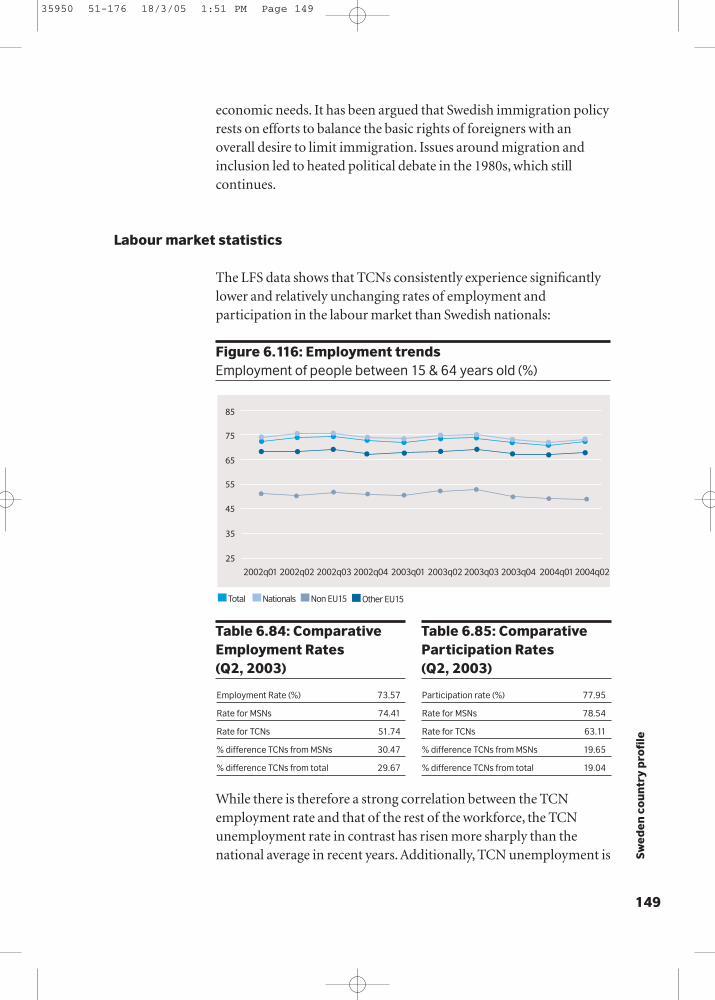
149
Swe
de
n c
ou
ntr
y p
rofi
le
economic needs. It has been argued that Swedish immigration policyrests on efforts to balance the basic rights of foreigners with anoverall desire to limit immigration. Issues around migration andinclusion led to heated political debate in the 1980s, which stillcontinues.
The LFS data shows that TCNs consistently experience significantlylower and relatively unchanging rates of employment andparticipation in the labour market than Swedish nationals:
Figure 6.116: Employment trendsEmployment of people between 15 & 64 years old (%)
While there is therefore a strong correlation between the TCNemployment rate and that of the rest of the workforce, the TCNunemployment rate in contrast has risen more sharply than thenational average in recent years. Additionally, TCN unemployment is
Labour market statistics
Total Nationals Non EU15
25
35
55
45
75
65
85
Other EU15
2002q01 2002q02 2002q03 2002q04 2003q01 2003q02 2003q03 2003q04 2004q012004q02
Table 6.84: ComparativeEmployment Rates (Q2, 2003)
Table 6.85: ComparativeParticipation Rates (Q2, 2003)
Employment Rate (%) 73.57
Rate for MSNs 74.41
Rate for TCNs 51.74
% difference TCNs from MSNs 30.47
% difference TCNs from total 29.67
Participation rate (%) 77.95
Rate for MSNs 78.54
Rate for TCNs 63.11
% difference TCNs from MSNs 19.65
% difference TCNs from total 19.04
35950 51-176 18/3/05 1:51 PM Page 149
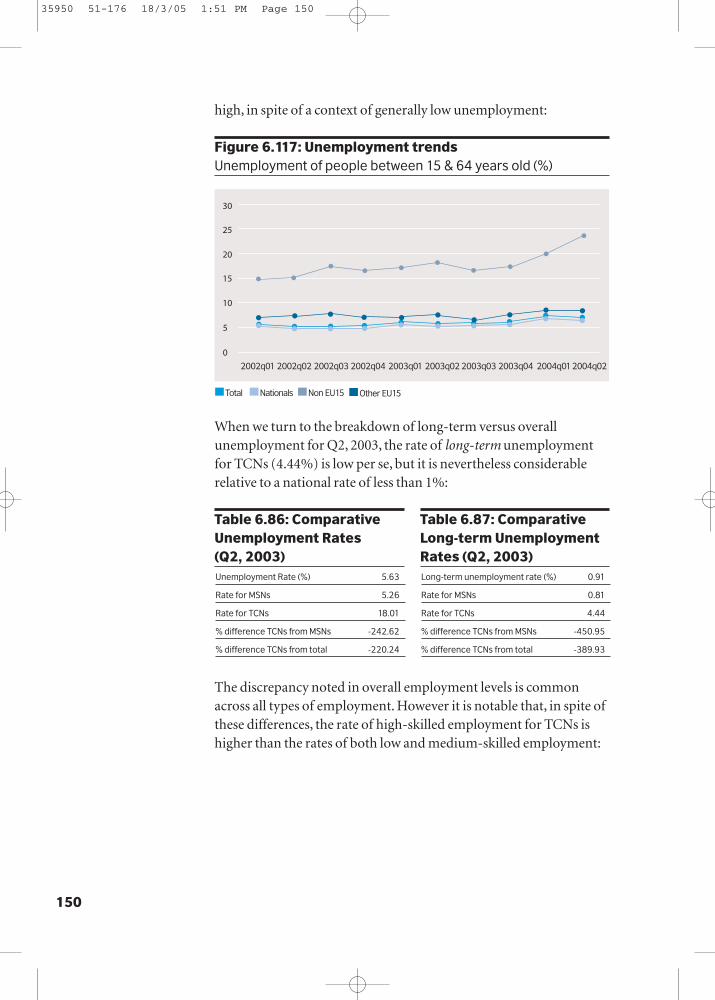
high, in spite of a context of generally low unemployment:
Figure 6.117: Unemployment trendsUnemployment of people between 15 & 64 years old (%)
When we turn to the breakdown of long-term versus overallunemployment for Q2, 2003, the rate of long-term unemploymentfor TCNs (4.44%) is low per se, but it is nevertheless considerablerelative to a national rate of less than 1%:
The discrepancy noted in overall employment levels is commonacross all types of employment. However it is notable that, in spite ofthese differences, the rate of high-skilled employment for TCNs ishigher than the rates of both low and medium-skilled employment:
150
Total Nationals Non EU15
0
5
15
10
25
20
30
Other EU15
2002q01 2002q02 2002q03 2002q04 2003q01 2003q02 2003q03 2003q04 2004q012004q02
Unemployment Rate (%) 5.63
Rate for MSNs 5.26
Rate for TCNs 18.01
% difference TCNs from MSNs -242.62
% difference TCNs from total -220.24
Long-term unemployment rate (%) 0.91
Rate for MSNs 0.81
Rate for TCNs 4.44
% difference TCNs from MSNs -450.95
% difference TCNs from total -389.93
Table 6.86: ComparativeUnemployment Rates (Q2, 2003)
Table 6.87: ComparativeLong-term UnemploymentRates (Q2, 2003)
35950 51-176 18/3/05 1:51 PM Page 150

151
Swe
de
n c
ou
ntr
y p
rofi
le
Table 6.88: Comparative Rates for Employment accordingto Skill (low, medium or high; Q2, 2003)
Low Medium High
Total employment rate 56.99 79.10 85.86
Rate for MSNs 57.72 79.70 86.78
Rate for TCNs 40.14 60.98 63.07
% difference TCNs from MSNs 30.45 23.49 27.32
% difference TCNs from total 29.56 22.90 26.55
In terms of contracts, TCNs are markedly more likely to holdtemporary contracts than are Swedish nationals:
Table 6.89: Comparison of Employment by Type of Contract (Permanent or Temporary; Q2, 2003)
Permanent Contract Temporary Contract
Total % in type of contract 84.44 15.56
% of MSNs in type of contract 84.80 15.20
% of TCNs in type of contract 69.56 30.44
% difference TCNs from MSNs 17.97 -100.26
% difference TCNs from total 17.62 -95.66
Training is an area of strength for the Swedish labour market as awhole, and it benefits TCNs. A TCN is marginally more likely to havehad recent training than a Swedish national:
Table 6.90: Proportion of workers having receivedtraining in 4 weeks previous to survey (Q2, 2003)
Country-wide proportion receiving training in previous 4 wks 35.77
Percentage of MSNs receiving training in last 4 wks 35.82
Percentage of TCNs receiving training in last 4 wks 39.58
Percentage difference TCNs from MSNs -10.50
Percentage difference TCNs from total -10.64
While TCNs do enjoy some advantages in the Swedish labourmarket, it should be noted that there are outstanding issues ofemployment and participation to be addressed.
35950 51-176 18/3/05 1:51 PM Page 151
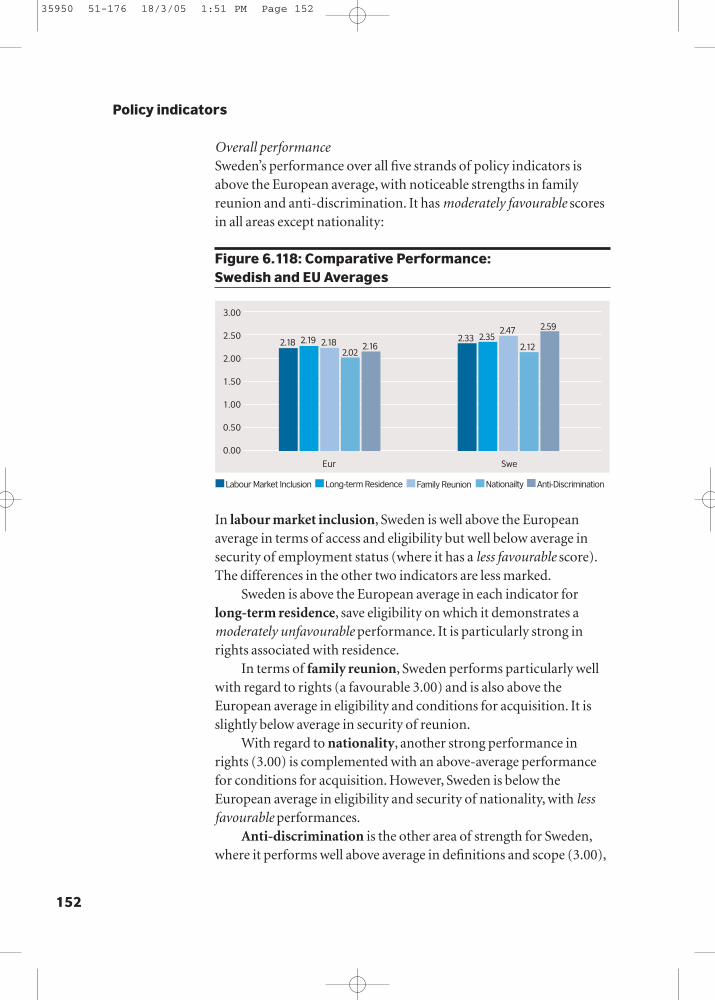
Overall performanceSweden’s performance over all five strands of policy indicators isabove the European average, with noticeable strengths in familyreunion and anti-discrimination. It has moderately favourable scoresin all areas except nationality:
Figure 6.118: Comparative Performance: Swedish and EU Averages
In labour market inclusion, Sweden is well above the Europeanaverage in terms of access and eligibility but well below average insecurity of employment status (where it has a less favourable score).The differences in the other two indicators are less marked.
Sweden is above the European average in each indicator forlong-term residence, save eligibility on which it demonstrates amoderately unfavourable performance. It is particularly strong inrights associated with residence.
In terms of family reunion, Sweden performs particularly wellwith regard to rights (a favourable 3.00) and is also above theEuropean average in eligibility and conditions for acquisition. It isslightly below average in security of reunion.
With regard to nationality, another strong performance inrights (3.00) is complemented with an above-average performancefor conditions for acquisition. However, Sweden is below theEuropean average in eligibility and security of nationality, with lessfavourable performances.
Anti-discrimination is the other area of strength for Sweden,where it performs well above average in definitions and scope (3.00),
152
Policy indicators
0.00
2.192.18 2.182.02
2.16
0.50
1.00
1.50
2.00
2.50
3.00
Eur Swe
Labour Market Inclusion Long-term Residence Nationailty Anti-DiscriminationFamily Reunion
2.33 2.352.47
2.12
2.59
35950 51-176 18/3/05 1:51 PM Page 152
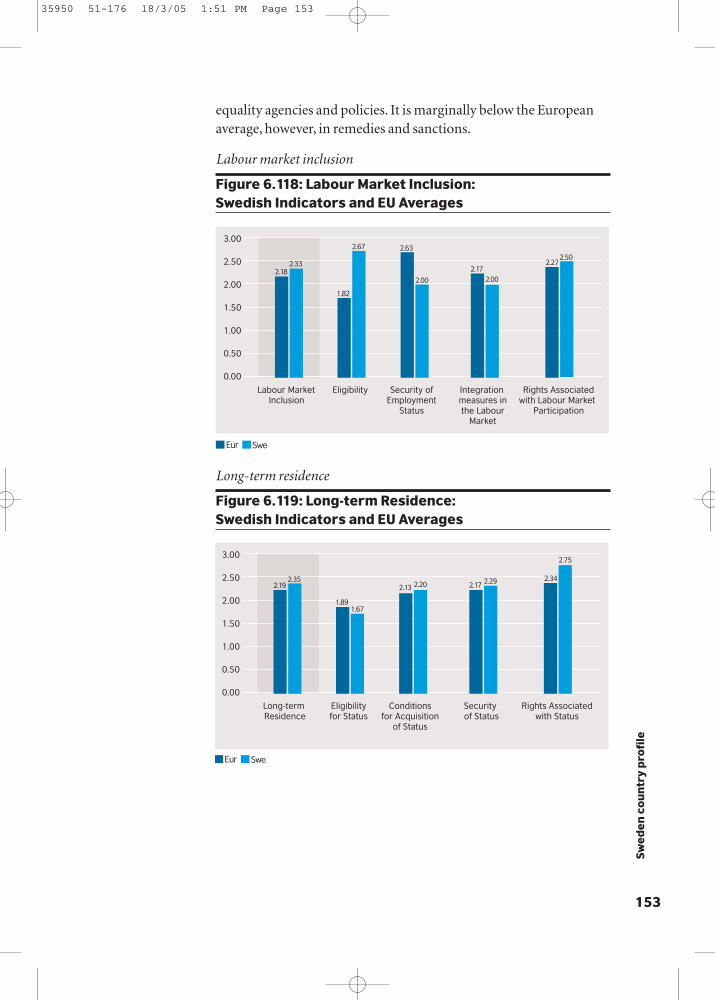
153
Swe
de
n c
ou
ntr
y p
rofi
le
equality agencies and policies. It is marginally below the Europeanaverage, however, in remedies and sanctions.
Labour market inclusion
Figure 6.118: Labour Market Inclusion: Swedish Indicators and EU Averages
Long-term residence
Figure 6.119: Long-term Residence: Swedish Indicators and EU Averages
0.00
0.50
1.00
1.50
2.00
2.50
3.00
Labour MarketInclusion
Eligibility Security ofEmployment
Status
Integration measures inthe Labour
Market
Rights Associatedwith Labour Market
Participation
Eur Swe
2.182.33
2.67
1.82
2.63
2.00
2.172.00
2.502.27
0.00
0.50
1.00
1.50
2.00
2.50
3.00
Long-term Residence
Eligibilityfor Status
Conditionsfor Acquisition
of Status
Security of Status
Rights Associatedwith Status
Eur Swe
2.192.35
1.891.67
2.13 2.20 2.17 2.29 2.34
2.75
35950 51-176 18/3/05 1:51 PM Page 153
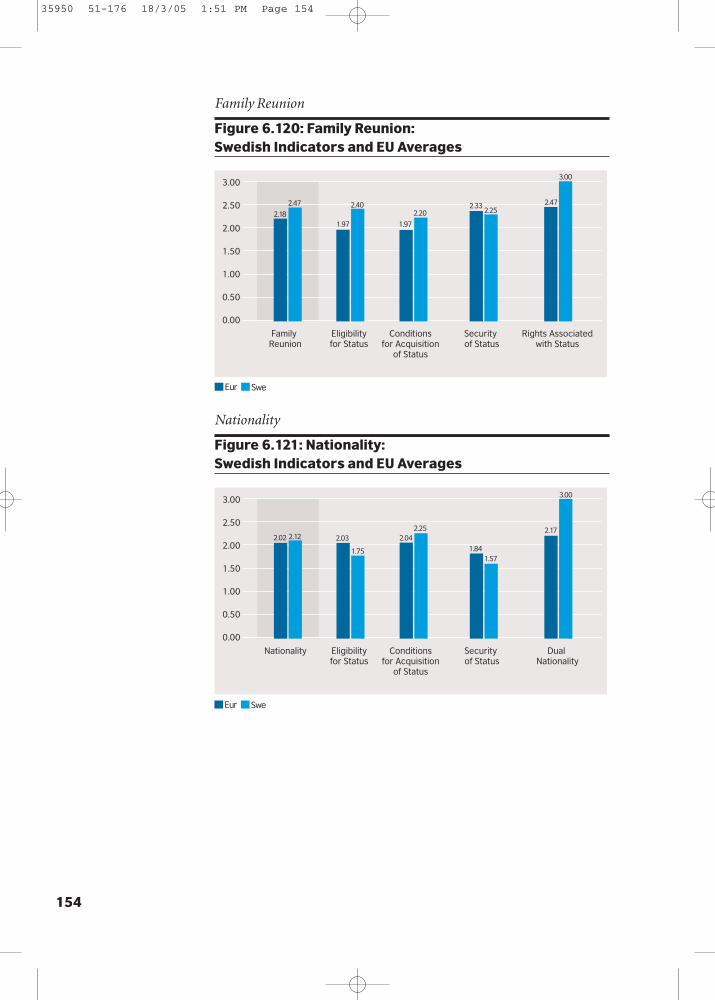
Family Reunion
Figure 6.120: Family Reunion: Swedish Indicators and EU Averages
Nationality
Figure 6.121: Nationality: Swedish Indicators and EU Averages
154
0.00
0.50
1.00
1.50
2.00
2.50
3.00
Family Reunion
Eligibilityfor Status
Conditionsfor Acquisition
of Status
Security of Status
Rights Associatedwith Status
Eur Swe
2.18
2.47
1.97 1.97
2.402.20
2.332.25
2.47
3.00
0.00
0.50
1.00
1.50
2.00
2.50
3.00
Nationality Eligibilityfor Status
Conditionsfor Acquisition
of Status
Security of Status
Dual Nationality
Eur Swe
2.02 2.12
1.84
2.03
1.75
2.252.04
1.57
2.17
3.00
35950 51-176 18/3/05 1:51 PM Page 154
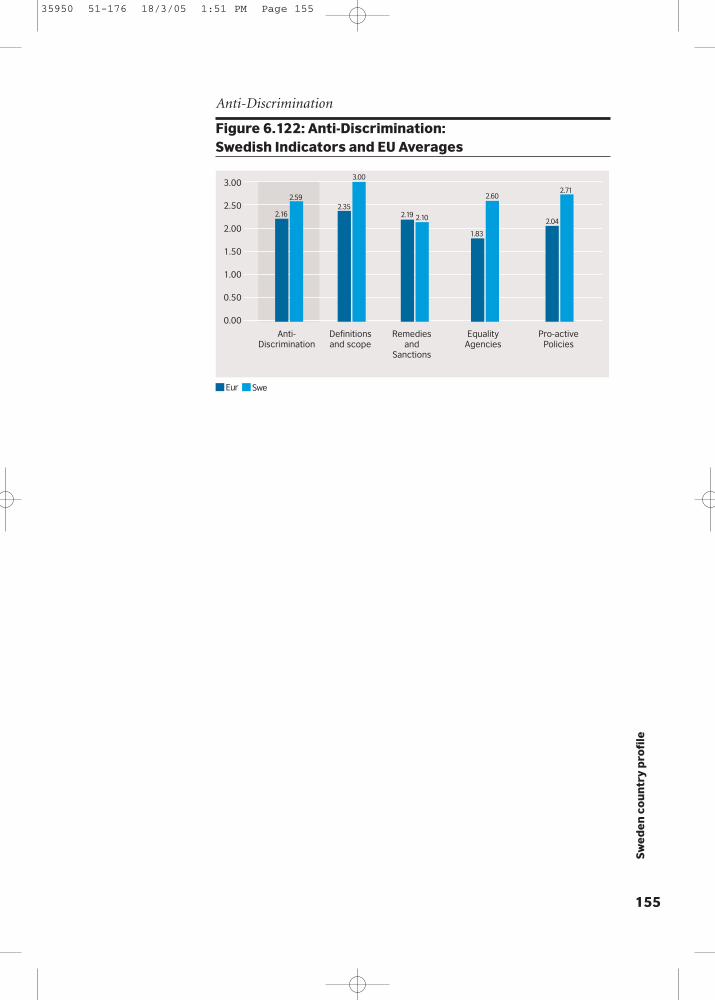
155
Swe
de
n c
ou
ntr
y p
rofi
le
Anti-Discrimination
Figure 6.122: Anti-Discrimination: Swedish Indicators and EU Averages
0.00
0.50
1.00
1.50
2.00
2.50
3.00
Anti-Discrimination
Definitionsand scope
Remediesand
Sanctions
EqualityAgencies
Pro-activePolicies
Eur Swe
2.16
2.59
1.83
2.35
3.00
2.102.19
2.60
2.04
2.71
35950 51-176 18/3/05 1:51 PM Page 155

In 2001, the UK was host to 2.6 million foreigners (4.4% of thepopulation), including 1.2 million foreign workers (4.4% of theworkforce).55 Of the overall foreign population, the Irish remainedthe largest national group but declined as a proportion of the foreignpopulation to 15.3% from 16.8%. Europe was the largest source offoreign residents at 46% of the total, a slight increase due to thegrowth in numbers of Central and Eastern Europeans citizens.
156
United Kingdom country profile
0.00
1.00
2.00
3.00
EligibilitySecurity of Employment Status
Labour Market Integration Measures
Rights Associated with Labour Market Participation
Eligibility for Status
Conditions for Acquisition of Status
Security of Status
Rights Associated with Status
Eligibility for Status
Conditions for Acquisition of Status
Security of StatusRights Associated with Status
Eligibility for Status
Conditions for Acquisition of Status
Security of Status
Dual Nationality
Definitions and Scope
Remedies and Sanctions
Equality Agencies
Pro-active Policies
Labour Market Inclusion Long-term Residence
Nationailty Anti-Discrimination
Family Reunion
Figure 6.123: Overview of UK’s Indicators
Background
55 Data in thisparagraph is drawnfrom OECD, Trends inInternationalMigration, AnnualReport 2003 (Paris,2003), pp158-161.
35950 51-176 18/3/05 1:51 PM Page 156
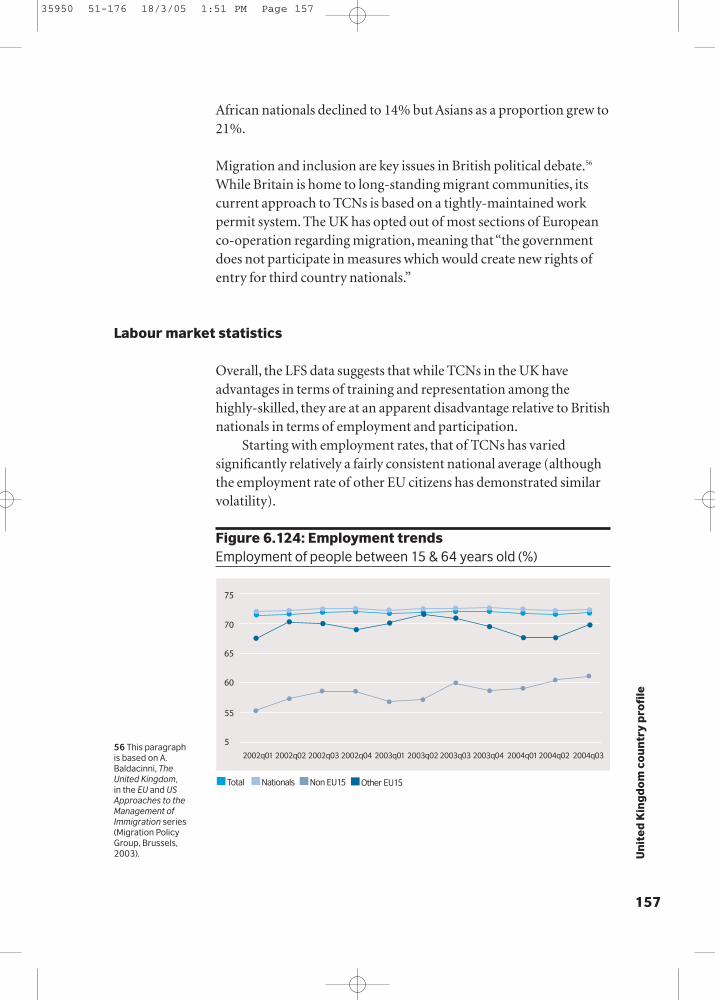
157
Un
ite
d K
ing
do
m c
ou
ntr
y p
rofi
le
African nationals declined to 14% but Asians as a proportion grew to21%.
Migration and inclusion are key issues in British political debate.56
While Britain is home to long-standing migrant communities, itscurrent approach to TCNs is based on a tightly-maintained workpermit system. The UK has opted out of most sections of Europeanco-operation regarding migration, meaning that “the governmentdoes not participate in measures which would create new rights ofentry for third country nationals.”
Overall, the LFS data suggests that while TCNs in the UK haveadvantages in terms of training and representation among thehighly-skilled, they are at an apparent disadvantage relative to Britishnationals in terms of employment and participation.
Starting with employment rates, that of TCNs has variedsignificantly relatively a fairly consistent national average (althoughthe employment rate of other EU citizens has demonstrated similarvolatility).
Figure 6.124: Employment trendsEmployment of people between 15 & 64 years old (%)
Labour market statistics
Total Nationals Non EU15
5
55
65
60
70
75
Other EU15
2002q01 2002q02 2002q03 2002q04 2003q01 2003q02 2003q03 2003q04 2004q012004q02 2004q0356 This paragraph is based on A.Baldacinni, TheUnited Kingdom, in the EU and USApproaches to theManagement ofImmigration series(Migration PolicyGroup, Brussels,2003).
35950 51-176 18/3/05 1:51 PM Page 157

Turning to the recent trends in unemployment, the TCNunemployment rate, although marginally more volatile than that forthe rest of the workforce, does not demonstrate considerablefluctuations:
Figure 6.125: Unemployment trendsUnemployment of people between 15 & 64 years old (%)
While we can see that the unemployment rate for TCNs isconsistently higher than that for British nationals, the long-termunemployment rate as shown in the breakdown for Q2, 2003, isrelatively low for both nationals and TCNs:
158
Total Nationals Non EU15
0
5
15
10
20
25
Other EU15
2002q01 2002q02 2002q03 2002q04 2003q01 2003q02 2003q03 2003q04 2004q012004q02 2004q03
Table 6.91: ComparativeEmployment Rates (Q2, 2003)
Table 6.92: ComparativeParticipation Rates (Q2, 2003)
Employment Rate (%) 71.69
Rate for MSNs 72.30
Rate for TCNs 57.21
% difference TCNs from MSNs 20.87
% difference TCNs from total 20.20
Participation rate (%) 75.35
Rate for MSNs 75.85
Rate for TCNs 63.08
% difference TCNs from MSNs 16.84
% difference TCNs from total 16.29
35950 51-176 18/3/05 1:51 PM Page 158

159
Un
ite
d K
ing
do
m c
ou
ntr
y p
rofi
le
As in Sweden, the employment rates for high and medium-skilledTCN employment are higher than that for low-skilled labour:
Table 6.95: Comparative Rates for Employment accordingto Skill (low, medium or high; Q2, 2003)
Low Medium High
Total employment rate 51.37 77.12 87.49
Rate for MSNs 52.32 77.38 87.94
Rate for TCNs 33.49 57.92 75.58
% difference TCNs from MSNs 35.98 25.15 14.05
% difference TCNs from total 34.80 24.90 13.61
Again similar to Sweden, the number of TCNs on temporarycontracts is high relative to the national average:
Table 6.96: Comparison of Employment by Type ofContract (Permanent or Temporary; Q2, 2003
Permanent Contract Temporary Contract
Total % in type of contract 93.43 5.60
% of MSNs in type of contract 93.80 5.23
% of TCNs in type of contract 84.71 14.24
% difference TCNs from MSNs 9.69 -172.08
% difference TCNs from total 9.33 -154.46
The UK is notable in that training is not only an area of strength forthe labour market overall, but that TCNs are considerably morelikely to have recently received training than British nationals:
Unemployment Rate (%) 4.85
Rate for MSNs 4.68
Rate for TCNs 9.30
% difference TCNs from MSNs -98.60
% difference TCNs from total -91.82
Long-term unemployment rate (%) 1.11
Rate for MSNs 1.09
Rate for TCNs 1.74
% difference TCNs from MSNs -60.38
% difference TCNs from total -57.31
Table 6.93: ComparativeUnemployment Rates (Q2, 2003)
Table 6.94: ComparativeLong-term UnemploymentRates (Q2, 2003)
35950 51-176 18/3/05 1:51 PM Page 159

160
Policy indicators57
57 Devised by theMigration Policygroup and Europe in the World Centreas described in the methodologysection.
Table 6.97: Proportion of workers having receivedtraining in 4 weeks previous to survey (Q2, 2003)
Country-wide proportion receiving training in previous 4 wks 28.10
Percentage of MSNs receiving training in last 4 wks 27.66
Percentage of TCNs receiving training in last 4 wks 38.43
Percentage difference TCNs from MSNs -38.96
Percentage difference TCNs from total -36.77
While the UK labour market favours training and higher-skilledTCNs, it demonstrates outstanding problems of employment andparticipation for TCNs generally.
Overall performanceBritain is very close to the European average in each indicator. It isslightly higher than average in labour market inclusion, longer-termresidence and nationality and slightly below in anti-discrimination.All its strand scores are within the less favourable category.
Figure 6.126: Comparative Performance: British and EU Averages
Though Britain performs above the European average in access andeligibility and labour market integration measures, it is belowaverage in security and rights associated with labour marketparticipation.
Britain is below the European average with regard to rightsassociated with long-term residence and, to a much larger degree, to
0.00
2.192.18 2.182.02
2.16
0.50
1.00
1.50
2.00
2.50
3.00
Eur UK
Labour Market Inclusion Long-term Residence Nationailty Anti-DiscriminationFamily Reunion
2.22 2.17 2.16 2.18 2.15
35950 51-176 18/3/05 1:51 PM Page 160

161
Un
ite
d K
ing
do
m c
ou
ntr
y p
rofi
le
eligibility. However, it performs comparably better in conditions foracquisition and security.
Again, this time for family reunion, Britain is above theEuropean average for two of the indicators and below for the otherhalf. However, there is not too much difference between the figures,with the exception of security of reunion, where it performs poorly.
Though it is slightly below the European average for eligibilityfor nationality, Britain performs well in the other three indicators,especially security.
In terms of anti-discrimination, there are again no significantdifferences between Britain’s performance and the Europeanaverages; it is slightly below in remedies and sanctions butmarginally higher in the other three indicators.
Labour market inclusion
Figure 6.127: Labour Market Inclusion: British Indicators and EU Averages
0.00
0.50
1.00
1.50
2.00
2.50
3.00
Labour MarketInclusion
Eligibility Security ofEmployment
Status
Integration measures inthe Labour
Market
Rights Associatedwith Labour Market
Participation
Eur UK
2.18 2.22
2.00
1.82
2.632.50
2.17
2.50
2.00
2.27
35950 51-176 18/3/05 1:51 PM Page 161

162
Long-term residence
Figure 6.128: Long-term Residence: British Indicators and EU Averages
Family Reunion
Figure 6.129: Family Reunion: British Indicators and EU Averages
0.00
0.50
1.00
1.50
2.00
2.50
3.00
Family Reunion
Eligibilityfor Status
Conditionsfor Acquisition
of Status
Security of Status
Rights Associatedwith Status
Eur UK
2.18 2.161.97 1.972.00
2.202.33
2.00
2.47 2.40
0.00
0.50
1.00
1.50
2.00
2.50
3.00
Long-term Residence
Eligibilityfor Status
Conditionsfor Acquisition
of Status
Security of Status
Rights Associatedwith Status
Eur UK
2.19 2.17
1.89
1.33
2.132.40
2.172.29 2.34
2.25
35950 51-176 18/3/05 1:51 PM Page 162

163
Un
ite
d K
ing
do
m c
ou
ntr
y p
rofi
le
Nationality
Figure 6.130: Nationality: British Indicators and EU Averages
Anti-Discrimination
Figure 6.148: Anti-Discrimination: British Indicators and EU Averages
0.00
0.50
1.00
1.50
2.00
2.50
3.00
Nationality Eligibilityfor Status
Conditionsfor Acquisition
of Status
Security of Status
Dual Nationality
Eur UK
2.022.18
1.84
2.03 2.002.13
2.042.33 2.17
2.50
0.00
0.50
1.00
1.50
2.00
2.50
3.00
Anti-Discrimination
Definitionsand scope
Remediesand
Sanctions
EqualityAgencies
Pro-activePolicies
Eur UK
2.16 2.15
1.83
2.35 2.36
2.002.19
2.00 2.042.14
35950 51-176 18/3/05 1:51 PM Page 163

164
Annex I Indicators and Options
In the Commission’s first Annual Reporton Migration and Integration (2004) lack of access to employment wasidentified in the majority of countries as the most important barrier tointegration and therefore the most urgent political priority for nationalintegration policies.
Restricting access to employment isexclusionary, hinders mobility, and leadsto a potential loss of skills to the economy,yet European countries are characterisedby a structure of inclusion and exclusion.This restriction of access to the labourmarket can occur in a very explicit sense interms of sectors and occupations that arereserved for nationals or EU nationals, butit can also be more indirect through thenon-recognition of qualifications, thetying of work permits to specific jobs orsectors, or lack of access to education,vocational training, etc.
For example, EU nationals haveunrestricted work and residence in anyother EU member state, whereas differentarrangements exist for citizens of the newaccession states in different countrieswhile nationals of other countries mightbe covered by bilateral agreements.Likewise, the recognition of academic andprofessional qualifications is an essentialpart of access to the labour market andmobility as it allows individuals to findwork, and in the same way EU nationalsoften enjoy pan-European recognitionwhile third country nationals are either
not covered, or have to rely on ad-hoc orbilateral arrangements.
1.1 Access and Eligibility FavourableThe same procedures that apply to EEAnationals for the recognition of academicand professional qualifications apply tothird country nationals. Third countrynationals enjoy equal access toemployment including the public sector,but not including the exercise of publicauthority, and access to self-employmentis only limited by the financial viability ofthe individual’s business plan.
Less favourableDifferent procedures to those which applyto EEA nationals for the recognition ofacademic and professional qualificationsapply to third country nationals.Restrictions exist with regards to theemployment of third country nationals inthe public sector, and other limitingconditions and restrictions restrict thegranting of self-employed status for thirdcountry nationals, such as linguisticability.
Unfavourable There is no recognition of academic andprofessional qualifications for thirdcountry nationals, or there is a possibledown-grading of qualifications. Access toemployment in the public sector and othersectors is restricted by nationality. In the
Labour market inclusion strand
35950 51-176 18/3/05 1:51 PM Page 164
165
case of self-employment, certain sectorsand activities are reserved solely fornationals/ EU nationals.
1.2 Security of Employment StatusMost countries have more than one workpermit scheme in place, and typicallydifferent systems have different conditionsin terms of duration, and whether theindividual is tied to a specific employer orsector. As a result of the complexityinvolved in each country, rather thanlooking separately at all the different typesof work permits available, we focus onwhat happens following admission for allpermits of one year or more in terms ofhow easy it is to renew work permits, andthe security of the status for the migrantworker after the termination of thepermit.
FavourableAll work permits (except for seasonalpermits) are in principle possible to renew.Residence permit is not necessarilyrevoked after the termination of a workcontract. If the individual has more thanthree years of legal employment (and forless than three years) other elements areconsidered, such as length of residence orworker’s social security history, or moreflexible criteria (less than three years etc.).
Less favourableCertain permits (in addition to seasonalpermits) are in principle not renewable.Residence permit is not revoked after thetermination of a work contract. If theindividual has more than five years of legalemployment further elements (length ofresidence, worker’s social security historyor other) are considered.
UnfavourableWork permits are in principle notrenewable; residence permit can berevoked in all cases after the terminationof a work permit.
1.3 Labour Market Integration MeasuresMember States have committedthemselves to reduce significantly the gaps
in rates of unemployment between non-EU and EU nationals. First results fromworking groups set up within the openmethod of co-ordination suggest thatthere are significant obstacles for migrantsto access learning opportunities. In thissection we ask whether there is equalaccess to education and vocationaltraining and test the commitment toreduce the gap in unemployment byasking what policy measures in terms ofwork-related integration have beenintroduced for migrant workers.
FavourableNo distinction made between EU andnon-EU nationals in terms of educationand vocational training, including studygrants; national policy targets have beenset to reduce the unemployment ofmigrants; national targets have been set topromote vocational training for migrants,and there are language acquisitionprogrammes to improve occupationalskills.
Less favourableEqual treatment in terms of education andvocational training only after more thanone but less than three years of legalemployment; either national targets havebeen set for reduction of unemploymentof migrants or vocational training, orlanguage programmes have beenintroduced (but not all of these measures).
UnfavourableThird country nationals do not have equalaccess to education and vocationaltraining after three years, or other limitingconditions exist; no elements ofintegration measures.
1.4 Rights Associated with LabourMarket ParticipationRights associated with job security andaccess to representation through unionsand other associations are crucial elementsof an inclusive and open labour market. Itshould be noted that rights can varygreatly according to the type of workpermit held by the migrant (as mentioned A
nn
ex I
– In
dic
ato
rs a
nd
Op
tio
ns
35950 51-176 18/3/05 1:51 PM Page 165
166
in section 1.2). This has been referred to byLydia Morris (2004) as ‘civic stratification’.In the case of the UK, for example, thereare more than 12 separate migrant workerschemes in operation, each with a differentset of rights attached. As with the previousindicators, we focus on all those holding apermit of a year or more (not includingseasonal permits). Here we look at theright for the third-country national tochange working status or work permit (i.e.different employer, different job, differentindustry, different permit category etc.),and the right to join and become an activemember of a trade union or otherprofessional organisation.
FavourableThe third country national has the right tochange working status or work permitbefore completing one year of legalemployment. Membership and access toelected positions in unions and otherprofessional associations are equal to thatof nationals.
Less favourableThe right to change status is only grantedafter one year (and less than three years).Membership of unions and otherprofessional associations is allowed, butaccess is restricted for elected positions inunions.
UnfavourableThe right to change status is not allowed oronly allowed after more than three years oflegal employment. Restrictions apply tomembership of unions or otherprofessional associations.
Refs:European Commission (EC) COM(2004)508 final First Annual Report on Migrationand Integration Brussels,July 2004Morris, L. (2004) “The Control of Rights:The Rights of Workers and Asylum SeekersUnder Managed Migration, DiscussionPaper, Joint Council For the Welfare ofImmigrants (JCWI)
Civic citizenship
Equality and access are cornerstones ofEuropean immigrant and integrationpolicies. Equal treatment of immigrants isoften a condition for their admission.They acquire more rights and assumemore responsibilities over time and in thisway they gradually become full and activecitizens. Policies can set favourableintegration conditions and they includesecuring residence, facilitating familyreunion, encouraging naturalisation andcombating discrimination. These areas,taken together, promote civic citizenship.
35950 51-176 18/3/05 1:51 PM Page 166

167
An
nex
I –
Ind
icat
ors
an
d O
pti
on
s
1.1 Eligibility Employed and self-employed third-country nationals legally residing in aMember State are after a certain period oftime entitled to the status of long-termresident.
FavourableThis period is not more than three yearsfor employed persons and five years fornon-economically active persons, periodsthat may be interrupted for more than tennon-consecutive months.
Less favourableThis period is three to five years for (self-)employed persons and up to eight for non-economically active persons, periods thatmay be interrupted for up to ten non-consecutive months or six consecutivemonths.
UnfavourableThis period is more than five years for(self-) employed persons and more thaneight years for non-economically activepersons, periods that may be interruptedfor less than ten non-consecutive monthsor six consecutive months.
1.2 Conditions FavourableThe status of long-term resident isacquired by way of a simple procedurewithout economic, insurance orintegration conditions. The length of theapplication procedure is not longer thansix months and entails no costs.
Less favourableThe status is acquired on the basis ofemployment related criteria. In addition, asimple sickness insurance is required and alanguage test. The length of theapplication procedure takes between six toten months and the same administrativefee is charged as for an identity card.
UnfavourableThe status is acquired after it is established
that the applicant has stable and sufficientmeans for himself and dependents. Inaddition, there is a test on insurance at allrisks. The integration test includes morethan a language test. The length of theapplication procedure takes more thannine months and costs more than what ischarged for an identity card.
1.3 Security of statusFavourableThe long-term residence permit is validfor five or more years and automaticallyrenewable. It is allowed to be absent from aMember State for more than three years.Grounds for withdrawal and refusal torenew the status should be limited toproven fraud in the acquisition of thestatus and a sentence for a serious crime.In case of expulsion due account should betaken of personal behaviour of the personconcerned, his/her age, duration ofresidence, consequences for both statusholder and his/her family, links to theMember State and links with country oforigin. Alternative measures (e.g.downgrading to a limited stay ortemporary residence permit) are takeninto consideration. Expulsion should beprecluded after status holder has beenresident for 20 years, in case of minors andwhen the status holder is born in theMember State or admitted as child beforethe age of ten. If a permit is withdrawn oran expulsion order issued, the statusholder is entitled to a fair hearing, areasoned decision, access to appeal andrepresentation before a independentauthority.
Less favourableThe long-term residence permit is validfor three to five years renewableautomatically or upon simple application.The migrant is allowed to be absent from aMember State for up to three years.Grounds for withdrawal and refusal torenew the status include an actual andserious threat to public policy or nationalsecurity, but not unemployment. In case of
Long-term residence
35950 51-176 18/3/05 1:51 PM Page 167

168
expulsion, due account should be taken ofat least the age of the status holder and theduration of residence, consequences forboth status holder and his/her family andlinks to the Member State. Expulsionshould be precluded after status holder hasbeen resident for 20 years and/or in case ofminors. If a permit is withdrawn or anexpulsion order issued, the status holder isentitled to a fair hearing, a reasoneddecision and access to appeal.
UnfavourableThe long-term residence permit is validfor less than three years and onlyrenewable when the original requirementsare still met. It is not allowed to be absentfrom a Member State for more than oneyear. Grounds for withdrawal and refusalto renew include unemployment of status holder. In case of expulsion, oneor more essential factors are not taken intoaccount: age, duration of residence,consequences for both the status holderand his/her family and/or links to theMember State. Expulsion is possible undermany circumstances and legal redress is limited. One or more of basic elementsof protection (fair hearing, reasoneddecision and right to appeal) are notguaranteed.
1.4 Rights associated FavourableLong-term residents maintain theirresidence status after retirement. Theyhave equal access to the labour market(except for work involving the exercise ofpublic authority) under the same workingconditions as EU citizens. Other equalityrights include access to social security,social assistance and healthcare, such asminimum income support, minimumhousing support, assistance in case ofillness, pregnancy and maternity and long-term care. They have also equal access toeducation and vocational training. Therecognition of their academic andprofessional qualifications and diplomastakes place on the basis of the sameprocedures that are used for EEAnationals. Long-term residents can
become (active) members of trade unionsand professional or other associations andhave the right to vote in all elections andstand for local elections.
Less favourableLong-term residents maintain theirresidence status after retirement, but withfewer entitlements. They have equal accessto the labour market (except for workinvolving the exercise of public authority)under the same working conditions as EU citizens, but priority is given tonationals and EEA citizens. They areentitled to some core benefits, includingminimum income support, assistance incase of illness, pregnancy and maternityand long-term care. They have access to education and to vocational trainingbut language proficiency is required (for other than university level). There aredifferent procedures for the recognition of academic and professionalqualifications than those that apply to EEAcitizens. Long-term residents can become(active) members of trade unions andprofessional or other associations, butaccess to certain elected positions isrestricted. They have the right to vote andstand for elections, but only in localelections and with some restriction forcertain posts.
UnfavourableThe long-term residence status is notmaintained after retirement. There arelimiting conditions for accessing thelabour market and equal workingconditions, other than priority given toEEA citizens. Access to social security,assistance and healthcare is less than accessto core benefits or there is no access at all.Access to education and vocationaltraining is severely restricted. Academicand professional qualifications are notrecognised or even downgraded.Restrictions apply for the membership of and participation in trade unions andother professional organisations.There is no right to vote and stand for local elections or severe restrictionsapply.
35950 51-176 18/3/05 1:51 PM Page 168

169
An
nex
I –
Ind
icat
ors
an
d O
pti
on
s
2.1 Eligibility FavourableLegally residing third-country nationals–sponsors– are entitled to family reunionafter an up to one year’s waiting period orwhen holding a residence permit for up toone year. The persons entitled toreunification with the sponsor includespouse or registered partner and minorchildren with no limiting conditions (suchas specific age limits). Dependent adultchildren and dependent relatives in theascending line are also entitled.
Less favourableLegally residing third-country nationals –sponsors – are entitled to family reunionafter a waiting period of one or more yearsor when holding a residence permit forone or more years. The persons entitled to reunification with the sponsor includespouse, but not the registered partner,and unmarried minor children.Dependent adult children and dependentrelatives in the ascending line may undercertain conditions be united with theirfamily.
UnfavourableLegally residing third-country nationals–sponsors– are entitled to family reunionafter a waiting period of two or more yearsor when holding a residence permit oftwo or more years. The persons entitled to reunification with the sponsor musteither be of a certain age, or integration or other conditions apply. For minorchildren the applications must be madebefore the age of 15, or other conditionsapply. Dependent relatives and adultchildren may not be united with theirfamilies.
2.2 Conditions FavourableThere are no accommodation, economicresources or integration requirements forfamily reunion. The procedures are short,not longer than six months, and do notentail costs.
Less favourableAccommodation requirements only relateto reasonable health and safety standardsand economic or integration requirementsrelate only to employment or languagetests respectively. The applicationprocedure takes between six and ninemonths and the costs are not higher thanfor the issue of an identity card.
UnfavourableAccommodation requirements go beyondreasonable health and safety standards.Economic or integration requirementsinclude stable and sufficient resources forall family members and integrationconditions apply. The length ofapplication procedure exceeds ninemonths and the costs are higher than foran identity card.
2.3 Security of statusFavourableThe residence status of family members is the same as that of the sponsor’s and isrenewable. Grounds for the withdrawal or refusal to renew are proven fraud in the acquisition of the status and majorpublic policy or security threat. Before the status is withdrawn or renewal refused,due account is taken of the solidity ofthe sponsor’s family relationship, theduration of the sponsor’s residence and(non)-existing links with the MemberState and/or country of origin. If a permitis finally withdrawn or refused, the status holder is entitled to a reasoneddecision, access to appeal andrepresentation before an independentauthority and/or a court.
Less favourableThe residence permit of family members is renewable and valid for one year ormore but its duration is not equal to thatof the sponsor’s. Grounds for thewithdrawal or refusal to renew are provenfraud in the acquisition of the status andmajor public policy or security threat,but also the break-up of family
Family reunion
35950 51-176 18/3/05 1:51 PM Page 169
170
relationship (before three years).Before the status is withdrawn or renewalrefused, due account may be taken ofsome but not all of the following factors:solidity of the sponsor’s familyrelationship, the duration of the sponsor’sresidence and (non)-existing links withthe Member State and/or country oforigin. If a permit is finally withdrawn orrefused, the status holder is entitled at leastto a reasoned decision and access toappeal.
UnfavourableThe residence permit of family members is valid for less than one year after which anew application may be required. Groundsfor the withdrawal or refusal to renewalare proven fraud in the acquisition of thestatus and major public policy or securitythreat, the break-up of family relationship,but also other grounds. The status can bewithdrawn and renewal can be refused. If apermit is finally withdrawn or refused, thestatus holder is not entitled to at least oneof two basic guarantees of protection ofstatus (reasoned decision and right ofappeal).
2.4 Rights associatedFavourableSpouse, partners, children reaching the age of majority acquire an autonomousresidence status after less than or just after three years of residence. Other familymembers acquire this right after threeyears. Family members have access toeducation, training and employment,as well as access to social security andassistance, healthcare and housing,in the same way as the sponsor.
Less favourableSpouse, partners and children reaching the age of majority acquire anautonomous residence status after three to five years of residence. Other familymembers acquire this right after threeyears or upon certain conditions only.Under certain conditions family membershave access to education, training andemployment, as well as access to social
security and assistance, healthcare andhousing.
UnfavourableSpouse, partners and children reaching theage of majority acquire an autonomousresidence status after five years ofresidence or on the basis of otherconditions. Other family members haveno right to an autonomous residencepermit. Family members have no access toeducation, training and employment, or tosocial security and assistance, healthcareand housing.
35950 51-176 18/3/05 1:51 PM Page 170

171
An
nex
I –
Ind
icat
ors
an
d O
pti
on
s
3.1 Eligibility FavourableFirst generation immigrants and spousesof EU citizens can apply for nationalityafter three years of legal residence and/ormarriage (for spouses of nationals).Second and third generation immigrantsacquire nationality automatically at birth.Periods of absence of more than ninemonths are allowed previous to theacquisition of nationality.
Less favourableFirst generation immigrants and spousesof EU citizens can apply for nationalityafter three to five years of legal residenceand/or marriage (for spouses ofnationals). Second and third generationimmigrants acquire nationality onapplication at age of majority but with no additional requirements. Periods ofabsence of six to nine months are allowedprevious to acquisition.
UnfavourableFirst generation immigrants and spouses of EU citizens can apply fornationality after more than five years of legal residence and/or marriage (forspouses of nationals). Second and third generation immigrants acquirenationality provided they meetrequirements such as continuousresidence since birth, for a number of years, etc. Only periods of absenceshorter than six months are allowedprevious to the acquisition ofnationality.
3.2 ConditionsFavourableConditions for the acquisition ofnationality are only linked to duration ofresidence and family ties. No language orcitizenship tests (including knowledge ofhistory and institutions) apply. Equally, noeconomic resources, health insurance oroath of allegiance (in the form of adeclaration or other) is required foracquisition. The application is rejected
only on grounds of having committed aserious crime, which is clearly defined inthe law. The application procedures mustbe short, not be longer than six months,and entail no costs.
Less favourableLanguage and citizenship tests areconditions for the acquisition ofnationality but they are kept at a simplelevel. Economic and health insurancerequirements are limited to minimumincome and simple health insurancerespectively. Applicants sign a declarationof allegiance. An application may berejected for reason of repeated offences orserious crimes. Procedures do not exceednine months and costs do not exceed theamount due for an identity card.
UnfavourableLanguage and citizenship tests at high levelare conditions for the acquisition ofnationality. Economic and healthinsurance requirements must be met thatgo beyond minimum income and simplehealth insurance. Other conditions couldinclude attending naturalisationceremonies. An application can be rejectedon grounds of offences other thanrepeated offences or serious crimes clearlyspecified in the law. Procedures exceednine months and have costs higher thanthose charged for an identity card.
3.3 Security of statusFavourableThere is only one ground for thewithdrawal of nationality, namely whenfraud in the acquisition of nationality isproven. Before withdrawal due account istaken of personal behaviour of the personconcerned, his/her age, duration ofresidence, consequences for both statusholder and his/her family, links to theMember State and links with country oforigin. In addition, alternative measures(e.g. downgrading to residence permit,etc.) are considered. If nationality iswithdrawn, the person concerned is
Nationality
35950 51-176 18/3/05 1:51 PM Page 171
172
entitled to legal redress and legalguarantees include, a reasoned decision,the right to appeal and representationbefore an independent authority and/or acourt.
Less favourableGrounds for withdrawal of citizenship arerestricted to two, namely when fraud inthe acquisition of nationality has beenproven and when the applicant poses anactual serious threat to public policy ornational security. Before withdrawal dueaccount is taken of a number of elements:age, duration of residence, consequencesfor both status holder and his/her familyand links to the Member State and linkswith country of origin. If nationality iswithdrawn, the person concerned isentitled to legal redress and legalguarantees include a reasoned decisionand right to appeal.
UnfavourableGrounds for withdrawal of citizenship gobeyond proven fraud in the acquisition ofthe status and actual serious threat topublic policy or national security. Beforewithdrawal of citizenship, one or variousessential factors such as age of personconcerned, duration of residence andconsequences for both the status holderand his/her family, and links to theMember State and the country of originare not considered. If nationality iswithdrawn, the person concerned does nothave a right to a reasoned decision oraccess to appeal.
3.4 Rights associatedFavourableWhen acquiring the nationality of aMember State it is not necessary to give upthe original nationality of another state.Children born to parents of differentnationality or different from the MemberState are entitled to dual citizenshipautomatically at birth.
Less favourableWhen acquiring the nationality of aMember State it is necessary to give up the
original nationality, but there areexceptions for certain nationalities.Children born to parents of differentnationality or different from the MemberState are entitled to dual citizenship oncertain conditions (such as if born inwedlock).
UnfavourableWhen acquiring the nationality of aMember State it is necessary to give up theoriginal nationality. Children born toparents of different nationality or differentfrom the Member State are neither entitledto dual citizenship.
35950 51-176 18/3/05 1:51 PM Page 172

173
An
nex
I –
Ind
icat
ors
an
d O
pti
on
s
Whether anti-discrimination policies setfavourable less favourable or unfavourableconditions for immigrant inclusiondepends very much on whether a range ofdiscrimination grounds is covered.
FavourableThe grounds of discrimination include:race/ethnic origin, religion/belief andnationality.
Less favourableThe grounds of discrimination include:two of those three grounds.
UnfavourableThe grounds of discrimination includeonly one ground
4.1 ScopeThe definition of discrimination includesdirect and indirect discrimination,harassment and instructions todiscriminate. Anti-discrimination on allthese grounds cover as many as possiblefields including the labour market,education and training, social protection(including social security and healthcare),social advantages and the supply of goodsand services (including housing). The lawalso prohibits discrimination and coverracially motivated public insults, threats ordefamation, as well as instigating, aiding,abetting or attempting to commit suchoffences. Racist motivation in othercrimes should be treated as aggravatingcircumstance.
4.2 RemediesAccessible judicial civil and/oradministrative procedures are in place, aswell as procedures for alternative disputeresolution. The burden of proof is sharedin civil procedures. Persons are protectedagainst victimisation. Legal entities with alegitimate interest may engage inproceedings on behalf or in support ofvictims. Legal entities can bring cases evenif no specific victim is referred to. The stateprovides financial support to pursue
complaint where victims do not have thenecessary means. Interpretation isprovided free of charge. Sanctions include,financial compensation to victims formaterial and moral damages, therestitution of rights lost due todiscrimination, and imposing positivemeasures on the discriminator.
4.3 Equality agenciesEquality agencies provide independentassistance to victims of discrimination.They conduct independent surveys,publish independent reports and makerecommendations. They undertakeawareness–raising and promote policiesand good practices. They have the powerto instigate proceedings in their ownname. They also have investigative powersand the powers to enforce findings.
4.4 Pro-active policiesAnti-discrimination law provides for theintroduction of positive action measuresand public bodies are under the obligationto promote equality in carrying out theirfunctions. They ensure that parties towhom they award contracts, loans, grantsor other benefits respect non-discrimination. Governments disseminateinformation and ensure social dialoguearound issues of discrimination and astructured dialogue with civil society. Therestriction of freedom of association,assembly and speech is permitted as ameans to combat racism.
Anti-discrimination
35950 51-176 18/3/05 1:51 PM Page 173

174
Also available from British Council BrusselsFor a free copy tel +32 2 227 0840 or [email protected] full details of British Council Brussels publications, visitwww.britishcouncil.be
The Democratic PapersEdited by Paul HilderIn association with DEMOS, Opendemocracy.net and Vision.The Democratic Papers contains rich, challenging and excitinganalyses of the future of governance in Europe and beyond. Twenty-three contributors from twelve countries take a penetrating look atreal issues that matter to real people all over the world, aiming to helpshape new debates about what democracy can and should mean, andhow we can meet its demands.
Turkey in Europe: More Than a Promise?Report of the Independent Commission on TurkeyIn association with the Open Society InstituteThe Independent Commission on Turkey was established in March2004 to help defuse tensions surrounding the possibility of openingaccession negotiations with Turkey. The Commission’s reportexamines in detail opportunities and challenges presented byTurkey’s possible membership of the European Union to help shapea more rational debate. Chaired by former Finnish President MarttiAhtisaari, its nine members include former heads of state, foreignministers and European Commissioners.
Further reading
35950 51-176 18/3/05 1:51 PM Page 174

175
Also by Andrew GeddesImmigration and European IntegrationA. Geddes, Manchester University Press, 2000
The Politics of Migration and Immigration in EuropeA. Geddes, Sage, 2003
The European Union and British PoliticsA. Geddes, Palgrave Macmillan, 2004
Also available by the Foreign Policy CentreThe European Inclusion Index: Is Europe ready for the globalisation of people?By Mark Leonard and Phoebe GriffithOctober 2003; available free online at: www.fpc.org.uk/publicationsThe European Inclusion Index will rank European member states’attempts to promote progressive citizenship and inclusion policies.The Index will assess the policies put in place to challengediscrimination, as well as the ability of migrants and ethnicminorities to participate actively in the social, political and economiclives of their host communities.
35950 51-176 18/3/05 1:51 PM Page 175

De
sig
n: J
on
Hill
De
sig
n w
ith
Mat
t B
row
n |
Pro
du
ctio
n: R
ou
te |
Co
ver
illu
stra
tio
n: G
illia
n B
leas
e
35950 51-176 18/3/05 1:51 PM Page 176