european climate foundation trucking into a … environmental impacts 52 8 conclusions 53 appendix a...
TRANSCRIPT
Final Report September
2018
Cambridge Econometrics
Cambridge, UK
www.camecon.com
European Climate Foundation
Trucking into a Greener Future: the economic impact of decarbonizing goods vehicles in Europe

Decarbonising road freight in Europe: A socio-economic assessment
2 Cambridge Econometrics
Our mission is to provide clear insights, based on rigorous and independent economic analysis, to support policy-makers and strategic planners in government, civil society and business in addressing
the complex challenges facing society.
Cambridge Econometrics Limited is owned by a charitable body, the Cambridge Trust for New Thinking in Economics.
www.neweconomicthinking.org

Decarbonising road freight in Europe: A socio-economic assessment
3 Cambridge Econometrics
Authorisation and Version History
Version Date Authorised for release by
Description
1.1 05/09/18 Jon Stenning Appendix added with outcomes from ICCT technology review
1.0 21/08/18 Jon Stenning Final technical report

Decarbonising road freight in Europe: A socio-economic assessment
4 Cambridge Econometrics
Acknowledgments
In recent years a number of studies have assessed the socio-economic impact of a transition to low-carbon cars in Europe, at the level of the EU as a whole (‘Fuelling Europe’s Future’, 2013 and 20181) and Member State (‘Fuelling Britain’s Future’, 20152, ‘En route pour un transport durable’, 20163, ‘Low-carbon cars in Germany’, 20174, ‘Fuelling Spain’s Future’, 20185). However, this is the first study that has looked at the whole-economy impact of a similar transition in the heavy-duty freight transport segment.
Cambridge Econometrics provided the analytical work presented in this report, including vehicle stock analysis and economic modelling (using the E3ME6 model).
The report was funded by the European Climate Foundation who convened a core working group to advise and review the analysis and reporting. The authors would like to thank all members of the core working group for their respective inputs.
The stakeholders who contributed to this study shared the aim of establishing a constructive and transparent exchange of views on the technical, economic and environmental issues associated with the development of low-carbon technologies for HGVs. The objective was to evaluate the boundaries within which vehicle technologies can contribute to mitigating carbon emissions from HGVs across Europe. Each stakeholder contributed their knowledge and vision of these issues. The information and conclusions in this report have benefitted from these contributions but should not be treated as necessarily reflecting the views of the companies and organisations involved.
The technology cost data used in this analysis was independently reviewed by Felipe Rodriguez and Rachel Muncrief of the International Council for Clean Transportation, and a full list of the feedback received, and the steps taken to address it, is included in Appendix B. The infrastructure data and assumptions used were similarly reviewed by Céline Cluzel of Element Energy.
1 https://www.camecon.com/how/our-work/fuelling-europes-future/ 2 https://www.camecon.com/how/our-work/fuelling-britains-future/ 3 https://www.camecon.com/how/our-work/en-route-pour-un-transport-durable/ 4 https://www.camecon.com/how/our-work/low-carbon-cars-in-germany/ 5 https://www.camecon.com/how/our-work/fuelling-spains-future/ 6 More detail on this model is presented in an annex to this report, and can also be found at www.e3me.com
Background
Core analytical team
Disclaimer
Review

Decarbonising road freight in Europe: A socio-economic assessment
5 Cambridge Econometrics
Contents
Page
Acronyms and abbreviations 6
Executive summary 8
1 Introduction 10
2 Overview of scenarios 13
3 Modelling assumptions 18
4 Infrastructure requirements 35
5 Hauliers’ perspective 43
6 Economic impacts 46
7 Environmental impacts 52
8 Conclusions 53
Appendix A E3ME model description 54
Appendix B ICCT review 61

Decarbonising road freight in Europe: A socio-economic assessment
6 Cambridge Econometrics
Acronyms and abbreviations
Table 0.1 sets out the acronyms and abbreviations commonly used in the report.
Table 0.1 Acronyms and abbreviations
Abbreviation Definition
Powertrain types
Internal combustion engine
ICE These are conventional diesel vehicles with an internal combustion engine. In the various scenarios modelled there is variation in the level of efficiency improvements to the ICE. Efficiency improvements cover engine options, transmission options, driving resistance reduction, tyres and hybridisation.
Plug-in hybrid electric vehicle
PHEV Plug-in hybrid electric vehicles have a large battery and an internal combustion engine. They can be plugged in to recharge the vehicle battery. EVs with range extenders are not included in the study.
Battery electric vehicle
BEV This category refers to fully electric vehicles, with a battery but no internal combustion engine.
Fuel cell electric vehicle
FCEV FCEVs are hydrogen fuelled vehicles, which include a fuel cell and a battery-powered electric motor.
Zero emissions vehicle
ZEV Includes all vehicles with zero tailpipe emissions (e.g. FCEVs and BEVs).
Electric vehicles EV All vehicles which are fuelled directly via electricity (i.e. BEVs and PHEVs)
Electric road system
ERS Refers to electrified infrastructure to supply EV vehicles with a constant power supply across portions of the road network. PHEV-ERS and BEV-ERS are vehicles with the required pantograph to enable them to draw charge from ERS.
Economic terminology
Gross domestic product
GDP A monetary measure of the market value of all final goods and services produced in the national economy
Gross value added
GVA A measure of the total value of incomes generated from production (largely wages and gross profits); it is equal to the difference between the value of output and the value of bought-in goods and services (hence ‘value added’).
Other acronyms
Original equipment manufacturers
OEMs Refers to equipment manufacturers of motor vehicles
Million/billion barrels of oil equivalent
Mboe/Bboe A unit for measuring oil volumes
Total Cost of Ownership
TCO Total cost of owning and operating (fuel etc) a vehicle
Light Heavy goods vehicles
LHGVs Heavy goods vehicles with a gross vehicle weight of 3.5-7.5 tonnes
Medium Heavy goods vehicles
MHGVs Heavy goods vehicles with a gross vehicle weight of 7.5-16 tonnes
Heavy Heavy goods vehicles
HHGVs Heavy goods vehicles with a gross vehicle weight of greater than 16 tonnes
Operations and maintenance
O&M Refers to the category of expenditure covering the operations and maintenance to provide a good or service.

Decarbonising road freight in Europe: A socio-economic assessment
7 Cambridge Econometrics
Hyrdogen refuelling station
HRS Refers to infrastructure for the dispensing of hydrogen for motor vehicles

Decarbonising road freight in Europe: A socio-economic assessment
8 Cambridge Econometrics
Executive summary
This report assesses the economic costs and benefits of decarbonising Heavy Goods Vehicles (HGVs) in Europe. A scenario approach has been developed to envisage various possible vehicle technology futures, and then economic modelling has been applied to assess impacts.
Cambridge Econometrics was commissioned by the European Climate Foundation (ECF) to assess the likely economic impacts and the transitional challenges associated with decarbonising the European fleet of vans and heavy goods vehicle in the medium term (to 2030) and the long term (to 2050).
This technical report sets out the findings from our analysis. It provides details about the charging infrastructure requirements, technology costs and economic impacts of the transition to low-carbon mobility in the freight sector. A summary report, presenting the key messages from the study, is also available7.
The study shows that, while there are potentially large economic and environmental benefits associated with decarbonising road freight in Europe, there are also transitional challenges which must be addressed if the benefits are to be realised. Up until now there has been little effort from OEM and policy makers to decarbonise vans and HGVs. But there are signs that the market is about to change. In May 2018 the European Commission put forward a proposal for the first ever European CO2 emission standards for HGVs, buses and coaches8. Throughout 2017 and 2018, a number of OEMs have unveiled prototypes of electric and hydrogen-fuelled propulsion systems for HGVs.
The potential benefits if Europe embraces the transition are substantial:
• Reduced use of oil and petroleum products will cut energy import dependence and bring about large reductions in carbon emissions.
• There are net gains in value added and employment which increase as oil imports are reduced over time. By 2030, in each of the Zero-Emission Vehicle technology (ZEV) scenarios there is an increase in GDP of 0.07% compared to the ‘Business as Usual’ case, and an increase in employment of around 120,000 jobs.
• The transition offers the opportunity of lower costs of road freight transportation, with lower total cost of ownership associated with BEV and ERS technologies, and FCEVs achieving cost parity with ICEs by 2050.
However, our modelling, in combination with insight from the Core Working Group, also highlights a number of transitional challenges:
• The implementation of a rapid charging infrastructure and hydrogen refueling stations will require investments reaching several billion euros
7 See: https://www.camecon.com/how/our-work/trucking-to-a-greener-future 8 European Commission (2018), Reducing CO2 emissions from heavy duty vehicles, Accessed 02/08/18 https://ec.europa.eu/clima/policies/transport/vehicles/heavy_en

Decarbonising road freight in Europe: A socio-economic assessment
9 Cambridge Econometrics
per year from 2030 to 2050. All technology options require a determined and joint effort of the industry, government and civil society to deploy sufficient fueling and charging infrastructure. Timing, location, capability and interoperability are key issues.
• The transition to low-carbon mobility causes a wide range of impacts in employment across several sectors. Employment in the motor vehicles sector in the ZEV scenarios at the start of the projected period is a little higher than in the ‘Business as Usual’ case. But the growing importance of the ZEV value chain involves a shift in the supply chain away from traditional motor vehicle components and towards the producers of the advanced powertrain technologies. Jobs are also created in the provision of charging and refueling infrastructure while the shift away from oil to lower-cost mobility leads to increased employment in services as consumers benefit from lower-cost goods as transportation costs fall.
• The transition poses a significant challenge to maintain the competitiveness and market share of the European auto industry, by remaining at the cutting edge of clean technology innovation.

Decarbonising road freight in Europe: A socio-economic assessment
10 Cambridge Econometrics
1 Introduction
1.1 Background
To meet climate goals of the Paris Agreement the European Commission’s “Strategy on Low Emissions Mobility” envisages a shift away from the use of petroleum towards greener energy sources. Policy is in place to promote this in passenger transportation: the European Parliament and the Council of the European Union set out legislation to limit the emissions of new passenger cars. Until recently, road freight has lagged behind. But now change is on the way; in May 2018, the European Commission put forward a proposal to the European Parliament to introduce a set of emissions standards for HGVs, buses and coaches. The proposal recognizes that all forms of HGVs need to be included, but initially the regulation will be limited to large articulated trucks and then in 2022 extended to other smaller trucks such as delivery vans in cities, as well as buses and coaches. If accepted, there will be a mandatory target for new heavy-duty vehicles to on average emit 15% fewer CO2 emissions in 2025 compared to 2019.
Ahead of these targets major HGVs manufacturers are developing new product lines that are increasingly fuel efficient, and are also starting to release vehicles with alternative powertrains, including electric drivetrains and fuel cells. These announcements signify a push to keep up with potential future emissions standards and help pave the way towards a decarbonised freight sector.
There has been much debate about the potential role for, and impact of, the transition to ZEVs within the freight sector. The purpose of this study is to shed light on the economic impacts and the transitional challenges of decarbonising vans and HGVs for the European automotive industry and the wider economy over the period to 2050. In doing so, it highlights some of the key issues that policy makers should focus on, including;
• What is the scale and pace of investment in infrastructure required? Will infrastructure act as a catalyst for sales of alternative powertrains; if so, sufficient infrastructure needs to be in place before hauliers begin to transition.
• How will government tax revenues be affected due to reduced fuel duty?
• In what areas of the economy should governments offer retraining programs to ensure workers from ‘losing’ sectors can be redeployed?
• What will be the impact on the electricity grid, and peak electricity demand, and how could this be better managed?
1.2 Methodology
For this study, a set of scenarios were defined in each of which it was assumed that a certain low-carbon vehicle technology mix would be introduced and taken up. The particular factors affecting hauliers’ decisions to purchase alternative vehicle technologies were not assessed.
Low-carbon freight transport policy
Motivation for the study

Decarbonising road freight in Europe: A socio-economic assessment
11 Cambridge Econometrics
As shown in the graphic below, the methodology involved distinct stages:
1) Stakeholder consultation to define the scenarios and agree on the key modelling assumptions.
2) An integrated modelling framework that involved (i) application of the CE’s vehicle stock model to assess the impact of alternative low-carbon vehicle sales mix on energy demand and emissions, vehicle prices, technology costs and the total vehicle cost of ownership and (ii) application of the E3ME model to assess the wider socio-economic effects of the low-carbon vehicle transition.
Figure 1.1: Our approach
The two models that were applied in our framework are Cambridge Econometrics’ Vehicle Stock Model and its E3ME model.
The vehicle stock model calculates vehicle fuel demand, vehicle emissions and vehicle prices for a given mix of vehicle technologies. The model uses information about the efficiency of new vehicles and vehicle survival rates to assess how changes in new vehicles sales affect stock characteristics. The model also includes a detailed technology sub-model to calculate how the efficiency and price of new vehicles are affected, with increasing uptake of fuel efficient technologies. The vehicle stock model is highly disaggregated, modelling 16 different technology types across four different classes of commercial vehicles (Vans, LHGV, MHGV, HHGV)9.
Outputs from the vehicle stock model (including fuel demand and vehicle prices) are then used as inputs to E3ME, an integrated macro-econometric model, which has full representation of the linkages between the energy system, environment and the economy at national and global level. The high regional and sectoral disaggregation (including explicit coverage of every EU
9 See Section 3, Table 3.1 for more details.
Vehicle Stock Model
E3ME

Decarbonising road freight in Europe: A socio-economic assessment
12 Cambridge Econometrics
Member State) allows modelling of scenarios specific to Europe and detailed analysis of sectors and trade relationships in key supply chains (for the automotive and petroleum refining industries). E3ME was used to assess how the transition to low carbon vehicles affects household incomes, trade in oil and petroleum, consumption, GDP, employment, CO2, NOx and particulates.
For more information see www.e3me.com. A summary description of the model is also available in Appendix A of this report.
Much of the technical analysis presented in this report focuses on the HHGV segment; however, similar analysis has been carried out for vans, LHGV and MHGV segments. The focus is primarily placed upon HHGVs because these deliver the vast majority of freight tonne kilometres, and as such dominate the cost, economic and environmental impacts of the transition of road freight.
1.3 Structure of the report
The report is structured as follows:
• Section 2 sets out the scenarios that were developed to inform the analysis and are required to answer the questions raised by the Core Working Group.
• The main modelling assumptions and technology cost data are set out in Section 3.
• New infrastructure requirements are a key consideration for the deployment of zero emission vehicles; these are considered in Section 4.
• Above all, a transition requires hauliers to adopt low and zero emission vehicles. In Section 5 we look at the capital and fuel costs facing hauliers in the future.
• The core analysis focuses on the macroeconomic impact of the different scenarios. The net impacts and transitional challenges are set out in Section 6.
• The main motivation for promoting adoption of low emissions freight vehicles is to reduce the harmful impact that road transport has on the environment. The contribution of road freight to CO2 emissions is set out in Section 7.
• The report finishes with our conclusions in Section 8. These are the views of the report’s authors and do not necessarily represent the views of the European Climate Foundation or the members of the Core Working Group, either individually or collectively.
Scope of the analysis and the
report

Decarbonising road freight in Europe: A socio-economic assessment
13 Cambridge Econometrics
2 Overview of scenarios
2.1 Scenario design
The analysis set out in this report is based on a set of scenarios developed by the Core Working Group, each assuming a different new vehicle sales mix. These represent a range of decarbonisation pathways and are designed to assess the impacts of a shift towards low carbon powertrains; they do not necessarily reflect current predictions of the future makeup of the European heavy goods fleet. Uptake of each kind of vehicle is by assumption: implicitly we assume that this change is brought about by policy. The five core scenarios to be modelled for this study are summarised in the table below:
Table 2.1: Description of the five core modelling scenarios
Scenario Scenario description
REF (Reference)
• No change in the deployment of efficiency technology or the sales mix from 2018 onwards
• Some improvements in the fuel-efficiency of the vehicle stock, due to stock turnover
TECH-ICE (Fuel efficient technologies only)
• Ambitious deployment of fuel efficient technologies to improve the efficiency of ICE vehicle over the period to 2050 (e.g. light-weighting)
• No deployment of advanced powertrains
TECH-BEV (High Technology, BEVs dominate)
• Ambitious deployment of fuel-efficient technologies in all new vehicles over the period to 2050 (e.g. light-weighting)
• Deployment of advanced powertrains (predominately BEVs) from 2025
• BEVs dominate the sales mix from 2040 onwards
TECH ERS (High Technology, ERS system dominates)
• Ambitious deployment of fuel-efficient technologies in all new vehicles over the period to 2050 (e.g. light-weighting)
• Deployment of advanced powertrains (predominately PHEV and BEVs reliant on ERS infrastructure) from 2025
• Deployment of advanced powertrains is dominated by PHEV-ERS vehicles until 2040, after which BEV-ERS sales begin to accelerate, reaching 70% of sales by 2050
TECH FCEV (High Technology, Fuel cell vehicles dominate)
• Ambitious deployment of fuel-efficient technologies in all new vehicles over the period to 2050 (e.g. light-weighting)
• Deployment of advanced powertrains (predominately FCEVs) from 2025
• FCEVs slow to deploy into new sales until 2030, but increase rapidly to dominate the sales mix from 2040 onwards
2.2 Vehicle sales and stock
In this section we outline the sales mix by powertrain deployed across each of the scenarios and vehicle size class. We then show the impact of these assumed sales mixes on the resulting stock as calculated by the vehicle stock model.
The reference scenario excludes any further improvements in new vehicle efficiency after the last year of history, 2018. This is the baseline against which
Reference scenario

Decarbonising road freight in Europe: A socio-economic assessment
14 Cambridge Econometrics
all other scenarios are compared. In the absence of any existing EU fuel standards for HGVs, this scenario shows the impact of ‘current policy’.
The scenarios focus on the deployment of advanced powertrains into heavy goods vehicles. For vans and LHGVS (<7.5t) we assume the deployment of advanced powertrains is the same across all TECH scenarios except TECH-ICE, which has no deployment of advanced powertrains. Amongst vans, advanced powertrains are 50% of new sales by 2030, and 100% by 2040, with BEVs emerging as the dominant technology. In terms of impact on the overall stock, over half (60%) of the stock in 2040 is advanced powertrains, with BEVs contributing 34%. By 2050 BEVs make up over half of the total stock (55%).
Figure 2.1: Sales and Stock composition for Vans in the TECH scenarios
Across LHGVs, PHEVs and BEVs account for 30% of new sales in 2030. By 2050 new ICEs are completed phased out, and new sales are split evenly between PHEVs and BEVs. By 2050 there is an even split of advanced powertrains in the stock, with 34% PHEVs and 34% BEVs.
Treatment of MHGVs in the stock model
The sections below explicitly refer to HHGVs only, because it is the most important vehicle segment in terms of mileage and emissions. However, MHGVs follow the exact same deployment of advanced powertrains into sales as HHGVs in each of the below scenarios. Note, however, that they do not follow the same stock composition, as each vehicle segment has different survival rates.
As discussed above, the TECH-ICE scenario has no deployment of advanced powertrains in HHGVs, instead only fuel-efficient technologies are deployed.
Vans and LHGVS
HHGV powertrain deployment in the TECH-ICE scenario
Figure 2.2: Sales and stock composition for LHGVs in the TECH scenarios
Decarbonising road freight in Europe: A socio-economic assessment
15 Cambridge Econometrics
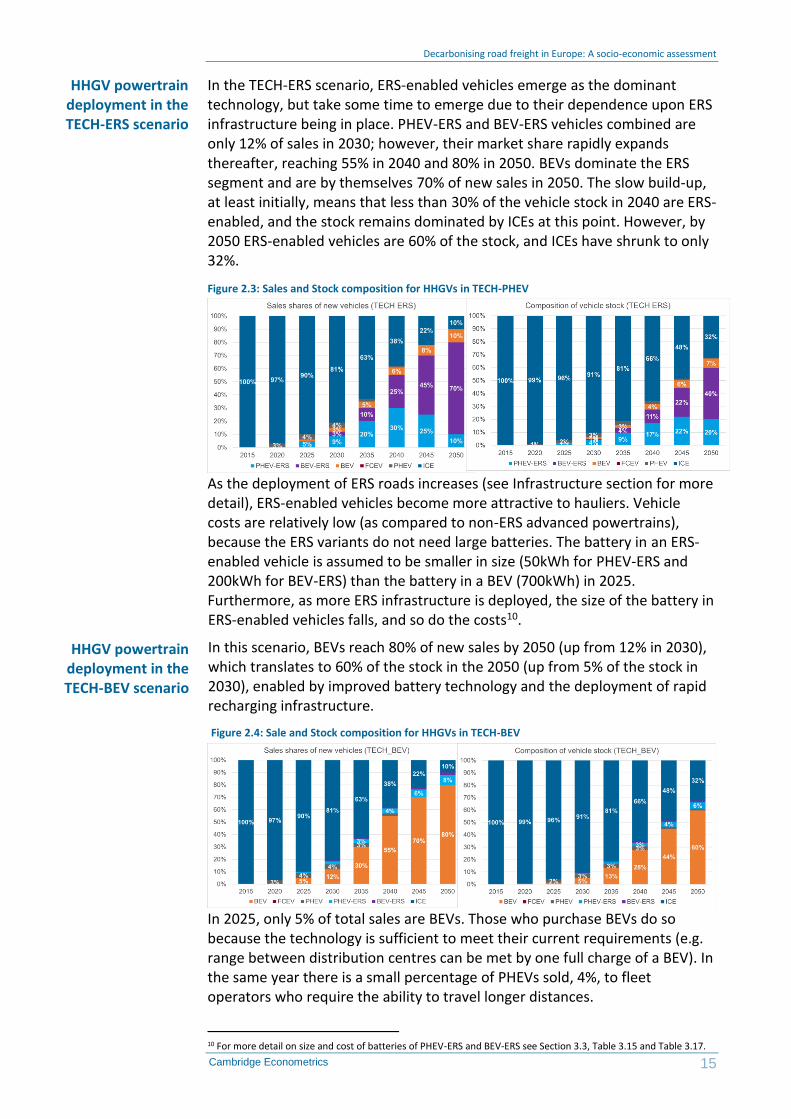
In the TECH-ERS scenario, ERS-enabled vehicles emerge as the dominant technology, but take some time to emerge due to their dependence upon ERS infrastructure being in place. PHEV-ERS and BEV-ERS vehicles combined are only 12% of sales in 2030; however, their market share rapidly expands thereafter, reaching 55% in 2040 and 80% in 2050. BEVs dominate the ERS segment and are by themselves 70% of new sales in 2050. The slow build-up, at least initially, means that less than 30% of the vehicle stock in 2040 are ERS-enabled, and the stock remains dominated by ICEs at this point. However, by 2050 ERS-enabled vehicles are 60% of the stock, and ICEs have shrunk to only 32%.
As the deployment of ERS roads increases (see Infrastructure section for more detail), ERS-enabled vehicles become more attractive to hauliers. Vehicle costs are relatively low (as compared to non-ERS advanced powertrains), because the ERS variants do not need large batteries. The battery in an ERS-enabled vehicle is assumed to be smaller in size (50kWh for PHEV-ERS and 200kWh for BEV-ERS) than the battery in a BEV (700kWh) in 2025. Furthermore, as more ERS infrastructure is deployed, the size of the battery in ERS-enabled vehicles falls, and so do the costs10.
In this scenario, BEVs reach 80% of new sales by 2050 (up from 12% in 2030), which translates to 60% of the stock in the 2050 (up from 5% of the stock in 2030), enabled by improved battery technology and the deployment of rapid recharging infrastructure.
In 2025, only 5% of total sales are BEVs. Those who purchase BEVs do so because the technology is sufficient to meet their current requirements (e.g. range between distribution centres can be met by one full charge of a BEV). In the same year there is a small percentage of PHEVs sold, 4%, to fleet operators who require the ability to travel longer distances.
10 For more detail on size and cost of batteries of PHEV-ERS and BEV-ERS see Section 3.3, Table 3.15 and Table 3.17.
HHGV powertrain deployment in the TECH-ERS scenario
HHGV powertrain deployment in the TECH-BEV scenario
Figure 2.3: Sales and Stock composition for HHGVs in TECH-PHEV
Figure 2.4: Sale and Stock composition for HHGVs in TECH-BEV

Decarbonising road freight in Europe: A socio-economic assessment
16 Cambridge Econometrics
However, as advances in battery technology are made, reducing the costs and increasing the range of BEVs, the sales of PHEVs are replaced by BEVs, and by 2045 PHEVs no longer feature in sales. There is low-level penetration of PHEV-ERS vehicles from 2025, with BEV-ERS entering the market soon after, but neither establish a substantial market share.
In the TECH-FCEV scenario, FCEVs emerge as the dominate powertrain and by 2050 they make up 80% of new sales. Due to the relatively high starting costs for the technology, FCEV deployment does not start in earnest until 2030, when it achieves 12% of sales. Under this scenario, vehicles with batteries (BEVs and PHEVs) fail to establish a market share, and instead FCEVs achieve rapid deployment from 2030 onwards, reaching 27% of the stock in 2040 and 60% in 2050.
2.3 Fuel demand
Figure 2.6 shows the combined effects of efficiency improvements and deployment of advanced powertrains on fuel consumption by the European vehicle stock in the TECH scenarios. By 2030, we see a modest reduction in demand for fuel, with an 8% reduction in fossil fuel demand relative to 2015 in the TECH-ICE scenario and a 20% reduction in demand in the TECH scenarios. By 2050, the demand for fossil fuels in the advanced powertrain scenarios will have fallen by 82% compared to 2015 levels. These reductions are starker when compared to the reference case, where fossil fuel demand increases by 23% over 2015-2050 due to increases in freight demand.
HHGV powertrain deployment in the
TECH-FCEV scenario
Figure 2.5: Sale and Stock composition for HHGVs in TECH-FCEV

Decarbonising road freight in Europe: A socio-economic assessment
17 Cambridge Econometrics
Electricity and hydrogen demand grow in line with the rollout of the stock of the relevant advanced powertrains. By 2050, due to their higher efficiencies, their share of total energy demand is lower than their share of the vehicle stock.
Figure 2.6: Stock fuel consumption of fossil fuels, hydrogen and electricity (Mtoe)

Decarbonising road freight in Europe: A socio-economic assessment
18 Cambridge Econometrics
3 Modelling assumptions
This section sets out the key modelling assumptions underpinning the analysis.
The scenarios are defined by (i) the new sales mix by vehicle powertrain type and (ii) the uptake of fuel efficient technologies. Key assumptions that are common to all scenarios and are briefly outlined in Table 3.1. The subsequent sections provide information about our assumptions for technology costs and deployment, battery costs, fuel cell vehicle and the power sector.
3.1 Common modelling assumptions
Table 3.1: Key assumptions used in stock model
Details of assumptions used
Vehicle sales • Historical sales data for 2005-2016 taken from the ACEA new HGV registration statistics.
• Total new registrations beyond 2016 are calculated to ensure the stock meet freight demand through accounting for both replacement demand and demand from growing freight demand.
Mileage by age cohort
• We assume that average annual mileage falls gradually over the lifetime of a vehicle and varies depending on size and powertrain. From the TRACCS11 database we have derived mileage factors which show the annual mileage of each vehicle. Mileage factors were calibrated to meet the total tonne kilometres travelled (exogenously defined).
Total tonne km travelled
• Total tonne km travelled by road freight are increased in line with the European Commission’s PRIMES 2016 reference scenario. This results in a 48% increase in total tonnes km travelled from 2015-2050.
Vehicle survival rates
• The survival rate was derived from analysis of the age distribution of the total EU HGV stock between 2005-2010 (using stock data from the TRACCS database). Different survival rates are used for each size of HGV.
Fuel prices • Historical data for fuel prices is taken from the European Commission’s Oil Bulletin.
• For the central scenarios, we assume oil prices grow in line with the IEA World Energy Outlook Current Policies Scenario (and a constant percentage mark-up is applied to derive the petrol and diesel fuel price).
• Prices exclude VAT, as this can be recovered by hauliers.
Electricity prices • Electricity prices assume that additional capacity is provided to meet demand from EVs in the same mix as in the PRIMES 2016 Reference Scenario.
• The electricity price for EV users is assumed to be the same as that paid by industrial users.
11 Transport data collection supporting the quantitative analysis of measures relating to transport and climate change, European Commission, 2013.

Decarbonising road freight in Europe: A socio-economic assessment
19 Cambridge Econometrics
Rest of world • The rest of the world assumptions on low carbon transport policy affect the global oil price and are tested through sensitivity analysis.
Value chains • In all scenarios, we assume that Member States capture a consistent share of the vehicle value chain for conventional ICEs. For the ZEV deployment scenarios, we assume that, for EVs, battery modules and battery packs are assembled in the EU but that the battery cells are manufactured in Asia, in line with current practice.
Trade in motor vehicles
• We assume the same volume of vehicle imports and exports in each scenario. The price of vehicle imports and vehicle exports changes in line with the change in domestic vehicle prices (reflecting that transport policy is assumed to be consistent across the EU).
Vehicle depreciation
• We assume an annual depreciation rate of 20%.
3.2 ICE efficiency gains
Fuel-efficient technologies for HGV segments were collected from four different sources:
• Ricardo-AEA 2011, Reduction and Testing of Greenhouse Gas (GHG) Emissions from Heavy Duty Vehicles – Lot 1: Strategy
• TIAX 2012, European Union Greenhouse Gas Reduction Potential for Heavy-Duty Vehicles
• Ricardo-AEA 2012, A review of the efficiency and cost assumptions for road transport vehicles to 2050 for UK CCC
• Ricardo-AEA 2017, Heavy Duty Vehicles Technology Potential and Cost Study for ICCT Technology
Where there was overlap in technologies, data from the latest Ricardo-AEA (2017) took precedence.

Decarbonising road freight in Europe: A socio-economic assessment
20 Cambridge Econometrics
Technology costs and energy savings
Three aerodynamic technologies from R-AEA (2017) have been included in the technology list for HGVs (see Table 3.2). These technologies include several aerodynamic technologies, for example, aerodynamic bodies/trailers and box skirts, which when deployed together give the percentage reduction in aerodynamic drag. However, the report by R-AEA (2017) is not explicit in terms of which specific aspects are included; aerodynamic technologies from older studies have therefore been removed to avoid double counting.
Table 3.2: Aerodynamic technologies
Energy saving Cost (€, 2015)
LHGV MHGV HHGV LHGV MHGV HHGV
10% reduction in aerodynamic drag 0.6% - - 250 - -
15% reduction in aerodynamic drag - 6.3% - - 375 -
25% reduction in aerodynamic drag - - 10.6% - - 2000
Light-weighting technologies were taken from R-AEA (2017), most of this saving (R-AEA, 2017) occurs due to material substitution. Thus, material substitution (TIAX, 2012) has been removed. Note that the light-weighting technologies (light-weighting 1, 2 and 3) are additive, rather mutually exclusive.
Table 3.3: Light-weighting technologies
Energy saving Cost (€, 2015)
LHGV MHGV HHGV LHGV MHGV HHGV
Light-weighting 1 0.5% 0.2% 0.3% 0 0 0
Light-weighting 2 0.03% - 0.1% 1 - 53
Light-weighting 3 0.7% 0.7% 0.3% 91 300 300
Energy saving and costs for Low rolling resistance tires are from R-AEA (2017) whereas data on single-wide tires is from R-AEA (2012). Automatic tire pressure adjustment is an uncertain technology, the payback period is unknown and the impact on Total Cost of Ownership (TCO) is negative, according to our calculation. Tire Pressure Monitoring System (TPMS) supersedes it, since TPMS is far cheaper with only a small sacrifice in energy saving reduction.
Table 3.4: Tire and wheel technologies
Energy saving Cost (€, 2015)
LHGV MHGV HHGV LHGV MHGV HHGV
Low rolling resistance tires 2.5% 4.8% 5.1% 644 1820 5880
Single wide tires 4.0% 4.0% 5.0% 866 866 1364
Automatic tire pressure adjustment
1.0% 1.0% 2.0% 10111 10111 14633
Tire Pressure Monitoring System (TPMS)
0.4% 0.4% 0.4% 250 250 475
Aerodynamic technologies
Light-weighting technologies
Tire and wheel technologies

Decarbonising road freight in Europe: A socio-economic assessment
21 Cambridge Econometrics
Transmission friction reduction (TIAX, 2012) and improved controls with aggressive shift logic and early lockup (TIAX, 2012) can be deployed alongside automated manual.
Table 3.5: Transmission and driveline technologies
Energy saving Cost (€, 2015)
LHGV MHGV HHGV LHGV MHGV HHGV
Transmission friction reduction 0.5% 1.3% 1.3% 204 204 204
Improved controls, with aggressive shift logic and early lockup
2.0% - - 49 - -
Automated manual 7.0% 5.0% 1.7% 2300 2300 1500
Improved diesel engine (TIAX, 2012) has been removed from our technology list as it overlaps with nearly all the other technologies included in this category. In fact, the sum of all the other engine efficiency technologies (16%) is roughly the same energy saving percentage as the improved diesel engine. Mechanical and electrical turbocompound are mutually exclusive.
Table 3.6: Engine efficiency technologies
Energy saving Cost (€, 2015)
LHGV MHGV HHGV LHGV MHGV HHGV
Controllable air compressor - - 1.0% - - 199
Mechanical turbocompound 0.7% 0.7% 2.0% 2393 2393 1800
Electrical turbocompound 1.0% 1.0% 2.0% 6002 6002 1800
Turbocharging 1.9% 2.0% 2.5% 1050 1050 1050
Heat recovery 1.5% 1.5% 4.5% 9922 9922 5000
Unspecified FMEP improvements 3.7% 2.3% 1.4% 0 0 0
Variable oil pump 2.0% 1.5% 1.0% 90 90 90
Variable coolant pump 1.2% 0.8% 0.5% 90 90 90
Bypass oil cooler 0.8% 0.5% 0.2% 25 25 25
Low viscosity oil 2.0% 2.0% 1.0% 410 1550 0
Engine encapsulation 1.5% - - 25 - -
Enhanced stop/start (R-AEA, 2017) is deployed only in LHGVs and MHGVs as long-haul driving is more continuous. For long haul the dual model hybrid electric system is deployed as an alternative.
Table 3.7: Hybridisation technologies
Energy saving Cost (€, 2015)
LHGV MHGV HHGV LHGV MHGV HHGV
Dual-mode hybrid electric 25.0% 30.0% 6.5% 23694 18997 8535
Enhanced stop/start system 4.5% 4.5% - 1160 1160 -
Vehicle improvements using driver aids from the TIAX (2012) only came with fuel saving - no costs were included. The cost was estimated by summing similar technologies, route management and training and feedback from R-AEA (2012).
Transmission and driveline
technologies
Engine efficiency technologies
Hybridisation technologies
Management technologies
Decarbonising road freight in Europe: A socio-economic assessment
22 Cambridge Econometrics
Table 3.8: Management technologies
Energy saving Cost (€, 2015)
LHGV MHGV HHGV LHGV MHGV HHGV
Predictive cruise control - - 2.0% - - 640
Smart Alternator, Battery Sensor & AGM Battery
1.5% 1.5% 1.5% 548 548 986
Vehicle improvements using driver aids
- - 10.0% - - 1144
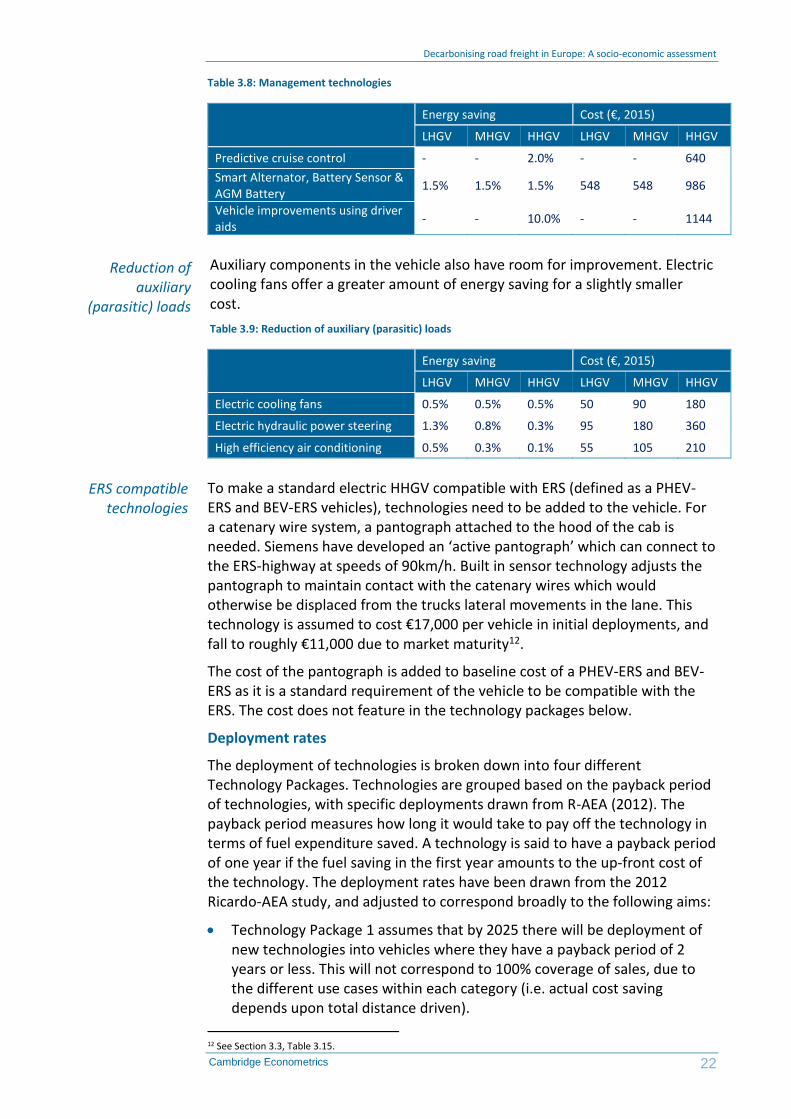
Auxiliary components in the vehicle also have room for improvement. Electric cooling fans offer a greater amount of energy saving for a slightly smaller cost.
Table 3.9: Reduction of auxiliary (parasitic) loads
Energy saving Cost (€, 2015)
LHGV MHGV HHGV LHGV MHGV HHGV
Electric cooling fans 0.5% 0.5% 0.5% 50 90 180
Electric hydraulic power steering 1.3% 0.8% 0.3% 95 180 360
High efficiency air conditioning 0.5% 0.3% 0.1% 55 105 210
To make a standard electric HHGV compatible with ERS (defined as a PHEV-ERS and BEV-ERS vehicles), technologies need to be added to the vehicle. For a catenary wire system, a pantograph attached to the hood of the cab is needed. Siemens have developed an ‘active pantograph’ which can connect to the ERS-highway at speeds of 90km/h. Built in sensor technology adjusts the pantograph to maintain contact with the catenary wires which would otherwise be displaced from the trucks lateral movements in the lane. This technology is assumed to cost €17,000 per vehicle in initial deployments, and fall to roughly €11,000 due to market maturity12.
The cost of the pantograph is added to baseline cost of a PHEV-ERS and BEV-ERS as it is a standard requirement of the vehicle to be compatible with the ERS. The cost does not feature in the technology packages below.
Deployment rates
The deployment of technologies is broken down into four different Technology Packages. Technologies are grouped based on the payback period of technologies, with specific deployments drawn from R-AEA (2012). The payback period measures how long it would take to pay off the technology in terms of fuel expenditure saved. A technology is said to have a payback period of one year if the fuel saving in the first year amounts to the up-front cost of the technology. The deployment rates have been drawn from the 2012 Ricardo-AEA study, and adjusted to correspond broadly to the following aims:
• Technology Package 1 assumes that by 2025 there will be deployment of new technologies into vehicles where they have a payback period of 2 years or less. This will not correspond to 100% coverage of sales, due to the different use cases within each category (i.e. actual cost saving depends upon total distance driven).
12 See Section 3.3, Table 3.15.
Reduction of auxiliary
(parasitic) loads
ERS compatible technologies

Decarbonising road freight in Europe: A socio-economic assessment
23 Cambridge Econometrics
• Technology Package 2 assumes that over 2025-33 there will be deployment in new vehicles of technologies in use cases where they have a payback period of 3.5 years or less.
• Technology Package 3 assumes deployment in new vehicles over 2033-42 of technologies in cases where they have a payback period of 5 years or less.
• Technology Package 4 assumes that by 2050 there will be full deployment in new vehicles of all technologies where they have a positive impact on the TCO.
For technologies with no available payback period, deployment rates in previous studies were used instead.
Table 3.10: Deployment rates of technologies for LHGVs
Technology Technology Packages, LHGVs
1 (2025) 2 (2033) 3 (2042) 4 (2050)
10% reduction in aerodynamic drag 0% 0% 50% 100%
Light-weighting 2 100% 100% 100% 100%
Light-weighting 3 30% 60% 100% 100%
Light-weighting 4 15% 30% 60% 100%
Low rolling resistance tires 50% 75% 50% 0%
Single wide tires 0% 25% 50% 100%
Tire Pressure Monitoring System (TPMS) 0% 0% 30% 100%
Transmission friction reduction 0% 100% 100% 100%
Improved controls, with aggressive shift logic and early lockup
0% 100% 100% 100%
Mechanical turbocompound 0% 10% 30% 40%
Electrical turbocompound 0% 1% 15% 30%
Turbocharging 0% 0% 30% 100%
Heat recovery 0% 0% 5% 20%
Unspecified FMEP improvements 100% 100% 100% 100%
Variable oil pump 100% 100% 100% 100%
Variable coolant pump 100% 100% 100% 100%
Bypass oil cooler 100% 100% 100% 100%
Low viscosity oil 100% 100% 100% 100%
Engine encapsulation 100% 100% 100% 100%
Enhanced stop/start system 35% 25% 15% 0%
Full hybrid 20% 30% 50% 100%
Smart Alternator, Battery Sensor & AGM Battery
20% 60% 100% 100%
Electric cooling fans 50% 100% 100% 100%
Electric hydraulic power steering 100% 100% 100% 100%
High efficiency air conditioning 20% 100% 100% 100%
Low rolling resistance tires and single wide tires cannot both be deployed on the same vehicle – the total deployment of these two technologies cannot exceed 100%. Low rolling resistance tires feature in 50% of all sales in Technology package 1 because the costs and energy saving are both lower. Purchasers invest a small amount (€644) and are compensated by small energy savings (2.5%). The deployment increases to 75% by 2033, with the

Decarbonising road freight in Europe: A socio-economic assessment
24 Cambridge Econometrics
remaining use cases including single wide tires, across 25% of new sales. By 2050 single wide tires make up all tire sales because of the large energy saving potential.
The same is true of enhanced stop/start systems and full hybrid technologies. Both cannot feature on a single vehicle. The cost of enhanced stop/start is smaller, so it is implemented in a few business cases, covering 35% of new sales. Full hybrid technology is more expensive but in the long-run the energy savings are much higher (so it suits use cases which cover a larger mileage). It only makes economic sense for 20% of sales in Technology package 1. By 2033, full hybrids begin to dominate as the potential TCO saving covers more use cases, at the expense of enhanced stop/start. Moreover, the implementation of a stop/start system is complex, requiring high torque and durability requirements which may mean it is more likely hauliers invest in a full hybrid system instead (R-AEA, 2017).
Table 3.11: Deployment rate of technologies for MHGVs
Technology Technology Packages, MHGVs
1 (2025) 2 (2033) 3 (2042) 4 (2050)
15% reduction in aerodynamic drag 100% 100% 100% 100%
Lightweighting 1 100% 100% 100% 100%
Lightweighting 3 20% 50% 100% 100%
Lightweighting 4 0% 50% 100% 100%
Low rolling resistance tires 100% 100% 100% 100%
Tire Pressure Monitoring System (TPMS) 0% 50% 100% 100%
Transmission friction reduction 0% 0% 100% 100%
Mechanical turbocompound 0% 10% 30% 40%
Electrical turbocompound 0% 1% 15% 30%
Turbocharging 0% 0% 0% 100%
Heat recovery 0% 0% 5% 20%
Unspecified FMEP improvements 100% 100% 100% 100%
Variable oil pump 100% 100% 100% 100%
Variable coolant pump 100% 100% 100% 100%
Bypass oil cooler 100% 100% 100% 100%
Low viscosity oil 100% 100% 100% 100%
Enhanced stop/start system 100% 75% 50% 0%
Full hybrid 0% 25% 50% 100%
Smart Alternator, Battery Sensor & AGM Battery 20% 60% 100% 100%
Electric cooling fans 100% 100% 100% 100%
Electric hydraulic power steering 100% 100% 100% 100%
High efficiency air conditioning 20% 60% 100% 100%
Table 3.12: Deployment rate of technologies for HHGVs
Technology Technology Packages, HHGVs
1 (2025) 2 (2033) 3 (2042) 4 (2050)
25% reduction in aerodynamic drag 50% 100% 100% 100%
Lightweighting 1 50% 100% 100% 100%

Decarbonising road freight in Europe: A socio-economic assessment
25 Cambridge Econometrics
Lightweighting 2 50% 100% 100% 100%
Lightweighting 3 50% 100% 100% 100%
Lightweighting 4 15% 30% 60% 100%
Single wide tires 50% 75% 100% 100%
Tire Pressure Monitoring System (TPMS) 50% 100% 100% 100%
Transmission friction reduction 100% 100% 100% 100%
Controllable air compressor 20% 50% 100% 100%
Mechanical turbocompound 50% 100% 100% 100%
Turbocharging 50% 100% 100% 100%
Heat recovery 0% 100% 100% 100%
Unspecified FMEP improvements 50% 100% 100% 100%
Variable oil pump 50% 100% 100% 100%
Variable coolant pump 50% 100% 100% 100%
Bypass oil cooler 50% 100% 100% 100%
Low viscosity oil 50% 100% 100% 100%
Dual-mode hybrid electric 0% 30% 50% 100%
Predictive cruise control 100% 100% 100% 100%
Smart Alternator, Battery Sensor & AGM Battery 45% 50% 70% 100%
Vehicle improvements using driver aids 50% 75% 100% 100%
Electric cooling fans 100% 100% 100% 100%
Electric hydraulic power steering 25% 75% 100% 100%

Decarbonising road freight in Europe: A socio-economic assessment
26 Cambridge Econometrics
Total impact of technology packages
Table 3.13 shows the total energy saving and cost of each technology package to be deployed in ICE HGVs. The technology packages vary by powertrain because not all technologies are applicable to all advanced powertrains. For example, there will be no deployment of heat recovery in BEVs or FCEVs as there is no internal combustion engine to recover heat from. The implication is that the total energy saving and costs for each technology package decrease as you move through powertrains from ICE to PHEV/PHEV-ERS and PHEV/PHEV-ERS to BEV/FCEV.
Table 3.13: Technology Packages for ICEs
LHGV Energy saving
Cost Incremental energy saving
Incremental Cost
Technology package 1 19.9% €4,254 19.9% €4,254
Technology package 2 26.3% €6,700 6.4% €2,446
Technology package 3 32.4% €11,858 6.1% €5,158
Technology package 4 45.0% €22,108 12.5% €10,250
MHGV Energy saving
Cost Incremental energy saving
Incremental Cost
Technology package 1 22.3% €5,571 22.3% €5,571
Technology package 2 26.4% €9,454 4.1% €3,883
Technology package 3 31.6% €15,117 5.2% €5,663
Technology package 4 39.3% €24,714 7.7% €9,598
HHGV Energy saving
Cost Incremental energy saving
Incremental Cost
Technology package 1 20.4% €5,992 20.4% €5,992
Technology package 2 35.9% €17,572 15.6% €11,580
Technology package 3 39.8% €20,082 3.9% €2,510
Technology package 4 42.2% €24,746 2.3% €4,663
A pattern seen across all powertrains in the HGV segment is the potential energy savings in Technology package 1, which are considerably lower in the other packages.
3.3 Vehicle costs
The cost of a baseline ICE HHGV was taken from a report was taken from CE Delft (2013)13, and re-based to 2015. The cost of a tractor was calculated to be €85,201, and €15,243 for a trailer.
All costs stated below are the production cost and exclude taxes and margins. All costs are expressed in 2015 Euros. Note the cost engine, tractor and trailer in the tables below exclude the cost of fuel efficient technologies.
The cost estimate for the advanced powertrain HHGVs was calculated by subtracting the cost of the engine from the baseline ICE HHGV, and then adding the cost of the advanced powertrain and other additional components.
13 Zero emissions trucks: An overview of state-of-the-art technologies and their potential, CE Delft (2013) ,Accessed here on 11/12/2017
Baseline vehicle
Advanced powertrain costs

Decarbonising road freight in Europe: A socio-economic assessment
27 Cambridge Econometrics
Hybrid vehicles add the cost of the additional powertrain and components to the base ICE cost.
The tables below breakdown the size, marginal cost and total cost of each component for each advanced powertrain.
The cost of the ICE in the baseline vehicle is approximately €37,000. This was calculated from the cost of the engine per kW (106 €/kW)14 multiplied by the assumed engine sized (350 kW) from the archetype HHGV from R-AEA (2017).
The additional required battery electric systems are the electric systems (power electronics, battery management systems, etc.) necessary to control the power transfer (ICCT, 2017). They are scaled with the size of the electric motor.
Table 3.14: Size and cost breakdown of PHEV
2025 2030 2040 2050
Engine size (kW) 322 322 322 322
Engine marginal cost (€/kW) 106 106 106 106
Cost of engine (€) 37224 37224 37224 37224
Battery pack (kWh) 165 165 165 165
Battery marginal cost (€/kWh) 113 90 82 70
Cost of battery pack (€) 18563 14850 13530 11550
Electric motor (kW) 350 350 350 350
Electric motor marginal cost (€/kW) 16 14 14 14
Additional system requirements (€/kW) 41 37 37 37
Cost of electric motor (€) 5477 4861 4861 4861
Cost of additional electric system requirements (€)
14511 12934 12934 12934
Cost of tractor (excl. ICE) (€) 47977 47977 47977 47977
Cost of trailer (€) 15243 15243 15243 15243
Total cost of PHEV (€) 138995 133089 131769 129789
The marginal cost estimates for a battery pack are from the OEM announcement scenario of Element Energy’s (EE) work on Fuelling Europe’s Future (2018). The marginal cost of the electric motor and additional system requirements were taken from ICCT (2017)15. This report only considers the costs to 2030; these costs are then assumed to hold constant out to 2050.
14 Transitioning to Zero-Emission Heavy-Duty Freight Vehicles, ICCT (2017). Accessed here on 5/12/2017 15 Transitioning to Zero-Emission Heavy-Duty Freight Vehicles, ICCT (2017). Accessed here on 5/12/2017
Plug-in hybrid (PHEV)
Battery costs

Decarbonising road freight in Europe: A socio-economic assessment
28 Cambridge Econometrics
Figure 3.1: Battery cost per kWh estimates from E
In terms of components, there are two main differences between PHEV and the PHEV-ERS vehicles. First, the battery is smaller in a PHEV-ERS. Second, a PHEV-ERS includes an active pantograph, which enables compatibility with ERS.
Table 3.15: Size and cost breakdown of PHEV-ERS
2025 2030 2040 2050 Engine size (kW) 350 350 350 350 Engine marginal cost (€/kW) 106 106 106 106
Cost of engine (€) 37224 37224 37224 37224
Battery pack (kWh) 50 50 50 50 Battery marginal cost (€/kWh) 113 90 82 70
Cost of battery pack (€) 5625 4500 4100 3500
Electric motor (kW) 350 350 350 350 Electric motor marginal cost (€/kW) 16 14 14 14 Additional system requirements (€/kW) 41 37 37 37
Cost of electric motor (€) 5477 4861 4861 4861
Cost of additional system requirements (€)
14511 12934 12934 12934
Cost of active pantograph (€) 17670 10591 10591 10591
Cost of tractor (excl. ICE) (€) 47977 47977 47977 47977
Cost of trailer (€) 15243 15243 15243 15243
Total cost of PHEV-ERS 143727 133330 132930 132330
The marginal battery pack cost is calculated based on Element Energy’s cost projections. The electric motor and additional system requirements costs are from ICCT (2017). The cost of the active pantograph was supplied by Siemens.
We assume an average battery size in a BEV of 700 kWh, based upon an efficient vehicle consuming 1 kWh per km (1.6 kWh per mile, in line with the lower end of efficiencies announced by Tesla (1.5 – 2 kWh per mile), and assuming an 80% usable state of charge, a range of 580 km (in the middle of Tesla’s stated ranges of 300 and 500 miles).
PHEV-ERS
BEV

Decarbonising road freight in Europe: A socio-economic assessment
29 Cambridge Econometrics
Table 3.16: Size and cost breakdown of BEV
2025 2030 2040 2050
Battery pack (kWh) 700 700 700 700
Battery marginal cost (€/kWh) 113 90 82 70
Cost of battery pack (€) 78750 63000 57400 49000
Electric motor (kW) 350 350 350 350
Electric motor marginal cost (€/kW) 16 14 14 14 Additional electric system requirements (€/kW)
41 37 37 37
Cost of electric motor (€) 5477 4861 4861 4861
Cost of additional system requirements (€) 14511 12934 12934 12934
Cost of tractor (excl. ICE) (€) 47977 47977 47977 47977
Cost of trailer (€) 15243 15243 15243 15243
Total cost of BEV 161958 144015 138415 130015
The source for the marginal battery costs, electric motor and additional system requirements is the same as the costs used for PHEV-ERS and PHEV (the ICCT and EE’s OEM announcement scenario).
Table 3.17 shows a detailed breakdown of the costs of a BEV-ERS. The difference in cost between a BEV-ERS and PHEV-ERS is the cost of the internal combustion engine.
Table 3.17: Size and cost breakdown of BEV-ERS
2025 2030 2040 2050
Battery pack (kWh) 200 200 200 200
Battery marginal cost (€/kWh) 113 90 82 70
Cost of battery pack (€) 22500 18000 16400 14000
Electric motor (kW) 350 350 350 350
Electric motor marginal cost (€/kW) 16 14 14 14
Additional system requirements (€/kW) 41 37 37 37
Cost of electric motor (€) 5477 4861 4861 4861
Cost of additional system requirements (€) 14511 12934 12934 12934
Cost of active pantograph (€) 17670 10591 10591 10591
Cost of tractor (excl. ICE) ($) 47977 47977 47977 47977
Cost of trailer (€) 15243 15243 15243 15243
Total cost of BEV-ERS 123378 109606 108006 105606
Table 3.18 shows the breakdown of components required in a FCEV. The size of the individual components and the costs were taken from ICCT (2017). The ICCT report assumes that the per kW cost of HHGV FCEV components is the same as for passenger cars; this is supported by the announcement from Toyota that their new fuel cell drayage will contain two Mirai fuel cell stacks (as used in the Mirai passenger car), suggesting that such scaling of costs is a reasonable assumption.
The size of the compressed H2 tank (63kg) is determined by the mid-point of the estimated range of the Nikola One Semi Truck16, the energy efficiency of a FCEV in 2025; 6 MJ/km, and an energy density of 120 MJ/kg.
16 Nikola One Semi Truck. Accessed here on 15/01/2018
BEV-ERS
FCEV

Decarbonising road freight in Europe: A socio-economic assessment
30 Cambridge Econometrics
Table 3.18: Size and cost breakdown of FCEV
2025 2030 2040 2050 Battery pack (kWh) 12 12 12 12 Battery marginal cost (€/kWh) 113 90 82 70
Cost of battery pack (€) 1350 1080 984 840
Electric motor (kW) 350 350 350 350 Electric motor marginal cost (€/kW) 16 14 14 14 Additional electric system requirements (€/kW)
41 37 37 37
Cost of electric motor (€) 5477 4861 4861 4861
Cost of additional electric system requirements (€)
14511 12934 12934 12934
Fuel cell (kW) 350 350 350 350 Fuel cell marginal cost (€/kW) 80 53 42 33 Additional fuel cell system requirements (€/kW)
28 25 25 25
Cost of fuel cell (€) 28076 18612 14709 11407
Cost of additional system requirements (€) 9779 8833 8833 8833
Compressed H2 tank capacity (kg) 63 62 61 61
H2 tank marginal cost (€/kg) 630 570 507 475
Cost of compressed H2 tank (€) 39974 35603 31162 29181
Cost of tractor (excl. ICE) (€) 47977 47977 47977 47977
Cost of trailer (€) 15243 15243 15243 15243
Total cost of FCEV 162387 145142 136703 131276
3.4 Fuel costs
The price of petrol faced by hauliers in the EU excludes VAT (because this is reclaimed) but includes fuel duty. Future petrol prices are projected to be consistent with the oil price forecast in the IEA Current Policies Scenario (2016).
The price of diesel faced by hauliers in the EU does not include VAT and in eight of member states they can reclaim fuel duty. The impact of fuel duty on the EU average price is calculated by Transport and Environment17 to be €0.04/L. The diesel prices are adjusted to reflect this. Future diesel prices are projected to be consistent with the oil price forecast by the IEA in their Current Policies Scenario (2016).
The historical data for electric prices (excluding VAT and other recoverable taxies/levies) for non-households from Eurostat18 is used in the model. The price varies by consumption type; for this modelling the consumption Band IE: 20 000 MWh < Consumption < 70 000 MWh is used.
Table 3.19: Real electricity prices for non-households form Eurostat (Band IE)
2010 2011 2012 2013 2014 2015
Total (€/MWh, real 2015) 78 85 91 92 92 93
17 Transport and Environment. Europe’s tax deals for diesel. Accessed here on 11/01/2018 18 Data series: nrg_pc_205
Petrol
Diesel
Electricity

Decarbonising road freight in Europe: A socio-economic assessment
31 Cambridge Econometrics
Projected electricity prices are based on the growth rate of electricity prices for final demand sectors from PRIMES reference scenario (2016)19 (see Figure 5.2).
Our assumptions for hydrogen production costs are based on work done by Element Energy in Fuelling Europe’s Future (2018). The following text is drawn from the technical report for that study.
Hydrogen production for the transport sector is expected to be dominated by water electrolysers, steam methane reforming (SMR) and by-product from industrial processes (for example chloralkali plants). These sources form the basis of the production mix in this study. Other potential sources include waste or biomass gasification, or SMR with carbon capture and storage. These additional routes could potentially provide low cost, low carbon hydrogen, but are not yet technically or economically proven and have not been included in the cost assumptions below.
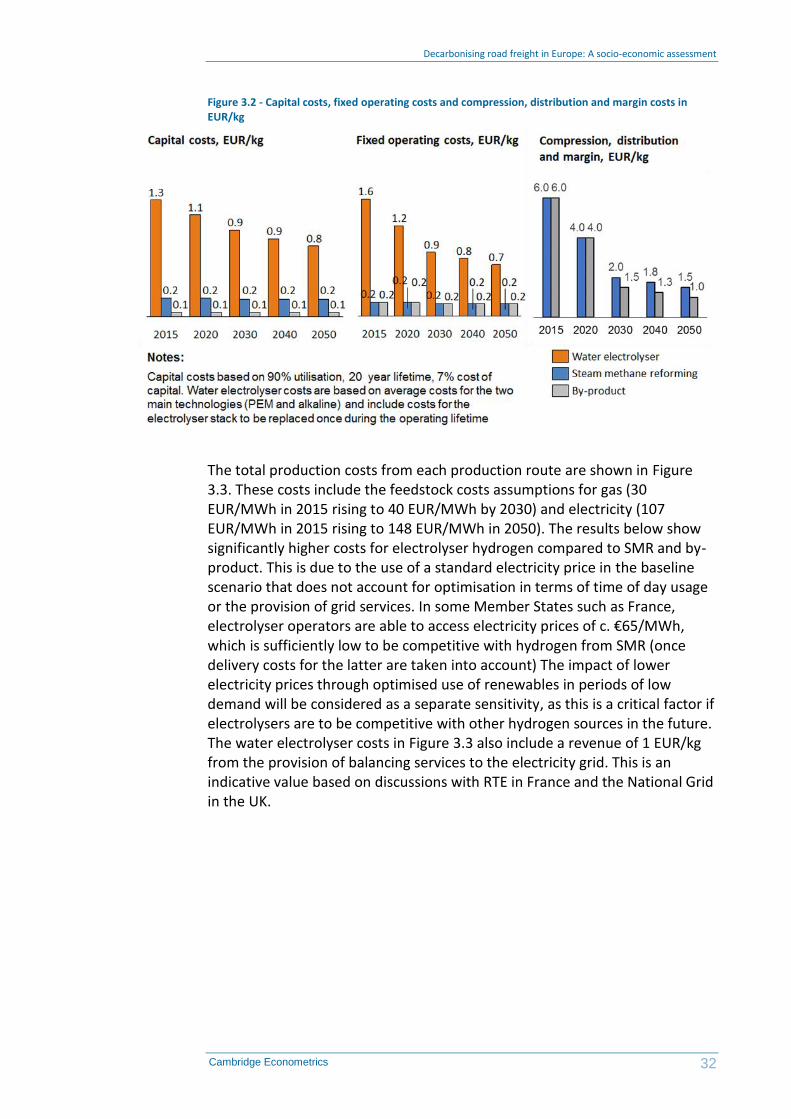
Hydrogen production cost data was sourced from the UK Technology Innovation Needs Assessment, and Element Energy and E4Tech’s Development of Water Electrolysis in the European Union study. The capital and fixed operating costs per kg of hydrogen produced are shown in Figure 3.2. SMR and by-product technologies are already mature, and so future cost reductions are assumed to be zero for this study. Current electrolyser costs are relatively high, driven by low manufacturing volumes and relative immaturity at the scale expected for hydrogen production (e.g. 500kg-5t/day). Compression, distribution and margin costs for SMR and by-product are specific to each supplier, the number of stations served and the geographical distribution of refuelling stations. Values for compression costs, distribution and margin are consistent with observed prices in funded demonstration projects (which also show significantly higher and lower costs) and were agreed by industry participants for the French en Route Pour un Transport Durable study.
19 European commission 2016: EU Reference Scenario, 2016 Energy, transport and GHG emissions Trends to 2050. Accessed here 30/08/2016
Hydrogen
Hydrogen production costs
Decarbonising road freight in Europe: A socio-economic assessment
32 Cambridge Econometrics
Figure 3.2 - Capital costs, fixed operating costs and compression, distribution and margin costs in EUR/kg
The total production costs from each production route are shown in Figure 3.3. These costs include the feedstock costs assumptions for gas (30 EUR/MWh in 2015 rising to 40 EUR/MWh by 2030) and electricity (107 EUR/MWh in 2015 rising to 148 EUR/MWh in 2050). The results below show significantly higher costs for electrolyser hydrogen compared to SMR and by-product. This is due to the use of a standard electricity price in the baseline scenario that does not account for optimisation in terms of time of day usage or the provision of grid services. In some Member States such as France, electrolyser operators are able to access electricity prices of c. €65/MWh, which is sufficiently low to be competitive with hydrogen from SMR (once delivery costs for the latter are taken into account) The impact of lower electricity prices through optimised use of renewables in periods of low demand will be considered as a separate sensitivity, as this is a critical factor if electrolysers are to be competitive with other hydrogen sources in the future. The water electrolyser costs in Figure 3.3 also include a revenue of 1 EUR/kg from the provision of balancing services to the electricity grid. This is an indicative value based on discussions with RTE in France and the National Grid in the UK.

Decarbonising road freight in Europe: A socio-economic assessment
33 Cambridge Econometrics
Figure 3.3 - Total costs of hydrogen production, €/kg
The hydrogen production mix in any given hydrogen market will be influenced by relative costs of each production source, customer demand (in terms of the carbon footprint of the hydrogen) and policies such as incentives for green hydrogen. The production mix already varies significantly between leading hydrogen markets in Europe. For example, most, if not all, of the first 100 stations deployed by H2 Mobility Germany will use hydrogen from steam methane reforming or industrial by-product hydrogen delivered by truck. In contrast, most of the recent stations deployed in the UK under the EU-Financed HyFIVE and H2ME projects are supplied by on-site water electrolysers. This is due in part to electrolysis specialists making significant investments in the UK (as they are in Scandinavia), but also due to the relative ease of guaranteeing hydrogen purity from electrolysers compared with SMR routes. The production mix used to calculate the CO2 footprint of hydrogen is shown in Figure 3.4, and shows a slight dominance of SMR-derived hydrogen in 2015, with equal quantities of electrolyser and SMR hydrogen beyond 2020. It should be noted that if the electrolyser market develops quickly, both in terms of technology cost reductions and the ability to provide grid services and take advantage of otherwise-curtailed renewable energy, green hydrogen could become the dominant production method during the 2020s. Grid services can potentially provide up to an additional €80 000 per MW capacity per year and could prove to be a significant incentive to developing the electrolyser market. The production mix shown below in 2020 would deliver an approximately 50% well-to-wheel CO2 saving relative to an equivalent diesel car (assuming the electricity supplied to the water electrolysers is green).
Hydrogen production mix

Decarbonising road freight in Europe: A socio-economic assessment
34 Cambridge Econometrics
Figure 3.4 - Hydrogen production mix scenarios

Decarbonising road freight in Europe: A socio-economic assessment
35 Cambridge Econometrics
4 Infrastructure requirements
This section describes the definition, costs and rate of deployment of
• electric road systems
• electric charging posts
• hydrogen refuelling stations
It also provides a breakdown of our calculation for total infrastructure requirements.
The main source of electricity for ERS-enabled vehicles will be via an electric road system (ERS). There will also be a roll out of slow depot chargers (22kW) for each vehicle, to facilitate overnight charging of vehicles. As the deployment of ERS increases the time spent in electric mode will increase, reflecting an increased use of the ERS infrastructure. To incentivise the take up of ERS vehicles the ERS infrastructure deployment has been front-loaded.
The main infrastructure to serve BEVs will be rapid chargers on highways, with an output of 700 kW. Alongside these there will also be BEV depot chargers (90kW) for slow charging overnight.
The main infrastructure required to serve FCEVs will be hydrogen refuelling stations (HRS). For this technology to take off, sufficient front loading is needed to incentivise hauliers to invest in FCEV HGVs. After an initial spike in deployment the roll out of hydrogen refuelling is determined by a refuelling density assumption.
4.1 Electric Road Systems
The central cost assumptions for installation and operation and maintenance of ERS in the HGV stock model is Umwelt Bundesamt (2016)20. There are two installation costs: the first, ‘Installation cost in 2020 (€m/km)’ represents the cost in the earlier stages of deployment, and the second ‘Installation cost in 2050 (€m/km)’ is the cost estimate of a mature deployment, after learning has taken place. Linear interpolation is used to derive the cost in each year between 2020 and 2050.
Table 4.1: Cost assumption for ERS
Figure 4.1: Cumulative ERS infrastructure costs in TECH ERS scenarioFigure 4.1 below shows the cumulative cost of installation and O&M cost from 2020 and 2050. By 2050 the total amount of investment (including O&M) reaches €45 billion.
20 Umwelt Bundesamt (2016)Erarbeitung einer fachlichen Strategie zur Energieversorgung des Verkehrs bis zum Jahr 2050)20, accessed here.
Costs
Installation cost in 2020 (€m/km)
Installation cost in 2050 (€m/km)
O&M cost (€m/km)
Central assumption 2.43 2.02 0.05

Decarbonising road freight in Europe: A socio-economic assessment
36 Cambridge Econometrics
Figure 4.1: Cumulative ERS infrastructure costs in TECH ERS scenario
ERS will be deployed across the core TEN-T network. The deployment of ERS envisaged in the TECH-ERS scenario is the most ambitious (relative to the other TECH scenarios). It is based on a density assumption derived from Fraunhofer (2017)21. The study assumes that 19% of German highways are electrified by 2030. This enables 25% of the HHGV stock to be ERS-enabled vehicles; we estimate this to equate to approximately 300 HHGVs ERS-enabled vehicles in the stock for every km of ERS. Assuming that the density of ERS-enabled vehicles per km changes as the vehicles achieve greater penetration in the stock, we assume 300 vehicles per km is the ‘peak’ density, i.e. that at lower levels of ERS installation, there are fewer vehicles per km (which represents sufficient front loading), and that beyond this point each additional km of ERS installed is a lesser-used road, meaning that there are no further increases in vehicle density in additional installed ERS (and in fact vehicle density falls slightly).
21 Fraunhofer (2017): Machbarkeitsstudie zur Ermittlung der Potentiale des Hybrid-Oberleitungs-Lkw, accessed here Aug 2018
Deployment

Decarbonising road freight in Europe: A socio-economic assessment
37 Cambridge Econometrics
Figure 4.2: Deployment of ERS by scenario
The density assumption for the roll out of ERS in TECH BEV and TECH FCEV scenarios is based on fixing the peak value of vehicles per kilometre at the lower figure of 220. The roll out of ERS infrastructure in these scenarios is much less because the stock of ERS-enabled vehicles is smaller.
The percentage of time spent in electric mode is an important determinant for calculating the fuel consumption of both PHEV and PHEV-ERS vehicles. Figure 4.3 illustrates the percentage of the time each vehicle spends in electric mode – either drawing electricity from ERS or using the on-board battery. A BEV-ERS spends 100% of its time in electric mode.
Figure 4.3: Time spent in electric mode (complete trend)
The time spent in electric mode for a PHEV is calculated based on a number of assumptions. The average trip length of an HHGV in Europe is approximately 525km (TRACCS). For a HHGV travelling at an average speed of 80km/h, the
Percentage of time spent in electric
mode

Decarbonising road freight in Europe: A socio-economic assessment
38 Cambridge Econometrics
time taken for a complete trip is just under 7 hours. With a battery capacity of 165kWh and electricity consumption of 1kWh/km, a fully charged battery has a range of 150km. After this, the vehicle switches to diesel. However, the Working Time Directive means that the driver must stop after 4½ hours (i.e. after driving around 360km). Assuming that this 45-minute rest is used to recharge the PHEV battery (using a rapid charger), the first 150km after the stop can again be done using the electric motor, and the rest of the trip on the ICE. By the end of the trip, the vehicle has covered just over 300km in electric mode of a total of 525km, or around 57%, which is our working assumption for time spent in electric mode by a PHEV.
However, while the time spent in electric mode by a PHEV is constant over time, the same is not true of a PHEV-ERS. For these vehicles, the time spent in electric mode increases over time, in response to the increasing deployment of ERS. The initial start point for PHEV-ERS is the same as PHEV, from which it increases based on data from three German studies (see Table 4.2).
Table 4.2: Modelled estimates of time spent in electric mode by ERS vehicles
4.2 Rapid charging
A few firms have recently announced battery electric HGVs which will rely upon rapid charging technology for on-route recharging. Such vehicles will require dedicated high-power charging infrastructure installed along key transport routes (e.g. the core TEN-T network) and lower-powered chargers installed at haulage depots to enable overnight charging.
The costs for depot and rapid charging have been based on cost analysis for chargers from Fuelling Europe’s Future (2018). The study explored the production and installation cost of rapid chargers (150kW and 350kW) for light duty vehicles. A rapid charger needs to be able to dispense higher power to recharge a HHGV with a 700kWh battery in a reasonable time. However, there is an absence of cost data on rapid chargers of the required size so, these are estimated by linearly scaling up (or down, for ‘slow’ chargers) the costs from Fuelling Europe’s Future (2018). The analysis from Fuelling Europe’s Future (2018) showed close to a linear relationship of a 150kW and 350kW charger, suggesting that this is a reasonable assumption.
Depot chargers have been included at different sizes to support different size batteries in the fleet. The function of these chargers is to enable overnight slow charging of vehicles, and it is assumed that depot owners would buy the cheapest charger that fulfils their need.
Study ERS deployed (km) Time spent in electric mode (%)
UBA 72 (2016) 4000 75
Renewbility III – Endbericht (2016) 8000 80
IFEU (2015) 10400 90
Costs
Source: eHighway, Siemens (2017)

Decarbonising road freight in Europe: A socio-economic assessment
39 Cambridge Econometrics
Table 4.3: Rapid charging infrastructure
The installation cost of preparing these sites will depend on the number of charging posts installed, the location and existing facilities of the site, and most significantly, the level of grid reinforcement needed to cope with the increased local electricity demand. These costs are based on linear scale up of the additional costs of 350kW charging posts from Fuelling Europe’s Future (2018), see Table 4.4 below. We have assumed that all depot chargers are brownfield sites, and rapid charging sites will be greenfield, reflecting the substantial additional space requirements of new rapid charging stations and the tight limits to existing HGV stopping and refuelling space in much of Europe.
Table 4.4: Additional costs for preparing sites for rapid charging
Source: SDG for the EC, Clean Power for Transport Infrastructure Deployment, 2017.
To determine the roll out of rapid charging infrastructure to meet the demand of HGVs we have derived an infrastructure density assumption. With staggered charge times and other logistical options such as advanced booking of charging slots by hauliers, we assume that an average usage factor of 50% could be achieved. As such, 16 vehicles can use a single charger in one day, for
Main application
Charging point features
Power (kW)
Charge time (empty to full)
Cost (€)
Production Installation
Depot – vans
Van wall box Brownfield
7 kW
Battery: 33kWh Time: 5hr
800 400
Depot – PHEV & ERS HHGVs
Overnight charging Brownfield
22kW Battery: 165kWh Time: 7.5hr
10,000 3,813
Deport – BEV HHGVs
Overnight charging Brownfield
90kW Battery: 700kWh Time: 7.7hr
36,000 13,775
Rapid charging Greenfield 700kW
Battery: 700kWh Time: 1hr
480,000 373,125
Item Initial stage (2 chargers)
Mature Stage (8 or more chargers)
Brownfield site
Grid connection € 10,000 € 345,000
Civils € 64,000 € 82,000
TOTAL € 74,000 € 427,000
Greenfield site
Access roads € 50,000 € 50,000
Site works € 100,000 € 100,000
Professional fees € 33,000 € 33,000
Grid connection € 5,000 € 340,000
Civils € 64,000 € 82,000
TOTAL € 252,000 € 605,000
Deployment

Decarbonising road freight in Europe: A socio-economic assessment
40 Cambridge Econometrics
a period of 45 minutes each. Furthermore, because only 34% of trips are greater than 600km (according to data from Eurostat), only a third of vehicles need to use a charger at all (the remainder would be able to complete the journey from a single charge at the depot and would stop only to adhere to the law rather than refuel). Finally, we assume that there are three individual chargers per station. Therefore, the infrastructure density required is one rapid charging station for every 141 HHGVs.
Rapid charging stations are the only infrastructure that do not have any degree of front loading (i.e. building out the infrastructure in advance of the stock requirements). This is because, for every BEV in the stock, one overnight charger is available; on a full charge a BEV can complete the average trip distance, essentially going from depot to depot without requiring any rapid charging stations, along the route. We therefore implicitly assume that the initial deployment of EVs will be used for shorter trip lengths (although completing on an annual basis a total mileage consistent with the whole fleet average).
Figure 4.4 below shows the gross additional rapid charging points required to serve the EV (PHEV and BEV) fleet in the TECH BEV scenario. Figure 4.5 shows the gross additional depot charging points to serve EV fleet in the TECH BEV scenario. The graphs have been split to show the number of rapid charging points in more detail.
Figure 4.4: Additional rapid charging points to support EV fleet in TECH BEV

Decarbonising road freight in Europe: A socio-economic assessment
41 Cambridge Econometrics
Figure 4.5: Additional depot charging points to support EV fleet in TECH BEV
4.3 Hydrogen refuelling stations
The main components of a hydrogen refuelling station (HRS) are a compressor, refrigeration equipment and a dispenser. An HRS will dispense 700 bar hydrogen in conjunction with the performance specification set out in the SAE J2601 international standard. The current technology level and manufacturing volumes means that the costs of a hydrogen refuelling tank are relatively high. Our assumption in this analysis (in line with modelling of hydrogen refuelling stations in Fuelling Europe’s Future (2018) and previous studies) is that hydrogen is produced locally by an on-site electrolyser; note that this generation cost is not included in the infrastructure costs considered below; it matters only in as much as it affects the price of hydrogen fuel.
We have selected two different HRS sizes for the stock model; 10,000kg/day and 25,000kg/day. The upper size is in line with Nikola’s announcement that they will build HRS which can dispense up to 25,000kg of hydrogen per day22.
Our cost estimates of HRS are linearly scaled using the 0.6 power rule from the cost of a 3000kg/day station initial conceived for hydrogen buses23. The cost of a dispenser (including installation & civil etc.) is in the range of €100,000 – €300,000. Note a 3000kg/day charger requires 5 dispensers, this ratio is used to determine the number of dispensers needed for a 10,000kg and 25,000kg HRS. The investment cost of a storage and compression unit combined is within the range of 2,500 – 5,000 €/(kg H2 /day). Larger HRS can achieve costs at the lower end of the range, and since the modelled chargers are large, we assume costs at the bottom end of these ranges.
22 Fuel Cell Cars. Accessed here on 11/07/2017 23 NewBusFuel. Accessed here on 07/12/2017

Decarbonising road freight in Europe: A socio-economic assessment
42 Cambridge Econometrics
Table 4.5: Installation costs for hydrogen refuelling stations
The infrastructure density was based on our assumptions, and cross checked against Nikola estimates. Assuming an efficiency of 6 MJ/km (2025 efficiency estimate of real world efficiency) and energy density of hydrogen of 120 MJ/kg and an average trip length of 525km, each trip requires around 26kg of hydrogen This is less than the Nikola estimate which is between 50-70kg/day per FCEV HHGV, reflecting the lower average distance covered by European HHGVs compared to those in the US. Assuming 75% usage of the capital, 26kg/day means that 286 vehicles can be supported by a single 10,000 kg/day HRS and 714 vehicles by a 25,000 kg/day HRS.
In the first four years of FCEV HHGV deployment we assume some front-loading of infrastructure. Gross additional HRS is illustrated in Figure 4.6 below. As each HRS is assumed to have a 20-year life span, the first replacement chargers are introduced in 2046.
Figure 4.6: Additional HRS to support FCEV fleet in TECH FCEV
Size of charger
Number of dispensers per station
Installation cost of dispensers (€m)
Installation cost of storage and compression unit (€m)
Total installation cost (€m)
10000kg 17 1.7 24.7 26.4
25000kg 42 4.2 42.8 44.5
Deployment

Decarbonising road freight in Europe: A socio-economic assessment
43 Cambridge Econometrics
5 Hauliers’ perspective
5.1 Vehicle costs
The capital cost of each vehicle is derived by combining projections of the powertrain and glider cost with estimates of the cost of fuel-efficient technologies installed in the vehicle (including low-rolling resistance tyres, aerodynamic improvements, weight reductions).
In this capital cost calculation, only the manufacturing cost of the vehicle is considered, therefore excluding margins, distribution costs and VAT. To the extent that these latter costs are proportional to the final sale price, they would be higher in absolute terms for advanced powertrains than for ICE vehicles; however, they would not impact the relative difference in capital cost.
In Figure 5.1 below, and in all subsequent charts where the cost of different powertrains are compared, we compare technologies at the same level of maturity ((i.e. similar percentage cost reductions have been achieved through economies of scale and learning effects).
The cost of technologies which reduce CO2 emissions from road freight will reduce over time as scale economies are achieved, but the cost faced by hauliers will increase as more technologies are added to reach tighter CO2 limits. In 2030, battery-electric and fuel-cell electric vehicles are projected to be significantly more expensive than diesel and gasoline vehicles and their hybrid variants. By 2050, the difference in price will be narrowed slightly but still some distance from convergence with ICE purchase costs, even though the cost of diesel vehicles is increasing (as additional fuel efficient technologies are deployed to meet environmental goals) and zero-emissions vehicles become cheaper as they start being manufactured at scale.
Figure 5.1 Capital cost of a new heavy HGV sized vehicle in the TECH scenarios

Decarbonising road freight in Europe: A socio-economic assessment
44 Cambridge Econometrics
5.2 Fuel costs
One feature of the TECH scenarios is the substantial improvement to the efficiency of conventional ICEs, leading to fuel bill savings for operators of diesel vehicles. In addition, the transition towards an increase in the share of advanced powertrains has implications for fuel bills in the TECH scenarios due to the differences in the costs of these alternative fuels, as well as the improvements in the efficiency of energy conversion in an electric powertrain relative to a conventional ICE.
The oil price projections used for this analysis are taken from IEA’s November 2016 World Energy Outlook and the cost of petrol and diesel production is assumed projected to be consistent with these oil prices over the period to 2050. The electricity price is considered at the EU level and increases in line with the 2016 PRIMES Reference Scenario24; an EU average is presented in the chart below.
As advanced powertrains become more prevalent in the vehicle mix, assumptions about the price of electricity and hydrogen become more important and domestic electricity prices are modelled as relatively constant reflecting the trend in the wholesale cost of production from the generation mix in PRIMES.
5.3 Total cost of ownership (TCO)
To evaluate the impact of the low carbon transition on hauliers, it is also important to look at the total cost of owning a vehicle for the first owner, whose purchasing decision will determine whether the low-carbon technologies enter the vehicle fleet or not. To understand this requires that over the initial ownership period the capital cost, the costs of fuelling the vehicle, share of infrastructure costs, and the amount for which it can be resold at the end of the ownership period are all considered. Figure 5.3 shows
24 European commission 2016: EU Reference Scenario, 2016 Energy, transport and GHG emissions Trends to 2050. Accessed here 30/08/2016
Figure 5.2 Projected cost of petrol, diesel, hydrogen and electricity (2016 €/MWh), EU average

Decarbonising road freight in Europe: A socio-economic assessment
45 Cambridge Econometrics
this perspective over a 5-year ownership period, and again considers similar maturity levels across the different technologies.
Figure 5.3 Total cost of owning and running a heavy HGV over 5 years with various powertrains in the TECH scenarios in 2030 and 2050 (€)
The main finding of the TCO analysis is that due to the high mileage of HHGVs and increased efficiency of the electric motor, the lower running costs of BEV and PHEV based powertrains more than outweigh the higher capital costs. For FCEVs, the vehicles achieve cost-competitiveness with ICEs by 2050, although remain more expensive than other advanced powertrains. This largely reflects the fact that hydrogen fuel costs are substantially higher than obtaining the equivalent energy content directly from electricity.
Overall the TCO comparison shows that the uptake of fuel efficient vehicles should not raise overall costs to hauliers. However, there are other challenges to overcome to ensure uptake of more fuel-efficient vehicles:
• fuel expenses are covered by the clients as part of standard contracts, reducing the incentive of hauliers to reduce these costs
• the haulage sector has many SME operators that lack the capacity to finance investments in more fuel-efficient rolling stock

Decarbonising road freight in Europe: A socio-economic assessment
46 Cambridge Econometrics
6 Economic impacts
The economic impact of decarbonising Europe’s goods vehicles, compared to a reference case (REF) in which vans and heavy goods vehicles remain unchanged from today, was modelled using E3ME25.
6.1 GDP impacts
All scenarios show a small positive impact on GDP from the transition to more efficient vehicles and alternative powertrains. This comes from the shift in spending away from imported oil and towards a higher capital content in vehicles and spending on decarbonised fuels. Since oil is imported into Europe and the decarbonised fuels (hydrogen, electricity) are produced within Europe, the shift in spending on fuel reduces leakage from the European economy and is reflected in an improvement in the balance of trade.
The higher cost of vehicles raises prices to consumers and depresses real incomes and spending. It diverts spending towards the value chain for manufacturing vehicles and their component parts and away from other sectors of the economy. However, where this is displacing spending on oil, since there is greater domestic supply content in motor vehicles as compared to oil, this represents a net benefit to the European economy. In addition, when the TCO of vehicles is lower in the scenario than in the reference case, the overall cost of mobility of road freight is reduced. This has the effect of reducing costs faced by hauliers, the businesses that they supply (as some of the cost reduction is passed on in the form of lower prices) and ultimately consumers. When consumers are faced with lower prices, they are able to re-allocate their expenditure onto other goods and services which further boosts GDP. A summary of the main economic indicators is presented in Table 6.1.
Table 6.1: Main macroeconomic indicators
TECH ICE TECH BEV TECH FCEV TECH ERS
2030 impacts (relative to REF)
GDP (%) 0.03% 0.07% 0.07% 0.06%
Employment (000s) 80 121 122 116
Oil imports (mboe) -106 -197 -192 -193
CO2 emissions from road freight (mtCO2) -43 -80 -78 -79
TECH ICE TECH BEV TECH FCEV TECH ERS
2050 impacts (relative to REF)
GDP (%) 0.03% 0.24% 0.24% 0.22%
Employment (000s) 215 288 341 223
Oil imports (mboe) -188 -749 -749 -743
25 https://www.camecon.com/how/e3me-model/

Decarbonising road freight in Europe: A socio-economic assessment
47 Cambridge Econometrics
CO2 emissions from road freight (mtCO2) -77 -307 -307 -304
The scale of the long-term economic impact is uncertain, depending on a number of competing factors: the cost of vehicles, low-carbon technologies and EV batteries; the location of vehicle supply chains; and future oil prices, amongst others. However, the dominant impact arises from the reduction in oil imports. This is evident in the macroeconomic results in the TECH-ICE relative to other TECH scenarios, in which the reduction in oil imports is much smaller without the shift to advanced powertrains in HGVs.
Compared to the TECH BEV and TECH FCEV scenario, TECH ERS leads to a smaller improvement in employment, a smaller reduction in emissions and a slightly lower boost to GDP. This is due to the smaller infrastructure investment required in this scenario, and the fact that oil imports are reduced by slightly less, due to the continued role for PHEV vehicles in the scenario. The difference between TECH BEV and TECH FCEV is marginal in terms of both the impact on both GDP and employment, with a similar reduction in oil imports in both scenarios.
Figure 6.1 shows the GDP impacts under different scenarios. In the TECH scenarios, by 2030 there is a very small (0.07%) GDP improvement compared to baseline, as the economic benefits of reduced spending on oil and petroleum imports outweigh the negative economic impacts associated with higher vehicle prices. However, by 2050 this has widened to just over 0.24%, as spending on imported fuels falls further due to continued improvement in efficiency of the stock and a continued shift away from ICEs and towards either ERS-enabled vehicles, BEVs or FCEVs.
Figure 6.1 GDP results relative to the reference scenario
6.2 Sectoral impacts
The costs and benefits vary by sector: some benefit and some are adversely affected by the transition.

Decarbonising road freight in Europe: A socio-economic assessment
48 Cambridge Econometrics
In the TECH BEV scenario, spending on fossil fuel imports is €18 billion lower (in 2015 prices) than in the reference scenario by 2030. While much of this spending in the REF scenario flows to producers based outside of Europe, reduced spending has an adverse impact on domestic refining. In the TECH scenario, gross output in the petroleum refining sector is considerably lower than in the reference scenario by 2030.
The electricity and hydrogen sectors benefit from improved capital stock through investment in charging infrastructure and through hauliers’ expenditure on electricity and hydrogen. In the TECH BEV scenario, gross output in the electricity sector is €2.6bn higher than in the reference scenario by 2030.
In the TECH BEV scenario, the automotive supply chain shows a net increase in gross output of €9 billion and an increase of 31,000 jobs in 2030 compared to the reference scenario. However, within the supply chain there is a substantial transition in content from traditional motor vehicles production to electrical equipment in the long term netting out with a moderate increase. By 2050, output in traditional motor vehicles falls by €22 billion whereas electrical equipment output increases by €34 billion.
6.3 Employment
The pattern of impacts on employment, while related to the output impacts, are somewhat different. To assess the impact on employment, we also need to take account of the different employment intensities in the various sectors that are affected. The trend towards greater automation in the auto industry is expected to reduce the number of jobs, regardless of the low-carbon transition. Building battery-electric vehicles is expected to be less labour intensive than building the gasoline and diesel vehicles they will replace, while building hybrids and plug-in hybrids is expected to be more labour intensive (reflecting the fact that these vehicles have dual powertrains). Our modelling confirms that the net employment impact for the auto sector from the transition depends on the market shares of these various technologies, and the degree to which they are imported or produced in Europe.
Figure 6.2 shows the evolution of jobs in Europe because of the transition to low-carbon road freight in 2030 and 2050 under our TECH BEV scenario, relative to the Reference case. There is a net increase in employment in the following sectors: electricity, hydrogen, services and most manufacturing sectors. Employment in the petrol and diesel fuels sector is reduced. Employment in the automotive manufacturing sector is higher until 2030 but is lower thereafter in our TECH BEV scenario.
Oil and petroleum refining
Other energy industries
The automotive supply chain

Decarbonising road freight in Europe: A socio-economic assessment
49 Cambridge Econometrics
Figure 6.2 The employment impact per sector of the transition to low-carbon road freight (TECH BEV compared to REF)
In our TECH BEV scenario, by 2050, the net impact on auto jobs is negative because ICEs with fuel efficient technologies are increasingly replaced by battery-electric vehicles, which are simpler to build and therefore require fewer jobs to produce.
Employment impacts within the auto sector are an important issue. The benefit of using a macro-economic modelling approach is that it allows us to assess the economy-wide impacts of this transition, but there are limits to the level of detail that can be provided. For the low-carbon transition to be successful, care will need to be taken to support those who lose their jobs in technologies that are being phased out. Managing the switch in the motor vehicles industry, to ensure a “just transition”, should be a key focus of policy, particularly against an overall background of increasing automation.
6.4 Oil imports
By 2030, In the TECH BEV scenario, cumulative oil imports since 2018 are reduced by around 1 billion boe. By 2050, the cumulative reduction in oil imports compared to the Reference case increases to 11 bboe. (see Figure 6.3).
The reduction in oil imports is the main economic driver and explains the levelling off of the economic benefits in the TECH ICE scenario from 2030 onwards, compared to the increasing GDP benefits in the other TECH scenarios out to 2050.

Decarbonising road freight in Europe: A socio-economic assessment
50 Cambridge Econometrics
Figure 6.3 Oil imports (difference from REF)
6.5 Government revenues
In many European countries, fuel tax is levied to raise general revenue and to pay for road infrastructure improvements. Vehicle efficiency improvements and a switch to low-carbon vehicles will reduce spending on petrol and diesel fuels with consequent impacts on tax revenues and the model for financing road maintenance and road infrastructure improvements. In some Member States, hauliers have tax exemptions which mean that the impact on fuel duties would be minimal; in the analysis that follows, we adopt a conservative perspective, and assume that all fossil fuel sales that are foregone in the TECH scenarios would be subject to fuel duty. This therefore represents a ‘worst case’ of lost revenues, with the actual impact on fuel duty revenues at a European level likely to be somewhat smaller.
Our analysis shows that the advanced powertrains as in the TECH BEV scenario would cut fuel duty revenues by €23 billion in 2050. However, as described above, the structural shifts prompted by this transition lead to increased economic activity which boosts other tax revenues. This mitigates some of the loss of revenues, and, to close the gap entirely compared with the baseline, the standard rate of VAT was increased by 1-2% (varying by Member State). This ensures that none of the economic benefits outlined above are the result of unfunded borrowing by government; the total tax take by government is unchanged, and the increase in VAT rates that is modelled serves to depress the economic outcomes in the TECH scenarios somewhat.

Decarbonising road freight in Europe: A socio-economic assessment
51 Cambridge Econometrics
Figure 6.4 Fuel duty revenues in 2050 (€2015bn)
While the economic modelling demonstrates this balance in revenues, European governments may focus on the loss of fuel tax revenues and attempt to recoup the lost revenue directly through other taxes on the same group, for example through increases in excise duties (where they exist) or road charging. The net economic effect would depend on which taxes are changed. This highlights the importance of industry, government and civil society working together to find consensus on the optimal approach.

Decarbonising road freight in Europe: A socio-economic assessment
52 Cambridge Econometrics
7 Environmental impacts
7.1 Impact on CO2 emissions
The evolution of average CO2 emissions for new HGVs in each scenario is shown in Figure 7.1. Apart from the REF scenario, all scenarios meet or exceed the European Commission’s proposed reductions of 15% by 2025 and 30% by 2030. In the TECH BEV scenario, the average HGVs is 25% more efficient in 2025 and 39% in 2030.
Figure 7.1 Average CO2 emissions of HGVs from 2018-2050
Figure 7.2 shows the vehicle stock’s CO2 tailpipe emissions under each scenario. In the TECH BEV scenario, CO2 emissions from vans and HGVS are reduced from around 290 Mt per annum in 2018 to 51 Mt per annum in 2050. This is achieved via a combination of increased fuel efficiency and switching the energy source from diesel to low-carbon electricity.
Figure 7.2 Total EU vehicle stock CO2 tailpipe emissions (Mt)

Decarbonising road freight in Europe: A socio-economic assessment
53 Cambridge Econometrics
8 Conclusions
This study focused on the potential economic impacts of decarbonising vans and HGVs in Europe.
We find that all the scenarios yield net economic benefits in the short, medium and long term, strengthening Europe’s economy. This comes about because of the economic benefits of reducing oil imports, and all scenarios lead to reductions in oil consumption and emissions. The economic benefits increase over the period to 2050 and overall there are mild benefits to both GDP and employment, as oil imports are further reduced as efficient vehicles and advanced powertrains take a higher share of the stock. The implication of this finding is that a transition towards low carbon road freight transportation to meet Europe’s climate goals can be achieved without fear of economic collapse, but there are significant challenges along the way.
Policy makers must be ready to manage the transition and should focus their efforts on a few key areas:
• The investment of recharging infrastructure must be delivered in an efficient fashion, likely by both private and public actors, to support haulier take-up of new powertrains.
• Retraining programs must be available to manage the labour market impacts of the transition, giving workers involved in traditional ICE manufacturing the opportunity to re-skill to take up jobs either in the new supply chains around electric vehicles, or to take advantage of the wider opportunities created by higher economic growth.
• Fuel duty revenues will decline due to the transition, but the net benefits to the rest of the economy would make up much of the shortfall by expanding the tax base elsewhere. The scale of net decline in revenues could be met in a number of different ways; however, politicians might be inclined to introduce other taxes on the same group of road users to avoid changing incentives around existing road freight transportation behaviours.

Appendix A E3ME model description
Introduction
E3ME is a computer-based model of the world’s economic and energy systems and the environment. It was originally developed through the European Commission’s research framework programmes and is now widely used in Europe and beyond for policy assessment, for forecasting and for research purposes.
Recent applications of E3ME include:
• a global assessment of the economic impact of renewables for IRENA
• contribution to the EU’s Impact Assessment of its 2030 climate and energy package
• evaluations of the economic impact of removing fossil fuel subsidies in India and Indonesia
• analysis of future energy systems, environmental tax reform and trade deals in East Asia
• an assessment of the potential for green jobs in Europe
• an economic evaluation for the EU Impact Assessment of the Energy Efficiency Directive
This model description provides a short summary of the E3ME model. For further details, the reader is referred to the full model manual available online from www.e3me.com.
E3ME’s basic structure and data
The structure of E3ME is based on the system of national accounts, with further linkages to energy demand and environmental emissions. The labour market is also covered in detail, including both voluntary and involuntary unemployment. In total there are 33 sets of econometrically estimated equations, also including the components of GDP (consumption, investment, international trade), prices, energy demand and materials demand. Each equation set is disaggregated by country and by sector.
E3ME’s historical database covers the period 1970-2014 and the model projects forward annually to 2050. The main data sources for European countries are Eurostat and the IEA, supplemented by the OECD’s STAN database and other sources where appropriate. For regions outside Europe, additional sources for data include the UN, OECD, World Bank, IMF, ILO and national statistics. Gaps in the data are estimated using customised software algorithms.
The main dimensions of the model
The main dimensions of E3ME are:
• 59 countries – all major world economies, the EU28 and candidate countries plus other countries’ economies grouped
Overview
Recent applications

Decarbonising road freight in Europe: A socio-economic assessment
55 Cambridge Econometrics
• 43 or 69 (Europe) industry sectors, based on standard international classifications
• 28 or 43 (Europe) categories of household expenditure
• 22 different users of 12 different fuel types
• 14 types of air-borne emission (where data are available) including the six greenhouse gases monitored under the Kyoto protocol
The countries and sectors covered by the model are listed at the end of this document.
Standard outputs from the model
As a general model of the economy, based on the full structure of the national accounts, E3ME is capable of producing a broad range of economic indicators. In addition there is range of energy and environment indicators. The following list provides a summary of the most common model outputs:
• GDP and the aggregate components of GDP (household expenditure, investment, government expenditure and international trade)
• sectoral output and GVA, prices, trade and competitiveness effects
• international trade by sector, origin and destination
• consumer prices and expenditures
• sectoral employment, unemployment, sectoral wage rates and labour supply
• energy demand, by sector and by fuel, energy prices
• CO2 emissions by sector and by fuel
• other air-borne emissions
• material demands
This list is by no means exhaustive and the delivered outputs often depend on the requirements of the specific application. In addition to the sectoral dimension mentioned in the list, all indicators are produced at the national and regional level and annually over the period up to 2050.
E3ME as an E3 model
The figure below shows how the three components (modules) of the model - energy, environment and economy - fit together. Each component is shown in its own box. Each data set has been constructed by statistical offices to conform with accounting conventions. Exogenous factors coming from outside the modelling framework are shown on the outside edge of the chart as inputs into each component. For each region’s economy the exogenous factors are economic policies (including tax rates, growth in government expenditures, interest rates and exchange rates). For the energy system, the outside factors are the world oil prices and energy policy (including regulation of the energy industries). For the environment component, exogenous factors include policies such as reduction in SO2 emissions by means of end-of-pipe filters from large combustion plants. The linkages between the
The E3 interactions

Decarbonising road freight in Europe: A socio-economic assessment
56 Cambridge Econometrics
components of the model are shown explicitly by the arrows that indicate which values are transmitted between components.
The economy module provides measures of economic activity and general price levels to the energy module; the energy module provides measures of emissions of the main air pollutants to the environment module, which in turn can give measures of damage to health and buildings. The energy module provides detailed price levels for energy carriers distinguished in the economy module and the overall price of energy as well as energy use in the economy.
Technological progress plays an important role in the E3ME model, affecting all three Es: economy, energy and environment. The model’s endogenous technical progress indicators (TPIs), a function of R&D and gross investment, appear in nine of E3ME’s econometric equation sets including trade, the labour market and prices. Investment and R&D in new technologies also appears in the E3ME’s energy and material demand equations to capture energy/resource savings technologies as well as pollution abatement equipment. In addition, E3ME also captures low carbon technologies in the power sector through the FTT power sector model26.
Treatment of international trade
An important part of the modelling concerns international trade. E3ME solves for detailed bilateral trade between regions (similar to a two-tier Armington model). Trade is modelled in three stages:
• econometric estimation of regions’ sectoral import demand
26 See Mercure (2012).
The role of technology

Decarbonising road freight in Europe: A socio-economic assessment
57 Cambridge Econometrics
• econometric estimation of regions’ bilateral imports from each partner
• forming exports from other regions’ import demands
Trade volumes are determined by a combination of economic activity indicators, relative prices and technology.
The labour market
Treatment of the labour market is an area that distinguishes E3ME from other macroeconomic models. E3ME includes econometric equation sets for employment, average working hours, wage rates and participation rates. The first three of these are disaggregated by economic sector while participation rates are disaggregated by gender and five-year age band.
The labour force is determined by multiplying labour market participation rates by population. Unemployment (including both voluntary and involuntary unemployment) is determined by taking the difference between the labour force and employment. This is typically a key variable of interest for policy makers.
Comparison with CGE models and econometric specification
E3ME is often compared to Computable General Equilibrium (CGE) models. In many ways the modelling approaches are similar; they are used to answer similar questions and use similar inputs and outputs. However, underlying this there are important theoretical differences between the modelling approaches.
In a typical CGE framework, optimal behaviour is assumed, output is determined by supply-side constraints and prices adjust fully so that all the available capacity is used. In E3ME the determination of output comes from a post-Keynesian framework and it is possible to have spare capacity. The model is more demand-driven and it is not assumed that prices always adjust to market clearing levels.
The differences have important practical implications, as they mean that in E3ME regulation and other policy may lead to increases in output if they are able to draw upon spare economic capacity. This is described in more detail in the model manual.
The econometric specification of E3ME gives the model a strong empirical grounding. E3ME uses a system of error correction, allowing short-term dynamic (or transition) outcomes, moving towards a long-term trend. The dynamic specification is important when considering short and medium-term analysis (e.g. up to 2020) and rebound effects27, which are included as standard in the model’s results.
Key strengths of E3ME
In summary the key strengths of E3ME are:
27 Where an initial increase in efficiency reduces demand, but this is negated in the long run as greater efficiency lowers the relative cost and increases consumption. See Barker et al (2009).

Decarbonising road freight in Europe: A socio-economic assessment
58 Cambridge Econometrics
• the close integration of the economy, energy systems and the environment, with two-way linkages between each component
• the detailed sectoral disaggregation in the model’s classifications, allowing for the analysis of similarly detailed scenarios
• its global coverage, while still allowing for analysis at the national level for large economies
• the econometric approach, which provides a strong empirical basis for the model and means it is not reliant on some of the restrictive assumptions common to CGE models
• the econometric specification of the model, making it suitable for short and medium-term assessment, as well as longer-term trends
Applications of E3ME
Although E3ME can be used for forecasting, the model is more commonly used for evaluating the impacts of an input shock through a scenario-based analysis. The shock may be either a change in policy, a change in economic assumptions or another change to a model variable. The analysis can be either forward looking (ex-ante) or evaluating previous developments in an ex-post manner. Scenarios may be used either to assess policy, or to assess sensitivities to key inputs (e.g. international energy prices).
For ex-ante analysis a baseline forecast up to 2050 is required; E3ME is usually calibrated to match a set of projections that are published by the European Commission and the IEA but alternative projections may be used. The scenarios represent alternative versions of the future based on a different set of inputs. By comparing the outcomes to the baseline (usually in percentage terms), the effects of the change in inputs can be determined.
It is possible to set up a scenario in which any of the model’s inputs or variables are changed. In the case of exogenous inputs, such as population or energy prices, this is straight forward. However, it is also possible to add shocks to other model variables. For example, investment is endogenously determined by E3ME, but additional exogenous investment (e.g. through an increase in public investment expenditure) can also be modelled as part of a scenario input.
Model-based scenario analyses often focus on changes in price because this is easy to quantify and represent in the model structure. Examples include:
• changes in tax rates including direct, indirect, border, energy and environment taxes
• changes in international energy prices
• emission trading schemes
All of the price changes above can be represented in E3ME’s framework reasonably well, given the level of disaggregation available. However, it is also possible to assess the effects of regulation, albeit with an assumption about effectiveness and cost. For example, an increase in vehicle fuel-efficiency standards could be assessed in the model with an assumption about how
Scenario-based analysis
Price or tax scenarios
Regulatory impacts

Decarbonising road freight in Europe: A socio-economic assessment
59 Cambridge Econometrics
efficient vehicles become, and the cost of these measures. This would be entered into the model as a higher price for motor vehicles and a reduction in fuel consumption (all other things being equal). E3ME could then be used to determine:
• secondary effects, for example on fuel suppliers
• rebound effects28
• overall macroeconomic impacts
Table 1: Main dimensions of the E3ME model
Regions Industries (Europe)
Industries (non-Europe)
1 Belgium Crops, animals, etc Agriculture etc 2 Denmark Forestry & logging Coal 3 Germany Fishing Oil & Gas etc 4 Greece Coal Other Mining 5 Spain Oil and Gas Food, Drink & Tobacco 6 France Other mining Textiles, Clothing & Leather 7 Ireland Food, drink & tobacco Wood & Paper 8 Italy Textiles & leather Printing & Publishing 9 Luxembourg Wood & wood prods Manufactured Fuels 10 Netherlands Paper & paper prods Pharmaceuticals 11 Austria Printing & reproduction Other chemicals 12 Portugal Coke & ref petroleum Rubber & Plastics 13 Finland Other chemicals Non-Metallic Minerals 14 Sweden Pharmaceuticals Basic Metals 15 UK Rubber & plastic products Metal Goods 16 Czech Rep. Non-metallic mineral prods Mechanical Engineering 17 Estonia Basic metals Electronics 18 Cyprus Fabricated metal prods Electrical Engineering 19 Latvia Computers etc Motor Vehicles 20 Lithuania Electrical equipment Other Transport Equipment 21 Hungary Other machinery/equipment Other Manufacturing 22 Malta Motor vehicles Electricity 23 Poland Other transport equip Gas Supply 24 Slovenia Furniture; other manufacture Water Supply 25 Slovakia Machinery repair/installation Construction 26 Bulgaria Electricity Distribution 27 Romania Gas, steam & air cond. Retailing 28 Norway Water, treatment & supply Hotels & Catering 29 Switzerland Sewerage & waste Land Transport etc 30 Iceland Construction Water Transport 31 Croatia Wholesale & retail MV Air Transport 32 Turkey Wholesale excl MV Communications 33 Macedonia Retail excl MV Banking & Finance 34 USA Land transport, pipelines Insurance 35 Japan Water transport Computing Services 36 Canada Air transport Professional Services 37 Australia Warehousing Other Business Services 38 New Zealand Postal & courier activities Public Administration 39 Russian Fed. Accommodation & food serv Education 40 Rest of Annex I Publishing activities Health & Social Work 41 China Motion pic, video, television Miscellaneous Services 42 India Telecommunications Unallocated 43 Mexico Computer programming etc.
28 In the example, the higher fuel efficiency effectively reduces the cost of motoring. In the long-run this is likely to lead to an increase in demand, meaning some of the initial savings are lost. Barker et al (2009) demonstrate that this can be as high as 50% of the original reduction.

Decarbonising road freight in Europe: A socio-economic assessment
60 Cambridge Econometrics
44 Brazil Financial services 45 Argentina Insurance 46 Colombia Aux to financial services 47 Rest Latin Am. Real estate 48 Korea Imputed rents 49 Taiwan Legal, account, consult 50 Indonesia Architectural & engineering 51 Rest of ASEAN R&D 52 Rest of OPEC Advertising 53 Rest of world Other professional 54 Ukraine Rental & leasing 55 Saudi Arabia Employment activities 56 Nigeria Travel agency 57 South Africa Security & investigation, etc 58 Rest of Africa Public admin & defence 59 Africa OPEC Education 60 Human health activities
61 Residential care
62 Creative, arts, recreational
63 Sports activities 64 Membership orgs 65 Repair comp. & pers. goods 66 Other personal serv. 67 Hholds as employers 68 Extraterritorial orgs 69 Unallocated/Dwellings Source(s): Cambridge Econometrics.

Decarbonising road freight in Europe: A socio-economic assessment
61 Cambridge Econometrics
Appendix B ICCT review
The table below summarises the comment received from the ICCT in April 2018, and the response from CE. In many cases the recommendations from ICCT were directly acted upon, although in some cases, where changes made no impact upon the modelling (e.g. costs were equal across all powertrains), or there was a lack of a clear alternative figure, issues were addressed.

Decarbonising road freight in Europe: A socio-economic assessment
62 Cambridge Econometrics
Technology/Powertrain
ICCT comment ICCT recommendation CE response
Costs of vehicles
Trailer Price For our ICCT-CostEff study, we used a baseline tractor price is as €101,000 and baseline trailer
price as €27,500. This based on publicly available market data for 2016. This prices do not include
taxes. They do include the OEM’s margin.
Combining your cost assumptions and the publically available data on truck prices before taxes, the truck would have a margin of ~18%
(looks ok to me) and the trailer of ~80% (looks high to me).
ICCT recommends to double check the trailer
cost assumptions.
Not addressed: trailer prices not the focus of the
study. Value consistent across
all powertrains so no impact from changing value.
Electric motor costs
The number cited in the ICCT report on trasitioning to ZEVs is $118/kW (2015 USD), therefore the 106
€/kW looks high to me.
What exchange rate and inflation
adjustments are you using?
Addressed: exchange rate of
1.13 $:€ now applied.
PHEV Engine size
The powertrain power seems overdimensioned to me. The total combined power would be 672 kW.
Here’s how I see the different hybrid powertrains:
HEV: Main power source is the ICE (350 kW), with
a motor of one third to one half of the power (120 - 170 kW) for regenerative braking and power assist. Such a vehicle could also operate in full
electric mode under the catenary, as the average engine power required for highway operation is
~100 kW.
PHEV: Main power source is the electric motor (350 kW), with an ICE engine of one third to one
half of the power (120 - 170 kW) as a range extender. Once the battery is drained, such a
vehicle could also operate in hybrid mode, where the motor provides the propoulsion power, and
the engine just continuously charges the batteries. There has been no announcements of PHE-HDVs
from the industry (and I don’t see any coming), so there are no examples to compare against.
The battery pack of 165 kWh seems reasonable.
ICCT’s recommendation is to reduce the engine
size in the PHEV case.
Not addressed.
ICE engine cost On the motor cost: The price per kW is taken from ICCT-ZEV study. The prices in that report are in
2015 USD (e.g., $16/kW). However, they are used here without correcting to EUR or to the year
2016.
Is this intentional? If so it must be justified.
You also chose to neglect the electric
motor fixed costs used in the ICCT-ZEV study
(Table 6, $75 (2015 USD) in 2030). Although this has a minor impact,
this also must be justified.
Not addressed.
What is the reasoning for using a 322 kW ICE engine in the PHEV but a 350 kW ICE engine in the
PHEV-ERS?
In any case, the ICE engine is
overdimensioned in both cases. The PHEV and PHEV-ERS should
be thought of as range-extended hybrids, and
therefore the ICE engine power should be
in the 120 to 170 kW range.
Partially addressed: PHEV
and ICE engine size aligned.
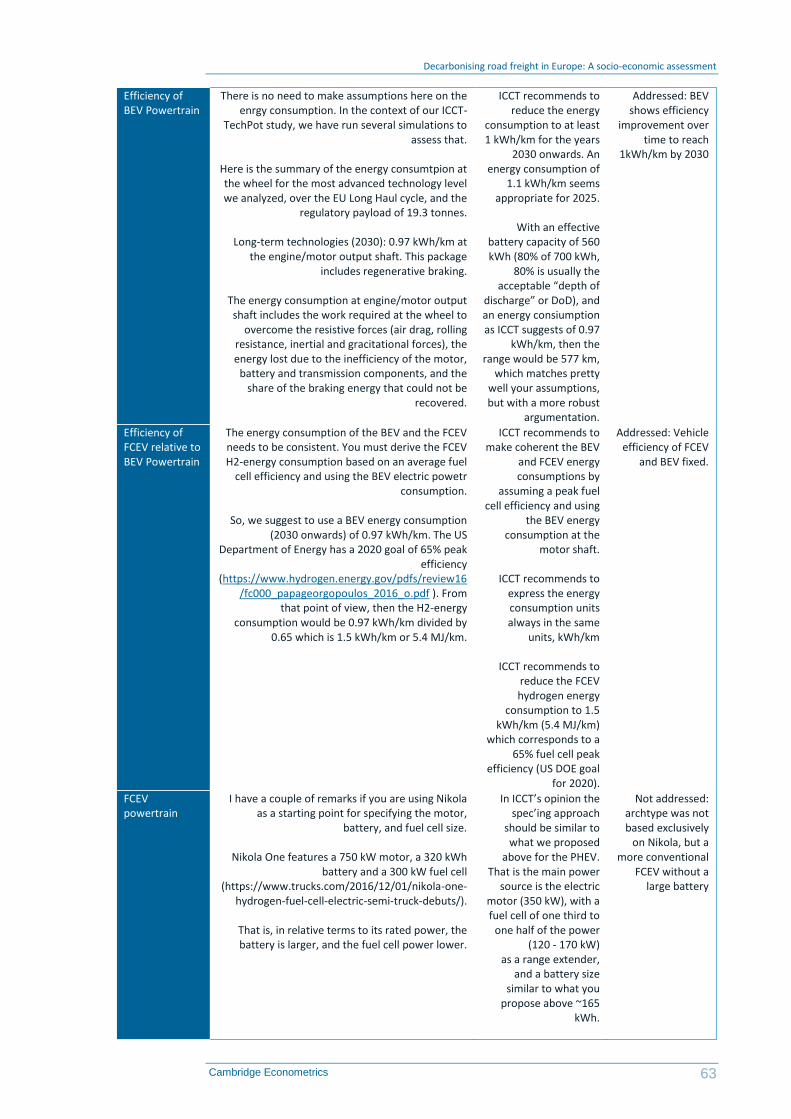
Decarbonising road freight in Europe: A socio-economic assessment
63 Cambridge Econometrics
Efficiency of BEV Powertrain
There is no need to make assumptions here on the enrgy consumption. In the context of our ICCT-
TechPot study, we have run several simulations to assess that.
Here is the summary of the energy consumtpion at the wheel for the most advanced technology level we analyzed, over the EU Long Haul cycle, and the
regulatory payload of 19.3 tonnes.
Long-term technologies (2030): 0.97 kWh/km at the engine/motor output shaft. This package
includes regenerative braking.
The energy consumption at engine/motor output shaft includes the work required at the wheel to
overcome the resistive forces (air drag, rolling resistance, inertial and gracitational forces), the energy lost due to the inefficiency of the motor,
battery and transmission components, and the share of the braking energy that could not be
recovered.
ICCT recommends to reduce the energy
consumption to at least 1 kWh/km for the years
2030 onwards. An energy consumption of
1.1 kWh/km seems appropriate for 2025.
With an effective
battery capacity of 560 kWh (80% of 700 kWh,
80% is usually the acceptable “depth of
discharge” or DoD), and an energy consiumption as ICCT suggests of 0.97
kWh/km, then the range would be 577 km,
which matches pretty well your assumptions, but with a more robust
argumentation.
Addressed: BEV shows efficiency
improvement over time to reach
1kWh/km by 2030
Efficiency of FCEV relative to BEV Powertrain
The energy consumption of the BEV and the FCEV needs to be consistent. You must derive the FCEV H2-energy consumption based on an average fuel
cell efficiency and using the BEV electric powetr consumption.
So, we suggest to use a BEV energy consumption
(2030 onwards) of 0.97 kWh/km. The US Department of Energy has a 2020 goal of 65% peak
efficiency (https://www.hydrogen.energy.gov/pdfs/review16
/fc000_papageorgopoulos_2016_o.pdf ). From that point of view, then the H2-energy
consumption would be 0.97 kWh/km divided by 0.65 which is 1.5 kWh/km or 5.4 MJ/km.
ICCT recommends to make coherent the BEV
and FCEV energy consumptions by
assuming a peak fuel cell efficiency and using
the BEV energy consumption at the
motor shaft.
ICCT recommends to express the energy consumption units always in the same
units, kWh/km
ICCT recommends to reduce the FCEV hydrogen energy
consumption to 1.5 kWh/km (5.4 MJ/km)
which corresponds to a 65% fuel cell peak
efficiency (US DOE goal for 2020).
Addressed: Vehicle efficiency of FCEV
and BEV fixed.
FCEV powertrain
I have a couple of remarks if you are using Nikola as a starting point for specifying the motor,
battery, and fuel cell size.
Nikola One features a 750 kW motor, a 320 kWh battery and a 300 kW fuel cell
(https://www.trucks.com/2016/12/01/nikola-one-hydrogen-fuel-cell-electric-semi-truck-debuts/).
That is, in relative terms to its rated power, the battery is larger, and the fuel cell power lower.
In ICCT’s opinion the spec’ing approach
should be similar to what we proposed
above for the PHEV. That is the main power
source is the electric motor (350 kW), with a fuel cell of one third to
one half of the power (120 - 170 kW)
as a range extender, and a battery size
similar to what you propose above ~165
kWh.
Not addressed: archtype was not based exclusively
on Nikola, but a more conventional
FCEV without a large battery

Decarbonising road freight in Europe: A socio-economic assessment
64 Cambridge Econometrics
It seems that you are using the 12 kWh
battery proposed in our ICCT-ZEV paper, which
comes from Toyota and its recent prototype.
However, note that that truck is for port
(drayage) operation and not for highway use.
ICCT recommends to re-
spec the FCEV truck as described above, and
not to use the specs proposed in our ICCT-
ZEV paper.
Diesel Fuel prices
We put some effort in our ICCT-CostEff study to predict the diesel prices looking forward to 2030, with a careful consideration of excise duties (e.g.,
some EU countries have refunds on the excise duty). See Figure 3.
Addressed: Adjusted diesel price to reflect
price without fuel duty
Tolls Should take into account the latest announcement by the German government of completely
eliminiating the road toll for electric trucks starting in 2019.
https://www.focus.de/auto/elektroauto/tausende-euro-gespart-elektro-lkw-sollen-von-maut-befreit-
werden_id_8752077.html
Not addressed: insufficient data to
take account of tolls at EU level in
costs.
Fuel efficient technologies
Aerodynamic improvements
In ICCT-TechPot we estimate a 42% reduction (Table 21) in air drag for the long term package.
The air drag reduction translates in a 13.2% reduction in fuel consumption (Table 22).
Looking at a package more in line with what you
are assuming here, in the advanced package of ICCT-TechPot we estimate a 27% reduction (Table 21) in air drag. The air drag reduction translates in
a 8.5% reduction in fuel consumption (Table 22).
In ICCT-CostEff we estimate the 2030 cost of the advanced aero package to be 2293 (2016 €), and of
the long-term aero package to be 2897 (2016 €)
In ICCT-CostEff see Figure 7. See Table 10 for the breakdown between tractor and trailer
technologies. The trailer technologies are multiplied by a factor of 1.4 to account for the in-
use trailer/tractor ratio.
In ICCT’s opinion the FC reduction and cost
estimates look reasonable.
No action required
Lightweighting In ICCT-TechPot we estimate a 2300 kg reduction (Table 25) curb weight in the long-term package.
The weight reduction translates in a 3.4% reduction in fuel consumption.
Looking at a package more in line with what you
are assuming here, in the incremental package of ICCT-TechPot we estimate a 200 kg reduction
(Table 25). The weight reduction translates in a 0.3% reduction in fuel consumption.
In ICCT-CostEff we estimate the 2030 cost of the incremental lightweighting package to be 400.6
(2016 €), and of the long-term lightweighting to be 10712.4 (2016 €)
In ICCT’s opinion the FC reduction estimate is
reasonable, but the cost estimates look a bit
low.
Not addressed: small
underestimate of costs balanced out by suggested over-
estimates elsewhere

Decarbonising road freight in Europe: A socio-economic assessment
65 Cambridge Econometrics
In ICCT-CostEff see Figure 9. See Table 10 for the
breakdown between tractor and trailer technologies. The trailer technologies are
multiplied by a factor of 1.4 to account for the in-use trailer/tractor ratio.
Tire pressure systems
US Phase 2 regulation credits ATIS at 1.2% and TPMS at 1.0%. US Phase 2 cost is ~1,500USD for
ATIS and ~220USD for TPMS. (compliance cost in 2024 which assumes 25% penetration ATIS and
50% penetration TPMS is USD477, compliance cost in 2027 which assumes 30% penetration ATIS and
70% penetration TPMS is USD594).
Cost data for ATIS (~10,000 Euros) seems way out of bounds, we
recommend using US Phase 2 numbers..
Addressed: Used TPMS cost data,
which is in line with ICCT estimates
Low rolling resistance tires
We only looked at low-rolling resistance tires. ICCT simulation modeling assumes that tires are
properly inflated to appropriate pressure at all times. The use of technologies such as tire
pressure monitoring or automatic tire inflation systems is not assumed.
In ICCT-TechPot we estimate a 27% reduction
(Table 23) in rolling resistance for the long term package. That translates in a 8.4% reduction in fuel
consumption (Table 24).
Looking at a package more in line with what you are assuming here, in the moderate package of
ICCT-TechPot we estimate a 19% reduction (Table 23) in rolling resistamce. That translates in a 5.8%
reduction in fuel consumption (Table 24).
In ICCT-CostEff we estimate the 2030 cost of the moderate tires package to be 319 (2016 €), and of
the long-term aero package to be 334 (2016 €). Note that these costs refer to the increase with respect to the baseline tires, and not the actual
cost of the tire set.
The total maintenance costs of always replacing the tires with LRR amount to €659 (2016 €) in net present value, using a discount rate of 7%. (Table
9, ICCT-CostEff)
In ICCT-CostEff see Figure 8. See Table 10 for the breakdown between tractor and trailer
technologies. The trailer technologies are multiplied by a factor of 1.4 to account for the in-
use trailer/tractor ratio.
In ICCT’s opinion the FC reduction estimate is
reasonable, but the cost estimates are too high.
Addressed: Single wide tires are only
option for HHGV, but omitted to
rename and combine the two.
Cost estimates remain slightly too
high.
Single wide tyres
Single wide tires: ICCT has consulted with tire experts during the development of the different
studies, and they agree on the fact that the adoption of single wide tires in the EU is not
feasible. Nevertheless, the same benefits can be obtained with twin-low rolling resistance tires.
I suggest to change this item’s name to “low
rolling resistance tires”.
See previous.
Transmission Automated manual transmissions are the industry standard now, so they should belong to the
baseline HHGV vehicle and should not be considered as a future fuel saving technology.
The ICCT-TechPot and ICCT-CostEff study include
the effects of two driveline technologies, increased
transmission and axle efficiency.
In ICCT’s opinion the FC reduction and cost
estimates look reasonable.
Addressed: removed
automatic manual from all technology
packages
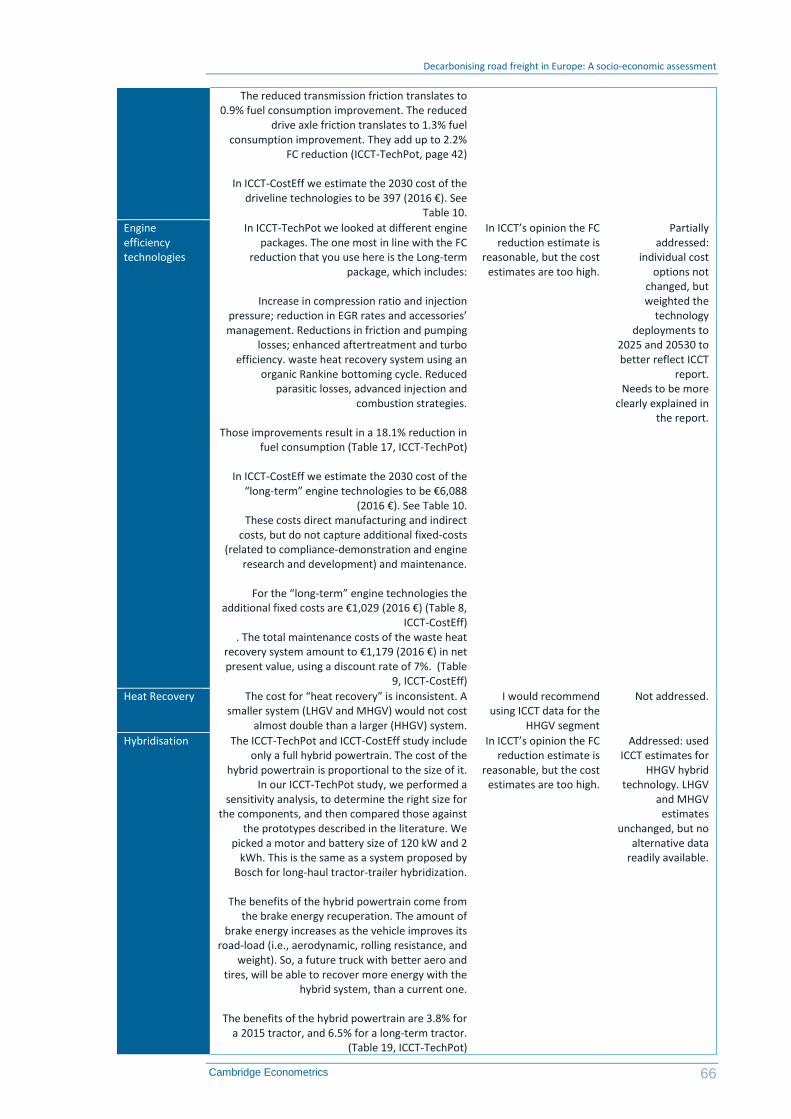
Decarbonising road freight in Europe: A socio-economic assessment
66 Cambridge Econometrics
The reduced transmission friction translates to 0.9% fuel consumption improvement. The reduced
drive axle friction translates to 1.3% fuel consumption improvement. They add up to 2.2%
FC reduction (ICCT-TechPot, page 42)
In ICCT-CostEff we estimate the 2030 cost of the driveline technologies to be 397 (2016 €). See
Table 10.
Engine efficiency technologies
In ICCT-TechPot we looked at different engine packages. The one most in line with the FC
reduction that you use here is the Long-term package, which includes:
Increase in compression ratio and injection
pressure; reduction in EGR rates and accessories’ management. Reductions in friction and pumping
losses; enhanced aftertreatment and turbo efficiency. waste heat recovery system using an
organic Rankine bottoming cycle. Reduced parasitic losses, advanced injection and
combustion strategies.
Those improvements result in a 18.1% reduction in fuel consumption (Table 17, ICCT-TechPot)
In ICCT-CostEff we estimate the 2030 cost of the
“long-term” engine technologies to be €6,088 (2016 €). See Table 10.
These costs direct manufacturing and indirect costs, but do not capture additional fixed-costs
(related to compliance-demonstration and engine research and development) and maintenance.
For the “long-term” engine technologies the
additional fixed costs are €1,029 (2016 €) (Table 8, ICCT-CostEff)
. The total maintenance costs of the waste heat recovery system amount to €1,179 (2016 €) in net present value, using a discount rate of 7%. (Table
9, ICCT-CostEff)
In ICCT’s opinion the FC reduction estimate is
reasonable, but the cost estimates are too high.
Partially addressed:
individual cost options not
changed, but weighted the
technology deployments to
2025 and 20530 to better reflect ICCT
report. Needs to be more
clearly explained in the report.
Heat Recovery The cost for “heat recovery” is inconsistent. A smaller system (LHGV and MHGV) would not cost
almost double than a larger (HHGV) system.
I would recommend using ICCT data for the
HHGV segment
Not addressed.
Hybridisation The ICCT-TechPot and ICCT-CostEff study include only a full hybrid powertrain. The cost of the
hybrid powertrain is proportional to the size of it. In our ICCT-TechPot study, we performed a
sensitivity analysis, to determine the right size for the components, and then compared those against
the prototypes described in the literature. We picked a motor and battery size of 120 kW and 2
kWh. This is the same as a system proposed by Bosch for long-haul tractor-trailer hybridization.
The benefits of the hybrid powertrain come from
the brake energy recuperation. The amount of brake energy increases as the vehicle improves its
road-load (i.e., aerodynamic, rolling resistance, and weight). So, a future truck with better aero and
tires, will be able to recover more energy with the hybrid system, than a current one.
The benefits of the hybrid powertrain are 3.8% for
a 2015 tractor, and 6.5% for a long-term tractor. (Table 19, ICCT-TechPot)
In ICCT’s opinion the FC reduction estimate is
reasonable, but the cost estimates are too high.
Addressed: used ICCT estimates for
HHGV hybrid technology. LHGV
and MHGV estimates
unchanged, but no alternative data
readily available.

Decarbonising road freight in Europe: A socio-economic assessment
67 Cambridge Econometrics
In ICCT-CostEff we estimate the 2030 cost of the
hybrid technology to be €8,535 (2016 €). See Table 10.
Reduction of auxiliary (parasitic) loads
Two technologies are missing from this list:
1. High efficiency alternators 2. Smart/efficient air compressors.
We looked at the total benefits of the 5 auxiliary
technologies (the 3 you have, plus these 2) and estimate a FC reduction of 2% (Table 26, ICCT-
TechPot).
In ICCT’s opinion the FC reduction estimate is on
the low side, but the cost estimates look ok.
Not addressed
Overall Technology package costs
In ICCT-TechPot and ICCT-CostEff we looked at 12 different technology packages. The packages with
FC reductions similar to what you consider here (for HHGV) are packages 10, 11, and 12.
The FC reduction are 35%, 39% and 43%
respectively (see ICCT-TechPot, Figure 12).
The associated cost in 2030 of these 3 packages are €18,890, €20,067, and €28,602 all in (2016 €).
(see ICCT- CostEff, Table 12).
Looking at the total (retail level) technology package plus NPV of incremental maintenance
costs the respective costs ion 2030 (7% discount rate for maintenance costs) are €20,199, €21,377
and €30,559 all in (2016 €). (see ICCT- CostEff, Table 13).
In ICCT’s opinion the FC reduction estimate is
reasonable, but the cost estimates are a factor
of ~1.5 too high.
Partly addressed: overall package
costs adjusted to be closer to ICCT overall estimates
for equivalent packages.