european economy. economic papers 242/2006. cross-border...
TRANSCRIPT

EUROPEAN ECONOMY
EUROPEAN COMMISSION DIRECTORATE-GENERAL FOR ECONOMIC
AND FINANCIAL AFFAIRS
ECONOMIC PAPERS
ISSN 1725-3187 http://europa.eu.int/comm/economy_finance
Number 242 February 2006
Cross-border mergers and acquisitions and the role of trade costs
by Alexander Hijzen (GEP, University of Nottingham)
Holger Görg (GEP, University of Nottingham and DIW Berlin) and Miriam Manchin (Tinbergen
Institute, Rotterdam University)

Economic Papers are written by the Staff of the Directorate-General for Economic and Financial Affairs, or by experts working in association with them. The "Papers" are intended to increase awareness of the technical work being done by the staff and to seek comments and suggestions for further analyses. Views expressed represent exclusively the positions of the author and do not necessarily correspond to those of the European Commission. Comments and enquiries should be addressed to the: European Commission Directorate-General for Economic and Financial Affairs Publications BU1 - -1/13 B - 1049 Brussels, Belgium ECFIN/REP/54606-EN ISBN 92-79-01183-9 KC-AI-06-242-EN-C ©European Communities, 2006
CROSS-BORDER MERGERS & ACQUISITIONS
AND THE ROLE OF TRADE COSTS
Alexander Hijzen*
(GEP, University of Nottingham)
Holger Görg
(GEP, University of Nottingham and DIW Berlin)
Miriam Manchin
(Tinbergen Institute, Rotterdam University)
Abstract Cross-border mergers and acquisitions (M&As) have increased dramatically over the last two decades. This paper analyses the role of trade costs in explaining the increase in both the number and the value of cross-border mergers and acquisitions. In particular, we distinguish horizontal and non-horizontal M&As and investigate whether distance and trade policy barriers affect these two types of mergers differently. We analyse this question using industry data for 23 OECD countries for the period 1990-2001. Our findings suggest that while in the aggregate trade costs affect cross-border merger activity negatively its impact differs importantly across horizontal and non-horizontal mergers. The impact of trade costs is less negative for horizontal mergers, which is consistent with the tariff-jumping argument.
Keywords: mergers and acquisitions, international trade, trade costs, gravity, FDI
JEL: F02, F15, F21, F23
Acknowledgements We would like to thank the DG Economic and Financial Affairs, European Commission for providing the data on mergers and acquisitions and Olivier Bertrand, Keith Head, Thierry Mayer, Daniel Mirza and John Ries as well as participants of the workshop on Cross-Border M&A at Nottingham University (4 October 2004) and the MWIEG Meeting at Vanderbilt University (22-24 April 2005) for very helpful comments and suggestions. We are very grateful to David Laborde at CEPII for providing the MAcMap data (in US SIC 1987). Financial support from the Leverhulme Trust (Programme Grant F114-BF) and the ESRC under PTA-026-27-0733 is gratefully acknowledged. * Corresponding author: Alexander Hijzen, School of Economics, University of Nottingham, University Park, Nottingham NG7 2RD. Email: [email protected]
Non-technical summary Cross-border mergers and acquisitions (M&As) have increased dramatically over the last two decades. Given this rapid increase, fully understanding the determinants and implications of mergers and acquisitions has been high on the agenda for both policy makers as well as academics. Traditionally, much of the FDI activity, be it M&As or greenfield investment, has been explained by the “tariff jumping” argument. This explanation for FDI posits that exporting and investing abroad are substitutes, and as trade costs increase (making exporting more costly), firms are more likely to choose investing abroad. More recently, studies focussing more on the industrial organisation aspect of firm behaviour, have provided alternative views. In these models, it is found that high trade costs do not necessarily induce foreign M&As, contrary to the tariff jumping argument. These theoretical models implicitly relate to horizontal mergers, i.e., mergers between firms in the same industry. However, empirically much of international M&A activity involves mergers between firms in different industries, that is, vertical and/or conglomerate mergers. For such M&As predictions about horizontal mergers may not be straightforwardly applicable. This observation is one of the starting points for our paper. We use micro level data on merger deals, which we aggregate to the industry level to study explicitly the impact of trade costs and impediments to trade and investment on M&As, paying particular attention to differences between horizontal and non-horizontal mergers. Horizontal M&As are defined as mergers between firms within the same industry, whereas non-horizontal M&As are defined as mergers between firms in different industries. Our data provide detailed information on the number and value of international merger deals for a number of OECD countries over the period 1990 to 2001. The role of trade costs in determining international exchanges of capital and goods is far from negligible despite an increasingly globalised world. Hence, an analysis of the impact of trade costs on international merger activity is interesting not only from an academic point of view, but may also provide valuable information for policy makers. In order to take account of the effects of trade impediments on cross-border M&As we consider two different types of measures of barriers to trade. The first one is the distance between the two countries; a variable commonly employed in gravity models of trade and investment. Apart from distance we also analyse the impact of trade policy on cross-border M&A via its impact on trade costs. We use detailed data on applied protection based on bilateral ad valorem equivalent data at the industry level. The results suggest that distinguishing empirically between horizontal and non-horizontal M&As brings to the fore a number of differences in the determinants between the two types of mergers. While in the aggregate trade costs affect cross-border merger activity negatively its impact is significantly less pronounced for horizontal mergers than for non-horizontal mergers. Hence, treating heterogeneous mergers as a homogenous group at the country level may potentially bias results and lead to unreliable conclusions to be drawn from such estimations. The less negative effect on horizontal mergers provides support to the tariff jumping argument put forward in the literature on the determinants of horizontal FDI.
1

Our findings have important policy implications. The main findings in the paper that cross-border M&A respond negatively to trade costs in the aggregate and that the share of horizontal M&A increases in the level of trade costs provide an additional rational for free trade. To the extent that horizontal mergers are less likely to be associated with productivity spillovers and more likely with anticompetitive behaviour up freeing up trade not only increases the level of inward investment but also its composition in a way that is likely to benefit the economy. The trade regime might thus have important implications for attracting inward investment in terms of M&As, an issue that should be recognised by governments wishing to attract foreign investment in order to benefit from technology and spillovers.
2

1. Introduction
Cross-border mergers and acquisitions (M&As) have increased dramatically over the last
two decades. In 1999, the value of completed cross-border M&As was around $720
billion. The value of all M&As, both cross-border and domestic, amounted to an
equivalent of 8 percent of world GDP in the same year. For comparison, in 1980 this ratio
was merely 0.3 percent (UN 2001). Also, over that period, most of the growth in foreign
direct investment flows (FDI) has been attributed to M&As rather than greenfield
investment (UN 2001). Given this rapid increase, fully understanding the determinants and
implications of mergers and acquisitions has been high on the agenda for both policy
makers as well as academics.
Traditionally, much of the FDI activity, be it M&As or greenfield investment, has been
explained by the “tariff jumping” argument. In a nutshell, this explanation for FDI posits
that exporting and investing abroad are substitutes, and as trade costs increase (making
exporting more costly), firms are more likely to choose investing abroad.1
More recently, studies focussing more on the industrial organisation aspect of firm
behaviour, have provided alternative views. Horn and Persson (2001) and Norbäck and
Persson (2004) provide theoretical models where foreign firms may acquire domestic
acquisition targets, with the acquisition price being determined endogenously in a
bargaining process. In these models, they find that high trade costs do not necessarily
induce foreign M&As, contrary to the tariff jumping argument.
Tekin Koru (2004) takes this issue further by providing an explicit model where a foreign
firm chooses between M&A, greenfield investment or exporting as a means of foreign
market entry. The acquisition price is again determined endogenously, similar to the
models above. She shows theoretically that increases in trade costs may make M&As
more costly vis-à-vis greenfield investment or exporting. She also shows empirically,
using firm level data for Swedish firms that trade costs are negatively related to the choice
of M&As as opposed to greenfield or exporting.
1 For example, Markusen’s (2002) knowledge-capital model implies this prediction that high trade costs encourage horizontal FDI. See Brainard (1997), Carr et al. (2001), and Blonigen et al. (2003) for evidence in line with this argument.
3
It is worthy of note that these IO models implicitly relate to horizontal mergers, i.e.,
mergers between firms in the same industry. However, empirically, as we show in Section
2, much of international M&A activity involves mergers between firms in different
industries, that is, vertical and/or conglomerate mergers. Arguably, for such M&As
predictions about horizontal mergers may not be straightforwardly applicable.2 This
observation is one of the starting points for our paper.
We use micro level data on merger deals, which we aggregate to the industry level to
study explicitly the impact of trade costs and impediments to trade and investment on
M&As, paying particular attention to differences between horizontal and non-horizontal
mergers. Horizontal M&As are defined as mergers between firms within the same
industry, whereas non-horizontal M&As are defined as mergers between firms in different
industries. To the best of our knowledge, the present paper is the first to explicitly
distinguish these two types of cross-border mergers. Our data, which provide detailed
information on the number and value of international merger deals for a number of OECD
countries over the period 1990 to 2001, come from the Thomson Financial Securities
Global Mergers and Acquisitions database.3
That the role of trade costs in determining international exchanges of capital and goods are
far from negligible despite an increasingly globalised world economy is made clear by
Anderson and Van Wincoop (2004). They estimate that the tax equivalent of international
trade costs for a typical industrial country is 74% (including domestic trade costs this rises
to 170%). These consist of transportation costs (21%), tariff and non-tariff policy barriers
(8%) and other border-related non-policy barriers (33%). Hence, an analysis of the impact
of trade costs on international merger activity is interesting not only from an academic
point of view, but may also provide valuable information for policy makers.
In order to take account of the effects of trade impediments on cross-border M&As we
consider two different types of measures of barriers to trade. The first one is the distance
2 As an illustration, the Markusen (2002) model arrives at different predictions for horizontal vs. vertical FDI in relation to trade costs and other variables. 3 These data have been used in a limited number of recent studies that investigate specifically the determinants of international cross-border M&As (e.g., Di Giovanni, 2005, Bertrand et al., 2004). Di Giovanni (2005) uses M&A data at the country level. Bertrand et al. (2004) use industry level data but do not distinguish vertical and horizontal mergers. Also related to our work are empirical papers on the
4

between the two countries; a variable commonly employed in gravity models of trade and
investment. Apart from distance we also analyse the impact of trade policy on cross-
border M&A via its impact on trade costs. We use detailed data on applied protection
based on bilateral ad valorem equivalent data at the industry level. These data are
available from a new unique data set called Market Access Map (MacMap), developed
jointly by the ITC (UNCTAD-WTO, Geneva) and CEPII (Paris).
Using explicit information on the level of applied protection on trade rather than just
distance is interesting because the former explicitly relates to the cost of exporting unlike
distance which may capture informational barriers in addition to pure trade costs (Portes
and Rey, 2001). Thus, even when distance affects various types of cross-border mergers
differently we can a priori not be sure whether this is due to the theoretical argument based
on the interdependence between trade and FDI. Including explicit information on the trade
policy stance should help to address this problem.
Moreover, using trade policy indicators of imports from the target country by the
acquisition country in addition to those for imports from the acquisition country by the
target country allows one to assess to what extent non-horizontal mergers reflect mergers
of the vertical type, i.e. mergers that are motivated by the desire to exploit international
differences in factor prices by moving the production of certain parts or components to
affiliates abroad. Vertical mergers thus tend to be associated with imports by foreign
affiliates in the target country that are subsequently re-exported to the home country. We
therefore expect that vertical mergers are negatively affected by trade policy barriers in
both the acquisition and the target country.
Finally, it may be useful for policy makers to realise that changes in the trade policy
stance may not only affect the pattern of trade but also the level and composition of
inward investment. Given the importance policy-makers have attached to attracting
foreign multinationals this may be an important side-effect of trade policy worth taking
into account.
determinants of cross-border equity flows (portfolio investment), see, e.g., Portes and Rey (2005), Portes et al. (2001).
5

The results suggest that distinguishing empirically between horizontal and non-horizontal
M&As brings to the fore a number of differences in the determinants between the two
types of mergers. While in the aggregate trade costs affect cross-border merger activity
negatively its impact is significantly less pronounced for horizontal mergers than for non-
horizontal mergers. Hence, treating heterogeneous mergers as a homogenous group at the
country level may potentially bias results and lead to unreliable conclusions to be drawn
from such estimations.
The remainder of the paper is structured as follows. Section 2 describes the database on
M&As and describes the pattern of merger activity in the data. In section 3 we develop a
simple theoretical model of cross-border M&A. Section 4 introduces the empirical model,
describes the variables and discusses the econometric methodology used to investigate the
role of trade costs in explaining cross-border mergers. Section 5 presents and analyses the
estimation results of the basic model. Section 6 extends the basic model to assess to what
extent and how trade policy affects cross-border M&A through its impact on trade costs.
Section 7 provides some conclusions.
2. Definitions and Patterns
Given the close link between the present paper, which focuses on cross-border M&A, and
the FDI literature, which resolves to an important extent around the role of trade, it is
worthwhile making clear to what extent cross-border M&A and FDI actually are one and
the same phenomenon.
Firstly, cross-border M&A is typically considered to be a subset of FDI ranging from
about 50% to 90% depending on the source that is consulted. The remainder of FDI is
generally considered to be realised through greenfield investment. Thus, a majority of FDI
tends to occur through cross-border M&A. Secondly, while thinking of cross-border M&A
as simply a component of FDI may be useful, strictly speaking the relationship between
cross-border M&A and FDI is much more complicated as is made clear in UNCTAD’s
World Invest Report for 2000, which is specifically dedicated to the issue of cross-border
mergers and acquisitions. FDI, in contrast to cross-border M&A, solely refers to
transactions between parents and affiliates. Cross-border M&A includes also investments
that are financed via domestic and international capital markets. It is not always possible
to trace the country from which these funds originate. Moreover, FDI refers to net
6
investments whereas M&A refer to gross transactions (acquisitions and divestments). Due
to those differences, it is therefore well possible that cross-border M&A exceeds the
documented value of FDI.4
Data on mergers and acquisitions originate from the Global Mergers and Acquisitions
database included in Thomson Financial Securities. It is claimed that this dataset includes
all domestic and cross-border mergers and acquisitions worldwide in excess of one million
dollar. This dataset has been used relatively little in previous research, although a number
of studies have used these data to analyse the nature of primarily domestic mergers (for
example, Gugler et al. 2003). Manchin (2004) and Di Giovanni (2005) appear to be the
only studies to have used these data to explicitly analyse patterns in aggregate cross-
border mergers and acquisitions.
For the present analysis we use a fairly restrictive definition of M&A which excludes
portfolio investment. More particularly, we include all M&As in which the acquirer
obtains a majority interest in the target by either
• acquiring an interest of 50% or over in the target
• raising its interest from below to above 50%, or
• acquiring the remaining interest it does not already own.5
Moreover, we concentrate on announced rather than actual M&A. This allows us to
analyse the desire to merge, which is not necessarily the same as actual mergers due to, for
example, the impact of merger policy. A large merger may be desired and announced by
the acquirer (and target) but the competition authority may not allow this transaction to go
ahead. This instance would, however, still be recorded in the data. The vast majority of
announced mergers is consummated though.
The database allows us to determine the main industry of the acquirer as well as of the
target company. Hence, we can determine whether two firms within the same industry
merge, or whether the merger takes place across industries. The former case is a standard
4 The statistical difference between M&A and FDI explains why the literature on M&A pays more attention to its financial characteristics. However, in the present paper we will ignore the potentially important role of financial variables (see Giovanni, 2005). 5 The analysis excludes minority stake acquisitions, repurchase programs, self-tender offers, recapitalisation, and exchange offers.
7
horizontal merger whereas the latter combines both vertical and conglomerate mergers.
More specifically, horizontal M&A is defined as the activity of M&A that takes place
within the same 4-digit US SIC industry. It is thereby assumed that 4-digit industries
represent homogenous groupings of firms.6 The main motivation to engage in horizontal
cross-border M&A is market access. Non-horizontal mergers are those that take place
across 4-digit industries.7 The main question is to see whether horizontal and non-
horizontal mergers are driven by different factors, and particularly to what extent
horizontal and non-horizontal mergers behave differently in the presence of trade costs.
Table 1 summarises the number of deals and the average value of deals for different types
of mergers over the 1990s. We distinguish between horizontal and non-horizontal
transactions as well as between domestic and cross-border deals. When comparing cross-
border M&A with domestic mergers a number of points can be made. First of all, the
average value of cross-border transactions is substantially higher than that of domestic
merger transactions. This may reflect the higher fixed cost associated with investment
abroad.
Second, both in terms of the number of deals as well as their average value the relative
importance of cross-border mergers in global merger activity is on the increase. The
number of cross-border deals increased by 146% from 1990/1991 to 2000/2001, while the
number of domestic deals increased by 116% over the same period. Also in terms of the
value per merger the importance of cross-border merger activity has increased relative to
domestic M&A. In particular, the average value of cross-border deals has increased by
18% relative to 12% for domestic deals. These findings on the development of the number
6 Classifying horizontal and non-horizontal mergers on the basis of their 4-digit SIC code may in some cases be too restrictive as some 4-digit industries can be very similar. However, classifying mergers using at higher levels of aggregation is likely to contaminate the group of horizontal mergers with non-horizontal mergers. As our main focus is with horizontal mergers we prefer a conservative definition of horizontal M&A. Our measure horizontal M&A may also underestimate the importance of horizontal M&A in the context of multi-product firms. Unfortunately, we do not have any information in the data to satisfactorily resolve this issue. 7 As regards non-horizontal M&As, vertical mergers are mergers that take place across 4-digit industries, and reflect mergers between firms that are related through buyer-supplier links. Conglomerate mergers also take place across 4-digit industries, but are not associated with input-output linkages. In order to distinguish these two types of mergers directly one would need detailed input-output tables for a large number of countries in our data, which we do not have available. However, using the Input-Output table for 1992 for the US, while assuming that these relationships are representative for the OECD as a whole, and combining the IO with bilateral trade data suggests that the actual number of vertical cross-border M&A is very small. This is also confirmed by Gugler et al. (2003) who suggest that most mergers across 4-digit industries are unrelated to input-output linkages.
8
and the value of cross-border deals are in line with the evidence provided by OECD
(2001) and Di Giovanni (2005).8
Third, horizontal M&A accounts for about 42% of total global M&A.9 However, the share
of horizontal mergers in total cross-border M&A is substantially smaller (at 32%) than
that of horizontal mergers in domestic M&A (45%). There may be a number of reasons for
this. On the one hand, the scope for strategic behaviour within one’s own industry may be
limited at the international level as it may be more difficult to acquire market power.
Hence, the possibility of strategic horizontal mergers may be restricted. On the other hand,
non-horizontal mergers may be more frequent in an international context as the potential
gains from diversification are expected to be larger thus encouraging conglomerate
mergers, and more related to the theory on foreign direct investment, factor endowments
and hence prices may differ across countries which makes it interesting to establish
international production networks through vertical mergers (see Markusen, 2002).
Table 2 focuses solely on cross-border mergers, which are the main interest of this paper.
It provides details on the number of deals by broad industrial category. Manufacturing is
the largest acquiring industry, followed by the financial sector. The former is, also, by far
the most important target industry for mergers. More precisely, manufacturing accounts
for approximately 40% of cross-border acquirers and targets. The dominance of
manufacturing in cross-border M&A may be explained by the strong pressure in
developed economies to restructure its manufacturing activities due to increased foreign
competition or technological progress. This dominance provides a justification for
concentrating on manufacturing in the empirical part of this paper. Another reason to
focus on this sector is that manufacturing is a traded sector, whereas other sectors are less
tradable. Hence we would expect the role of trade costs to be most visible in
manufacturing.
Table 3 reports the number of cross-border merger deals by region of origin of acquiring
and target firms. The dataset distinguishes the following regions: Africa/Middle East
8 UN (2000) does not report an apparent increase in the importance of cross-border M&A in total M&A either in terms of the number or their size. This difference results from the different starting point used in the World Investment Report (1987 rather than 1990). Di Giovanni (2005) reports larger total numbers, although the average values are similar to ours. This may be explained by the more restrictive definition of M&A employed in the present paper.
9

(AE), North America (AM), Asia-Pacific (AP), Europe (EU), Japan and South-East Asia
(JP), and supranational (SN).10 From the data it follows that by and large the majority of
M&A activity occurs within the same geographic region. This is in line with the frequent
finding that international investment, whether FDI, portfolio or M&A, decreases with
distance (e.g, Carr et al., 2001, Portes and Rey, 2005; Di Giovanni, 2005). We also find,
however, that a substantial amount of European firms acquire US firms and vice versa.
Finally, it is apparent that most cross-border M&A take place between developed
countries. Roughly, 70% of all cross-border deals involve only Europe and North-
America. This number is likely to be even higher when looking at deal values.
3. A Simple Model of Cross-Border M&A
In this section we develop a simple theoretical model of cross-border M&A in order to
provide a background for our empirical analysis below. The model is based on discrete
choice theory and the dartboard model recently proposed by Head and Ries (2005). We
extend their model by distinguishing between different types of cross-border M&A,
namely horizontal and non-horizontal mergers.
The probability of a cross-border acquisition of a given unit in industry j and country l by
a bidder in industry i and country k is denoted by π. The expected level of bilateral cross-
border M&A, m, is then given by:
jlijklijkl Ym π= (1)
where Y refers to the total number of assets available in industry j and country l. We
assume that the valuation of potential targets is independently and identically distributed
across bidders.11 Everything else equal all bidders have an identical probability of winning
a bid. We further assume that the number of bidders in each industry is proportional to the
size of its industry. In a frictionless world, the probability of a firm in industry j in country
l being acquired by a firm in industry i in country k is given by the share of the number of
bidders in industry i and country k over the total number of bidders in the world.
9 Gugler et el. (2003) provide very similar figures on the importance of horizontal M&A activity. 10 Transactions involving supranational firms are not recorded in the same way as other transactions as such firms have no formal base country. 11 This represents a strong departure from the theoretical M&A literature (Horn and Persson, 2001; Tekin-Koru, 2004) in which the price of the bid is endogenously determined in a bargaining game.
10

∑∑
= ≠
= I
i
K
lkik
ikijkl
Y
Y
1
π (2)
As we are only interested in cross-border M&A in this paper we exclude the possibility of
bidding on a firm in the same country.
In order to take account of transaction costs consider a firm g’s private valuation, v*, of a
potential target, h,
ghghgh Xv εβ +=* (3)
which is a function of observed, X, and unobserved characteristics, ε. The last term is a
random term with Type I Extreme Value distribution with cumulative distribution
function: )]exp(exp[)( εε −−=CDF . The error term refers to the base valuation in a
frictionless world (Head and Ries, 2005).
In a world where frictions are important the valuation of the firm will be dependent on
transaction costs. However, the role of transaction costs on its private valuation depends
on the objective a potential take-over is supposed to fulfil, i.e., whether it is a horizontal or
a non-horizontal cross-border merger. Transaction costs can play a role in different ways.
There may be informational barriers which increase the cost of transaction and thereby
reduce a firm’s private valuation (Portes and Rey, 2005). Though there does not seem any
reason to believe that informational barriers affect horizontal and non-horizontal mergers
differently.
However, transaction costs in the form of trade costs may also affect the relative
attractiveness of alternative modes of entry such as exports and greenfield investment, and
thereby affect the desire to engage in M&A. For the moment, we solely concentrate on the
relationship between trade and M&A, and assume that M&A and greenfield investment
are independent. The latter assumption is admittedly quite restrictive, but allowing for this
interdependence is beyond the scope of this paper. Theoretical contributions emphasising
11
the interdependence of those two modes of entry are provided by Ferret (2003) and Nocke
and Yeaple (2004).
A horizontal merger is typically assumed to be driven by market access considerations as
such mergers may be seen as an alternative to supplying a foreign market through exports.
In the FDI literature it is generally asserted that the incentive for a profit-maximising firm
to engage in a horizontal merger increases in the level of trade costs (Markusen, 2002;
Brainard, 1997).12 However, Horn and Persson (2001) show that this is not necessarily the
case in the presence of pre-emptive domestic mergers when the acquisition price is
determined endogenously in a bargaining process.13
To the extent that mergers across different industries are driven by vertical linkages,
mergers facilitate the development of international production networks and are likely to
complement trade in a way similar to (vertical) greenfield investment (Markusen, 2002).
Trade costs reduce the cost-saving potential of vertical mergers provided by international
factor price differences. However, as stated in the previous section the actual number of
cross-industry mergers driven by input-output linkages is likely to be very small in
practice. The majority of cross-industry mergers are likely to represent conglomerate deals
which cannot be assumed to be related to trade costs in any systematic way.
Thus, we assume that a firm’s private valuation depends on transaction costs, either in the
form of informational barriers or trade costs. However, we only expect a differential effect
of trade costs across horizontal and non-horizontal mergers. A firm will adjust its private
valuation by:
)lnln( 21 klkl τσατα −− (4)
where α1 refers to the impact of transaction costs for non-horizontal mergers, particularly
informational barriers but possibly also trade costs when the merger is motivated by
vertical linkages. The second term represents an interaction term between the share of
12 We would expect the same if the merger were intended for establishing an export platform for exports to third countries, While such an option is not included in the standard theories of vertical and horizontal FDI (e.g., Markusen, 2002), it has recently been analysed by Ekholm et al. (2004). 13 See also Norbäck and Persson (2004) and Tekin-Koru (2004) for related arguments.
12
horizontal mergers over the total number of cross-border mergers, σ, times the level of
bilateral transaction costs, τ. The second term thus gives the differential impact of trade
costs across horizontal and non-horizontal mergers. A priori we would expect this to be
positive under the “tariff jumping” argument, albeit Horn and Persson (2001) argue that
this does not necessarily need to be the case. The total impact of transaction costs on a bid
leading to horizontal M&A (for σ=1) is given by -α1+α2.
In order to operationalise the model we utilise the insights of MacFadden (1974), who
demonstrated that the probability that a target will yield an investor the highest profits
within its choice set is given by the logit expression:14
∑∑
= ≠
−−
−−I
i
K
lkkl
kl
121
21
]ln)(exp[
]ln)(exp[
τσαα
τσαα (5)
Since all bidders have an equal probability of procuring the bid the aggregate probability
of any firm in industry i of country k taking over the firm in industry j in country l as:
∑∑
=
−
≠
−
= I
ikl
K
lkik
klikijkl
Y
Y
1
)(
)(
21
21
/
/σαα
σαα
τ
τπ if akl >+−− ετσαα ln)( 21 (6)
For a cross-border merger to actually occur the highest bid needs to be profitable:
akl >+−− ετσαα ln)( 21 which states that the winning bid should exceed the level of
expected additional earnings, a. In the present model the presence of transactions costs
explains why it is possible to observe no cross-border merger activity across two
industries.
The expected number of bilateral cross-border M&A is then given by substituting (6) in
equation (1):
14 Strictly speaking this is only true if, and only if, ε, is distributed as a Type I Extreme Value independent random variable.
13
)( 21 σαατ
ρ−=
kl
jliklijkl
YYm (7)
where . Head and Ries (2005) label ρ the bid potential, which
is essentially an index of proximity of bidding teams for a given unit in industry j and
country l. This measure corresponds to the measure of remoteness sometimes used in the
trade and geography literature when we assume that
)//(11
)( 21∑∑=
−
≠
=I
ikl
K
lkikl Y σαατρ
121 =− σαα (Helliwell, 1998).
4. Empirical Methodology
Having established in a simple theoretical set-up that trade costs may affect horizontal and
non-horizontal mergers in different ways, we now present the empirical model, describe
the variables and the data sources used for the analysis, and discuss the econometric
methodology.
Empirical Model and Data
Given the multiplicative nature we log-linearise equation (7) to obtain the following
estimable model of cross-border mergers (m) of acquirers in industry i in country k with
target in industry j in country l at time t:15
ijklttlkltkltjltiktijklt DYYm ερατσαταααα ++++−++= lnlnlnlnlnln 543210 (8)
where Y is the economic size of the industry in each country (measured in terms of value-
added obtained from OECD STAN database), ρ is an indicator of bid potential for country
l, τ is a proxy for transaction costs and τσ ln the interaction term between the share of
horizontal mergers over total mergers and transaction costs. In addition, we also include a
full set of time dummies D in order to control for global macro-economic influences and
asset market bubbles. Initially, we use distance, δ, as a measure of transaction costs.
15 This effectively represents a standard gravity model applied to cross-border M&A. Gravity models have had a long history in the empirical analysis of trade flows and, more recently, have also become popular in the analysis of foreign direct investment flows (e.g., Carr et al., 2001), equity capital flows (Portes and Rey, 2005) and M&A activity (e.g., Di Giovanni, 2005). While gravity models based on general equilibrium theory (Carr et al., 2001) are conducted at the country level, the present analysis essentially adopts a partial equilibrium approach as it is conducted at the industry level.
14
Subsequently, we extend the analysis by adding bilateral data on the level of applied
protection between country k and l in industry i,τ .16
In a trade context distance has been interpreted as a measure of trade costs consisting of
both trade restrictions and transportation costs. Recently, Portes and Rey (2005) show
using data on bilateral telephone traffic that informational barriers are important in
determining cross-country capital flows. Consequently, assuming that informational
barriers to investment increase in distance, it may also proxy for informational barriers. As
noted before, there seems no reason to assume that informational barriers affect horizontal
and non-horizontal mergers differently. However, distance may also proxy for trade costs.
Thus, while the impact of distance for the volume of trade and non-horizontal mergers is
unambiguously negative, its impact on horizontal M&A is ex ante unclear. Data on
distance are obtained from CEPII.
Apart from distance, we also include a variable as a proxy for the bid potential for the
target country. This variable can also be interpreted as a measure of remoteness
(Helliwell, 1998; Head, 2003). Remoteness captures the set of alternative locations from
which a country may import. The availability of nearby alternatives is important as it
reduces its dependence on a particular closely located exporting country. For instance the
amount of trade between Australia and New Zealand is likely to be much larger than that
between two countries in continental Europe with similar sizes and distance.
Consequently, ignoring this source of heterogeneity may bias estimates for distance, one
of our key variable of interest.
Following the theoretical model, the bid potential is defined analogously to remoteness in
Head (2003) as . Rather than using output-weighted trade costs we
use the inverse of the trade costs-weighted industry size which drives the size of far away
countries to insignificance. Generally, we would expect that the higher the bilateral trade
costs between target country l and potential investing countries k compared to that
between country l and country m, the higher will be the probability that a firm in country
∑∑= ≠
=I
ikl
K
lkikl Y
1)//(1 τρ
16 We do not include bilateral country-partner fixed effects in the estimation. This is mainly because we are interested in the coefficient on distance, which is a country-partner time invariant variable and would not be
15
m will make an acquisition in country l. As we implicitly assumed here that 121 =− σαα
we also experiment with interacting the share of horizontal mergers with the bid potential
as our model suggests that the role of bid potential varies with the type of merger.
Specifically, we expect the impact of the bid potential to be more positive for non-
horizontal than for horizontal M&A.
Finally, we extend the basic gravity model to see to what extent policy affects cross-
border M&A through its impact on trade costs. The most obvious way to address this
question is by including trade policy variables in the form of tariffs. More specifically, we
use bilateral tariff at the sectoral level to measure the tariff rate to which exports of good i
from country k to country l are subjected. Adding tariffs as an explicit proxy for trade
costs allows one to assess to what extent the differential effect of distance on horizontal
and non-horizontal mergers is indeed driven by the presumed interdependence of trade and
horizontal M&A. In order to assess to what extent non-horizontal mergers are associated
with re-exports back home we also include a tariff variable to measure the level of
protection on good i from country l to country k.
Data on the bilateral level of applied protection are obtained from a new dataset called
Market Access Map (MAcMap), developed jointly by ITC (UNCTAD-WTO, Geneva) and
CEPII (Paris).17 It provides detailed information on highly disaggregated bilateral applied
tariff duties. The tariff data represent equivalent ad valorem tariffs taking into account ad
valorem and non ad valorem tariffs, quotas, antidumping measures and preferential trade
agreements. For a detailed description of this dataset see Bouët et al. (2004). As these data
are only available for the year 2000 we assume that the level of protection is constant
throughout the sample period.
We estimate the model using data for 23 OECD countries and 19 manufacturing industries
for the period 1990-2001. In order to enhance the manageability of the dataset we use 2-
year averages except for the last year. This gives us 23 source countries * 22 target
estimated if fixed effects were included. To the extent that country-partner effects are important, they should be captured by the distance variable. 17 The MAcMap database differs from the TRAINS database provided by UNCTAD by its more comprehensive treatment of preferential trade agreements and by proposing ad valorem equivalent calculations. It thus provides a unique resource that is well equipped to the analysis of applied protection at the disaggregated level.
16
countries * 19 source industries * 19 target industries * 6 periods = 1,095,996
observations. The actual number of observations in the dataset is somewhat smaller due to
the presence of missing values in the OECD STAN data. In order to analyse the impact of
the right-hand side variables on different types of cross-border mergers we interact them
with the share of horizontal mergers in total mergers.18
Econometric Issues
The data provide us with information on both the number and the value of the merger
deals. The choice of dependent variable depends on the specific context and has important
implications for the estimation procedure. The value of the deal reflects the economic
importance of cross-border M&A. This would therefore be the most appropriate measure
of M&A activity from a policy perspective. Using deal values as the dependent variable
also allows one to compare the results with those obtained from trade flows. Di Giovanni
(2005) uses deal values. However, if one is interested in specific firm decisions such as the
choice to invest or not to invest, or alternatively, in the choice of location, the number of
transactions may be more interesting. Bertrand et al. (2004) study the locational choice of
multinationals using the number of transactions. Using the number of transactions further
provides a useful robustness check as the count data are not obscured by mega-deals. In
the present paper we use both definitions of the dependent variable, namely, the number of
deals as well as the total value of deals alternatively.19
A key issue one needs to address irrespective of the definition of the dependent variable is
how to account for the presence of zero observations. Whilst the full sample used for
econometric analysis consists of more than half a million observations the majority of
those are zero. In fact, the proportion of zero observations is much larger than in previous
studies since the current analysis is conducted at the industry level. It, thereby, accounts
for merger deals across industries as well as within industries and, hence, enlarges
dramatically the number of possible cells compared to standard cross-country analyses of
investment flows and industry/country level studies of trade flows. Still, the issue of zeros
18 As mergers are classified at the 4-digit level but the analysis is carried out at the 2-digit level the share varies between zero and unity for observations within the same 2-digit industry and always equals zero for observations across different industries. 19 Note that for a number of transactions the deal value is missing in the dataset. In these instances the transactions were removed from the sample. Similar to Di Giovanni (2005) we assume that missing values are randomly distributed.
17
comes up in all gravity studies albeit often less pronounced. Nevertheless, the issue
appears to have been ignored in most studies.
In the majority of cases zero observations are not related to data availability, but reflect the
optimal choice of profit maximising firms. Zero cross-border investment may be optimal
for example in the presence of fixed cost to international investment (Razin et al., 2004).
The zero observations can therefore be considered corner solution outcomes and should be
addressed in what Wooldridge (2002) appropriately terms corner solution models, a subset
of censored regression models.
Linear estimation procedures such as OLS are problematic in this setting, because zero
cross-border investment has a positive probability, but can be considered a continuous
random variable for strictly positive values. A linear model would produce biased
estimates underestimating the coefficients for strictly positive values and predicting
negative values for observations where actual investment is zero.20 Non-linear models
equally suffer a number of drawbacks (see Wooldridge, 2002). The approach used to
control for such censored observations depends on whether M&A activity is specified in
terms of its value or the number of transactions. We first discuss the issue in the context of
the value of M&A and subsequently turn to the issue when using the number of
transactions.
Recently, a number of papers that look at the value of trade or cross-border capital flows
have explicitly taken account of zero observations. Di Giovanni (2005) and Felbermayr
and Kohler (2004) use Tobit estimations to allow for the presence of the limited dependent
variable. The paper by Felbermayr and Kohler (2004) is particularly interesting in that it
explicitly adopts the corner solution model as described in Wooldridge (2002) while
embedding it in a compelling theoretical structure. In our analysis we follow this approach
and use a Tobit model when using the logarithmic value of the merger as the dependent
variable.
20 It can be shown that using a simple OLS on only the positive observations leads to biased results, as the conditional expectation of y on x, given that y > 0, E[Y|X,Y > 0] = β'X + σf(β'X/σ)/F(β'X/σ), where F and f are the distribution function and the density, respectively, of the standard normal distribution.
18
The Tobit model allows cross-border M&A to be zero with positive probability and the
conditional expectation of M&A to be non-linear for positive values of M&A.
Specifically, the estimation considers the following latent variable model:
y* = β’X+u where u|X~N(0, σ2) (9)
where y*, in our case is the latent value of M&A conditional on the covariates X that
would be optimal in the absence of any binding constraints. In reality, profit maximisation
leads to either positive M&A, y*>0, or no M&A, y=0, which can be summarised by:
(10) *),0max( yy =
In order to evaluate the magnitude of the estimated coefficients one has to calculate the
partial effects (signs remain the same).21
In a locational choice model with the number of deals as the dependent variable (not in
logs) the Tobit model is no longer appropriate. While it appears to be a reasonable
assumption to treat the value of deals as a continuous variable (and hence employ Tobit
estimation) this is arguably not the case for the number of deals. Standard OLS (or Tobit)
would produce biased estimates unless the mean counts are very large. Given that the
dependent variable, the number of deals, is a non-negative integer we employ count model
techniques.22
In the Poisson model one assumes that the variable is generated by a Poisson distribution
of the form
21 In order to deal with the fact that the log of zero is not defined we use ln(v+1) as the dependent variable in the Tobit estimations where v is the value of cross-border merger activity. 22 Most research that focuses on the locational choice of multinationals has typically adopted the conditional logit model. This model is attractive as it is directly derived from the profit maximisation problem faced by investing firms based on McFadden (1974). However, estimating the model with a large choice set as in the present case becomes very cumbersome. Previous research has dealt with this issue either by selecting a random sample for the large choice set, or by ignoring all zero-observations. Guimaraes et al. (2003) show that under certain circumstances the count model is equivalent to the conditional logit. However, in contrast to the conditional logit model, count models can deal with large choice sets. Given this insight, Guimaraes et al. succinctly state that: “Thus, many previous studies, (…), would have benefited if they had considered the Poisson regression as an alternative to the conditional logit model”.
19
( ) !)Pr( fjt
nfjt nen
fjt μμ −= (11)
where μ is the conditional mean of the distribution. It is then assumed that the expected
value of n, μ, is log linearly dependent on some explanatory variables. Parameter
estimates of these variables can be obtained using maximum likelihood techniques. The
Poisson model imposes the restriction that the conditional mean of the dependent variable
equals its variance. If it is found that this restriction does not hold in the data, one may
employ a negative binomial distribution, which allows for overdispersion in the data, i.e.,
the variance of the dependent variable is allowed to exceed the mean. In our econometric
analysis we test the validity of this restriction.
The simple Poisson and Negative Binomial models assume that there is no separate
process for generating zero and non-zero counts. If, however, there were a separate
underlying model for industries for which we did not observe any merger activity, then a
zero-inflated Poisson model (ZIP) would be more appropriate.23 The ZIP model has
essentially a two stage interpretation. In the first stage, the probability of the outcome
variable being zero is estimated conditional on a vector of observable covariates X. The
second stage constitutes a truncated count model for the positive realisations (i.e., the
outcome is conditional on being non-zero) conditional on observables Z. If the restriction
of mean-variance equivalence is rejected one can resort to the negative binomial ZIP
model (ZINB), which allows for overdispersion. As there are a priori no strong reasons to
expect different variables to explain the decision not to undertake M&As (i.e., first step),
we use the same vector of variables for X and Z in our estimation (Girma, 2002). We do,
however, not include any interaction terms in the first stage.
5. Results
Table 4 presents the results of the baseline gravity equation as specified in equation (8),
excluding for the moment the tariff variables. In the first column we estimate this model
with exports of good i from country k to country l in order to see whether our model and
the data produce results that are in line with the literature. Reassuringly, they do. We find
that market size in the home and partner country is positively associated with total exports,
23 See Cameron and Trivedi (1998) for descriptions of ZIP models. See also Girma (2002) and List (2001) for application of ZIP models in the context of location of FDI.
20

while distance has a negative impact. Also, the remoteness indicator is positively related
to exports. These results are as expected from standard gravity models.
We then re-estimate the model on the data for cross-border mergers, using the deal value
as the dependent variable. Column (2) reports results for total bilateral merger activity.
Results are similar to the trade model, with mergers increasing in market size and
remoteness (which, in the case of mergers, is a proxy for the bid potential) but decreasing
with distance between the home and partner country. Assuming that distance is an
appropriate measure of trade costs, this result thus points against the “tariff jumping”
hypothesis for aggregate merger activity.
In column (3) we allow the coefficient on the distance variable to differ between
horizontal and non-horizontal mergers by including an interaction term defined as the
share of horizontal mergers in total merger activity. This shows that the coefficients do
indeed differ for horizontal and non-horizontal mergers; the effect of distance is less
important the higher the share of horizontal mergers. Columns (4) and (5) provide
alternative specifications varying the number of interaction terms as a robustness check.
The results in column (5) show that all interaction terms (with the exception of acquisition
country market size) are statistically significant and, hence, including them improves the
model.
The average effect of distance on cross-border M&A is now given by the coefficient of
distance plus the coefficient on the interaction term times the share of horizontal mergers
in total mergers. The average value for the share of horizontal mergers is 0.32. The
average effect of distance in columns (3) to (5) ranges from 0.05 to -0.02 depending on
whether one includes the full set of interaction terms or not. Alternatively, one may
calculate the critical value of HMA at which the marginal effect of distance switches
signs. If the share of horizontal mergers in total mergers exceeds 0.21 (0.105/0.497) or
0.44 (0.087/0.197) in columns (3) and (5) respectively, then the impact of distance on
bilateral merger activity will be positive. Conversely, for shares lower than the critical
value the impact of distance will negative. The percentage of observations where the share
of horizontal mergers exceeds the critical value of 0.21 is 32.4% and 29.5% for a critical
value 0.44.
21
While a negative effect of distance on cross-border capital flows has been found in most
previous work (see for example, Carr et al., 2001; Portes and Rey, 2005; Di Giovanni,
2005), those studies are all conducted at the country level. Using our sectoral data we
show that the effect of distance differs between different types of merger activity. More
particularly, while the estimated average effect of distance is negative it is positive for
horizontal mergers alone. Assuming that distance is a proxy for barriers to trade, this is in
line with the theoretical expectations of a tariff-jumping motive for horizontal mergers.24
Given that the database provides information not only on the total value of cross-border
mergers but also on the number of deals an interesting extension to the analysis is to
investigate whether there are differences in the determinants of the number as opposed to
the total logarithmic value of deals. We therefore change the analysis towards the issue of
locational choice. We re-estimate equation (8) with the number of deals as the dependent
variable using different count models. A likelihood-ratio test for the restriction that the
conditional mean of the dependent variable equals its variance rejects this assumption and
points at over-dispersion for all estimations. Hence, we report the negative binomial
results rather than the standard Poisson estimates. Furthermore, employing a test due to
Vuong (1989) we find that a zero-inflated model better captures the underlying decision
process. In our discussion we, therefore, focus on the results from the zero-inflated
negative binomial estimations, which are reported in columns (5) to (8) of Table 5.
Columns (5) to (8) show that the results for total merger activity are qualitatively similar
to the results obtained from the Tobit regressions above. The only significant differences
are the statistically insignificant coefficient on Yk in column (5), and the insignificance of
the interaction terms in column (8). Hence, we prefer the models in columns (6) and (7)
which only interact the share of horizontal mergers with distance and remoteness.
Allowing for different coefficients on the distance and remoteness variables for the two
types of merger activities shows again statistically significant differences. This therefore
provides a further robustness check to the Tobit regressions.
24 This is in contrast to the evidence provided by Tekin-Koru (2004), who uses firm level data on total merger activity and does not distinguish between horizontal and non-horizontal activities. Note that in the aggregate our results, like those by Tekin-Koru, point against the tariff-jumping argument. The present finding that the effect of distance is increasing in the share of horizontal mergers however is inconsistent
22
6. Cross-border M&A and Trade Policy
Above we assumed that the differential impact of distance and remoteness across different
types of merges results from the interdependence between trade and cross-border M&A.
We now re-examine the issue using industry level data on the bilateral level of applied
protection. More precisely, we use a new dataset, which converts different types of tariffs,
quotas, antidumping measures and preferential trade agreements into a single equivalent
ad valorem tariff. As these data are only available for the year 2000 we assume that tariffs
are, like distance, constant across time. 25
Looking at trade policy indicators allows one to verify to what extent the reasoning that
distance and remoteness proxy for trade barriers is indeed plausible as the trade policy
variables included here refer explicitly to international trade and in principle have no
bearing on international investment as long as investment abroad is independent of
international trade. However, if trade and investment are interdependent changes in the
trade policy stance may not only affect the pattern of trade but also the level and
composition of inward investment. If this were indeed the case this may have to be taken
into account by policy makers, given the importance that has been attached in the past to
attracting foreign multinationals in the hope that these will stimulate jobs and/or generate
productivity spillovers.
The estimations are thus extended by including the bilateral ad valorem equivalent tariff
applicable to exports of good i from country k to country l. The results are reported in
Table 6 using the Tobit model only. We start again with estimating the impact of trade
policy on exports to check whether our results are plausible in the context of a standard
gravity model of trade (column 1). As one can see from the table both distance and tariffs
have a negative effect on exports, as would be expected. Interestingly, when comparing
the coefficient on distance with that in Table 4 we observe that adding explicit information
on the level of bilateral protection reduces the impact of distance on exports from -0.9 to -
0.6 thereby suggesting that distance proxies to some extent for bilateral protection in
addition to transportation and information costs.
with the theoretical prediction by Tekin-Koru and others of a negative relationship due to the impact of distance on the acquisition price. 25 The results remain qualitatively the same once one uses period averages.
23

We then turn to the effect of trade policy on cross-border merger activity. Column (2)
shows that trade barriers negatively affect total M&As. However, allowing for different
coefficients of trade policy for horizontal and non-horizontal mergers again highlights the
heterogeneity between these two groups. From column (3) we find a negative coefficient
on the term interacting the share of horizontal M&As and tariffs, which is perhaps
unexpected. In principle, this would suggest that while protection tends to reduce cross-
border merger activity in general the impact of protection would affect horizontal M&A
by less than non-horizontal M&A.
However, note that in this regression distance is also statistically insignificant, perhaps
reflecting the fact that the effect of distance on M&As mainly reflects trade costs, which
are now better captured with the tariff variable.26 Dropping distance from the estimations
shows that we then obtain a negative sign on tariffs, and a positive sign on the interaction
term for tariffs and horizontal M&As. This suggests that the impact of trade costs on
cross-border M&A is less negative or even positive the higher the share of horizontal
mergers in total mergers. This is in line with the argument emphasised throughout this
paper that cross-border M&A in the same industries tend to substitute for exports. Indeed,
we may interpret this as evidence in support of the tariff-jumping argument set out by
Brainard (1997).
The tariff variable, as pointed out above, captures the tax equivalent of applied protection
on exports from the acquisition to the target country. We argued above that this cost
provides a rationale for exporting firms to look for takeover targets abroad. We did not
however say much about the possible relationship between tariffs and non-horizontal
merges even though it seems not unlikely that at least some part of non-horizontal M&A
represents vertical mergers. These are likely not only to be more negatively affected by
taxes on its exports but also on changes in the costs of re-exports from the target to the
acquisition country. We now address this issue in more detail.
Instead of relying on direct information on trade patterns and input-output linkages, which
suggests that vertical mergers are relatively unimportant, including ad valorem equivalent
26 The pairwise correlation between the log of distance and the tariff on exports from the acquisition to the target country equals 0.37.
24

tariffs on imports from to the target to the acquisition provides an indirect method to infer
to what extent the vertical motive is likely to play an important role in explaining non-
horizontal mergers. We thus proceed by including a measure of the level of applied
protection on exports from country l to country k in the estimation. As can be seen from
columns (6) and (7), this variable is also negatively related with total M&A activity. This
negative effect is again less for industries with higher levels of horizontal mergers, as
indicated by the positive sign on the interaction term. In contrast to the direct estimates on
the importance of vertical mergers in total merger activity, the indirect estimates based on
regression analysis obtained here suggest that the share of vertical mergers in non-
horizontal mergers may be substantial.
7. Conclusions
This paper analyses in detail the role of trade costs on bilateral cross-border M&As for 23
OECD countries over 1990-2001 using industry level data on merger activity and a new
data source on with detailed information on the bilateral level of applied protection. In the
aggregate, distance and tariff barriers have negative effects on cross-border M&A. An
important finding of our paper is that the effect of distance and trade costs differs
depending on whether mergers are horizontal (i.e., with acquirer and target in the same
industry) or whether they span different industries. This suggests that results based on
aggregate data which do not distinguish these types neglect an important source of
heterogeneity. The less negative effect on horizontal mergers provides support to the tariff
jumping argument put forward in the literature on the determinants of horizontal FDI.
Our findings have important policy implications. The main findings in the paper that
cross-border M&A respond negatively to trade costs in the aggregate and that the share of
horizontal M&A increases in the level of trade costs provide an additional rational for free
trade. To the extent that horizontal mergers are less likely to be associated with
productivity spillovers and more likely with anticompetitive behaviour up freeing up trade
not only increases the level of inward investment but also its composition in a way that is
likely to benefit the economy. The trade regime might thus have important implications
for attracting inward investment in terms of M&As, an issue that should be recognised by
governments wishing to attract foreign investment in order to benefit from technology and
spillovers.
25
References Anderson, J. and E. Van Wincoop (2004), “Trade Costs”, Journal of Economic Literature, forthcoming. Bertrand, O., J. Mucchielli and H. Zitouna (2004), "Location Choices of Multinational Firms: The Case of Mergers and Acquisitions", HWWA Discussion Paper 274. Bouët, A., Y. Decreux, L. Fontagé, S. Jean and D. Laborde (2004), “A Consitent, ad valeorem equivalent measure of applied protection across the world: The MAcMap-HS6 database”, CEPII Working Paper, No. 22. Brainard, S. L. (1997), “An Empirical Assessment of the Proximity-Concentration Trade-Off Between Multinational Sales and Trade”, American Economic Review, 87, pp. 520-545, Cameron, A.C. and P.K. Trivedi (1998), Regression Analysis of Count Data, Cambridge: Cambridge University Press. Carr, D.L., J.R. Markusen and K.E. Maskus (2001), Estimating the knowledge-capital model of the multinational enterprise, American Economic Review, 91, pp. 693-708. Di Giovanni, J. (2005), “What drives capital flows? The case of cross-border M&A activity and financial deepening”, Journal of International Economics, 65, pp. 127-149. Ekholm, K., R. Forslid and J. Markusen (2004), “Export Platform Foreign Direct Investment”, NBER Working Paper, No. 9517. Felbermayr, G.J. and W. Kohler (2004), “Exploring the Intensive and Extensive Margins of World Trade”, CESIfo Working Paper. Ferrett, B. (2003), “Greenfield Investment versus Acquisition: Positive Analysis”, GEP Research Paper 03/02, University of Nottingham Girma, S. (2002), “The process of European integration and the determinants of entry by non-EU multinationals in UK manufacturing”, The Manchester School, 71, pp. 315-335. Gugler, K., D. C. Mueller, B. B. Yurtoglu and C. Zulehner (2003), “The Effects of Mergers: An International Comparison”, International Journal of Industrial Organization, 21, pp. 625-653. Guimaraes, P. O. Figueirdo, and D. Woodward (2003), “A Tractable Approach to the Firm Location Problem”, Review of Economics and Statistics, 85, pp. 201-204. Head, K. (2003), “Gravity for Beginners”, UBC Working Paper Head, K. and J. Ries (2005), "Judging Japan's FDI: The Verdict from a Dartboard Model," Journal of the Japanese and International Economies, forthcoming 2005.
26

Helliwell, J.F. (1998), How Much Do National Borders Matter?, Washington D.C.: Brookings Institution. Horn, H. and L. Persson (2001), “The Equilibrium Ownership of an International Oligopoly”, Journal of International Economics, 53, pp. 307-333. List, J.A. (2001), “US Country Level Determinants of Inbound FDI: Evidence from a two step modified count data model”, International Journal of Industrial Organization, 19, pp. 953-973. Manchin, M. (2004), “Determinants of European cross-border mergers and acquisitions”, European Commission, European Economy Economic Papers, No. 212. Markusen, J.R., Multinational firms and the theory of international trade, MIT Press, 2002 Martin, P. and H. Rey (2005), “Financial super-markets: Size matters for asset trade”, Journal of International Economics, forthcoming. McFadden, D.L. (1974), “Conditional Logit Analysis of Qualitative Choice Analysis”, in P. Zarembka (ed.), Frontiers in Econometrics, New York: Academic Press, pp. 105-142. Nocke, V. and S. Yeaple (2004), “An assignment theory of foreign direct investment”, NBER Working Paper 11003. Norbäck, P.J. and L. Persson (2004), “Privatization and foreign competition”, Journal of International Economics, Vol. 62, pp. 409-416. OECD (2001), New Patterns of Industrial Globalisation, Cross-border Mergers and Acquisitions and Strategic Alliances. Portes, R. and H. Rey (2005), “The determinants of cross-border equity flows”, Journal of International Economics, Vol. 65, pp. 269-296. Portes, R., H. Rey and Y. Oh (2001), “Information and capital flows: the determinants of transactions in financial assets”, European Economic Review, 45, 783-796. Razin, A., Y. Rubinstein, and E. Sadka (2003), “Which countries export FDI, and how much?”, NBER Working Paper, No. 10145. Tekin Koru, A. (2004), “Is FDI indeed tariff-jumping? Firm level evidence”, mimeo, University of Oregon. UNCTAD (2000), “Cross-border Mergers and Acquisitions and Development”, World Investment Report, Geneva: United Nations. UNCTAD (2001), “Promoting Linkages”, World Investment Report 2001, Geneva: United Nations.
27

Vuong, Q.H. (1989), “Likelihood ratio tests for model selection and non-nested hypotheses”, Econometrica, Vol. 57, pp. 307-333.
28

Table 1: Summary statistics M&A, 1990-2001
Domestic M&A Cross-border M&A All
Non-Hor Horizontal Total
Non-Hor Horizontal Total Non-Hor Horizontal Total
Number of deals
1990/1991 55.36% 44.64% 6,281 70.15% 29.85% 2,161 59.14% 40.86% 8,442 1992/1993 58.01% 41.99% 7,575 69.24% 30.76% 2,123 60.47% 39.53% 9,698 1994/1995 53.58% 46.42% 10,245 68.16% 31.84% 2,921 56.81% 43.19% 13,166 1996/1997 53.73% 46.27% 13,760 66.82% 33.18% 3,668 56.48% 43.52% 17,428 1998/1999 53.19% 46.81% 17,586 67.91% 32.09% 5,042 56.47% 43.53% 22,628 2000/2001 59.46% 40.54% 13,557 68.75% 31.25% 5,319 62.08% 37.92% 18,876 Total 55.31% 44.69% 69,004 68.33% 31.67% 21,234 58.38% 41.62% 90,238
Average deal value (mln $) 1990/1991 50.95 41.04 46.53 61.37 54.49 59.32 54.11 43.56 49.80 1992/1993 40.45 38.82 39.76 48.71 44.05 47.27 42.52 39.71 41.41 1994/1995 38.71 44.19 41.25 45.92 49.09 46.93 40.63 44.99 42.51 1996/1997 49.35 55.10 52.01 59.35 63.83 60.83 51.84 56.50 53.87 1998/1999 51.45 52.55 51.96 64.67 70.70 66.60 54.99 55.53 55.23 2000/2001 48.66 57.62 52.29 69.80 71.33 70.28 55.26 60.80 57.36 Total 47.31 50.23 48.61 60.53 62.48 61.15 50.95 52.42 51.56
Table 2: Summary Statistics M&A by Acquirer and Target Industry, 1990-2001
Acquirer\Target Agr. & Mining
Man. Trans. Wholes. Finance Other services
Health & Edu.
Total
1205 194 79 61 53 46 34 1672 Agriculture &
Mining Manufacturing 269 6597 180 636 162 412 178 8434
64 150 1246 50 43 176 31 1760 Transportation & Public Util. Wholesale 48 346 49 831 42 107 20 1443
233 859 309 248 2260 499 108 4516 Finance, Ins. & Estate Other services 46 232 107 146 108 1931 136 2706
47 142 27 36 27 87 277 643 Health & Education Total 1909 8514 2005 2009 2695 3258 784 21174
Government sector excluded.
29

Table 3: Summary Statistics Cross-Border M&A by Region, 1990-2001
AE AM AP EU JP SN Total Acquirer\Target AE 170 131 71 144 516 AM 209 4,054 814 2,337 68 2 7,484 AP 65 377 2,083 325 29 2,879 EU 237 2,398 729 6,363 44 2 9,773 JP 3 243 165 135 21 567 SN 1 1 8 5 15 Total 685 7,204 3,870 9,309 162 4 21,234
30
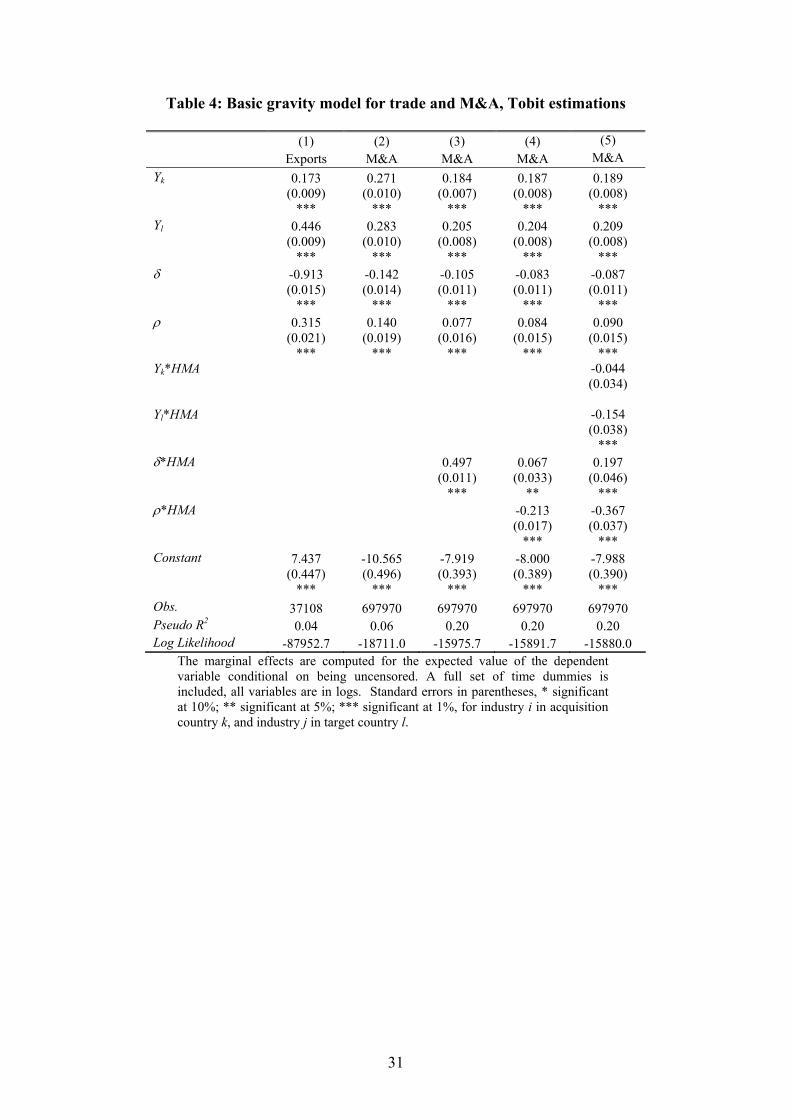
Table 4: Basic gravity model for trade and M&A, Tobit estimations
(1) (2) (3) (4) (5) Exports M&A M&A M&A M&A Yk 0.173 0.271 0.184 0.187 0.189
(0.009) ***
(0.010) ***
(0.007) ***
(0.008) ***
(0.008) ***
Yl 0.446 0.283 0.205 0.204 0.209
(0.009) ***
(0.010) ***
(0.008) ***
(0.008) ***
(0.008) ***
δ -0.913 -0.142 -0.105 -0.083 -0.087
(0.015) ***
(0.014) ***
(0.011) ***
(0.011) ***
(0.011) ***
ρ 0.315 0.140 0.077 0.084 0.090
(0.021) ***
(0.019) ***
(0.016) ***
(0.015) ***
(0.015) ***
Yk*HMA -0.044
(0.034)
Yl*HMA -0.154
(0.038)
*** δ*HMA 0.497 0.067 0.197
(0.011)
*** (0.033)
** (0.046)
*** ρ*HMA -0.213 -0.367
(0.017)
*** (0.037)
*** Constant 7.437 -10.565 -7.919 -8.000 -7.988
(0.447) ***
(0.496) ***
(0.393) ***
(0.389) ***
(0.390) ***
Obs. 37108 697970 697970 697970 697970 Pseudo R2 0.04 0.06 0.20 0.20 0.20 Log Likelihood -87952.7 -18711.0 -15975.7 -15891.7 -15880.0
The marginal effects are computed for the expected value of the dependent variable conditional on being uncensored. A full set of time dummies is included, all variables are in logs. Standard errors in parentheses, * significant at 10%; ** significant at 5%; *** significant at 1%, for industry i in acquisition country k, and industry j in target country l.
31

Table 5: Estimating the number of mergers, count data models
Negative binomial Zero-inflated negative binomial (1) (2) (3) (4) (5) (6) (7) (8) Yk 0.580 0.494 0.504 0.502 -0.041 0.325 0.318 0.315
(0.018)
*** (0.016)
*** (0.016)
*** (0.017)
*** (0.044)
(0.026)
*** (0.027)
*** (0.027)
*** Yl 0.603 0.558 0.563 0.558 0.606 0.570 0.582 0.576
(0.018)
*** (0.016)
*** (0.016)
*** (0.017)
*** (0.029)
*** (0.020)
*** (0.020)
*** (0.021)
*** δ -0.263 -0.170 -0.138 -0.136 -0.180 -0.143 -0.094 -0.089
(0.027)
*** (0.026)
*** (0.027)
*** (0.027)
*** (0.036)
*** (0.028)
*** (0.029)
*** (0.029)
*** ρ 0.208 0.147 0.150 0.147 0.986 0.449 0.500 0.490
(0.036)
*** (0.035)
*** (0.035)
*** (0.035)
*** (0.061)
*** (0.051)
*** (0.051)
*** (0.052)
*** Yk*HMA -0.003 0.049
(0.094)
(0.091)
Yl*HMA 0.167 0.092
(0.108)
(0.104)
δ*HMA 1.077 0.487 0.390 1.035 0.267 0.174
(0.023)
*** (0.101)
*** (0.133)
*** (0.023)
*** (0.098)
*** (0.127)
ρ*HMA -0.268 -0.138 -0.345 -0.239
(0.047)
*** (0.100)
(0.046)
*** (0.098)
** Constant -20.352 -20.210 -20.654 -20.593 2.551 -12.793 -12.453 -12.495
(0.855)
*** (0.823)
*** (0.817)
*** (0.824)
*** (1.630)
(1.172)
*** (1.170)
*** (1.173)
*** Obs. 699718 699718 699718 699718 699718 699718 699718 699718 Pseudo R2 0.08 0.23 0.23 0.23 Log Likelihood
-14049
-11865
-11849
-11848
-13837
-11790
-11762
-11762
LR-test α=0:
4642.64 [0.000]
2062.33 [0.000]
1596.60 [0.000]
1348.29 [0.000]
Vuong 9.78 6.84 5.17 4.73 A full set of time dummies is included, all variables are in logs. Standard errors in parentheses, * significant at 10%; ** significant at 5%; *** significant at 1%, for industry i in acquisition country k, and industry j in target country l.
32
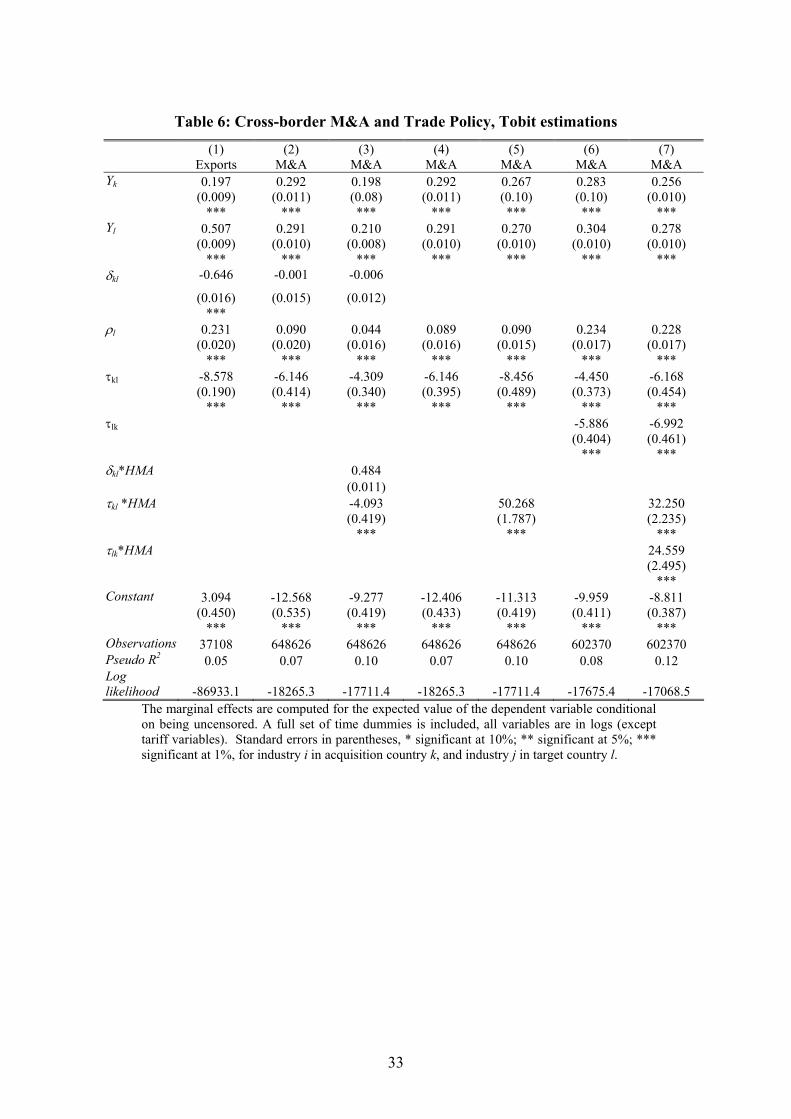
Table 6: Cross-border M&A and Trade Policy, Tobit estimations
(1) Exports
(2) M&A
(3) M&A
(4) M&A
(5) M&A
(6) M&A
(7) M&A
Yk 0.197 0.292 0.198 0.292 0.267 0.283 0.256 (0.009)
*** (0.011)
*** (0.08) ***
(0.011) ***
(0.10) ***
(0.10) ***
(0.010) ***
Yl 0.507 0.291 0.210 0.291 0.270 0.304 0.278 (0.009)
*** (0.010)
*** (0.008)
*** (0.010)
*** (0.010)
*** (0.010)
*** (0.010)
*** δkl -0.646 -0.001 -0.006
(0.016) ***
(0.015) (0.012)
ρl 0.231 0.090 0.044 0.089 0.090 0.234 0.228 (0.020)
*** (0.020)
*** (0.016)
*** (0.016)
*** (0.015)
*** (0.017)
*** (0.017)
*** τkl -8.578 -6.146 -4.309 -6.146 -8.456 -4.450 -6.168
(0.190) ***
(0.414) ***
(0.340) ***
(0.395) ***
(0.489) ***
(0.373) ***
(0.454) ***
τlk -5.886 -6.992
(0.404)
*** (0.461)
*** δkl*HMA 0.484 (0.011) τkl *HMA -4.093 50.268 32.250
(0.419) ***
(1.787) ***
(2.235) ***
τlk*HMA 24.559
(2.495)
*** Constant 3.094 -12.568 -9.277 -12.406 -11.313 -9.959 -8.811
(0.450) ***
(0.535) ***
(0.419) ***
(0.433) ***
(0.419) ***
(0.411) ***
(0.387) ***
Observations 37108 648626 648626 648626 648626 602370 602370 Pseudo R2 0.05 0.07 0.10 0.07 0.10 0.08 0.12 Log likelihood -86933.1 -18265.3 -17711.4 -18265.3 -17711.4 -17675.4 -17068.5
The marginal effects are computed for the expected value of the dependent variable conditional on being uncensored. A full set of time dummies is included, all variables are in logs (except tariff variables). Standard errors in parentheses, * significant at 10%; ** significant at 5%; *** significant at 1%, for industry i in acquisition country k, and industry j in target country l.
33