european ivd market statistics report - medtech europe
TRANSCRIPT

European IVD MarketStatistics Report

11,100
11,200
11,300 11,26511,400
11,000
10,900
10,800
10,700
10,600
10,5002009 2010 2011 2012 2013 2014 2015 2016 2017 2018 2019
EUROPEAN IVD MARKET REVENUES (MILLION €)
OverviewMedTech Europe is pleased to publish the market estimates of the In vitro diagnostic (IVD) industry in Europe. The MedTech Europe figures include market size and dynamics information, based on 2019 and 2018 data. Macroeconomic and healthcare data are also included for all 28 EU-member states plus the European Free Trade Association members (EFTA) –Switzerland, Norway and Iceland.
In vitro diagnostics (IVDs) are an essential part of today’s healthcare. IVDs are used to diagnose, monitor, screen and assess predispositions to diseases, thereby contributing to the available medical information regarding a patient. By allowing earlier and more targeted treatments, IVDs help to reduce hospital stays and convalescences, resulting in healthier populations, reduced costs and economic growth in the long run.
Three out of the five largest European IVD markets – France, Spain and UK are showing slight to moderate growth in 2019 and overall revenues across EU-28 plus EFTA reached €11,265 million, an increase of +1.5%. If changes in the value of non-Euro currencies, are considered the overall change in the Euro value of the European IVD market from 2018 to 2019 is +1.3%.
The IVD revenues in Germany stagnated (-0.4%), further market decrease was seen in the reagents market (-1.2%). In Italy, the IVD market decreased (-2%), with decreased revenues in both clinical chemistry, (-7.6%) and haematology, (-2.7%). From the largest five markets, the UK is experienced the highest increase of +3.1%, largely due to increase in instruments and consumables, infectious disease testing, and nucleic acid testing systems. In Spain, the IVD market increased by +2.8% due to growth in immunochemistry, micro and infectious diseases segments. After stagnation in 2015 and 2016, the French IVD market registered a third year of slight growth of +0.3%. The changes in revenues do not necessarily reflect changes in test volumes, and there is evidence in many countries that volumes have increased significantly without increased revenues. The Greek market marked an increase of + 3.7%, the highest growth since 2008. On the other hand, Portugal reported a -1.5% decrease in IVD expenditure.
In the newer EU member states, IVD expenditure averaged 1.2% of total healthcare expenditure (THE), significantly higher than the 0.63% seen in older member states (EU-15), but in absolute terms the new member states spend only €11.3 per capita compared to €23 in the EU-15. Growth in those states is at +6.4% compares to +0.8% in the EU-15 states.

11,100
11,200
11,300 11,26511,400
11,000
10,900
10,800
10,700
10,600
10,5002009 2010 2011 2012 2013 2014 2015 2016 2017 2018 2019
EUROPEAN IVD MARKET REVENUES (MILLION €)
Overview
CountrySpecificData
Countries
Population GDP GDP / capita THE THE / capita THE as % GDP IVD mkt. 2019IVD mkt.
2018IVD mkt.
growth rate 19-18
IVD mkt. / THE
IVD mkt. / capita
1000 Mio Mio % Mio Mio % %
Germany 83.019 3.449.050 41.545 383.636 4.627 11,5% 2.161 2.170 -0,4% 0,6% 26,0France 1 67.013 2.425.708 36.198 265.764 3.969 11,3% 1.623 1.619 0,3% 0,6% 24,2UK 2 66.647 2.522.713 37.852 242.300 3.646 10,0% 1.042 1.011 3,1% 0,4% 15,6Italy 60.360 1.789.747 29.651 153.085 2.534 8,7% 1.556 1.588 -2,0% 1,0% 25,8Spain 46.937 1.244.772 26.520 108.110 2.310 9,0% 1.033 1.004 2,8% 0,9% 22,0Netherlands 17.282 810.247 46.883 77.202 4.480 10,0% 294 286 2,7% 0,4% 17,0Greece 10.725 183.414 17.102 14.251 1.328 7,7% 213 198 7,5% 1,4% 19,8Portugal 10.277 213.301 20.756 19.303 1.877 9,5% 226 229 -1,5% 1,2% 22,0Belgium 11.456 476.203 41.570 47.417 4.150 10,3% 399 386 3,3% 0,8% 34,8Sweden 10.230 474.468 46.379 51.296 5.041 10,9% 187 179 4,5% 0,3% 18,2Austria 8.859 397.575 44.879 39.791 4.501 10,3% 268 262 2,3% 0,7% 30,3Denmark 5.806 312.747 53.865 30.450 5.256 10,1% 155 151 2,8% 0,5% 26,7Finland 5.518 240.556 43.595 21.117 3.829 9,0% 119 120 -1,2% 0,6% 21,5Ireland 4.904 356.051 72.601 22.452 4.613 6,9% 126 122 3,7% 0,5% 25,7Luxembourg 614 63.516 103.465 3.174 5.221 5,3% 19 19 0,0% 0,6% 30,9EU-15 409.646 14.960.069 36.520 1.479.349 3.611 9,9% 9.419 9.343 0,8% 0,6% 23,0Poland 37.973 532.329 14.019 31.502 830 6,3% 394 377 4,4% 1,2% 10,4Romania 19.414 223.337 11.504 11.371 584 5,6% 195 180 8,1% 1,6% 10,0Czech Rep 10.650 223.945 21.028 15.872 1.493 7,7% 182 158 15,0% 1,0% 17,1Hungary 9.773 146.062 14.946 8.964 917 6,7% 82 79 5,1% 0,9% 8,4Bulgaria 7.000 61.240 8.748 4.121 587 7,4% 30 32 -7,4% 0,8% 4,3Slovakia 5.450 93.865 17.222 5.991 1.100 6,7% 77 76 1,9% 1,3% 14,2Croatia 4.076 54.238 13.306 3.524 862 6,8% 67 65 4,4% 1,8% 16,5Lithuania 2.794 48.797 17.464 2.973 1.061 6,6% 31 29 9,3% 1,0% 11,3Latvia 1.920 30.463 15.867 1.804 936 6,2% 30 24 24,3% 1,3% 15,5Slovenia 2.081 48.393 23.256 3.797 1.831 8,3% 52 52 0,1% 1,4% 25,0Estonia 1.325 28.112 21.220 1.735 1.312 6,7% 21 21 -0,8% 1,2% 16,1Cyprus 876 22.287 25.445 1.431 1.645 6,8% 10 10 5,3% 0,7% 11,4Malta 494 13.462 27.276 1.110 2.290 9,0% 5 5 0,0% 0,5% 10,1New MS 103.826 1.526.531 14.703 94.194 907 6,2% 1.177 1.108 6,3% 1,2% 11,3EU-28 (EU-15 + new MS) 513.472 16.486.600 32.108 1.573.543 3.065 9,5% 10.596 10.451 1,4% 0,7% 20,6Switzerland 8.545 653.471 76.478 70.902 8.327 11,9% 473 462 2,2% 0,7% 55,3Norway 5.328 360.301 67.621 36.971 6.960 10,1% 185 178 3,8% 0,5% 34,7Iceland 357 21.635 60.604 1.862 5.280 8,5% 11 11 0,0% 0,6% 30,8EFTA 14.230 1.035.407 72.764 109.735 7.712 10,6% 668 651 2,6% 0,6% 47,0TOTAL (EU-28 + EFTA) 527.701 17.522.007 33.204 1.683.278 3.190 9,6% 11.265 11.102 1,5% 0,7% 21,3Turkey 82.004 679.510 8.286 27.701 338 4,1% N/A 645 N/A 2,3% N/ATOTAL (EU-28 + EFTA + Turkey) 609.705 18.201.518 29.853 1.710.979 2.806 9,4% N/A 11.748 N/A 0,7% N/A
Eurostat 2019 Eurostat 2018 Source MedTech Europe
UK GBP 1,1399 1,1304 914 887 1.042 1.002 3,9%Sweden SEK 0,09446 0,09752 1.975 1.891 187 184 1,2%Denmark DKK 0,133939 0,134171 1.159 1.128 155 151 2,5%EU-15 EUR N/A N/A 9.419 9.341 0,8%Poland PLN 0,2327 0,2347 1.678 1.608 390 377 3,5%Romania RON 0,2107 0,2149 906 840 191 180 5,7%Czech Rep CZK 0,03896 0,03899 4.664 4.057 182 158 15%Hungary HUF 0,003075 0,003137 26.739 25.681 82 81 2,1%Bulgaria BGN 0,511305 0,511305 60 64 30 32 -7,4%Croatia HRK 0,134 0,134 502 481 67 65 4,4%New MS EUR N/A N/A 1.169 1.110 5,3%EU-28 (EU-15 + new MS) EUR N/A N/A 10.588 10.451 1,3%
Country Currency 2019 average Exchange Rate
2018 average Exchange Rate
IVD mkt. 2019 Mio LC
IVD mkt. 2018Mio
IVD mkt. growth rate 19-18
IVD mkt. 2018 Mio LC
IVD mkt. 2019Mio
IVD Market Statistics
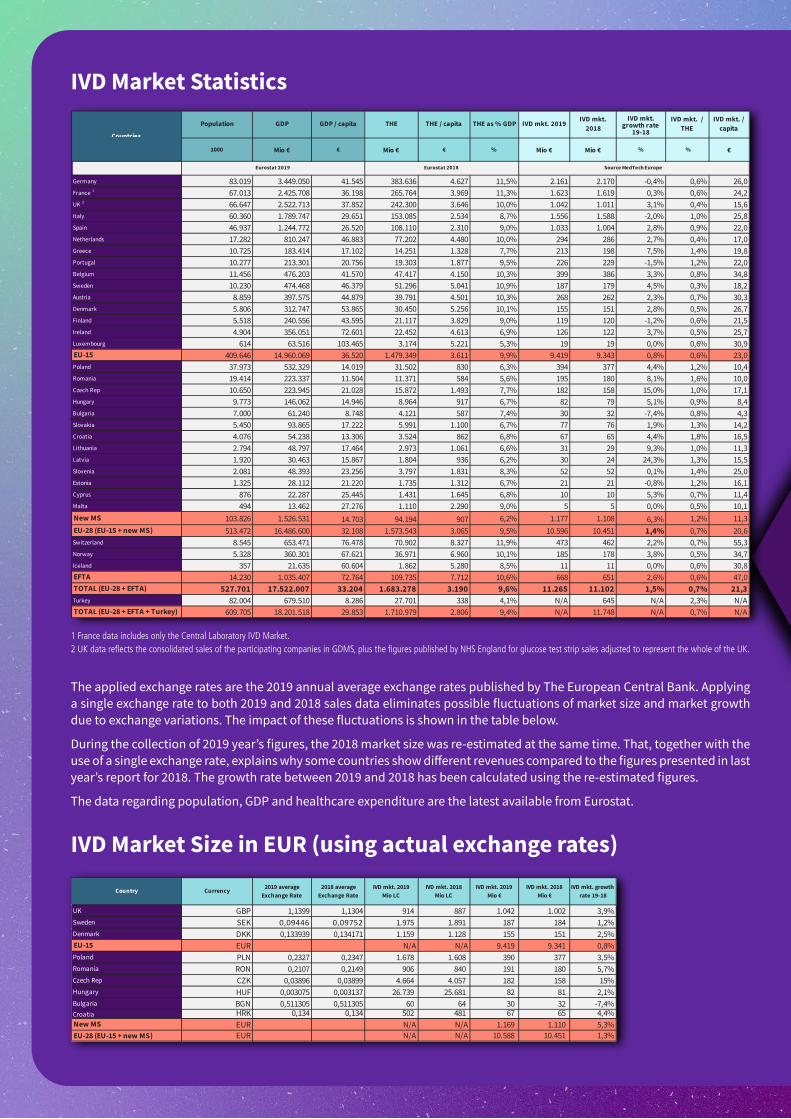
The applied exchange rates are the 2019 annual average exchange rates published by The European Central Bank. Applying a single exchange rate to both 2019 and 2018 sales data eliminates possible fluctuations of market size and market growth due to exchange variations. The impact of these fluctuations is shown in the table below.
During the collection of 2019 year’s figures, the 2018 market size was re-estimated at the same time. That, together with the use of a single exchange rate, explains why some countries show different revenues compared to the figures presented in last year’s report for 2018. The growth rate between 2019 and 2018 has been calculated using the re-estimated figures.
The data regarding population, GDP and healthcare expenditure are the latest available from Eurostat.
IVD Market Size in EUR (using actual exchange rates)
1 France data includes only the Central Laboratory IVD Market.2 UK data reflects the consolidated sales of the participating companies in GDMS, plus the figures published by NHS England for glucose test strip sales adjusted to represent the whole of the UK.
CountrySpecificData
Although there are variations in healthcare systems, reimbursement policies etc. from country to country, healthcare cost containment is a constant across the various countries in this report. Besides budget restrictions, greater centralization both in the public and private laboratory sectors has increased the power of purchasing organizations. The overall situation with Sales Outstanding (DSO) in 2019 remains unsatisfactory.
1 France data includes only the Central Laboratory IVD Market.2 UK data reflects the consolidated sales of the participating companies in GDMS, plus the figures published by NHS England for glucose test strip sales adjusted to represent the whole of the UK.

2019 IVDMarket Size
in mEUR
2019 IVDMarket/Capita
in EURSwitzerland 55
Belgium 35
Norway 35
Luxembourg 31
Iceland 31
Austria 30
Germany 26
Italy 26
Ireland 26
Slovenia 25
France 24
Spain 22
Portugal 22
Finland 22
Greece 20
Sweden 18
Czech Republic 17
Netherlands 17
Estonia 16
Croatia 17
UK 16
Latvia 15
Slovakia 14
Cyprus 11
Lithuania 11
Poland 10
Malta 10
Romania 10
Hungary 8
Bulgaria 4
Denmark 27
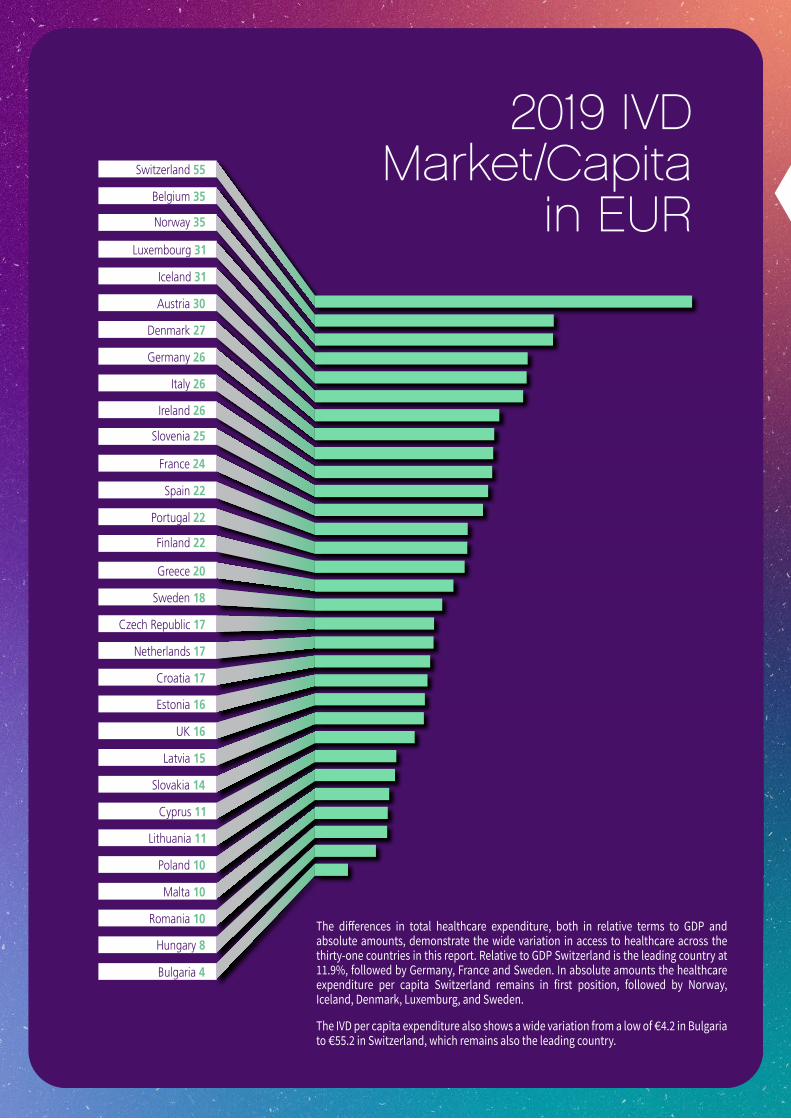
The differences in total healthcare expenditure, both in relative terms to GDP and absolute amounts, demonstrate the wide variation in access to healthcare across the thirty-one countries in this report. Relative to GDP Switzerland is the leading country at 11.9%, followed by Germany, France and Sweden. In absolute amounts the healthcare expenditure per capita Switzerland remains in first position, followed by Norway, Iceland, Denmark, Luxemburg, and Sweden.
The IVD per capita expenditure also shows a wide variation from a low of €4.2 in Bulgaria to €55.2 in Switzerland, which remains also the leading country.
2019 IVDMarket Size
in mEUR
2019 IVDMarket/Capita
in EURSwitzerland 55
Belgium 35
Norway 35
Luxembourg 31
Iceland 31
Austria 30
Germany 26
Italy 26
Ireland 26
Slovenia 25
France 24
Spain 22
Portugal 22
Finland 22
Greece 20
Sweden 18
Czech Republic 17
Netherlands 17
Estonia 16
Croatia 17
UK 16
Latvia 15
Slovakia 14
Cyprus 11
Lithuania 11
Poland 10
Malta 10
Romania 10
Hungary 8
Bulgaria 4
Denmark 27
The differences in total healthcare expenditure, both in relative terms to GDP and absolute amounts, demonstrate the wide variation in access to healthcare across the thirty-one countries in this report. Relative to GDP Switzerland is the leading country at 11.9%, followed by Germany, France and Sweden. In absolute amounts the healthcare expenditure per capita Switzerland remains in first position, followed by Norway, Iceland, Denmark, Luxemburg, and Sweden.
The IVD per capita expenditure also shows a wide variation from a low of €4.2 in Bulgaria to €55.2 in Switzerland, which remains also the leading country.
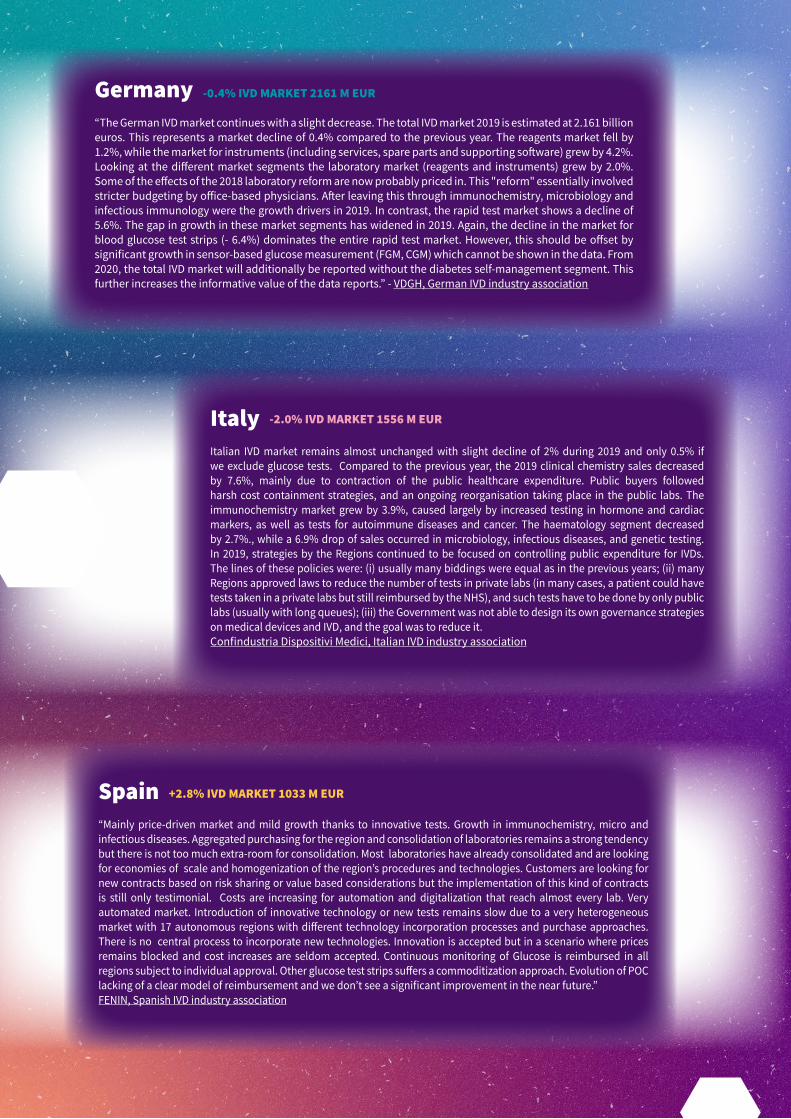
Germany -0.4% IVD MARKET 2161 M EUR
“The German IVD market continues with a slight decrease. The total IVD market 2019 is estimated at 2.161 billion euros. This represents a market decline of 0.4% compared to the previous year. The reagents market fell by 1.2%, while the market for instruments (including services, spare parts and supporting software) grew by 4.2%. Looking at the different market segments the laboratory market (reagents and instruments) grew by 2.0%. Some of the effects of the 2018 laboratory reform are now probably priced in. This "reform" essentially involved stricter budgeting by office-based physicians. After leaving this through immunochemistry, microbiology and infectious immunology were the growth drivers in 2019. In contrast, the rapid test market shows a decline of 5.6%. The gap in growth in these market segments has widened in 2019. Again, the decline in the market for blood glucose test strips (- 6.4%) dominates the entire rapid test market. However, this should be offset by significant growth in sensor-based glucose measurement (FGM, CGM) which cannot be shown in the data. From 2020, the total IVD market will additionally be reported without the diabetes self-management segment. This further increases the informative value of the data reports.” - VDGH, German IVD industry association
Italy -2.0% IVD MARKET 1556 M EUR
Italian IVD market remains almost unchanged with slight decline of 2% during 2019 and only 0.5% if we exclude glucose tests. Compared to the previous year, the 2019 clinical chemistry sales decreased by 7.6%, mainly due to contraction of the public healthcare expenditure. Public buyers followed harsh cost containment strategies, and an ongoing reorganisation taking place in the public labs. The immunochemistry market grew by 3.9%, caused largely by increased testing in hormone and cardiac markers, as well as tests for autoimmune diseases and cancer. The haematology segment decreased by 2.7%., while a 6.9% drop of sales occurred in microbiology, infectious diseases, and genetic testing. In 2019, strategies by the Regions continued to be focused on controlling public expenditure for IVDs. The lines of these policies were: (i) usually many biddings were equal as in the previous years; (ii) many Regions approved laws to reduce the number of tests in private labs (in many cases, a patient could have tests taken in a private labs but still reimbursed by the NHS), and such tests have to be done by only public labs (usually with long queues); (iii) the Government was not able to design its own governance strategies on medical devices and IVD, and the goal was to reduce it.Confindustria Dispositivi Medici, Italian IVD industry association
Spain +2.8% IVD MARKET 1033 M EUR
“Mainly price-driven market and mild growth thanks to innovative tests. Growth in immunochemistry, micro and infectious diseases. Aggregated purchasing for the region and consolidation of laboratories remains a strong tendency but there is not too much extra-room for consolidation. Most laboratories have already consolidated and are looking for economies of scale and homogenization of the region’s procedures and technologies. Customers are looking for new contracts based on risk sharing or value based considerations but the implementation of this kind of contracts is still only testimonial. Costs are increasing for automation and digitalization that reach almost every lab. Very automated market. Introduction of innovative technology or new tests remains slow due to a very heterogeneous market with 17 autonomous regions with different technology incorporation processes and purchase approaches. There is no central process to incorporate new technologies. Innovation is accepted but in a scenario where prices remains blocked and cost increases are seldom accepted. Continuous monitoring of Glucose is reimbursed in all regions subject to individual approval. Other glucose test strips suffers a commoditization approach. Evolution of POC lacking of a clear model of reimbursement and we don’t see a significant improvement in the near future.”FENIN, Spanish IVD industry association
France +0.3% IVD MARKET 1624 M EUR
“The Central Laboratory IVD French market is estimated at 1.624 billion €, with a growth of +0.3% compared to 2018. The Central Laboratory IVD French market has been in stagnation since 2014 with continuous non-significant growth of less than 1%.” SIDIV, French IVD industry association
Poland +4.4% IVD MARKET 394 M EUR
“Compared to the previous year, the Polish market observed an increase of +4.4%.” MedTech Polska, Polish IVD industry association
United Kingdom +3.1% IVD MARKET 1042 M EUR
“The UK IVD market grew by 3.1% during 2019, of which a significant component was instruments and consumables. This could be in part due to increased reporting of these groups. Reagent revenues increased by 1.1% and there was particularly strong growth in Infectious Disease testing revenues. It is difficult to avoid commenting on 2019 without mentioning the current situation in the midst of the 2020 Covid-19 epidemic, but as the Influenza season was mild, it may have contributed to a lack of preparedness for mass testing later. At the time, however, the major concern was still Brexit and its likely impact on supply chains and market access. As expected, nucleic acid testing systems continue to grow strongly, by about £12m (17%) over 2018, and multiple target NAT infectious disease systems grew by 32%. Some individual tests declined surprisingly, such as Vitamin D, while allergy and autoimmune testing saw double digit percentage growth. Overall, the UK still spends a very low amount per capita on IVD testing.” - BIVDA, British IVD industry association
Portugal 1.5% IVD MARKET 226 M EUR
“IVD market in Portugal has been quite stable, showing a negative development of -1.5% when compared with 2018. The market excluding glucose strips, has been stable, with a growth of 0.4%. The cause of the-1.5% market growthis that we are seeing a shift towards new technologies. In 2019, test strips declined around 4%. Short term tendering and contracts adding to political measures to contain costs in Healthcare, specifically with Medical Devices, leads to high pressure on prices. Slight market positive development from organic growth (higher life expectancy and increase in elderly population) is being compensated by market value decrease with cost measures and aggressive competitive pressure. Public funding is leaning towards more cost-effective and integrated care, with and increasing role of insurance companies. Health insurance continues to gain relevance with ~25% of population insured (growth 4.5%) and a growing number of private hospitals competing aggressively to gain MS. Lab consolidation seen in the past has slowed down with stabilization of number of labs in the country. We’ve been witnessing increasing patient empowerment and education, with a shift of disease management from reactive to preventive. Public policies are focused at improving screening and integrating hospitals and primary care. NHS purchasing centralization continuous to be discussed although not yet applied to IVD. Discussions are arising on new models of funding healthcare, like value-based purchasing and payments over results in health.” APIFARMA, Portuguese IVD industry association

DataGathering
Participating in the GDMS programme
Not participating in the GDMS programme
Greece +7.5% IVD MARKET 213 M EUR
“2019 was the first full year during which the Greek Government was able to define its fiscal policy outside the fiscal adjustment programmes since 2010. The Greek economy grew for the third consecutive year, with 1.9% GDP growth compared to 2018. The Greek IVD market grew by 7.5% in 2019, for the fourth consecutive time since 2008, reaching a size of € 213M. This growth is driven mainly from the public sector, which represents 67% of the Greek IVD market. The remaining 33% corresponds to the private sector. Finally, for the total IVD Market, DSO were approximately 230 days during 2019.” SEIV, Greek IVD industry association
Slovenia +0.1% IVD MARKET 52 M EUR
“The market stayed at last year's level, only +0.1 % growth. The reason is mainly the decline of the Rapid testing and Diabetes Care market by almost -4 % and slowing down of the Laboratory market growth.Reagents sales were declining approximately -2 % due to Clin Chemistry (-3 %), Haematology/Haemostasis (- 4%), and a big drop in Infect. Immunology (- 14 %), all being partially compensated by Immunology Reagents sales by + 6 %. To last year's outstanding contribution of the Instruments sales to the market value, the trend continued by + 8 % growth in 2019 (importantly by Immunochemistry & Infectious Immunology Instruments) and after-sales Service. As the public procurement system is still very much based on price, no significant increase in the market value is expected.”SIEDMA, Slovenian IVD industry association
Austria +2.3% IVD MARKET 268 M EUR
“In 2019, the Austrian IVD market grew by 2.3%, reaching a market size of 268 M Euros.”AUSTROMED, Austrian IVD industry association
Slovakia +1.9% IVD MARKET 77 M EUR
“IVD market in Slovakia has been quite stable, showing a growth of 1.9 % when compared with 2018, mainly caused by NAT testing in Blood Banks.”SEDMA, Slovakian IVD industry association

DataGathering
Participating in the GDMS programme
Not participating in the GDMS programme
The results presented above are based on individual 2019 estimates made for 28 countries, comprising of the EU countries, EFTA countries and Turkey:
• 13 countries are participating in the Global Diagnostic Market Statistics (GDMS, former EDMS) programme: Austria, Belgium, Czech Republic, France, Germany, Italy, the Netherlands, Poland, Portugal, Slovakia, Spain, Switzerland, and the UK.
• The National Association Members of MedTech Europe and the MedTech Europe’s Market Research Committee have estimated the IVD market in 17 other countries not participating in the GDMS programme: Bulgaria, Croatia, Cyprus, Denmark, Estonia, Finland, Greece, Hungary, Iceland, Ireland, Latvia, Lithuania, Malta, Norway, Romania, Slovenia, Sweden.
The figures per country are compiled from the Global Diagnostic Market Statistics (GDMS) programme, through which companies report invoiced sales of reagents, instruments and consumables to an independent auditor, CIP, as based on the Global IVD Classification (GIVD). This is done in association with the MedTech Europe’s Market Research Committee and the National Association Members.
More than 85% of the market is covered in major countries by GDMS, ensuring the reliability and objectiveness of the information provided by MedTech Europe and its members. MedTech Europe encourages all IVD suppliers and countries to participate in the GDMS programme, which is the largest In vitro diagnostic audit in Europe and the most accurate source of information for understanding and predicting market trends.

About In Vitro Diagnostics In vitro diagnostics are non-invasive tests performed on biological samples (for example blood, urine or tissues) to diagnose or exclude a disease. IVDs provide valuable information about how the body is functioning and its state of health. They are used for diagnosis, prognosis, risk stratification, screening and therapeutic monitoring of diseases. IVDs have a broad scope ranging from sophisticated technologies performed in clinical laboratories to simple self-tests, such as those for pregnancy and glucose monitoring.
About MedTech Europe
MedTech Europe is the European trade association for the medical technology industry including diagnostics, medical devices and digital health. Our members are national, European and multinational companies as well as a network of national medical technology associations who research, develop, manufacture, distribute and supply health-related technologies, services and solutions. MedTech Europe’s mission is to make innovative medical technology available to more people, while helping healthcare systems move towards a sustainable path. MedTech Europe encourages policies that help the medical technology industry meet Europe’s growing healthcare needs and expectations. It also promotes medical technology’s value for Europe focusing on innovation and stakeholder relations, using economic research and data, communications, industry events and training sessions.
The European in vitro diagnostic industry is a market worth around €11 billion. Driven by research and development, 95% of the industry is comprised of small and medium size enterprises and approximately 1 billion euros per year is reinvested in R&D. Developed by MedTech Europe, the Global Diagnostic Market Statistics (GDMS) and Management Information System (MIS) programmes provide a comprehensive overview of the latest market trends based on the Global IVD Product Classification (GIVD). For more information, visit www.medtecheurope.org.
For more informationTeodora Angelova Market Data ManagerEmail: [email protected]: +32 2 777 02 74

www.medtecheurope.org