european journal of translational and clinical medicine
TRANSCRIPT

M E D I C A L U N I V E R S I T Y O F G D A Ń S K
EUROPEAN JOURNAL OF TRANSLATIONAL
AND CLINICAL MEDICINE
e-ISSN 2657-3156 2019 Vol. 2 No. 2 www.ejtcm.gumed.edu.pl


EUROPEAN JOURNALOF TRANSLATIONAL AND CLINICAL MEDICINE
2019 Vol. 2 No. 2
Editor-in-Chief Dariusz Kozłowski
Vice-Editor-in-Chief Tomasz Szmuda
SecretaryBeata Dudzik-Richter
Thematic Editors
Michał Chmielewski / Clinical MedicineTadeusz Jędrzejczyk / e-Health, Epidemiology and Preventive MedicineLeszek Kalinowski / Biobanking and Technologies for Personalized MedicineDariusz Kozłowski / Cardiology, Hypertension and Cardiovascular ScienceNatalia Marek-Trzonkowska / Basic Science, Cell & Molecular Biology, Experimental MedicineJarosław Sławek / Neuroscience, Neurology and Psychiatric DisordersAnna Starzyńska / Dental SciencesPiotr Szefer / PharmacyTomasz Szmuda / SurgeryAgnieszka Zimmermann / Bioethics, Biolaw, History of Medicine
Editorial Board
Zdzisław BereznowskiZbigniew GaciongPaul GrundemanAnna GrygorowiczMarcin HellmannMiłosz JaguszewskiEwa Iżycka-ŚwieszewskaWojciech KamyszWiesław MakarewiczMichał ObuchowskiStefan RaszejaMałgorzata Sokołowska-WojdyłoAdam SzarszewskiAgnieszka Szlagatys-SidorkiewiczAnna Tomaszuk-KazberukBartosz WasągRenata Zaucha
Managing EditorMałgorzata Omilian-Mucharska
Statistical EditorPaweł Zagożdżon
Technical EditorshipPiotr SampławskiIzabela Szeibelis-Deskiewicz
Language EditorJanusz Springer
DTP EditorIzabela Szeibelis-Deskiewicz
International Advisory Board
John J. Bissler / USAMarsha Cohen / USAJean-Luc Cracowski / FranceLawrence W. Dobrucki / USAAnna Dominiczak / GB Alexandru Eniu / RomaniaJerzy B. Gajewski / CanadaJacek Jassem / PolandJanis Kisis / LatviaSeda Kizilel / TurkeyLukasz Konopka / USAPawel M. Kozlowski / USABengt Lindholm / SwedenJan-Eric Litton / SwedenEva M. Martinez-Cacerez / Spain
Olle Melander / SwedenMarius Miglinas / LithuaniaKrzysztof Narkiewicz / PolandUladzimir Petrovich Adaskevich / BelarusWaldemar Priebe / USAThomas Ritter / IrelandYanosh Sanotsky / UkrainePawel Tacik / GermanyPiotr Witkowski / USAZbigniew K. Wszołek / USAMahmut Ilker Yilmaz / Turkey
Editorial Office
Department of Cardiologyand ElectrotherapyMedical University of GdańskDębinki 7 80-211 Gdańsk, Poland
Phone: +48 58 349 39 10Fax: +48 58 349 39 20E-mail: [email protected]
Publisher
Medical University of GdańskM. Skłodowskiej-Curie 3 A80-210 Gdańsk, Poland© Copyright by Medical University of Gdańsk
Gdańsk 2019e-ISSN 2657-3156 Online edition is the original version of the journal
Photo on the cover by Sara Kierońska


INVITED REVIEW ARTICLE
The problem of paediatric patients in developing countries: do we actually know how to feed the hungry children?Daniel Kasprowicz, Franco Cyrille Rajaomalala
RESEARCH ARTICLES
Sex-related differences in patients undergoing radiofrequency ablation of atrioventricular nodal reentrant tachycardia Joanna Sokołowska, Magdalena Sokołowska, Jakub Adamowicz, Dorota Zyśko, Jadwiga Radziejewska, Agnieszka Sławuta
Can medical staff have visible tattoos? A survey study among studentsAnna Paprocka-Lipińska, Alan Majeranowski, Małgorzata Drozd-Garbacewicz, Małgorzata Mazanek, Maria Hebdzińska, Joanna Styszko
Awareness of the role of cardiovascular risk factors and their prevention – comparison between rural-urban and urban adolescentsDawid Ostrówka, Tadeusz Dereziński, Maria Nowak, Anna Komand, Marta Jancewicz, Anna Szyndler, Jacek Wolf, Krzysztof Narkiewicz
Interdisciplinary treatment of large adrenocortical carcinoma infiltrating inferior vena cavaMałgorzata Dobrzycka, Piotr Spychalski, Urszula Rusek, Michał Brzeziński, Jarosław Kobiela, Przemysław Kłosowski, Monika Berendt-Obołończyk, Andrzej Łachiński, Krzysztof Sworczak, Zbigniew Śledziński
REVIEW ARTICLES
The usefulness and limitations of diffusion tensor imaging – a review study Sara Kierońska, Paweł Słoniewski
Quality of life after laparoscopic sleeve gastrectomy – review of literatureMateusz Wityk, Wojciech Makarewicz, Cezary Kaczmarkiewicz, Maciej Bobowicz
The relationship between blood pressure variability and outcome in acute ischemic strokeKamil Kowalczyk, Dariusz Gąsecki
Acute cholecystitis in patients with diabetes mellitus – systematic reviewMonika Łącka, Piotr Spychalski, Małgorzata Dobrzycka, Olga Rostkowska, Jarosław Kobiela
SHORT COMMUNICATION
Carotid access in Transcatheter Aortic Valve Implantation – an alternative to the gold standard. A single-center experienceAleksandra Stańska, Aleksandra Wierzbowska, Radosław Targoński, Wojciech Karolak, Agnieszka Mickiewicz, Miłosz Jaguszewski, Dariusz Jagielak
COMMENTARY
Commentary on: The usefulness and limitations of diffusion tensor imaging – a review studyTomasz Szmuda, Shan Ali
07
19
23
27
38
43
52
61
71
80
85
CONTENTSEUROPEAN JOURNAL OF TRANSLATIONAL AND CLINICAL MEDICINE 2019;2(2):1-88

INVITED REVIEW ARTICLE
The problem of paediatric patients in developing countries: do we actually know how to feed the malnourished children?
Abstract
The problem of malnutrition affects both developed and developing countries. The disease-related malnutrition in hospitalised patients is well-described and the treatment recommendations reflect the health care conditions of developed countries. However the diagnosis and treatment of children with severe acute malnutrition (SAM) is inconsistent both in the international and in the developing countries’ guidelines. The aim of this article is to start a discussion about the guidelines for the treatment and nutrition of malnourished infants and children in deve-loping countries. The differences appear primarily in the hydration and nutritional status assessment, treatment of hypoglycaemia, additional supplementation and partly in nutrition itself. In general, we do know how to treat children with SAM, however the differences in the guidelines can cause a lot of difficulty in making decisions in emergencies, particularly for infants under 6 months.
Keywords: severe acute malnutrition · infants · supplementation · nutritional status assessment · WHO protocol
EUROPEAN JOURNAL OF TRANSLATIONAL AND CLINICAL MEDICINE 2019;2(2):7-18
Citation
Kasprowicz D, Rajaomalala FC, The problem of paediatric patients in developing countries: do we actually know how to feed the malnourished children? Eur J Transl Clin Med. 2019;2(2):7-18.DOI: 10.31373/ejtcm/116313
Corresponding author:Daniel Kasprowicz, Medical Clinic Flamboyant, Mampikony, Madagascare-mail: [email protected] external funds. Available online: www.ejtcm.gumed.edu.plCopyright ® Medical University of Gdańsk
Daniel Kasprowicz , Franco Cyrille Rajaomalala
Medical Clinic Flamboyant, Mampikony, Madagascar
This is Open Access article distributed under the terms of the Creative Commons Attribution-ShareAlike 4.0 International.
Introduction
The problem of world hunger is not new, however the recent trends in global food security force us to ask questions about the effectiveness of international in-terventions. Although the newest United Nations Food and Agriculture Organisation (FAO) statistics show a clear distribution of malnourished people in different regions of the world, the data also indicate that we are not winning the battle with famine. Furthermore, sin-
ce 2014 the fight against hunger seems to be moving towards global failure with a large increase in people suffering from overweight and obesity [1]. In develo-ped countries malnutrition is related with chronic or acute disease and most often affects hospitalised pa-tients (20 to 50% of patients, depending on the hospi-tal department or the nature) [2-3]. Therefore, hunger result-ing from food insecurity is rather the domain of
Updated: 29.01.2020
08 Eur J Transl Clin Med 2019;2(2):7-18
developing countries, mainly countries in sub-Saha-ran Africa, Central Asia and Southern Asia. Statistically, 25.9% of the African population does not have adequ-ate access to nutritious food and 30.3% of children < 5 years of age are malnourished [1]. Moreover, statistics do not include micronutrient-related malnutrition and micronutrient excess, which may suggest that malno-urishment is a bigger problem quantitatively [4]. The quick progress of knowledge in nutritional sciences, development of nutritional status assessment me-thods and nutritional risk, accessibility of artificial diets and nutritional teams enabled effective treatment of disease-related malnutrition [5-13].
However, using the developed countries' standards to treat and feed malnourished patients in developing countries is impossible due to the insufficient quan-tity of ready-to-use therapeutic food (RUTF) and oral nutritional supplements (ONS), lack of medical and technological resources, low financial support and inadequate training of health workers. Although the World Health Organisation (WHO), UNICEF or Doctors without borders (Médecins sans frontières, MSF) pu-blished several guidelines and assessment tools, many of the presented algorithms for the treatment of mal-nutrition are still not implemented [14-16]. Among the reasons for this situation is the complex task of ada-pting the guidelines to the local resources and capa-bilities, the co-occurence of malnutrition and tropical diseases and the relatively scarce evidence base for the treatment of malnutrition of infants < 6 months of age [17-18]. In addition, many of the countries struggling to provide effective care for the malnourished paedia-tric patients also lack funding for research, hence the specific and critical research questions regarding the nutrition or nursing care (which are not yet addressed by the aforementioned guidelines) remain unanswe-red and the evidence base remains scarce.
The aim of the article is to start a discussion about the treatment and nutrition of malnourished infants and children in developing countries. In addition, it is important to note the lack of specific nutrition stan-dards and lack of consistent international guidelines, especially among children < 6 months of age. The au-thors would like to emphasize that this article is not in-tended to suggest standards for the treatment of mal-nourished children in developing countries.
Nutritional Status Assessment
Accurate nutritional status assessment (NSA) is the first and key element in the diagnosis of severe acute malnutrition (SAM) in paediatric patients [19]. SAM consists of two basic forms: severe wasting (also
described as marasmus or energy malnutrition) and nutritional oedema (also described as kwashiorkor or protein malnutrition). Marasmus is a consequence of uncomplicated prolonged starvation. It is mainly characterised by a decrease in body weight and other anthropometric and immunological indicators. Usual-ly, total protein and serum albumin are normal or sli-ghtly below normal. There is also a shortage of mine-rals and vitamins such as iron, iodine, zinc and vitamin A. Kwashiorkor is a result of hypercatabolism due to qu-alitative and quantitative malnutrition. Patients have a decrease in protein fractions in the blood serum, which results in oedema and apparent weight gain [1, 14-15, 20-21]. Both types of malnutrition can also be caused by bacterial, viral and parasitic infections or by the combined burden of malnutrition and tropical diseases [22]. WHO also distinguishes a third type: marasmic kwashiorkor characterised by a decrease in muscle mass and fat, sarcopenia, weakening of the im-mune system, anaemia, lowering of protein levels in blood serum, digestive and absorption disorders as well as impairment of organs and body systems [15, 20-21].
Criteria for pharmacological
Although the scientific societies established seve-ral criteria for diagnosing malnutrition, none are spe-
-cific to children < 6 months. Using different methods of NSA in the same group of patients, we can obtain significant differences in the percentage distribution of well-fed and malnourished patients [2]. This poses the risk of not diagnosing early malnutrition, which may manifest with symptoms or biological changes not included in the basic parameters of the selected NSA method [15]. A special treatment algorithm is intended for children with SAM. Some recommenda-tions suggest using selected algorithms also to treat children with moderate acute malnutrition (MAM), but NSA determined by different methods can lead to the exclusion of some paediatric patients [14-17].
The most popular and oldest method of NSA among paediatric patients is to determine abnormalities in weight and height/length on percentile charts regar-ding weight-for-height/length, however since 2005 the WHO recommends that mid-upper arm circumference (MUAC) and the occurrence of oedema as independent diagnostic indicators of malnourishment [2, 23-24]. The index of weight-for-height/length primarily gives information about weight loss compared to children with good nutritional status of the same height/length. MUAC indicates loss of muscle mass and gives quick
and nutritional treatment of SAM

09The problem of paediatric patients in developing countries: do we...
check of infants and children’s nutritional status [14]. Comparing these two measurements, MUAC seems to play a more important role because it is a more reliable parameter, burdened with less risk of incorrect measu-rement, and can also be used by minimally-trained non-
-professionals for community-based screening of SAM in infancy [25]. WHO, UNICEF and MSF unanimously propose that in developing countries for the diagnosis of SAM and thus for pharmacological and nutritional treatment, children should meet the criteria:
· the MUAC in infants and children 6-59 months is <115 mm, · and/or bilateral pitting oedema, · and/or a weight-for-height/length < 3 Z-score of the WHO growth standards
Some recommendations suggest MUAC < 110 mm, but using this criteria may lead to under-diagnosis. Besides proper anthropometric parameters attention should be paid to other elements that may be the first symptoms of micronutrient-related malnutrition and micronutrient excess. During the history-taking, it is worth asking about the current diet and breastfeeding time, birth weight, vaccinations, episodes of diarrhoea and vomiting, urine colour, and contact with people suf-fering from infectious diseases. In physical examination, it is important to check the basic life parameters, size of the liver and spleen, peristalsis sounds on ausculta-tion, skin pallor, signs of circulatory collapse and any changes in the eyes, ears, skin and hair [14-17, 25-26]. The circumference of the child's head is not recommen-ded because of statistically significant variation within nations and ethnic groups, leading to overdiagnosis of macrocephaly or microcephaly may occur. Also, growth percentiles charts may not be optimal in all cases and a very careful and individual examination is required [27].
SAM in infants under 6 months of age
For many years, the issue of diagnosing and tre-ating malnourished infants under 6 months of age was underestimated, and in international and national guidelines little or no attention was paid to it. Further-more, each guideline points to completely different factors causing malnutrition as well as factors affecting the treatment process. Using the guidelines to make the decision to hospitalise an infant patient is also dif-ficult. The criteria that are strongly recommended for defining SAM and MAM in infancy and for starting a nutritional intervention are:
· weight-for height/length < 3 Z-score of the WHO growth standards,
· and/or the presence of bilateral oedema.
Other parameters which are worth attention:
· infant is too weak to be breastfed, · and/or insufficient milk production by the mother, · and/or body length below 49 cm, · and/or the infant has not gained any weight within 1-2 weeks, · and/or weight loss has been observed.
So far no recommendation was made to divide
SAM into complicated and uncomplicated forms [17]. Some recommendations suggest that patients < 3 kg [17, 28-36] or < 4 kg [37-38] should be treated and fed as patients under 6 months. None of the guideli-nes focus on NSA of infants < 6 months. Studies show that scales used in nutrition-related emergencies are largely unsuitable for weighing infants < 6 months [39]. International and national guidelines also does not re-commend MUAC for NSA of infants under 6 months [17], but independent medical institutions pointed to MUAC as a simple and easy method for quickly diagno-sing infants with MAM and SAM [25].
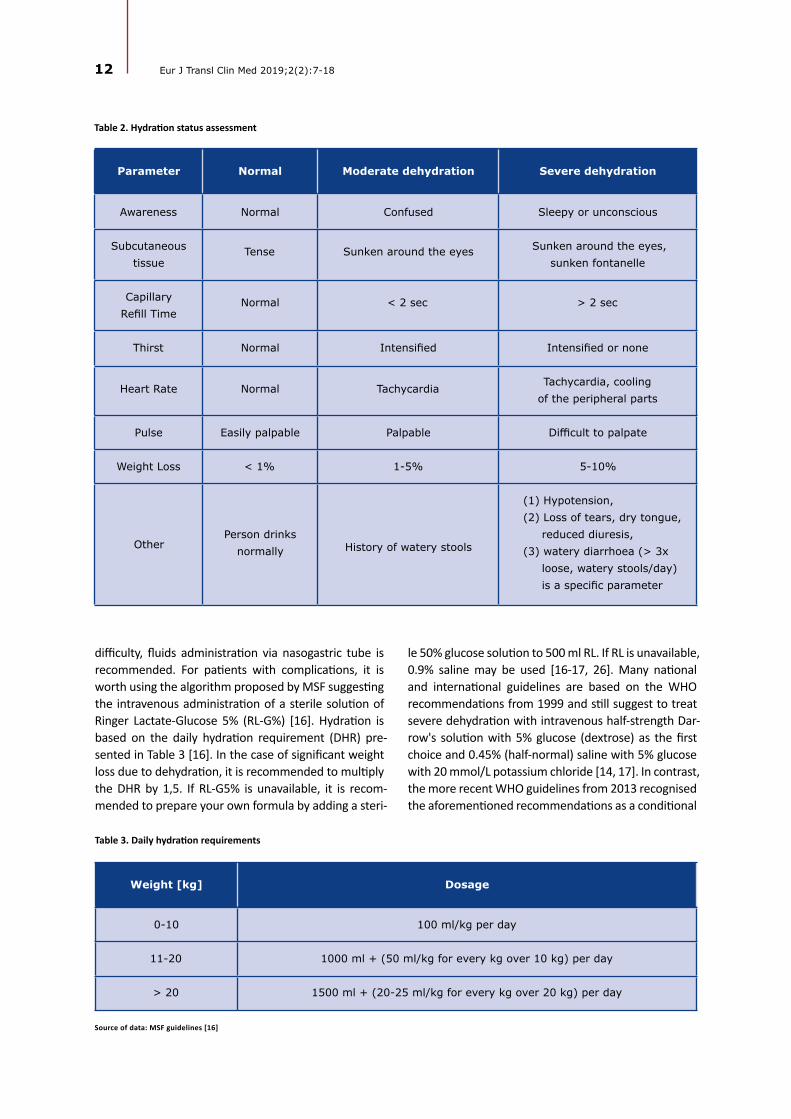
The comprehensive treatment of a malnourished child consists of three phases: initial treatment (also referred to as stabilisation phase; up to 7 days), reha-bilitation (2-6 weeks) and continuation of treatment including emotional stimulation and sensory develop-ment of the child. In terms of nutrition, the first phase is the most important and contains many tasks that must be undertaken by a physician, a dietitian or a nur-se, e.g. treatment (or prevention) of hypoglycaemia, hypothermia and dehydration, water and electrolyte imbalance, treatment of possible infections, careful start of nutrition as well as diagnosis and treatment of comorbidities (e.g. vitamin deficiency, heart failure or anaemia) (Figure 1) [17, 26, 40].
Hypoglycaemia
Hypoglycaemia in children with SAM is diagnosed when blood glucose level is < 54 mg/dL (< 3 mmol/L), but MSF suggests intervening in blood glucose < 60 mg/dL (< 3.3 mmol/L) [26]. Severe hypoglycaemia is a condition when the blood glucose level is < 40 mg/dL (< 2.2 mmol/L) [14]. The most common causes of hypoglycaemia in children with SAM or MAM are:
Nutritional and pharmacological treatment

10 Eur J Transl Clin Med 2019;2(2):7-18
· a reduced amount of stored glucose in the muscles (decrease in muscle mass, wasting), · weakening of glucose conversion mechanisms (due to increased metabolism of proteins and fats), · immune response to infection (including the particularly dangerous Plasmodium falciparum infection), · impaired glucose absorption in the gastrointestinal tract (atrophy of the intestinal villi, gastrointestinal mycosis), · prolonged fasting and delayed introduction of nutrition (due to the long journey to the hospital) [26, 41-43].
Stabilisation Rehabilitation Phase
Step Days 1-2 Days 3-7 Weeks 2-6
1. Hypoglycaemia
2. Hypothermia
3. Dehydration
4. Electrolytes
5. Infections
6. Mictronutrients
7. Cautious feeding
8. Catch-up growth
9. Sensory stimulation
10. Prepare for follow-up
phase
Figure 1. Main steps in the treatment of SAM
non-Fe non-Fe with-Fe
If hypoglycaemia occurs in a child with SAM, im-mediate intervention should take place because this is the main cause of death in the first phase of treat-ment. If it is not possible to check the blood glucose level, it is recommended to administer prophylactic glucose solutions based on clinical symptoms [26]. Tre-atment of hypoglycaemia in the most common con-ditions is presented in Table 1 [14, 16-17, 26].
Table 1. Management of hypoglycaemia in various states
Statement Intervention Comments
Unconscious / convulsive child
5 ml of 10% sterile glucose i.v./kg body weight
(2-3 minutes)
1. Check the glucose level after 15 minutes. If blood glucose level is still below the norm, give an another bolus.2. After regaining consciousness, feed with F-75A diet.3. If there is no improvement, rapid diagnosis for another factors causing hypoglycaemia *
Source of data: WHO [14]

11The problem of paediatric patients in developing countries: do we...
There are infections that can significantly lower blood glucose levels, and thus reduce the effective-ness of conservative treatment. In the case of malaria (P. falciparum) infection, there is a decrease in blood glucose as a result of multi-enzymatic changes caused by infection and simultaneous starvation on the one hand [44-45], and on the other hand the treatment with quinine or quinidine leads to hyper-insulinemic hypoglycaemia [46-47]. It is recommended to admini-ster either drug by constant infusion with 5% glucose, active feeding during the disease and regular glucose measurement [14].
Hydration status assessment
Hydration status assessment (HSA) of malnourished paediatric patients is very difficult due to the differen-ces in the dehydration symptoms in different types of malnutrition. Furthermore, it is often difficult to deter-mine the acute symptoms of dehydration and chronic symptoms of malnutrition. Dehydration is a serious he-
Unconscious child with a nasogastric
tube (NG)
5 ml 10% sterile glucose per kg body weight i.v.
(2-3 minutes) and then 50 ml of 10% solution of glucose
or sucrose by NT
1. If vascular access is not available, 50 ml of a 10% glucose or glucose solution should be first administered via the NG2. After regaining consciousness, feed with F-75 diet or glucose dissolved in water (60g/L)3. If there is no improvement, rapid diagnosis for another factor causing hypoglycaemia *
Conscious child, without NG
50 ml of 10% glucose or sugar solution orally, next start F-75 diet every 30 minutes for the
next 2 hours. Then give a meal rich in complex carbohydrates.
1. If there is no improvement, rapid diagnosis for another factor causing hypoglycaemia *
Infant <6 months Diluted F-100B ** No information provided
* No clinical improvement may suggest severe infection (e.g. malaria, meningitis) or epilepsy. Perform a quick diagnostic test
and then apply the appropriate treatment (antibiotic therapy, anti-malarial therapy, anti-epileptic therapy) with the symptomatic
treatment of hypoglycaemia.
** MSF 2006 recommendation for the prevention of hypoglycaemia in children with SAM. However the WHO, MSF and UNICEF
guidelines do not include specific recommendations for the treatment of hypoglycaemia in infants < 6 months of age.A Formula 75; therapeutic milk, 100 ml of F-75 provides 75 kcal and 1 g of proteinB Formula 100; therapeutic milk, 100 ml of F-100 provides 100 kcal and 3 g of protein
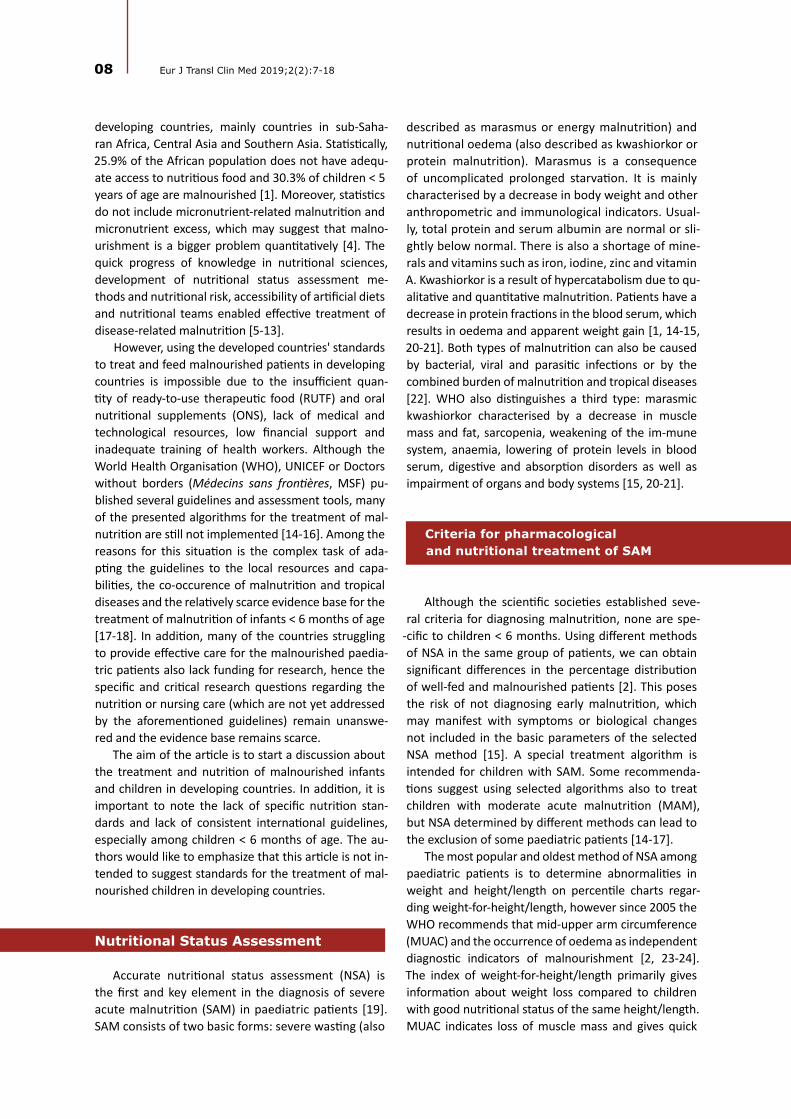
alth problem in the first phase of treatment and just like hypoglycaemia, it is one of the main causes of death in the course of MAM or SAM. The most severe compli-cation is severe hypovolemic shock [14, 17]. MSF and WHO suggest dividing patients into three groups: no si-gns of dehydration, moderate dehydration, and severe dehydration. More specific differences and assessment of dehydration severity are included in Table 2 [16, 48]. Matiland et al asked a bold question whether the risk of death in children with SAM could be identified using WHO protocols. In children with diarrhoea, hydra-tion status was of limited importance as a prognostic symptom because only 58% of deceased children were assessed as moderately or severely dehydrated. CRT best identified the high risk of death [49]. In proper-ly hydrated patients, oral rehydration salts (ORS) are used to prevent dehydration. In children < 2 years of age it is recommended to administer 50-100 ml after each stool until diarrhoea disappears. In moderately or severely dehydrated patient without hypovolemic or septic shock, it is recommended to give ORS 5-10 ml/kg/h for up to 12 hours orally. In case of swallowing
12 Eur J Transl Clin Med 2019;2(2):7-18
difficulty, fluids administration via nasogastric tube is recommended. For patients with complications, it is worth using the algorithm proposed by MSF suggesting the intravenous administration of a sterile solution of Ringer Lactate-Glucose 5% (RL-G%) [16]. Hydration is based on the daily hydration requirement (DHR) pre-sented in Table 3 [16]. In the case of significant weight loss due to dehydration, it is recommended to multiply the DHR by 1,5. If RL-G5% is unavailable, it is recom-mended to prepare your own formula by adding a steri-
Table 2. Hydration status assessment
Parameter Normal Moderate dehydration Severe dehydration
Awareness Normal Confused Sleepy or unconscious
Subcutaneous tissue
Tense Sunken around the eyes Sunken around the eyes, sunken fontanelle
Capillary Refill Time
Normal < 2 sec > 2 sec
Thirst Normal Intensified Intensified or none
Heart Rate Normal Tachycardia Tachycardia, cooling of the peripheral parts
Pulse Easily palpable Palpable Difficult to palpate
Weight Loss < 1% 1-5% 5-10%
OtherPerson drinks
normally History of watery stools
(1) Hypotension, (2) Loss of tears, dry tongue, reduced diuresis, (3) watery diarrhoea (> 3x loose, watery stools/day) is a specific parameter
le 50% glucose solution to 500 ml RL. If RL is unavailable, 0.9% saline may be used [16-17, 26]. Many national and international guidelines are based on the WHO recommendations from 1999 and still suggest to treat severe dehydration with intravenous half-strength Dar-row's solution with 5% glucose (dextrose) as the first choice and 0.45% (half-normal) saline with 5% glucose with 20 mmol/L potassium chloride [14, 17]. In contrast, the more recent WHO guidelines from 2013 recognised the aforementioned recommendations as a conditional
Table 3. Daily hydration requirements
Weight [kg] Dosage
0-10 100 ml/kg per day
11-20 1000 ml + (50 ml/kg for every kg over 10 kg) per day
> 20 1500 ml + (20-25 ml/kg for every kg over 20 kg) per day
Source of data: MSF guidelines [16]

13The problem of paediatric patients in developing countries: do we...
choice, and that the evidence for the effectiveness of such treatment is of very low quality. This was due to the limited availability of randomised controlled trials, trials comparing existing WHO recommendations with new treatment options, or trials documenting compari-sons of diagnoses and treatment methods [26].
There are no specific guidelines for HSA in children < 6 months. Nevertheless, the MAMI report indicates that the WHO, UNICEF and MSF guidelines can also be used in newborns [17]. It is important to monitor pro-gress during hydration (pulse rate, respiratory rate, uri-ne frequency, stool/vomit frequency) every half hour for the first 2 hours and then every hour for 6-12 ho-urs. In addition, the appearance of tears, moisture in the mouth, shortening of CRT, reduction of the collapse of the fontanelle and eyes may indicate a positive hy-dration process. However, attention should be paid to chronically malnourished patients, because even after adequate hydration these features may remain unchan-ged. There is a huge risk of over-hydration, which can also be fatal [50]. The 2006 MSF Nutrition Protocol hi-ghlights fluid therapy for watery diarrhoea. In diarrho-ea without dehydration and without above-mentioned features, ORS are not advised and frequent oral hydra-tion with water is recommended, not ORS. In the case of aversion to drinking plain water, the guidelines re-commend oral administration of 50 ml of a 10% sugar solution after each loose stool and HSA every 4 hours, mainly controlling weight loss. The goal of this procedu-re is to avoid complications associated with hydration, mainly over-treatment with fluids [48].
An important element in the treatment of dehydra-tion associated with severe diarrhoea is additional zinc supplementation. In international and national guideli-nes, supplementation with this element was limited to the use of rehydration solution for malnutrition (ReSo-Mal), which contains 0.3 mmol of zinc per litre of solu-tion [16-17]. MSF Nutrition recommends supplementa-tion with 10 mg zinc for 10 days in children < 6 months, and 20 mg zinc for 10 days in children > 6 months [48]. Many randomised studies have demonstrated the ef-fectiveness of additional zinc supplementation in child-ren > 6 months of age, but the significance in children < 6 has been questioned [51-53].
Additional supplementation
Serum levels of vitamin A, folic acid (FA) and iron should be laboratory checked in malnourished child-
ren, even if there are no clinical signs of deficiency [48]. Despite the recommendations to monitor these three micronutrients, especially in children with SAM > 6 months [17], the lack of access to medical laboratories, qualified laboratory personnel and medical equipment creates a significant barrier in Sub-Saharan Africa [54]. Thus, in many cases the deficiencies of these compo-nents are determined when significant clinical symp-toms already occur and often are very difficult to treat with inexpensive medicaments or when the patient is acutely ill. This is the a paradox of the requirements imposed by the guidelines of global organisations that cannot realistically be met in underfunded and unde-requipped health care facilities in developing countries.
Vitamin A
Supplementation with vitamin A, and its derivati-ves are used to prevent xerophthalmia and blindness, and to treat malnutrition and intestinal diseases. The incidence of infectious diseases decrease, and indirec-tly the mobility reduction, could be obtained through vitamin A related to gut immune tolerance/homeosta-sis, intestinal barrier integrity, and responses to ente-ropathogens in the context of the environmental en-teric dysfunction [55-60]. The MSF Nutrition Protocol recommends a single dose of 100,000 IU for children 6-12 months and 200,000 IU for children > 1 year [48]. 8 of 14 international guidelines and 15 of 23 national guidelines1 suggest supplementation of 50,000 IU vi-tamin A once orally on the first day of admission in children < 6 months [17]. A 2003 WHO report states that supplementing 5,000 IU of vitamin A daily during the hospital stay yields much better results than a sin-gle dose of 100,000 IU. This method of supplementa-tion prevents severe diarrhoea and respiratory dise-ases. A single dose seems to bring good results only during measles, in ongoing infectious diarrhoea and clinical symptoms of deficiency of this vitamin [26].
Haematopoietic elements
Vitamin B12, FA and iron (Fe) supplementation are considered for the prevention and treatment of ana-emia. The WHO, MSF and UNICEF recommend a sin-gle dose of 5 mg FA orally on the day of admission. Iron supplementation is recommended only during the rehabilitation phase due to iron toxicity, which in
1 Guidelines from countries in sub-Saharan Africa, Central Asia and Southern Asia.
14 Eur J Transl Clin Med 2019;2(2):7-18
malnourished patients may increase oxidative stress, contribute to electrolyte imbalance, disrupt metabolic processes and worsen intestinal infections. Only after correction of critical abnormalities (about 2 weeks), it is recommended to supplement Fe in children > 6 months (3 mg of elemental Fe/kg in 2 divided doses) [48]. Only 2 of 14 international guidelines and 2 of 23 national guidelines recommended similar supplemen-tation in children < 6 months [17]. One national guide-line recommended supplementation double dose of elemental iron in malnourished infants. In other guidelines, the recommendation was either not pro-vided or nutritional treatment with the F-100 formula was considered sufficient [17]. Although many studies have shown equal and sometimes significantly greater importance of vitamin B12 in preventing and treating anaemia in children with SAM, none of the guidelines recommend its supplementation [61-65].
Cautious feeding
Depending on the child's age, severity of mal-nutrition and associated diseases, nutritional treat-ment involves breastfeeding, formula F-75, formula F-100, diluted formula F-100 (F-100D), infant formula (IF), ready-to-use therapeutic food (RUTF), oral nutritio-nal supplements (ONS), and home-made milk feeds. The first phase of treatment (up to 7 days) is extremely important due to the fact of a precisely calculated dose of food, which aims to avoid failure in the treatment of malnutrition and especially overnutrition, including in the form of re-feeding syndrome. Most guidelines are consistent as to the frequency and methods of feeding in the first phase of treatment. A child > 6 months of age should be fed orally using a teaspoon, cup or syrin-ge. If the child is unable to swallow food on its own, it is rec-ommended to feed via nasogastric (NG) tube and to withdraw it as soon as the child is able to swallow. The guidelines are consistent as to the gradual feeding of the child with the appropriate calories. Muscle and tissue catabolism will increase when feeding < 80 kcal/kg/day, while feeding > 100 kcal/kg/day may contribu-te to a serious metabolic imbalance. The main compli-cations of overnutrition and overhydration in the first phase of treatment are congestive heart failure and death. Most common errors are due to excessive vo-lume of food given at one time, excessive sodium inta-ke and high protein intake. International and national guidelines have well-described tables, thanks to which health care workers can easily calculate and monitor the amount of food administered [14-17, 26, 39, 48]. The problem begins in children with SAM < 6 months because many guidelines do not specify this group in
their dietary recommendations. In 6 of 13 internatio-nal guidelines this topic was omitted completely, in 7 of 13 it was recommended to continue breastfeeding without detailed information, and 6 of 13 guidelines recognised F-75, F-100, F-100D and IF as a substitute for breastfeeding and details of feeding were presen-ted [17]. What the guidelines do not seem to take into account is the maternal peridelivery mortality in de-veloping countries, which results in orphaned infants for whom no breastmilk is available due to the lack of breast milk banks.
In a double-blind randomised trial, F-100 and F-100D were found to be of high safety in children < 6 months. In addition, F-100 restored the nutritio-nal status of children much more effectively and faster than IF [66]. Attempts have also been made to exa-mine the transition from formula F-75 to RUTF accor-ding to WHO recommendations. It turned out that the transition in the first time was only possible in 65% of cases, and almost impossible in acutely malnourished children or those with severe illnesses [67]. Rytter et al showed a strong correlation between feeding milk-
-rice porridges to children with SAM and the occurren-ce of refeeding syndrome (even with moderately low plasma phosphate levels) and F-75 was considered a safer product [68].
Nevertheless, there are questions about the ava-ilability of these nutritional preparations, both ready-
-made offered by WHO/UNICEF and those prepared at hospital or home using the recipes provided in the WHO and UNICEF training materials. In both cases, there are often problems with the distribution of food products or individual ingredients to create a standar-dised nutrient. This is often deepened by social unrest, corruption and a lack of financial support for treat-ment facilities in developing countries. Furthermore, compared to alternative nutritional approaches, RUTF improves recovery and slightly increases the rate of weight gain. Unfortunately, the effect on malnutrition recurrence or mortality after going on a normal diet is not fully known. The authors recommend further ran-domised controlled trials [69].
Conclusion
The lack of consistency between international and national guidelines on nutrition of children with SAM makes it difficult to treat malnourishment in develo-ping countries and most understatements occur in the treatment of infants < 6 months old. This topic requires many research trials that will significantly help tosolve the problem of diagnosis and pharmaco-logical-nutritional treatment of children 0-59 months.

15The problem of paediatric patients in developing countries: do we...
It is necessary to unify the NSA and the rules of ad-mitting children for nutritional treatment in medical facilities, because underdiagnosis may end in unne-cessary death. In addition, specialised expert groups studying the problem of malnutrition should attempt to present new treatments that could be used in the field internationally. The experience of local medical personnel who care for the malnourished should also
be taken into account. It is also worth asking the qu-estion why there is the problem of so many differen-ces in treatment protocols, and why there is so little scientific research in places affected by poverty. If almost 1/3 of children under 5 are malnourished in Africa, this fact should motivate to create professional and reliable standards of treatment child with SAM in developing countries.
References
1. FAO. The state of food security and nutrition in the world 2018. Building climate resilience for food security and nutrition [Internet]. 2018 [cited 2019 Nov 7]. Available from: www.fao.org/publications
2. Kang MC, Kim JH, Ryu S-W, Moon JY, Park JH, Park JK, et al. Prevalence of malnutrition in hospitalized patients: a mul-ticenter cross-sectional study. J Korean Med Sci [Internet]. 2018 [cited 2019 Nov 7];33(2):e10. Available from: https://www.ncbi.nlm.nih.gov/pmc/articles/PMC5729651/
3. Barker L, Gout B, Crowe T. Hospital malnutrition: prevalence, identification and impact on patients and the healthcare system. Int J Environ Res Public Health [Internet]. 2011 [cited 2019 Nov 8];8(2):514–27. Available from: http://www.ncbi.nlm.nih.gov/pubmed/21556200
4. Hwalla N, Al Dhaheri AS, Radwan H, Alfawaz HA, Fouda MA, Al-Daghri NM, et al. The prevalence of micronutrient de-ficiencies and inadequacies in the middle east and approaches to interventions. Nutrients [Internet]. 2017 [cited 2019 Nov 8];9(3):229. Available from: http://www.mdpi.com/2072-6643/9/3/229
5. Cederholm T, Barazzoni R, Austin P, Ballmer P, Biolo G, Bischoff SC, et al. ESPEN guidelines on definitions and termi-nology of clinical nutrition. Clin Nutr [Internet]. 2017 [cited 2019 Nov 8];36(1):49–64. Available from: http://dx.doi.org/10.1016/j.clnu.2016.09.004
6. Cederholm T, Bosaeus I, Barazzoni R, Bauer J, Van Gossum A, Klek S, et al. Diagnostic criteria for malnutrition – an ESPEN Consensus Statement. Clin Nutr [Internet]. 2015 [cited 2019 Nov 8];34(3):335–40. Available from: http://www.ncbi.nlm.nih.gov/pubmed/25799486
7. Arends J, Baracos V, Bertz H, Bozzetti F, Calder PC, Deutz NEP, et al. ESPEN expert group recommendations for action against cancer-related malnutrition. Clin Nutr [Internet]. 2017 [cited 2019 Nov 8];36(5):1187–96. Available from: https://doi.org/10.1016/j.clnu.2017.06.017
8. Bischoff SC, Austin P, Boeykens K, Chourdakis M, Cuerda C, Jonkers-Schuitema C, et al. ESPEN guideline on home enteral nutrition. Clin Nutr [Internet]. 2019 [cited 2019 Nov 8]; Available from: https://doi.org/10.1016/j.clnu.2019.04.022
9. Koletzko B, Goulet O, Hunt J, Krohn K, Shamir R, Parenteral Nutrition Guidelines Working Group, et al. Guidelines on pae-diatric parenteral nutrition of the European Society of Paediatric Gastroenterology, Hepatology and Nutrition (ESPGHAN) and the European Society for Clinical Nutrition and Metabolism (ESPEN), supported by the European Society of Paediatri. J Pediatr Gastroenterol Nutr [Internet]. 2005 [cited 2019 Nov 8];41 Suppl 2(Supplement 2):S1-87. Available from: http://www.sign.ac.
10. Turck D, Braegger CP, Colombo C, Declercq D, Morton A, Pancheva R, et al. ESPEN-ESPGHAN-ECFS guidelines on nutri-tion care for infants, children, and adults with cystic fibrosis. Clin Nutr [Internet]. 2016 [cited 2019 Nov 8];35(3):557–77. Available from: https://doi.org/10.1016/j.clnu.2016.03.004
11. Druml C, Ballmer PE, Druml W, Oehmichen F, Shenkin A, Singer P, et al. ESPEN guideline on ethical aspects of artifi-cial nutrition and hydration. Clin Nutr [Internet]. 2016 [cited 2019 Nov 8];35(3):545–56. Available from: http://dx.doi.org/10.1016/j.clnu.2016.02.006
12. Mihatsch W, Shamir R, van Goudoever JB, Fewtrell M, Lapillonne A, Lohner S, et al. ESPGHAN/ESPEN/ESPR/CSPEN guide-lines on pediatric parenteral nutrition: guideline development process for the updated guidelines. Clin Nutr [Internet]. 2018 [cited 2019 Nov 8];37(6):2306–8. Available from: https://doi.org/10.1016/j.clnu.2018.06.943
13. Kondrup J. ESPEN Guidelines for Nutrition Screening 2002. Clin Nutr [Internet]. 2003 [cited 2019 Nov 8];22(4):415–21. Available from: https://linkinghub.elsevier.com/retrieve/pii/S0261561403000980
14. WHO. Management of severe malnutrition: a manual for physicians and other senior health workers [Internet]. [cited 2019 Nov 8]. Available from: https://www.who.int/nutrition/publications/en/manage_severe_malnutrition_eng.pdf
16 Eur J Transl Clin Med 2019;2(2):7-18
15. WHO, Unicef. WHO child growth standards and the identification of severe acute malnutrition in infants and children [Internet]. [cited 2019 Nov 8]. Available from: www.who.int/childgrowth/standards
16. MSF. Clinical guidelines – diagnosis and treatment manual [Internet]. 2019th ed. 2019. Available from: https://medical-guidelines.msf.org/msf-books-hosting/14385582-English.pdf
17. Kerac M, Mcgrath M, Grijalva-Eternod C, Bizouerne C, Saxton J, Bailey H, et al. Management of Acute Malnutrition in Infants (MAMI) project. Technical review: current evidence, policies, practices & programme outcomes [Internet]. 2010 [cited 2019 Nov 19]. Available from: https://reliefweb.int/sites/reliefweb.int/files/resources/8A7E77D26B-35660F492576F70010D7DF-mami-report-complete.pdf
18. The double burden of malnutrition. Case studies from six developing countries [Internet]. 2006 [cited 2019 Nov 8]. Avail-able from: http://www.fao.org/3/a0442e/a0442e00.pdf
19. Green Corkins K, Teague EE. Pediatric nutrition assessment. Nutr Clin Pract [Internet]. 2017 [cited 2019 Nov 8];32(1):40–51. Available from: http://doi.wiley.com/10.1177/0884533616679639
20. Müller O, Krawinkel M. Malnutrition and health in developing countries. CMAJ [Internet]. 2005 [cited 2019 Nov 8];173(3):279–86. Available from: http://www.cmaj.ca/cgi/doi/10.1503/cmaj.050342
21. Velly H, Britton RA, Preidis GA. Mechanisms of cross-talk between the diet, the intestinal microbiome, and the under-nourished host. Gut Microbes [Internet]. 2017 [cited 2019 Nov 8];8(2):98–112. Available from: https://www.tandfonline.com/doi/full/10.1080/19490976.2016.1267888
22. Farhadi S, Ovchinnikov R. The relationship between nutrition and infectious diseases: a review. Biomed Biotechnol Res J [Internet]. 2018 [cited 2019 Nov 8];2(3):168. Available from: http://www.bmbtrj.org/text.asp?2018/2/3/168/240706
23. Fernandez MAL, Delchevalerie P, van Herp M. Accuracy of MUAC in the detection of severe wasting with the new WHO growth standards. Pediatrics [Internet]. 2010 [cited 2019 Nov 8];126(1):e195–201. Available from: http://pediatrics.aap-publications.org/cgi/doi/10.1542/peds.2009-2175
24. Jacob A, Iboyi K, Zha L. Severe Acute Malnutrition (SAM) evaluation of associated risk factors, screening tools, and thera-peutic management among South Sudanese children age 6 < 59 months in emergency settings: case reports and review of literatures. J Trop Dis. 2019;7(2):298.
25. Mwangome MK, Fegan G, Mbunya R, Prentice AM, Berkley JA. Reliability and accuracy of anthropometry performed by community health workers among infants under 6 months in rural Kenya. Trop Med Int Heal [Internet]. 2012 May [cited 2019 Nov 8];17(5):622–9. Available from: https://reliefweb.int/sites/reliefweb.int/files/resources/8A7E77D26B-35660F492576F70010D7DF-mami-report-complete.pdf
26. WHO. Guideline: updates on the management of severe acute malnutrition in infants and children [Internet]. Geneva; 2013 [cited 2019 Nov 8]. Available from: www.who.int
27. Natale V, Rajagopalan A. Worldwide variation in human growth and the World Health Organization growth standards: a systematic review. BMJ Open [Internet]. 2014 [cited 2019 Nov 8];4(1):e003735. Available from: http://www.ncbi.nlm.nih.gov/pubmed/24401723
28. MSF. Nutrition guidelines [Internet]. 1995 [cited 2019 Nov 8]. Available from: https://www.unhcr.org/3c4d391a4.pdf29. Politique nationale de nutrition [Internet]. [cited 2019 Nov 8]. Available from: http://extwprlegs1.fao.org/docs/pdf/
mli152514.pdf30. Nutrition Unit of the Ministry of Health. Malawi guidelines for community-based management of acute malnutrition,
2nd edition [Internet]. 2016 [cited 2019 Nov 8]. Available from: https://www.fantaproject.org/sites/default/files/re-sources/Malawi-CMAM-Guidelines-Dec2016.pdf
31. MISAU. Manual de tratamento e reabilitação nutricional volume I: 0 aos 14 anos [Internet]. 2018 [cited 2019 Nov 8]. Available from: https://www.fantaproject.org/sites/default/files/resources/PRN-I-Manual-Tratamento-Reabilitação-Nu-tricional-Vol-I-Set2018.pdf
32. Integrated management of acute malnutrition. National guidelines. 2018. 33. Training course on inpatient management of severe acute malnutrition. Children 6–59 months with SAM and medical
complications. 2011. 34. Interim manual community-based management of severe acute malnutrition version 1.0 [Internet]. [cited 2019 Nov 8].
Available from: https://www.fantaproject.org/sites/default/files/resources/GOS_CMAM_Manual_version 1.0 Novem-ber2009.pdf
35. UNICEF. Prise en charge de la malnutrition aiguë sévère chez les enfants: vers des résultats à grande échelle guide des Programmes de l’unicef [Internet]. 2015 [cited 2019 Nov 8]. Available from: http://www.unicefinemergencies.com/downloads/eresource/docs/2.3 Nutrition/SAM PRO 2015 French with links.pdf

17The problem of paediatric patients in developing countries: do we...
36. Jayatissa R, Bekele A, Kethiswaran A, De Silva AH. Community-based management of severe and moderate acute malnu-trition during emergencies in Sri Lanka: challenges of implementation. Food Nutr Bull [Internet]. 2012 [cited 2019 Nov 8];33(4):251–60. Available from: http://journals.sagepub.com/doi/10.1177/156482651203300405
37. Kent Page, Unicef, DRC. Infant Feeding in Emergencies Module 2 Version 1.1 for health and nutrition workers in emer-gency situations [Internet]. 2007 [cited 2019 Nov 8]. Available from: http://www.ennonline.net/ife
38. Unicef. Plan National d’Action pour la Nutrition-III [Internet]. 2017 [cited 2019 Nov 8]. Available from: https://www.unicef.org/madagascar/sites/unicef.org.madagascar/files/2018-08/Madagascar-nutrition-PNAN3.pdf
39. FEX AC. Weighing scales for young infants: a survey of relief workers. 2006; 40. Ashworth A, Chopra M, McCoy D, Sanders D, Jackson D, Karaolis N, et al. WHO guidelines for management of severe
malnutrition in rural South African hospitals: effect on case fatality and the influence of operational factors. Lancet [Internet]. 2004 [cited 2019 Nov 8];363(9415):1110–5. Available from: https://linkinghub.elsevier.com/retrieve/pii/S0140673604158947
41. Ashworth A. Treatment of severe malnutrition. J Pediatr Gastroenterol Nutr. 2001;32(5):516–518. 42. Bandsma RHJ, Spoelstra MN, Mari A, Mendel M, van Rheenen PF, Senga E, et al. Impaired glucose absorption in children
with severe malnutrition. J Pediatr [Internet]. 2011 [cited 2019 Nov 8];158(2):282-287.e1. Available from: https://linkin-ghub.elsevier.com/retrieve/pii/S0022347610006268
43. Karaolis N, Jackson D, Ashworth A, Sanders D, Sogaula N, McCoy D, et al. WHO guidelines for severe malnutrition: are they feasible in rural African hospitals? Arch Dis Child [Internet]. 2007 [cited 2019 Nov 8];92(3):198–204. Available from: http://www.ncbi.nlm.nih.gov/pubmed/16670119
44. Thien H V., Kager PA, Sauerwein HP. Hypoglycemia in falciparum malaria: is fasting an unrecognized and insufficiently em-phasized risk factor? Trends Parasitol [Internet]. 2006 [cited 2019 Nov 8];22(9):410–5. Available from: https://linkinghub.elsevier.com/retrieve/pii/S1471492206001759
45. Madrid L, Lanaspa M, Maculuve SA, Bassat Q. Malaria-associated hypoglycaemia in children. Expert Rev Anti Infect Ther [Internet]. 2015 [cited 2019 Nov 8];13(2):267–77. Available from: http://www.tandfonline.com/doi/full/10.1586/14787210.2015.995632
46. Njomatchoua AC, Tankeu AT, Sobngwi E, Mbanya J-C. Glycemic effects of quinine infusion in healthy volunteers. BMC Res Notes [Internet]. 2017 [cited 2019 Nov 8];10(1):423. Available from: http://www.ncbi.nlm.nih.gov/pubmed/28836995
47. Cox CD, Anderson AC, Chittivelu S. Quinine overdose: hypoglycemia potentiated by age and alcohol. J Pharm Technol [Internet]. 2001 [cited 2019 Nov 8];17(6):270–2. Available from: http://journals.sagepub.com/doi/10.1177/875512250101700605
48. MSF. Nutrition Guidelines. 2nd edition. 2006. 49. Maitland K, Berkley JA, Shebbe M, Peshu N, English M, Newton CRJC. Children with severe malnutrition: can those at
highest risk of death be identified with the WHO protocol? Molyneux E, editor. PLoS Med [Internet]. 2006 [cited 2019 Nov 17];3(12):e500. Available from: https://dx.plos.org/10.1371/journal.pmed.0030500
50. Ashworth A, Khanum S, Jackson A, Schofield C. Guidelines for the inpatient treatment of severely malnourished children [In-ternet]. 2003 [cited 2019 Nov 17]. Available from: https://apps.who.int/iris/bitstream/handle/10665/42724/9241546093.pdf?sequence=1
51. Rerksuppaphol L, Rerksuppaphol S. Efficacy of zinc supplementation in the management of acute diarrhoea: a ran-domised controlled trial. Paediatr Int Child Health [Internet]. 2019 [cited 2019 Nov 17];1–6. Available from: http://www.ncbi.nlm.nih.gov/pubmed/31578136
52. Lazzerini M, Ronfani L. Oral zinc for treating diarrhoea in children. In: Lazzerini M, editor. Cochrane Database of System-atic Reviews [Internet]. Chichester, UK: John Wiley & Sons, Ltd; 2012 [cited 2019 Nov 17]. p. CD005436. Available from: http://www.ncbi.nlm.nih.gov/pubmed/22696352
53. Somji SS, Dhingra P, Dhingra U, Dutta A, Devi P, Kumar J, et al. Effect of dose reduction of supplemental zinc for childhood diarrhoea: study protocol for a double-masked, randomised controlled trial in India and Tanzania. BMJ Paediatr Open [Internet]. 2019 [cited 2019 Nov 17];3(1):e000460. Available from: http://bmjpaedsopen.bmj.com/lookup/doi/10.1136/bmjpo-2019-000460
54. Petti CA, Polage CR, Quinn TC, Ronald AR, Sande MA. Laboratory medicine in Africa: a barrier to effective health care. Clin Infect Dis [Internet]. 2006 [cited 2019 Nov 17];42(3):377–82. Available from: https://academic.oup.com/cid/arti-cle-lookup/doi/10.1086/499363
55. Gutierrez-Mazariegos J, Theodosiou M, Campo-Paysaa F, Schubert M. Vitamin A: a multifunctional tool for development. Semin Cell Dev Biol [Internet]. 2011 [cited 2019 Nov 17];22(6):603–10. Available from: https://linkinghub.elsevier.com/retrieve/pii/S1084952111000814

18 Eur J Transl Clin Med 2019;2(2):7-18
56. Kanungo J. Retinoic acid signaling in P19 stem cell differentiation. Anticancer Agents Med Chem [Internet]. 2017 [cited 2019 Nov 17];17(9). Available from: http://www.eurekaselect.com/143305/article
57. Sommer A. Preventing blindness and saving lives: the centenary of vitamin A. JAMA Ophthalmol [Internet]. 2014 [cited 2019 Nov 17];132(1):115–7. Available from: http://archopht.jamanetwork.com/article.aspx?doi=10.1001/jamaophthal-mol.2013.5309
58. Paganelli A, Gnazzo V, Acosta H, López SL, Carrasco AE. Glyphosate-based herbicides produce teratogenic effects on vertebrates by impairing retinoic acid signaling. Chem Res Toxicol [Internet]. 2010 [cited 2019 Nov 17];23(10):1586–95. Available from: http://www.ncbi.nlm.nih.gov/pubmed/20695457
59. Robinson JF, Verhoef A, Pennings JLA, Pronk TE, Piersma AH. A comparison of gene expression responses in rat whole embryo culture and in vivo: time-dependent retinoic acid-induced teratogenic response. Toxicol Sci [Internet]. 2012 [cited 2019 Nov 17];126(1):242–54. Available from: https://academic.oup.com/toxsci/article-lookup/doi/10.1093/toxsci/kfr342
60. de Medeiros PHQS, Pinto D V, de Almeida JZ, Rêgo JMC, Rodrigues FAP, Lima AÂM, et al. Modulation of intestinal im-mune and barrier functions by vitamin A: implications for current understanding of malnutrition and enteric infections in children. Nutrients [Internet]. 2018 [cited 2019 Nov 17];10(9):1128. Available from: http://www.mdpi.com/2072-6643/10/9/1128
61. Yaikhomba T, Poswal L, Goyal S. Assessment of iron, folate and vitamin B12 status in severe acute malnutrition. Indian J Pedi-atr [Internet]. 2015 [cited 2019 Nov 17];82(6):511–4. Available from: http://link.springer.com/10.1007/s12098-014-1600-7
62. Thakur N, Chandra J, Pemde H, Singh V. Anemia in severe acute malnutrition. Nutrition [Internet]. 2014 [cited 2019 Nov 17];30(4):440–2. Available from: https://linkinghub.elsevier.com/retrieve/pii/S0899900713004437
63. Villalpando S, Cruz V de la, Shamah-Levy T, Rebollar R, Contreras-Manzano A. Nutritional status of iron, vitamin B12, folate, retinol and anemia in children 1 to 11 years old: results of the Ensanut 2012. Salud Publica Mex [Internet]. 2015 [cited 2019 Nov 17];57(5):372–84. Available from: http://www.saludpublica.mx/index.php/spm/article/view/7616
64. Metz J. A high prevalence of biochemical evidence of vitamin B12 or folate deficiency does not translate into a compara-ble prevalence of anemia. Food Nutr Bull [Internet]. 2008 [cited 2019 Nov 17];29(2 Suppl):S74-85. Available from: http://journals.sagepub.com/doi/10.1177/15648265080292S111
65. Shah R, Javdekar B. Management of children with severe acute malnutrition: experience of nutrition rehabilitation cen-tre at Baroda, Gujarat. Int J Contemp Pediatr [Internet]. 2014 [cited 2019 Nov 17];1(1):3. Available from: http://www.ijpediatrics.com
66. Islam MM, Huq S, Hossain MI, Ahmed AMS, Ashworth A, Mollah MAH, et al. Efficacy of F-100, diluted F-100, and infant formula as rehabilitation diet for infants aged < 6 months with severe acute malnutrition: a randomized clinical trial. Eur J Nutr [Internet]. 2019 [cited 2019 Nov 17]; Available from: http://www.ncbi.nlm.nih.gov/pubmed/31367914
67. Lanyero B, Namusoke H, Nabukeera-Barungi N, Grenov B, Mupere E, Michaelsen KF, et al. Transition from F-75 to ready-to-use therapeutic food in children with severe acute malnutrition, an observational study in Uganda. Nutr J [Internet]. 2017 [cited 2019 Nov 17];16(1):52. Available from: http://nutritionj.biomedcentral.com/articles/10.1186/s12937-017-0276-z
68. Rytter MJH, Babirekere-Iriso E, Namusoke H, Christensen VB, Michaelsen KF, Ritz C, et al. Risk factors for death in chil-dren during inpatient treatment of severe acute malnutrition: a prospective cohort study. Am J Clin Nutr [Internet]. 2017 [cited 2019 Nov 17];105(2):494–502. Available from: https://academic.oup.com/ajcn/article/105/2/494-502/4633943
69. Schoonees A, Lombard MJ, Musekiwa A, Nel E, Volmink J. Ready-to-use therapeutic food (RUTF) for home-based nutri-tional rehabilitation of severe acute malnutrition in children from six months to five years of age. Cochrane database Syst Rev [Internet]. 2019 [cited 2019 Nov 17];5(5):CD009000. Available from: http://doi.wiley.com/10.1002/14651858.CD009000.pub3
RESEARCH ARTICLE
Sex-related differences in patients undergoing radiofrequency ablation of atrioventricular nodal reentrant tachycardia
Abstract
Background: Atrioventricular nodal reentry tachycardia (AVNRT) is the most common paroxysmal supraventricular tachycardia. The relatively ineffective antiarrhythmic drugs and the predominant young age makes the catheter ablation the therapy of choice in many patients. This results in predominance of this arrhythmia in electrophysio-logical labs. The aim of the study was to analyze the gender-related differences among patients undergoing the ra-diofrequency catheter ablation of slow pathway entrance to the atrioventricular node. Material and methods: The study group comprised of 147 consecutive patients with diagnosed atrioventricular nodal reentry tachycardia, who underwent the radiofrequency catheter ablation (RFCA) of slow pathway. Patients have been divided into 2 groups, based on sex. Results: The overall 97.3% of effectiveness of RFCA was observed. Women were significantly younger than men (53.7 +/- 17.2 vs. 57.7 +/- 9.8 years) with lower radiation dose (2383.5 +/- 1993.2 vs. 2891.6 +/- 2377.1 cGyxcm2). Conclusions: Younger age of women in comparison to men during RFCA of AVNRT reflects earlier onset of symptoms in women. Gender does not affect the time of fluoroscopy, but the higher rate of inducible tachycardia after RFCA in women may suggest the existence of anatomical difficulties or the operator’s apprehensions. Sex-re-lated difference in radiation dose that we have observed may result from the greater volume of the men’s chest.
Keywords: AVNRT · RF ablation · age · gender
EUROPEAN JOURNAL OF TRANSLATIONAL AND CLINICAL MEDICINE 2019;2(2):19-22
Citation
Sokołowska J, Sokołowska M, Adamowicz J, Zyśko D, Radziejewska J, Sławuta A. Sex-related differences in patients undergoing radiofrequency ablation of atrioventricular nodal reentrant tachycardia. Eur J Transl Clin Med. 2019;2(2):19-22.DOI: 10.31373/ejtcm/115072
Corresponding author:Agnieszka Sławuta, Department of Internal and Occupational Diseases, Hypertension and Clinical Oncology, Wrocław Medical University, Wrocław, Polande-mail: [email protected] external funds. Available online: www.ejtcm.gumed.edu.plCopyright ® Medical University of Gdańsk
Joanna Sokołowska1, Magdalena Sokołowska2, Jakub Adamowicz2 ,
Dorota Zyśko3 , Jadwiga Radziejewska4, Agnieszka Sławuta5
1Praxis Joanna Sokołowska, Ingolstadt, Germany2Department of Cardiology, Kłodzko County Hospital, Kłodzko, Poland3Department of Emergency Medicine, Wrocław Medical University, Wrocław, Poland4Kłodzko County Hospital, Kłodzko, Poland5Department of Internal and Occupational Diseases, Hypertension and Clinical Oncology, Wrocław Medical University, Wrocław, Poland
This is Open Access article distributed under the terms of the Creative Commons Attribution-ShareAlike 4.0 International.

20 Eur J Transl Clin Med 2019;2(2):19-22
Introduction
Atrioventricular nodal reentry tachycardia (AVNRT) is the most common type of paroxysmal supraventri-cular tachycardia, accounting for approximately 60% of all narrow-QRS-complex tachycardias [1-2]. AVNRT is up to 4 times more likely to affect women than men and tends to appear in young patients (mean age of 32 years) [2-4]. The reentrant mechanism of this arrhyth-mia results from the existence of the ‘fast’ and ‘slow’ atrioventricular nodal entry pathways, differing in con-duction velocity and refractory period [5]. Due to the relatively ineffective antiarrhythmic pharmacotherapy and the predominant young age of the patients, cathe-ter ablation continues to be considered the treatment of choice [6]. This method was introduced in 1982 by Gallagher et al [7]. The slow pathway ablation is a hi-ghly-effective method, with a success-rate of over 91-95%, minor recurrence index and a very low complica-tion rate of 0.2-0.7% [8-9].
The recommended invasive treatment resulted in AVNRT being one of the dominant clinical entities treated in electrophysiology labs and could influence the change in the patient population. The prevalence of this arrhythmia also contributed to better training of the physicians performing the ablation procedures. Moreover, the newly available techniques, such as cryoablation, could change the electrophysiologists’ attitude toward the endpoints of the first ablation, in particular in younger patients. We further hypothesize that the patient’s characteristics and effective results assessment have changed along with an increased number of performed ablation procedures.
Aim
The aim of the study was to analyze the gender--related differences among patients undergoing the radiofrequency catheter ablation (RFCA) of slow pa-thway entrance to the atrioventricular node.
Materials and methods
The study group comprised of 147 consecutive pa-tients with diagnosed atrioventricular nodal reentry ta-chycardia, who underwent the RFCA of slow pathway between January 2012 and December 2017. Standard RFCA was performed using one diagnostic decapolar deflectable catheter located in the coronary sinus. We used 4 mm tip, non-irrigated, radiofrequency catheters for His-bundle location and the procedure itself. The temperatures were initially set for 52° Celsius (C) and then increased to 56-58° C. The RF ablation was pre-
ceded by an electrophysiological study aiming at the assessment of the properties of the atrioventricular junction and implicitly at the induction of the AVNRT. The procedure was performed in the presence of dual atrial echoes during programmed atrial pacing on pa-tients with a clinically confirmed arrhythmia, after exc-luding an accessory pathway. The ablation process was aimed to change the electrophysiological properties of the slow pathway eventually to total elimination of the slow pathway conduction. Clinically, the purpose of the procedure was the non-inducibility of the arrhyth-mia or profound changes to the AV junction properties which could prevent the tachycardia recurrence.
Patients were divided into 2 groups based on sex. Parameters, such as age, cycle length duration, Wenc-kebach point, time of fluoroscopy, the radiation expo-sure and effect of the procedure were analyzed. The effect of the procedure was rated based on the scale presented in the table 1. The analyzed parameters are presented as the means and standard deviations. As-sessment of the statistical significance was performed using the non-parametric Mann-Whitney U Test. P va-lue < 0.05 was considered statistically significant.
Score Effect
0 Ineffective procedure
1Slight slow pathway modification,
single echo beats
2 Impossible to induce arrhythmia
3Deep slow pathway modification,
the presence of AH 'jump' in AV conduction
4Periodic occurrence of a AH
‘jump’ in AV conduction
5Absence of the conduction
in a slow pathway
Table 1. Assessment of the radiofrequency catheter ablation of slow
pathway entrance to the atrioventricular node procedure efficacy
AV – atrioventricular

Results
The clinical and procedural characteristics of the studied patients were presented in table 2.
In 4 cases - all female patients the non-inducibility of the tachycardia could not be obtained; there was no such case among men. The overall 97,3% of ef-fectiveness was observed. Women were significantly younger than men (53,7 +/- 17,2 vs. 57,7 +/- 9,8) with lower radiation dose (2383,5 +/- 1993,2 vs. 2891,6 +/- 2377,1). We did not observe any statistically si-gnificant sex-related differences among the patients within the other parameters.
Discussion
RFCA is a highly successful method in both men, and women. According to the literature, women expe-rience more symptoms than men, but they have lon-ger time of delay before ablation [10-11]. Carnlöf et al. showed, that 17% of women stated that they were not taken seriously (vs. 7% men) and were misdiagnosed more frequently as suffering from panic disorders [12-13]. According to the results of Liuba et al. acute suc-cess rate and the recurrence rate were similar in both sexes, although some authors claim that women are more likely have certain arrhythmia symptoms after the procedure [14]. In our study, women undergoing RFCA were younger than men, what can be explained by the earlier onset of symptoms in women. This asso-ciation was documented by Deneke et al. with onset of symptomatic AVNRT at age of 38 +/- 18 in women vs. 51 +/- 18 years in men (p = 0.01) [15]. In the study
Table 2. The analyzed parameters in the patient sample
Women (n = 104)
Men (n = 43)
All patients (n = 147) P value
Age (years) 53.7 ± 17.2 57.7 ± 9.8 55.2 ± 14.9 p < 0.05
Cycle length (ms) 381.2 ± 74 377.2 ± 58.3 380.3 ± 70.4 n.s
Wenckebach point (ms) 377.1 ± 78.3 389.4 ± 80.9 390.5 ± 79.5 n.s
Fluoroscopy (s) 335.5 ± 229.2 338.3 ± 187.4 336.3 ± 217.2 n.s
Radiation dose (cGy x cm2 )
2383.5 ± 1993.2
2891.6 ± 2377.1
2532.2 ± 2117.1
p < 0.05
Effect of the procedure (scale)
3.0 ± 1.3 3.2 ± 1.0 3.1 ± 1.2 n.s
Suenari et al. women were also significantly younger than men [16]. The above-mentioned study by Liuba et al. showed however the differences in age of pa-tients with heart disease and with lone AVNRT.
Associated heart disease was present in patients who experienced the first episode of tachycardia at a significantly older age (women 50 +/- 18 and men 45 +/- 20) what more precisely reflects the features of our population [14]. The differences in AV conduction properties are probably the reason of different inciden-ce of AVNRT [16]. In women Wenckebach block point was lower than in men. The same results presented Liu et al. in study on sex differences in AV conduction [17].
The duration of fluoroscopy did not differ between sexes, but there was a difference in radiation exposure between men and women. Those results are similar to earlier studies and most probably should be attributed to the patients’ body dimensions and the default set-tings of fluoroscopy [10, 16, 18].
Conclusions
Younger age of women in comparison to men during RFCA of AVNRT reflects earlier onset of symp-toms in women. Sex does not affect the time of flu-oroscopy, but the higher rate of inducible tachycardia after RFCA in women may suggest the existence of anatomical difficulties or the operator’s apprehen-sions. Sex-related difference in radiation dose that we have observed may result from the greater volume of the men’s chest.
21Sex-related differences in patients undergoing radiofrequency...

1. Katritsis DG, Camm AJ. Atrioventricular nodal reentrant tachycardia. Circulation. 2010;122(8):831-40. Available from: https://doi.org/10.1161/CIRCULATIONAHA.110.936591
2. Porter MJ, Morton JB, Denman R, Lin AC, Tierney S, Santucci PA, Cai JJ, Madsen N, Wilber DJ. Influence of age and gender on the mechanism of supraventricular tachycardia. Heart Rhythm. 2004;1(4):393-6. Available from: https://doi.org/10.1016/j.hrthm.2004.05.007
3. Lang F. Encyclopedia of molecular mechanisms of disease. Springer Science & Business Media; 2009.4. Goyal R, Zivin A, Souza J, Shaikh SA, Harvey M, Bogun F, Daoud E, Man KC, Strickberger SA, Morady F. Compari-
son of the ages of tachycardia onset in patients with atrioventricular nodal reentrant tachycardia and accessory pathway-mediated tachycardia. Am Heart J. 1996;132(4):765-7. Available from: https://doi.org/10.1016/S0002-8703(96)90308-7
5. Jackman WM, Beckman KJ, McClelland JH, Wang X, Friday KJ, Roman CA, Moulton KP, Twidale N, Hazlitt HA, Prior MI, et al. Treatment of supraventricular tachycardia due to atrioventricular nodal reentry by radiofrequency cathe-ter ablation of slow-pathway conduction. N Engl J Med. 1992;327(5):313-8. Available from: https://doi.org/10.1056/NEJM199207303270504
6. Katritsis DG, Zografos T, Katritsis GD, Giazitzoglou E, Vachliotis V, Paxinos G, Camm AJ, Josephson ME. Catheter abla-tion vs. antiarrhythmic drug therapy in patients with symptomatic atrioventricular nodal re-entrant tachycardia: a rand-omized, controlled trial. Europace. 201;19(4):602-606. Available from: https://doi.org/10.1093/europace/euw064
7. Gallagher JJ, Svenson RH, Kasell JH, German LD, Bardy GH, Broughton A, Critelli G. Catheter technique for closed-chest ablation of the atrioventricular conduction system. N Engl J Med. 1982;306(4):194-200. Available from: https://doi.org/10.1056/NEJM198201283060402
8. Yaminisharif A, Davoodi G, Kasemisaeid A, Farahani AV, Ghazanchai F, Moghaddam M. Radiofrequency Catheter Ablation of Atrioventricular Nodal Reentrant Tachycardia: Success Rates and Complications during 14 Years of Experience. J Teh-ran Heart Cent. 2010;5(2):87-91. Available from: http://jthc.tums.ac.ir/index.php/jthc/article/view/168
9. Femenía F, Arce M, Arrieta M, Palazzolo J, Trucco E. Long-term results of slow pathway ablation in patients with atrio-ventricular nodal reentrant tachycardia: simple approach. J Electrocardiol. 2012;45(3):203-8. Available from: https://doi.org/10.1016/j.jelectrocard.2011.12.007
10. Dagres N, Clague JR, Breithardt G, Borggrefe M. Significant gender-related differences in radiofrequency catheter abla-tion therapy. J Am Coll Cardiol. 2003;42(6):1103-7. Available from: https://doi.org/10.1016/S0735-1097(03)00925-2
11. Wood KA, Wiener CL, Kayser-Jones J. Supraventricular tachycardia and the struggle to be believed. Eur J Cardiovasc Nurs. 2007;6(4):293-302. Available from: https://doi.org/10.1016/j.ejcnurse.2007.02.006
12. Carnlöf C, Iwarzon M, Jensen-Urstad M, Gadler F, Insulander P. Women with PSVT are often misdiagnosed, referred later than men, and have more symptoms after ablation. Scand Cardiovasc J. 2017;51(6):299-307. Available from: https://doi.org/10.1080/14017431.2017.1385837
13. Lessmeier TJ, Gamperling D, Johnson-Liddon V, Fromm BS, Steinman RT, Meissner MD, Lehmann MH. Unrecognized par-oxysmal supraventricular tachycardia. Potential for misdiagnosis as panic disorder. Arch Intern Med. 1997;157(5):537-43. Available from: https://doi.org/10.1001/archinte.1997.00440260085013
14. Liuba I, Jönsson A, Säfström K, Walfridsson H. Gender-related differences in patients with atrioventricular nodal reentry tachycardia. Am J Cardiol. 2006;97(3):384-8. Available from: https://doi.org/10.1016/j.amjcard.2005.08.042
15. Deneke T, Müller P, Lawo T, Lemke B, Horlitz M, Calcum B, Bösche LI, Mügge A, Grewe PH. Gender differences in onset of symptoms in AV nodal re-entrant and accessory pathway-mediated re-entrant tachycardia. Herzschrittmacherther Elektrophysiol. 2009;20(1):33-8. Available from: https://doi.org/10.1007/s00399-009-0036-7
16. Suenari K, Hu Y-F, Tso H-M, Tai C-T, Chiang C-E, Lin Y-J, et al. Gender Differences in the Clinical Characteristics and Atri-oventricular Nodal Conduction Properties in Patients With Atrioventricular Nodal Reentrant Tachycardia. J Cardiovasc Electrophysiol. 2010;21(10):1114–9. Available from: https://doi.org/10.1111/j.1540-8167.2010.01779.x
17. Liu S, Yuan S, Hertervig E, Kongstad O, Olsson SB. Gender and atrioventricular conduction properties of patients with symptomatic atrioventricular nodal reentrant tachycardia and Wolff-Parkinson-White syndrome. J Electrocardiol. 2001;34(4):295–301. Available from: https://doi.org/10.1054/jelc.2001.26316
18. Rosenthal LS, Mahesh M, Beck TJ, Saul JP, Miller JM, Kay N, Klein LS, Huang S, Gillette P, Prystowsky E, Carlson M, Berger RD, Lawrence JH, Yong P, Calkins H. Predictors of fluoroscopy time and estimated radiation exposure during radiofre-quency catheter ablation procedures. Am J Cardiol. 1998;82(4):451-8. Available from: https://doi.org/10.1016/S0002-9149(98)00356-7
References
22 Eur J Transl Clin Med 2019;2(2):19-22
RESEARCH ARTICLE
Can medical staff have visible tattoos? A survey study among students
Abstract
Background: Tattoo is becoming a more and more common form of body decoration of people from representati-ves of various professions.The aim of this study was: what is the opinion of university students about medical staff having visible tattoos. Material and methods: The study was conducted among the students of four universities in Gdańsk. The questionnaire contained questions about the acceptance of visible tattoos in people working in medical professions. The respondents were also asked about their attitudes to tattoos as a form of body decora-tion and whether they had tattoos themselves. The statistical analysis was performed using IBM SPSS Statistics 25 software. Results: Filled-in questionnaires were obtained from 676 respondents, including 477 students of the medical university and 199 students of non-medical universities. The students who have tattoos themselves ac-cept visible tattoos in healthcare professionals to a significantly greater extent (92%) than those who do not have tattoos, but the acceptance of visible tattoos in healthcare professionals in this group turned out to be very high too (75%). The respondents most readily accepted a visible tattoo on the skin of a laboratory diagnostician (75%). Conclusions: University students, regardless of their university profile, consider a visible tattoo as a completely acceptable phenomenon in healthcare professionals.
Keywords: health care professionals · visible tattoos · dress code
EUROPEAN JOURNAL OF TRANSLATIONAL AND CLINICAL MEDICINE 2019;2(2):23-26
Citation
Paprocka-Lipińska A, Majeranowski A, Drozd-Garbacewicz M, Mazanek M, Hebdzińska M, Styszko J. Can medical staff have visible tattoos? A survey study among studentsEur J Transl Clin Med. 2019;2(2):23-26.DOI: 10.31373/ejtcm/113511
Corresponding author:
Anna Paprocka-Lipińska, Department of Ethics, Medical University of Gdańsk, Poland
e-mail: [email protected]
No external funds.
Available online: www.ejtcm.gumed.edu.pl
Copyright ® Medical University of Gdańsk
Anna Paprocka-Lipińska1 , Alan Majeranowski1 , Małgorzata
Drozd-Garbacewicz1 , Małgorzata Mazanek2, Maria Hebdzińska2,
Joanna Styszko2
1Department of Ethics, Medical University of Gdańsk, Poland2Students Circle of Bioethics, Department of Ethics, Medical University of Gdańsk,Poland
This is Open Access article distributed under the terms of the Creative Commons Attribution-ShareAlike 4.0 International.

24 Eur J Transl Clin Med 2019;2(2):23-26
Introduction
Tattoo, defined as intentional and permanent skin pigmentation, is becoming a more and more com-mon phenomenon in the public space. According to an epidemiological study from 2015, the incidence of tattoos among the inhabitants of industrialised co-untries which indicate that approximately 30% of the adult population has at least one tattoo [1]. While in the past tattoos were mainly a form of expression of belonging to a subculture or social group, today they have become a vivid form of body decoration. Recen-tly, having a tattoo has become a common phenome-non in various social groups and professions, inclu-ding healthcare.
Aim
The aim of the study was to find out what is the opinion of university students about people working in medical professions having visible tattoos that cannot be easily covered with clothes (on the face, neck and hands).
Material and methods
A survey was conducted among the students of four universities in Gdańsk: the Medical University of Gdańsk, Stanislaw Moniuszko Academy of Music in Gdańsk, Gdańsk University of Technology and the University of Gdańsk. The self-administered question-naire consisted of questions about the acceptance of medical professionals having visible tattoos. The respondents were also asked about their attitudes to tattoos as a form of body decoration and whether they had tattoos themselves. The study was approved by the Independent Bioethics Committee for Scientific Research of the Medical University of Gdańsk (appro-val no. NKBBN/724/2018-2019).
The statistical analysis was performed using IBM SPSS Statistics 25 software. The data was analysed using statistical description and comparison of sub-group results with chi-square test (comparison of proportions). The assumed probability value was p < 0.05, which means that the differences between the compared groups were considered as statistically si-gnificant if the p-value was smaller than 0.05.
Results
A completed questionnaires were obtained from 676 respondents, including 477 students of the me-
dical university and 199 students of the non-medical universities. The majority of them were women: 77% among the medical university respondents and 83% among the non-medical university respondents.
In total, 21% of the respondents confirmed having a tattoo. Majority of them were women (23% vs. men 12%) from the non-medical universities (31% vs. medi-cal university 17%).
Surprisingly, 64% of the students responded affir-matively to the question whether medical staff should follow some kind of a dress code. The affirmative re-sponses were significantly more common among the students of the medical university than among the non-medical students from the (67% vs. 55%, p < 0.05). The analysis of the responses to the question “do you find tattoos an attractive form of body decoration?” shows that 69% of the respondents consider this form of body decoration as attractive, with affirmative re-sponses significantly more frequent among the stu-dents of the non-medical universities (75% vs. 66%, p < 0.05). A statistically significant difference was ob-served also between the male and female respondents. Female students answered the question affirmatively more often than males (71% vs. 60%, p < 0.05). The negative answer to this question was chosen by 16% of the respondents, significantly more frequently by the medical university students (19%) than by those studying at the non-medical universities (9%, p < 0.05).
Asked about their acceptance of healthcare profes-sionals having visible tattoos, 79% of the respondents answered affirmatively. The affirmative answer was chosen significantly more often by the non-medical university students (84% vs. 76% for the medical uni-versity students, p < 0.05).
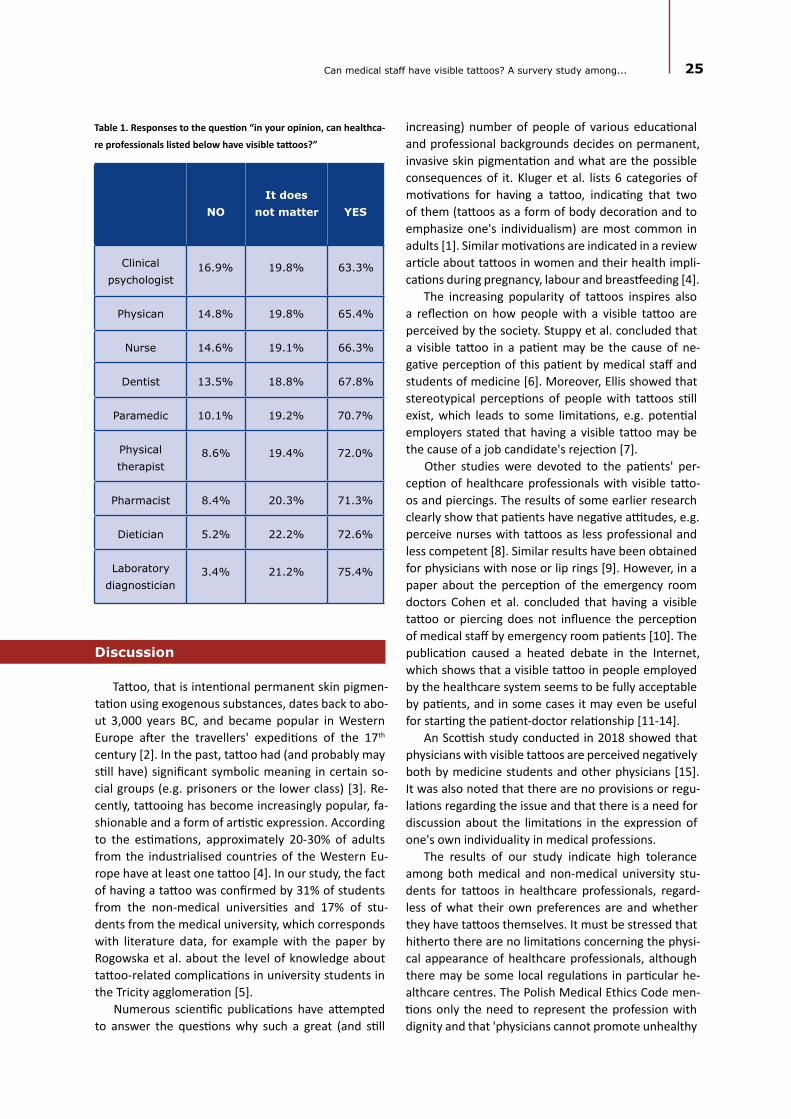
The data about the acceptance of particular medi-cal professionals having visible tattoos is presented in Table 1. According to our study participants, visible tat-toos are the most acceptable on laboratory diagnosti-cians, followed by nurses, dentists and physicians. The students were most reluctant to accept clinical psycho-logists with visible tattoos.
The respondents who have tattoos themselves were more reluctant to express limitations for the external appearance of healthcare professionals whi-le the respondents who do not have tattoos were more restrictive in the topic (51% vs. 67% for limita-tions in the external appearance, which is statistically significant, p < 0.05). Similarly, the students who have tattoos themselves accept visible tattoos in healthca-re professionals to a significantly greater extent (92%) than those who do not have tattoos (p < 0.05). Ho-wever, the acceptance of visible tattoos in healthcare professionals in the latter group also turns out to be quite high (75%).
Discussion
Tattoo, that is intentional permanent skin pigmen-tation using exogenous substances, dates back to abo-ut 3,000 years BC, and became popular in Western Europe after the travellers' expeditions of the 17th century [2]. In the past, tattoo had (and probably may still have) significant symbolic meaning in certain so-cial groups (e.g. prisoners or the lower class) [3]. Re-cently, tattooing has become increasingly popular, fa-shionable and a form of artistic expression. According to the estimations, approximately 20-30% of adults from the industrialised countries of the Western Eu-rope have at least one tattoo [4]. In our study, the fact of having a tattoo was confirmed by 31% of students from the non-medical universities and 17% of stu-dents from the medical university, which corresponds with literature data, for example with the paper by Rogowska et al. about the level of knowledge about tattoo-related complications in university students in the Tricity agglomeration [5].
Numerous scientific publications have attempted to answer the questions why such a great (and still
NOIt does
not matter YES
Clinical psychologist
16.9% 19.8% 63.3%
Physican 14.8% 19.8% 65.4%
Nurse 14.6% 19.1% 66.3%
Dentist 13.5% 18.8% 67.8%
Paramedic 10.1% 19.2% 70.7%
Physical therapist
8.6% 19.4% 72.0%
Pharmacist 8.4% 20.3% 71.3%
Dietician 5.2% 22.2% 72.6%
Laboratory diagnostician
3.4% 21.2% 75.4%
Table 1. Responses to the question “in your opinion, can healthca-
re professionals listed below have visible tattoos?”
increasing) number of people of various educational and professional backgrounds decides on permanent, invasive skin pigmentation and what are the possible consequences of it. Kluger et al. lists 6 categories of motivations for having a tattoo, indicating that two of them (tattoos as a form of body decoration and to emphasize one's individualism) are most common in adults [1]. Similar motivations are indicated in a review article about tattoos in women and their health impli-cations during pregnancy, labour and breastfeeding [4].
The increasing popularity of tattoos inspires also a reflection on how people with a visible tattoo are perceived by the society. Stuppy et al. concluded that a visible tattoo in a patient may be the cause of ne-gative perception of this patient by medical staff and students of medicine [6]. Moreover, Ellis showed that stereotypical perceptions of people with tattoos still exist, which leads to some limitations, e.g. potential employers stated that having a visible tattoo may be the cause of a job candidate's rejection [7].
Other studies were devoted to the patients' per-ception of healthcare professionals with visible tatto-os and piercings. The results of some earlier research clearly show that patients have negative attitudes, e.g. perceive nurses with tattoos as less professional and less competent [8]. Similar results have been obtained for physicians with nose or lip rings [9]. However, in a paper about the perception of the emergency room doctors Cohen et al. concluded that having a visible tattoo or piercing does not influence the perception of medical staff by emergency room patients [10]. The publication caused a heated debate in the Internet, which shows that a visible tattoo in people employed by the healthcare system seems to be fully acceptable by patients, and in some cases it may even be useful for starting the patient-doctor relationship [11-14].
An Scottish study conducted in 2018 showed that physicians with visible tattoos are perceived negatively both by medicine students and other physicians [15]. It was also noted that there are no provisions or regu-lations regarding the issue and that there is a need for discussion about the limitations in the expression of one's own individuality in medical professions.
The results of our study indicate high tolerance among both medical and non-medical university stu-dents for tattoos in healthcare professionals, regard-less of what their own preferences are and whether they have tattoos themselves. It must be stressed that hitherto there are no limitations concerning the physi-cal appearance of healthcare professionals, although there may be some local regulations in particular he-althcare centres. The Polish Medical Ethics Code men-tions only the need to represent the profession with dignity and that 'physicians cannot promote unhealthy
25Can medical staff have visible tattoos? A survery study among...

attitudes, also outside their professional work' [16]. As tattoo may be linked to a risk of infections or allergic reactions, having a visible tattoo may be questionable from this point of view.
Conclusions
1. Regardless of their field of study, university students consider it completely acceptable for healthcare professionals to have a visible tattoo, but they simultaneously state that such professionals should be subjected to some rules as to their physical appearance (dress code).
2. Medical university students seem slightly more conservative in their opinions about the limitations in the appearance of medical staff. However, their acceptance of visible tattoos on healthcare professionals is still high (although lower than of students of non-medical universities). 3. The students who do not like tattoos as a form of body decoration and do not have tattoos themselves, are still quite liberal when it comes to visual tattoos in healthcare professionals. However, they express their acceptance significantly less frequently than students who like tattoos or have a tattoo themselves.
References
1. Kluger N. Epidemiology of tattoos in industrialized countries. In: Current Problems in Dermatology [Internet]. 2015. p. 6–20. Available from: https://www.karger.com/DOI/10.1159/000369175
2. Pesapane F, Nazzaro G, Gianotti R, Coggi A. A short history of tattoo. JAMA dermatology [Internet]. 2014;150(2):145. Avail-able from: https://doi.org/10.1001/jamadermatol.2013.8860
3. Klein CA, Kenedi C. Understanding Tattoos in Medicolegal Assessments. J Am Acad Psychiatry Law [Internet]. 2018;46(1):93–101. Available from: https://europepmc.org/abstract/med/29618541
4. Farley CL, Van Hoover C, Rademeyer C. Women and tattoos: fashion, meaning, and implications for health. J Midwifery Womens Health [Internet]. 2019;64(2):154–69. Available from: https://doi.org/10.1111/jmwh.12932
5. Rogowska P, Szczerkowska-Dobosz A, Kaczorowska R, Słomka J, Nowicki R. Tattoos: Evaluation of knowledge about health complications and their prevention among students of Tricity universities. J Cosmet Dermatol [Internet]. 2018;17(1):27–32. Available from: https://doi.org/10.1111/jocd.12479
6. Stuppy DJ, Armstrong ML, Casals-Ariet C. Attitudes of health care providers and students towards tattooed people. J Adv Nurs [Internet]. 1998;27(6):1165–70. Available from: https://doi.org/10.1046/j.1365-2648.1998.00626.x
7. Ellis AD. A picture is worth one thousand words: Body art in the workplace. Empl Responsib Rights J [Internet]. 2015;27(2):101–13. Available from: https://doi.org/10.1007/s10672-014-9254-1
8. Westerfield H V, Stafford AB, Speroni KG, Daniel MG. Patients’ perceptions of patient care providers with tattoos and/or body piercings. JONA J Nurs Adm [Internet]. 2012;42(3). Available from: https://doi.org/10.1097/NNA.0b013e31824809d6
9. Newman AW, Wright SW, Wrenn KD, Bernard A. Should physicians have facial piercings? J Gen Intern Med [Internet]. 2005;20(3):213–8. Available from: http://link.springer.com/10.1111/j.1525-1497.2005.40172.x
10. Cohen M, Jeanmonod D, Stankewicz H, Habeeb K, Berrios M, Jeanmonod R. An observational study of patients’ attitudes to tattoos and piercings on their physicians: the ART study. Emerg Med J [Internet]. 2018 Sep;35(9):538–43. Available from: http://emj.bmj.com/lookup/doi/10.1136/emermed-2017-206887
11. Houston M. Would you care if your doctor had a ‘Mad Max’ tattoo? [Internet]. The Irish times. 2018 [cited 2019 Nov 4]. Available from: https://www.irishtimes.com/life-and-style/health-family/would-you-care-if-your-doctor-had-a-mad-max-tattoo-1.3553635
12. Foston N. Should doctors show their tattoos at work? DOs speak out - The DO [Internet]. The Do. 2018 [cited 2019 Nov 4]. Available from: https://thedo.osteopathic.org/2018/11/should-doctors-show-their-tattoos-at-work-dos-speak-out/
13. Kalaichandran A. Do patients care if their doctors have tattoos or piercings? - ABC News [Internet]. ABC News. 2018 [cited 2019 Nov 4]. Available from: https://abcnews.go.com/health/patients-care-doctors-tattoos-piercing/story?id=56329779
14. Bernard MA. Will that tattoo hurt you professionally? Not if you’re a doctor, study finds [Internet]. Philadelphia Inquir-er. 2018 [cited 2019 Nov 4]. Available from: https://www.inquirer.com/philly/health/how-do-patients-perceive-doctors-with-tattoos-20180709.html
15. Callaghan B, McConville K. The tattooed doctor: An exploration of the perceptions of medical students and medical school staff. MedEdPublish [Internet]. 2018;7(1):49. Available from: https://doi.org/10.15694/mep.2018.0000049.1
16. Polish Medical Ethics Code, uniform text of 2 January 2004, with the amendmends passed on 20 September 2003. In: 7th Extraordinary National Medical Congress. Warsaw; 2004.
26 Eur J Transl Clin Med 2019;2(2):23-26
RESEARCH ARTICLE
Awareness of the role of cardiovascular risk factors and their prevention – comparison between rural-urban and urban adolescents
Abstract
Background: Unhealthy habits (poor diet, smoking and hazardous alcohol drinking) often originate from early-life. We assessed the knowledge on selected cardiovascular and cancer risk factors, healthy habits and its implementation among adolescents and the correlation with their place of residence. Materials and methods: A survey-based study (38-item inventory) was conducted among adolescents from urban and rural-urban areas recruited in two Tricity high-schools and one junior high school from Gniewkowo, respectively. Results: A total of 410 students (59% girls) from Tricity and 287 (51% girls) from Gniewkowo completed the inventory. The mean age was 15.3 years. Students from Gniewkowo spend weekly 8.9 ± 6.2 hours on structured physical activity, which contrasts with 5.5 ± 4.5hrs in Trici-ty (P < 0.001). Gniewkowo residents restrained from alcohol consumption in 38.7% vs. 31.1% in Tricity (P = 0.04); were active smokers at 9.4% vs. 4.2% (P = 0.007); regular fruits and vegetables consumption was low in both Gniewkowo and Tricity 11.8% vs. 8.6% (P = 0.19); respectively. The awareness of the risk factors of non-communicable diseases was more common amongst Tricity adolescents. This was consistently coupled with the knowledge on preventive methods. Conclusions: The level of knowledge on common non-communicable disease risk factors is higher among teenagers from urban areas, however this does not necessarily translate to more frequent introduction of healthy lifestyle.
Keywords: CVD risk factors · adolescents · smoking · physical activity
EUROPEAN JOURNAL OF TRANSLATIONAL AND CLINICAL MEDICINE 2019;2(2):27-37
Citation
Ostrówka D, Dereziński T, Nowak M, Komand A, Jancewicz M, Szyndler A, Wolf J, Narkiewicz K. Awareness of the role of cardiovascular risk factors and their prevention – comparison between rural-urban and urban adolescents. Eur J Transl Clin Med. 2019;2(2):27-37.DOI: 10.31373/ejtcm/116002
Corresponding author:Anna Szyndler, Department of Hypertension and Diabetology, Faculty of Medicine, Medical University of Gdańsk, Gdańsk, Poland; Center of Translational Medicine, Medical University of Gdańsk, Gdańsk, Poland e-mail: [email protected] No external funds. Available online: www.ejtcm.gumed.edu.pl
Dawid Ostrówka1,2 , Tadeusz Dereziński3 , Maria Nowak4 ,
Anna Komand1, Marta Jancewicz1, Anna Szyndler1 , Jacek Wolf1 ,
Krzysztof Narkiewicz1
1Department of Hypertension and Diabetology, Faculty of Medicine, Medical University of Gdańsk, Gdańsk, Poland; Center of Translational Medicine, Medical University of Gdańsk, Gdańsk, Poland2Department of Pediatrics, Heamatology and Oncology, Faculty of Medicine, Medical University of Gdańsk, Gdańsk, Poland3NZOZ Esculap, Gniewkowo, Poland4First Department of Cardiology, Faculty of Medicine, Medical University of Gdańsk, Gdańsk, Poland
This is Open Access article distributed under the terms of the Creative Commons Attribution-ShareAlike 4.0 International.
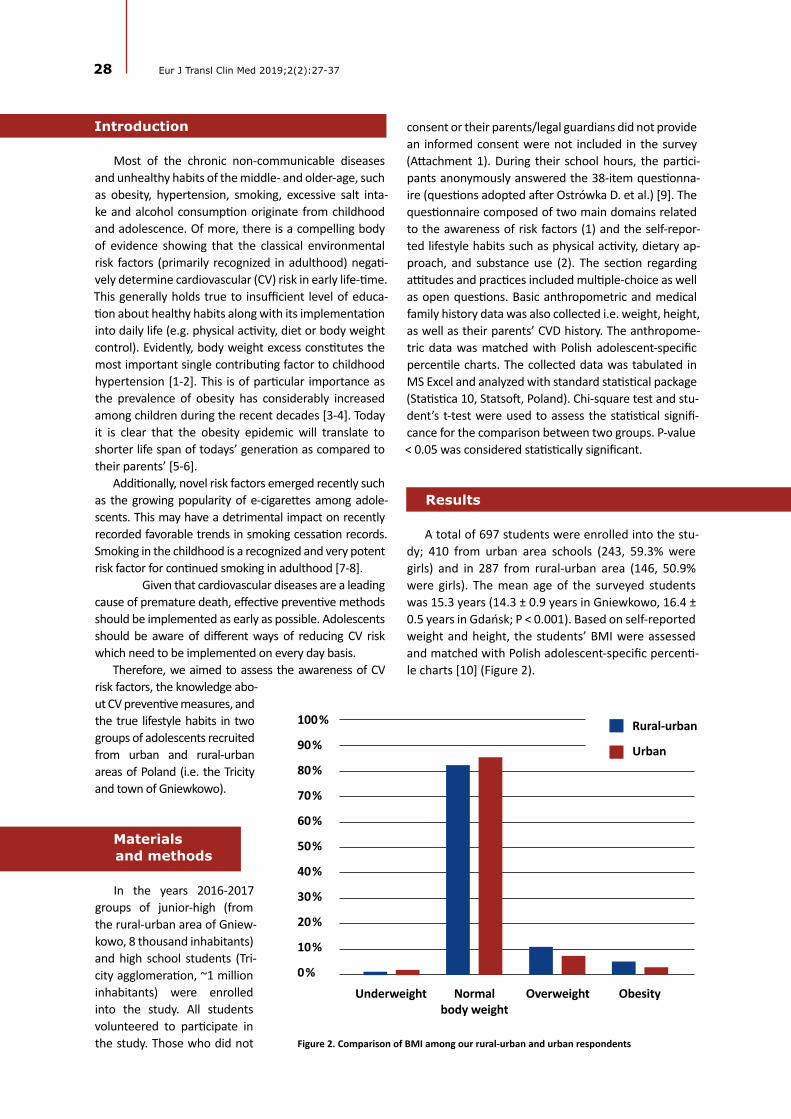
28 Eur J Transl Clin Med 2019;2(2):27-37
Introduction
Most of the chronic non-communicable diseases and unhealthy habits of the middle- and older-age, such as obesity, hypertension, smoking, excessive salt inta-ke and alcohol consumption originate from childhood and adolescence. Of more, there is a compelling body of evidence showing that the classical environmental risk factors (primarily recognized in adulthood) negati-vely determine cardiovascular (CV) risk in early life-time. This generally holds true to insufficient level of educa-tion about healthy habits along with its implementation into daily life (e.g. physical activity, diet or body weight control). Evidently, body weight excess constitutes the most important single contributing factor to childhood hypertension [1-2]. This is of particular importance as the prevalence of obesity has considerably increased among children during the recent decades [3-4]. Today it is clear that the obesity epidemic will translate to shorter life span of todays’ generation as compared to their parents’ [5-6].
Additionally, novel risk factors emerged recently such as the growing popularity of e-cigarettes among adole-scents. This may have a detrimental impact on recently recorded favorable trends in smoking cessation records. Smoking in the childhood is a recognized and very potent risk factor for continued smoking in adulthood [7-8].
Given that cardiovascular diseases are a leading cause of premature death, effective preventive methods should be implemented as early as possible. Adolescents should be aware of different ways of reducing CV risk which need to be implemented on every day basis.
Therefore, we aimed to assess the awareness of CV risk factors, the knowledge abo-ut CV preventive measures, and the true lifestyle habits in two groups of adolescents recruited from urban and rural-urban areas of Poland (i.e. the Tricity and town of Gniewkowo).
Materials
In the years 2016-2017 groups of junior-high (from the rural-urban area of Gniew-kowo, 8 thousand inhabitants) and high school students (Tri-city agglomeration, ~1 million inhabitants) were enrolled into the study. All students volunteered to participate in the study. Those who did not
consent or their parents/legal guardians did not provide an informed consent were not included in the survey (Attachment 1). During their school hours, the partici-pants anonymously answered the 38-item questionna-ire (questions adopted after Ostrówka D. et al.) [9]. The questionnaire composed of two main domains related to the awareness of risk factors (1) and the self-repor-ted lifestyle habits such as physical activity, dietary ap-proach, and substance use (2). The section regarding attitudes and practices included multiple-choice as well as open questions. Basic anthropometric and medical family history data was also collected i.e. weight, height, as well as their parents’ CVD history. The anthropome-tric data was matched with Polish adolescent-specific percentile charts. The collected data was tabulated in MS Excel and analyzed with standard statistical package (Statistica 10, Statsoft, Poland). Chi-square test and stu-dent’s t-test were used to assess the statistical signifi-cance for the comparison between two groups. P-value < 0.05 was considered statistically significant.
Results
A total of 697 students were enrolled into the stu-dy; 410 from urban area schools (243, 59.3% were girls) and in 287 from rural-urban area (146, 50.9% were girls). The mean age of the surveyed students was 15.3 years (14.3 ± 0.9 years in Gniewkowo, 16.4 ± 0.5 years in Gdańsk; P < 0.001). Based on self-reported weight and height, the students’ BMI were assessed and matched with Polish adolescent-specific percenti-le charts [10] (Figure 2).
100%
90%
80%
70%
60%
50%
40%
30%
20%
10%
0%
Figure 2. Comparison of BMI among our rural-urban and urban respondents
Underweight Normalbody weight
Overweight Obesity
Rural-urban
Urban
and methods

Rural-urban Urban P-value
Percentage of students involved in out of school physical activities ≥ 1/week 70.0% 73.4% 0.34
Average time spent daily on physical activity (h) 1.99 ± 1.24 1.39 ± 1.00 < 0.001
Average time spent weekly on physical activity (h) 8.86 ± 6.17 5.5 ± 4.5 < 0.001
Students participating in 3 or more types of sport disciplines 8.7% 10.0% 0.79
Students using computer or TV set for 2 or more hours per day 48.6% 47.2% 0.76
Students using computer or TV set for 4 or more hours per day 13.6% 14.0% 0.91
Students who consider regular physical activity as a CVD protective measure 86.0% 97.1% < 0.001
Physical activity
Awareness of the positive role of regular physical activity in the prevention of cardiovascular disease was significantly lower in the rural-urban population. The results of our study show that in both groups ap-proximately 7 out of 10 students participate in out-
-of-school physical activities in urban and rural-urban areas; this was comparable in both studied groups. Additionally, no differences between the rural-urban and urban area students were noted with respect to number of sport activities (Table 1). Rural-urban ado-lescents, however, claim to spend more time on phy-sical activity, on both daily (1.99 ± 1.24 h vs. 1.39 ± 1.00 h) and weekly basis (8.86 ± 6.17h vs 5.5h ± 4.5h) as compared to their peers from the urban area. At the same time the percentage of students, who dec-lared spending 2 or more hours and 4 or more hours in front of TV set or computer was comparable be-tween groups.
Smoking and psychoactive substances
Approximately, one-third of the rural-urban area students have already started tobacco smoking in the-
ir early years whereas in the urban agglomeration this phenomenon was less common and noted among 20% of our respondents (P = 0.002). The age of rural-urban students, who smoked their first-ever cigarette was significantly lower than among the urban students (12.0 ± 2.8 yrs vs. 14.6 ± 1.4 yrs; P < 0.001). Twice as many adolescents in the rural-urban area declared active smo-king as in the urban area (9.4% vs. 4.2%; P < 0.01). Fur-thermore, the rural-urban students who used tobacco regularly tended to smoke over 3 times more cigarettes per day than their smoking urban peers (Table 2).
Tobacco usage was also more prevalent among the parents of the rural-urban adolescents: 56.6% of stu-dents have at least one smoking parent, in comparison to urban parents where only 23.7% of them smoke on daily basis. Therefore, the percentage of students exposed to passive smoking in rural-urban area is twi-ce as high as in the urban agglomeration (Table 2).
Urban students identified tobacco usage as a pos-sible cause of cancer and lung diseases more frequ-ently than their rural-urban peers. Only two thirds of students in both groups associated smoking cigarettes with CVD, and less than half of the students, irrespec-tive of their place of residence, identified smoking as a risk factor of stroke (Table 2).
Table 1. Attitude towards sport and sedentary lifestyle among our rural-ubran and urban respondents
29Awareness of the role of cardiovascular risk factors and their prevention...
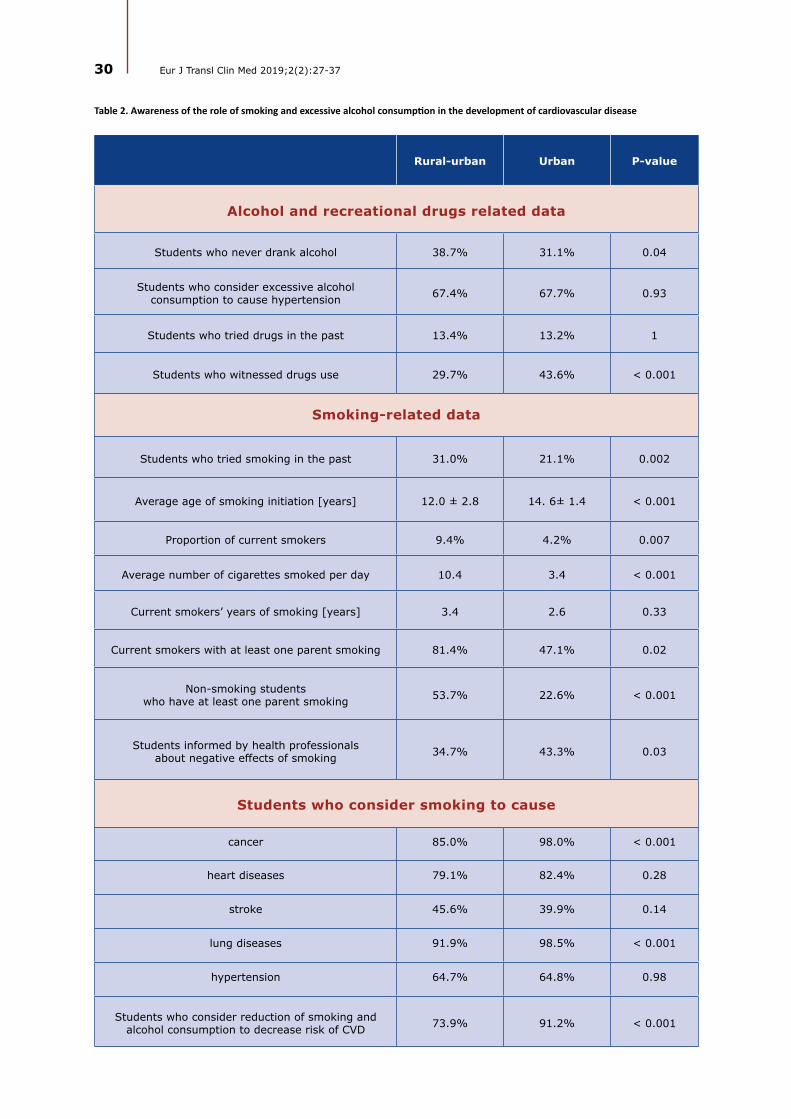
30 Eur J Transl Clin Med 2019;2(2):27-37
Rural-urban Urban P-value
Alcohol and recreational drugs related data
Students who never drank alcohol 38.7% 31.1% 0.04
Students who consider excessive alcohol consumption to cause hypertension 67.4% 67.7% 0.93
Students who tried drugs in the past 13.4% 13.2% 1
Students who witnessed drugs use 29.7% 43.6% < 0.001
Smoking-related data
Students who tried smoking in the past 31.0% 21.1% 0.002
Average age of smoking initiation [years] 12.0 ± 2.8 14. 6± 1.4 < 0.001
Proportion of current smokers 9.4% 4.2% 0.007
Average number of cigarettes smoked per day 10.4 3.4 < 0.001
Current smokers’ years of smoking [years] 3.4 2.6 0.33
Current smokers with at least one parent smoking 81.4% 47.1% 0.02
Non-smoking students who have at least one parent smoking 53.7% 22.6% < 0.001
Students informed by health professionals about negative effects of smoking 34.7% 43.3% 0.03
Table 2. Awareness of the role of smoking and excessive alcohol consumption in the development of cardiovascular disease
Students who consider smoking to cause
cancer 85.0% 98.0% < 0.001
heart diseases 79.1% 82.4% 0.28
stroke 45.6% 39.9% 0.14
lung diseases 91.9% 98.5% < 0.001
hypertension 64.7% 64.8% 0.98
Students who consider reduction of smoking and alcohol consumption to decrease risk of CVD 73.9% 91.2% < 0.001

A different trend was observed in terms of alcohol use in between the studied groups. Rural-urban stu-dents more often indicated that they have never drank alcohol in their life. Whereas the number of students who experimented with illicit psychoactive substances was comparable in both of the studied groups with up to 15% more rural-urban adolescents reporting eye-
-witnessed drug use.
Dietary habits
The number of students, who declare to eat 5 or more portions of fruits and vegetables per day, is low in both groups. Only around half of the studied popu-
lations reports eating low-fat diet on a regular basis, and portion of adolescents, who eat fast food is almost 2 times higher in the urban area. Detailed comparisons are summarized in Table 3.
Knowledge of CVD risk factors
The awareness of CVD risk factors was lower in the rural-urban area group. The percentage of correct an-swers to all the questions in this domain was lower by 10-20% among those students. An exception is the qu-estion about regular fruit and vegetable consumption
– the answers were almost the same in both groups (P > 0.05) (Table 4).
Rural-urban Urban P-value
Students who eat ≥ 5 portions of fruit or vegetables/day 11.8% 8.6% 0.19
Students who eat fast food ≥ 1/week 26.2% 44.8% < 0.001
Students who declare to reduce fat in their diet 59.5% 55.5% 0.30
Students who add salt to their meals 42.3% 35.1% 0.56
Table 3. Dietary habits of our rural-urban and urban respondents
Students who consider
the following activities
to reduce risk of CVD
Rural--urban
Urban P-value
Body weight reduction 73.9% 93.9% < 0.001 77.1% 81.1% 0.21
Regular physical activity 86.0% 97.1% < 0.001 72.5% 68.6% 0.27
Limiting smoking and alcohol consumption 73.9% 91.2% < 0.001 84.6% 91.1% 0.01
Reducing salt amount in meals 66.2% 82.3% < 0.001 61.8% 61.7% 1
Regular fruit and vegetable consumption 80.5% 83.1% 0.42 80.4% 87.3% 0.02
Fat reduction in meals 66.8% 86.2% < 0.001 59.5% 55.5% 0.31
Students who consider
the following activities to reduce
risk of CVD
Students who regularly apply the following
activity in their daily life
Table 4. The awareness of and applying CVD
risk-reducing activities into daily life
Rural--urban Urban
P--value
31Awareness of the role of cardiovascular risk factors and their prevention...

32 Eur J Transl Clin Med 2019;2(2):27-37
The following pattern was also observed in the re-sponses to the questions about the causes and con-sequences of arterial hypertension. Adolescents from the rural-urban area less frequently associated target organ damage with HT. Yet, both groups rarely asso-ciated kidney diseases and stroke with hypertension (Table 5).
Discussion
In our study the rural-urban adolescents dedicated considerably more time both daily and weekly to out-
-of-school physical activities and concurrently these ju-nior-high school students were significantly more likely to smoke than urban high-school students. Disturbin-gly, the age of smoking initiation among adolescents in urban-rural area is approximately 2 years earlier in comparison to students dwelling in the bigger cities. Both groups of surveyed teenagers accurately iden-tified unhealthy diet, smoking and excessive alcohol consumption with incident of the commonest cardio-vascular consequences. Interestingly, this association is poor with respect to cerebrovascular consequences. Knowledge about risky health behaviors as well as cau-ses and consequences of hypertension is significantly better among urban youngsters, however no signifi-cant difference was observed in terms of regular pro-
-healthy behaviors in the studied populations.
Physical activity
Physical activity is considered one of the crucial elements of a healthy lifestyle. The World Health Or-ganization (WHO) recommends adolescents to engage in physical exercise for at least 60 minutes every day in order to preserve health [11]. The health benefits
following that routine are well-established [12-13].However, recent meta-analysis including 34 co-
untries shows that only 23% of boys and 15% of girls meet these WHO criteria [14-15]. This trend is reflec-ted in the Polish population, where only around one in five adolescents declares moderate to vigorous physi-cal activity (at least 60 minutes of exercise for 7 days/week) [16]. In contrast, both of the groups we studied appear to meet the above criteria. Nonetheless, a di-stinct discrepancy is observed - both daily and weekly exercise were significantly higher in rural-urban group. The following trend was reflected in HBSC 2014 stu-dy, where factors such as place of residence – namely rural-urban area favored physical activity [17]. This trend can be explained by several factors. Greater pre-sence of shopping centers and cinemas in urban areas creates opportunities for passive leisure activities. For instance, in 2016 8-16% of students from two major Polish cities of Kraków and Katowice declared to visit a shopping center on a daily basis [18]. It is also impor-tant to mention, that limited access to sport facilities, such as swimming pools or stadiums, in rural-urban areas did not facilitate participating in sport activities by studied adolescents. Still, many participants repor-ted being active in local parks, playgrounds. Another important issue differentiating both groups may be a way of commuting to school. In rural-urban areas school is often easily accessible on foot or by bike. In contrast, studies show that as many as 40% of students in urban area are driven to school by their parents and one in five rides public transportation [19].
Smoking
Tobacco smoking is an important CVD risk factor, re-sponsible for short term consequences such as short-ness of breath, higher resting heart rate, biochemical
Table 5. The percentage of students correctly identifying diseases that are a consequence of HT
Rural-urban Urban P-value
Stroke 34.0% 46.2% 0.002
Myocardial infarction 70.2% 92.4% < 0.01
Kidney diseases 31.7% 28.0% 0.31
Lower limb artherosclerosis 52.0% 73.7% < 0.001

blood changes – increased LDL level and higher insulin resistance, which in adulthood evolves to atheroscle-rosis [20], stroke [21] or myocardial infarction [22].
Over the past decade the positive trend in smo-king cessation was observed in both the pediatric [23] and adult populations [24]. However, the prevalence of smoking in adolescents is still high. An American questionnaire-based study assessed that percentage of students who smoke cigarettes in junior-high and in high school is 2.2% and 8%, respectively (7.2% and 20.2% for any tobacco products) [25]. In the EU the percentage of adolescents (13-17 years of age) who declare active smoking is even higher, with some stu-dies reporting up to 30.9% of active smokers [26]. A questionnaire-based study, conducted in semi-urban district of Istambul among 11-14 year olds describes the prevalence of smoking at least once in the par-ticipant's lifetime at the level of 12% and the rate of current smoking as 3.6% [27]. At the same time the HBSC 2014 study in Polish population reports the per-centage of students who smoke on daily basis or at le-ast once a week at the level of 9% in urban and 7.7% in rural-urban area [17].
Our results do not fully support this data. The number of current smokers among the surveyed ado-lescents in the rural-urban area is twice as high as cor-responding number in urban area. Additionally, adole-scents in the rural-urban environment are at higher risk of long term consequences, such as COPD or lung can-cer development, as they tend to smoke 3 times more cigarettes a day, than their peers in Tricity, which is co-upled with their greater exposure to passive smoking.
We also observed significantly more adolescents in rural-urban group who tried smoking at least once in their life. Studies show that of those individuals who have tried smoking, about one-third become da-ily smokers [28]. More importantly, tobacco usage is extremely addictive among adolescents [29]. Moreo-ver, early onset of smoking appears to entail social consequences, such as lower educational attainment in life and low socio-economic status [28].
Additionally disturbing is the high number of smo-kers among the parents of our rural-urban respon-dents. Students from families with at least one parent smoking, self-report smoking more frequently. More importantly, there are over twice as many rural-urban adolescents, who restrain themselves from smoking and at the same time are exposed to tobacco smoke by their parents as in the urban group. Similar situation was reported by Kaleta et al. with almost 40% of Polish adolescents being exposed to involuntary smoking at home [30]. At the same time it was established that parental tobacco usage poses as a risk factor for adole-scents smoking initiation [31].
Adolescents in rural-urban area report being less frequently informed by their doctor about negative consequences of smoking. In turn we observe ear-ly smoking initiation, higher percentage of first ever smokers, longer smoking history despite being 2 years younger than their urban peers. Sadly, in both groups less than half of studied population identified tobacco use as stroke risk factor.
What should also be mentioned is that approxima-tely two in three rural-urban and urban adolescents alike, drank alcohol at least once in their life. Our re-sults stand in opposition to several studies which sug-gest that alcohol drinking habit has greater frequency in rural areas [32-33]. Furthermore, the percentage of rural-urban students, who declared abstinence was higher than in the urban area. It is important to note that our urban respondents were on average 2 years older than their rural-urban peers. Nonetheless, one should be aware that early initiation in alcohol use is connected with greater use in adulthood.
Dietary habits
The WHO recommendations state that prevailing good health is supported by 400g (5 portions) of fruit and vegetables per day. Several studies support the beneficial role of such diet in decreasing the risk of CVD [34], diabetes [35], stroke [36] and cancer [37]. What appears to be of a great concern is fact that die-tary habits formed in childhood tend to be continu-ed later in adulthood. Therefore, only 1 out of 10 of respondents in both studied groups reporting regular fruit and vegetable consumption is unsatisfactory.
Knowledge of CVD risk factors
Knowledge of CVD risks factors and preventive measures was generally higher among the urban ad-olescents, who as mentioned earlier were on average 2 years older than their rural-urban peers. With this in mind our study showed that the greater level of knowledge on CVD risk factors did not clearly correla-te with a healthier lifestyle. It remains the matter of a debate whether reported differences may have a po-tential to modify future CVD incidence. Swedish rese-archers observed that knowledge of CVD risk factors, such as smoking, had no effect on future use [38]. The following tendency is also visible in our study, where greater knowledge level did not clearly correlate with a healthier lifestyle. The following observation was also demonstrated in CARDIA study, where in the gro-up of young adults knowledge on risk factors itself did not predict a 10-year change in CVD risk factors inten-sity (marginal impact on reducing obesity rates) [39].
33Awareness of the role of cardiovascular risk factors and their prevention...
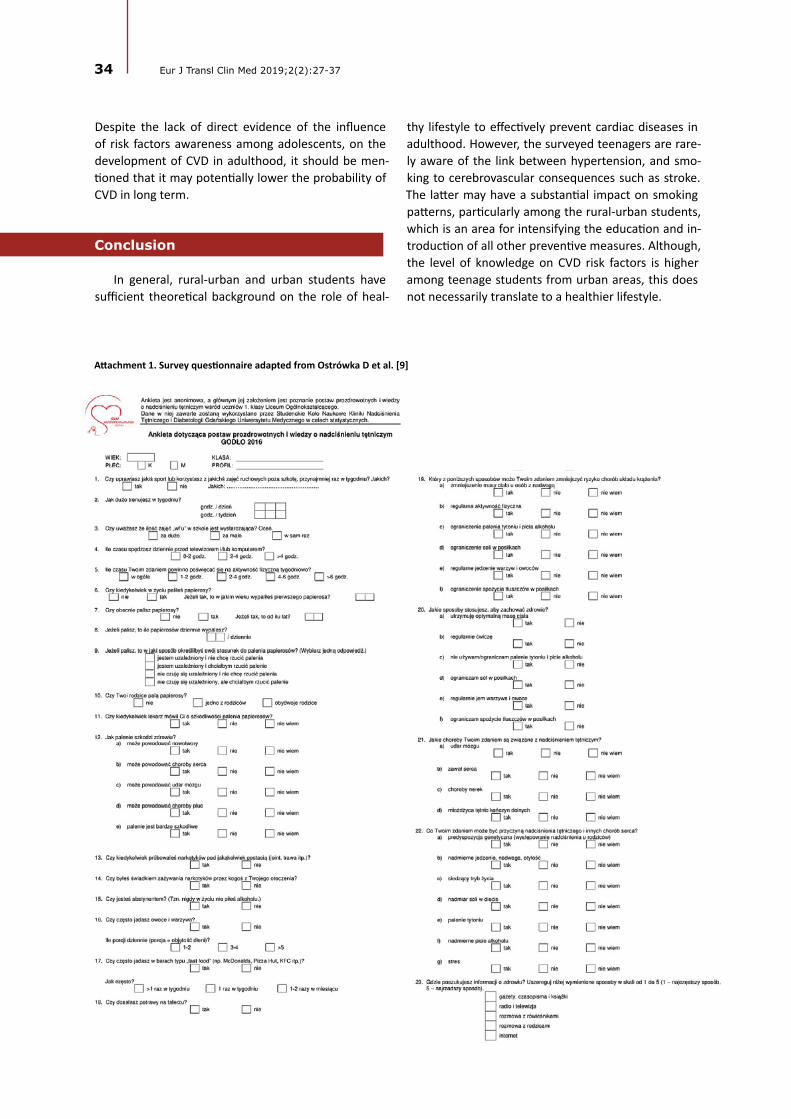
34 Eur J Transl Clin Med 2019;2(2):27-37
Despite the lack of direct evidence of the influence of risk factors awareness among adolescents, on the development of CVD in adulthood, it should be men-tioned that it may potentially lower the probability of CVD in long term.
Conclusion
In general, rural-urban and urban students have sufficient theoretical background on the role of heal-
thy lifestyle to effectively prevent cardiac diseases in adulthood. However, the surveyed teenagers are rare-ly aware of the link between hypertension, and smo-king to cerebrovascular consequences such as stroke. The latter may have a substantial impact on smoking patterns, particularly among the rural-urban students, which is an area for intensifying the education and in-troduction of all other preventive measures. Although, the level of knowledge on CVD risk factors is higher among teenage students from urban areas, this does not necessarily translate to a healthier lifestyle.
Attachment 1. Survey questionnaire adapted from Ostrówka D et al. [9]
1. Lurbe E, Cifkova R, Cruickshank JK, Dillon MJ, Ferreira I, Invitti C, et al. Management of high blood pressure in children and adolescents: recommendations of the European Society of Hypertension. J Hypertens [Internet]. 2009 Sep;27(9):1719–42. Available from: https://insights.ovid.com/crossref?an=00004872-200909000-00001
2. Litwin M, Michałkiewicz J, Gackowska L. Primary Hypertension in Children and Adolescents is an Immuno-Metabolic Dis-ease with Hemodynamic Consequences. Curr Hypertens Rep [Internet]. 2013 Aug 5;15(4):331–9. Available from: https://doi.org/10.1007/s11906-013-0360-5
3. Tenfold increase in childhood and adolescent obesity in four decades: new study by Imperial College London and WHO [Internet]. WHO. 2017 [cited 2019 Dec 30]. Available from: https://www.who.int/news-room/detail/11-10-2017-ten-fold-increase-in-childhood-and-adolescent-obesity-in-four-decades-new-study-by-imperial-college-london-and-who
4. Wolnicka K, Taraszewska A, Jaczewska-Schuetz J. Prevalence of overweight, obesity and underweight among 3rd grade students of primary schools taking into account regional differences. Endocrin Obes Met Disor [Internet]. 2012;8:80–8. Available from: https://journals.viamedica.pl/eoizpm/article/view/25934
5. Olshansky SJ, Passaro DJ, Hershow RC, Layden J, Carnes BA, Brody J, et al. A potential decline in life expectancy in the United States in the 21st century. N Engl J Med [Internet]. 2005 Mar 17;352(11):1138–45. Available from: http://www.nejm.org/doi/abs/10.1056/NEJMsr043743
6. Preston SH, Vierboom YC, Stokes A. The role of obesity in exceptionally slow US mortality improvement. Proc Natl Acad Sci [Internet]. 2018 Jan 30;115(5):957–61. Available from: http://www.pnas.org/lookup/doi/10.1073/pnas.1716802115
7. Wills TA, Sargent JD, Knight R, Pagano I, Gibbons FX. E-cigarette use and willingness to smoke: a sample of adolescent non-smokers. Tob Control [Internet]. 2016 Apr;25(e1):e52–9. Available from: http://dx.doi.org/10.1136/tobaccocon-trol-2015-052349
8. Conner M, Grogan S, Simms-Ellis R, Flett K, Sykes-Muskett B, Cowap L, et al. Do electronic cigarettes increase cigarette smoking in UK adolescents? Evidence from a 12-month prospective study. Tob Control [Internet]. 2018;27(4):365–72. Available from: http://dx.doi.org/10.1136/tobaccocontrol-2016-053539
9. Ostrówka D, Jancewicz M, Komand A, Nowak M, Łubiarz M, Furtak M, et al. Awareness of the role of cardiovascu-lar risk factors and their prevention from the perspective of Tricity adolescents. Arter Hypertens [Internet]. 2017 Mar 30;21(1):51–9. Available from: https://journals.viamedica.pl/arterial_hypertension/article/view/51000
10. Siatki centylowe dzieci i młodzieży w wieku 3-18 lat [Internet]. Instytut ‘Pomnik Centrum Zdrowia Dziecka’. 2019 [cited 2019 Dec 30]. Available from: http://www.czd.pl/index.php?option=com_content&view=article&id=1717&Itemid=538
11. Physical activity and young people [Internet]. WHO. [cited 2019 Dec 30]. Available from: https://www.who.int/dietphys-icalactivity/factsheet_young_people/en/
References
35Awareness of the role of cardiovascular risk factors and their prevention...

36 Eur J Transl Clin Med 2019;2(2):27-37
12. Farpour-Lambert NJ, Martin XE, Bucher Della Torre S, von Haller L, Ells LJ, Herrmann FR, et al. Effectiveness of individual and group programmes to treat obesity and reduce cardiovascular disease risk factors in pre-pubertal children. Clin Obes [Internet]. 2019 Dec 1;9(6):e12335. Available from: https://doi.org/10.1111/cob.12335
13. Cuenca-García M, Ortega FB, Ruiz JR, González-Gross M, Labayen I, Jago R, et al. Combined influence of healthy diet and active lifestyle on cardiovascular disease risk factors in adolescents. Scand J Med Sci Sports [Internet]. 2014 Jun 1;24(3):553–62. Available from: https://doi.org/10.1111/sms.12022
14. Guthold R, Cowan MJ, Autenrieth CS, Kann L, Riley LM. Physical activity and sedentary behavior among schoolchil-dren: a 34-country comparison. J Pediatr [Internet]. 2010;157(1):43-49.e1. Available from: http://dx.doi.org/10.1016/j.jpeds.2010.01.019
15. Belton S, O’ Brien W, Meegan S, Woods C, Issartel J. Youth-Physical Activity Towards Health: evidence and background to the development of the Y-PATH physical activity intervention for adolescents. BMC Public Health [Internet]. 2014 Dec 5;14(1):122. Available from: https://doi.org/10.1186/1471-2458-14-122
16. Mazur J, Oblacińska A, Jodkowska M, Małkowska-Szkutnik A, Tabak I, Zawadzka D, et al. Aktywność fizyczna młodzieży szkolnej w wieku 9-17 lat, aktualne wskaźniki, tendencje ich zmian oraz wybrane zewnętrzne i wewnętrzne uwarunkowa-nia. Instytut Matki i Dziecka, projekt realizowany na zlecenie Ministerstwa Sportu i Turystyki, Warszawa. 2013.
17. Oblacińska A. Zdrowie i zachowania zdrowotne młodzieży szkolnej w Polsce na tle wybranych uwarunkowań socjodemo-graficznych. Wyniki badań HBSC. Warszawa: Instytut Matki i Dziecka. 2015.
18. Sociologist: For many teenagers shopping malls are the modern day yards [Internet]. Science in Poland. 2015 [cited 2019 Dec 30]. Available from: http://scienceinpoland.pap.pl/en/news/news%2C406860%2Csociologist-for-many-teenagers-shopping-malls-are-the-modern-day-yards.html
19. Polskie dzieci (wciąż) jeżdżą do szkoły samochodami [Internet]. Transport Publiczny. [cited 2019 Dec 30]. Available from: https://www.transport-publiczny.pl/wiadomosci/polskie-dzieci-wciaz-jezdza-do-szkoly-samochodami-59528.html
20. Siasos G, Tsigkou V, Kokkou E, Oikonomou E, Vavuranakis M, Vlachopoulos C, et al. Smoking and atherosclerosis: mech-anisms of disease and new therapeutic approaches. Curr Med Chem [Internet]. 2014;21(34):3936–48. Available from: https://www.ingentaconnect.com/content/ben/cmc/2014/00000021/00000034/art00004#Refs
21. Shah RS, Cole JW. Smoking and stroke: the more you smoke the more you stroke. Expert Rev Cardiovasc Ther [Internet]. 2010 Jul 10;8(7):917–32. Available from: https://doi.org/10.1586/erc.10.56
22. Oliveira A, Barros H, Júlia Maciel M, Lopes C. Tobacco smoking and acute myocardial infarction in young adults: A population-based case-control study. Prev Med (Baltim) [Internet]. 2007 Apr;44(4):311–6. Available from: https://doi.org/10.1016/j.ypmed.2006.12.002
23. Mazur J, Dzielska A, Kowalewska A, Fijałkowska A. Current trends in tobacco smoking among 15-year-old adolescents in Poland in the background of 30 countries. Przegl Lek [Internet]. 2016;73(10):685–9. Available from: http://www.ncbi.nlm.nih.gov/pubmed/29688683
24. Polakowska M, Kaleta D, Piotrowski W, Topór-Mądry R, Puch-Walczak A, Niklas A, et al. Tobacco smoking in Poland in the years from 2003 to 2014. Multicentre Natl Popul Heal Exam Surv (WOBASZ) Pol Arch Intern Med [Internet]. 2017;127(2):91–9. Available from: https://pdfs.semanticscholar.org/d404/098b75cee94017fad84b373ae226c8ffb47c.pdf
25. Gentzke AS, Creamer ML, Cullen KA, Ambrose BK, Willis G, Jamal A, et al. Vital signs: tobacco product use among middle and high school students - United States, 2011-2018. MMWR Morb Mortal Wkly Rep [Internet]. 2019;68(6):157–64. Available from: https://www.ncbi.nlm.nih.gov/pmc/articles/PMC5991815/
26. Banzer R, Haring C, Buchheim A, Oehler S, Carli V, Wasserman C, et al. Factors associated with different smoking status in European adolescents: results of the SEYLE study. Eur Child Adolesc Psychiatry [Internet]. 2017 Nov 6;26(11):1319–29. Available from: https://doi.org/10.1007/s00787-017-0980-4
27. Kaya CA, Unalan PC. Factors associated with adolescents’ smoking experience and staying tobacco free. Ment Health Fam Med [Internet]. 2010 Sep;7(3):145–53. Available from: http://www.ncbi.nlm.nih.gov/pubmed/22477936
28. Health NCfCDPaHPUOoSa. Social, Environmental, Cognitive, and Genetic Influences on the Use of Tobacco Among Youth. 2012; 29. Zhan W, Dierker LC, Rose JS, Selya A, Mermelstein RJ. The natural course of nicotine dependence symptoms among ad-
olescent smokers. Nicotine Tob Res [Internet]. 2012 Dec 1;14(12):1445–52. Available from: https://academic.oup.com/ntr/article-lookup/doi/10.1093/ntr/nts031
30. Kaleta D, Polanska K, Wojtysiak P, Szatko F. Involuntary smoking in adolescents, their awareness of its harmfulness, and attitudes towards smoking in the presence of non-smokers. Int J Environ Res Public Health [Internet]. 2017 Sep 21;14(10):1095. Available from: https://doi.org/https://doi.org/10.3390/ijerph14101095

31. Gilman SE, Rende R, Boergers J, Abrams DB, Buka SL, Clark MA, et al. Parental smoking and adolescent smoking initiation: an intergenerational perspective on tobacco control. Pediatrics [Internet]. 2009 Feb 1;123(2):e274–81. Available from: https://doi.org/10.1542/peds.2008-2251
32. Lambert D, Gale JA, Hartley D. Substance abuse by youth and young adults in rural America. J Rural Heal [Internet]. 2008 Jun;24(3):221–8. Available from: http://doi.wiley.com/10.1111/j.1748-0361.2008.00162.x
33. Atav S, Spencer GA. Health risk behaviors among adolescents attending rural, suburban, and urban schools: A compar-ative study. Fam Community Health [Internet]. 2002;25(2):53–64. Available from: https://journals.lww.com/familyand-communityhealth/Fulltext/2002/07000/Health_Risk_Behaviors_among_Adolescents_Attending.7.aspx
34. Yu D, Zhang X, Gao Y-T, Li H, Yang G, Huang J, et al. Fruit and vegetable intake and risk of CHD: results from prospec-tive cohort studies of Chinese adults in Shanghai. Br J Nutr [Internet]. 2014;111(2):353–62. Available from: https://doi.org/10.1017/S0007114513002328
35. Li M, Fan Y, Zhang X, Hou W, Tang Z. Fruit and vegetable intake and risk of type 2 diabetes mellitus: meta-analysis of prospective cohort studies. BMJ Open [Internet]. 2014;4(11):e005497. Available from: http://dx.doi.org/10.1136/bm-jopen-2014-005497
36. Dauchet L, Amouyel P, Dallongeville J. Fruit and vegetable consumption and risk of stroke: a meta-analysis of cohort stud-ies. Neurology [Internet]. 2005;65(8):1193–7. Available from: https://doi.org/10.1212/01.wnl.0000180600.09719.53
37. Boeing H, Bechthold A, Bub A, Ellinger S, Haller D, Kroke A, et al. Critical review: vegetables and fruit in the prevention of chronic diseases. Eur J Nutr [Internet]. 2012;51(6):637–63. Available from: https://doi.org/10.1007/s00394-012-0380-y
38. Povlsen L, Aryal UR, Petzold M, Krettek A. Adolescents’ knowledge and opinions about smoking: a qualitative study from the Jhaukhel-Duwakot Health Demographic Surveillance Site, Bhaktapur District, Nepal. Int J Adolesc Med Health [Inter-net]. 2018;30(1):20150124. Available from: https://doi.org/10.1515/ijamh-2015-0124
39. Lynch EB, Liu K, Kiefe CI, Greenland P. Cardiovascular disease risk factor knowledge in young adults and 10-year change in risk factors: the Coronary Artery Risk Development in Young Adults (CARDIA) Study. Am J Epidemiol [Internet]. 2006;164(12):1171–9. Available from: https://doi.org/10.1093/aje/kwj334
37Awareness of the role of cardiovascular risk factors and their prevention...
RESEARCH ARTICLE
Interdisciplinary treatment of large adrenocortical carcinoma infiltrating inferior vena cava
Abstract
Background: Adrenal tumors are common neoplasms and majority of them are small, benign, hormonally inac-tiveadrenocortical adenomas. Whereas adrenal cancer is a rarely occurring (5% of adrenal tumors) but highly aggressive neoplasm. The early diagnosis and complete surgical resection is the only effective treatment option. Laparoscopic adrenalectomy is the gold standard for small and medium tumors. Whereas for large tumors clas-sic adrenalectomy is considered a procedure of choice with a proven better oncological outcome. Material and methods: There were 245 patients with adrenal tumors operated in the Department of General, Endocrine and Transplant Surgery, Medical University of Gdańsk, Poland between 2014and 2018. Results: Out of entire series, there was one case of a 57-year-old female diagnosed with a large, advanced left adrenal tumor with invasion of vena cava. It was diagnosed in computer tomography and proven in core biopsy. Open adrenalectomy with thoracotomy was conducted to completely resect the tumor by the interdisciplinary team. Conclusions: In case of large adrenal tumour with vessel infiltration, a successful R0 resection can be performed by multi-specialist ap-proach. For adrenal cancer early diagnosis based on the clinical, biochemical and imaging features and successful surgical treatment is crucial in significant prolongation of patient survival.
Keywords: surgical treatment · adrenocortical carcinoma · adrenal cancer
EUROPEAN JOURNAL OF TRANSLATIONAL AND CLINICAL MEDICINE 2019;2(2):38-42
Citation
Dobrzycka M, Spychalski P, Rusek U, Brzeziński M, Kobiela J, Kłosowski P, Berendt-Obłończyk M, Łachiński A, Sworczak K, Śledziński Z. Interdisciplinary treatment of large adrenocortical carcinoma infiltrating inferior vena cava – case report and review of literature. Eur J Transl Clin Med. 2019;2(2):38-42.DOI: 10.31373/ejtcm/111365
Corresponding author:Małgorzata Dobrzycka, Department of General, Endocrine and Transplant Surgery, Medical University of Gdańsk, Polande-mail: [email protected] external funds. Available online: www.ejtcm.gumed.edu.plCopyright ® Medical University of Gdańsk
Małgorzata Dobrzycka1 , Piotr Spychalski1 , Urszula Rusek2,
Michał Brzeziński2 , Jarosław Kobiela1 , Przemysław Kłosowski3 ,
Monika Berendt-Obołończyk3, Andrzej Łachiński1 , Krzysztof
Sworczak3 , Zbigniew Śledziński1
1Department of General, Endocrine and Transplant Surgery, Medical University of Gdańsk, Poland2Department of General Surgery, Students Scientific Circle, Medical University of Gdańsk, Poland3Department of Endocrinology and Internal Diseases, Medical University of Gdańsk, Poland
This is Open Access article distributed under the terms of the Creative Commons Attribution-ShareAlike 4.0 International.
Updated: 20.05.2020

39Interdisciplinary treatment of large adrenocortical carcinoma...
Introduction
Adrenocortical cancer (ACC) is a rare malignan-cy. The incidence is estimated to be 1 to 2 per million per year [1]. There is a predilection for the female sex with 2.5-fold higher prevalence [1]. Despite its rare occurrence, According is especially noteworthy due to its aggressive nature. The prognosis of ACC is poor with a 5-year overall survival rates below 30% in most series [2]. In addition, lymph node and/or distant or-gan metastases are already present in about 60% of patients at the time of diagnosis [3]. Early diagnosis of hormone-secreting adrenocortical tumor depends on the occurrence of clinical symptoms of excess of adrenocortical hormones. Whereas the diagnosis of non-secreting tumors is usually accidental in patients due to non-specific abdominal pain, nausea, vomiting and feeling of abdominal fullness [1-4].
The primary treatment of ACC is surgical excision [5]. Furthermore, chemotherapy with steroidogenesis inhibitors (especially mitotane) is crucial. The applica-tion of mitotane can be considered in adjuvant treat-ment and is the basis for the management of patients with diffused ACC. In the treatment of advanced dise-ase, multi-drug chemotherapy is also used alone or in combination with mitotane. Currently, the basic treat-ment regimen is the combination of etoposide, doxo-rubicin and cisplatin (EDP) [1].
Series analysis
There were 245 patients with adrenal tumors ope-rated in the Department of General, Endocrine and
Transplant Surgery, Medical University of Gdańsk, Po-land between 2014 and 2018. In 211 (86%) of them laparoscopic adrenalectomy was performed, whereas in 34 patients with large tumors classic adrenalectomy was performed. In histopathological examination the-re were 5 cases of ACC. In the presented case report, we describe the clinical picture of a patient with highly advanced, metastatic ACC. Furthermore, we present a highly specialized interdisciplinary approach towards patient care in case of a rare cancer.
Case report
A 57 year old woman (0.4%) was admitted to the Department of General, Endocrine and Transplant Sur-gery at the Medical University of Gdańsk (Poland) due to presence of a left adrenal tumor. The patient’s hi-story included autoimmune polyendocrine syndrome type 2 (APS2) diagnosed 10 years prior. Since then she received hormonal substitution for Hashimoto's dise-ase and adrenal insufficiency (thyroxine, prednisone and fludrocortisone). Furthermore, she was diagnosed with hypertension one month before the admission to hospital. The patient's family history included her mother's death from adrenal cancer at the age of 69.
An outpatient abdominal ultrasound incidentally discovered a 97 x 75 x 94 mm tumor located in the left adrenal gland (near the superior pole of the left kid-ney). It had mixed echogenicity, peripheral and central flows, fluid spaces and fine calcifications. The diagno-sis was confirmed in abdominal CT examination (Fig. 1). The lesion was 143 x 85 mm in transverse dimension and 98 mm (cephalocaudal dimension). In addition,
Figure 1. Abdomen CT. Left adrenal gland tumor. Infiltration of left renal vein, vena cava inferior and left kidney

40 Eur J Transl Clin Med 2019;2(2):38-42
the CT images revealed infiltration and thrombosis of the left renal vein, ovarian vein and the inferior vena cava from the left renal vein inflow to the diaphragm level. Furthermore, a slight 5 mm hypodense focal le-sion was identified in the liver segment IVa and a 4 mm nodule was revealed in the right lung segment 8 near the fissure. Endocrine diagnostics showed increased androgen concentration without any clinical symptoms of hyperandrogenism. The androstendione level was 29.7 ng/ml, (normal range 0.3-3.5 ng/ml), the dehy-droepiandrosterone sulphate (DHEA-S) was also mar-kedly elevated to 960 ug/dl, (normal range 26-200 ug/dl), the testosterone was elevated to 6.6 nmol/l (nor-mal range 0.43-1.24 nmol/l) and the 17(OH)-progesterone was 7.7 ng/ml. The excretion of meta- and normetanephri-ne in a 24-hour collection of urine was normal. Loss of the circadian rhythm of cortisol secretion (morning cortisol le-vel was 16 ug/dl and nighttime was 17 μg/dl) in this case was not very diagnostic because of adrenal insufficiency and hor-monal substitution.
A core biopsy revealed the formation of a tumor origina-ting from the adrenal cortex, with the following pathological characteristics: IHC:inhibin +/-, MelanA +, Ki67 7%, no signs of increased atypia, atypical divisions or necrosis. Together these features result in Weiss
score > 3, indicating the ma-lignant nature of the lesion. The patient was qualified for curative surgical treatment planned by an interdisciplina-ry team consisting of general and cardiac surgeons.
After the laparotomy, a 20cm tumor displacing the kidney downwards was found in the left adrenal field. It was gro-wing into the inferior vena cava through the left renal vein. Moreover, a solid 8mm lesion in the left lobe of the liver was exposed. No further
signs of tumor spread were revealed. Then a right-si-ded thoracotomy was performed by a cardiac surgeon to obtain access to the inferior vena cava through the apex of the right atrium. Following this, IVC below the renal veins and the right renal vein were clamped. The tumor was extracted by incising the left renal vein at the entrance to the inferior vena cava. Later, the adre-nal gland with the tumor, the left kidney, the retrope-ritoneal tissues and the spleen were resected en bloc (Fig 2). Next, a non-anatomical tumor resection of the left lobe of the liver with margins was performed. The surgery lasted 284 minutes. The estimated intraopera-tive blood loss was 1700 ml. Histopathological exami-nation of the extracted tissue revealed ACC cells with atypical mitosis, hemorrhage and extensive necrosis (Fig 3). There was no evidence of invasion of the organ
Figure 2. Adrenal cancer resected en bloc with left kidney and
vascular invasion to inferior vena cava
Figure 3. Microscopic intravascular invasion of adrenal cancer

41Interdisciplinary treatment of large adrenocortical carcinoma...
capsule. Cancer was resected within the limits of the organ pouch. In addition, the tumor expanded into the renal vein. Metastasis was found in the removed liver tumor. The postoperative period was complicated by hematoma in right pleural cavity resulting from ble-eding from the branch of right internal mammary arte-ry and from the splenic artery stump (successfully tre-ated with transarterial embolization). Hydrocortisone replacement therapy was conducted perioperatively. On postoperative day 15 the patient was discharged home. In laboratory follow-up 1 month after the surge-ry, the total testosterone and DHEA-S levels returned to normal (0.8 ng/ml and 15 ug/dl respectively). Later the patient was treated for metastasis found in CT with chemotherapy (mitotane, etoposide and cisplatin) and transarterial chemoembolization of the liver metasta-sis with lipiodol and doxorubicin.
Discussion
The diagnosis of adrenal mass should focus on di-stinguishing between benign and non-secreting mas-ses from malignant or hormonally active lesions that require further treatment. It consists of a complete physical examination, biochemical evaluation of hor-mone secretion, and careful examination of radiologi-cal imaging tests. Adrenal tumor biopsy is contraindica-ted in the case of suspected ACC (due to the risk of local spread after damage to the tumor capsule) and phe-ochromocytoma (danger of hypertensive crisis). Its im-plementation is justified in the case of suspicion of me-tastases to the adrenal glands if imaging studies do not state clearly whether the lesion is benign or malignant and the unequivocal determination of the etiology of focal lesions will affect further therapeutic treatment. About 80% of the tumors are benign adenomas or ad-renal tuberous hyperplasia. According to The European Network for the Study of Adrenal Tumors (ENSAT) clas-sification, the patient described above was diagnosed with stage IV tumor with high grade malignant features in histological Weiss criteria [6-7].
The basic screening tests for hypercortisolism inclu-de test of inhibition of cortisol secretion after oral ad-ministration of 1 mg dexamethasone, daily excretion of free cortisol in the urine and a midnight salivary cortisol level. In women with adrenal tumors and with hyperandrogenisation syndrome, it is recommended to measure total testosterone, DHEA-S and 17(OH)-
-progesterone. High levels of testosterone (> 200 ng/dl), DHEA-S (> 800 μg/dl) and 17(OH)-progesterone are more often associated with ACC [8]. Our patient
had an increased androgen concentration (total testo-sterone, 17(OH)-progesterone, androstendione and DHEA-S) and no circadian rhythm of cortisol secretion.
The coexistence of ACC with the history of APS2 might change the standard diagnostic process. In such cases, non-circadian secretion of cortisol should be considered because it is already disturbed as a result of APS2. Also, our patient's normal level of aldostero-ne seems intriguing. Before the tumor developed, the patient might have had reduced aldosterone levels due to the adrenal insufficiency, whereas secretion by the ACC brought this hormone to its normal level.
For localized ACC the only curative method is a complete resection (R0) of the tumor and it is consi-dered as the treatment of choice. Superiority of open vs. laparoscopic adrenalectomy remains controversial. Laparoscopic adrenalectomy is the gold standard in adrenal tumors surgery but recent research has shown that open adrenalectomy is superior to laparoscopic approach in terms of disease-free survival and rate of 2-year disease-free survival, in spite of the larger ma-ximum diameter of tumors and lesser benefit during the perioperative period [9-10]. Laparoscopic surgery is still not recommended in case of large tumor (>6cm) and if there is a suspicion of local invasion or the pre-sence of metastases in regional lymph nodes. About 30-40% of patients are in the IV clinical stage at the time of diagnosis. The prognosis in these patients is significantly worse than in stage I and II, but with the predicted resectability R0 of the primary site and the resection of lung and liver metastases, they are still eligible for surgery. Due to the relatively frequent re-currences after treatment (range 19%-30% depending on the tumor stage), adjuvant therapy should be ad-ministered after the surgery [3]. It includes using mi-totane and tumoral bed irradiation. In cases of oligo-metastatic disease, > 80% tumor mass resection and slow tumor progression, radiotherapy, radiofrequency ablation or transarterial chemoembolization with mi-totane can be conducted [1].
Conclusion
In conclusion, the presented case has shown that in case of large, advanced ACC with vessel infiltra-tion a successful R0 resection can be performed by multidisciplinary surgical team. For adrenal cancer early diagnosis based on the clinical, biochemical and imaging features and successful surgical treatment is crucial in order to achieve significant prolongation of patient survival.

42 Eur J Transl Clin Med 2019;2(2):38-42
References
1. Fassnacht M, Allolio B. Clinical management of adrenocortical carcinoma. Best Pract Res Clin Endocrinol Metab [Inter-net]. 2009;23(2):273–89. Available from: https://linkinghub.elsevier.com/retrieve/pii/S1521690X08001413
2. Berruti A, Baudin E, Gelderblom H, Haak HR, Porpiglia F, Fassnacht M, et al. Adrenal cancer: ESMO Clinical Practice Guide-lines for diagnosis, treatment and follow-up. Ann Oncol [Internet]. 2012;23(suppl 7):vii131–8. Available from: https://academic.oup.com/annonc/article-lookup/doi/10.1093/annonc/mds231
3. Fay AP, Elfiky A, Teló GH, McKay RR, Kaymakcalan M, Nguyen PL, et al. Adrenocortical carcinoma: The management of metastatic disease. Crit Rev Oncol Hematol [Internet]. 2014;92(2):123–32. Available from: https://linkinghub.elsevier.com/retrieve/pii/S1040842814000882
4. Dworakowska D, Drabarek A, Wenzel I, Babińska A, Świątkowska-Stodulska R, Sworczak K. Rak kory nadnercza (ACC) — przegląd piśmiennictwa i doświadczenia własne. Endokrynol Pol [Internet]. 2015;65(6):492–512. Available from: http://czasopisma.viamedica.pl/ep/article/view/38591
5. Gaujoux S, Mihai R. European Society of Endocrine Surgeons (ESES) and European Network for the Study of Adrenal Tumours (ENSAT) recommendations for the surgical management of adrenocortical carcinoma. Br J Surg [Internet]. 2017;104(4):358–76. Available from: http://doi.wiley.com/10.1002/bjs.10414
6. Lughezzani G, Sun M, Perrotte P, Jeldres C, Alasker A, Isbarn H, et al. The European Network for the Study of Adrenal Tumors staging system is prognostically superior to the international union against cancer-staging system: A North Amer-ican validation. Eur J Cancer [Internet]. 2010;46(4):713–9. Available from: https://linkinghub.elsevier.com/retrieve/pii/S0959804909009198
7. Jain M, Kapoor S, Mishra A, Gupta S, Agarwal A. Weiss criteria in large adrenocortical tumors: A validation study. Indian J Pathol Microbiol [Internet]. 2010;53(2):222. Available from: http://www.ijpmonline.org/text.asp?2010/53/2/222/64325
8. McDuffie LA, Aufforth RD. Adrenocortical carcinoma: modern management and evolving treatment strategies. Int J En-docr Oncol [Internet]. 2016;3(2):161–74. Available from: https://www.futuremedicine.com/doi/10.2217/ije-2015-0003
9. Zheng G-Y, Li H-Z, Deng J-H, Zhang X-B, Wu X-C. Open adrenalectomy versus laparoscopic adrenalectomy for adreno-cortical carcinoma: a retrospective comparative study on short-term oncologic prognosis. Onco Targets Ther [Internet]. 2018;11:1625–32. Available from: https://www.dovepress.com/open-adrenalectomy-versus-laparoscopic-adrenalecto-my-for-adrenocortica-peer-reviewed-article-OTT
10. Autorino R, Bove P, De Sio M, Miano R, Micali S, Cindolo L, et al. Open Versus Laparoscopic Adrenalectomy for Adreno-cortical Carcinoma: A Meta-analysis of Surgical and Oncological Outcomes. Ann Surg Oncol [Internet]. 2016;23(4):1195–202. Available from: http://link.springer.com/10.1245/s10434-015-4900-x
REVIEW ARTICLE
The usefulness and limitations of diffusion tensor imaging – a review study
Abstract
Diffusion tensor tractography (DTI) has been used for planning of a brain pathology surgeries. Knowledge about the distances between neural tracts and brain tumours is believed to increase the patient safety and implies the extent of resection. The aim of the study was to demonstrate the contemporary possibilities and the clinical usefulness of DTI. Following the explanation of the technical basics of DTI, we presented the drawbacks and limi-tations of this visualisation technique. The most commonly outlined tracts are corticospinal tract (CST), arcuate fasciculus (AF) and frontal aslant tract (FAT). Tumour located in frontal, parietal or temporal lobe can affect the course of the CST. There are two basic possibilities to visualise CST: deterministic and probabilistic. The usefulness of DTI seems limited in imaging the neoplasms of either frontal or temporal region causing aphasia, which infil-trate the AF or the FAT. This limitation is probably related to divergent and patient-specific location of functional speech areas. Acquisition disturbances, ill-defined mathematical algorithms, surgery-related brain shift and de-fining wrong non-functional brain area are the sources of DTI inaccuracy, which is limiting its clinical application.
Keywords: Diffusion Tensor Imaging · tractography · corticospinal tract · arcuate fasciculus · frontal aslant tract
EUROPEAN JOURNAL OF TRANSLATIONAL AND CLINICAL MEDICINE 2019;2(2):43-51
Citation
Kierońska S, Słoniewski P. The usefulness and limitations of diffusion tensor imaging – a review study. Eur J Transl Clin Med. 2019;2(2):43-51.DOI: 10.31373/ejtcm/112437
Corresponding author:Sara Kierońska, Jan Biziel University Hospital Collegium Medicum Nicolaus Copernicus University, Department of Neurosurgery and Neurology, Bydgoszcz, Polande-mail: [email protected] external funds. Available online: www.ejtcm.gumed.edu.plCopyright ® Medical University of Gdańsk
Sara Kierońska1,2 , Paweł Słoniewski2
1Jan Biziel University Hospital Collegium Medicum Nicolaus Copernicus University, Department of Neurosurgery and Neurology, Bydgoszcz, Poland2Department of Neurosurgery, Medical University of Gdańsk, Poland
This is Open Access article distributed under the terms of the Creative Commons Attribution-ShareAlike 4.0 International.
CNS or peripheral nervous system by using diffusion tensor imaging (DTI), a specific sequence of magnetic resonance (MR) [1]. Tractography allows reconstruc-ting the neural fibres in colourful projections that run simultaneously through particular anatomical regions of the brain. Important neural pathways are tracked
Introduction
Tractography is a non-invasive method of visu-alizing the white matter of central nervous system (CNS) structures in vivo. It is possible to determine the direction and continuity of neural fibres in either

44 Eur J Transl Clin Med 2019;2(2):43-51
Figure 1. Directionally encoded colour (DEC) sequence of the diffusion tensor tractography de-
picts the course of white matter fibres. In standard markings, the red colour means left-right,
green front-back and blue top-to-bottom directions of white matter fibres
by utilising the connection map and their course corre-lates with some pathological changes in the CNS [2-3]. That information is essential in neurosurgeon's pre-operative planning, as it leads to an improvement in setting boundaries for tumour resection and decrease of post-surgery neurological deficits.
Tractography utilises the data provided by the MR tensor, which returns information about size and the direction of the diffusion. The sketch of the white mat-ter pathways through the selected anatomical points is based on the principles of voxel continuity [4]. There are several analytical methods used in the assessment of anatomical differences between specific groups of patients. Nevertheless, the most commonly used is the voxel-based analysis. It is easily adjustable to the needs of the neurosurgeon and makes it possible to assess the degree of tissue diffusion simultaneously thro-ughout the encephalon, which points out the possible locations of tumour infiltrations. Another widely used method is an analysis of the region of interest (ROI) which enables the precise assessment of the degree of diffusion in hypothetically determined locations [5-6].
Studies conducted on neurosurgical patients reve-aled that total or subtotal brain tumor resection leads to improved survival. The specific success rate is direc-tly connected with a lower risk of tumour relapse [7-8]. From the patient’s perspective, it is crucial to maintain quality of life, motor function and speech after under-going surgery [9]. The vast majority of available litera-ture refers to the preclinical technical aspects of DTI and rarely describes its practical application. Curren-tly, only several of these practical possibilities that DTI gives are utilised in modern neurosurgery. These need to be summarised in a compre-hensive review, which is not only directed at neurosurge-ons but also radiologists and neurologists. In this study, we reviewed not only the usefulness but also the po-tential limitations of DTI in brain tumour surgery.
Tractography
Tractography is a me-thod of spatial imaging of computational radiological data. It allows various neural fibres to be tracked, which is a result of different diffusion of a single voxel. Many pro-fessional applications, both
paid and freeware, are used for tracking, fusing of the sequences and comparative analyses. These are widely available and have great flexibility in the data processing. Images can be saved in a variety of formats, printed and transferred to operating rooms or used for research purposes. The most clinically valid and nonetheless spectacular graphic presentation of DTI is a directionally encoded colour (DEC) sequence. DEC is conditioned by the direction of the diffusion vector of white matter. According to built-in, automatic, anatomi-cal atlases, applications allow precise determination of neural structures and some of the main fibre pathways. These structures are named regions of interest (ROIs). By setting one or more ROI, the application automati-cally calculates and draws white matter fibres. To note, visualising an individual neural pathway is also possible. The software also allows sketching the location of the tumour concerning the previously designated path.
At our department, we performed DTI for all pa-tients with suspected tumour infiltration, according to internal DTI protocol, resulting in a total of 60 diffusion sampling directions acquired. Parameters of those MRI examinations were as follows:
· b-value: 1000 s/mm2, · in-plane resolution: 1.95313 mm, · thickness: 2 mm, · angular threshold: 90°.
The obtained pattern of neaural tracts, as well as the outlined tumour, can be imported into the neu-ronavigation system, which seems to be the leading, practical advantage of all DTI methods.

There are two basic techniques for creating mo-dels of neural pathways: probabilistic and determini-stic. The deterministic approach implies drawing the fibres in the system by marking one starting point and another ROI. Utilising this technique, the defined neural bundle assumes only one direction assigned to
the single voxel. Therefore, the main limitation of this approach is the high anatomical variability of neural pathways and the fact that some of the fibres inter-sect each other [10]. Table 1 presents selected articles comparing both methods.
Author Title Year TractProbabilistic
vs. Deterministic
Clinical impact
Zolal A et al. [1]
Comparison of probabilistic
and deterministic fibre tracking of cranial nerves
2017Cranial nerves: II, III,V, VII,VIII
ProbabilisticProbabilistic tracking
is more effective than the previously
described deterministic
Schlaier JR et al. [2]
Probabilistic vs. deterministic fibre tracking and the
influence of different seed regions to delineate
cerebellar-thalamic fibers in deep brain stimulation
2017 Dentate-rubro thalamic tract
ProbabilisticProbabilistic fibre tracking was more sensitive and provides
more accurate tracking solutions for dentate-rubro-thalamic tract
Jenabi M et al. [3]
Identification of the Corticobulbar Tracts of the
Tongue and Face Using Deterministic and Probabilistic
DTI Fibre Tracking in Patients with Brain Tumor
2015 Corticobulbar tract
Probabilistic
Probabilistic tractography successfully reconstructs the face- and tongue-associated corticobulbar tracts from the
lateral primary motor cortex to the pons in both hemispheres
Jenabi M et al. [4]
Probabilistic fibre tracking of the language and motor white matter pathways of the supplementary motor
area (SMA) in patients with brain tumors
2014Broca's area
to SMAProbabilistic
The identification of unique areas of white matter
according to the probabilistic method allows the location
of the tract connecting Broca’s area to SMA
Li Z et al. [5]
Diffusion tensortractography of the arcuate fasciculus in patients with brain tumors: Comparison between deterministic and
probabilistic models
2013Arcuate
fasciculus Probabilistic
Probabilistic tractography reconstructs the arcuate
fasciculus more completely and performs better
through areas of tumor and/or edema
Table 1. Comparison of methods of tractography: the probabilistic and deterministic. The practical application of each technique was
extracted from the studies
45The usefulness and limitations of diffusion tensor imaging...

46 Eur J Transl Clin Med 2019;2(2):43-51
Burkett DJ et al. [6]
Deterministic Tractography
of the Descending Tract of the Spinal Trigeminal Nerve Using Diffusion Tensor Imaging
2017
descending tract
of the trigeminal
nerve
Determinitsic
The identification of unique areas of white matter
according to the probabilistic method allows the location
of the tract connecting Broca’s area to SMA
Anthofer JM et al. [7]
DTI-based deterministic fibre tracking of the medial
forebrain bundle
2015medial
forebrain bundle
Determinitsic
Deterministic tractography with different ROIs provides variable
delineations of the course of the medial
forebrain bundle
Most authors use a probabilistic method for ascer-taining a specific tract. The obtained images of DTI are easy to interpret for most of them [17-18]. The advan-tage of probabilistic tractography is an obtained ske-tch of neural tracts that presents any structural chan-ges of white matter adjacent to pathological changes [18]. On the other hand, the deterministic method, is mostly used for the analysis of the course of fibres that have their ending in the voxels with the lowest FA value [10]. For the clinical purpose, the deterministic model is chosen less frequently, although it has some clinical advantages. In our experience, the determini-stic approach results in better visualisation of the corti-cospinal tract (CST) adhering to tumours of the medial frontal lobe.
There are over 50 patients who had deterministic tracking of the CST before undergoing surgery at the Neurosurgery Department of the Medical University of Gdańsk (Poland). Those surgeries confirmed the po-sition of CST with the clinical findings. Other studies confirm our observations [19].
Clinical application of tractography
The precise visualisation of the neural pathways and their topographic relation to the tumour increases the safety of the surgery, even though DTI fibres are not the same as the actual neural pathways [19-20]. Optimal preoperative planning allows the operating team to minimise the potential damage of vital white matter during the surgery [21-22]. The images created during the preoperative planning can be superimpo-sed in realtime onto the view shown in the operative
microscope. This way the neurosurgeon can remove the tumour relying solely on the preoperative planning in what is known as ‘image-guided surgery’ [23].
Corticospinal tract
The CST is the main neuronal route responsible for motor functions of the face, limbs and trunk. CST is composed of descending fibres starting in the pre-
-centre bend (4th Brodmann area) which transmits neural impulses through the pyramid up to the spinal cord [24]. Infiltration or destruction of CST caused by a brain tumour, ischemic stroke or subarachnoid ha-emorrhage affects the density of the fibres. Sterr et al demonstrated that the degree of the damage to the pyramidal pathway is closely related to subsequent motor deficits in patients after ischemic stroke [25]. The anatomy of the CST and its topography in relation to the tumour is essential when those two are close to each other [26]. Based on tractographic parameters, we can estimate the degree of CST injury and predict the postoperative neurological outcome [26]. The CST is the neural bundle most commonly tracked by neu-rosurgeons, including at our centre [27]. Various ROIs can be used to track CST, resulting in high variability rate. Weiss et al showed that an ROI set at the anterior inferior pontine region yielded better tracking results compared to the ROI set at the internal capsule [28-30]. Furthermore, CST was reconstructed from neural bun-dles passing through by cerebral peduncle, posterior limb of internal capsule and corona radiata in a patient after stroke [31]. This study confirmed the significance of a hind limb of the internal capsule as an ROI for CST
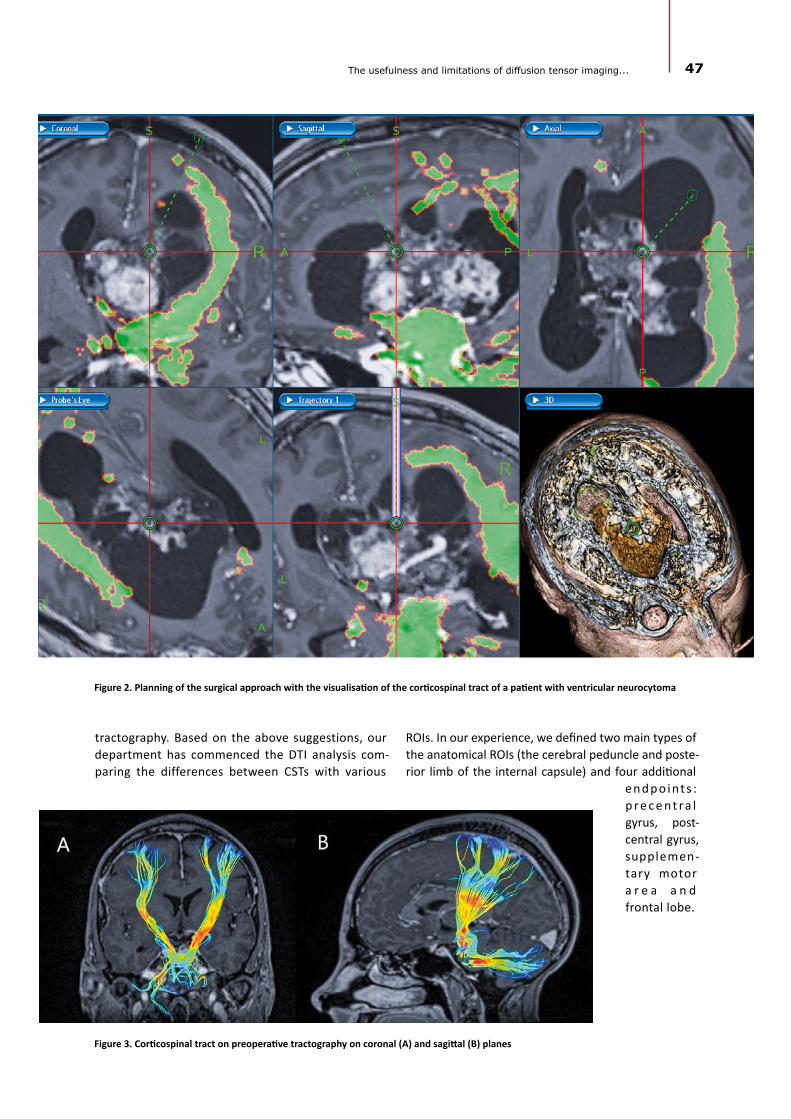
Figure 2. Planning of the surgical approach with the visualisation of the corticospinal tract of a patient with ventricular neurocytoma
tractography. Based on the above suggestions, our department has commenced the DTI analysis com-paring the differences between CSTs with various
Figure 3. Corticospinal tract on preoperative tractography on coronal (A) and sagittal (B) planes
ROIs. In our experience, we defined two main types of the anatomical ROIs (the cerebral peduncle and poste-rior limb of the internal capsule) and four additional
e n d p o i nt s : p r e c e n t ra l gyrus, post-central gyrus, supplemen-tary motor a r e a a n d frontal lobe.
47The usefulness and limitations of diffusion tensor imaging...

48 Eur J Transl Clin Med 2019;2(2):43-51
Arcuate Fasciculus (AF)
AF is the white matter pathway connecting the Broca speech centre (located in the frontal lobe) with the Wernicke speech centre (temporal lobe). CNS le-sions infiltrating AF affect speech because the com-munication between the Broca and Wernicke areas becomes severed. The patient usually presents with so-called conduction aphasia [32-33]. DTI-based visu-alisation of AF is an widely accepted management for tumours of eloquent areas. The synchronisation of the tractography with the navigation system determines the precise location of the AF. Therefore, DTI sets bo-undaries for resection of a tumour located near AF and helps to prevent iatrogenic injury of the speech centre [34]. However, AF alone tractography could not always prevent postoperative aphasia. Cortical mapping, to-gether with neurophysiological monitoring, could be applied for some more demanding tumours, although some surgeons prefer awake craniotomy [35]. Awake craniotomy also improves patient safety in terms of preserving speech functions [36]. The different loca-tion of both Broca and Wernicke area among indivi-duals preclude the correct prediction of functionally active AF in DTI, what seems to be the main drawback of DTI tracking of AF, also confirmed by our experience.
Nevertheless, functional MRI also can unambi-guously estimate the exact location of speech areas. Researchers should put more effort into studying DTI in terms of speech preservation as awake craniotomy resection is still more reliable in this case [37].
Figure 4. Arcuate Fasciculus connecting Broca’s and Wernicke’s areas
Frontal aslant tract
The frontal aslant tract (FAT), first described in DTI by Catani et al, contains neural fibres connecting the lo-wer frontal bend (pars triangularis and pars opercularis of the operculum) with the supplementary motor area (SMA) and pre-SMA [38]. Tumors infiltrating SMA or pre-SMA may impede some motor functions, learning and aphasia. In a majority of patients, the FAT projected to the opercularis part of inferior frontal gyrus (IFG) and a greater number of fibres terminated at the triangula-ris part of IFG in left-handed patients [39]. The course of FAT through the inferior frontal lobe and the Broca’s area suggests its significant role in the proper functio-ning of speech. Patients with progressive aphasia with a significant change within the FAT show particularly lar-ge changes in the correlation with AF [38-40]. In studies of the surgical treatment of patients with brain tumours, FAT lesions are associated with transient speech disor-ders and the occurrence of mutism and motor aphasia [34, 41]. The accurate prediction of the FAT location is possible thanks to the neuromonitoring techniques and direct stimulation of the cerebral cortex. In one study, the intraoperative stimulation of the left hemisphere FAT during craniotomy caused transient speech disor-der of the stuttering type [34, 42].
In clinical practice, FAT could be determined to be a means of DTI in patients for whom an awake cranio-tomy is planned [43]. Baker et al. suggested that FAT and "crossed FAT" are of great importance for tumours infiltrating SMA and pre-SMA [37, 44].
Limitations and future
DTI is an imaging method used as a radiological tool for years. However, only the recent development of visualisation of neural tracts, tractography, makes it possible to use on per-sonal computers. Frequent use of tractography leads to the constant improvement of re-construction methods and the-se directly influenced the preci-sion of treatment in the clinical setting. The correlation of DTI with a patient’s neurological condition is sufficient for an adequate therapeutic process
of tractograph

Figure 5. Frontal aslant tract based on two regions of interest--gyrus frontalis superior (GFs) and gy-
rus frontalis inferior (GFi). Abbreviations: GFs –gyrus frontalis superior, GFi – gyrus frontalis inferior
[45-47]. However, tractography is not considered as a standard approach due to its limitations, variability of obtained data and lack of standardisation of image acquisition parameters.
49The usefulness and limitations of diffusion tensor imaging...
As mentioned earlier, tractography is a method of spatial imaging of computational radiological data and because of that use of DTI in surgical planning remains virtual. For patients with malignant tumours or signifi-cant brain edema, the identification of neural pathways is inaccurate [47]. Furthermore, in the case of sizable cerebrospinal fluid flow, there is a risk of motion arte-facts occurring during the DTI acquisition. This functio-nal limitation substantially affects the precision of trac-tography. For these reasons, DTI techniques should be regarded as complementary in surgical planning or as an educational tool [48].
On the other hand, DTI is still dynamically evolving. Thanks to its widespread use by neurosurgeons, we need continuous research to discover new clinical uses and possibilities of DTI. The main contemporary issue is to find the functional significance of each visu-alised neural tract. On the contrary, even if a particular
amount of fibres is da-maged during the surge-ry, it does not necessarily lead to noticeable neu-rological deficits [21]. It seems that the future of neural tract tracking lies in the development of a universal mathematical model for precise deline-ation of anatomic-func-tional structures [23].
Tractography, as a method of imaging, has been used for se-veral years. We’ve been using it at out depart-ment since 2010. In most cases, acquisition para-meters are the same but
ways of determining the nerve path of our patients are based on the experience of the researcher currently re-sponsible for the patient. Nevertheless, conclusions of all the researchers are in line with each other. Also other review articles coincide with our observations about the utility and reliability of the tractography as a standard diagnostic procedure. Furthermore, our results are in line with the experiences published by other teams abo-ut the necessity of using the tractography as an essential tool in treatment in patients with a brain tumour.
Conclusions DTI is a clinically significant tool in the daily neu-
rosurgical practice. In the current review, we provide examples where tractography is a valuable imaging ad-junct. Owing to the limitations of DTI, combining trac-tography with intraoperative monitoring would allow more accurate preoperative planning and then incre-ase the safety of the surgery. Further standardisation of DTI protocols is needed.
1. Basser PJ, Pajevic S, Pierpaoli C, Duda J, Aldroubi A. In vivo fiber tractography using DT-MRI data. Magn Reson Med [In-ternet]. 2000;44(4):625–32. Available from: http://www.ncbi.nlm.nih.gov/pubmed/11025519
2. Catani M. Occipito-temporal connections in the human brain. Brain [Internet]. 2003 Sep 1;126(9):2093–107. Available from: https://academic.oup.com/brain/article-lookup/doi/10.1093/brain/awg203
3. Gierek T, Paluch J, Pencak P, Kaźmierczak B, Klimczak-Gołab L. [Magnetic resonance tractography in neuroradiological diagnostic aspects]. Otolaryngol Pol = Polish Otolaryngol [Internet]. 2009;63(5):403–6. Available from: http://linkinghub.elsevier.com/retrieve/pii/S0030665709701519
References

50 Eur J Transl Clin Med 2019;2(2):43-51
4. Radek M, Wiśniewski K, Grochal M, Jastrzębski K, Gębski P, Snopkowska-Wiaderna D, et al. Traktografia rdzenia jako meto-da diagnostyczna w trudnych przypadkach guzów śródrdzeniowych. Neurol Neurochir Pol [Internet]. 2013;47(1):74–9. Available from: https://linkinghub.elsevier.com/retrieve/pii/S0028384314602747
5. Gawłowska-Sawosz M, Pawełczyk A, Gębski P, Pawełczyk T, Strzelecki D, Rabe-Jabłońska J. Evaluation of white matter struc-ture changes, as assessed in tractography, and cognitive dysfunctions in patients with early onset schizophrenia and their first-degree relatives. Psychiatr Pol [Internet]. 2017;51(4):735–50. Available from: http://psychiatriapolska.pl/735750_
6. Shizukuishi T, Abe O, Aoki S. Diffusion tensor imaging analysis for psychiatric disorders. Magn Reson Med Sci [Internet]. 2013;12(3):153–9. Available from: http://www.ncbi.nlm.nih.gov/pubmed/23857149
7. Smith JS, Chang EF, Lamborn KR, Chang SM, Prados MD, Cha S, et al. Role of Extent of Resection in the Long-Term Out-come of Low-Grade Hemispheric Gliomas. J Clin Oncol [Internet]. 2008 Mar 10;26(8):1338–45. Available from: http://ascopubs.org/doi/10.1200/JCO.2007.13.9337
8. Dubey A, Kataria R, Sinha V. Role of diffusion tensor imaging in brain tumor surgery. Asian J Neurosurg [Internet]. 2018;13(2):302. Available from: http://www.asianjns.org/text.asp?2018/13/2/302/228537
9. Ulmer JL, Salvan C V., Mueller WM, Krouwer HG, Stroe GO, Aralasmak A, et al. The role of diffusion tensor imaging in establishing the proximity of tumor borders to functional brain systems: Implications for preoperative risk assessments and postoperative outcomes. Technol Cancer Res Treat [Internet]. 2004;3(6):567–76. Available from: https://journals.sagepub.com/doi/abs/10.1177/153303460400300606
10. Klein J, Grötsch A, Betz D, Barbieri S, Friman O, Stieltjes B, et al. Qualitative and quantitative analysis of probabilistic and deterministic fiber tracking. In: Dawant BM, Haynor DR, editors. Medical Imaging 2010: Image Processing [Internet]. 2010. p. 76232A. Available from: http://proceedings.spiedigitallibrary.org/proceeding.aspx?doi=10.1117/12.843472
11. Zolal A, Sobottka SB, Podlesek D, Linn J, Rieger B, Juratli TA, et al. Comparison of probabilistic and deterministic fiber tracking of cranial nerves. J Neurosurg [Internet]. 2017;127(3):613–21. Available from: https://thejns.org/view/jour-nals/j-neurosurg/127/3/article-p613.xml
12. Schlaier JR, Beer AL, Faltermeier R, Fellner C, Steib K, Lange M, et al. Probabilistic vs. deterministic fiber tracking and the influence of different seed regions to delineate cerebellar-thalamic fibers in deep brain stimulation. Roeper J, editor. Eur J Neurosci [Internet]. 2017;45(12):1623–33. Available from: https://doi.org/10.1111/ejn.13575
13. Jenabi M, Peck KK, Young RJ, Brennan N, Holodny AI. Identification of the Corticobulbar Tracts of the Tongue and Face Using Deterministic and Probabilistic DTI Fiber Tracking in Patients with Brain Tumor. Am J Neuroradiol [Internet]. 2015;36(11):2036–41. Available from: http://www.ajnr.org/lookup/doi/10.3174/ajnr.A4430
14. Jenabi M, Peck KK, Young RJ, Brennan N, Holodny AI. Probabilistic fiber tracking of the language and motor white matter pathways of the supplementary motor area (SMA) in patients with brain tumors. J Neuroradiol [Internet]. 2014 Dec 1 [cit-ed 2019 Sep 30];41(5):342–9. Available from: https://www.sciencedirect.com/science/article/pii/S0150986113001302
15. Li Z, Peck KK, Brennan NP, Jenabi M, Hsu M, Zhang Z, et al. Diffusion tensor tractography of the arcuate fasciculus in patients with brain tumors: Comparison between deterministic and probabilistic models. J Biomed Sci Eng [Internet]. 2013;6(2):192–200. Available from: https://www.ncbi.nlm.nih.gov/pubmed/25328583
16. Burkett DJ, Garst JR, Hill JP, Kam A, Anderson DE. Deterministic Tractography of the Descending Tract of the Spinal Trigeminal Nerve Using Diffusion Tensor Imaging. J Neuroimaging [Internet]. 2017 Sep;27(5):539–44. Available from: http://doi.wiley.com/10.1111/jon.12425
17. Anthofer JM, Steib K, Fellner C, Lange M, Brawanski A, Schlaier J. DTI-based deterministic fibre tracking of the medial forebrain bundle. Acta Neurochir (Wien) [Internet]. 2015 Mar 15;157(3):469–77. Available from: http://link.springer.com/10.1007/s00701-014-2335-y
18. Jbabdi S, Johansen-Berg H. Tractography: Where Do We Go from Here? Brain Connect [Internet]. 2011 Sep;1(3):169–83. Available from: http://www.liebertpub.com/doi/10.1089/brain.2011.0033
19. Schonberg T, Pianka P, Hendler T, Pasternak O, Assaf Y. Characterization of displaced white matter by brain tumors using combined DTI and fMRI. Neuroimage [Internet]. 2006 May;30(4):1100–11. Available from: https://linkinghub.elsevier.com/retrieve/pii/S1053811905024626
20. Witwer BP, Moftakhar R, Hasan KM, Deshmukh P, Haughton V, Field A, et al. Diffusion-tensor imaging of white matter tracts in patients with cerebral neoplasm. J Neurosurg [Internet]. 2002;97(3):568–75. Available from: https://thejns.org/view/journals/j-neurosurg/97/3/article-p568.xml
21. Provenzale JM, Mukundan S, Barboriak DP. Diffusion-weighted and Perfusion MR Imaging for Brain Tumor Characteri-zation and Assessment of Treatment Response. Radiology [Internet]. 2006;239(3):632–49. Available from: http://pubs.rsna.org/doi/10.1148/radiol.2393042031
22. Al-Okaili RN, Krejza J, Wang S, Woo JH, Melhem ER. Advanced MR Imaging Techniques in the Diagnosis of Intraaxial Brain Tumors in Adults. RadioGraphics [Internet]. 2006 Oct;26(suppl_1):S173–89. Available from: http://pubs.rsna.org/doi/10.1148/rg.26si065513
23. Krakowiak M, Słoniewski P, Dzierżanowski J, Szmuda T. Future of the nerve fibres imaging: tractography application and development directions. Folia Morphol (Warsz) [Internet]. 2015 Sep 2;74(3):290–4. Available from: https://journals.via-medica.pl/folia_morphologica/article/view/38825
24. Tracey D. Ascending and Descending Pathways in the Spinal Cord. In: The Rat Nervous System [Internet]. Elsevier; 2004. p. 149–64. Available from: https://linkinghub.elsevier.com/retrieve/pii/B9780125476386500080
25. Sterr A, Shan Shen, Szameitat AJ, Herron KA. The Role of Corticospinal Tract Damage in Chronic Motor Recovery and Neurorehabilitation: A Pilot Study. Neurorehabil Neural Repair [Internet]. 2010 Jun;24(5):413–9. Available from: http://journals.sagepub.com/doi/10.1177/1545968309348310
26. Seo JP, Jang SH. Different Characteristics of the Corticospinal Tract According to the Cerebral Origin: DTI Study. Am J Neuroradiol [Internet]. 2013 Jul;34(7):1359–63. Available from: http://www.ajnr.org/lookup/doi/10.3174/ajnr.A3389

51The usefulness and limitations of diffusion tensor imaging...
27. Min Z, Niu C, Zhang Q, Zhang M, Qian Y. Optimal Factors of Diffusion Tensor Imaging Predicting Corticospinal Tract Injury in Patients with Brain Tumors. Korean J Radiol [Internet]. 2017;18(5):844. Available from: https://synapse.koreamed.org/DOIx.php?id=10.3348/kjr.2017.18.5.844
28. Morita N, Wang S, Kadakia P, Chawla S, Poptani H, Melhem ER. Diffusion Tensor Imaging of the Corticospinal Tract in Pa-tients with Brain Neoplasms. Magn Reson Med Sci [Internet]. 2011;10(4):239–43. Available from: http://joi.jlc.jst.go.jp/JST.JSTAGE/mrms/10.239?from=CrossRef
29. Gao B, Shen X, Shiroishi MS, Pang M, Li Z, Yu B, et al. A pilot study of pre-operative motor dysfunction from gliomas in the region of corticospinal tract: Evaluation with diffusion tensor imaging. Fung SH, editor. PLoS One [Internet]. 2017 Aug 22;12(8):e0182795. Available from: https://dx.plos.org/10.1371/journal.pone.0182795
30. Weiss C, Tursunova I, Neuschmelting V, Lockau H, Nettekoven C, Oros-Peusquens A-M, et al. Improved nTMS- and DTI-de-rived CST tractography through anatomical ROI seeding on anterior pontine level compared to internal capsule. Neuro-Image Clin [Internet]. 2015;7:424–37. Available from: https://linkinghub.elsevier.com/retrieve/pii/S2213158215000078
31. Maraka S, Jiang Q, Jafari-Khouzani K, Li L, Malik S, Hamidian H, et al. Degree of corticospinal tract damage correlates with motor function after stroke. Ann Clin Transl Neurol [Internet]. 2014;1(11):891–9. Available from: http://doi.wiley.com/10.1002/acn3.132
32. Geranmayeh F, Brownsett SLE, Wise RJS. Task-induced brain activity in aphasic stroke patients: what is driving recov-ery? Brain [Internet]. 2014 Oct;137(10):2632–48. Available from: https://academic.oup.com/brain/article-lookup/doi/10.1093/brain/awu163
33. Fridriksson J, Guo D, Fillmore P, Holland A, Rorden C. Damage to the anterior arcuate fasciculus predicts non-fluent speech production in aphasia. Brain [Internet]. 2013 Nov;136(11):3451–60. Available from: https://academic.oup.com/brain/article-lookup/doi/10.1093/brain/awt267
34. Fujii M, Maesawa S, Motomura K, Futamura M, Hayashi Y, Koba I, et al. Intraoperative subcortical mapping of a lan-guage-associated deep frontal tract connecting the superior frontal gyrus to Broca’s area in the dominant hemisphere of patients with glioma. J Neurosurg [Internet]. 2015 Jun;122(6):1390–6. Available from: https://thejns.org/view/jour-nals/j-neurosurg/122/6/article-p1390.xml
35. De Witte E, Mariën P. The neurolinguistic approach to awake surgery reviewed. Clin Neurol Neurosurg [Internet]. 2013;115(2):127–45. Available from: https://linkinghub.elsevier.com/retrieve/pii/S0303846712004933
36. Sitnikov AR, Grigoryan YA, Mishnyakova LP. Awake craniotomy without sedation in treatment of patients with lesional epilepsy. Surg Neurol Int [Internet]. 2018;9:177. Available from: http://www.ncbi.nlm.nih.gov/pubmed/30221022
37. Chernoff BL, Teghipco A, Garcea FE, Sims MH, Paul DA, Tivarus ME, et al. A Role for the Frontal Aslant Tract in Speech Planning: A Neurosurgical Case Study. J Cogn Neurosci [Internet]. 2018 May;30(5):752–69. Available from: https://www.mitpressjournals.org/doi/abs/10.1162/jocn_a_01244
38. Catani M, Dell’Acqua F, Vergani F, Malik F, Hodge H, Roy P, et al. Short frontal lobe connections of the human brain. Cortex [Internet]. 2012 Feb;48(2):273–91. Available from: https://linkinghub.elsevier.com/retrieve/pii/S0010945211003170
39. Szmuda T, Rogowska M, Słoniewski P, Abuhaimed A, Szmuda M, Springer J, et al. Frontal aslant tract projections to the inferior frontal gyrus. Folia Morphol (Warsz) [Internet]. 2017 Dec 1;76(4):574–81. Available from: https://journals.via-medica.pl/folia_morphologica/article/view/50306
40. Mandelli ML, Caverzasi E, Binney RJ, Henry ML, Lobach I, Block N, et al. Frontal White Matter Tracts Sustaining Speech Production in Primary Progressive Aphasia. J Neurosci [Internet]. 2014 Jul 16;34(29):9754–67. Available from: http://www.jneurosci.org/cgi/doi/10.1523/JNEUROSCI.3464-13.2014
41. Sierpowska J, Gabarrós A, Fernandez-Coello A, Camins À, Castañer S, Juncadella M, et al. Morphological derivation overflow as a result of disruption of the left frontal aslant white matter tract. Brain Lang [Internet]. 2015 Mar;142:54–64. Available from: https://linkinghub.elsevier.com/retrieve/pii/S0093934X15000061
42. Kemerdere R, de Champfleur NM, Deverdun J, Cochereau J, Moritz-Gasser S, Herbet G, et al. Role of the left frontal aslant tract in stuttering: a brain stimulation and tractographic study. J Neurol [Internet]. 2016 Jan 11;263(1):157–67. Available from: http://link.springer.com/10.1007/s00415-015-7949-3
43. Andrea GD, Trillo G, Picotti V, Raco A. Trends in Reconstructive Neurosurgery [Internet]. Visocchi M, Mehdorn HM, Katay-ama Y, von Wild KRH, editors. Cham: Springer International Publishing; 2017. 241–250 p. (Acta Neurochirurgica Supple-ment; vol. 124). Available from: http://link.springer.com/10.1007/978-3-319-39546-3
44. Varriano F, Pascual-Diaz S, Prats-Galino A. When the FAT goes wide: Right extended Frontal Aslant Tract volume predicts performance on working memory tasks in healthy humans. He H, editor. PLoS One [Internet]. 2018 Aug 1;13(8):e0200786. Available from: https://dx.plos.org/10.1371/journal.pone.0200786
45. Essayed WI, Zhang F, Unadkat P, Cosgrove GR, Golby AJ, O’Donnell LJ. White matter tractography for neurosurgical plan-ning: A topography-based review of the current state of the art. NeuroImage Clin [Internet]. 2017;15(January):659–72. Available from: https://linkinghub.elsevier.com/retrieve/pii/S2213158217301444
46. Abdullah KG, Lubelski D, Nucifora PGP, Brem S. Use of diffusion tensor imaging in glioma resection. Neurosurg Focus [Internet]. 2013 Apr;34(4):E1. Available from: https://thejns.org/view/journals/neurosurg-focus/34/4/article-pE1.xml
47. Castellano A, Bello L, Michelozzi C, Gallucci M, Fava E, Iadanza A, et al. Role of diffusion tensor magnetic resonance tractography in predicting the extent of resection in glioma surgery. Neuro Oncol [Internet]. 2012 Feb 1;14(2):192–202. Available from: https://academic.oup.com/neuro-oncology/article-lookup/doi/10.1093/neuonc/nor188
48. Zhukov VY, Goryaynov SA, Ogurtsova AA, Ageev IS, Protskiy S V, Pronin IN, et al. [Diffusion tensor imaging tractography and intraoperative neurophysiological monitoring in surgery of intracranial tumors located near the pyramidal tract]. Zh Vopr Neirokhir Im N N Burdenko [Internet]. 2016;80(1):5–18. Available from: https://www.researchgate.net/profile/Ivan_Ageev/publication/301315444_Diffusion_tensor_imaging_tractography_and_intraoperative_neurophysiological_moni-toring_in_surgery_of_intracranial_tumors_located_near_the_pyramidal_tract/links/5873d42008ae8fce4924cc91.pdf

REVIEW ARTICLE
Quality of life after laparoscopic sleeve gastrectomy – review of literature
Abstract
Background: The last decade brought changes the most frequently performed types of bariatric procedures. Despite the well-documented positive impact of bariatric surgery on depression, somatic comorbidities, lifespan prolongation and cancer risk, there is still insufficient data on patients’ quality of life (QoL) after this operation.Methods: PubMed and Scopus databases as well as Mendeley search engine were used to find publications from last ten years focusing on QoL after LSG. 702 abstracts were reviewed. 13 articles with 1630 patients in total were analyzed. Results: Six different QoL assessment tools were described in the reviewed literature: SF-36, BAROS, Moorehead-Ardelt II questionnaire, IWQOL-Lite, GIQLI and SF8. In majority of studies the QoL was improved. Pre- and postoperative assessment with SF-36 showed significant improvement. The mean BAROS score was 5.1-7.1 with 77-96% of patients achieving “good” to “excellent” outcomes. In some studies, QoL was better in females and in one study QoL was below the general population norms. Some studies demonstrated lack of improvement in QoL after LSG or no correlation between excess weight loss and health related QOL. Conclusions: High quality research about QoL after LSG is limited, though quality of life seems to be better after that procedure.
Keywords: bariatric surgery · metabolic surgery · BAROS · SF-36 · QoL
EUROPEAN JOURNAL OF TRANSLATIONAL AND CLINICAL MEDICINE 2019;2(2):52-60
Citation
Wityk M, Makarewicz W, Kaczmarkiewicz C, Bobowicz M. Quality of life after laparoscopic sleeve gastrectomy – review of literature. Eur J Transl Clin Med. 2019;2(2):52-60.DOI: 10.31373/ejtcm/112077
Corresponding author:
Mateusz Wityk, Department of General and Oncological Surgery, Voivodeship Specialist Hospital of Janusz Korczak in Słupsk, Poland
e-mail: [email protected]
No external funds.
Available online: www.ejtcm.gumed.edu.pl
Copyright ® Medical University of Gdańsk
Mateusz Wityk1 , Wojciech Makarewicz2 ,
Cezary Kaczmarkiewicz1 , Maciej Bobowicz2
1Department of General and Oncological Surgery, Voivodeship Specialist Hospital of Janusz Korczak in Słupsk, Poland2Department of Oncological Surgery, Medical University of Gdańsk, Poland
This is Open Access article distributed under the terms of the Creative Commons Attribution-ShareAlike 4.0 International.
53Quality of life after laparoscopic sleeve gastrectomy...
Introduction
Obesity increases the risk of metabolic, cardio-vascular and musculoskeletal diseases, depression and several types of cancer. In addition, obesity might lead to reduced quality of life, lower productivity and social disadvantages [1]. Obesity also decreases life expec-tancy [2]. The worldwide prevalence of overweight and obesity has doubled since 1980 to an extent that nearly a third of the world's population is currently classified as overweight or obese [3].
The superiority of surgery over conservative treat-ment for obesity and related diseases has been pro-ven for many years [4]. Last decade brought changes in the trends of most frequently performed types of operations. A 2018 Worldwide Survey published by the International Federation for the Surgery of Obe-sity and Metabolic Disorders (IFSO) showed that the most frequently performed primary surgical bariatric/metabolic procedure in 2016 was laparoscopic sleeve gastrectomy (LSG) (53.6%), followed by Roux-en-Y ga-stric bypass (30.1%) and one-anastomosis gastric by-pass (4.8%) [5].
The first sleeve gastrectomy was performed in 1988 as part of the biliopancreatic diversion with duodenal switch and since 2004 was accepted as a stand-alone bariatric procedure [6]. In the following years it be-came the most common type of surgical treatment of obesity in Poland (62%) and worldwide [5].
There are several measurable outcomes of bariatric surgery such as weight loss, resolution or improvement of comorbidities and an increase in life expectancy. One of the most important patient-reported outcomes, which is defining failure or success of bariatric surgery is Health-Related Quality of Life (HRQoL), however only few published studies focused on this end point [7-8]. There is some original research and literature reviews about QoL after bariatric surgery, comparing various methods of surgical technique [9]. Nevertheless, to our best knowledge, there are no reviews focusing directly on QoL after LSG and the relevant articles started to appear well after 2004 (2). In perspective of rising po-pularity of the LSG as the surgical treatment of choice for obesity, our aim was to assess the impact of this procedure on patients’ quality of life (QoL).
Material & Methods
In 2010 LSG became the most frequently perfor-med bariatric procedure in Poland, and thus our deci-sion to include publications from the last 10 years [10]. We searched relevant publications that investigated
adult participants (both sexes) who underwent LSG for obesity and underwent assessment of QoL at le-ast once after 6-months of follow-up (or longer) with one of the well-established and validated tools for the QoL assessment (The 36-Item Short Form Health Survey (SF-36), Bariatric Analysis and Reporting Out-come System (BAROS) and it’s updated version, The Moorehead-Ardelt Quality of Life Questionnaire (MA-
-II), The Impact of Weight on Quality of Life - Lite Qu-estionnaire (IWQOL-Lite), The Gastrointestinal Quality of Life Index (GIQLI) and The 8-Item Short Form Health Survey (SF-8) [11-18]. We took into consideration all QoL outcomes depending on the design of the QoL form and the primary outcome was the change in the total score of the QoL assessment after LSG.
In this review we used PubMed and Scopus data-bases as well as Mendeley search engine for articles from last ten years focusing on quality of life after LSG. Search strategy was based on terms “sleeve gastrecto-my” and “laparoscopy”/or “LSG” and “quality of life”/or “QoL” and was performed independently by two researchers (MW and MB). We excluded case reports, reviews, letters, duplicate studies, pediatric patients (< 18 years of age), studies with patient samples smal-ler than 50 patients (n < 50) and studies involving ba-riatric procedures other than LSG [e.g. laparoscopic Roux-en-Y gastric bypass (LRYGB), single-anastomosis gastric bypass (SAGB) or mini-gastric bypass (MGB), adjustable gastric banding (AGB)].
Results
Literature search
Initial search returned 702 abstracts (see Figure 1). Of those, 25 abstracts met the inclusion criteria. Full-
-texts of articles were obtained and reviewed. 12 articles were excluded for reasons such as analyzing the same groups of patients, using not validated QoL questionnaires or small patient samples (n < 50). We included 13 articles in the final analysis, with a total of 1630 patients and extracted the data (see Figure 1).
Patient Characteristics
In A total of 1630 adults underwent LSG as a tre-atment for morbid obesity. 1151 were female and 416 were male. BMI and age of patients are conta-ined in Table 1.
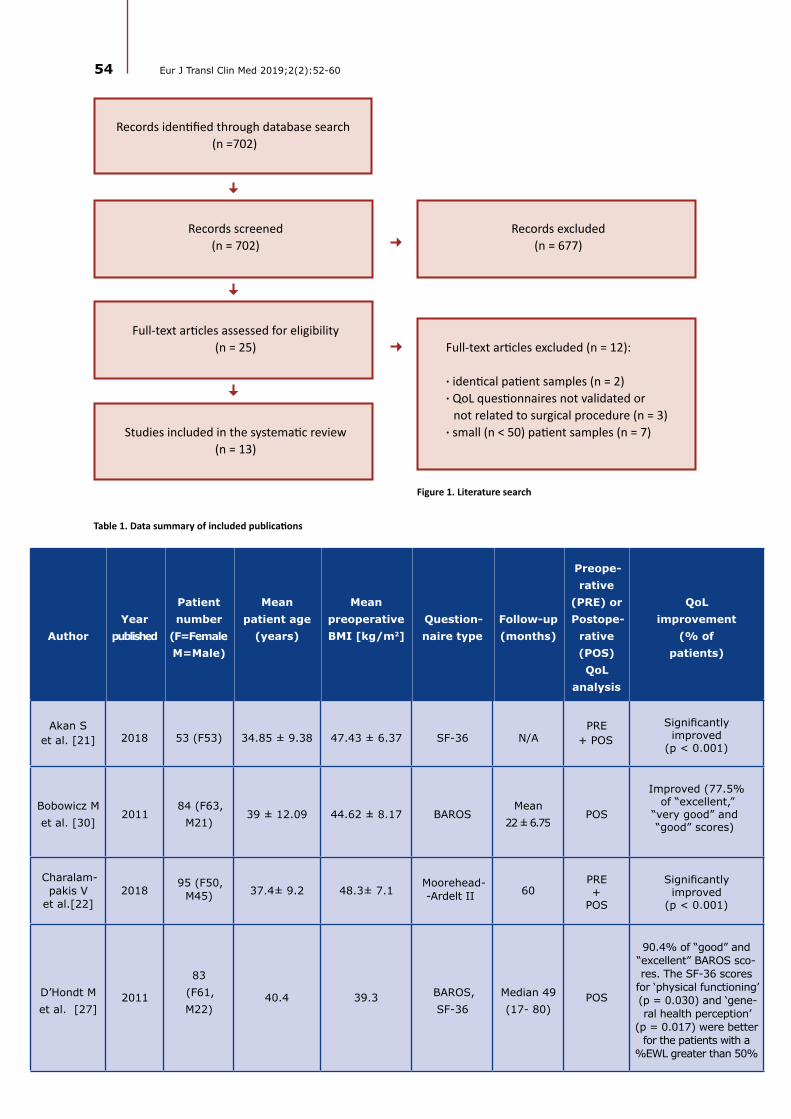
54 Eur J Transl Clin Med 2019;2(2):52-60
AuthorYear
published
Patient number
(F=FemaleM=Male)
Mean patient age
(years)
Mean preoperativeBMI [kg/m2]
Question-naire type
Follow-up (months)
Preope-rative
(PRE) or Postope-
rative (POS)QoL
analysis
QoL improvement
(% of patients)
Akan S et al. [21] 2018 53 (F53) 34.85 ± 9.38 47.43 ± 6.37 SF-36 N/A
PRE + POS
Significantly improved
(p < 0.001)
Bobowicz M et al. [30]
201184 (F63,
M21)39 ± 12.09 44.62 ± 8.17 BAROS
Mean 22 ± 6.75
POS
Improved (77.5% of “excellent,”
“very good” and “good” scores)
Charalam-pakis V
et al.[22]2018
95 (F50, M45) 37.4± 9.2 48.3± 7.1
Moorehead--Ardelt II 60
PRE +
POS
Significantly improved
(p < 0.001)
D’Hondt M et al. [27]
2011
83 (F61, M22)
40.4 39.3 BAROS, SF-36
Median 49 (17- 80)
POS
90.4% of “good” and “excellent” BAROS sco-res. The SF-36 scores
for ‘physical functioning’ (p = 0.030) and ‘gene-ral health perception’
(p = 0.017) were better for the patients with a
%EWL greater than 50%
Records identified through database search (n =702)
Records screened(n = 702)
Full-text articles assessed for eligibility(n = 25)
Studies included in the systematic review(n = 13)
Records excluded(n = 677)
Full-text articles excluded (n = 12):
· identical patient samples (n = 2)· QoL questionnaires not validated or
not related to surgical procedure (n = 3)· small (n < 50) patient samples (n = 7)
Figure 1. Literature search
Table 1. Data summary of included publications

55Quality of life after laparoscopic sleeve gastrectomy...
Fezzi M et al.[23]
201177
(F54, M23)
42.4 47 SF-36, IWQOL-Lite
12PRE +
POS
Significantly improved SF-36 (p < 0.001) and
IWQOL-Lite (p < 0.001)
Figura A et al.[19]
201659
(N/A)**63 (F45,
M18)
45.6 ±
10.9
51.5± 8.1
SF-8 Mean 19 ± 6
PRE +
POS
Significant impro-vement in physical health (p < 0.001).
Mental health did not change significantly
(p > 0.05)
Flølo TN et al.[28]
2017136 (F97, M39)
40.3 ±10.5 46.2 ± 6.4 SF-36 60 POSSignificant
improvement (p < 0.001)
Gallart--Aragon T et al. [24]
201872
(F47, M25)
45.36±
9.38N/A GIQLI 6
PRE +
POS
Significant improve-ment in total GIQLI score (p < 0.001)
Hosseini SV et al.
[29]2018
120 (F95,M25)
35.23±
10.0548.87
Moorehead--Ardelt II,
SF-36
Median 14.5
(2- 46)POS
No significant difference in MAII score before and
after operation (good to excellent in 90%).SF-36 scores were
statistically different in all parameters (p < 0.05) except for ‘role limitations
attributed to emotional problems’ and ‘mental health’ with no significant
difference (p = 0.080, 0.074,
respectively)
Kirkil C et al.[20]
2018562
(F399, M163)
34.1± 8.1
45.4±
5.4BAROS
Mean 7.4 ± 5.3
POS
Good to excellent BAROS score in
80.1% of patients. The mean QoL scores
were significantly increased after LSG (range, p < 0.05
to < 0.001)
Porta A et al. ***
[25]2016
130 (F104, M26)
CL 39± 2.3SI 36± 2.9
CL 41.01± 0.4
SI 40.09± 0.3
SF-36 12PRE+
POS
Significant improvement in all
items of SF-36 in CL and SI groups
(both p < 0.05)

56 Eur J Transl Clin Med 2019;2(2):52-60
Rebibo L et al. [26]
201656
(F44, M12)
43.3± 10.8
46.3±7.1
SF-36, BAROS
6PRE*+
POS
Significant improve-ment in all domains
of the SF-36 qu-estionnaire
(p < 0.01). Mean BAROS score during
follow-up = 7.1 (range: 4- 9)
Sofianos C et al. [31]
2016 103 (F88 M15)
41.8 42.1 BAROS 6 POS Excellent to good score in 96.1%
TotalT = 1630
F = 1151**M = 416**
*Preoperative data available only for SF-36
**Gender results were corrected according to Figura et al. - N/A data of 4 excluded person gender
***Two groups of patients: CL= Conventional LSG, SI=Single incision LSG
Quality of life
In The most frequently used questionnaires were SF-36 (in 7 studies), BAROS (5; twice authors used the updated version) and Moorehead-Ardelt II question-naire (2). IWQOL-Lite, GIQLI and SF8 forms were used in one study each [11, 13-18].
Design varied significantly between studies with relatively short follow-up < 12 months in 6 studies and > 12 months in the remaining 7 studies. Majority of the articles (N = 8) included data for small study groups (50-100 patients), 4 studies had 100-200 participants and only 1 analyzed > 500 patients (Tab.1) [20]. Only 7 studies incorporated preoperative analysis of QoL [19, 21-26].
SF-36
The SF-36 questionnaire was used in 7 publications four times set together with another questionnaire [21, 23, 25-29]. Studies by Akan et al., Fezzi et al., Por-ta et al. and Rebibo et al. demonstrated significant improvement in all domains of the SF-36 in 6 and 12 months after surgery compared to preoperative scores [21, 23, 25-26]. Moreover, Akan et al. showed promi-nent postoperative improvement in the physical and mental components of the SF-36 questionnaire com-paring with preoperative scores [21].
In a postoperative analysis by D’Hondt et al., pa-tients with a percent excess weight loss (%EWL) > 50% at median 49 months of observation had higher SF-36
scores for ‘physical functioning’ and ‘general health’ perception [27]. Hosseini et al. compared a group of candidates for surgery with patients after LSG. SF-36 scores were statistically different in all parameters ex-cept mental health and role limitation due to emotio-nal problems [29].
Fezzi et al. showed significant improvement in all domains of SF-36, but there was no statistically signifi-cant correlation between weight loss and the QoL [23]. Porta et al. additionally investigated the influence of classical or single incision LSG on QoL, showing no dif-ference in QoL outcomes between the groups [25].
Flølo et al. checked QoL 5 years after sleeve ga-strectomy and compared it with a baseline cohort of obese patients eligible for LSG and a cohort represen-tative of the Norwegian general population. The men-tal and physical summary scores were better at 5-year follow-up compared with baseline cohort but were below the normal results of the rest of the population. Authors showed no correlation between %EWL and HRQOL score at 5-year follow-up [28].
BAROS
The BAROS questionnaire was used in 5 studies, twice it was paired with the SF-36 [20, 26, 27, 30-31]. In 2 studies the authors used the updated version of BAROS [14, 20, 27]. In both versions this questionnaire merges %EWL, improvement of comorbidities, QoL in self-esteem, physical activity, social, labor and sexual

57Quality of life after laparoscopic sleeve gastrectomy...
aspects, allowing complex assessment of outcomes in bariatric surgery.
The BAROS questionnaire was completed by pa-tients in Sofianos et al. study with good to excel-lent outcomes achieved in 96.1% of patients at the 6-month follow-up and the mean BAROS score was 5.1 (range 1.9-8.7, max. possible score = 9) [31]. Rebibo et al. checked QoL after 6 months of follow-up using previous version of BAROS. Mean postoperative BA-ROS score was 7.1 (range 4-9) which means that the entire study group (56 patients) achieved an excellent outcome, although no precise information about the distribution of outcomes was included [26]. Slightly less optimistic results are published Kirkil et al. in their study on 562 respondents: “good” to “excellent” out-comes in 80% of patients (19.6% “excellent,” 25.6%
“very good,” 34.9% “good”) at 7.4±5.3 months of follow up [20]. Bobowicz et al. showed that “excellent,” “very good” and “good” scores were achieved in 77.5% of patients, at the mean 22 months of follow up. In their study, females achieved significantly better result than males [30]. D’Hondt et al. also presented “good” to
“excellent” score in 90,4% of responders at significantly longer time of observation with median of 49 months [27]. On the other hand, “fair” results were observed in 3.9-15.3% of patients in all studies, and failures va-ried between 0-13% [20, 30-31].
Moorehead-Ardelt quality of life questionnaire (MAII)
Moorehead-Ardelt quality of life questionnaire (MAII) was used in 2 studies [22, 29], once together with the SF-36 [29]. Charalampakis et al. showed significant improvement in QoL after LSG that was observed at all postoperative time points, despite the decline between the 2nd and the 5th year of follow-up. The MAII sco-re increased from - 0.38 ± 1.3 preoperatively to 1.77 ± 0.8 (6 months), 2.08 ± 0.8 (12 months), 2.12 ± 0.7 (24 months) and 1.67 ± 1.1 at 60 months postoperatively. In final, there were only four patients classified with
“poor” outcome and no patients in “very poor” group in MAII score at 5 years after operation. This study also showed that QoL improvement is higher in females [22]. Hosseini et al. showed that after median 14.5 months of follow up the median MAII score was 6.48 ± 0.45. Thus, the “good” to “excellent” scores were observed in 90% of patients but there was no statistically significant dif-ference in comparison to control group [29].
Impact of Weight on Quality of Life – Lite (IWQOL)
Impact of Weight on Quality of Life – Lite (IWQOL) questionnaire in connection with SF-36 form was used
by Fezzi et al. in their study with 12-month follow-up of 77 patients [23]. The scores of five areas of IWQOL-Lite showed an improvement of the quality of life connec-ted to the loss of weight for all the dimensions: phy-sical function, self-esteem, sexual life, public distress, and work. Their key finding is a significant change for every dimension of QoL, but there was no statistical-ly significant correlation between the QoL and weight loss in 1-year follow-up. Researchers commented that the self-esteem was the only aspect of QoL that impro-ved and was directly related to the %EWL [23].
The Gastrointestinal Quality of Life Index (GIQLI)
The Gastrointestinal Quality of Life Index (GIQLI) questionnaire was used by Gallart-Aragon et al. for evaluation of QoL before and 6 months after the ope-ration. Authors showed significant improvements in all, except one aspect (emotional condition) of the GIQLI and total GIQLI score after half a year [24].
Short Form Health Survey (SF-8)
Short Form Health Survey (SF-8) was used by Fi-gura et al. to assess and compare QoL in two groups of patients before and after LSG with outcomes of pa-tients undergoing conservative treatment (i.e. dietary advice, physical exercise etc.). LSG patients’ results, within-group comparisons, showed a significant incre-ase in physical health, whereas mental health did not change significantly. For perceived physical health or mental health statistically significant post interventio-nal group differences could not be identified. Impor-tant information is that four LSG patients failed to fill out the SF-8 questionnaire and were excluded from the analysis – there is no information about the sex of excluded patients [19].
Discussion
The LSG became a stand-alone procedure just in 2004. We aimed to find studies that have adequate follow-up time and did not include patients from the surgeons’ “learning-curve” years. Therefore we focu-sed on studies conducted in 2008-2018, when baria-tric teams mastered the LSG technique.
QoL in bariatric surgery has been broadly inve-stigated, nevertheless we couldn’t find any review focusing directly on QoL changes following LSG [8-9, 32]. In the context of the epidemiological forecasts for obesity and the increasing implementation of LSG worldwide, it seems reasonable to intensify the research efforts on obesity treatment outcomes [5,

58 Eur J Transl Clin Med 2019;2(2):52-60
33-34]. The positive influence of bariatric surgery on obesity-related comorbidities is well known and QoL is an undisputable part of bariatric outcomes [35-37]. Evaluation of quality of life appears to be a very impor-tant parameter both for patients and surgeons. The same conclusion was made in review by Rausa et al, which compared quality of life after LSG and LRYGB [9]. The authors stated that there was no difference in QoL regardless which of the two surgical approaches was used. It leads to conclusion that patient’s and surge-on’s preference may play an important role in choice of surgical procedure [9].
Based on our literature review, we can state that almost all studies showed improvement in HRQOL after LSG in 6-80 months follow-up in adult population (Tab.1). It is easy to observe, mainly in studies using BAROS score, 77-96% of patients achieving “good” to
“excellent” outcomes with improvement in the Mo-orehead–Ardelt QoL Questionnaire assessing such factors as self-esteem, physical activity, social engage-ment, ability to work, and sexual life. Sleeve gastrec-tomy shows promising results not only in pathological obesity but also class I obesity resulting in early we-ight loss and significant QoL improvement [38]. Some studies show that female patients achieve better QoL than male patients after bariatric surgery [22, 30]. LSG improves women’s sexual function according to study by Akan et al., and reduces urinary dysfunction among males [21].
The benefit of LSG in terms of HRQOL improve-ment was also proven in older patients > 55 years of age, which interestingly was even higher than in youn-ger groups [39-40]. Both studies also showed safety of this procedure in older patients. Similar outcomes such as resolution of co-morbidities and improvement in QoL were observed independently by Boza et al. in adolescents [41].
On the contrary, some studies demonstrated no si-gnificant difference in some aspects of QoL after LSG [19, 23, 25, 29]. What is even more interesting, Flølo et al. showed that despite the significantly better HRQOL after LSG compared to the baseline cohort, the study population did not reach population norms [28]. In our opinion, this is a serious limitation of all HRQOL research in obese patients. Most of the researchers concentrate on the improvement of QoL after surgery with no reference to healthy volunteers neither to the pre-operative situation. This might be a goal for fur-ther research in obesity management.
Obesity surgery has some additional limitations in-fluencing HRQOL such as worse food tolerance after LSG in up to 5% of patients in comparison to non-obe-se patients who had no surgery [27]. The very good
news is that most recent studies show satisfactory po-stoperative reflux control in the majority of patients and low rates of de novo GERD after laparoscopic sleeve gastrectomy [37]. Currently there are several modern methods for data collection, follow-up and communication between surgeons and patients such as text messages or social media which could be con-sidered in the holistic approach towards patients with obesity and present-day surgery [20, 42].
Major limitations of our study are: heterogeneity of all the reviewed studies, different designs and different QoL tools applied (six different HRQOL questionnaires) that bring in many sources of bias and make the results difficult to compare. Exclusion and inclusion of patients undergoing different bariatric procedures, lack of pre-
-operative assessment and non-uniform statistical re-porting resulted in mainly descriptive and not quan-titative analysis. Other limitations are small groups of patients included and different methodology used for quality of life data collection. Moreover, in some stu-dies, there was limited or lacking information on pa-tients’ characteristics such as age, gender, BMI etc.
Conclusions
Despite all the limitations of the reviewed studies and different HRQOL tools used, almost all of the re-viewed studies showed improvement in QoL following sleeve gastrectomy. It is difficult to assess which QoL tool is the most appropriate bariatric surgery patients. None of the tools assessed is perfect, but when used properly they can provide important information abo-ut postoperative course. Such information can then be used to adequately prepare for surgery and choose the best operative technique. Further research abo-ut this subject is needed, particularly controlled and long-term studies, with unified data collection and sta-tistical analysis. In our opinion, quality of life after la-paroscopic sleeve gastrectomy should be checked ro-utinely during follow-up visits, same as BMI or %EWL.
Funding
There was no external funding for conducting this study.
Conflict of interest
The authors declare no conflicts of interest regar-ding the publishing of this article.

59Quality of life after laparoscopic sleeve gastrectomy...
1. Blüher M. Obesity: global epidemiology and pathogenesis. Nat Rev Endocrinol [Internet]. 2019;15(5):288–98. Available from: http://www.nature.com/articles/s41574-019-0176-8
2. Preedy VR, Watson RR, editors. Years of Life Lost Due to Mortality BT - Handbook of Disease Burdens and Quality of Life Meas-ures. In New York, NY: Springer New York; 2010. p. 4355–6. Available from: https://doi.org/10.1007/978-0-387-78665-0_6946
3. Chooi YC, Ding C, Magkos F. The epidemiology of obesity. Metabolism [Internet]. 2019;92:6–10. Available from: https://linkinghub.elsevier.com/retrieve/pii/S002604951830194X
4. Cheng J, Gao J, Shuai X, Wang G, Tao K. The comprehensive summary of surgical versus non-surgical treatment for obe-sity: a systematic review and meta-analysis of randomized controlled trials. Oncotarget [Internet]. 2016;7(26). Available from: http://www.oncotarget.com/fulltext/9581
5. Angrisani L, Santonicola A, Iovino P, Vitiello A, Higa K, Himpens J, et al. IFSO Worldwide Survey 2016: Primary, Endo-luminal, and Revisional Procedures. Obes Surg [Internet]. 2018;28(12):3783–94. Available from: http://link.springer.com/10.1007/s11695-018-3450-2
6. Hess DS, Hess DW. Biliopancreatic Diversion with a Duodenal Switch. Obes Surg [Internet]. 1998;8(3):267–82. Available from: http://link.springer.com/10.1381/096089298765554476
7. Favretti F, Cadiere GB, Segato G, Busetto L, Loffredo A, Vertruyen M, et al. Bariatric Analysis and Reporting Outcome Sys-tem (BAROS) Applied to Laparoscopic Gastric Banding Patients. Obes Surg [Internet]. 1998;8(5):500–4. Available from: http://link.springer.com/10.1381/096089298765554052
8. Driscoll S, Gregory DM, Fardy JM, Twells LK. Long-term health-related quality of life in bariatric surgery patients: A systematic review and meta-analysis. Obesity [Internet]. 2016;24(1):60–70. Available from: http://doi.wiley.com/10.1002/oby.21322
9. Rausa E, Kelly ME, Galfrascoli E, Aiolfi A, Cavalcoli F, Turati L, et al. Quality of Life and Gastrointestinal Symptoms Fol-lowing Laparoscopic Roux-en-Y Gastric Bypass and Laparoscopic Sleeve Gastrectomy: a Systematic Review. Obes Surg [Internet]. 2019;29(4):1397–402. Available from: http://link.springer.com/10.1007/s11695-019-03737-3
10. Janik MR, Stanowski E, Paśnik K. Present status of bariatric surgery in Poland. Videosurgery Other Miniinvasive Tech [Internet]. 2016;1:22–5. Available from: http://www.termedia.pl/doi/10.5114/wiitm.2016.58742
11. Ware JE, Sherbourne CD. The MOS 36-ltem Short-Form Health Survey (SF-36). Med Care [Internet]. 1992;30(6):473–83. Available from: https://insights.ovid.com/crossref?an=00005650-199206000-00002
12. Lins L, Carvalho FM. SF-36 total score as a single measure of health-related quality of life: Scoping review. SAGE Open Med [Internet]. 2016;4:205031211667172. Available from: http://journals.sagepub.com/doi/10.1177/2050312116671725
13. Oria HE, Moorehead MK. Bariatric Analysis and Reporting Outcome System (BAROS). Obes Surg [Internet]. 1998;8(5):487–99. Available from: http://link.springer.com/10.1381/096089298765554043
14. Oria HE, Moorehead MK. Updated Bariatric Analysis and Reporting Outcome System (BAROS). Surg Obes Relat Dis [Inter-net]. 2009;5(1):60–6. Available from: https://linkinghub.elsevier.com/retrieve/pii/S1550728908007739
15. Moorehead MK, Ardelt-Gattinger E, Lechner H, Oria HE. The Validation of the Moorehead-Ardelt Quality of Life Question-naire II. Obes Surg [Internet]. 2003;13(5):684–92. Available from: http://link.springer.com/10.1381/096089203322509237
16. Kolotkin RL, Crosby RD. Psychometric evaluation of the impact of weight on quality of life-lite questionnaire (IWQOL-Lite) in a community sample. Qual Life Res [Internet]. 2002;11(2):157–71. Available from: https://doi.org/10.1023/A:1015081805439
17. Ware JE, Kosinski M, Dewey JE, Gandek B. How to score and interpret single-item health status measures: a manual for users of the SF-8 health survey. Lincoln, RI Qual Inc. 2001;15(10):5.
18. Eypasch E, Williams JI, Wood-Dauphinee S, Ure BM, Schmulling C, Neugebauer E, et al. Gastrointestinal Quality of Life Index: Development, validation and application of a new instrument. Br J Surg [Internet]. 1995;82(2):216–22. Available from: http://doi.wiley.com/10.1002/bjs.1800820229
19. Figura A, Rose M, Ordemann J, Klapp BF, Ahnis A. Improvement in self-reported eating-related psychopathology and physical health-related quality of life after laparoscopic sleeve gastrectomy: A pre-post analysis and comparison with conservatively treated patients with obesity. Eat Behav [Internet]. 2017;24:17–25. Available from: https://linkinghub.elsevier.com/retrieve/pii/S147101531630143X
20. Kirkil C, Aygen E, Korkmaz MF, Bozan MB. Quality of life after laparoscopic sleeve gastrectomy using BAROSsystem. ABCD Arq Bras Cir Dig (São Paulo) [Internet]. 2018;31(3). Available from: http://www.scielo.br/scielo.php?script=sci_arttex-t&pid=S0102-67202018000300302&lng=en&tlng=en
21. Akan S, Uruc F, Aydin MT, Verit A. The effect of sleeve gastrectomy technique on women’s sexual function: A prospective study. Rev Int Andrología [Internet]. 2018;16(4):167–73. Available from: https://linkinghub.elsevier.com/retrieve/pii/S1698031X18300207
22. Charalampakis V, Seretis C, Daskalakis M, Fokoloros C, Karim A, Melissas J. The effect of laparoscopic sleeve gastrectomy on quality of life: A prospective cohort study with 5-years follow-up. Surg Obes Relat Dis [Internet]. 2018;14(11):1652–8. Available from: https://linkinghub.elsevier.com/retrieve/pii/S1550728918303411
References

60 Eur J Transl Clin Med 2019;2(2):52-60
23. Fezzi M, Kolotkin RL, Nedelcu M, Jaussent A, Schaub R, Chauvet MA, et al. Improvement in Quality of Life After Laparo-scopic Sleeve Gastrectomy. Obes Surg [Internet]. 2011;21(8):1161–7. Available from: http://link.springer.com/10.1007/s11695-011-0361-x
24. Gallart-Aragón T, Fernández-Lao C, Galiano-Castillo N, Cantarero-Villanueva I, Lozano-Lozano M, Arroyo-Morales M. Im-provements in Health-Related Quality of Life and Pain: A Cohort Study in Obese Patients After Laparoscopic Sleeve Gastrectomy. J Laparoendosc Adv Surg Tech [Internet]. 2018;28(1):53–7. Available from: http://www.liebertpub.com/doi/10.1089/lap.2017.0415
25. Porta A, Aiolfi A, Musolino C, Antonini I, Zappa MA. Prospective Comparison and Quality of Life for Single-Incision and Conventional Laparoscopic Sleeve Gastrectomy in a Series of Morbidly Obese Patients. Obes Surg [Internet]. 2017;27(3):681–7. Available from: http://link.springer.com/10.1007/s11695-016-2338-2
26. Rebibo L, Verhaeghe P, Tasseel-Ponche S, Cosse C, Maréchal V, Dhahri A, et al. Does sleeve gastrectomy improve the gait parameters of obese patients? Surg Obes Relat Dis [Internet]. 2016;12(8):1474–81. Available from: https://linkinghub.elsevier.com/retrieve/pii/S1550728916300016
27. D’Hondt M, Vanneste S, Pottel H, Devriendt D, Van Rooy F, Vansteenkiste F. Laparoscopic sleeve gastrectomy as a sin-gle-stage procedure for the treatment of morbid obesity and the resulting quality of life, resolution of comorbidities, food tolerance, and 6-year weight loss. Surg Endosc [Internet]. 2011;25(8):2498–504. Available from: http://link.spring-er.com/10.1007/s00464-011-1572-x
28. Flølo TN, Andersen JR, Kolotkin RL, Aasprang A, Natvig GK, Hufthammer KO, et al. Five-Year Outcomes After Vertical Sleeve Gastrectomy for Severe Obesity: A Prospective Cohort Study. Obes Surg [Internet]. 2017;27(8):1944–51. Available from: http://link.springer.com/10.1007/s11695-017-2605-x
29. Hosseini SV, Al Hurry AMA, Khazraei H, Hadavi H. The Effect of Laparoscopic Sleeve Gastrectomy on Patients’ Quality of Life in Shiraz. J Minim Invasive Surg Sci [Internet]. 2018;7(1). Available from: http://minsurgery.com/en/articles/67611.html
30. Bobowicz M, Lehmann A, Orlowski M, Lech P, Michalik M. Preliminary Outcomes 1 Year after Laparoscopic Sleeve Gas-trectomy Based on Bariatric Analysis and Reporting Outcome System (BAROS). Obes Surg [Internet]. 2011;21(12):1843–8. Available from: http://link.springer.com/10.1007/s11695-011-0403-4
31. Sofianos C, Sofianos C. Outcomes of laparoscopic sleeve gastrectomy at a bariatric unit in South Africa. Ann Med Surg [Internet]. 2016;12:37–42. Available from: https://linkinghub.elsevier.com/retrieve/pii/S2049080116301510
32. Hachem A, Brennan L. Quality of Life Outcomes of Bariatric Surgery: A Systematic Review. Obes Surg [Internet]. 2016;26(2):395–409. Available from: http://link.springer.com/10.1007/s11695-015-1940-z
33. Pineda E, Sanchez-Romero LM, Brown M, Jaccard A, Jewell J, Galea G, et al. Forecasting Future Trends in Obesity across Europe: The Value of Improving Surveillance. Obes Facts [Internet]. 2018;11(5):360–71. Available from: https://www.karger.com/Article/FullText/492115
34. Finkelstein EA, Khavjou OA, Thompson H, Trogdon JG, Pan L, Sherry B, et al. Obesity and Severe Obesity Forecasts Through 2030. Am J Prev Med [Internet]. 2012;42(6):563–70. Available from: https://linkinghub.elsevier.com/retrieve/pii/S0749379712001468
35. Sjöström L, Lindroos A-K, Peltonen M, Torgerson J, Bouchard C, Carlsson B, et al. Lifestyle, Diabetes, and Cardiovascular Risk Factors 10 Years after Bariatric Surgery. N Engl J Med [Internet]. 2004;351(26):2683–93. Available from: https://doi.org/10.1056/NEJMoa035622
36. Fouse T, Brethauer S. Resolution of Comorbidities and Impact on Longevity Following Bariatric and Metabolic Sur-gery. Surg Clin North Am [Internet]. 2016;96(4):717–32. Available from: https://linkinghub.elsevier.com/retrieve/pii/S003961091630007X
37. Rebecchi F, Allaix ME, Patti MG, Schlottmann F, Morino M. Gastroesophageal reflux disease and morbid obesity: To sleeve or not to sleeve? World J Gastroenterol [Internet]. 2017;23(13):2269. Available from: http://www.wjgnet.com/1007-9327/full/v23/i13/2269.htm
38. Kakoulidis TP, Karringer Å, Gloaguen T, Arvidsson D. Initial results with sleeve gastrectomy for patients with class I obesity (BMI 30–35 kg/m2). Surg Obes Relat Dis [Internet]. 2009;5(4):425–8. Available from: https://linkinghub.elsevier.com/retrieve/pii/S1550728908007375
39. Keren D, Matter I, Rainis T. Sleeve Gastrectomy in Different Age Groups: a Comparative Study of 5-Year Outcomes. Obes Surg [Internet]. 2016;26(2):289–95. Available from: http://link.springer.com/10.1007/s11695-015-1735-2
40. Lainas P, Dammaro C, Gaillard M, Donatelli G, Tranchart H, Dagher I. Safety and short-term outcomes of laparoscopic sleeve gastrectomy for patients over 65 years old with severe obesity. Surg Obes Relat Dis [Internet]. 2018;14(7):952–9. Available from: https://linkinghub.elsevier.com/retrieve/pii/S1550728918301229
41. Boza C, Viscido G, Salinas J, Crovari F, Funke R, Perez G. Laparoscopic sleeve gastrectomy in obese adolescents: results in 51 patients. Surg Obes Relat Dis [Internet]. 2012;8(2):133–7. Available from: https://linkinghub.elsevier.com/retrieve/pii/S155072891200010X
42. Lauti M, Kularatna M, Pillai A, Hill AG, MacCormick AD. A Randomised Trial of Text Message Support for Reducing Weight Regain Following Sleeve Gastrectomy. Obes Surg [Internet]. 2018;28(8):2178–86. Available from: http://link.springer.com/10.1007/s11695-018-3176-1
REVIEW ARTICLE
The relationship between blood pressure variability and outcome in acute ischemic stroke
Abstract
Stroke is the second most common cause of mortality. Ischemic stroke is approximately 10 times more common than haemorrhagic stroke. The strongest risk factor for ischemic stroke is hypertension, thus reduction of blood pressure decreases the risk of ischemic stroke. However, the prognostic importance of blood pressure after is unclear. The problem is even more complex considering blood pressure variability (BPV), i.e. continuous chan-ges of blood pressure values. The aim of this review is to discuss the very short-term, short-term, mid-term, and long-term blood pressure variability in the context of clinical outcome in patients after acute ischemic stroke. Most of the studies have shown that increased BPV in ischemic stroke patients is associated with poorer pro-gnosis, however in some of them there was not association between BPV and outcome.
Keywords: outcome · ischemic stroke · blood pressure variability
EUROPEAN JOURNAL OF TRANSLATIONAL AND CLINICAL MEDICINE 2019;2(2):61-70
Citation
Kowalczyk K, Gąsecki D. The relationship between blood pressure variability and outcome in acute ischemic stroke. Eur J Transl Clin Med. 2019;2(2):61-70.DOI: 10.31373/ejtcm/115986
Kamil Kowalczyk , Dariusz Gąsecki
Department of Adult Neurology, Medical University of Gdańsk, Poland
Introduction
Worldwide, stroke is the second most common cause of death, after ischemic heart disease, and the second most common cause of reduced disability-ad-justed life-years [1-3]. In Poland in 2009-2013, an annu-
al hospital admission rate of ischemic stroke patients (standardized by age) is 127/100,000 for females and 193/100,000 for males [4]. Hypertension is the stron-gest risk factor for ischemic stroke. In the INTERSTRO-
Corresponding author:
Kamil Kowalczyk, Department of Adult Neurology, Medical University of Gdańsk, Poland
e-mail: [email protected]
No external funds.
Available online: www.ejtcm.gumed.edu.pl
Copyright ® Medical University of Gdańsk
This is Open Access article distributed under the terms of the Creative Commons Attribution-ShareAlike 4.0 International.

62 Eur J Transl Clin Med 2019;2(2):61-70
KE study, self-reported history of hypertension occu-rred in 31.5% of patients with acute ischemic stroke (AIS), while the incidence of hypertension defined as self-reported history of hypertension or blood pressu-re (BP) > 160/90 mm Hg was even higher (45.2%) [5]. No Polish nation-wide data on the hypertension in-cidence in ischemic stroke patients are available, ho-wever in the years 2013-2014 the pre-hospital inciden-ce of hypertension in Szczecin was 84.9% and 81.2% in Kraków {Formatting Citation}. Consequently, hyper-tension management reduces the incidence of stroke and therefore is recommended in primary prevention of ischemic stroke [8-10]. However, the prognostic si-gnificance of blood pressure in determining prognosis of stroke patients is unclear. The relationship between outcome and blood pressure often is U-shaped – both high and low early blood pressures may be associated with poorer outcome, yet the data results are incon-sistent [11-13].
Furthermore, the management of altered BP in AIS remains challenging. Recommendations included in the current guidelines on BP treatment in AIS pa-tients are not evidence-based [10, 15]. Present data suggest that lowering very high blood pressure in the early phase of AIS may be beneficial, but they need further confirmation. Data on raising blood pressure in the case of hypotension associated with focal cere-bral ischemia are also inconsistent. Thus, due to insuf-ficient data there is a continued concern about mana-gement of BP in patients with AIS [14]. Moreover, high blood pressure should be lowered for the purpose of secondary prevention after the acute phase of ische-mic stroke or transient ischemic attack [10, 15].
Despite all the controversies, the role of BP and its management in acute stroke seems to be meaningful [13, 16-18]. However, not only casual BP measure-ments affect the prognosis after AIS, but also BP pro-files may be an important factor. Evidence concerning their role in ischemic stroke is scarce.
There is a paucity of the available data on the co-urse of BP in ischemic stroke. In the vast majority of patients, during the acute phase of ischemic stroke blood pressure usually rises during the first hours and then declines over the time (a phenomenon known as acute hypertensive response, occurring in over 60% of such patients) [19-20]. Blood pressure upon admission is higher in patients with a history of hypertension [21]. Moreover, decrease in BP during the first 4 hours after admission is seen in patients with mild stroke and with subsequent favourable outcome [21]. On the contrary, no decline in BP is observed in patients with severe stroke and unfavourable outcome [21].
The variation in blood pressure over time is known as blood pressure variability (BPV) [22]. The role of BPV in ischemic stroke is poorly understood. BPV was fo-und to be higher in ischemic stroke patients receiving antihypertensives (without specifying the drug class) just before administration of thrombolytics [23]. More precisely, calcium-channel blockers decrease BPV and reduce the risk of stroke [24]. Longitudinal observa-tions of the general population in Japan showed that increased BPV was associated with higher stroke mor-tality [25]. The aim of this review is to discuss the role of BPV in prognosis after ischemic stroke. Other inte-resting factors that may influence ischemic stroke out-come are changes of blood pressure during the sleep/wake cycle, however the topic is beyond the scope of this review and requires further study.
Indices of blood pressure variability
Blood pressure changes substantially between be-ats (very short-term BPV); minutes, hours or from day to night (within 24 hours, short-term BPV); between different days (mid-term BPV) or between clinic visits (long-term BPV) [26-27]. Indices used for assessment of BPV are as follows: standard deviation (SD), coeffi-cient of variation (CV, defined as average SD divided by the mean BP and multiplied by 100), variation inde-pendent of mean (VIM, a transformation of SD which is not correlated with mean), average real variability (ARV, defined as the average of the absolute differen-ces between successive BP measurements), succes-sive variation (SV, defined as the square root of the average squared difference between consecutive BP measurements) [26, 28-30]. Novel approach includes more advanced methods, such as spectral analysis of the different frequency components [26, 31].
Patomechanism
There are several mechanisms having an impact on BPV; e.g., very short- and short-term BPV is caused by humoral, rheological, behavioural, and emotional factors; impact of reflex and central autonomic modu-lation or arterial elasticity; mid- and long-term BPV, by behavioural factors, arterial stiffness, as well as seaso-nal climatic change, or poor control of blood pressure in treated patients [26]. Detailed description of the BPV pathomechanism is beyond the scope of this re-view and may be found elsewhere [32-33].
of blood pressure variability

SV rise and SV drop (SVrisemax and SVdropmax) after quartering 0-to-24 h BP course. Severe haemorrhagic transformation (sHT) was defined as parenchymal ha-ematoma or symptomatic intracerebral haemorrhage (haemorrhagic transformation and an increase of 4 or more points in NIHSS score). Unfavourable outco-me was defined as 2-6 points in mRS at day 90. They found that SBP-SD and SBP-SV within 24 hours were positively associated with sHT. Within the first 6 ho-urs, only SBP-SV, SBP-SVrise, and SBP-SVrisemax were associated with sHT. Higher SBP-SV, SBP-SVrise, SBP-
-SVdrop, SBP-SVrisemax, and SBP-SVdropmax among all studies periods (0-24h, 0-6 h, 6-12 h, 12-18 h, 18-24 h) were significantly associated with unfavourable outcomes at day 90 with the exception of SBP-SV drop 0-6 (no relationship).
Endo et al assessed the clinical outcome in stroke patients receiving intravenous thrombolysis (0.6 mg/kg dose of rt-PA, recombinant tissue plasminogen ac-tivator) and early BPV [23]. In the study, 527 patients were enrolled. BP was measured before administra-tion of rt-PA and every 4 hours after completing the administration (in total, 8 measurements). Then SD, CV, and SV as the square root of the average diffe-rence in BP between each of the 8 successive measu-rements were calculated. Outcomes were as follows: intracerebral haemorrhage within the first 36 hours, modified Rankin Scale (mRS) score of 0 to 1, and de-ath at 3 months. Higher systolic BPV (SD, CV, SV) was associated with symptomatic intracerebral haemor-rhage and death.
In study by Manning et al, a post-hoc analysis of data from two randomized controlled trials (CHHIPS and COSSACS) was undertaken [37]. In COSSACS stu-dy, participants with stroke symptom onset < 48 hours were recruited, while in CHHIPS study, patients with symptom onset < 36 hours were enrolled. In both stu-dies, baseline (prior to randomization) BP was measu-red (2 sets of 3 BP measurements, 10 minutes apart). The following BPV measures were obtained: SD, CV, ARV, and VIM for SBP and DBP. In both studies, the pri-mary outcome was death or major disability (mRS > 3 at 2 weeks). Regarding COSSACS study, 706 patients were analysed. To assess the relationship between BPV and outcome, adjusted logistic regression was carried out. In the analysis, there was no statistically significant relationship between BPV and death and disability at 2 weeks. In terms of CHHIPS study, no as-sociation between short-term BPV and clinical outco-me was found.
Tomii et al. evaluated impact of changes of BP on stroke outcome after intravenous (i.v.) thrombolysis [38]. 125 stroke patients who received intravenous rt-
-PA within 3 hours of symptoms onset were enrolled.
Very short-term blood pressure variability
Dawson et al assessed beat-to-beat BPV in 92 acute stroke patients [34]. The subjects had Finapres non-invasive BP monitor fitted within 24 to 72 hours after symptom onset. SD of beat-to-beat recordings (SBP, DBP, pulse pressure and mean arterial pressure) was calculated. The patients were classified as dead/dependent or independent (mRS ≤ 2 points) on the ba-sis of assessment at 30 days after stroke. Patients with higher DBP and mean arterial pressure variability were of greater risk of poor outcome.
Short-term blood pressure variability
In a Spanish study, Delgado-Mederos et al asses-sed the impact of BPV on enlargement of diffusion-we-ighted imaging (DWI) ischemic lesion and clinical out-come [35]. 80 stroke patients with occlusion of middle cerebral artery, treated with intravenous tissue plasmi-nogen activator (tPA) were included into the study. All of them had DWI before and 36-48 hours after throm-bolysis. Repeated SBP and DBP measurement were recorded for 24 hours since admission. BP variability was defined as SD of all BP measurements. In non-re-canalized patients, SBP and DBP variability was higher than in recanalized patients. In the whole study popu-lation, higher SBP and DBP variability were associated with greater lesion growth on DWI. Interestingly, the correlation between BPV and DWI lesion expansion was higher in patients with persisting occlusion of the medial cerebral artery. In these cases, the correlation of SBP variability (but not of DBP variability) and lesion growth was still present after adjustment for baseline stroke severity, vascular risk factors, localisation of occlusion and the use of antihypertensives. Contrary to this, in patients who recanalized, DWI infarct size was not affected by BPV. Early clinical improvement (defined as a decrease of ≥ 4 points on the National Institutes of Health stroke scale [NIHSS] score at 24 hours after stroke onset) was correlated with lower BP variability. Moreover, higher SBP variability was asso-ciated with higher incidence of poor 3-month outco-me defined as a modified Rankin scale (mRS) score ≥ 3. The associations of BPV and clinical outcome (early clinical improvement and frequency of 3-month poor outcome) were more evident in the non-recanalized study subjects.
Liu et al studied the impact of systolic BPV on se-vere haemorrhagic transformation after intravenous thrombolysis [36]. They included 461 patients and me-asured the following BPV parameters: SD, SV, average squared difference between rise and drop successive measurements (SVrise and SVdrop), and maximum of
63The relationship between blood pressure variability and outcome ...

64 Eur J Transl Clin Med 2019;2(2):61-70
ted with independent functioning (mRS score ≤ 2) at day 90 (p < 0.001), and mortality at day 90 was more frequent in the high (> median) diastolic DBP-SD group (p = 0.04). The multivariate analysis for the 3-month outcome showed that high systolic BPV was associa-ted with poor outcome.
In a more recent retrospective study of 215 pa-tients de Havenon showed that increased SD, CV, and SV for SBP as well as increased SD and CV for DBP me-asured within 0-24 hours after admission due to AIS were associated with higher mRS assessed between 30 and 365 days [42]. Only patients with anterior circu-lation stroke were included in the study. The outcome was worse in the case of proximal artery occlusion and lower mean blood pressure.
In 2004, Castillo et al published their paper on the relationship between SBP, DBP, drop in BP and stro-ke outcome [43]. Their study included 304 patients with AIS admitted in < 24 hours after symptom onset. In all patients, BP on admission and on the first day was assessed. Reduction in SBP and DBP > 20 mm Hg between the first-day and admission measurements resulted in higher frequency of early neurological de-terioration defined as a decrease in the Canadian Stro-ke Scale (CCS) score ≥ 1point within the first 48 hours after admission, increased infarct volume and worse outcome (CCS ≤ 7 points at 3 months).
In a retrospective study of 2545 ischemic stroke pa-tients by Kang et al, the association of SBP-SD calcula-ted on days 1, 2, and 3 and early neurological deteriora-tion (END, increase of ≥ 2 points in NIHSS score) at days 1, 2, and 3 was checked [44]. It was shown that higher SBP-SD at day 2 was associated with END at day 2, and SBP-SD at day 3 was associated with END at day 3.
Buratti et al. evaluated 89 ischemic stroke patients with internal carotid artery occlusion [45]. They found that higher values of SD and CV for both SBP and DBP calculated within 48 hours after disease onset were si-gnificantly associated with poor outcome assessed at 3 months using the mRS score.
Sare et al. investigated the relationship between blood pressure variability and outcome in ischemic stroke patients admitted to hospital within 8 hours from symptoms onset who received placebo treat-ment instead of rt-PA [13]. Systolic and diastolic BPV was calculated as CV over 24 and 72 hours. At day 7, neurological impairment (NIHSS > 7); and at day 90, functional outcome (good, mRS ≤ 2; and poor, mRS > 2) were obtained. It was shown that (after adjustment for age, sex, time to inclusion, baseline NIHSS, hyper-tension in history, antihypertensive treatment within the first 7 days) increased systolic BPV was associated with poor 90-day functional outcome but not with ear-ly neurological impairment.
During the first 24 hours, BP parameters were measu-red (immediately after hospital admission as well as after starting rt-PA infusion: every 15 minutes during the first 2 hours, every 30 minutes from 2 to 6 hours, and every 1 hour from 6 to 24 hours). Then CV was obtained. The primary outcome was mRS < 3 points at 3 months, and the secondary outcome were as fol-lows: early neurological improvement (a reduction of at least 4 points from the baseline NIHSS score or a total NIHSS score of 0 or 1 at 24 hours after i.v. tPA) and intracerebral haemorrhage (found on CT within 36 hours after i.v. rt-PA). In the analysis, CV of SBP and pulse pressure were positively correlated with intra-cerebral haemorrhage.
In another Japanese study, Tomii et al. investigated the effect 24-hour blood pressure on recovery from AIS. They enrolled 104 ischemic stroke patients ad-mitted to hospital within 24 hours of symptom onset [39]. 24-hour ambulatory BP monitoring was started at 10:00 on the 2nd and 8th days of hospitalization. Sub-sequently, CV for SBP, DBP, and MBP was determined. The outcomes were independent activities of daily li-ving (mRS ≤ 2 points) and poor outcome (mRS ≥ 5 po-ints) at 3 months. In multivariate analysis, CV of pulse pressure on the second day was inversely associated with independent activities daily living.
Yong et al. investigated the relationship between BPV and functional outcome, mortality and haemor-rhagic complications in 793 patients after acute ische-mic stroke included in the ECASS-II study [40]. SV was used to represent BPV. 7-day haemorrhagic transfor-mation and 90-day favourable outcome (mRS score of 0 or 1 point) as well as all-cause mortality were the end points. The results suggest that higher SBP-SV was related to the greater risk of parenchymal haemorrha-ge (PH) in rtPA-treated group and inversely associated with 90-day favourable outcome in the entire study population. On the other hand, in the placebo-treated participants, there was an inverse association between high SBP-SV and 90-day favourable outcome.
Kellert et al observed 427 patients with acute stro-ke and investigated the effect of BPV on the develop-ment of intracerebral haemorrhage (ICH) after intrave-nous thrombolysis [41]. BPV was defined as SV and maximum SV for SBP and DBP. Patients were divided into high (> median) and low (≤ median) systolic and diastolic BPV. ICH was diagnosed on the basis of neuro-imaging studies, symptomatic ICH (sICH) was defined as detection of blood and NIHSS worsening by 4 or more points or leading to death. They found that there were no differences between non-ICH, ICH and sICH groups regarding BPV, however patients with high (> median) SBP-SD had increased risk of occurrence of sICH (p = 0.03). Moreover, lower SBP-SD was associa-
mic, haemorrhagic, or unknown type) was associated with higher SD of SBP in univariate logistic regression, but the relationship lost its statistical significance after adjustment for the aforementioned factors.
In another study by Kang et al, the effect of BPV in the subacute phase of ischemic stroke on the 3-month functional outcome was assessed [50]. 2271 partici-pants hospitalized within 48 hours of symptoms onset were enrolled into this retrospective observational study. The subacute stage was defined as the time period after 72 hours from ischemic stroke symptom onset to discharge or transfer to rehabilitation unit. SD and CV of systolic and diastolic blood pressure were obtained. Clinical outcome was assessed at 3 months using mRS. Poor outcome was defined as a 3-month mRS score of 2 to 6 if the baseline NIHSS score was ≤ 7 points, mRS score of 3 to 6 if the baseline NIHSS score was 8 to 14 points, and mRS score of 4 to 6 if the baseline NIHSS was ≥ 15 points. The analysis revealed that patients with poor outcome had a wider range of BP variability than those with good outcome.
A post-hoc analysis of data from ECASS-I study was performed by Yong et al [51]. The correlation between BPV and good functional recovery (mRS score of 0 or 1) at day 90 in ischemic stroke patients was assessed. BPV was defined as SV. Decreased diastolic SV be-tween 0 and 72 hours predicted favourable outcome. Besides, similar relationship was observed for systolic SV, but only in patients treated with rt-PA.
Fukuda et al assessed the relationship between the in-hospital day-by-day blood pressure variabili-ty during the acute and subacute stage of ischemic stroke and poor functional outcome at 3 months [52]. They included 2566 patients with acute ischemic stroke and measured BP daily as well as its variability (defined as SD, CV, and VIM). Then the authors evalu-ated 3-month functional outcome based on mRS. They showed that higher BPV during the subacute stage (but not during the acute) was associated with worse long-term functional outcome after ischemic stroke, independently of age, sex, body mass index, hyperten-sion, diabetes mellitus, dyslipidemia, atrial fibrillation, estimated glomerular filtration rate, ischemic stroke subtype (cardioembolic or non-cardioembolic), infarct area (anterior or posterior circulation), antihypertensi-ve agents administered during days 1-3, the baseline NIHSS score, thrombolytic therapy, and mean BP. Hi-gher SD, CV, and VIM of SBP were also associated with neurological deterioration (defined as an increase in the NIHSS ≥ 2 during hospitalization) after adjustment for confounding factors.
Tziomalos et al. assessed the relationship between BPV in the acute phase of ischemic stroke and the in-
-hospital outcome [53]. They evaluated SD and CV of
Mid-term blood pressure variability
Chung et al. evaluated the relationship between BPV and early neurological deterioration (END). In the study, patients with acute ischemic stroke hospitalized within 24 hours after symptoms onset were enrolled [46]. Finally, in the study period (over 3 years), 1161 patients were analysed. Blood pressure was measured for 72 hours of hospitalization. The following blood pressure variability parameters were calculated: stan-dard deviation (SD) and coefficient of variation (CV) for SBP and DBP. END was defined as an increase of at le-ast 2 points in the NIHSS score or increase of at least 1 point in the level of consciousness or motor items of the NIHSS, or the occurrence of new neurological deficits within the first 72 hours after admission to ho-spital. The study showed that all BPV parameters were higher in patients with END than in patients without END. Furthermore, SBP SD, SBP CV, DBP SD, and DBP CV were linearly associated with END, even after ad-justment for mean BP and potential clinical variables (among others, age, sex, history of stroke or transient ischemic attack, diabetes mellitus, atrial fibrillation, Trail of Org 10172 in Acute Stroke Treatment [TOAST] classification, and baseline NIHSS score).
Ko et al assessed relationship between BPV and haemorrhagic transformation (HT) in ischemic stroke patients [47]. The authors enrolled 792 patients hospi-talized within 24 hours after stroke onset whose initial gradient echo MRI showed no haemorrhagic transfor-mation. BP was measured during the first 72 hours and the following BPV parameters were obtained: SD and average squared difference between successive me-asurements (SV) for SBP and DBP. Presence of HT and microbleeds was evaluated on all brain images carried out within first 2 weeks after stroke. The analysis sho-wed that higher DBP SD and DBP-SV were associated with HT. The relationship remained significant for DBP-
-SD after adjustment for mean SBP, age, time from onset to admission to hospital, initial stroke severity, diabetes mellitus, stroke subtype, thrombolysis, initial glucose, and total cholesterol.
In the TAIST trial, the relationship between BPV de-fined as SD of SBP and early outcome (at day 10) was assessed [48-49]. In the study, 1479 patients with acu-te ischemic stroke were randomized. Death or neuro-logic deterioration (decrease of ≥ 5 points in the Scan-dinavian Stroke Scale [SSS] or decrease of > 2 points in consciousness part of the SSS) and neurologic de-terioration alone were associated with increased SBP variability in univariate analysis and after adjustment for baseline prognostic factors, time to treatment and treatment assignment (high-dose tinzaparin, medium-
-dose tinzaparin, and aspirin). Recurrent stroke (ische-
65The relationship between blood pressure variability and outcome ...

66 Eur J Transl Clin Med 2019;2(2):61-70
showed that higher SBP-CV was associated with higher incidence of all-cause and cardiovascular mortality. Furthermore, increased DBP-CV predicted the risk of cardiovascular mortality.
In another study, Lau et al assessed the relation-ship between visit-to-visit BPV and cardiovascular as well as all-cause mortality in patients with lacunar infarction [57]. 281 patients with lacunar infarction recruited within 14 days of presentation were follo-wed up for 78 ± 18 months, on average. During each outpatient clinic visit made every 3-4 months, BP was measured and then systolic and diastolic BPV indices (defined as SD and CV) were calculated. Clinical out-come included all-cause and cardiovascular mortality, recurrent stroke and acute coronary syndrome. The relationship between BPV and clinical characteristics was assessed. Patients with a systolic (but not diasto-lic) BPV of the third tertile were associated with higher risk of all-cause and cardiovascular mortality. The rela-tionship remained significant after adjustment for age, sex, mean systolic and diastolic BP, cardiovascular risk factors and cardiovascular-related comorbidities.
Meta-analyses
To our knowledge, only one meta-analysis for the influence of BPV in acute stroke on functional outcome exists was carried out to date [58]. Due to the hetero-geneity of observational studies, the analysis included only 7 reports with one study on primary intracerebral haemorrhage [23, 34, 37-39, 50, 59]. It is noteworthy that only variability of BP within the first 7 days follo-wing acute stroke was assessed. It was suggested that higher BPV in patients with ischemic stroke is associa-ted with worse functional outcome.
Summary
BPV was found to be a strong risk factor for stroke and other vascular events in high-risk patients, howe-ver little is known about the role of BPV after ischemic stroke [29]. Although some initial reports suggest their potential value in stroke prognosis, to date, few data on this issue are available and the existing results are inconsistent. Generally, the parameter which is most frequently reported as associated with prognosis after ischemic stroke is variability of SBP. In summary, it was shown that its higher values predict death, poor late outcome, haemorrhagic transformation, lesion growth assessed on MRI in case of occluded middle cerebral artery, neurologic deterioration or recurrent stroke [13, 23, 35-36, 38, 41-42, 44-48, 50-52, 54-55,
SBP and DBP in 608 patients during the first 2 days and the first 3 days after admission to the hospital. The out-come was in-hospital mortality and dependency rate (mRS score between 2 and 5). The authors found no association between BPV and the short-term outcome.
The relationship between BPV measured within 0-72 and 0-120 hours after admission and mRS was analyzed in the aforementioned study by de Havenon et al [42]. It was shown that higher SD, CV, and SV for SBP were predictors of poorer neurological outcome, while BPV for DBP was not significant.
In a prospective study by Wang et al, 873 patients with ischemic stroke were included in the analysis [54]. CV of SBP and CV of DBP calculated for the first 7 days of hospitalization were correlated with good neurolo-gical recovery (decrease in NIHSS score by ≥ 4 points from baseline or 0 point in NIHSS score), neurological deterioration (increase in NIHSS score by ≥ 1 point), poor functional outcome (2-5 points in mRS score) at 3 months as well as the risk of recurrent stroke, all-cau-se and cardiovascular mortality, and composite car-diovascular events (cardiovascular mortality, nonfatal stroke, and nonfatal myocardial infarction) within 12 months. They found that increased SBP-CV was signifi-cantly associated with less frequent good neurological recovery, neurological deterioration, poor functional outcome, higher risk of recurrent stroke and compo-site cardiovascular events. The same correlation was found for DBP-CV, except for association with poor functional outcome at 3 months (no correlation).
In another study, de Havenon et al. examined the relationship between SD, CV, and SV of SBP measured within 120 hours after admission in 110 patients with acute anterior circulation ischemic stroke with mRS score between 30 and 365 days [55]. Higher BPV was found to be associated with worse outcome, especially in patients with larger ischemic core volumes (defined as relative cerebral blood flow < 40% and absolute ar-terial tissue delay > 2 s) and larger hypoperfused vo-lumes (defined as relative mean transit time > 135%).
Long-term blood pressure variability
In a 2014 study, the significance of long-term BPV in patients with ischemic stroke of all subtypes without atrial fibrillation was analyzed [56]. 632 ischemic stro-ke patients recruited within 14 days of presentation were included in the analysis. The patients were follo-wed up (including BP measurement) every 3-4 months in an outpatient clinic (mean follow-up period was 76 ± 18 months). High BPV was defined as the fourth quarti-le of the study population. Outcome included all-cause and cardiovascular mortality, non-fatal recurrent stro-ke and nonfatal acute coronary syndrome. The analysis

studies is higher than in prospective studies [34-35, 38-39, 45, 52-54, 56-57].
As far as ischemic stroke subtype is concerned, in majority of the studies, this factor was not included in the analysis [10, 20, 31-32,34-37, 39, 43, 46, 48-49]. In several studies, BPV was found to be associated with the outcome after adjustment for, among others, stro-ke subtype [46-47, 50]. In one study, BPV was not asso-ciated with 3-month outcome independently of stroke subtype [38]. In few studies, only one stroke type was assessed: caused by middle cerebral artery occlusion [35] or internal carotid artery occlusion [45], lacunar [57], or anterior circulation ischemic stroke [55]. In one study, all types of stroke in patients without atrial fibrillation were included [56]. In one study, BPV was associated with long-term functional outcome inde-pendently of, inter alia, stroke subtype (cardioembolic vs. non-cardioembolic) or infarct area (anterior vs. po-sterior) [52]. In one study, it was shown that BPV did differ between stroke subtypes (anterior circulation, posterior circulation, or lacunar) and therefore they were not included in further analysis [34].
As demonstrated, studies of the relationship be-tween BPV and outcome in ischemic stroke patients are very heterogeneous; however, the role of BPV seems to be important. Although no clinical trials as-sessing the effectiveness of BPV reduction in ischemic stroke were carried out to date, it is essential to iden-tify subgroups of patients in whom its influence is hi-ghest and who might benefit from such therapies.
57]. Moreover, higher diastolic BPV was found to be associated with death, haemorrhage, poor short-term outcome and poor late outcome [23, 34-35, 42, 45-47, 50-52, 54]. Only several reports identified higher pulse pressure variability as being associated with haemor-rhagic transformation and poor outcome. In one stu-dy, it was reported that higher values of mean blood pressure variability were associated with poor late outcome [34, 38-39]. On the other hand, many studies showed no prognostic value of at least some of BPV indices [13, 37, 41-42, 48, 52-54, 56-57].
In a significant majority of studies, variability in-dices of both systolic and diastolic BP were included [10, 20, 30, 32, 36-37, 40-43, 45-49, 51-52], but in four studies [36, 40, 44-55] only SBP variability was consi-dered. One study group each evaluated the variability of SBP and PP; SBP, DBP, and PP; and SBP, DBP, and MBP [34, 38-39].
In most studies [10, 29-30,33-35, 39, 43, 46, 49, 52], only one BPV index of SBP and/or DBP was evalu-ated. In several studies, more than one BPV index was assessed (SD and CV in seven studies [36, 41, 45-46, 50, 53, 56]; SD, CV, and SV in three studies [23, 42, 55]; SD and SV in one study [47]; SD, CV, and VIM in one study [52]; and SD, CV, ARV, and VIM in one study [37]). In all of these studies, the importance of asses-sed indices was similar.
In general, majority of the studies regarding BPV are retrospective [10, 20, 31-32, 35-37, 39, 41-43, 45-46, 50], and the number of patients included in these
1. Lozano R, Naghavi M, Foreman K, Lim S, Shibuya K, Aboyans V, et al. Global and regional mortality from 235 causes of death for 20 age groups in 1990 and 2010: A systematic analysis for the Global Burden of Disease Study 2010. Lancet [Internet]. 2012;380(9859):2095–128. Available from: https://www.thelancet.com/journals/lancet/article/PIIS0140-6736(12)61728-0/fulltext
2. The 10 leading causes of death [Internet]. [cited 2019 Oct 21]. Available from: https://www.who.int/news-room/fact-sheets/detail/the-top-10-causes-of-death
3. Global Health Estimates 2014 Summary Tables: DALY BY CAUSE, AGE AND SEX, 2000-2012 [Internet]. [cited 2019 Oct 21]. Available from: https://www.who.int/healthinfo/global_burden_disease/GHE2016_DALY_WHOReg_2000_2016_.xls?ua=1
4. Chwojnicki K, Ryglewicz D, Wojtyniak B, Zagozdzon P, Czlonkowska A, Jedrzejczyk T, et al. Acute Ischemic stroke hospi-tal admissions, treatment, and outcomes in Poland in 2009-2013. Front Neurol [Internet]. 2018;9:1–9. Available from: https://www.frontiersin.org/articles/10.3389/fneur.2018.00134/full
5. O’Donnell MJ, Denis X, Liu L, Zhang H, Chin SL, Rao-Melacini P, et al. Risk factors for ischaemic and intracerebral haemor-rhagic stroke in 22 countries (the INTERSTROKE study): A case-control study. Lancet [Internet]. 2010;376(9735):112–23. Available from: https://www.thelancet.com/journals/lancet/article/PIIS0140-6736(10)60834-3/fulltext
6. Kotlȩga D, Gołąb-Janowska M, Meller A, Pawlukowska W, Nowacki P. Detection of stroke risk factors over the decade in the polish population of ischemic stroke patients. Adv Psychiatry Neurol [Internet]. 2019;28(2):83–7. Available from: https://www.termedia.pl/Wykrywalnosc-czynnikow-ryzyka-udaru-na-przestrzeni-dekady-w-polskiej-populacji-pacjen-tow-z-udarem-niedokrwiennym-mozgu,116,37026,1,0.html
References
67The relationship between blood pressure variability and outcome ...

68 Eur J Transl Clin Med 2019;2(2):61-70
7. Swarowska M, Burkot J, Janowska A, Klimkowicz-Mrowiec A, Pera J, Slowik A, et al. Improvement of survival in Polish stroke patients is related to reduced stroke severity and better control of risk factors: The Krakow Stroke Database. Arch Med Sci [Internet]. 2016;12(3):552–5. Available from: https://www.ncbi.nlm.nih.gov/pmc/articles/PMC4889689/pdf/AMS-12-27569.pdf
8. Zhang H, Thijs L, Staessen JA. Blood pressure lowering for primary and secondary prevention of stroke. Hypertension [In-ternet]. 2006;48(2):187–95. Available from: https://www.ahajournals.org/doi/10.1161/01.HYP.0000231939.40959.60
9. Aiyagari V, Gorelick PB. Management of blood pressure for acute and recurrent stroke. Stroke [Internet]. 2009;40(6):2251–6. Available from: https://www.ahajournals.org/doi/10.1161/STROKEAHA.108.531574
10. Ringleb PA, Bousser M, Ford G, Bath P, Brainin M, Caso V, et al. Guidelines for management of ischaemic stroke and tran-sient ischaemic attack 2008. Cerebrovasc Dis [Internet]. 2008;25(5):457–507. Available from: https://www.karger.com/Article/FullText/131083
11. Stead LG, Gilmore RM, Decker WW, Weaver AL, Brown RD. Initial emergency department blood pressure as predictor of survival af-ter acute ischemic stroke. Neurology [Internet]. 2005;65(8):1179–83. Available from: https://n.neurology.org/content/65/8/1179
12. Aslanyan S, Fazekas F, Weir CJ, Horner S, Lees KR. Effect of blood pressure during the acute period of ischemic stroke on stroke outcome: A tertiary analysis of the GAIN International Trial. Stroke [Internet]. 2003;34(10):2420–5. Available from: https://www.ahajournals.org/doi/10.1161/01.STR.0000091233.04524.0C
13. Sare GM, Ali M, Shuaib A, Bath PMW. Relationship between hyperacute blood pressure and outcome after ischemic stroke: data from the VISTA collaboration. Stroke [Internet]. 2009 Jun;40(6):2098–103. Available from: https://www.ahajournals.org/doi/10.1161/STROKEAHA.108.539155
14. Tikhonoff V, Zhang H, Richart T, Staessen J a. Blood pressure as a prognostic factor after acute stroke. Lancet Neurol [Internet]. 2009;8(10):938–48. Available from: https://www.thelancet.com/journals/laneur/article/PIIS1474-4422(09)70184-X/fulltext
15. Mancia G, Fagard R, Narkiewicz K, Redon J, Zanchetti A, Böhm M, et al. 2013 ESH/ESC guidelines for the management of arterial hypertension: The Task Force for the management of arterial hypertension of the European Society of Hyper-tension (ESH) and of the European Society of Cardiology (ESC). Eur Heart J [Internet]. 2013;34(28):2159–219. Available from: https://academic.oup.com/eurheartj/article/34/28/2159/451304
16. Rodríguez-García JL, Botia E, De La Sierra A, Villanueva MA, González-Spínola J. Significance of elevated blood pressure and its management on the short-term outcome of patients with acute ischemic stroke. Am J Hypertens [Internet]. 2005;18(3):379–84. Available from: https://academic.oup.com/ajh/article/18/3/379/160939
17. Ntaios G, Lambrou D, Michel P. Blood pressure changes in acute ischemic stroke and outcome with respect to stroke etiology. Neurology [Internet]. 2012;79:1440–8. Available from: https://n.neurology.org/content/79/14/1440
18. Okumura K, Ohya Y, Maehara A, Wakugami K, Iseki K, Takishita S. Effects of blood pressure levels on case fatality af-ter acute stroke. J Hypertens [Internet]. 2005 Jun;23(6):1217–23. Available from: https://insights.ovid.com/cross-ref?an=00004872-200506000-00017
19. Harper G, Castleden CM, Potter JF, G. H, C.M. C, J.F. P. Factors affecting changes in blood pressure after acute stroke. Stroke [Internet]. 1994;25(9):1726–9. Available from: https://www.ahajournals.org/doi/10.1161/01.STR.25.9.1726
20. Qureshi AI. Acute hypertensive response in patients with stroke pathophysiology and management. Circulation [Inter-net]. 2008;118(2):176–87. Available from: https://www.ahajournals.org/doi/10.1161/CIRCULATIONAHA.107.723874
21. Christensen H, Meden P, Overgaard K, Boysen G. The course of blood pressure in acute stroke is related to the severity of the neurological deficits. Acta Neurol Scand [Internet]. 2002;106(3):142–7. Available from: https://onlinelibrary.wiley.com/doi/full/10.1034/j.1600-0404.2002.01356.x
22. Rothwell PM. Limitations of the usual blood-pressure hypothesis and importance of variability, instability, and episodic hypertension. Lancet [Internet]. 2010;375(9718):938–48. Available from: https://www.thelancet.com/journals/lancet/article/PIIS0140-6736(10)60309-1/fulltext
23. Endo K, Kario K, Koga M, Nakagawara J, Shiokawa Y, Yamagami H, et al. Impact of early blood pressure variability on stroke outcomes after thrombolysis: The SAMURAI rt-PA registry. Stroke [Internet]. 2013;44(3):816–8. Available from: https://www.ahajournals.org/doi/10.1161/STROKEAHA.112.681007
24. Webb AJ, Fischer U, Mehta Z, Rothwell PM. Effects of antihypertensive-drug class on interindividual variation in blood pressure and risk of stroke: a systematic review and meta-analysis. Lancet [Internet]. 2010;375(9718):906–15. Available from: https://www.thelancet.com/journals/lancet/article/PIIS0140-6736(10)60235-8/fulltext
25. Kikuya M, Ohkubo T, Metoki H, Asayama K, Hara A, Obara T, et al. Day-by-day variability of blood pressure and heart rate at home as a novel predictor of prognosis: The Ohasama study. Hypertension [Internet]. 2008;52(6):1045–50. Available from: https://www.ahajournals.org/doi/10.1161/HYPERTENSIONAHA.107.104620
26. Parati G, Ochoa JE, Lombardi C, Bilo G. Assessment and management of blood-pressure variability. Nat Rev Cardiol [In-ternet]. 2013;10(3):143–55. Available from: http://www.ncbi.nlm.nih.gov/pubmed/23399972
27. Stergiou GS, Parati G, Vlachopoulos C, Achimastos A, Andreadis E, Asmar R, et al. Methodology and technology for periph-eral and central blood pressure and blood pressure variability measurement. J Hypertens [Internet]. 2016;34(9):1665–77. Available from: https://insights.ovid.com/crossref?an=00004872-201609000-00002
28. Stevens SL, Wood S, Koshiaris C, Law K, Glasziou P, Stevens RJ, et al. Blood pressure variability and cardiovascular dis-ease: systematic review and meta-analysis. BMJ [Internet]. 2016;354:i4098. Available from: https://www.bmj.com/con-tent/354/bmj.i4098
29. Rothwell PM, Howard SC, Dolan E, O’Brien E, Dobson JE, Dahlöf B, et al. Prognostic significance of visit-to-visit variability, maximum systolic blood pressure, and episodic hypertension. Lancet [Internet]. 2010;375(9718):895–905. Available from: https://www.thelancet.com/journals/lancet/article/PIIS0140-6736(10)60308-X/fulltext
30. Webb AJS, Fischer U, Rothwell PM. Effects of beta-blocker selectivity on blood pressure variability and stroke: A system-atic review. Neurology [Internet]. 2011;77(8):731–7. Available from: https://n.neurology.org/content/77/8/731
31. Parati G , Faini A VM. Blood pressure variabiliy: Its measurement and significance in hypertension. Curr Hypertens Rep [Internet]. 2006;8:199–204. Available from: https://www.nature.com/articles/nrcardio.2013.1
32. Parati G, Ochoa JE, Salvi P, Lombardi C, Bilo G. Prognostic value of blood pressure variability and average blood pressure levels in patients with hypertension and diabetes. Diabetes Care [Internet]. 2013;36(SUPPL.2):S3212–324. Available from: https://care.diabetesjournals.org/content/diacare/36/Supplement_2/S312.full.pdf
33. Chadachan VM, Ye MT, Tay JC, Subramaniam K, Setia S. Understanding short-term blood-pressure-variability phenotypes: From concept to clinical practice. Int J Gen Med [Internet]. 2018;11:241–54. Available from: https://www.dovepress.com/understanding-short-term-blood-pressure-variability-phenotypes-from-co-peer-reviewed-fulltext-article-IJGM
34. Dawson SL, Manktelow BN, Robinson TG, Panerai RB, Potter JF. Which parameters of beat-to-beat blood pressure and variability best predict early outcome after acute ischemic stroke? Stroke. 2000;31(2):463–8.
35. Delgado-Mederos R, Ribo M, Rovira A, Rubiera M, Manuera J, Santamarina E, et al. Prognostic significance of blood pressure variability after thrombolysis in acute stroke. Neurology [Internet]. 2008;71(8):552–8. Available from: https://n.neurology.org/content/71/8/552
36. Liu K, Yan S, Zhang S, Guo Y, Lou M. Systolic blood pressure variability is associated with severe hemorrhagic transfor-mation in the early stage after thrombolysis. Transl Stroke Res [Internet]. 2016;7(3):186–91. Available from: https://link.springer.com/article/10.1007%2Fs12975-016-0458-6
37. Manning LS, Mistri AK, Potter J, Rothwell PM, Robinson TG. Short-Term Blood Pressure Variability in Acute Stroke: Post hoc analysis of the controlling hypertension and hypotension immediately post stroke and continue or stop post-stroke antihypertensives collaborative study trials. Stroke [Internet]. 2015;46(6):1518–24. Available from: https://www.aha-journals.org/doi/10.1161/STROKEAHA.115.009078
38. Tomii Y, Toyoda K, Nakashima T, Nezu T, Koga M, Yokota C, et al. Effects of hyperacute blood pressure and heart rate on stroke outcomes after intravenous tissue plasminogen activator. J Hypertens [Internet]. 2011;29(10):1980–7. Available from: https://insights.ovid.com/crossref?an=00004872-201110000-00020
39. Tomii Y, Toyoda K, Suzuki R, Naganuma M, Fujinami J, Yokota C, et al. Effects of 24-hour blood pressure and heart rate recorded with ambulatory blood pressure monitoring on recovery from acute ischemic stroke. Stroke [Internet]. 2011;42(12):3511–7. Available from: https://www.ahajournals.org/doi/10.1161/STROKEAHA.111.628586
40. Yong M, Kaste M. Association of characteristics of blood pressure profiles and stroke outcomes in the ECASS-II trial. Stroke [Internet]. 2008 Mar;39(2):366–72. Available from: https://www.ahajournals.org/doi/10.1161/STROKEAHA.107.492330
41. Kellert L, Sykora M, Gumbinger C, Herrmann O, Ringleb P a. Blood pressure variability after intravenous thrombolysis in acute stroke does not predict intracerebral hemorrhage but poor outcome. Cerebrovasc Dis [Internet]. 2012;33(2):135–40. Available from: https://www.karger.com/Article/FullText/334186
42. de Havenon A, Bennett A, Stoddard GJ, Smith G, Wang H, Wold J, et al. Increased blood pressure variability is associated with worse neurologic outcome in acute anterior circulation ischemic stroke. Stroke Res Treat [Internet]. 2016;2016:1–8. Available from: https://www.hindawi.com/journals/srt/2016/7670161/
43. Castillo J, Leira R, García MM, Serena J, Blanco M, Dávalos A. Blood pressure decrease during the acute phase of ischem-ic stroke is associated with brain injury and poor stroke outcome. Stroke [Internet]. 2004;35(2):520–6. Available from: https://www.ahajournals.org/doi/10.1161/01.STR.0000109769.22917.B0
44. Kang J, Hong J-H, Jang MU, Choi NC, Lee JS, Kim BJ, et al. Change in blood pressure variability in patients with acute ischemic stroke and its effect on early neurologic outcome. PLoS One [Internet]. 2017;12(12):e0189216. Available from: http://dx.plos.org/10.1371/journal.pone.0189216
45. Buratti L, Cagnetti C, Balucani C, Viticchi G, Falsetti L, Luzzi S, et al. Blood pressure variability and stroke outcome in pa-tients with internal carotid artery occlusion. J Neurol Sci [Internet]. 2014;339(1–2):164–8. Available from: https://www.jns-journal.com/article/S0022-510X(14)00093-8/fulltext
69The relationship between blood pressure variability and outcome ...
46. Chung J-W, Kim N, Kang J, Park SH, Kim W-J, Ko Y, et al. Blood pressure variability and the development of early neurologi-cal deterioration following acute ischemic stroke. J Hypertens [Internet]. 2015;33(10):2099–106. Available from: https://insights.ovid.com/article/00004872-201510000-00020
47. Ko Y, Park JH, Yang MH, Ko SB, Han MK, Oh CW, et al. The significance of blood pressure variability for the development of hemorrhagic transformation in acute ischemic stroke. Stroke [Internet]. 2010;41(11):2512–8. Available from: https://www.ahajournals.org/doi/10.1161/STROKEAHA.110.595561
48. Geeganage C, Tracy M, England T, Sare G, Moulin T, Woimant F, et al. Relationship between baseline blood pressure parameters (including mean pressure, pulse pressure, and variability) and early outcome after stroke: Data from the tinzaparin in acute ischaemic stroke trial (TAIST). Stroke [Internet]. 2011;42(2):491–3. Available from: https://www.aha-journals.org/doi/10.1161/STROKEAHA.110.596163
49. Bath PMW, Lindenstrom E, Boysen G, De Deyn P, Friis P, Leys D, et al. The Tinzaparin in Acute Ischaemic Stroke Trial stroke (TAIST): a randomised aspirin-controlled trial. Hypertension [Internet]. 2001;358:702–10. Available from: https://www.thelancet.com/journals/lancet/article/PIIS0140-6736(01)05837-8/fulltext
50. Kang J, Ko Y, Park JH, Kim WJ, Jang MS, Yang MH, et al. Effect of blood pressure on 3-month functional outcome in the subacute stage of ischemic stroke. Neurology [Internet]. 2012;79(20):2018–24. Available from: https://n.neurology.org/content/79/20/2018
51. Yong M, Diener H-C, Kaste M, Mau J. Characteristics of blood pressure profiles as predictors of long-term outcome after acute ischemic stroke. Stroke [Internet]. 2005;36(12):2619–25. Available from: https://www.ahajournals.org/doi/10.1161/01.STR.0000189998.74892.24
52. Fukuda K, Kai H, Kamouchi M, Hata J, Ago T, Nakane H, et al. Day-by-Day Blood Pressure Variability and Functional Out-come After Acute Ischemic Stroke: Fukuoka Stroke Registry. Stroke [Internet]. 2015;1832–9. Available from: https://www.ahajournals.org/doi/10.1161/STROKEAHA.115.009076
53. Tziomalos K, Giampatzis V, Bouziana SD, Spanou M, Kostaki S, Papadopoulou M, et al. No association observed between blood pressure variability during the acute phase of ischemic stroke and in-hospital outcomes. Am J Hypertens [Internet]. 2015;29(7):841–846. Available from: http://ajh.oxfordjournals.org/lookup/doi/10.1093/ajh/hpv191
54. Wang Y, Meng P, Liu N, Ji N, Zhang G, Xu B, et al. Mid-term blood pressure variability Is associated with clinical outcome after ischemic stroke. Am J Hypertens [Internet]. 2017;301(10):968–77. Available from: https://academic.oup.com/ajh/article/30/10/968/3867193
55. de Havenon A, Bennett A, Stoddard GJ, Smith G, Chung L, O’Donnell S, et al. Determinants of the impact of blood pressure variability on neurological outcome after acute ischaemic stroke. Stroke Vasc Neurol [Internet]. 2017;2(1):1–6. Available from: http://svn.bmj.com/cgi/doi/10.1136/svn-2016-000057
56. Lau K-K, Wong Y-K, Teo K-C, Chang RSK, Chan K-H, Hon SFK, et al. Long-term prognostic implications of visit-to-visit blood pressure variability in patients with ischemic stroke. Am J Hypertens [Internet]. 2014;27(12):1486–94. Available from: https://academic.oup.com/ajh/article/27/12/1486/2743148
57. Lau KK, Wong YK, Chang RSK, Teo KC, Hon SFK, Chan KH, et al. Visit-to-visit systolic blood pressure variability predicts all-cause and cardiovascular mortality after lacunar infarct. Eur J Neurol [Internet]. 2014;21(2):319–25. Available from: https://onlinelibrary.wiley.com/doi/full/10.1111/ene.12310
58. Manning LS, Rothwell PM, Potter JF, Robinson TG. Prognostic significance of short-term blood pressure variability in acute stroke. Stroke [Internet]. 2015;46(9):2482–90. Available from: http://stroke.ahajournals.org/lookup/doi/10.1161/STROKEAHA.115.010075
59. Manning L, Hirakawa Y, Arima H, Wang X, Chalmers J, Wang J, et al. Blood pressure variability and outcome after acute intracerebral haemorrhage: a post-hoc analysis of INTERACT2, a randomised controlled trial. Lancet Neurol [Inter-net]. 2014 Apr [cited 2015 Dec 19];13(4):364–73. Available from: https://www.thelancet.com/journals/laneur/article/PIIS1474-4422(14)70018-3/fulltext
70 Eur J Transl Clin Med 2019;2(2):61-70

REVIEW ARTICLE
Acute cholecystitis in patients with diabetes mellitus – systematic review
Abstract
Introduction: According to the WHO, an estimated 422 million people are suffering from diabetes worldwide. Among them, the incidence of cholelithiasis is higher than in the healthy population. The aim of this literature re-view was to summarize the available evidence about acute cholecystitis in patients with diabetes. Materials and methods: This study adhered to the PRISMA guidelines. The course of hospitalization of patients with and witho-ut diabetes who underwent cholecystectomy due to acute cholecystitis was compared.Following information was abstracted from original studies: general study information, patient characteristics, complications, and recom-mendations for patients with diabetes. Results: Initial search provided 1632 results. After full text assessment, 40 studies met the inclusions criteria. Operative and postoperative complication rates were significantly higher among the diabetic patients. Diabetes is a risk factor for conversion from laparoscopic to open cholecystectomy method. The authors' opinions on elective surgery before the onset of acute cholecystitis symptoms are divided. Conclusions: Diabetic patients are at greater risk of developing complications. An individualized screening and treatment approach, as well as proper preparation of the diabetic patient for an elective cholecystectomy could have a positive effect on the outcome. However, the low quality of the data from the systematic review does not allow for meta-analysis, which is why we cannot draw strong conclusions.
Keywords: diabetes and metabolism · general surgery
EUROPEAN JOURNAL OF TRANSLATIONAL AND CLINICAL MEDICINE 2019;2(2):71-79
Citation
Łącka M, Spychalski P, Dobrzycka M, Rostkowska O, Kobiela J. Acute cholecystitis in patients with diabetes melli-tus – systematic review. Eur J Transl Clin Med. 2019;2(2):71-79.DOI: 10.31373/ejtcm/115402
Corresponding author:
Monika Łącka, Department of General, Endocrine and Transplant Surgery of University Clinical Center in Gdańsk, Poland
e-mail: [email protected]
No external funds.
Available online: www.ejtcm.gumed.edu.pl
Copyright ® Medical University of Gdańsk
Monika Łącka , Piotr Spychalski , Małgorzata Dobrzycka ,
Olga Rostkowska , Jarosław Kobiela
Department of General, Endocrine and Transplant Surgery of University Clinical Center in Gdańsk, Poland
This is Open Access article distributed under the terms of the Creative Commons Attribution-ShareAlike 4.0 International.

72 Eur J Transl Clin Med 2019;2(2):71-79
Introduction
According to the latest World Health Organization data, an estimated 422 million people suffer from diabetes worldwide. The incidence of diabetes is in-creasing rapidly and it is estimated that the number of people with diabetes will double by 2030. Approxi-mately 104 million new cases of gallbladder and bile duct pathologies are reported annually. Among people suffering from diabetes, the incidence of cholelithiasis is higher than in the healthy population and diabetes increases the risk of developing acute cholecystitis [1-5]. In this group of patients, complications of acute cholecystitis such as gangrenous cholecystitis, bacte-riobilia, perforation and emphysematous cholecystitis are more frequent [3-5]. Therefore, acute cholecystitis seems to be a serious problem in diabetic population [6]. However, not many studies were published in the last 30 years on this matter. Moreover, it was reported that cholecystectomy in people with diabetes is rela-ted to a significantly higher number of intraoperative complications and almost 3 times higher number of postoperative complications [7]. Once again, the lite-rature about these specific issues is limited.
The aim of this study was to systematically review the available evidence regarding acute cholecystitis in patients suffering from diabetes.
Materials and methods
This study adhered to the Preferred Reporting Items for Systematic Reviews and Meta-Analysis (PRIMSA) guidelines. We performed a systematic se-arch of the PubMed and Web of Science databases to identify studies on acute cholecystitis in patients with diabetes mellitus published before September 1st 2019. Following search query was used: “(cholecysti-tis OR cholecystectomy) AND (diabetes OR diabetic) Articles written in languages other than English were excluded. Abstracts, case reports, conference papers, letters, and editorials were excluded during the initial screening of titles and citations. Duplicated results were removed using Mendeley Software. Only full text papers describing the course of hospitalization in patients with diabetes who underwent cholecystecto-my due to acute cholecystitis were included in the re-view (see Figure 1). In the next step we compared the course of hospitalization of patients with and witho-ut diabetes who underwent cholecystectomy due to acute cholecystitis.
All steps of the literature search were performed by two independent researchers. Decisions regarding final inclusion were resolved by a consensus.
PRISMA 2009 Flow Diagram
Ide
nti
fica
tio
n Records identified through
database searching(n = 1632 )
Records after duplicates removed
(n = 956)
Scr
ee
nin
g
Records screened(n = 348)
Eli
gib
ilit
y
Full-text articles assessed
for eligibility(n = 224)
Studies included in qualitative synthesis
(n = 121)
Incl
ud
ed
Studies included in quantitative synthesis
(n = 40)
Records excluded(n = 124)
Full-text articles
excluded, with reasons
(n = 103)
Figure 1. Flowchart illustrating the literature search
From: Moher D, Liberati A, Tetzlaff J, Altman DG, The PRISMA Group (2009). Preferred Repor-
ting Items for Systematic Reviews and Meta-Analyses: The PRISMA Statement. PLoS Med 6(7):
e1000097. doi:10.1371/journal.pmed1000097
For more information, visit www.prisma-statement.org.

The following data was extracted from the original studies:
1. general study information: authors, publication year, country, institution,2. demographics: number of patients, sex, age,3. complications: septic shock, pneumonia, renal insufficiency, cardiovascular complications, (surgical site infection) SSI, wound dehiscence, infectious complications, conversion, preoperative perforation, bleeding, bile leakage, gangrenous cholecystitis, cholelithiasis, perioperative complications, postoperative complications, longer time of operation, anesthesia and total hospitalization time 4. recommendations for patients with diabetes: screening for gallstones, routine cholecystectomy before acute cholecystitis.
Results
The initial search identified 1632 articles. After excluding articles that do not match the criteria de-scribed above, 221 articles were included in the abs-tract review. Finally, 121 abstracts were selected for full text appraisal of which 40 met all the inclusion criteria and were included in this review. This sys-tematic review included 40 articles including over 1300000 patients. 8 articles did not contain infor-mation on the number of patients enrolled in the study. In only 10 articles the patients were grouped by sex. The age of patients enrolled in the study was given in 9 of 40 articles. 22 papers out of 40 were published before 2010, 11 of which contain data from before 2000. In effect, 25% of the analyzed li-terature contains data collected more than 20 years ago (see Table 1).
Table 1. Reviewed articles key data
Authors Number of patients
Men %
Risk factor of AC
Mortality
Infectious complications
during hospitalization
SSI
Conver-sion LC to open surgery
Postope-rative
complica-tions
Cho JY et al. 2009 [4]
1059 46.36YES, AOR
95% CI 1.802 (1.153-2.816)
Bodmer M et al.
2011 [24]22574 24.3
AOR for developing gallstone disease
followed by cholecystec-tomy of 0.88,
95% CI 78-1.00, p = 0.05)
that diabetes mellitus is not
an independent risk factor for
cholecystectomy.
De Santis A et al. 1999
[11]336 39.29
YES 11,6% vs. 4,8%
respectively OR, 2.55; 95% CI, 1,39-4,67
73Acute cholecystitis in patients with diabetes mellitus...

74 Eur J Transl Clin Med 2019;2(2):71-79
Karamanos E et al.
2013 [5]5460 55.4 YES, NR
YES (AOR) (95% CI): 1.79
(1.09, 2.94), adjusted
p = 0.022]
5.6 vs. 1.6%; AOR [95% CI]:
1.85 [1.53, 2.23]
On insulin vs. non-diabetics:
4.2 vs 1.6%;
AOR [95% CI]: 1.80
[1.39, 2.34]
Miguel-Yanes JM et al.
2016 [12]611 533
YES, p < 0.001
After open cholecystectomy
[OR = 0.82 (0.78-0.87)], but a higher IHM after
laparoscopic cholecystectomy
[OR = 1.18 (1.03-1.35)].
Turrill FL et al. 1961 [36]
481 YES, NR YES, NR YES, NR
Liu C-M et al. 2015 [22] 108850
YES, MALE p < 0.001
53,1 + D1:D31
Bedirli A et al. 2001 [27] 862 YES, NR
YES, p = 0,012
YES, 0,0061
Terho PM et al. 2016 [9]
373
YES, OR 2.0
(1.2-3.6) p = 0.014
Cucchiaro G et al. 1989
[14]YES, NR YES, p = 0.002
Lyass S et al. 2000 [15] 601 26.29 YES, NR YES, NR NO, NR
YES, p = 0.055
Jaafar G et al.
2017 [37]94557
YES, complicated diabetes p < 0.001
OR 3.177 CI 2.153–4.689, uncomplicated
diabetes p < 0.001
OR 2.943 CI 2.368–3.657
YES, complicated diabetes (OR
1.435, CI 1.205-1.708), uncomplicated diabetes (OR
1.391, CI 1.264-1.530)

Lee S et al. 2011 [16] 611
YES, p = 0,002 OR (95% CI)
1,960 (1,262-3,044)
Ransohoff DF et al. 1987
[17]311 51.12 YES, NR NO, p = 0,55 NO, NR
Pagliarulo M et al. 2004
[3]1337 53.1
NO, BMI, AGE, FAMILY, NR
de Siqueira Corradi MB et al. 2019
[18]
2520YES,
adjusted model 2.68 < 0.001
53,1 + D1:D31
Warren DK et al. 2017
[40]
Independent risk factors for SSI after
cholecystectomy. Adjusted HR (95%
CI) 1.53 (1.19–1.98)
Paajanen H et al. 2011
[19]
2548 YES, < 0.0001 YES, p < 0.01YES, NR
YES, p < 0.0001
YES, NR
Doran H et al. 2018
[20]
YES, NR YES, NRYES, NR YES, NR YES, NR
Ismat U et al. 2016 [42]
120
Presence of diabetes mellitus did not si-
gnificantly affect the onset of surgical site infection in patients undergoing laparo-
scopic cholecystecto-my; p = 0.07
Ibrahim S et al. 2006
[34]1000
NO, but diabetic patients who
had conversion had a signifi-cantly higher Hba1c (8.9%
+/- 0.6%; p < 0.038)
Philip Rothman J et al. 2016
[35]460995
None of the studies were eligible for
meta-analysis.
75Acute cholecystitis in patients with diabetes mellitus...
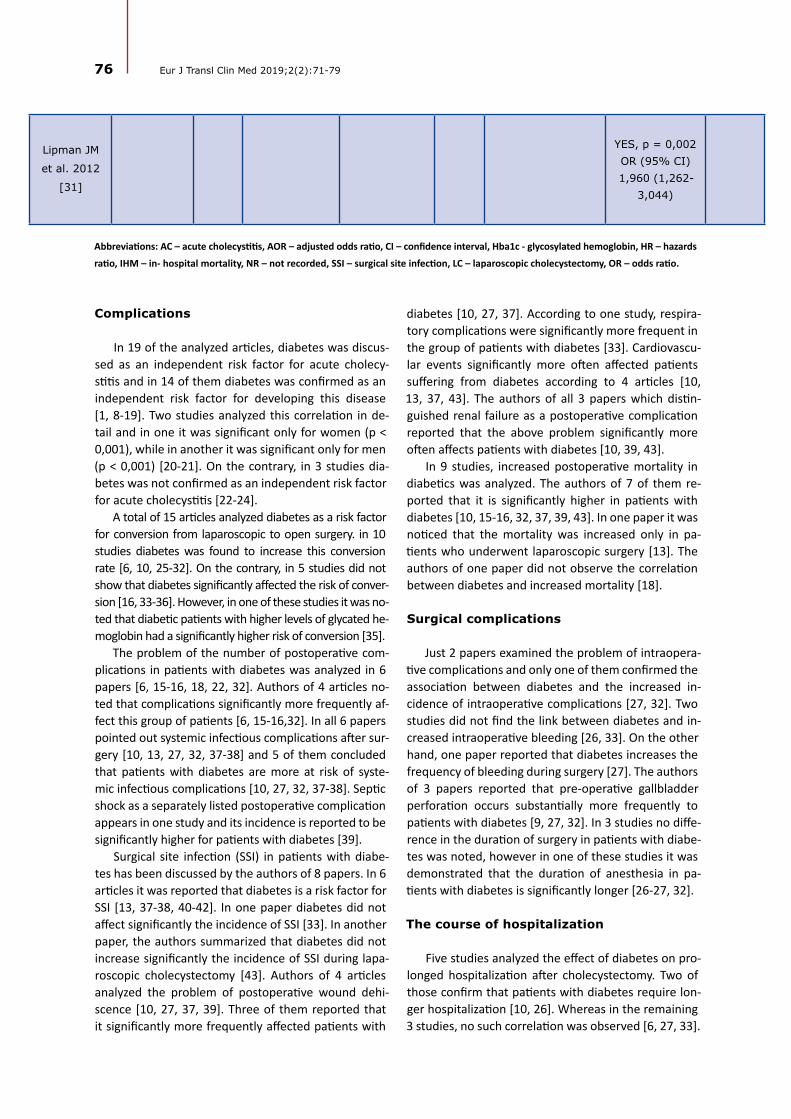
76 Eur J Transl Clin Med 2019;2(2):71-79
Lipman JM
et al. 2012
[31]
YES, p = 0,002 OR (95% CI) 1,960 (1,262-
3,044)
Abbreviations: AC – acute cholecystitis, AOR – adjusted odds ratio, CI – confidence interval, Hba1c - glycosylated hemoglobin, HR – hazards
ratio, IHM – in- hospital mortality, NR – not recorded, SSI – surgical site infection, LC – laparoscopic cholecystectomy, OR – odds ratio.
Complications
In 19 of the analyzed articles, diabetes was discus-sed as an independent risk factor for acute cholecy-stitis and in 14 of them diabetes was confirmed as an independent risk factor for developing this disease [1, 8-19]. Two studies analyzed this correlation in de-tail and in one it was significant only for women (p < 0,001), while in another it was significant only for men (p < 0,001) [20-21]. On the contrary, in 3 studies dia-betes was not confirmed as an independent risk factor for acute cholecystitis [22-24].
A total of 15 articles analyzed diabetes as a risk factor for conversion from laparoscopic to open surgery. in 10 studies diabetes was found to increase this conversion rate [6, 10, 25-32]. On the contrary, in 5 studies did not show that diabetes significantly affected the risk of conver-sion [16, 33-36]. However, in one of these studies it was no-ted that diabetic patients with higher levels of glycated he-moglobin had a significantly higher risk of conversion [35].
The problem of the number of postoperative com-plications in patients with diabetes was analyzed in 6 papers [6, 15-16, 18, 22, 32]. Authors of 4 articles no-ted that complications significantly more frequently af-fect this group of patients [6, 15-16,32]. In all 6 papers pointed out systemic infectious complications after sur-gery [10, 13, 27, 32, 37-38] and 5 of them concluded that patients with diabetes are more at risk of syste-mic infectious complications [10, 27, 32, 37-38]. Septic shock as a separately listed postoperative complication appears in one study and its incidence is reported to be significantly higher for patients with diabetes [39].
Surgical site infection (SSI) in patients with diabe-tes has been discussed by the authors of 8 papers. In 6 articles it was reported that diabetes is a risk factor for SSI [13, 37-38, 40-42]. In one paper diabetes did not affect significantly the incidence of SSI [33]. In another paper, the authors summarized that diabetes did not increase significantly the incidence of SSI during lapa-roscopic cholecystectomy [43]. Authors of 4 articles analyzed the problem of postoperative wound dehi-scence [10, 27, 37, 39]. Three of them reported that it significantly more frequently affected patients with
diabetes [10, 27, 37]. According to one study, respira-tory complications were significantly more frequent in the group of patients with diabetes [33]. Cardiovascu-lar events significantly more often affected patients suffering from diabetes according to 4 articles [10, 13, 37, 43]. The authors of all 3 papers which distin-guished renal failure as a postoperative complication reported that the above problem significantly more often affects patients with diabetes [10, 39, 43].
In 9 studies, increased postoperative mortality in diabetics was analyzed. The authors of 7 of them re-ported that it is significantly higher in patients with diabetes [10, 15-16, 32, 37, 39, 43]. In one paper it was noticed that the mortality was increased only in pa-tients who underwent laparoscopic surgery [13]. The authors of one paper did not observe the correlation between diabetes and increased mortality [18].
Surgical complications
Just 2 papers examined the problem of intraopera-tive complications and only one of them confirmed the association between diabetes and the increased in-cidence of intraoperative complications [27, 32]. Two studies did not find the link between diabetes and in-creased intraoperative bleeding [26, 33]. On the other hand, one paper reported that diabetes increases the frequency of bleeding during surgery [27]. The authors of 3 papers reported that pre-operative gallbladder perforation occurs substantially more frequently to patients with diabetes [9, 27, 32]. In 3 studies no diffe-rence in the duration of surgery in patients with diabe-tes was noted, however in one of these studies it was demonstrated that the duration of anesthesia in pa-tients with diabetes is significantly longer [26-27, 32].
The course of hospitalization
Five studies analyzed the effect of diabetes on pro-longed hospitalization after cholecystectomy. Two of those confirm that patients with diabetes require lon-ger hospitalization [10, 26]. Whereas in the remaining 3 studies, no such correlation was observed [6, 27, 33].

Recommendations
Elective surgery before the onset of symptoms of acute cholecystitis is recommended in 3 papers [15, 44, 45]. Whereas in 3 other articles such recommen-dation is not made [18, 22, 48]. Three authors discuss routine screening for cholelithiasis [15, 22, 45], and two of those recommend it [15, 45]. In one paper, the authors point out that patients with diabetes should be operated by laparoscopy because it improves po-stoperative outcomes [32].
Discussion
The analyzed studies were very heterogeneous in terms of data quality and data reporting. Surprisin-gly many articles did not contain basic patient demo-graphics, detailed methodology (e.g. patient inclusion/exclusion criteria) or full results presented in quan-titative data. For these reasons it was impossible to perform a meta-analysis in addition to the systematic review and therefore to draw strong conclusions.
Most authors of the analyzed articles confirm that diabetes is a risk factor for acute cholecystitis, altho-ugh some authors disagree [22-24]. Based on the li-terature reviewed, it seems that diabetes is an inde-pendent risk factor for acute cholecystitis. Most of the available literature suggests that diabetes is a risk factor for conversion from laparoscopic cholecystecto-my to the open approach. Conversion was significantly more common in diabetics with higher HbA1c levels. The effectiveness of the patient’s diabetes treatment affects the severity of biliary disease and can increase the risk of conversion. Postoperative complications seem to affect patients with diabetes more often. Ac-cording to most authors diabetes is a risk factor for systemic infection, such as pneumonia or UTI. Diabetic patients significantly more often suffer from SSI, wo-und dehiscence and septic shock. Diabetes is an inde-
pendent risk factor for impaired wound healing, which is therefore in agreement with the general view.
The results of the analyzed articles also support the well-known fact that cardiovascular events and renal failure significantly more often affect patients with diabetes. It is noteworthy that the authors also noted a significantly increased postoperative mortality among diabetic patients. This may be directly related to the more frequent development of the above-men-tioned complications. Another explanation for the above phenomenon is the more advanced age and more associated diseases discussed by the authors.
Regarding the recommendations for the manage-ment of patients with diabetes, the authors disagree whether elective cholecystectomy should be routi-nely performed in patients with diabetes. Although the EASL 2016 guidelines do not recommend routine cholecystectomy, the higher number of complications and mortality suggests that diabetic patients could benefit from such management [46]. Despite the lar-ge population of diabetic patients worldwide, at this time there is not enough high-quality evidence on this topic to formulate the necessary guidelines. An individualized approach, cholelithiasis screening and elective surgery could benefit not only patients but also the healthcare system.
Conclusion
Patients with diabetes have an increased risk of developing acute cholecystitis. Furthermore, diabetic patients with acute cholecystitis tend to have more complicated course of the disease. An individualized approach and screening in selected cases, as well as elective cholecystectomy after proper preparation of the patient could have a positive effect on the out-come. However, the low quality of the data from the systematic review does not allow for meta-analysis, which is why we cannot draw strong conclusions.
1. Aune D, Vatten LJ. Diabetes mellitus and the risk of gallbladder disease: A systematic review and meta-analysis of pro-spective studies. J Diabetes Complications [Internet]. 2016 Mar;30(2):368–73. Available from: https://linkinghub.elsevi-er.com/retrieve/pii/S105687271500450X
2. Chapman BA, Wilson IR, Frampton CM, Chisholm RJ, Stewart NR, Eagar GM, et al. Prevalence of gallbladder disease in diabe-tes mellitus. Dig Dis Sci [Internet]. 1996 Nov;41(11):2222–8. Available from: http://link.springer.com/10.1007/BF02071404
3. Pagliarulo M. Gallstone disease and related risk factors in a large cohort of diabetic patients. Dig Liver Dis [Internet]. 2004 Feb;36(2):130–4. Available from: https://linkinghub.elsevier.com/retrieve/pii/S1590865803006340
4. Cho JY, Han HS, Yoon YS, Ahn KS. Risk factors for acute cholecystitis and a complicated clinical course in patients with symptomatic cholelithiasis. Arch Surg [Internet]. 2010 Apr 1;145(4):329–33. Available from: http://archsurg.jamanet-work.com/article.aspx?doi=10.1001/archsurg.2010.35
References
77Acute cholecystitis in patients with diabetes mellitus...
78 Eur J Transl Clin Med 2019;2(2):71-79
5. Karamanos E, Sivrikoz E, Beale E, Chan L, Inaba K, Demetriades D. Effect of diabetes on outcomes in patients undergoing emergent cholecystectomy for acute cholecystitis. World J Surg [Internet]. 2013 Oct 16;37(10):2257–64. Available from: https://doi.org/10.1007/s00268-013-2086-6
6. Bourikian S, Anand RJ, Aboutanos M, Wolfe LG, Ferrada P. Risk factors for acute gangrenous cholecystitis in emergency general surgery patients. Am J Surg [Internet]. 2015 Oct;210(4):730–3. Available from: https://doi.org/10.1016/j.amjsurg.2015.05.003
7. Shpitz B, Sigal A, Kaufman Z, Dinbar A. Acute cholecystitis in diabetic patients. Am Surg [Internet]. 1995 Nov;61(11):964–7. Available from: http://www.ncbi.nlm.nih.gov/pubmed/7486428
8. Landau O, Deutsch AA, Kott I, Rivlin E, Reiss R. The risk of cholecystectomy for acute cholecystitis in diabetic patients. Hepato-gastroenterology [Internet]. 1992 Oct;39(5):437–8. Available from: http://www.ncbi.nlm.nih.gov/pubmed/1459527
9. Terho PM, Leppäniemi AK, Mentula PJ. Laparoscopic cholecystectomy for acute calculous cholecystitis: a retrospective study assessing risk factors for conversion and complications. World J Emerg Surg [Internet]. 2016 Dec 16;11(1):54. Avail-able from: http://wjes.biomedcentral.com/articles/10.1186/s13017-016-0111-4
10. Hickman MS, Schwesinger WH, Page CP. Acute cholecystitis in the diabetic. A case-control study of outcome. Arch Surg [Internet]. 1988 Apr;123(4):409–11. Available from: http://www.ncbi.nlm.nih.gov/pubmed/3348729
11. De Santis A, Attili AF, Ginanni Corradini S, Scafato E, Cantagalli A, De Luca C, et al. Gallstones and diabetes: a case-control study in a free-living population sample. Hepatology [Internet]. 1997 Apr;25(4):787–90. Available from: http://www.ncbi.nlm.nih.gov/pubmed/9096577
12. de Miguel-Yanes JM, Méndez-Bailón M, Jiménez-García R, Hernández-Barrera V, Pérez-Farinós N, Turégano F, et al. Open versus laparoscopic cholecystectomies in patients with or without type 2 diabetes mellitus in Spain from 2003 to 2013. Hepatobiliary Pancreat Dis Int. 2016 Oct;15(5):525–32.
13. ABRAMSON DJ. Diabetes Mellitus and Cholecystectomy. Ann Surg [Internet]. 1957 Mar;145(3):371–8. Available from: https://insights.ovid.com/crossref?an=00000658-195703000-00011
14. Cucchiaro G, Waiters CR, ROSSITCH JC, MEYERS WC. Deaths from Gallstones. Ann Surg [Internet]. 1989 Feb;209(2):149–51. Available from: https://insights.ovid.com/crossref?an=00000658-198902000-00002
15. Lyass S, Perry Y, Venturero M, Muggia-Sullam M, Eid A, Durst A, et al. Laparoscopic cholecystectomy: what does affect the outcome? A retrospective multifactorial regression analysis. Surg Endosc [Internet]. 2000 Jul;14(7):661–5. Available from: http://www.ncbi.nlm.nih.gov/pubmed/10948305
16. Lee S, Chung C-W, Ko KH, Kwon SW. Risk factors for the clinical course of cholecystitis in patients who undergo chol-ecystectomy. Korean J Hepato-Biliary-Pancreatic Surg [Internet]. 2011 Aug;15(3):164. Available from: https://synapse.koreamed.org/DOIx.php?id=10.14701/kjhbps.2011.15.3.164
17. Ransohoff DF, Miller GL, Forsythe SB, Hermann RE. Outcome of acute cholecystitis in patients with diabetes mellitus. Ann Intern Med [Internet]. 1987 Jun 1;106(6):829. Available from: http://annals.org/article.aspx?doi=10.7326/0003-4819-106-6-829
18. de Siqueira Corradi MB, D Ávila R, Duim E, Rodrigues CIS. Risk stratification for complications of laparoscopic cholecystec-tomy based on associations with sociodemographic and clinical variables in a public hospital. Am J Surg [Internet]. 2019 May 15; Available from: https://doi.org/10.1016/j.amjsurg.2019.05.005
19. Paajanen H, Suuronen S, Nordstrom P, Miettinen P, Niskanen L. Laparoscopic versus open cholecystectomy in diabetic patients and postoperative outcome. Surg Endosc [Internet]. 2011 Mar 27;25(3):764–70. Available from: http://link.springer.com/10.1007/s00464-010-1248-y
20. Doran H, Pătraşcu T. Acute abdomen in diabetic patients – what should we do? Chirurgia (Bucur). 2018;113(5):593. 21. Sun H, Tang H, Jiang S, Zeng L, Chen E-Q, Zhou T-Y, et al. Gender and metabolic differences of gallstone diseases. World J
Gastroenterol [Internet]. 2009 Apr;15(15):1886. Available from: http://www.wjgnet.com/1007-9327/full/v15/i15/1886.htm22. Liu C-M, Chung C-L, Hsu C-T, Song M-Z, Chen C-C, Li C-Y. Impact of diabetes mellitus on cholecystectomy rate: A popula-
tion-based follow-up study. Formos J Surg [Internet]. 2015 Oct;48(5):157–62. Available from: http://linkinghub.elsevier.com/retrieve/pii/S1682606X15001097
23. Aucott JN, Cooper G, Bloom A, Aron D. Management of Gallstones in Diabetic Patients. Arch Intern Med [Inter-net]. 1993 May 10;153(9):1053. Available from: http://archinte.jamanetwork.com/article.aspx?doi=10.1001/archinte.1993.00410090019003
24. Bodmer M, Brauchli YB, Jick SS, Meier CR. Diabetes mellitus and the risk of cholecystectomy. Dig Liver Dis [Internet]. 2011 Sep;43(9):742–7. Available from: https://linkinghub.elsevier.com/retrieve/pii/S159086581100154X
25. Bouassida M, Chtourou MF, Charrada H, Zribi S, Hamzaoui L, Mighri MM, et al. The severity grading of acute cholecystitis following the Tokyo Guidelines is the most powerful predictive factor for conversion from laparoscopic cholecystectomy to open cholecystectomy. J Visc Surg [Internet]. 2017 Sep;154(4):239–43. Available from: https://linkinghub.elsevier.com/retrieve/pii/S1878788616301953

26. Aldaqal SM, Albaghdadi AT, Tashkandi HM, El-deek BS, Al-Malki GA, Turki AM, et al. Effect of Diabetes Mellitus on Patients Un-dergoing Laparoscopic Cholecystectomy: A Comparative Cross-Sectional Study. LIife Sci Journal-ActaZ Hengzhou Univ Ovrseas Ed [Internet]. 2012;9(1):431–9. Available from: http://www.lifesciencesite.com/lsj/life0901/
27. Bedirli A, Sözüer EM, Yüksel O, Yilmaz Z. Laparoscopic Cholecystectomy for Symptomatic Gallstones in Diabetic Pa-tients. J Laparoendosc Adv Surg Tech [Internet]. 2001 Oct;11(5):281–4. Available from: http://www.liebertpub.com/doi/10.1089/109264201317054564
28. Sippey M, Grzybowski M, Manwaring ML, Kasten KR, Chapman WH, Pofahl WE, et al. Acute cholecystitis: risk factors for con-version to an open procedure. J Surg Res [Internet]. 2015 Dec;199(2):357–61. Available from: https://linkinghub.elsevier.com/retrieve/pii/S0022480415006514
29. Simopoulos C, Botaitis S, Polychronidis A, Tripsianis G, Karayiannakis AJ. Risk factors for conversion of laparoscopic cholecystectomy to open cholecystectomy. Surg Endosc [Internet]. 2005 Jul 4;19(7):905–9. Available from: http://link.springer.com/10.1007/s00464-004-2197-0
30. Costantini R, Caldaralo F, Palmieri C, Napolitano L, Aceto L, Cellini C, et al. Risk factors for conversion of laparoscopic cholecystec-tomy. Ann Ital Chir [Internet]. 2012;83(3):245–52. Available from: http://www.ncbi.nlm.nih.gov/pubmed/22610122
31. Lipman JM, Claridge JA, Haridas M, Martin MD, Yao DC, Grimes KL, et al. Preoperative findings predict conversion from laparo-scopic to open cholecystectomy. Surgery [Internet]. 2007 Oct;142(4):556–65. Available from: https://linkinghub.elsevier.com/retrieve/pii/S0039606007004357
32. Al-Mulhim ARS. The Outcome of Laparoscopic Cholecystectomy in Diabetic Patients: A Prospective Study. J Laparoendosc Adv Surg Tech [Internet]. 2010 Jun;20(5):417–20. Available from: http://www.liebertpub.com/doi/10.1089/lap.2009.0436
33. Pavlidis TE, Marakis GN, Ballas K, Symeonidis N, Psarras K, Rafailidis S, et al. Risk Factors Influencing Conversion of Laparoscopic to Open Cholecystectomy. J Laparoendosc Adv Surg Tech [Internet]. 2007 Aug;17(4):414–8. Available from: http://www.liebertpub.com/doi/10.1089/lap.2006.0178
34. Ibrahim S, Hean TK, Ho LS, Ravintharan T, Chye TN, Chee CH. Risk Factors for Conversion to Open Surgery in Patients Undergo-ing Laparoscopic Cholecystectomy. World J Surg [Internet]. 2006 Sep 16;30(9):1698–704. Available from: http://link.springer.com/10.1007/s00268-005-0612-x
35. Philip Rothman J, Burcharth J, Pommergaard H-C, Viereck S, Rosenberg J. Preoperative Risk Factors for Conversion of Laparo-scopic Cholecystectomy to Open Surgery - A Systematic Review and Meta-Analysis of Observational Studies. Dig Surg [Internet]. 2016;33(5):414–23. Available from: https://www.karger.com/Article/FullText/445505
36. Turrill FL, McCarron MM, Mikkelsen WP. Gallstones and diabetes: an ominous association. Am J Surg [Internet]. 1961 Aug;102(2):184–90. Available from: https://linkinghub.elsevier.com/retrieve/pii/000296106190383X
37. Jaafar G, Hammarqvist F, Enochsson L, Sandblom G. Patient-Related Risk Factors for Postoperative Infection After Cholecystectomy. World J Surg [Internet]. 2017 Sep 20;41(9):2240–4. Available from: http://link.springer.com/10.1007/s00268-017-4029-0
38. Karamanos E, Dulchavsky S, Beale E, Inaba K, Demetriades D. Diabetes Mellitus in Patients Presenting with Adhesive Small Bowel Obstruction: Delaying Surgical Intervention Results in Worse Outcomes. World J Surg [Internet]. 2016 Apr 13;40(4):863–9. Avail-able from: http://link.springer.com/10.1007/s00268-015-3338-4
39. Aga E, Keinan-Boker L, Eithan A, Mais T, Rabinovich A, Nassar F. Surgical site infections after abdominal surgery: incidence and risk factors. A prospective cohort study. Infect Dis (Auckl) [Internet]. 2015 Nov 2;47(11):761–7. Available from: http://www.tandfon-line.com/doi/full/10.3109/23744235.2015.1055587
40. Warren DK, Nickel KB, Wallace AE, Mines D, Tian F, Symons WJ, et al. Risk factors for surgical site infection after cholecystectomy. Open Forum Infect Dis [Internet]. 2017 Apr 1;4(2):ofx036. Available from: https://academic.oup.com/ofid/article/doi/10.1093/ofid/ofx036/3044173
41. Doran H, Pătraşcu T, Radu C. [Acute abdomen in diabetic patients --diagnostical questions]. Chirurgia (Bucur) [Internet]. 2003;98(2):119–25. Available from: http://www.ncbi.nlm.nih.gov/pubmed/14992132
42. Ismat U, Khan A, Nawaz A, Mansoor R, Malik AA, Sher F, et al. Surgical Site Infection in Diabetic and Non-Diabetic Patients Un-dergoing Laparoscopic Cholecystectomy. J Coll Physicians Surg Pak [Internet]. 2016 Feb;26(2):100–2. Available from: http://www.ncbi.nlm.nih.gov/pubmed/26876394
43. Sandler RS, Maule WF, Baltus ME. Factors associated with postoperative complications in diabetics after biliary tract surgery. Gastroenterol-ogy [Internet]. 1986 Jul;91(1):157–62. Available from: https://linkinghub.elsevier.com/retrieve/pii/001650858690452X
44. Chen L, Peng Y-T, Chen F-L, Tung T-H. Epidemiology, management, and economic evaluation of screening of gallstone disease among type 2 diabetics: A systematic review. World J Clin Cases [Internet]. 2015 Jul;3(7):599. Available from: http://www.wjgnet.com/2307-8960/full/v3/i7/599.htm
45. Del Favero G, Caroli A, Meggiato T, Volpi A, Scalon P, Puglisi A, et al. Natural history of gallstones in non-insulin-dependent diabetes mellitus. Dig Dis Sci [Internet]. 1994 Aug;39(8):1704–7. Available from: http://link.springer.com/10.1007/BF02087780
46. European Association for the Study of the Liver (EASL). Electronic address: [email protected]. EASL Clinical Practice Guide-lines on the prevention, diagnosis and treatment of gallstones. J Hepatol [Internet]. 2016 Jul;65(1):146–81. Available from: https://linkinghub.elsevier.com/retrieve/pii/S0168827816300320
79Acute cholecystitis in patients with diabetes mellitus...

SHORT COMMUNICATION
Carotid access in Transcatheter Aortic Valve Implantation – an alternative to the gold standard. A single-center experience
Abstract
Background: Transfemoral access is regarded as the TAVI gold standard for the transcatheter aortic valve implan-tation (TAVI) procedure. However, other options for vascular access have developed in the last few years. Access via the carotid artery is one such alternative. Materials and methods: The study included 9 elderly patients who underwent transcarotid TAVI procedure at the Cardiac and Vascular Surgery Department of the Medical Uni-versity of Gdańsk. Procedures were performed by a local Heart Team in a hybrid operating room under general anesthesia. Data was collected before the implantation and at discharge. Results: The mean patients’ age was 81 years of age (64-88) and the mean logistic EuroSCORE was 10.8 (7-16). Implantations were performed with 100% device success rate. Intra-operative valve-in-valve procedure was performed in one patient; there were no access-related and valve-related complications during the surgery. Post-procedural complications included minor bleeding, hematoma and pneumothorax. Echocardiographic parameters were significantly improving after the procedure. The mean hospital stay was 5 days (2-7 days). Conclusions: Transcatheter aortic valve implantation via the carotid artery appears to be safe and effective alternative to standard TAVI vascular access.
Keywords: transcatheter aortic valve implantation · aortic stenosis · carotid artery · elderly
EUROPEAN JOURNAL OF TRANSLATIONAL AND CLINICAL MEDICINE 2019;2(2):80-84
Citation
Stańska A, Wierzbowska A, Targoński R, Karolak W, Mickiewicz A, Jaguszewski M, Jagielak D. Carotid access in Transcatheter Aortic Valve Implantation – an alternative to the gold standard. A single-center experience. Eur J Transl Clin Med. 2019;2(2):80-84.DOI: 10.31373/ejtcm/116213
Corresponding author:Aleksandra Stańska, Department of Cardiac and Vascular Surgery, Medical University of Gdańsk, Polande-mail: [email protected] external funds. Available online: www.ejtcm.gumed.edu.plCopyright ® Medical University of Gdańsk
Aleksandra Stańska1 , Aleksandra Wierzbowska1, Radosław
Targoński1, Wojciech Karolak1 , Agnieszka Mickiewicz2 ,
Miłosz Jaguszewski2 , Dariusz Jagielak1
1Department of Cardiac and Vascular Surgery, Medical University of Gdańsk, Poland21st Department of Cardiology, Medical University of Gdańsk, Poland
This is Open Access article distributed under the terms of the Creative Commons Attribution-ShareAlike 4.0 International.
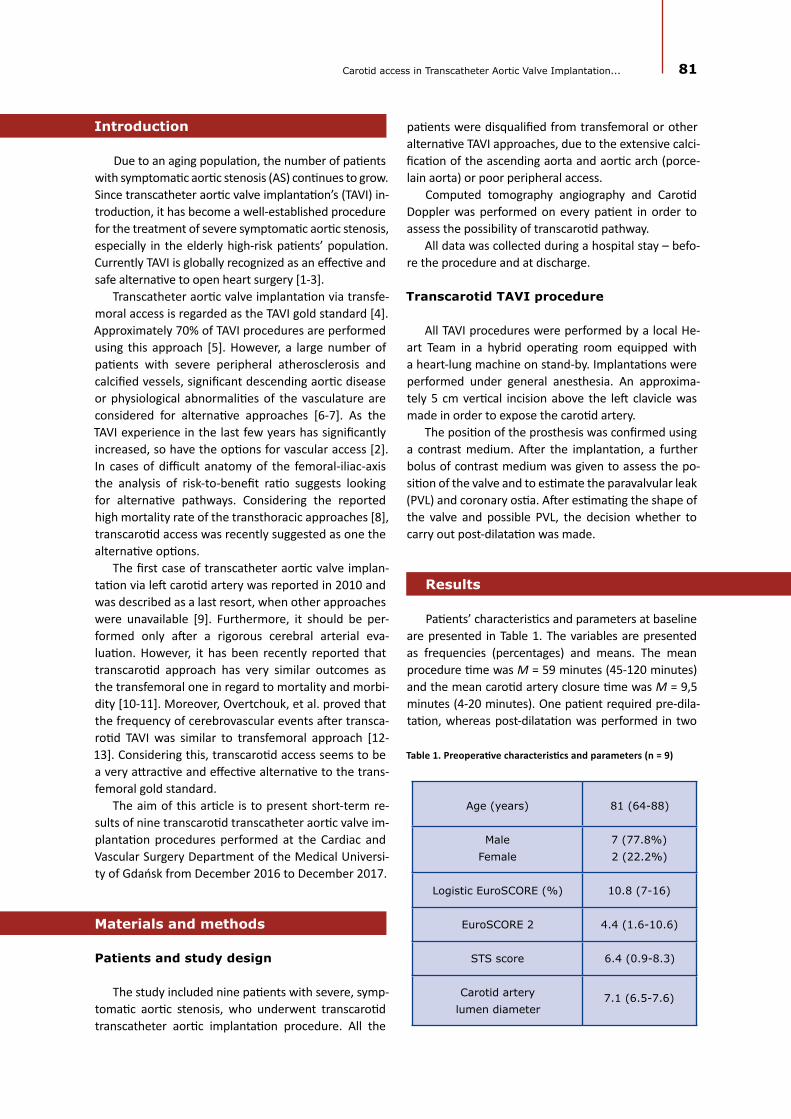
81Carotid access in Transcatheter Aortic Valve Implantation...
Introduction
Due to an aging population, the number of patients with symptomatic aortic stenosis (AS) continues to grow. Since transcatheter aortic valve implantation’s (TAVI) in-troduction, it has become a well-established procedure for the treatment of severe symptomatic aortic stenosis, especially in the elderly high-risk patients’ population. Currently TAVI is globally recognized as an effective and safe alternative to open heart surgery [1-3].
Transcatheter aortic valve implantation via transfe-moral access is regarded as the TAVI gold standard [4]. Approximately 70% of TAVI procedures are performed using this approach [5]. However, a large number of patients with severe peripheral atherosclerosis and calcified vessels, significant descending aortic disease or physiological abnormalities of the vasculature are considered for alternative approaches [6-7]. As the TAVI experience in the last few years has significantly increased, so have the options for vascular access [2]. In cases of difficult anatomy of the femoral-iliac-axis the analysis of risk-to-benefit ratio suggests looking for alternative pathways. Considering the reported high mortality rate of the transthoracic approaches [8], transcarotid access was recently suggested as one the alternative options.
The first case of transcatheter aortic valve implan-tation via left carotid artery was reported in 2010 and was described as a last resort, when other approaches were unavailable [9]. Furthermore, it should be per-formed only after a rigorous cerebral arterial eva-luation. However, it has been recently reported that transcarotid approach has very similar outcomes as the transfemoral one in regard to mortality and morbi-dity [10-11]. Moreover, Overtchouk, et al. proved that the frequency of cerebrovascular events after transca-rotid TAVI was similar to transfemoral approach [12-13]. Considering this, transcarotid access seems to be a very attractive and effective alternative to the trans-femoral gold standard.
The aim of this article is to present short-term re-sults of nine transcarotid transcatheter aortic valve im-plantation procedures performed at the Cardiac and Vascular Surgery Department of the Medical Universi-ty of Gdańsk from December 2016 to December 2017.
Materials and methods
Patients and study design
The study included nine patients with severe, symp-tomatic aortic stenosis, who underwent transcarotid transcatheter aortic implantation procedure. All the
patients were disqualified from transfemoral or other alternative TAVI approaches, due to the extensive calci-fication of the ascending aorta and aortic arch (porce-lain aorta) or poor peripheral access.
Computed tomography angiography and Carotid Doppler was performed on every patient in order to assess the possibility of transcarotid pathway.
All data was collected during a hospital stay – befo-re the procedure and at discharge.
Transcarotid TAVI procedure
All TAVI procedures were performed by a local He-art Team in a hybrid operating room equipped with a heart-lung machine on stand-by. Implantations were performed under general anesthesia. An approxima-tely 5 cm vertical incision above the left clavicle was made in order to expose the carotid artery.
The position of the prosthesis was confirmed using a contrast medium. After the implantation, a further bolus of contrast medium was given to assess the po-sition of the valve and to estimate the paravalvular leak (PVL) and coronary ostia. After estimating the shape of the valve and possible PVL, the decision whether to carry out post-dilatation was made.
Results
Patients’ characteristics and parameters at baseline are presented in Table 1. The variables are presented as frequencies (percentages) and means. The mean procedure time was M = 59 minutes (45-120 minutes) and the mean carotid artery closure time was M = 9,5 minutes (4-20 minutes). One patient required pre-dila-tation, whereas post-dilatation was performed in two
Table 1. Preoperative characteristics and parameters (n = 9)
Age (years) 81 (64-88)
Male Female
7 (77.8%)2 (22.2%)
Logistic EuroSCORE (%) 10.8 (7-16)
EuroSCORE 2 4.4 (1.6-10.6)
STS score 6.4 (0.9-8.3)
Carotid artery lumen diameter
7.1 (6.5-7.6)
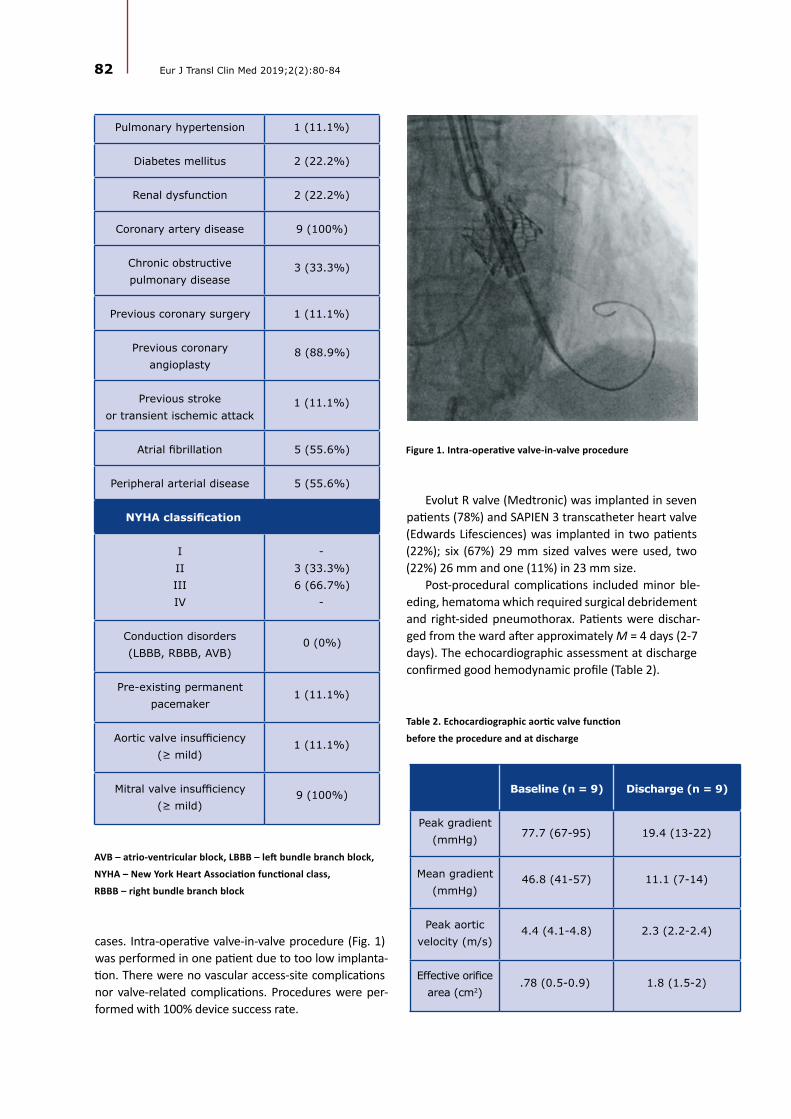
82 Eur J Transl Clin Med 2019;2(2):80-84
Pulmonary hypertension 1 (11.1%)
Diabetes mellitus 2 (22.2%)
Renal dysfunction 2 (22.2%)
Coronary artery disease 9 (100%)
Chronic obstructive pulmonary disease
3 (33.3%)
Previous coronary surgery 1 (11.1%)
Previous coronary angioplasty
8 (88.9%)
Previous stroke or transient ischemic attack
1 (11.1%)
Atrial fibrillation 5 (55.6%)
Peripheral arterial disease 5 (55.6%)
NYHA classification
IIIIIIIV
-3 (33.3%)6 (66.7%)
-
Conduction disorders (LBBB, RBBB, AVB)
0 (0%)
Pre-existing permanent pacemaker
1 (11.1%)
Aortic valve insufficiency (≥ mild)
1 (11.1%)
Mitral valve insufficiency (≥ mild)
9 (100%)
AVB – atrio-ventricular block, LBBB – left bundle branch block,
NYHA – New York Heart Association functional class,
RBBB – right bundle branch block
cases. Intra-operative valve-in-valve procedure (Fig. 1) was performed in one patient due to too low implanta-tion. There were no vascular access-site complications nor valve-related complications. Procedures were per-formed with 100% device success rate.
Figure 1. Intra-operative valve-in-valve procedure
Table 2. Echocardiographic aortic valve function
before the procedure and at discharge
Evolut R valve (Medtronic) was implanted in seven patients (78%) and SAPIEN 3 transcatheter heart valve (Edwards Lifesciences) was implanted in two patients (22%); six (67%) 29 mm sized valves were used, two (22%) 26 mm and one (11%) in 23 mm size.
Post-procedural complications included minor ble-eding, hematoma which required surgical debridement and right-sided pneumothorax. Patients were dischar-ged from the ward after approximately M = 4 days (2-7 days). The echocardiographic assessment at discharge confirmed good hemodynamic profile (Table 2).
Baseline (n = 9) Discharge (n = 9)
Peak gradient (mmHg) 77.7 (67-95) 19.4 (13-22)
Mean gradient (mmHg)
46.8 (41-57) 11.1 (7-14)
Peak aortic velocity (m/s)
4.4 (4.1-4.8) 2.3 (2.2-2.4)
Effective orifice area (cm2)
.78 (0.5-0.9) 1.8 (1.5-2)

83Carotid access in Transcatheter Aortic Valve Implantation...
Discussion
The main aim of the study conducted at the Cardiac and Vascular Surgery Department of the Medical Uni-versity of Gdańsk was to evaluate the safety and hemo-dynamic parameters of the transcarotid TAVI procedure.
A high rate of procedural success and a small num-ber of complications are presented. Furthermore, echo-cardiographic aortic valve function after the procedure was quite satisfactory. No patients experienced any neurological injury during, nor after the procedure.
It is well-known that the manipulation of carotid arteries may increase the risk of neurological injury, however the preliminary data suggest that patients undergoing TAVI procedure via transcarotid access are not exposed to severe neurological impairment. The key to success is probably thorough diagnostic process, including Carotid Doppler and computed tomography angiography. Assessing calcification and diameter of left carotid artery should be the most important part of the pre-operative qualification. In case of any do-ubts, it may be more adequate to choose non-vascular type of access.
The most important advantage of transcarotid ac-cess is a direct and a significantly shorter route to the aortic valve from the entry. The additional benefit is an improved movement precision during catheter delivery.
As in the case of every TAVI approach, there are also certain disadvantages of particular access. The transcarotid procedure is usually performed under general anesthesia and is more invasive in compari-son to the transfemoral approach, which is conducted under local anesthesia. Assuming that TAVI should be a less-invasive procedure, the process of evaluation ought to be very specific and, in case of transcarotid access, exclude high-risk patients with a large number of comorbidities. Transcarotid pathway requires larger surgical intervention (Fig. 2) and hence wound-related complications may occur, thus may not be suitable for all patients disqualified from the traditional transfe-moral access.
There are some limitations of the study. First of all, it is a single-center experience. Secondly, a small sam-
Figure 2. Transcarotid pathway requires larger surgical intervention
ple of patients was included. The analysis of a larger sample may offer slightly different results. Unfortuna-tely, transcarotid access is still not considered as a common alternative to transfemoral approach, so the number of patients’ undergoing TAVI via this access is quite small. Considering promising results this appro-ach should be taken into consideration as a second- or third-choice access to the established gold standard.
Conclusions
The preliminary data suggest that transcarotid tran-scatheter aortic valve implantation may be a safe and up-and-coming alternative to other types of vascular access. However, this requires further study and multi-
-center experience.
1. Liu Z, Kidney E, Bem D, Bramley G, Bayliss S, de Belder MA, et al. Transcatheter aortic valve implantation for aortic ste-nosis in high surgical risk patients: A systematic review and meta-analysis. Paul T, editor. PLoS One [Internet]. 2018 May 10 [cited 2019 Dec 31];13(5):e0196877. Available from: https://dx.plos.org/10.1371/journal.pone.0196877
2. Kanwar A, Thaden JJ, Nkomo VT. Management of patients with aortic valve stenosis. Mayo Clin Proc [Internet]. 2018 Apr [cited 2019 Dec 31];93(4):488–508. Available from: https://linkinghub.elsevier.com/retrieve/pii/S0025619618300727
References

84 Eur J Transl Clin Med 2019;2(2):80-84
3. Terré JA, George I, Smith CR. Pros and cons of transcatheter aortic valve implantation (TAVI). Ann Cardiothorac Surg [Internet]. 2017 Sep;6(5):444–52. Available from: http://www.annalscts.com/article/view/16397
4. Cahill TJ, Chen M, Hayashida K, Latib A, Modine T, Piazza N, et al. Transcatheter aortic valve implantation: current status and future perspectives. Eur Heart J [Internet]. 2018 Apr 27;39(28):2625–34. Available from: https://doi.org/10.1093/eurheartj/ehy244
5. Allende R, Urena M, Cordoba JG, Ribeiro HB, Amat-Santos I, DeLarochellière R, et al. Impact of the Use of Transradial Versus Transfemoral Approach as Secondary Access in Transcatheter Aortic Valve Implantation Procedures. Am J Cardiol [Internet]. 2014 Dec 1 [cited 2019 Dec 31];114(11):1729–34. Available from: https://www.sciencedirect.com/science/article/pii/S0002914914017846
6. Bonaros N, Petzina R, Cocchieri R, Jagielak D, Aiello M, Lapeze J, et al. Transaortic transcatheter aortic valve implantation as a first-line choice or as a last resort? An analysis based on the ROUTE registry†. Eur J Cardio-Thoracic Surg [Internet]. 2017 Mar 28;51(5):919–26. Available from: https://doi.org/10.1093/ejcts/ezw406
7. Pierard L. Transcatheter aortic valve implantation: indications. E-Journal Cardiol Pract [Internet]. 2016 [cited 2019 Dec 31];14(1). Available from: https://www.escardio.org/Journals/E-Journal-of-Cardiology-Practice/Volume-14/transcathe-ter-aortic-valve-implantation-indications
8. Koifman E, Magalhaes M, Kiramijyan S, Escarcega RO, Didier R, Torguson R, et al. Impact of transfemoral versus transapi-cal access on mortality among patients with severe aortic stenosis undergoing transcatheter aortic valve replacement. Cardiovasc Revascularization Med [Internet]. 2016;17(5):318–21. Available from: http://www.sciencedirect.com/sci-ence/article/pii/S1553838916301154
9. Modine T, Lemesle G, Azzaoui R, Sudre A. Aortic valve implantation with the CoreValve ReValving System via left carotid artery access: First case report. J Thorac Cardiovasc Surg [Internet]. 2010 Oct;140(4):928–9. Available from: https://doi.org/10.1016/j.jtcvs.2010.03.001%0A
10. Mylotte D, Sudre A, Teiger E, Obadia JF, Lee M, Spence M, et al. Transcarotid Transcatheter Aortic Valve Replacement: Feasibility and Safety. JACC Cardiovasc Interv [Internet]. 2016;9(5):472–80. Available from: http://www.sciencedirect.com/science/article/pii/S1936879815019251
11. Wee IJY, Stonier T, Harrison M, Choong AMTL. Transcarotid transcatheter aortic valve implantation: A systematic re-view. J Cardiol [Internet]. 2018;71(6):525–33. Available from: http://www.sciencedirect.com/science/article/pii/S0914508718300297
12. Overtchouk P, Alqdeimat I, Coisne A, Fattouch K, Modine T. Transcarotid approach for TAVI: an optimal alternative to the transfemoral gold standard. Ann Cardiothorac Surg [Internet]. 2017 Sep;6(5):555–7. Available from: http://www.annalscts.com/article/view/16391/16543
13. Nombela-Franco L, Webb J, de Jaegere P, Toggweiler S, Nuis R-J, Dager A, et al. Timing, Predictive Factors, and Prognostic Value of Cerebrovascular Events in a Large Cohort of Patients Undergoing Transcatheter Aortic Valve Implantation. Circu-lation [Internet]. 2012 Dec 18;126(25):3041–53. Available from: https://doi.org/10.1161/CIRCULATIONAHA.112.110981

COMMENTARY
Commentary on: The usefulness and limitations of diffusion tensor imaging – a review study
EUROPEAN JOURNAL OF TRANSLATIONAL AND CLINICAL MEDICINE 2019;2(2):85-86
Corresponding author:
Tomasz Szmuda MD, PhD, Neurosurgery Department, Medical University of Gdańsk, Mariana Smoluchowskiego 17, 80-214, Gdańsk, Poland
e-mail: [email protected]
No external funds.
Available online: www.ejtcm.gumed.edu.pl
Copyright ® Medical University of Gdańsk
Tomasz Szmuda1* , Shan Ali2*
1Neurosurgery Department, Medical University of Gdańsk, Poland2Student Scientific Circle, Neurosurgery Department, Medical University of Gdańsk, Poland *both authors contributed equally to the paper
This is Open Access article distributed under the terms of the Creative Commons Attribution-ShareAlike 4.0 International.
Abbreviations and acronyms
CPA – cerebello-pontine angleDTI – diffusion tensor tractographyFN – Facial nerve
Dear Editor,
We read with great enthusiasm the review article by Sara Kierońska and Paweł Słoniewski about the li-mitations of diffusion tensor imaging (DTI) [1]. While it was brilliant, we felt that the paper could have bene-fitted from alluding to the role DTI of cranial nerves in cerebello-pontine angle (CPA) tumours.
If the facial nerve (FN) surrounds a tumour, it should be always preserved during a large CPA tumour surgery, although, sometimes it cannot be visualised intraope-ratively. In such cases DTI might be particularly helpful. As researchers at the Medical University of Gdańsk, we were among the first to attempt FN tracking with DTI, however we obtained suboptimal results [2]. A 2018 systematic review on 234 cases, reported only a 90.6% accuracy of FN identification by fibre tracking DTI. For reference, the prediction rate of the FN’s position in CPA tumours should reach 100% [3]. The current ima-ging capabilities of DTI are unsatisfactory and neuro-surgeons should strive for better outcomes especially since concurrent radiosurgery enables similar CPA
Keywords: Diffusion Tensor Imaging · cerebellopontine angle · facial nerve · tractography
Citation
Szmuda T, Ali Sh. Commentary on: The usefulness and limitations of diffusion tensor imaging – a review study. Eur J Transl Clin Med. 2019;2(2):85-86.DOI: 10.31373/ejtcm/114000

Figure 1. Facial nerve’s path tracked by diffusion tensor imaging as it courses around
the vestibular schwannoma. A – axial planes, B – sagittal planes (green bundles),
C – a three-dimensional model (segmented in orange volume), D – the debulking of
the acoustic canal
1. Kierońska S, Słoniewski P. The usefulness and limitations of diffusion tensor imaging – a review study. Eur J Transl Clin Med [Internet]. 2019 Oct;2:[ahead of pub]. Available from: https://doi.org/10.31373/EJTCM/112437
2. Szmuda T, Słoniewski P, Sabisz A, Szmuda M. Traktografia nerwu twarzowego w guzach kąta mostowo-móżdżkowego. Otorynolaryngologia [Internet]. 2014;13(1):42–50. Available from: https://www.otorynolaryngologia-pk.pl/f/file/orl-2014_vol-13_issue-1_article-1136.pdf
3. Savardekar AR, Patra DP, Thakur JD, Narayan V, Mohammed N, Bollam P, et al. Preoperative diffusion tensor imaging–fib-er tracking for facial nerve identification in vestibular schwannoma: a systematic review on its evolution and current sta-tus with a pooled data analysis of surgical concordance rates. Neurosurg Focus [Internet]. 2018 Mar;44(3):E5. Available from: https://doi.org/10.3171/2017.12.FOCUS17672
4. Pereira PG, Manacas R. Magnetic Resonance Imaging Fusion of Cranial Nerves Impaired by Skull Base Tumors: A Tech-nical Development. J Nucl Med Radiat Ther [Internet]. 2019;10(1):396. Available from: https://doi.org/10.4172/2155-9619.1000396
References
tumour control. At our department we tracked the FN in the operating room by integrating preoperative planning with a real-time neurona-vigation system. This initially pro-mising hypothesis, still unpublished, was ultimately disappointing as the prediction rate of about 80% was lo-wer than expected.
Figure 1: The image illustrates the facial nerve’s path tracked by dif-fusion tensor imaging as it courses around the vestibular schwannoma. Facial nerve predictions are presen-ted on axial (A) and sagittal planes (B) (green bundles) and on a three-
-dimensional model (C) (segmented in orange volume). The debulking of the acoustic canal is presented in the intraoperative snapshot (D), the picture is injected to the screen is shown in the right upper corner.
In cases where the accuracy of DTI is moderate, a combination of DTI with other imaging modalities might yield more reliable results. For instance, Pereira et al. comple-mented standard DTI with multiplanar fused sequen-ces of magnetic resonance imaging; they took advan-tage of the regularity that only tumours enhanced with contrast could offer and thereby they isolated the surrounding cranial nerves [4]. This study of six patients postulates that the combined imaging with standard DTI could improve operative planning. Whi-le still a preliminary study, the agreement between the fused imaging and actual intraoperative anatomy proved to be correct always. We encourage scientists
to experiment by combining the imaging potential of multiple modalities like DTI and magnetic resonance imaging. Perhaps together they can yield more accura-te results than if used alone.
Regardless of our assessment, the study by Kie-rońska et al. contributes a relevant and critical appra-isal of DTI. Radiological imaging like DTI is central to neurological surgery and we commend the authors for reviewing the limitations of it. We hope our com-mentary expands the scientific discourse on this topic, thus serving as another building block to advance the imaging standards of neurosurgery.
86 Eur J Transl Clin Med 2019;2(2):85-86

