european monthly etf market review · 10 december 2015 european monthly etf market review deutsche...
TRANSCRIPT
Deutsche Bank Markets Research
Europe
Synthetic Equity & Index Strategy
European Monthly ETF Market Review
Date
10 December 2015
Strong Equity Inflows where Foreign Equities Benefit
Data in this report is as of 30th November 2015
________________________________________________________________________________________________________________
Deutsche Bank AG/London
Deutsche Bank does and seeks to do business with companies covered in its research reports. Thus, investors should be aware that the firm may have a conflict of interest that could affect the objectivity of this report. Investors should consider this report as only a single factor in making their investment decision. DISCLOSURES AND ANALYST CERTIFICATIONS ARE LOCATED IN APPENDIX 1.MCI (P) 124/04/2015.
Author
Ari Rajendra
Strategist
(+44) 20 754-52282
Team Contacts
Shan Lan
Strategist
(+852) 22036716
Sebastian Mercado
Strategist
(+1) 212 250-8690
European ETP Highlights
As of the end of November 2015, Global ETPs assets stood at $2.9 trillion with
European ETP assets at $505bn (€478bn). European ETPs continued its
positive trend and ended the month with net inflows of +€3.1bn in November
(+€6.2bn in the prev. month and +€65bn YTD). Equity ETFs led the charge with
notable inflows of +€2.5bn followed by Fixed Income ETFs (+€0.5bn) and
Commodity ETPs (+€0.2bn). Global ETPs flows totalled +$25.7bn for
November taking YTD total to over +$300bn. This was led by US ETPs
recording +$26bn in monthly inflows with YTD flows nearing +$200bn.
November saw significant number of new launches and 2 new providers
During November, European ETP market welcomed 48 new launches and 2
new Providers (BMO Global Asset Management and Sun Global Investments).
The majority of the new launches were by ETF Securities (24 launches)
introducing leveraged products on commodities and currencies.
US, Japan and Global focused ETFs benefitted from inflows, Broad European equities experienced net outflows
Majority of the inflows into equity ETFs in Europe were channeled into equities
outside of Europe. US equities in particular were favoured by European
investors where we observed inflows of +€0.6bn during November. Japan
equities and global benchmarks such as MSCI World also benefitted. Our
analysis suggests that both segments received net inflows of +€0.4bn each.
However, in November, the broad European equities segment had a reversal
where we observed monthly outflows of -€0.3bn.
Real Estate and Dividend ETFs drew interest in November
Sector wise, during November, we found that European investors showed
interest in real estate (+€0.4bn) and dividend ETFs (+€0.3bn). The low interest
rates environment has lead investors into higher-yielding products such as
dividend ETFs which has accumulated +€2bn YTD.
Corporate Bonds registered inflows while Sovereign lags
Within fixed income, corporate bonds led the flows attracting +€1.7bn over the
last month (+€13.1bn YTD) while sovereign bonds reversed the previous
month’s trend and recorded outflows of -€1.3bn in November (+€2bn in
October & +€8.7bn YTD).
10 December 2015
European Monthly ETF Market Review
Page 2 Deutsche Bank AG/London
Table of Contents
European Investment Trends ....................................................................................3 ETF Comparatives: Mutual Funds, cash equity turnover ..........................................5 Product Launch Activity ............................................................................................5 Other regions’ cash flow summary ...........................................................................7
1. Investment Trends ...................................................... 8 Cross-Asset Class ETPs ............................................................................................8 Equity ETFs ...............................................................................................................8 Fixed Income ETFs .................................................................................................11 Commodity ETPs ....................................................................................................11
2. Market Metrics .......................................................... 12 ETF Industry Asset Evolution ..................................................................................12 ETFs vs. Cash Equities ............................................................................................15 ETFs vs. Unlisted Mutual Funds .............................................................................17 European ETF Industry Replication Structure Composition (Synthetic vs. Physical)
................................................................................................................................19 Industry Growth Analysis ........................................................................................21
3. Cash Flow Analysis ................................................... 23 Regional Cash Flow Analysis ..................................................................................23 Asset Class Cash Flow Analysis .............................................................................23 Product Rankings ....................................................................................................28
4. Product Review ......................................................... 30 New Products Launched in the Month ...................................................................30 Average TERs .........................................................................................................35
5. Provider Rankings ..................................................... 38 Global Provider Rankings ........................................................................................38 European Provider Rankings – General ...................................................................40 European Provider Rankings – by Asset Class ........................................................44 European Provider Analysis by Replication Method ...............................................47
6. Trading Perspective .................................................. 48 ETP Monthly Turnover Analysis by Asset Class, by Instrument..............................48 Asset Class Analysis ...............................................................................................48 Product Rankings ....................................................................................................53
7. European ETF Exchanges ............................................ 58
8. Assets ......................................................................... 61 ETP Monthly AUM Analysis by Asset Class ...........................................................61 Asset Class Analysis ...............................................................................................61 Product Rankings ....................................................................................................66
9. ETF Broker rankings .................................................. 68 US ETP Broker Rankings .........................................................................................68 European ETP Broker Rankings ..............................................................................70
Appendix A: How we define ETPs ..................................... 72
Appendix B: The road from beta to alpha ......................... 73
10 December 2015
European Monthly ETF Market Review
Deutsche Bank AG/London Page 3
European Investment Trends
All the major asset classes registered inflows during November
European domiciled ETPs recorded yet another month of inflows where we
observed +€3.1bn of inflows into ETPs (+€6.2bn of inflows in Oct’15). During
the month of November, all the major asset classes registered inflows. Equity
ETFs took the lead with inflows of +€2.5bn followed by Fixed Income ETFs
(+€0.5bn) and Commodity ETPs (+€0.2bn). Year-to-date flows for European-
listed ETPs was at +€64.5bn as of the end of November.
US domiciled ETPs recorded inflows of +$26bn (+$28bn in Oct’15) in
November taking YTD flows close to +$200bn. Similar to Europe, Equity ETFs
dominated flows with +$25.1bn (+$15.8bn in Oct’15) of positive flows while
Fixed Income ETFs only registered inflows of +$0.3bn. Commodity ETPs
reversed previous month’s trend and experienced outflows of -$0.2bn
(+$0.5bn in Oct’15).
US, Japan and Global focused ETFs benefitted from inflows, Broad European equities experienced net outflows
Majority of the inflows into equity ETFs in Europe were channeled into equities
outside of Europe. US equities in particular were favoured by European
investors where we observed inflows of +€0.6bn during November. In the US,
this was more prevalent where US-listed ETFs providing US equities exposure,
across various types of indices, registered monthly inflows of c.+$19bn.
Japan equities and global benchmarks such as MSCI World also benefitted
from inflows in November. Our analysis suggests that both segments received
net inflows of +€0.4bn each.
Since start of 2015, European ETFs with exposure broad European equity
indices had attracted significant inflows. This trend was observed both among
European and US investors. In the European ETF domain, our analysis points
to +€20bn YTD. However, in November, this segment showed a slight reversal
where we observed monthly outflows of -€0.3bn out of broad European
equities. In contrast, US listed ETFs with broad European equity exposure
continued to grow in November (+$1bn, YTD total of +$33bn).
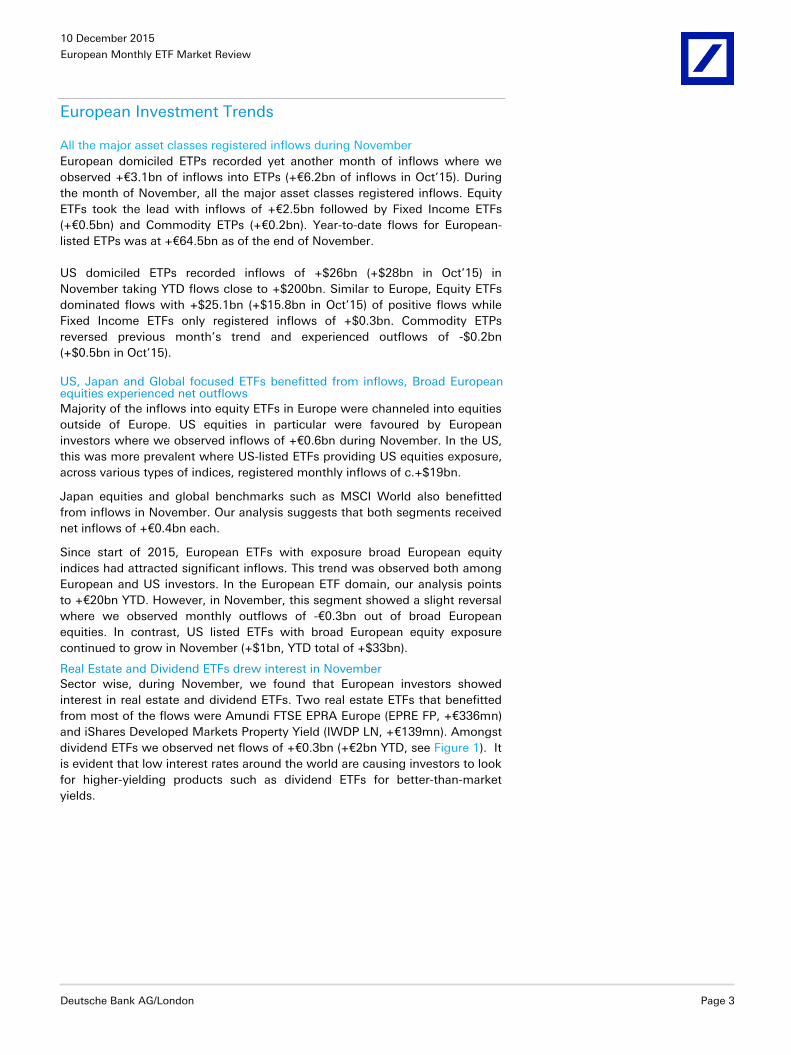
Real Estate and Dividend ETFs drew interest in November
Sector wise, during November, we found that European investors showed
interest in real estate and dividend ETFs. Two real estate ETFs that benefitted
from most of the flows were Amundi FTSE EPRA Europe (EPRE FP, +€336mn)
and iShares Developed Markets Property Yield (IWDP LN, +€139mn). Amongst
dividend ETFs we observed net flows of +€0.3bn (+€2bn YTD, see Figure 1). It
is evident that low interest rates around the world are causing investors to look
for higher-yielding products such as dividend ETFs for better-than-market
yields.
10 December 2015
European Monthly ETF Market Review
Page 4 Deutsche Bank AG/London
Figure 1: Cumulative YTD flows into Dividend ETFs
0
200
400
600
800
1,000
1,200
1,400
1,600
1,800
2,000
Cu
mm
ula
tive
Flo
ws €
mn
Dividend ETFs Flows
Source: Deutsche Bank, Bloomberg Finance LP, Reuters.
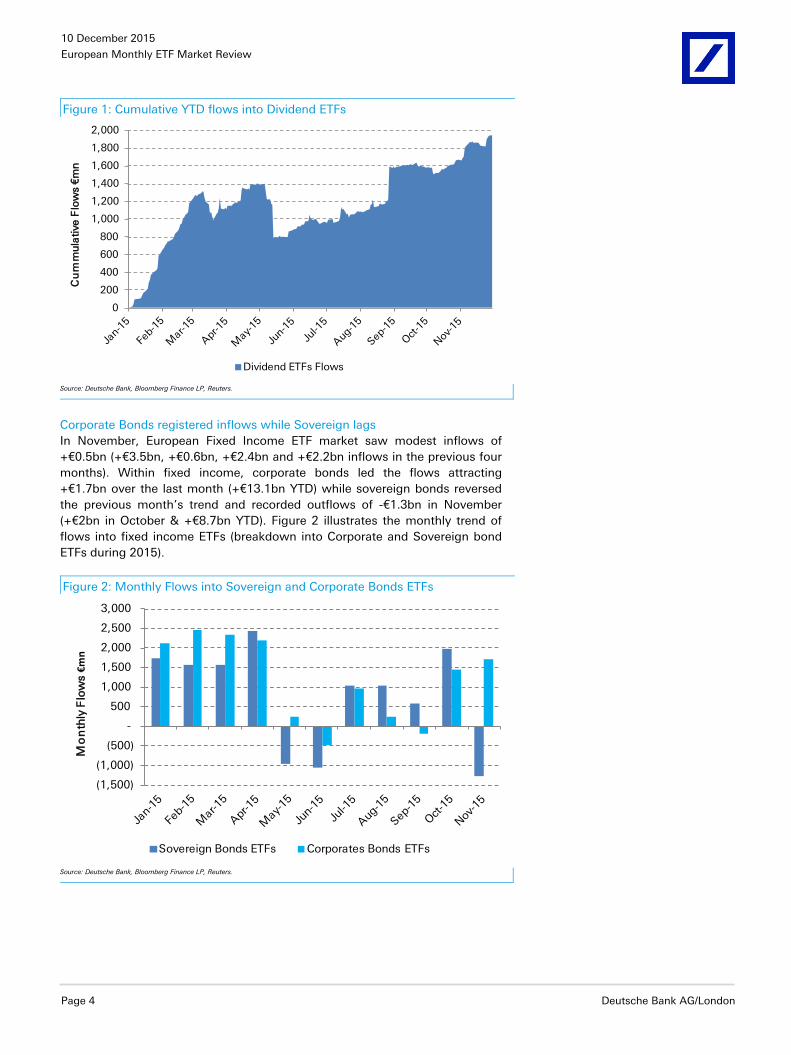
Corporate Bonds registered inflows while Sovereign lags
In November, European Fixed Income ETF market saw modest inflows of
+€0.5bn (+€3.5bn, +€0.6bn, +€2.4bn and +€2.2bn inflows in the previous four
months). Within fixed income, corporate bonds led the flows attracting
+€1.7bn over the last month (+€13.1bn YTD) while sovereign bonds reversed
the previous month’s trend and recorded outflows of -€1.3bn in November
(+€2bn in October & +€8.7bn YTD). Figure 2 illustrates the monthly trend of
flows into fixed income ETFs (breakdown into Corporate and Sovereign bond
ETFs during 2015).
Figure 2: Monthly Flows into Sovereign and Corporate Bonds ETFs
(1,500)
(1,000)
(500)
-
500
1,000
1,500
2,000
2,500
3,000
Mo
nth
ly F
low
s €
mn
Sovereign Bonds ETFs Corporates Bonds ETFs
Source: Deutsche Bank, Bloomberg Finance LP, Reuters.
10 December 2015
European Monthly ETF Market Review
Deutsche Bank AG/London Page 5
ETF Comparatives: Mutual Funds, cash equity turnover
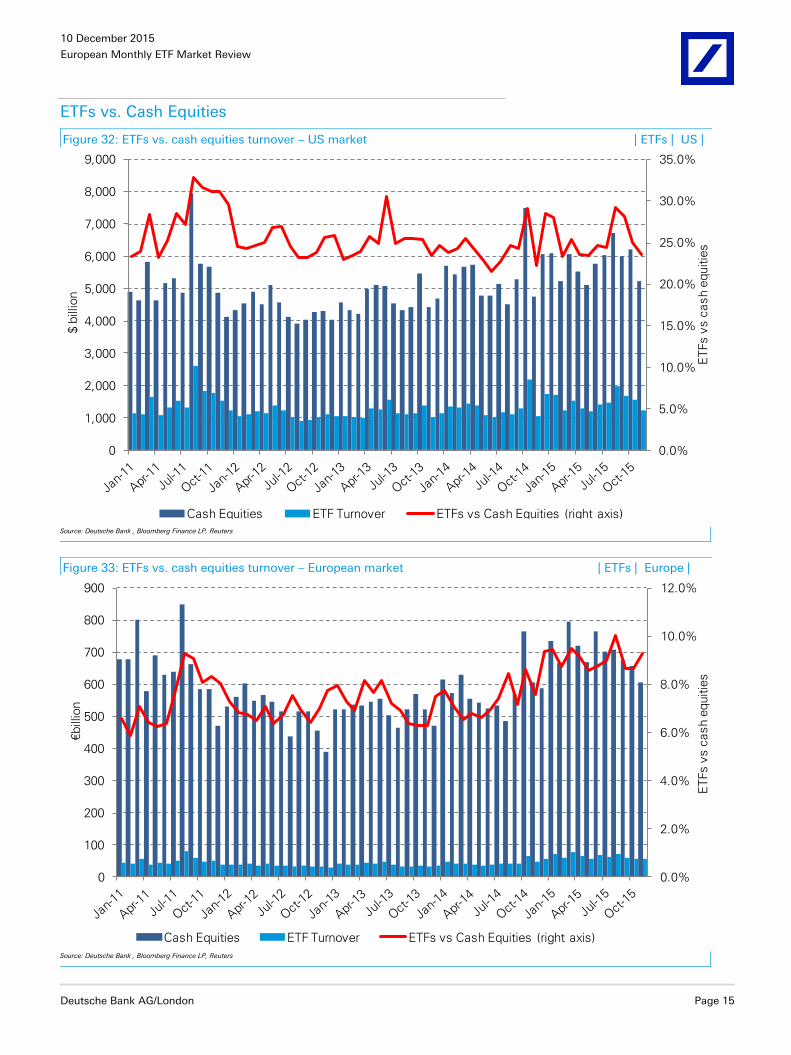
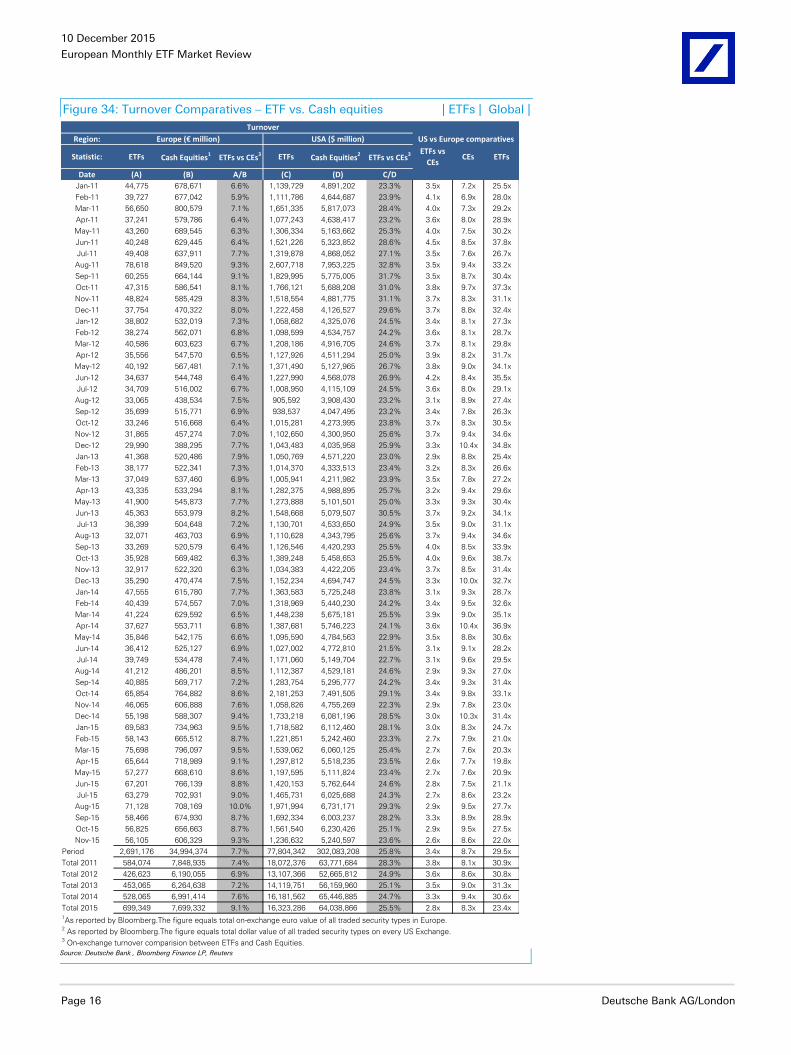
European ETF turnover1 as a percentage of the region’s cash equities
turnover2, increased to 9.3% (from 8.7% in Oct’15) as of the end of
November 2015. The equivalent number for the US market decreased to
23.6% over the same period (from 25.1% in Oct’15).
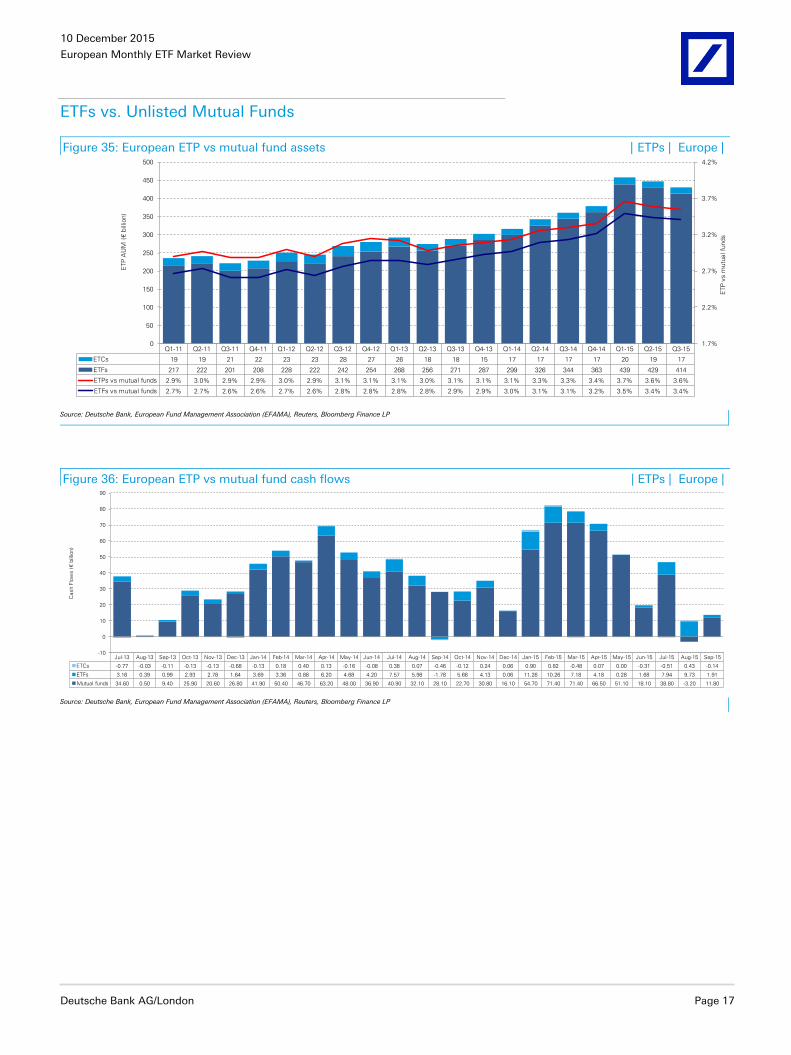
European ETFs comprised 3.4% of the continent’s mutual fund industry as
of September 2015. European domiciled ETFs registered inflows of
+€1.9bn through September 2015, while UCITS mutual funds registered
inflows totalling +€11.8bn in the same period, according to mutual fund
industry data published by the European Fund and Asset Management
Association (EFAMA).
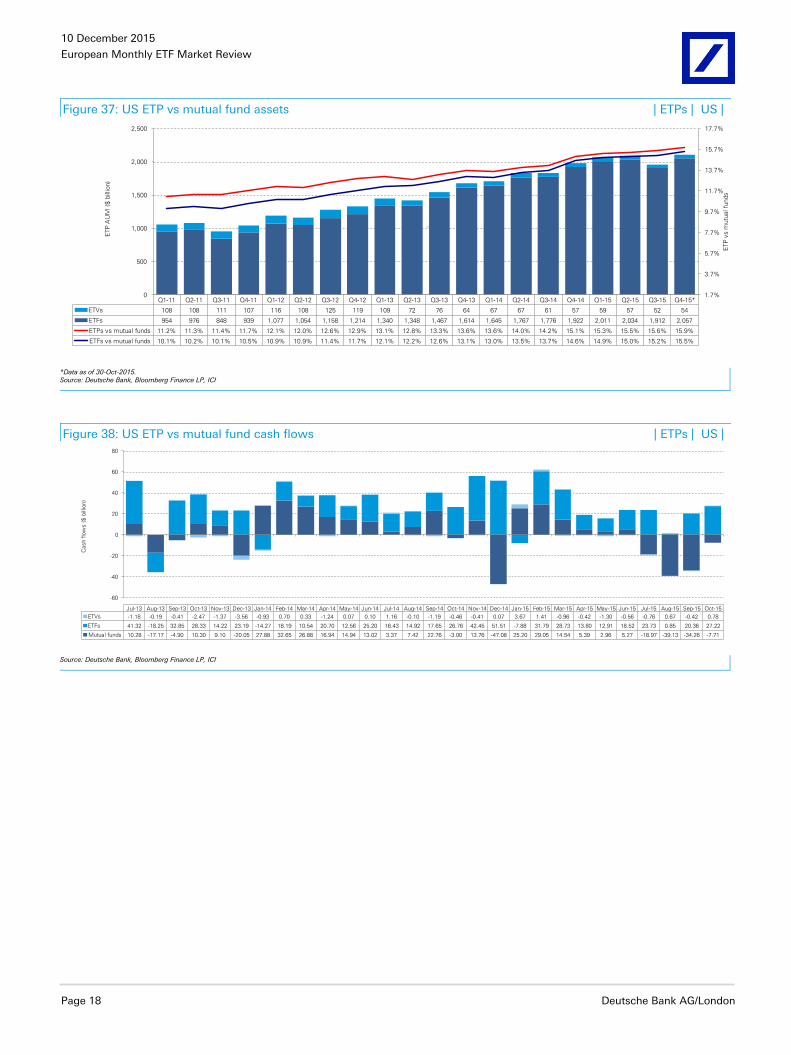
US ETFs comprised 15.5% of the mutual fund industry as of the end of
Oct’15. US domiciled ETFs registered inflows of +$27.2bn in Oct’15, while
US mutual funds experienced outflows of -$7.7bn over the same period,
according to mutual fund industry data published by the Investment
Company Institute (ICI).
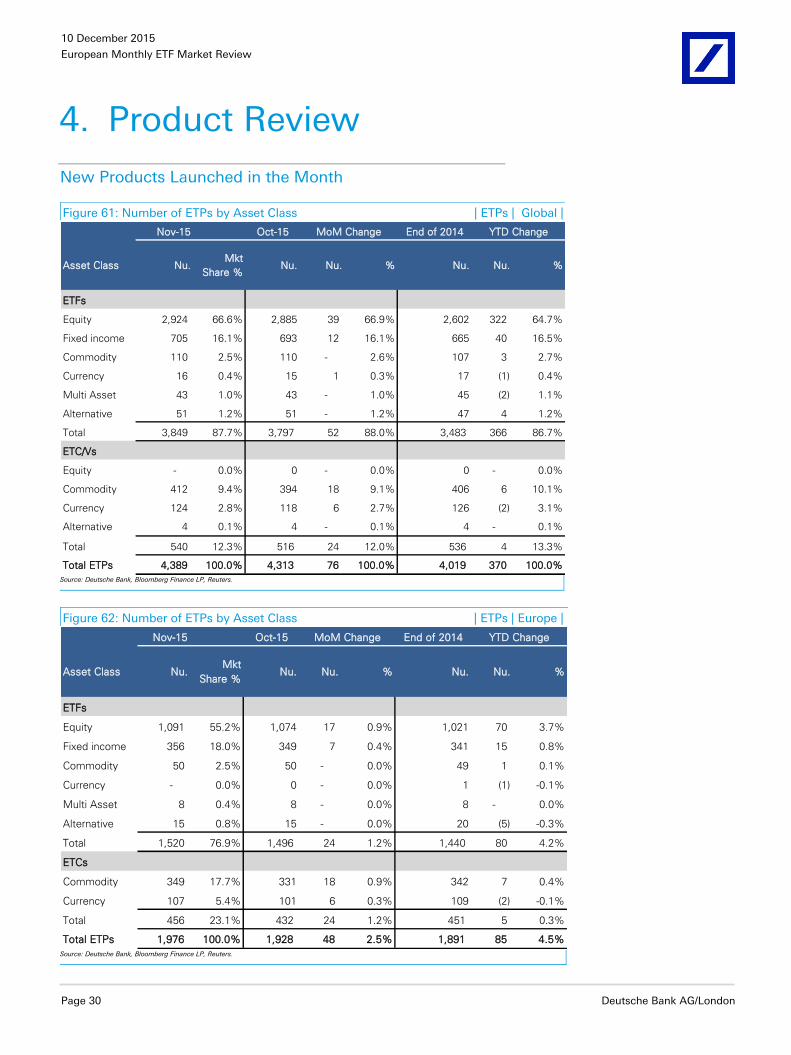
Product Launch Activity
ETP launch calendar in November: Busy month with 48 new launches
The European ETP industry registered 48 new products launches during
November including 24 ETFs and 24 ETCs.
ETF launches:
Equity
BMO Global Asset Management, a Canadian Bank debut into the European
ETF market by launching five equity ETFs on the London Stock Exchange.
Out of these five dividend ETFs, three ETFs provide exposure to MSCI’s
UK, Europe ex-UK and USA Select Quality Yields Indices. Other two ETFs
provide GBP hedged exposure to MSCI’s USA and Europe ex-UK Select
Quality Yields Indices.
WisdomTree launched seven equity ETFs during November. Out of these
seven ETFs, Three ETFs provides exposure to WisdomTree Europe Equity
Index, WisdomTree Japan Equity Index and WisdomTree Germany Equity
Index. Other four ETFs provide currency hedged exposure to investors
through WisdomTree Japan GBP Hedged Equity Index, WisdomTree Japan
EUR Hedged Equity Index, WisdomTree Germany USD Hedged Equity
Index and WisdomTree Europe Hedged Equity Index. These ETFs were
listed on London Stock Exchange, Deutsche Borse and Borsa Italiana.
ETF Securities listed two new equity ETFs on Borsa Italiana providing 3x
leverage (CH3L IM) and 3x short (CH3S IM) exposure to FTSE China 50
Index.
BlackRock listed one equity ETF (IUIT LN) on London Stock Exchange
tracking S&P 500 Information Technology Index.
1 On exchange turnover, excludes over the counter turnover figures as they are not currently consistently
reported across Europe. 2 Cash equities turnover represents total on-exchange euro value of all traded security types in Europe, as
reported by Bloomberg
10 December 2015
European Monthly ETF Market Review
Page 6 Deutsche Bank AG/London
ThinkCapital ETFs N.V. launched an equity ETF (TNAE NA) providing
exposure to Morningstar North America 100 Equal Weight Index. This ETF
was listed on the Euronext Amsterdam.
Commerzbank AG listed an equity (BOC1 GY) providing exposure to
Shanghai Stock Exchange 50 A Share Index. This ETF was listed on
Deutsche Borse. Fixed Income
BMO Global Asset Management also listed four Fixed income ETF during
November. The three global corporate bond ETFs and a global high yield
ETF are GBP hedged products and track the Barclays Global Corporate 1-3
Liquid Index, Barclays Global Corporate 3-7 Liquid Index, Barclays Global
Corporate 7-10 Liquid Index and Barclays Global HY Corporate Liquid
Index respectively. These ETFs were listed on the London Stock Exchange.
Sun Global Investments debut into the European ETF market by launching
one new Fixed Income ETF (CURY LN) on the London Stock Exchange
tracking the performance of ZyFin India Sovereign Owned Enterprise Bond
Index.
Source launched a Fixed Income ETF (STHS LN) on the London Stock
Exchange providing GBP hedged exposure to BofA Merrill Lynch 0-5 Yr US
HY Constrained index.
Amundi listed one Fixed Income ETF (CBBB FP) during November
providing exposure to Markit iBoxx EUR Liquid Corporates BBB Top 60
Index. This ETF was listed on the Euronext Paris.
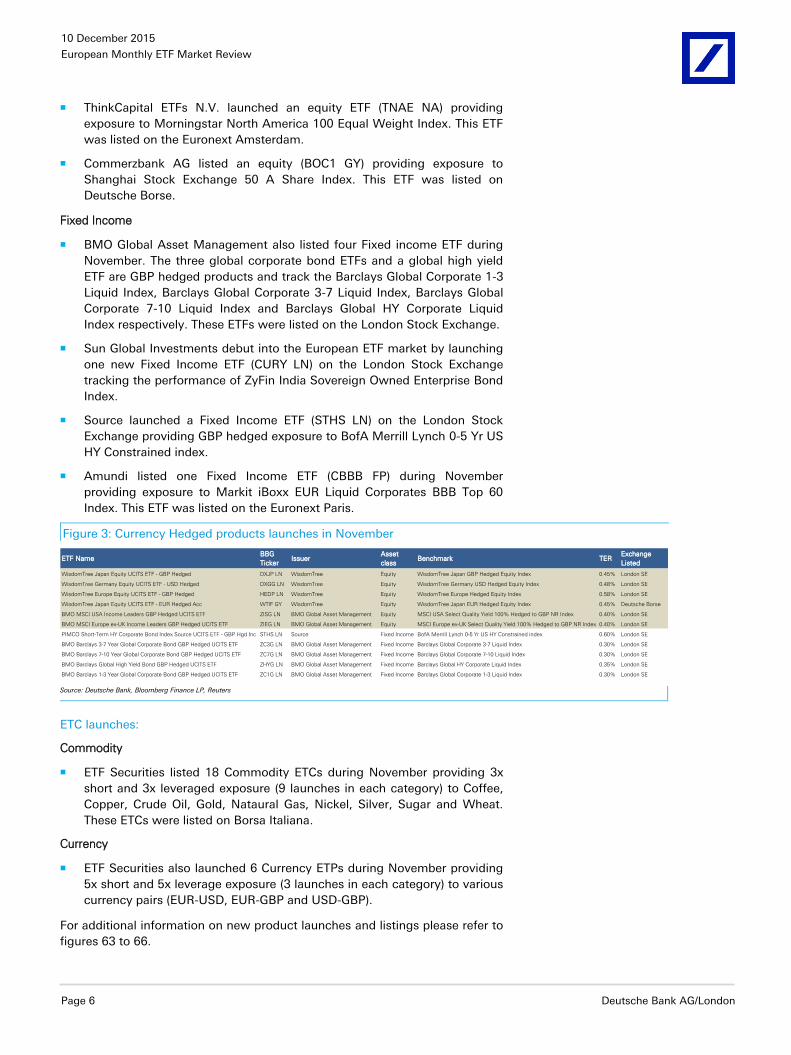
Figure 3: Currency Hedged products launches in November
ETF NameBBG
TickerIssuer
Asset
classBenchmark TER
Exchange
Listed
WisdomTree Japan Equity UCITS ETF - GBP Hedged DXJP LN WisdomTree Equity WisdomTree Japan GBP Hedged Equity Index 0.45% London SE
WisdomTree Germany Equity UCITS ETF - USD Hedged DXGG LN WisdomTree Equity WisdomTree Germany USD Hedged Equity Index 0.48% London SE
WisdomTree Europe Equity UCITS ETF - GBP Hedged HEDP LN WisdomTree Equity WisdomTree Europe Hedged Equity Index 0.58% London SE
WisdomTree Japan Equity UCITS ETF - EUR Hedged Acc WTIF GY WisdomTree Equity WisdomTree Japan EUR Hedged Equity Index 0.45% Deutsche Borse
BMO MSCI USA Income Leaders GBP Hedged UCITS ETF ZISG LN BMO Global Asset Management Equity MSCI USA Select Quality Yield 100% Hedged to GBP NR Index 0.40% London SE
BMO MSCI Europe ex-UK Income Leaders GBP Hedged UCITS ETF ZIEG LN BMO Global Asset Management Equity MSCI Europe ex-UK Select Quality Yield 100% Hedged to GBP NR Index 0.40% London SE
PIMCO Short-Term HY Corporate Bond Index Source UCITS ETF - GBP Hgd Inc STHS LN Source Fixed Income BofA Merrill Lynch 0-5 Yr US HY Constrained index 0.60% London SE
BMO Barclays 3-7 Year Global Corporate Bond GBP Hedged UCITS ETF ZC3G LN BMO Global Asset Management Fixed Income Barclays Global Corporate 3-7 Liquid Index 0.30% London SE
BMO Barclays 7-10 Year Global Corporate Bond GBP Hedged UCITS ETF ZC7G LN BMO Global Asset Management Fixed Income Barclays Global Corporate 7-10 Liquid Index 0.30% London SE
BMO Barclays Global High Yield Bond GBP Hedged UCITS ETF ZHYG LN BMO Global Asset Management Fixed Income Barclays Global HY Corporate Liquid Index 0.35% London SE
BMO Barclays 1-3 Year Global Corporate Bond GBP Hedged UCITS ETF ZC1G LN BMO Global Asset Management Fixed Income Barclays Global Corporate 1-3 Liquid Index 0.30% London SE Source: Deutsche Bank, Bloomberg Finance LP, Reuters
ETC launches:
Commodity
ETF Securities listed 18 Commodity ETCs during November providing 3x
short and 3x leveraged exposure (9 launches in each category) to Coffee,
Copper, Crude Oil, Gold, Nataural Gas, Nickel, Silver, Sugar and Wheat.
These ETCs were listed on Borsa Italiana.
Currency
ETF Securities also launched 6 Currency ETPs during November providing
5x short and 5x leverage exposure (3 launches in each category) to various
currency pairs (EUR-USD, EUR-GBP and USD-GBP). For additional information on new product launches and listings please refer to
figures 63 to 66.
10 December 2015
European Monthly ETF Market Review
Deutsche Bank AG/London Page 7
Other regions’ cash flow summary
US: Equities took the lead with strong monthly inflows
US domiciled ETPs recorded inflows of +$26bn (+$28bn in Oct’15) in
November taking YTD flows close to +$200bn. Equity ETFs took the lead with
+$25.1bn (+$15.8bn in Oct’15) of positive flows while Fixed Income ETFs took
a pause with inflows of +$0.3bn. Commodity ETPs reversed previous month’s
trend and experienced outflows of -$0.2bn (+$0.5bn in Oct’15).
Within equities, the following segments and sub-segments saw significant
activity:
Segments: Size (+$9.4bn), Developed Markets (+$5.1bn), Style (+$4.6bn),
Sector (+$3.2bn), Strategy (+$2.3bn) and Emerging Markets (-$0.8bn).
Sub-segments: Large Cap (+$5.7bn), DM broad (+$3.8bn), Small Cap
(+$3.1bn), Growth (+$3bn), Quantitative (+$1.7bn) and Germany (-$0.5bn).
Within fixed income, major inflows were recorded by ETFs benchmarked to
broad bonds indices (+$3.5bn) which were offset by outflows into sovereign
bonds (-$4.3bn). Among commodity ETPs, crude oil based ETPs registered
inflows of +$1.1bn while gold based ETPs saw outflows of -$1.4bn during
November’15.
Asia: YTD flows at record high level despite outflows in November
Asia-Pacific ETPs experienced monthly outflows of -$3.7bn in November
(+$1bn in Oct’15) bringing YTD total to +$37.4bn. With this, monthly flows
average for 2015 stands at +$3.4bn. Equity ETFs experienced outflows of -
$3bn, followed by fixed income ETFs with -$0.9bn outflows over the last
month.
Within equity, China, leveraged long strategy, Japan and South Korea ETFs
saw significant outflows last month recording -$1.7bn, -$1.2bn, -$0.5bn and -
$0.4bn worth of redemptions. On YTD basis, Japan and China focused ETFs
saw significant activity recording inflows of +$26.9bn and outflows of -
$12.9bn respectively.
This year, fixed income ETF flow contribution has been notable (+$11.1bn
YTD). This is primarily from money market ETFs which have recorded
+$10.3bn in YTD flows, although experiencing outflows for last two months (-
$0.9bn in Oct and -$1.3bn in Nov). Flow activity with commodity ETPs
remained negligible over the last month.
Commodity ETPs have gathered +$1.5bn in new money so far this year.
Among these, crude oil and gold ETPs received inflows of +$1bn and +$0.3bn
respectively.
10 December 2015
European Monthly ETF Market Review
Page 8 Deutsche Bank AG/London
1. Investment Trends3
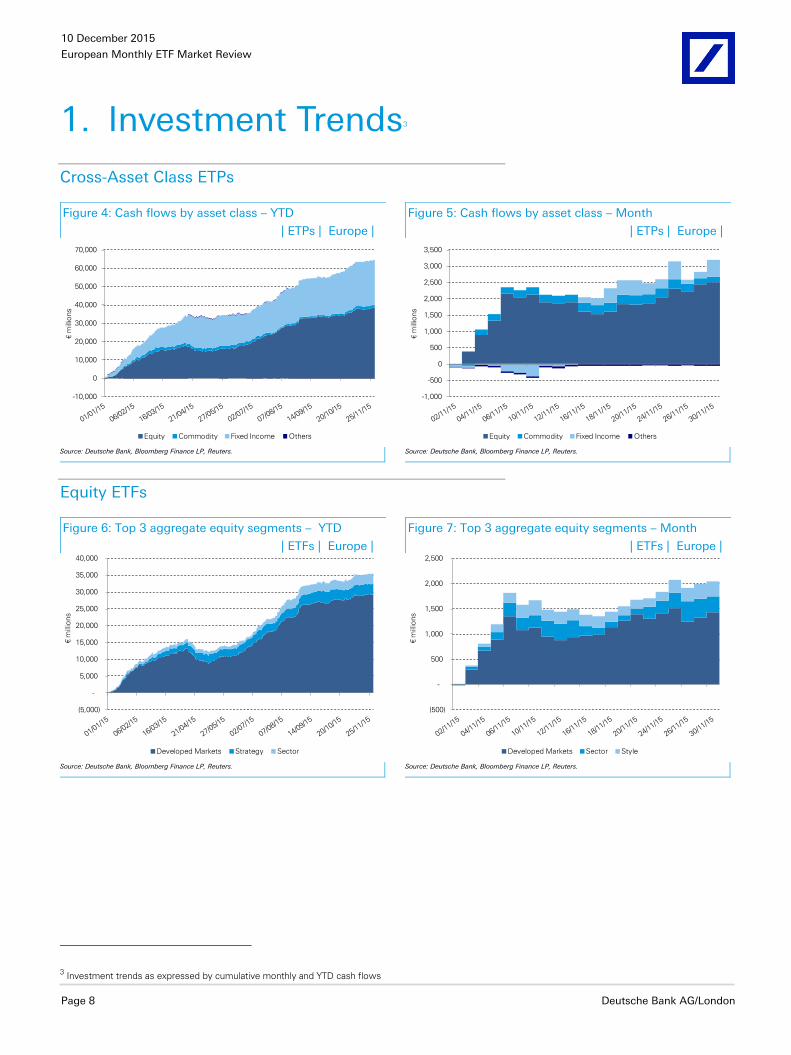
Cross-Asset Class ETPs
Figure 4: Cash flows by asset class – YTD
| ETPs | Europe |
Figure 5: Cash flows by asset class – Month
| ETPs | Europe |
-10,000
0
10,000
20,000
30,000
40,000
50,000
60,000
70,000
€m
illio
ns
Equity Commodity Fixed Income Others
-1,000
-500
0
500
1,000
1,500
2,000
2,500
3,000
3,500
€m
illio
ns
Equity Commodity Fixed Income Others
Source: Deutsche Bank, Bloomberg Finance LP, Reuters.
Source: Deutsche Bank, Bloomberg Finance LP, Reuters.
Equity ETFs
Figure 6: Top 3 aggregate equity segments – YTD
| ETFs | Europe |
Figure 7: Top 3 aggregate equity segments – Month
| ETFs | Europe |
(5,000)
-
5,000
10,000
15,000
20,000
25,000
30,000
35,000
40,000
€m
illio
ns
Developed Markets Strategy Sector
(500)
-
500
1,000
1,500
2,000
2,500
€m
illio
ns
Developed Markets Sector Style
Source: Deutsche Bank, Bloomberg Finance LP, Reuters.
Source: Deutsche Bank, Bloomberg Finance LP, Reuters.
3 Investment trends as expressed by cumulative monthly and YTD cash flows
10 December 2015
European Monthly ETF Market Review
Deutsche Bank AG/London Page 9
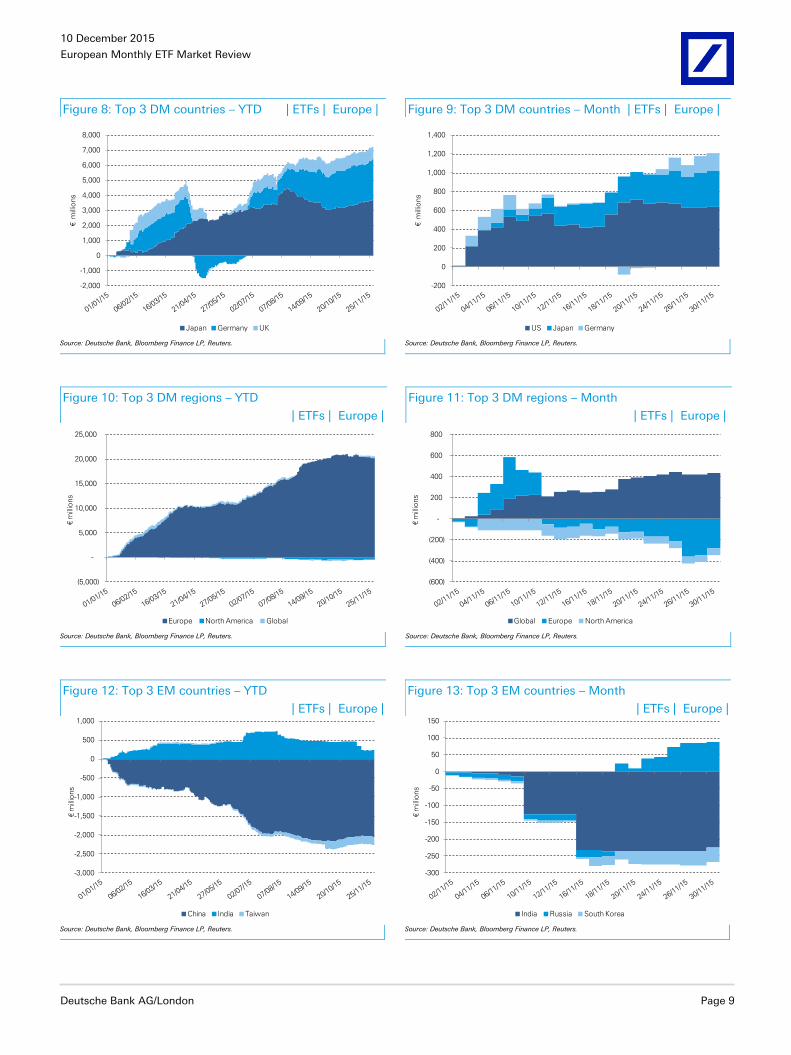
Figure 8: Top 3 DM countries – YTD | ETFs | Europe | Figure 9: Top 3 DM countries – Month | ETFs | Europe |
-2,000
-1,000
0
1,000
2,000
3,000
4,000
5,000
6,000
7,000
8,000
€m
illio
ns
Japan Germany UK
-200
0
200
400
600
800
1,000
1,200
1,400
€m
illio
ns
US Japan Germany
Source: Deutsche Bank, Bloomberg Finance LP, Reuters.
Source: Deutsche Bank, Bloomberg Finance LP, Reuters.
Figure 10: Top 3 DM regions – YTD
| ETFs | Europe |
Figure 11: Top 3 DM regions – Month
| ETFs | Europe |
(5,000)
-
5,000
10,000
15,000
20,000
25,000
€m
illio
ns
Europe North America Global
(600)
(400)
(200)
-
200
400
600
800
€m
illio
ns
Global Europe North America
Source: Deutsche Bank, Bloomberg Finance LP, Reuters.
Source: Deutsche Bank, Bloomberg Finance LP, Reuters.
Figure 12: Top 3 EM countries – YTD
| ETFs | Europe |
Figure 13: Top 3 EM countries – Month
| ETFs | Europe |
-3,000
-2,500
-2,000
-1,500
-1,000
-500
0
500
1,000
€m
illio
ns
China India Taiwan
-300
-250
-200
-150
-100
-50
0
50
100
150
€m
illio
ns
India Russia South Korea
Source: Deutsche Bank, Bloomberg Finance LP, Reuters.
Source: Deutsche Bank, Bloomberg Finance LP, Reuters.
10 December 2015
European Monthly ETF Market Review
Page 10 Deutsche Bank AG/London
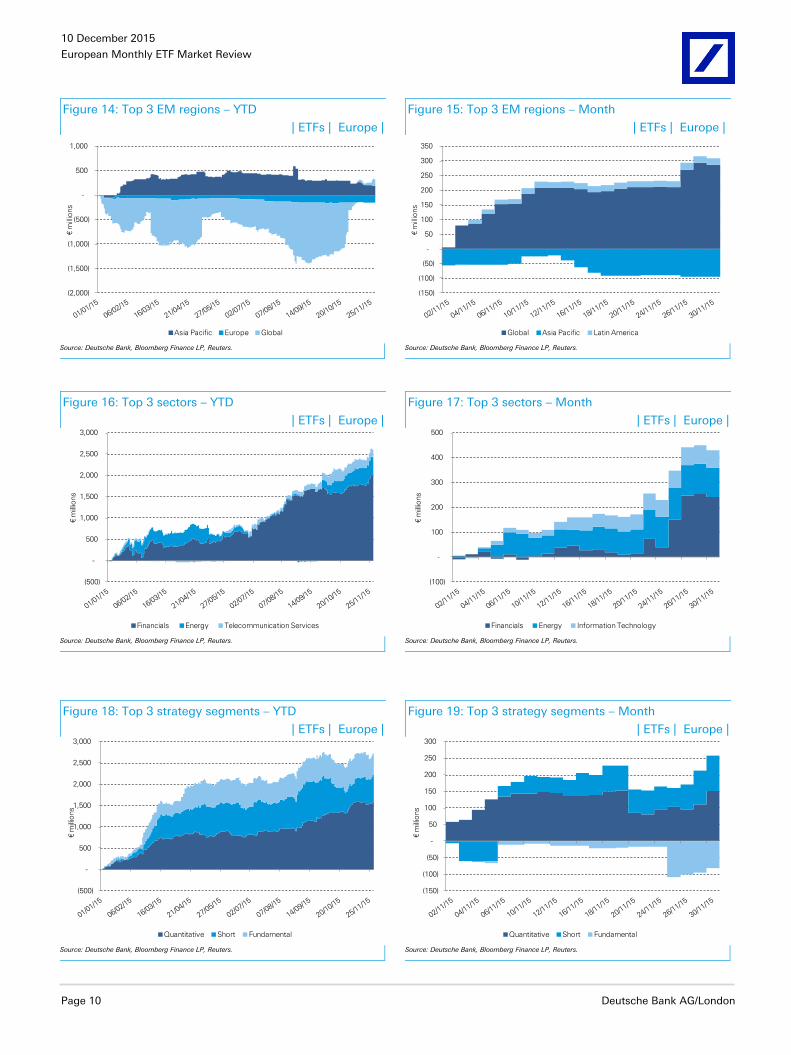
Figure 14: Top 3 EM regions – YTD
| ETFs | Europe |
Figure 15: Top 3 EM regions – Month
| ETFs | Europe |
(2,000)
(1,500)
(1,000)
(500)
-
500
1,000
€m
illio
ns
Asia Pacific Europe Global
(150)
(100)
(50)
-
50
100
150
200
250
300
350
€m
illio
ns
Global Asia Pacific Latin America
Source: Deutsche Bank, Bloomberg Finance LP, Reuters.
Source: Deutsche Bank, Bloomberg Finance LP, Reuters.
Figure 16: Top 3 sectors – YTD
| ETFs | Europe |
Figure 17: Top 3 sectors – Month
| ETFs | Europe |
(500)
-
500
1,000
1,500
2,000
2,500
3,000
€m
illio
ns
Financials Energy Telecommunication Services
(100)
-
100
200
300
400
500
€m
illio
ns
Financials Energy Information Technology
Source: Deutsche Bank, Bloomberg Finance LP, Reuters.
Source: Deutsche Bank, Bloomberg Finance LP, Reuters.
Figure 18: Top 3 strategy segments – YTD
| ETFs | Europe |
Figure 19: Top 3 strategy segments – Month
| ETFs | Europe |
(500)
-
500
1,000
1,500
2,000
2,500
3,000
€m
illio
ns
Quantitative Short Fundamental
(150)
(100)
(50)
-
50
100
150
200
250
300
€m
illio
ns
Quantitative Short Fundamental
Source: Deutsche Bank, Bloomberg Finance LP, Reuters.
Source: Deutsche Bank, Bloomberg Finance LP, Reuters.
10 December 2015
European Monthly ETF Market Review
Deutsche Bank AG/London Page 11
Fixed Income ETFs
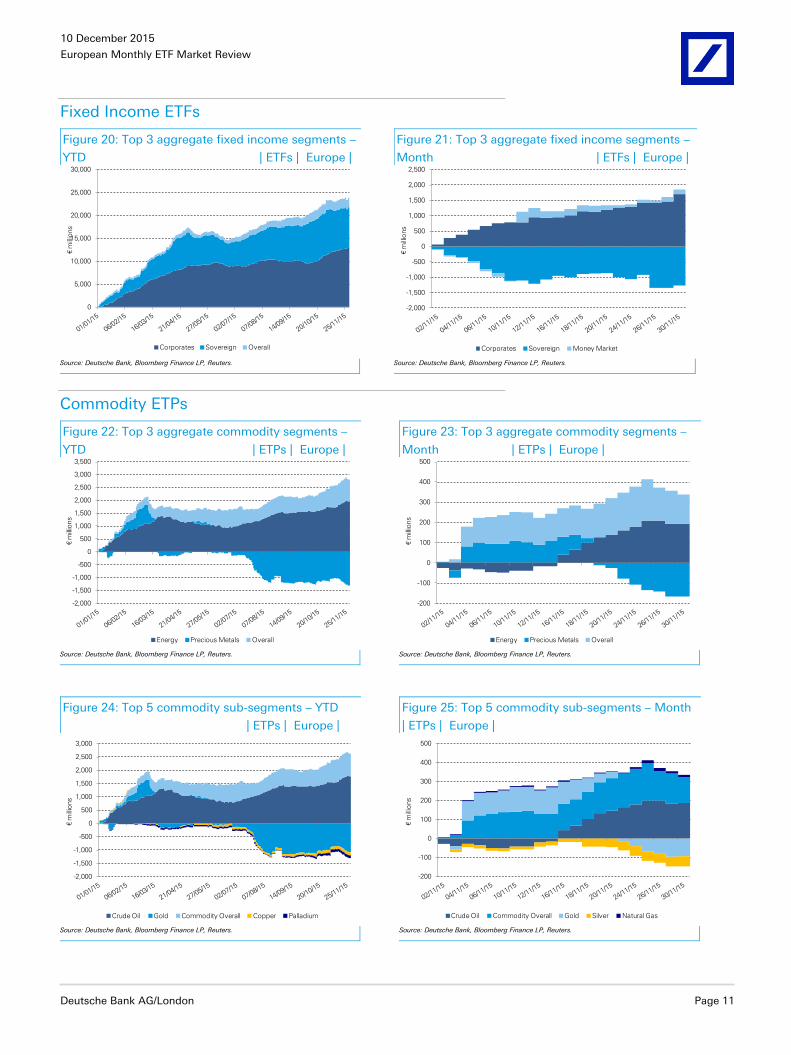
Figure 20: Top 3 aggregate fixed income segments –
YTD | ETFs | Europe |
Figure 21: Top 3 aggregate fixed income segments –
Month | ETFs | Europe |
0
5,000
10,000
15,000
20,000
25,000
30,000
€m
illio
ns
Corporates Sovereign Overall
-2,000
-1,500
-1,000
-500
0
500
1,000
1,500
2,000
2,500
€m
illio
ns
Corporates Sovereign Money Market
Source: Deutsche Bank, Bloomberg Finance LP, Reuters.
Source: Deutsche Bank, Bloomberg Finance LP, Reuters.
Commodity ETPs
Figure 22: Top 3 aggregate commodity segments –
YTD | ETPs | Europe |
Figure 23: Top 3 aggregate commodity segments –
Month | ETPs | Europe |
-2,000
-1,500
-1,000
-500
0
500
1,000
1,500
2,000
2,500
3,000
3,500
€m
illio
ns
Energy Precious Metals Overall
-200
-100
0
100
200
300
400
500
€m
illio
ns
Energy Precious Metals Overall
Source: Deutsche Bank, Bloomberg Finance LP, Reuters.
Source: Deutsche Bank, Bloomberg Finance LP, Reuters.
Figure 24: Top 5 commodity sub-segments – YTD
| ETPs | Europe |
Figure 25: Top 5 commodity sub-segments – Month
| ETPs | Europe |
-2,000
-1,500
-1,000
-500
0
500
1,000
1,500
2,000
2,500
3,000
€m
illio
ns
Crude Oil Gold Commodity Overall Copper Palladium
-200
-100
0
100
200
300
400
500
€m
illio
ns
Crude Oil Commodity Overall Gold Silver Natural Gas
Source: Deutsche Bank, Bloomberg Finance LP, Reuters.
Source: Deutsche Bank, Bloomberg Finance LP, Reuters.
10 December 2015
European Monthly ETF Market Review
Page 12 Deutsche Bank AG/London
2. Market Metrics
ETF Industry Asset Evolution
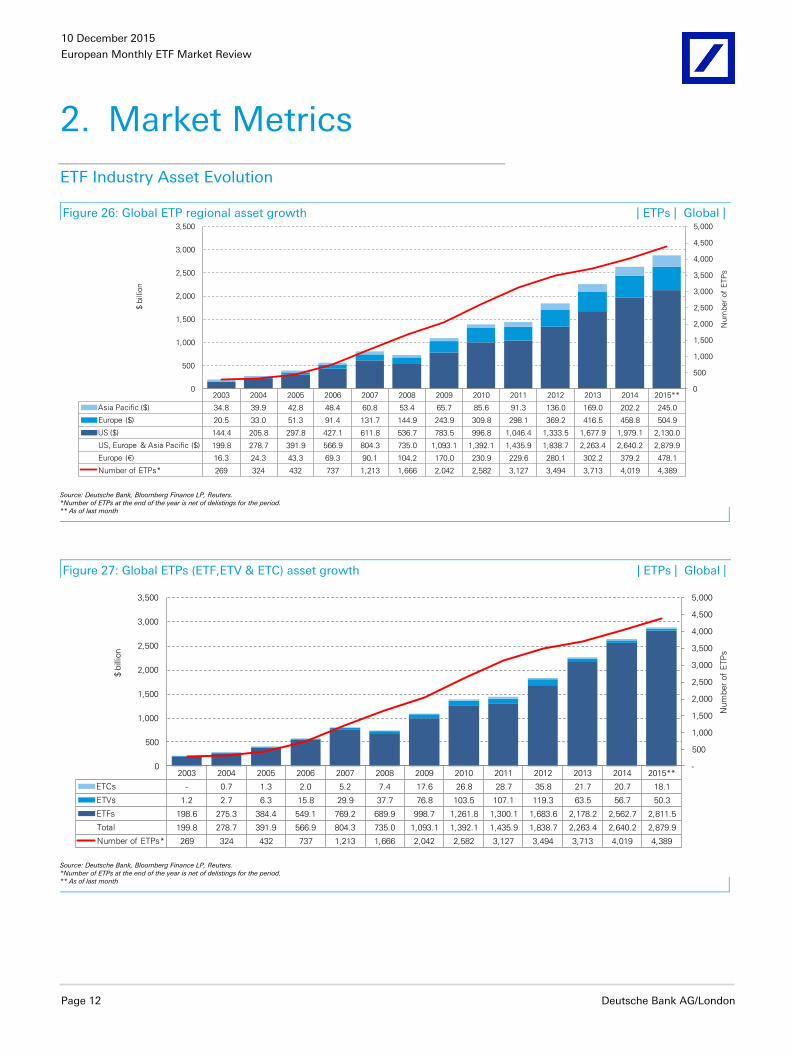
Figure 26: Global ETP regional asset growth | ETPs | Global |
2003 2004 2005 2006 2007 2008 2009 2010 2011 2012 2013 2014 2015**
Asia Pacific ($) 34.8 39.9 42.8 48.4 60.8 53.4 65.7 85.6 91.3 136.0 169.0 202.2 245.0
Europe ($) 20.5 33.0 51.3 91.4 131.7 144.9 243.9 309.8 298.1 369.2 416.5 458.8 504.9
US ($) 144.4 205.8 297.8 427.1 611.8 536.7 783.5 996.8 1,046.4 1,333.5 1,677.9 1,979.1 2,130.0
US, Europe & Asia Pacific ($) 199.8 278.7 391.9 566.9 804.3 735.0 1,093.1 1,392.1 1,435.9 1,838.7 2,263.4 2,640.2 2,879.9
Europe (€) 16.3 24.3 43.3 69.3 90.1 104.2 170.0 230.9 229.6 280.1 302.2 379.2 478.1
Number of ETPs* 269 324 432 737 1,213 1,666 2,042 2,582 3,127 3,494 3,713 4,019 4,389
0
500
1,000
1,500
2,000
2,500
3,000
3,500
4,000
4,500
5,000
0
500
1,000
1,500
2,000
2,500
3,000
3,500
Num
ber
of
ETP
s
$ b
illion
Source: Deutsche Bank, Bloomberg Finance LP, Reuters. *Number of ETPs at the end of the year is net of delistings for the period. ** As of last month
Figure 27: Global ETPs (ETF,ETV & ETC) asset growth | ETPs | Global |
2003 2004 2005 2006 2007 2008 2009 2010 2011 2012 2013 2014 2015**
ETCs - 0.7 1.3 2.0 5.2 7.4 17.6 26.8 28.7 35.8 21.7 20.7 18.1
ETVs 1.2 2.7 6.3 15.8 29.9 37.7 76.8 103.5 107.1 119.3 63.5 56.7 50.3
ETFs 198.6 275.3 384.4 549.1 769.2 689.9 998.7 1,261.8 1,300.1 1,683.6 2,178.2 2,562.7 2,811.5
Total 199.8 278.7 391.9 566.9 804.3 735.0 1,093.1 1,392.1 1,435.9 1,838.7 2,263.4 2,640.2 2,879.9
Number of ETPs* 269 324 432 737 1,213 1,666 2,042 2,582 3,127 3,494 3,713 4,019 4,389
-
500
1,000
1,500
2,000
2,500
3,000
3,500
4,000
4,500
5,000
0
500
1,000
1,500
2,000
2,500
3,000
3,500
Num
ber
of
ETP
s
$ b
illion
Source: Deutsche Bank, Bloomberg Finance LP, Reuters. *Number of ETPs at the end of the year is net of delistings for the period. ** As of last month
10 December 2015
European Monthly ETF Market Review
Deutsche Bank AG/London Page 13
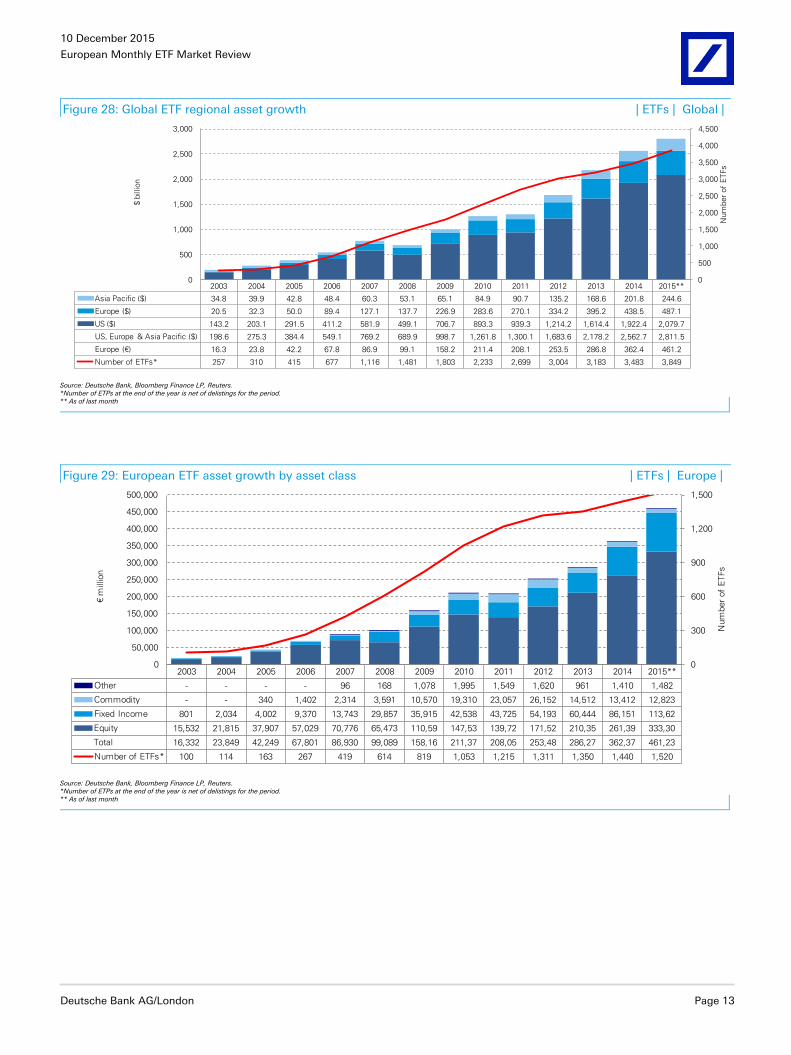
Figure 28: Global ETF regional asset growth | ETFs | Global |
2003 2004 2005 2006 2007 2008 2009 2010 2011 2012 2013 2014 2015**
Asia Pacific ($) 34.8 39.9 42.8 48.4 60.3 53.1 65.1 84.9 90.7 135.2 168.6 201.8 244.6
Europe ($) 20.5 32.3 50.0 89.4 127.1 137.7 226.9 283.6 270.1 334.2 395.2 438.5 487.1
US ($) 143.2 203.1 291.5 411.2 581.9 499.1 706.7 893.3 939.3 1,214.2 1,614.4 1,922.4 2,079.7
US, Europe & Asia Pacific ($) 198.6 275.3 384.4 549.1 769.2 689.9 998.7 1,261.8 1,300.1 1,683.6 2,178.2 2,562.7 2,811.5
Europe (€) 16.3 23.8 42.2 67.8 86.9 99.1 158.2 211.4 208.1 253.5 286.8 362.4 461.2
Number of ETFs* 257 310 415 677 1,116 1,481 1,803 2,233 2,699 3,004 3,183 3,483 3,849
0
500
1,000
1,500
2,000
2,500
3,000
3,500
4,000
4,500
0
500
1,000
1,500
2,000
2,500
3,000
Num
ber
of
ETFs
$ b
illion
Source: Deutsche Bank, Bloomberg Finance LP, Reuters. *Number of ETPs at the end of the year is net of delistings for the period. ** As of last month
Figure 29: European ETF asset growth by asset class | ETFs | Europe |
2003 2004 2005 2006 2007 2008 2009 2010 2011 2012 2013 2014 2015**
Other - - - - 96 168 1,078 1,995 1,549 1,620 961 1,410 1,482
Commodity - - 340 1,402 2,314 3,591 10,570 19,310 23,057 26,152 14,512 13,412 12,823
Fixed Income 801 2,034 4,002 9,370 13,743 29,857 35,915 42,538 43,725 54,193 60,444 86,151 113,62
Equity 15,532 21,815 37,907 57,029 70,776 65,473 110,59 147,53 139,72 171,52 210,35 261,39 333,30
Total 16,332 23,849 42,249 67,801 86,930 99,089 158,16 211,37 208,05 253,48 286,27 362,37 461,23
Number of ETFs* 100 114 163 267 419 614 819 1,053 1,215 1,311 1,350 1,440 1,520
0
300
600
900
1,200
1,500
0
50,000
100,000
150,000
200,000
250,000
300,000
350,000
400,000
450,000
500,000
Num
ber
of
ETFs
€m
illion
Source: Deutsche Bank, Bloomberg Finance LP, Reuters. *Number of ETPs at the end of the year is net of delistings for the period. ** As of last month
10 December 2015
European Monthly ETF Market Review
Page 14 Deutsche Bank AG/London
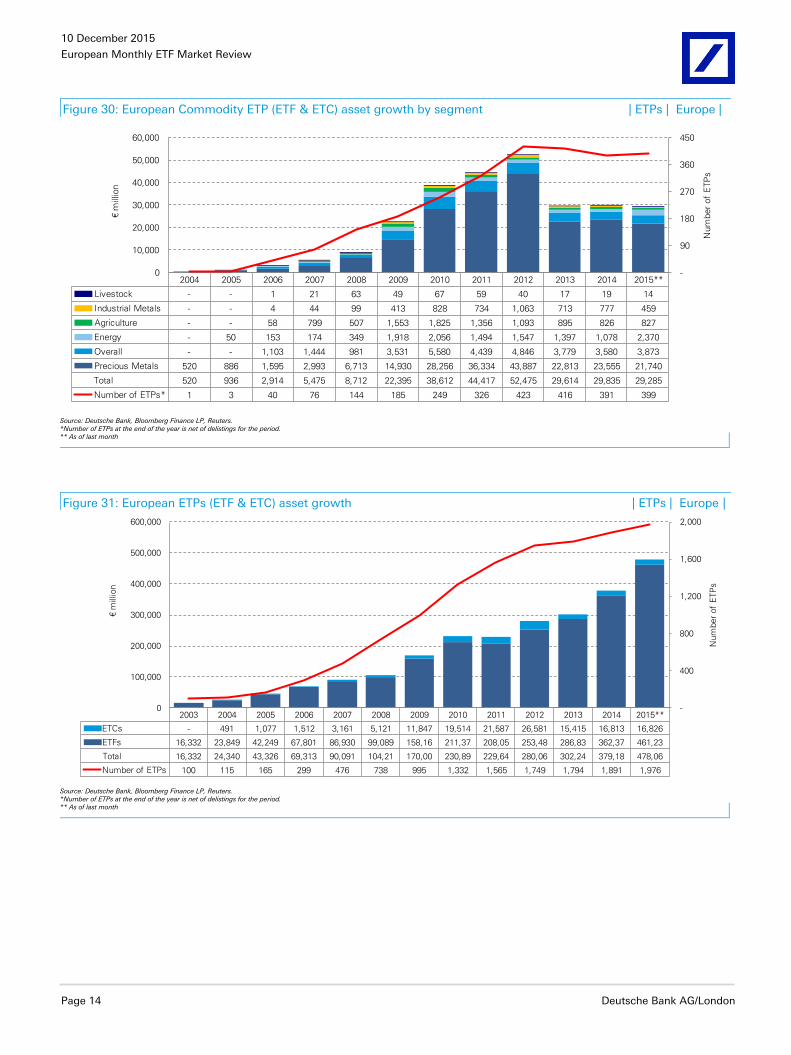
Figure 30: European Commodity ETP (ETF & ETC) asset growth by segment | ETPs | Europe |
2004 2005 2006 2007 2008 2009 2010 2011 2012 2013 2014 2015**
Livestock - - 1 21 63 49 67 59 40 17 19 14
Industrial Metals - - 4 44 99 413 828 734 1,063 713 777 459
Agriculture - - 58 799 507 1,553 1,825 1,356 1,093 895 826 827
Energy - 50 153 174 349 1,918 2,056 1,494 1,547 1,397 1,078 2,370
Overall - - 1,103 1,444 981 3,531 5,580 4,439 4,846 3,779 3,580 3,873
Precious Metals 520 886 1,595 2,993 6,713 14,930 28,256 36,334 43,887 22,813 23,555 21,740
Total 520 936 2,914 5,475 8,712 22,395 38,612 44,417 52,475 29,614 29,835 29,285
Number of ETPs* 1 3 40 76 144 185 249 326 423 416 391 399
-
90
180
270
360
450
0
10,000
20,000
30,000
40,000
50,000
60,000
Num
ber
of
ETP
s
€m
illion
Source: Deutsche Bank, Bloomberg Finance LP, Reuters. *Number of ETPs at the end of the year is net of delistings for the period. ** As of last month
Figure 31: European ETPs (ETF & ETC) asset growth | ETPs | Europe |
2003 2004 2005 2006 2007 2008 2009 2010 2011 2012 2013 2014 2015**
ETCs - 491 1,077 1,512 3,161 5,121 11,847 19,514 21,587 26,581 15,415 16,813 16,826
ETFs 16,332 23,849 42,249 67,801 86,930 99,089 158,16 211,37 208,05 253,48 286,83 362,37 461,23
Total 16,332 24,340 43,326 69,313 90,091 104,21 170,00 230,89 229,64 280,06 302,24 379,18 478,06
Number of ETPs 100 115 165 299 476 738 995 1,332 1,565 1,749 1,794 1,891 1,976
-
400
800
1,200
1,600
2,000
0
100,000
200,000
300,000
400,000
500,000
600,000
Num
ber
of
ETP
s
€m
illion
Source: Deutsche Bank, Bloomberg Finance LP, Reuters. *Number of ETPs at the end of the year is net of delistings for the period. ** As of last month
10 December 2015
European Monthly ETF Market Review
Deutsche Bank AG/London Page 15
ETFs vs. Cash Equities
Figure 32: ETFs vs. cash equities turnover – US market | ETFs | US |
0.0%
5.0%
10.0%
15.0%
20.0%
25.0%
30.0%
35.0%
0
1,000
2,000
3,000
4,000
5,000
6,000
7,000
8,000
9,000
ETFs v
s c
ash e
quitie
s
$ b
illion
Cash Equities ETF Turnover ETFs vs Cash Equities (right axis) Source: Deutsche Bank , Bloomberg Finance LP, Reuters
Figure 33: ETFs vs. cash equities turnover – European market | ETFs | Europe |
0.0%
2.0%
4.0%
6.0%
8.0%
10.0%
12.0%
0
100
200
300
400
500
600
700
800
900
ETFs v
s c
ash e
quitie
s
€billion
Cash Equities ETF Turnover ETFs vs Cash Equities (right axis)
Source: Deutsche Bank , Bloomberg Finance LP, Reuters
10 December 2015
European Monthly ETF Market Review
Page 16 Deutsche Bank AG/London
Figure 34: Turnover Comparatives – ETF vs. Cash equities | ETFs | Global |
Region:
Statistic: ETFs Cash Equities1 ETFs vs CEs3 ETFs Cash Equities2 ETFs vs CEs3 ETFs vs
CEsCEs ETFs
Date (A) (B) A/B (C) (D) C/D
Jan-11 44,775 678,671 6.6% 1,139,729 4,891,202 23.3% 3.5x 7.2x 25.5x
Feb-11 39,727 677,042 5.9% 1,111,786 4,644,687 23.9% 4.1x 6.9x 28.0x
Mar-11 56,650 800,579 7.1% 1,651,335 5,817,073 28.4% 4.0x 7.3x 29.2x
Apr-11 37,241 579,786 6.4% 1,077,243 4,638,417 23.2% 3.6x 8.0x 28.9x
May-11 43,260 689,545 6.3% 1,306,334 5,163,662 25.3% 4.0x 7.5x 30.2x
Jun-11 40,248 629,445 6.4% 1,521,226 5,323,852 28.6% 4.5x 8.5x 37.8x
Jul-11 49,408 637,911 7.7% 1,319,878 4,868,052 27.1% 3.5x 7.6x 26.7x
Aug-11 78,618 849,520 9.3% 2,607,718 7,953,225 32.8% 3.5x 9.4x 33.2x
Sep-11 60,255 664,144 9.1% 1,829,995 5,775,005 31.7% 3.5x 8.7x 30.4x
Oct-11 47,315 586,541 8.1% 1,766,121 5,688,208 31.0% 3.8x 9.7x 37.3x
Nov-11 48,824 585,429 8.3% 1,518,554 4,881,775 31.1% 3.7x 8.3x 31.1x
Dec-11 37,754 470,322 8.0% 1,222,458 4,126,527 29.6% 3.7x 8.8x 32.4x
Jan-12 38,802 532,019 7.3% 1,058,682 4,325,076 24.5% 3.4x 8.1x 27.3x
Feb-12 38,274 562,071 6.8% 1,098,599 4,534,757 24.2% 3.6x 8.1x 28.7x
Mar-12 40,586 603,623 6.7% 1,208,186 4,916,705 24.6% 3.7x 8.1x 29.8x
Apr-12 35,556 547,570 6.5% 1,127,926 4,511,294 25.0% 3.9x 8.2x 31.7x
May-12 40,192 567,481 7.1% 1,371,490 5,127,965 26.7% 3.8x 9.0x 34.1x
Jun-12 34,637 544,748 6.4% 1,227,990 4,568,078 26.9% 4.2x 8.4x 35.5x
Jul-12 34,709 516,002 6.7% 1,008,950 4,115,109 24.5% 3.6x 8.0x 29.1x
Aug-12 33,065 438,534 7.5% 905,592 3,908,430 23.2% 3.1x 8.9x 27.4x
Sep-12 35,699 515,771 6.9% 938,537 4,047,495 23.2% 3.4x 7.8x 26.3x
Oct-12 33,246 516,668 6.4% 1,015,281 4,273,995 23.8% 3.7x 8.3x 30.5x
Nov-12 31,865 457,274 7.0% 1,102,650 4,300,950 25.6% 3.7x 9.4x 34.6x
Dec-12 29,990 388,295 7.7% 1,043,483 4,035,958 25.9% 3.3x 10.4x 34.8x
Jan-13 41,368 520,486 7.9% 1,050,769 4,571,220 23.0% 2.9x 8.8x 25.4x
Feb-13 38,177 522,341 7.3% 1,014,370 4,333,513 23.4% 3.2x 8.3x 26.6x
Mar-13 37,049 537,460 6.9% 1,005,941 4,211,982 23.9% 3.5x 7.8x 27.2x
Apr-13 43,335 533,294 8.1% 1,282,375 4,988,895 25.7% 3.2x 9.4x 29.6x
May-13 41,900 545,873 7.7% 1,273,888 5,101,501 25.0% 3.3x 9.3x 30.4x
Jun-13 45,363 553,979 8.2% 1,548,668 5,079,507 30.5% 3.7x 9.2x 34.1x
Jul-13 36,399 504,648 7.2% 1,130,701 4,533,650 24.9% 3.5x 9.0x 31.1x
Aug-13 32,071 463,703 6.9% 1,110,628 4,343,795 25.6% 3.7x 9.4x 34.6x
Sep-13 33,269 520,579 6.4% 1,126,546 4,420,293 25.5% 4.0x 8.5x 33.9x
Oct-13 35,928 569,482 6.3% 1,389,248 5,458,653 25.5% 4.0x 9.6x 38.7x
Nov-13 32,917 522,320 6.3% 1,034,383 4,422,205 23.4% 3.7x 8.5x 31.4x
Dec-13 35,290 470,474 7.5% 1,152,234 4,694,747 24.5% 3.3x 10.0x 32.7x
Jan-14 47,555 615,780 7.7% 1,363,583 5,725,248 23.8% 3.1x 9.3x 28.7x
Feb-14 40,439 574,557 7.0% 1,318,969 5,440,230 24.2% 3.4x 9.5x 32.6x
Mar-14 41,224 629,592 6.5% 1,448,238 5,675,181 25.5% 3.9x 9.0x 35.1x
Apr-14 37,627 553,711 6.8% 1,387,681 5,746,223 24.1% 3.6x 10.4x 36.9x
May-14 35,846 542,175 6.6% 1,095,590 4,784,563 22.9% 3.5x 8.8x 30.6x
Jun-14 36,412 525,127 6.9% 1,027,002 4,772,810 21.5% 3.1x 9.1x 28.2x
Jul-14 39,749 534,478 7.4% 1,171,060 5,149,704 22.7% 3.1x 9.6x 29.5x
Aug-14 41,212 486,201 8.5% 1,112,387 4,529,181 24.6% 2.9x 9.3x 27.0x
Sep-14 40,885 569,717 7.2% 1,283,754 5,295,777 24.2% 3.4x 9.3x 31.4x
Oct-14 65,854 764,882 8.6% 2,181,253 7,491,505 29.1% 3.4x 9.8x 33.1x
Nov-14 46,065 606,888 7.6% 1,058,826 4,755,269 22.3% 2.9x 7.8x 23.0x
Dec-14 55,198 588,307 9.4% 1,733,218 6,081,196 28.5% 3.0x 10.3x 31.4x
Jan-15 69,583 734,963 9.5% 1,718,582 6,112,460 28.1% 3.0x 8.3x 24.7x
Feb-15 58,143 665,512 8.7% 1,221,851 5,242,460 23.3% 2.7x 7.9x 21.0x
Mar-15 75,698 796,097 9.5% 1,539,062 6,060,125 25.4% 2.7x 7.6x 20.3x
Apr-15 65,644 718,989 9.1% 1,297,812 5,518,235 23.5% 2.6x 7.7x 19.8x
May-15 57,277 668,610 8.6% 1,197,595 5,111,824 23.4% 2.7x 7.6x 20.9x
Jun-15 67,201 766,139 8.8% 1,420,153 5,762,644 24.6% 2.8x 7.5x 21.1x
Jul-15 63,279 702,931 9.0% 1,465,731 6,025,688 24.3% 2.7x 8.6x 23.2x
Aug-15 71,128 708,169 10.0% 1,971,994 6,731,171 29.3% 2.9x 9.5x 27.7x
Sep-15 58,466 674,930 8.7% 1,692,334 6,003,237 28.2% 3.3x 8.9x 28.9x
Oct-15 56,825 656,663 8.7% 1,561,540 6,230,426 25.1% 2.9x 9.5x 27.5x
Nov-15 56,105 606,329 9.3% 1,236,632 5,240,597 23.6% 2.6x 8.6x 22.0x
Period 2,691,176 34,994,374 7.7% 77,804,342 302,083,208 25.8% 3.4x 8.7x 29.5x
Total 2011 584,074 7,848,935 7.4% 18,072,376 63,771,684 28.3% 3.8x 8.1x 30.9x
Total 2012 426,623 6,190,055 6.9% 13,107,366 52,665,812 24.9% 3.6x 8.6x 30.8x
Total 2013 453,065 6,264,638 7.2% 14,119,751 56,159,960 25.1% 3.5x 9.0x 31.3x
Total 2014 528,065 6,991,414 7.6% 16,181,562 65,446,885 24.7% 3.3x 9.4x 30.6x
Total 2015 699,349 7,699,332 9.1% 16,323,286 64,038,866 25.5% 2.8x 8.3x 23.4x1As reported by Bloomberg.The figure equals total on-exchange euro value of all traded security types in Europe.
2 As reported by Bloomberg.The figure equals total dollar value of all traded security types on every US Exchange.
Europe (€ million) USA ($ million)
Turnover
US vs Europe comparatives
3 On-exchange turnover comparision between ETFs and Cash Equities.
Source: Deutsche Bank , Bloomberg Finance LP, Reuters
10 December 2015
European Monthly ETF Market Review
Deutsche Bank AG/London Page 17
ETFs vs. Unlisted Mutual Funds
Figure 35: European ETP vs mutual fund assets | ETPs | Europe |
Q1-11 Q2-11 Q3-11 Q4-11 Q1-12 Q2-12 Q3-12 Q4-12 Q1-13 Q2-13 Q3-13 Q4-13 Q1-14 Q2-14 Q3-14 Q4-14 Q1-15 Q2-15 Q3-15
ETCs 19 19 21 22 23 23 28 27 26 18 18 15 17 17 17 17 20 19 17
ETFs 217 222 201 208 228 222 242 254 268 256 271 287 299 326 344 363 439 429 414
ETPs vs mutual funds 2.9% 3.0% 2.9% 2.9% 3.0% 2.9% 3.1% 3.1% 3.1% 3.0% 3.1% 3.1% 3.1% 3.3% 3.3% 3.4% 3.7% 3.6% 3.6%
ETFs vs mutual funds 2.7% 2.7% 2.6% 2.6% 2.7% 2.6% 2.8% 2.8% 2.8% 2.8% 2.9% 2.9% 3.0% 3.1% 3.1% 3.2% 3.5% 3.4% 3.4%
1.7%
2.2%
2.7%
3.2%
3.7%
4.2%
0
50
100
150
200
250
300
350
400
450
500
ETP
vs m
utu
al fu
nds
ETP
AU
M (
€billion)
Source: Deutsche Bank, European Fund Management Association (EFAMA), Reuters, Bloomberg Finance LP
Figure 36: European ETP vs mutual fund cash flows | ETPs | Europe |
Jul-13 Aug-13 Sep-13 Oct-13 Nov-13 Dec-13 Jan-14 Feb-14 Mar-14 Apr-14 May-14 Jun-14 Jul-14 Aug-14 Sep-14 Oct-14 Nov-14 Dec-14 Jan-15 Feb-15 Mar-15 Apr-15 May-15 Jun-15 Jul-15 Aug-15 Sep-15
ETCs -0.77 -0.03 -0.11 -0.13 -0.13 -0.68 -0.13 0.18 0.40 0.13 -0.16 -0.08 0.38 0.07 -0.46 -0.12 0.24 0.06 0.90 0.82 -0.48 0.07 0.00 -0.31 -0.51 0.43 -0.14
ETFs 3.16 0.39 0.99 2.93 2.78 1.64 3.69 3.36 0.88 6.20 4.68 4.20 7.57 5.98 -1.78 5.68 4.13 0.06 11.26 10.26 7.18 4.18 0.28 1.68 7.94 9.73 1.91
Mutual funds 34.60 0.50 9.40 25.90 20.60 26.80 41.90 50.40 46.70 63.20 48.00 36.90 40.90 32.10 28.10 22.70 30.80 16.10 54.70 71.40 71.40 66.50 51.10 18.10 38.80 -3.20 11.80
-10
0
10
20
30
40
50
60
70
80
90
Cash F
low
s (
€billion)
Source: Deutsche Bank, European Fund Management Association (EFAMA), Reuters, Bloomberg Finance LP
10 December 2015
European Monthly ETF Market Review
Page 18 Deutsche Bank AG/London
Figure 37: US ETP vs mutual fund assets | ETPs | US |
Q1-11 Q2-11 Q3-11 Q4-11 Q1-12 Q2-12 Q3-12 Q4-12 Q1-13 Q2-13 Q3-13 Q4-13 Q1-14 Q2-14 Q3-14 Q4-14 Q1-15 Q2-15 Q3-15 Q4-15*
ETVs 108 108 111 107 116 108 125 119 109 72 76 64 67 67 61 57 59 57 52 54
ETFs 954 976 848 939 1,077 1,054 1,158 1,214 1,340 1,348 1,467 1,614 1,645 1,767 1,776 1,922 2,011 2,034 1,912 2,057
ETPs vs mutual funds 11.2% 11.3% 11.4% 11.7% 12.1% 12.0% 12.6% 12.9% 13.1% 12.8% 13.3% 13.6% 13.6% 14.0% 14.2% 15.1% 15.3% 15.5% 15.6% 15.9%
ETFs vs mutual funds 10.1% 10.2% 10.1% 10.5% 10.9% 10.9% 11.4% 11.7% 12.1% 12.2% 12.6% 13.1% 13.0% 13.5% 13.7% 14.6% 14.9% 15.0% 15.2% 15.5%
1.7%
3.7%
5.7%
7.7%
9.7%
11.7%
13.7%
15.7%
17.7%
0
500
1,000
1,500
2,000
2,500
ETP
vs m
utu
al fu
nds
ETP
AU
M (
$ b
illion)
*Data as of 30-Oct-2015. Source: Deutsche Bank, Bloomberg Finance LP, ICI
Figure 38: US ETP vs mutual fund cash flows | ETPs | US |
-60
-40
-20
0
20
40
60
80
Cash flo
ws (
$ b
illion)
Jul-13 Aug-13 Sep-13 Oct-13 Nov-13 Dec-13 Jan-14 Feb-14 Mar-14 Apr-14 May-14 Jun-14 Jul-14 Aug-14 Sep-14 Oct-14 Nov-14 Dec-14 Jan-15 Feb-15 Mar-15 Apr-15 May-15 Jun-15 Jul-15 Aug-15 Sep-15 Oct-15
ETVs -1.18 -0.19 -0.41 -2.47 -1.37 -3.56 -0.93 0.70 0.33 -1.24 0.07 0.10 1.16 -0.10 -1.19 -0.46 -0.41 0.07 3.67 1.41 -0.96 -0.42 -1.30 -0.56 -0.76 0.67 -0.42 0.78
ETFs 41.32 -18.25 32.85 28.33 14.22 23.19 -14.27 18.19 10.54 20.70 12.56 25.20 16.43 14.92 17.65 26.76 42.45 51.51 -7.88 31.79 28.73 13.80 12.91 18.52 23.73 0.85 20.36 27.22
Mutual funds 10.28 -17.17 -4.90 10.30 9.10 -20.05 27.88 32.65 26.88 16.94 14.94 13.02 3.37 7.42 22.76 -3.00 13.76 -47.08 25.20 29.05 14.54 5.39 2.96 5.27 -18.97 -39.13 -34.26 -7.71
Source: Deutsche Bank, Bloomberg Finance LP, ICI
10 December 2015
European Monthly ETF Market Review
Deutsche Bank AG/London Page 19
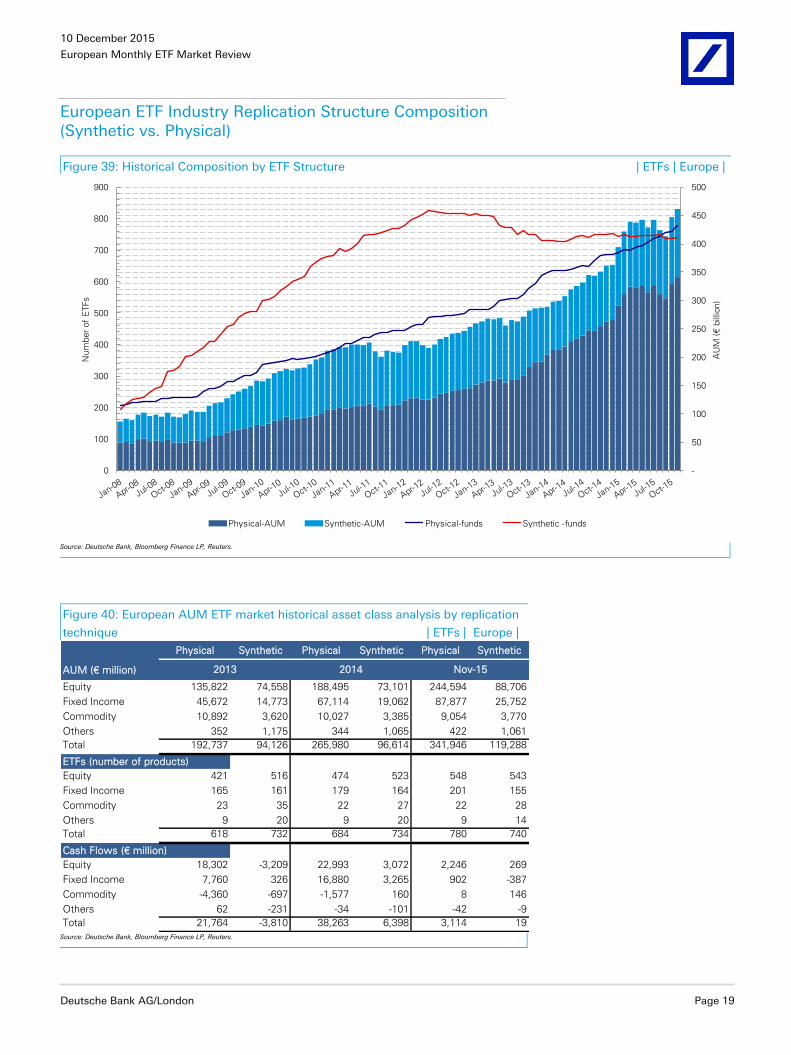
European ETF Industry Replication Structure Composition (Synthetic vs. Physical)
Figure 39: Historical Composition by ETF Structure | ETFs | Europe |
0
100
200
300
400
500
600
700
800
900
-
50
100
150
200
250
300
350
400
450
500
Num
ber
of
ETFs
AU
M (
€billion)
Physical-AUM Synthetic-AUM Physical-funds Synthetic -funds
Source: Deutsche Bank, Bloomberg Finance LP, Reuters.
Figure 40: European AUM ETF market historical asset class analysis by replication
technique | ETFs | Europe |
Physical Synthetic Physical Synthetic Physical Synthetic
AUM (€ million)
Equity 135,822 74,558 188,495 73,101 244,594 88,706
Fixed Income 45,672 14,773 67,114 19,062 87,877 25,752
Commodity 10,892 3,620 10,027 3,385 9,054 3,770
Others 352 1,175 344 1,065 422 1,061
Total 192,737 94,126 265,980 96,614 341,946 119,288
Equity 421 516 474 523 548 543
Fixed Income 165 161 179 164 201 155
Commodity 23 35 22 27 22 28
Others 9 20 9 20 9 14
Total 618 732 684 734 780 740
Equity 18,302 -3,209 22,993 3,072 2,246 269
Fixed Income 7,760 326 16,880 3,265 902 -387
Commodity -4,360 -697 -1,577 160 8 146
Others 62 -231 -34 -101 -42 -9
Total 21,764 -3,810 38,263 6,398 3,114 19
ETFs (number of products)
Cash Flows (€ million)
Nov-152013 2014
Source: Deutsche Bank, Bloomberg Finance LP, Reuters.
10 December 2015
European Monthly ETF Market Review
Page 20 Deutsche Bank AG/London
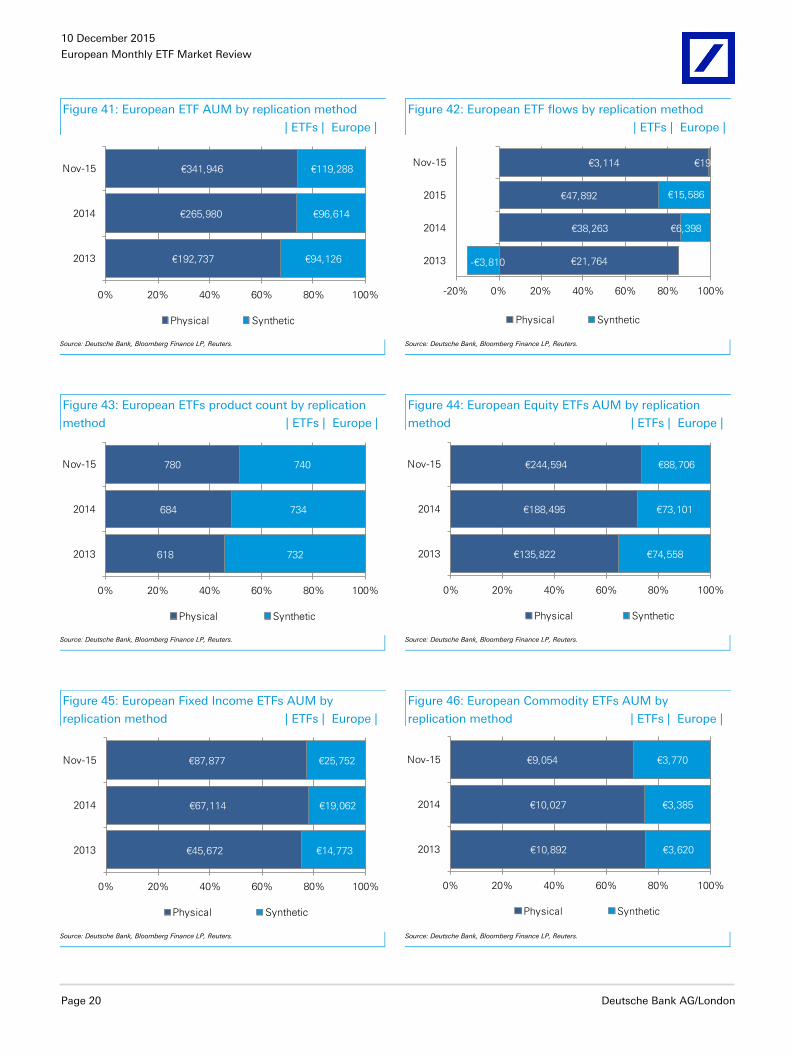
Figure 41: European ETF AUM by replication method
| ETFs | Europe |
Figure 42: European ETF flows by replication method
| ETFs | Europe |
€192,737
€265,980
€341,946
€94,126
€96,614
€119,288
0% 20% 40% 60% 80% 100%
2013
2014
Nov-15
Physical Synthetic
€21,764
€38,263
€47,892
€3,114
-€3,810
€6,398
€15,586
€19
-20% 0% 20% 40% 60% 80% 100%
2013
2014
2015
Nov-15
Physical Synthetic
Source: Deutsche Bank, Bloomberg Finance LP, Reuters.
Source: Deutsche Bank, Bloomberg Finance LP, Reuters.
Figure 43: European ETFs product count by replication
method | ETFs | Europe |
Figure 44: European Equity ETFs AUM by replication
method | ETFs | Europe |
618
684
780
732
734
740
0% 20% 40% 60% 80% 100%
2013
2014
Nov-15
Physical Synthetic
€135,822
€188,495
€244,594
€74,558
€73,101
€88,706
0% 20% 40% 60% 80% 100%
2013
2014
Nov-15
Physical Synthetic
Source: Deutsche Bank, Bloomberg Finance LP, Reuters.
Source: Deutsche Bank, Bloomberg Finance LP, Reuters.
Figure 45: European Fixed Income ETFs AUM by
replication method | ETFs | Europe |
Figure 46: European Commodity ETFs AUM by
replication method | ETFs | Europe |
€45,672
€67,114
€87,877
€14,773
€19,062
€25,752
0% 20% 40% 60% 80% 100%
2013
2014
Nov-15
Physical Synthetic
€10,892
€10,027
€9,054
€3,620
€3,385
€3,770
0% 20% 40% 60% 80% 100%
2013
2014
Nov-15
Physical Synthetic
Source: Deutsche Bank, Bloomberg Finance LP, Reuters.
Source: Deutsche Bank, Bloomberg Finance LP, Reuters.
10 December 2015
European Monthly ETF Market Review
Deutsche Bank AG/London Page 21
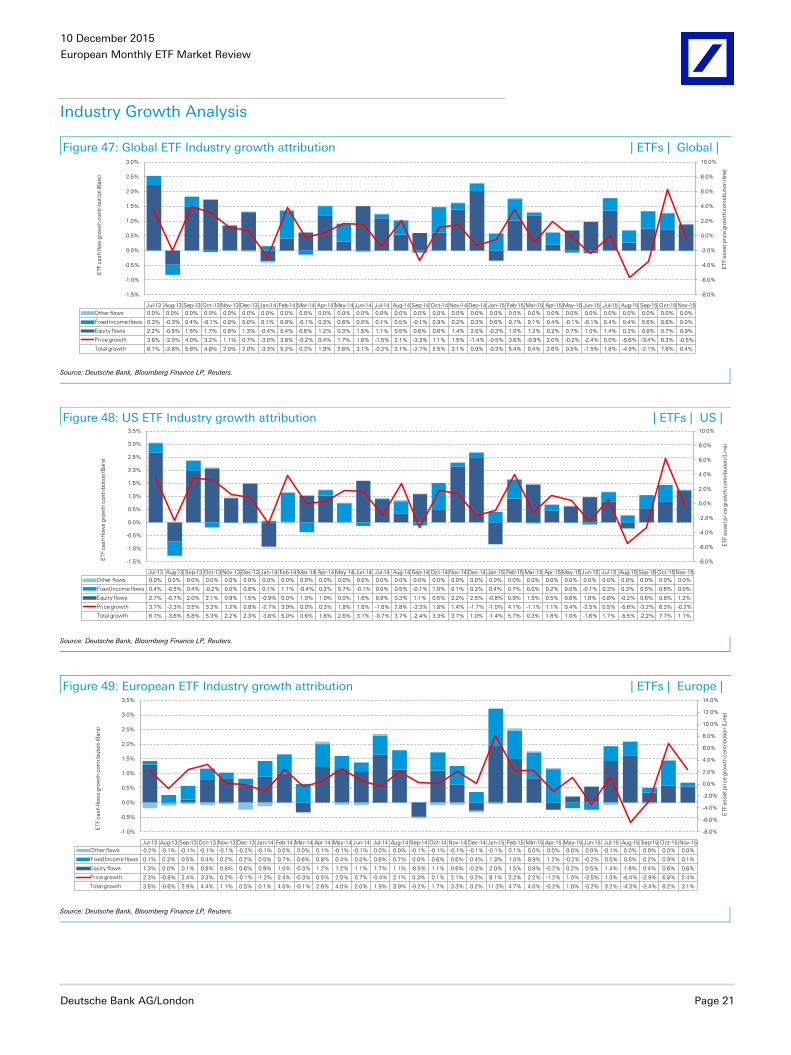
Industry Growth Analysis
Figure 47: Global ETF Industry growth attribution | ETFs | Global |
-8.0%
-6.0%
-4.0%
-2.0%
0.0%
2.0%
4.0%
6.0%
8.0%
10.0%
-1.5%
-1.0%
-0.5%
0.0%
0.5%
1.0%
1.5%
2.0%
2.5%
3.0%
ETF a
sset pri
ce g
row
th c
ontr
ibution (l
ine)
ETF c
ash flo
w g
row
th c
ontr
ibuti
on (B
ars
)
Jul-13 Aug-13 Sep-13 Oct-13 Nov-13 Dec-13 Jan-14 Feb-14 Mar-14 Apr-14 May-14 Jun-14 Jul-14 Aug-14 Sep-14 Oct-14 Nov-14 Dec-14 Jan-15 Feb-15 Mar-15 Apr-15 May-15 Jun-15 Jul-15 Aug-15 Sep-15 Oct-15 Nov-15
Other flows 0.0% 0.0% 0.0% 0.0% 0.0% 0.0% 0.0% 0.0% 0.0% 0.0% 0.0% 0.0% 0.0% 0.0% 0.0% 0.0% 0.0% 0.0% 0.0% 0.0% 0.0% 0.0% 0.0% 0.0% 0.0% 0.0% 0.0% 0.0% 0.0%
Fixed Income flows 0.3% -0.3% 0.4% -0.1% 0.0% 0.0% 0.1% 0.9% -0.1% 0.3% 0.6% 0.0% 0.1% 0.5% -0.1% 0.9% 0.2% 0.3% 0.6% 0.7% 0.1% 0.4% -0.1% -0.1% 0.4% 0.4% 0.6% 0.6% 0.0%
Equity flows 2.2% -0.5% 1.5% 1.7% 0.8% 1.3% -0.4% 0.4% 0.6% 1.2% 0.3% 1.5% 1.1% 0.5% 0.6% 0.6% 1.4% 2.0% -0.3% 1.0% 1.2% 0.2% 0.7% 1.0% 1.4% 0.3% 0.8% 0.7% 0.9%
Price growth 3.6% -2.0% 4.0% 3.2% 1.1% 0.7% -3.0% 3.8% -0.2% 0.4% 1.7% 1.6% -1.5% 2.1% -3.3% 1.1% 1.5% -1.4% -0.5% 3.6% -0.9% 2.0% -0.2% -2.4% 0.0% -5.6% -3.4% 6.3% -0.5%
Total growth 6.1% -2.8% 5.8% 4.8% 2.0% 2.0% -3.3% 5.2% 0.3% 1.9% 2.6% 3.1% -0.2% 3.1% -2.7% 2.5% 3.1% 0.9% -0.3% 5.4% 0.4% 2.6% 0.5% -1.5% 1.8% -4.9% -2.1% 7.6% 0.4%
Source: Deutsche Bank, Bloomberg Finance LP, Reuters.
Figure 48: US ETF Industry growth attribution | ETFs | US |
-8.0%
-6.0%
-4.0%
-2.0%
0.0%
2.0%
4.0%
6.0%
8.0%
10.0%
-1.5%
-1.0%
-0.5%
0.0%
0.5%
1.0%
1.5%
2.0%
2.5%
3.0%
3.5%
ETF a
sset pri
ce g
row
th c
ontr
ibution (L
ine)
ETF c
ash flo
ws g
row
th c
ontr
ibution (B
ars
)
Jul-13 Aug-13 Sep-13 Oct-13 Nov-13 Dec-13 Jan-14 Feb-14 Mar-14 Apr-14 May-14 Jun-14 Jul-14 Aug-14 Sep-14 Oct-14 Nov-14 Dec-14 Jan-15 Feb-15 Mar-15 Apr-15 May-15 Jun-15 Jul-15 Aug-15 Sep-15 Oct-15 Nov-15
Other flows 0.0% 0.0% 0.0% 0.0% 0.0% 0.0% 0.0% 0.0% 0.0% 0.0% 0.0% 0.0% 0.0% 0.0% 0.0% 0.0% 0.0% 0.0% 0.0% 0.0% 0.0% 0.0% 0.0% 0.0% 0.0% 0.0% 0.0% 0.0% 0.0%
Fixed Income flows 0.4% -0.5% 0.4% -0.2% 0.0% 0.0% 0.1% 1.1% -0.4% 0.2% 0.7% -0.1% 0.0% 0.5% -0.1% 1.0% 0.1% 0.2% 0.4% 0.7% 0.0% 0.2% 0.0% -0.1% 0.3% 0.3% 0.5% 0.6% 0.0%
Equity flows 2.7% -0.7% 2.0% 2.1% 0.9% 1.5% -0.9% 0.0% 1.0% 1.0% 0.0% 1.6% 0.9% 0.3% 1.1% 0.5% 2.2% 2.5% -0.8% 0.9% 1.5% 0.5% 0.6% 1.0% 0.8% -0.2% 0.6% 0.8% 1.2%
Price growth 3.7% -2.3% 3.5% 3.3% 1.2% 0.8% -2.7% 3.9% 0.0% 0.3% 1.8% 1.6% -1.6% 2.8% -3.3% 1.8% 1.4% -1.7% -1.0% 4.1% -1.1% 1.1% 0.4% -2.5% 0.5% -5.6% -3.2% 6.3% -0.2%
Total growth 6.7% -3.6% 5.8% 5.3% 2.2% 2.3% -3.6% 5.0% 0.6% 1.6% 2.6% 3.1% -0.7% 3.7% -2.4% 3.3% 3.7% 1.0% -1.4% 5.7% 0.3% 1.8% 1.0% -1.6% 1.7% -5.5% -2.2% 7.7% 1.1%
Source: Deutsche Bank, Bloomberg Finance LP, Reuters.
Figure 49: European ETF Industry growth attribution | ETFs | Europe |
-8.0%
-6.0%
-4.0%
-2.0%
0.0%
2.0%
4.0%
6.0%
8.0%
10.0%
12.0%
14.0%
-1.0%
-0.5%
0.0%
0.5%
1.0%
1.5%
2.0%
2.5%
3.0%
3.5%
ETF a
sset pri
ce g
row
th c
ontr
ibution (L
ine)
ETF c
ash flo
ws g
row
th c
ontr
ibution (B
ars
)
Jul-13 Aug-13 Sep-13 Oct-13 Nov-13 Dec-13 Jan-14 Feb-14 Mar-14 Apr-14 May-14 Jun-14 Jul-14 Aug-14 Sep-14 Oct-14 Nov-14 Dec-14 Jan-15 Feb-15 Mar-15 Apr-15 May-15 Jun-15 Jul-15 Aug-15 Sep-15 Oct-15 Nov-15
Other flows -0.2% -0.1% -0.1% -0.1% -0.1% -0.2% -0.1% 0.0% 0.0% 0.1% -0.1% -0.1% 0.0% 0.0% -0.1% -0.1% -0.1% -0.1% -0.1% 0.1% 0.0% 0.0% 0.0% 0.0% -0.1% 0.0% 0.0% 0.0% 0.0%
Fixed Income flows 0.1% 0.3% 0.5% 0.4% 0.2% 0.2% 0.5% 0.7% 0.6% 0.8% 0.4% 0.3% 0.6% 0.7% 0.0% 0.6% 0.6% 0.4% 1.3% 1.0% 0.9% 1.2% -0.2% -0.2% 0.5% 0.5% 0.2% 0.9% 0.1%
Equity flows 1.3% 0.0% 0.1% 0.8% 0.8% 0.6% 0.9% 1.0% -0.3% 1.2% 1.2% 1.1% 1.7% 1.1% -0.5% 1.1% 0.6% -0.3% 2.0% 1.5% 0.8% -0.2% 0.2% 0.5% 1.4% 1.6% 0.4% 0.6% 0.6%
Price growth 2.3% -0.8% 2.4% 3.3% 0.2% -0.1% -1.2% 2.4% -0.3% 0.5% 2.5% 0.7% -0.4% 2.1% 0.3% 0.1% 2.1% 0.2% 8.1% 2.2% 2.2% -1.2% 1.0% -3.5% 1.3% -6.4% -2.9% 6.8% 2.4%
Total growth 3.5% -0.6% 2.9% 4.4% 1.1% 0.5% 0.1% 4.0% -0.1% 2.6% 4.0% 2.0% 1.9% 3.9% -0.2% 1.7% 3.3% 0.2% 11.3% 4.7% 4.0% -0.2% 1.0% -3.2% 3.2% -4.3% -2.4% 8.2% 3.1%
Source: Deutsche Bank, Bloomberg Finance LP, Reuters.

10 December 2015
European Monthly ETF Market Review
Page 22 Deutsche Bank AG/London
Figure 50: European ETC Industry growth attribution | ETCs | Europe |
-15.0%
-10.0%
-5.0%
0.0%
5.0%
10.0%
15.0%
20.0%
-6.0%
-4.0%
-2.0%
0.0%
2.0%
4.0%
6.0%
8.0%
ETC
asset pri
ce g
row
th c
ontr
ibution (l
ine)
ETC
cash flo
ws g
row
th c
ontr
ibution (B
ars
)
Jul-13 Aug-13 Sep-13 Oct-13 Nov-13 Dec-13 Jan-14 Feb-14 Mar-14 Apr-14 May-14 Jun-14 Jul-14 Aug-14 Sep-14 Oct-14 Nov-14 Dec-14 Jan-15 Feb-15 Mar-15 Apr-15 May-15 Jun-15 Jul-15 Aug-15 Sep-15 Oct-15 Nov-15
Currency Flows 0.0% 0.1% 0.2% -0.1% -0.1% 0.1% 0.1% 0.1% 0.1% 0.3% 0.1% -0.1% 0.0% -0.3% -0.2% -0.1% 0.1% -0.1% -0.1% -0.2% 0.1% 0.1% 0.0% -0.2% 0.0% 0.1% -0.1% -0.1% 0.0%
Commodity Flows -4.4% 0.1% -0.9% -0.5% -0.7% -4.1% -0.9% 1.0% 2.5% 0.5% -0.9% -0.5% 2.2% 0.8% -2.4% -0.6% 1.4% 0.4% 5.5% 4.4% -2.4% 0.2% 0.0% -1.4% -2.7% 2.5% -0.7% 1.9% 0.1%
Price growth 5.5% 6.5% -6.6% -0.7% -4.6% -3.6% 4.6% 3.6% -1.8% -0.6% -0.7% 3.5% 0.1% 1.0% -2.6% -3.0% 0.1% 1.6% 10.5% -1.6% 0.5% -1.9% 1.9% -3.4% -7.7% 0.6% -2.3% 3.3% -4.6%
Total growth 1.2% 6.7% -7.3% -1.4% -5.3% -7.6% 3.7% 4.7% 0.8% 0.2% -1.5% 3.0% 2.3% 1.6% -5.2% -3.7% 1.6% 2.0% 15.9% 2.7% -1.8% -1.5% 1.8% -4.9% -10.4% 3.2% -3.1% 5.1% -4.6%
Source: Deutsche Bank, Bloomberg Finance LP, Reuters.
10 December 2015
European Monthly ETF Market Review
Deutsche Bank AG/London Page 23
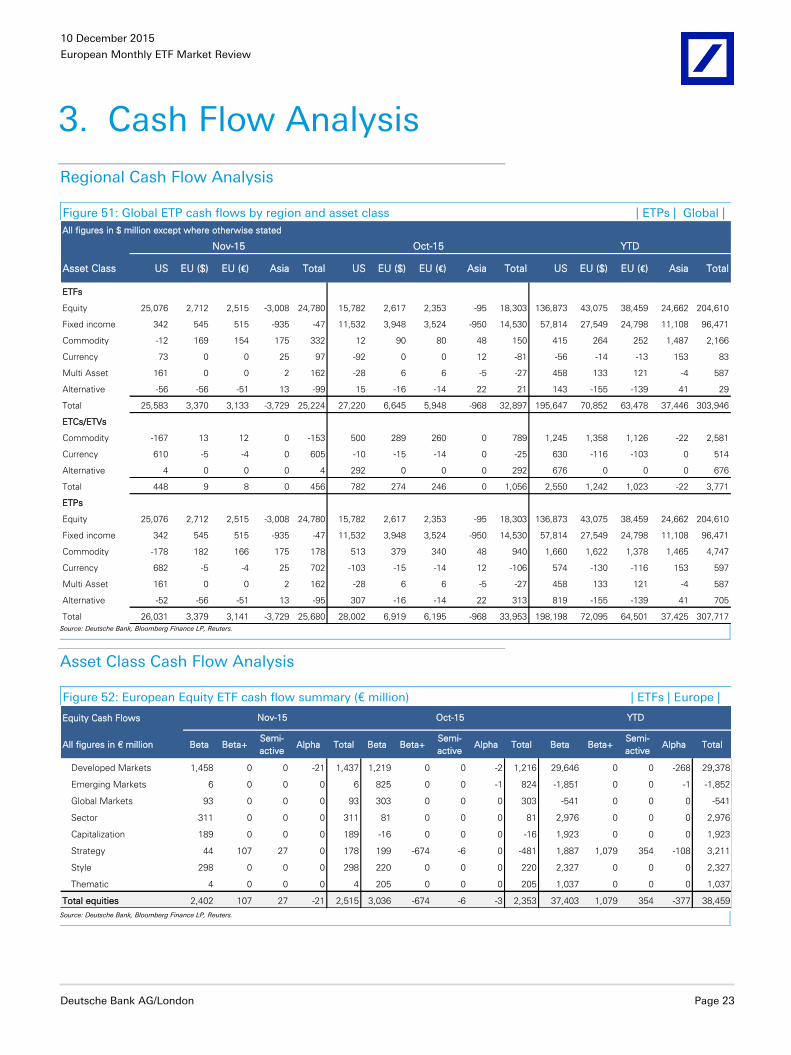
3. Cash Flow Analysis
Regional Cash Flow Analysis
Figure 51: Global ETP cash flows by region and asset class | ETPs | Global |
Asset Class US EU ($) EU (€) Asia Total US EU ($) EU (€) Asia Total US EU ($) EU (€) Asia Total
ETFs
Equity 25,076 2,712 2,515 -3,008 24,780 15,782 2,617 2,353 -95 18,303 136,873 43,075 38,459 24,662 204,610
Fixed income 342 545 515 -935 -47 11,532 3,948 3,524 -950 14,530 57,814 27,549 24,798 11,108 96,471
Commodity -12 169 154 175 332 12 90 80 48 150 415 264 252 1,487 2,166
Currency 73 0 0 25 97 -92 0 0 12 -81 -56 -14 -13 153 83
Multi Asset 161 0 0 2 162 -28 6 6 -5 -27 458 133 121 -4 587
Alternative -56 -56 -51 13 -99 15 -16 -14 22 21 143 -155 -139 41 29
Total 25,583 3,370 3,133 -3,729 25,224 27,220 6,645 5,948 -968 32,897 195,647 70,852 63,478 37,446 303,946
ETCs/ETVs
Commodity -167 13 12 0 -153 500 289 260 0 789 1,245 1,358 1,126 -22 2,581
Currency 610 -5 -4 0 605 -10 -15 -14 0 -25 630 -116 -103 0 514
Alternative 4 0 0 0 4 292 0 0 0 292 676 0 0 0 676
Total 448 9 8 0 456 782 274 246 0 1,056 2,550 1,242 1,023 -22 3,771
ETPs
Equity 25,076 2,712 2,515 -3,008 24,780 15,782 2,617 2,353 -95 18,303 136,873 43,075 38,459 24,662 204,610
Fixed income 342 545 515 -935 -47 11,532 3,948 3,524 -950 14,530 57,814 27,549 24,798 11,108 96,471
Commodity -178 182 166 175 178 513 379 340 48 940 1,660 1,622 1,378 1,465 4,747
Currency 682 -5 -4 25 702 -103 -15 -14 12 -106 574 -130 -116 153 597
Multi Asset 161 0 0 2 162 -28 6 6 -5 -27 458 133 121 -4 587
Alternative -52 -56 -51 13 -95 307 -16 -14 22 313 819 -155 -139 41 705
Total 26,031 3,379 3,141 -3,729 25,680 28,002 6,919 6,195 -968 33,953 198,198 72,095 64,501 37,425 307,717
All figures in $ million except where otherwise stated
Nov-15 Oct-15 YTD
Source: Deutsche Bank, Bloomberg Finance LP, Reuters.
Asset Class Cash Flow Analysis
Figure 52: European Equity ETF cash flow summary (€ million) | ETFs | Europe |
Equity Cash Flows
All figures in € million Beta Beta+Semi-
activeAlpha Total Beta Beta+
Semi-
activeAlpha Total Beta Beta+
Semi-
activeAlpha Total
Developed Markets 1,458 0 0 -21 1,437 1,219 0 0 -2 1,216 29,646 0 0 -268 29,378
Emerging Markets 6 0 0 0 6 825 0 0 -1 824 -1,851 0 0 -1 -1,852
Global Markets 93 0 0 0 93 303 0 0 0 303 -541 0 0 0 -541
Sector 311 0 0 0 311 81 0 0 0 81 2,976 0 0 0 2,976
Capitalization 189 0 0 0 189 -16 0 0 0 -16 1,923 0 0 0 1,923
Strategy 44 107 27 0 178 199 -674 -6 0 -481 1,887 1,079 354 -108 3,211
Style 298 0 0 0 298 220 0 0 0 220 2,327 0 0 0 2,327
Thematic 4 0 0 0 4 205 0 0 0 205 1,037 0 0 0 1,037
Total equities 2,402 107 27 -21 2,515 3,036 -674 -6 -3 2,353 37,403 1,079 354 -377 38,459
Nov-15 Oct-15 YTD
Source: Deutsche Bank, Bloomberg Finance LP, Reuters.
10 December 2015
European Monthly ETF Market Review
Page 24 Deutsche Bank AG/London
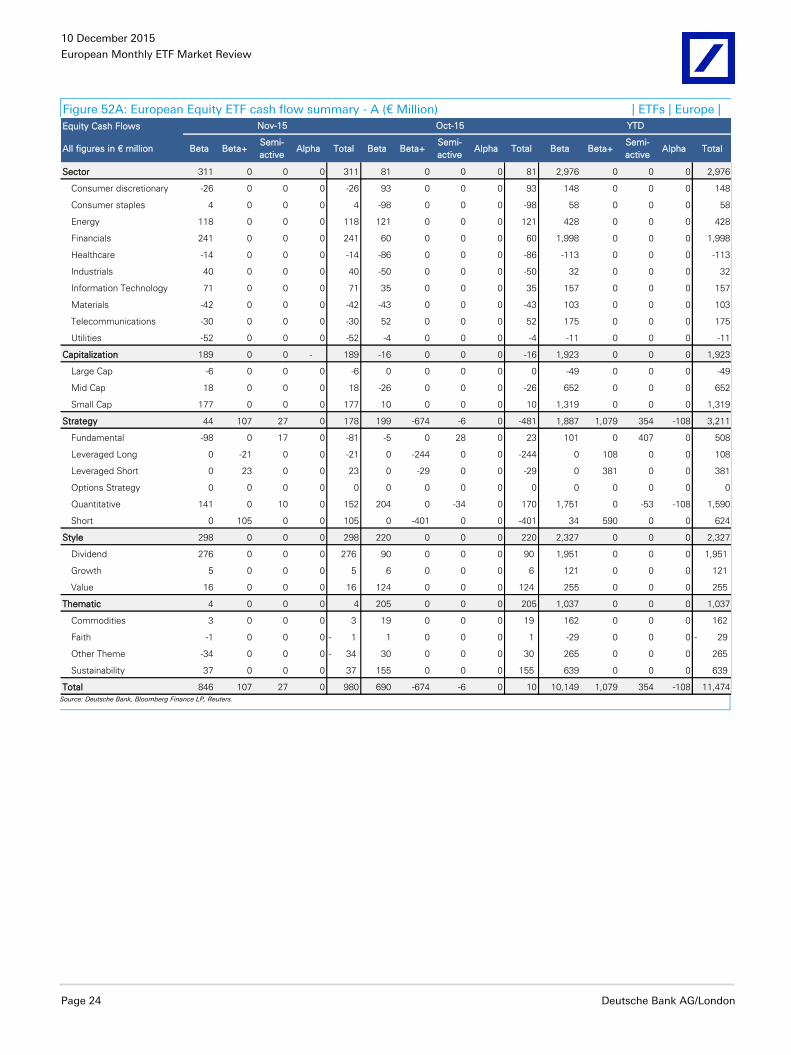
Figure 52A: European Equity ETF cash flow summary - A (€ Million) | ETFs | Europe |
Equity Cash Flows
All figures in € million Beta Beta+Semi-
activeAlpha Total Beta Beta+
Semi-
activeAlpha Total Beta Beta+
Semi-
activeAlpha Total
Sector 311 0 0 0 311 81 0 0 0 81 2,976 0 0 0 2,976
Consumer discretionary -26 0 0 0 -26 93 0 0 0 93 148 0 0 0 148
Consumer staples 4 0 0 0 4 -98 0 0 0 -98 58 0 0 0 58
Energy 118 0 0 0 118 121 0 0 0 121 428 0 0 0 428
Financials 241 0 0 0 241 60 0 0 0 60 1,998 0 0 0 1,998
Healthcare -14 0 0 0 -14 -86 0 0 0 -86 -113 0 0 0 -113
Industrials 40 0 0 0 40 -50 0 0 0 -50 32 0 0 0 32
Information Technology 71 0 0 0 71 35 0 0 0 35 157 0 0 0 157
Materials -42 0 0 0 -42 -43 0 0 0 -43 103 0 0 0 103
Telecommunications -30 0 0 0 -30 52 0 0 0 52 175 0 0 0 175
Utilities -52 0 0 0 -52 -4 0 0 0 -4 -11 0 0 0 -11
Capitalization 189 0 0 - 189 -16 0 0 0 -16 1,923 0 0 0 1,923
Large Cap -6 0 0 0 -6 0 0 0 0 0 -49 0 0 0 -49
Mid Cap 18 0 0 0 18 -26 0 0 0 -26 652 0 0 0 652
Small Cap 177 0 0 0 177 10 0 0 0 10 1,319 0 0 0 1,319
Strategy 44 107 27 0 178 199 -674 -6 0 -481 1,887 1,079 354 -108 3,211
Fundamental -98 0 17 0 -81 -5 0 28 0 23 101 0 407 0 508
Leveraged Long 0 -21 0 0 -21 0 -244 0 0 -244 0 108 0 0 108
Leveraged Short 0 23 0 0 23 0 -29 0 0 -29 0 381 0 0 381
Options Strategy 0 0 0 0 0 0 0 0 0 0 0 0 0 0 0
Quantitative 141 0 10 0 152 204 0 -34 0 170 1,751 0 -53 -108 1,590
Short 0 105 0 0 105 0 -401 0 0 -401 34 590 0 0 624
Style 298 0 0 0 298 220 0 0 0 220 2,327 0 0 0 2,327
Dividend 276 0 0 0 276 90 0 0 0 90 1,951 0 0 0 1,951
Growth 5 0 0 0 5 6 0 0 0 6 121 0 0 0 121
Value 16 0 0 0 16 124 0 0 0 124 255 0 0 0 255
Thematic 4 0 0 0 4 205 0 0 0 205 1,037 0 0 0 1,037
Commodities 3 0 0 0 3 19 0 0 0 19 162 0 0 0 162
Faith -1 0 0 0 1- 1 0 0 0 1 -29 0 0 0 29-
Other Theme -34 0 0 0 34- 30 0 0 0 30 265 0 0 0 265
Sustainability 37 0 0 0 37 155 0 0 0 155 639 0 0 0 639
Total 846 107 27 0 980 690 -674 -6 0 10 10,149 1,079 354 -108 11,474
Nov-15 Oct-15 YTD
Source: Deutsche Bank, Bloomberg Finance LP, Reuters.
10 December 2015
European Monthly ETF Market Review
Deutsche Bank AG/London Page 25
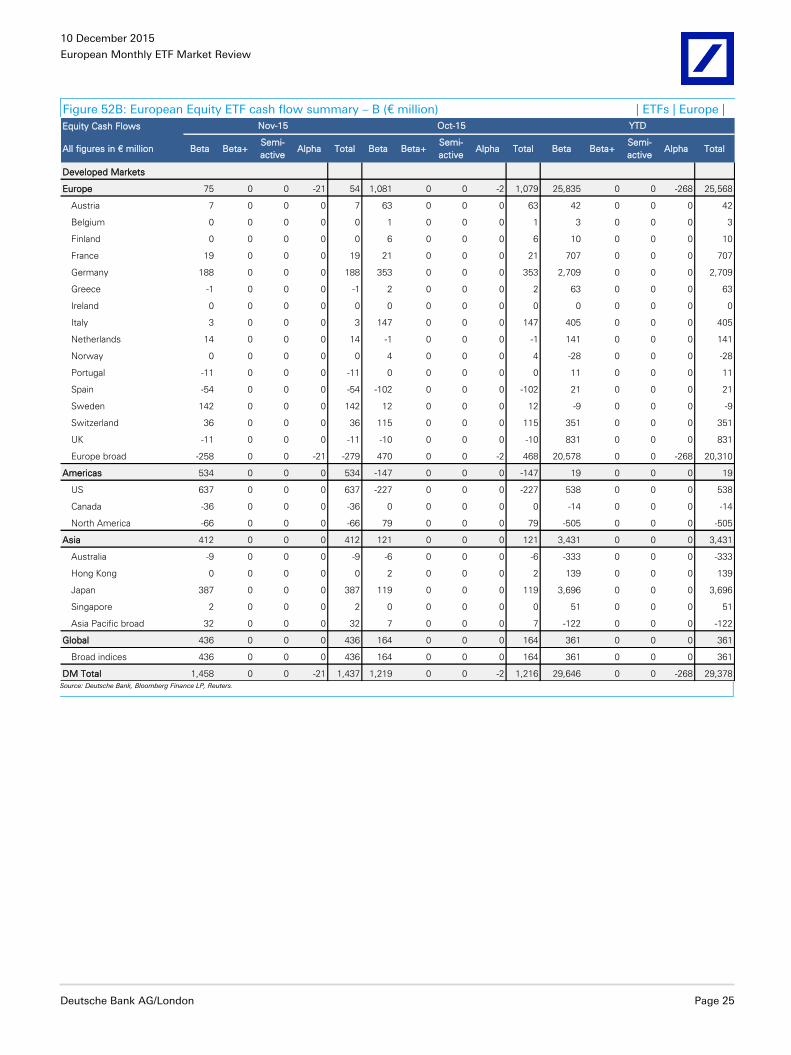
Figure 52B: European Equity ETF cash flow summary – B (€ million) | ETFs | Europe |
Equity Cash Flows
All figures in € million Beta Beta+Semi-
activeAlpha Total Beta Beta+
Semi-
activeAlpha Total Beta Beta+
Semi-
activeAlpha Total
Developed Markets
Europe 75 0 0 -21 54 1,081 0 0 -2 1,079 25,835 0 0 -268 25,568
Austria 7 0 0 0 7 63 0 0 0 63 42 0 0 0 42
Belgium 0 0 0 0 0 1 0 0 0 1 3 0 0 0 3
Finland 0 0 0 0 0 6 0 0 0 6 10 0 0 0 10
France 19 0 0 0 19 21 0 0 0 21 707 0 0 0 707
Germany 188 0 0 0 188 353 0 0 0 353 2,709 0 0 0 2,709
Greece -1 0 0 0 -1 2 0 0 0 2 63 0 0 0 63
Ireland 0 0 0 0 0 0 0 0 0 0 0 0 0 0 0
Italy 3 0 0 0 3 147 0 0 0 147 405 0 0 0 405
Netherlands 14 0 0 0 14 -1 0 0 0 -1 141 0 0 0 141
Norway 0 0 0 0 0 4 0 0 0 4 -28 0 0 0 -28
Portugal -11 0 0 0 -11 0 0 0 0 0 11 0 0 0 11
Spain -54 0 0 0 -54 -102 0 0 0 -102 21 0 0 0 21
Sweden 142 0 0 0 142 12 0 0 0 12 -9 0 0 0 -9
Switzerland 36 0 0 0 36 115 0 0 0 115 351 0 0 0 351
UK -11 0 0 0 -11 -10 0 0 0 -10 831 0 0 0 831
Europe broad -258 0 0 -21 -279 470 0 0 -2 468 20,578 0 0 -268 20,310
Americas 534 0 0 0 534 -147 0 0 0 -147 19 0 0 0 19
US 637 0 0 0 637 -227 0 0 0 -227 538 0 0 0 538
Canada -36 0 0 0 -36 0 0 0 0 0 -14 0 0 0 -14
North America -66 0 0 0 -66 79 0 0 0 79 -505 0 0 0 -505
Asia 412 0 0 0 412 121 0 0 0 121 3,431 0 0 0 3,431
Australia -9 0 0 0 -9 -6 0 0 0 -6 -333 0 0 0 -333
Hong Kong 0 0 0 0 0 2 0 0 0 2 139 0 0 0 139
Japan 387 0 0 0 387 119 0 0 0 119 3,696 0 0 0 3,696
Singapore 2 0 0 0 2 0 0 0 0 0 51 0 0 0 51
Asia Pacific broad 32 0 0 0 32 7 0 0 0 7 -122 0 0 0 -122
Global 436 0 0 0 436 164 0 0 0 164 361 0 0 0 361
Broad indices 436 0 0 0 436 164 0 0 0 164 361 0 0 0 361
DM Total 1,458 0 0 -21 1,437 1,219 0 0 -2 1,216 29,646 0 0 -268 29,378
Nov-15 Oct-15 YTD
Source: Deutsche Bank, Bloomberg Finance LP, Reuters.
10 December 2015
European Monthly ETF Market Review
Page 26 Deutsche Bank AG/London
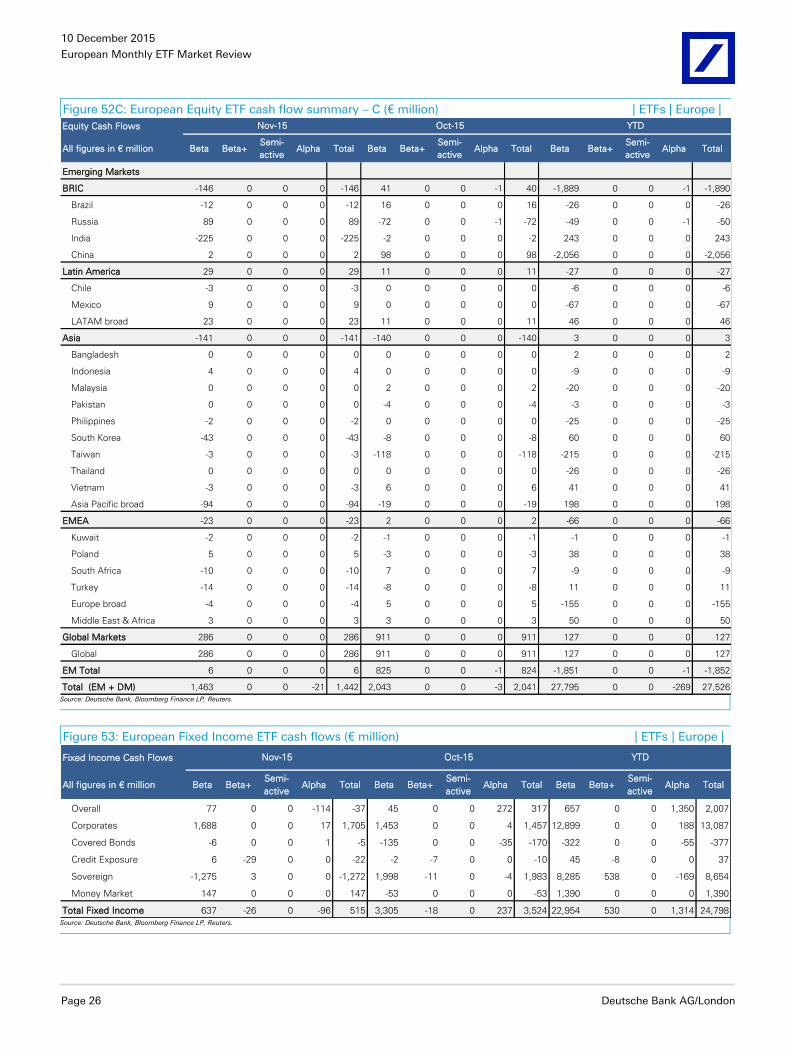
Figure 52C: European Equity ETF cash flow summary – C (€ million) | ETFs | Europe |
Equity Cash Flows
All figures in € million Beta Beta+Semi-
activeAlpha Total Beta Beta+
Semi-
activeAlpha Total Beta Beta+
Semi-
activeAlpha Total
Emerging Markets
BRIC -146 0 0 0 -146 41 0 0 -1 40 -1,889 0 0 -1 -1,890
Brazil -12 0 0 0 -12 16 0 0 0 16 -26 0 0 0 -26
Russia 89 0 0 0 89 -72 0 0 -1 -72 -49 0 0 -1 -50
India -225 0 0 0 -225 -2 0 0 0 -2 243 0 0 0 243
China 2 0 0 0 2 98 0 0 0 98 -2,056 0 0 0 -2,056
Latin America 29 0 0 0 29 11 0 0 0 11 -27 0 0 0 -27
Chile -3 0 0 0 -3 0 0 0 0 0 -6 0 0 0 -6
Mexico 9 0 0 0 9 0 0 0 0 0 -67 0 0 0 -67
LATAM broad 23 0 0 0 23 11 0 0 0 11 46 0 0 0 46
Asia -141 0 0 0 -141 -140 0 0 0 -140 3 0 0 0 3
Bangladesh 0 0 0 0 0 0 0 0 0 0 2 0 0 0 2
Indonesia 4 0 0 0 4 0 0 0 0 0 -9 0 0 0 -9
Malaysia 0 0 0 0 0 2 0 0 0 2 -20 0 0 0 -20
Pakistan 0 0 0 0 0 -4 0 0 0 -4 -3 0 0 0 -3
Philippines -2 0 0 0 -2 0 0 0 0 0 -25 0 0 0 -25
South Korea -43 0 0 0 -43 -8 0 0 0 -8 60 0 0 0 60
Taiwan -3 0 0 0 -3 -118 0 0 0 -118 -215 0 0 0 -215
Thailand 0 0 0 0 0 0 0 0 0 0 -26 0 0 0 -26
Vietnam -3 0 0 0 -3 6 0 0 0 6 41 0 0 0 41
Asia Pacific broad -94 0 0 0 -94 -19 0 0 0 -19 198 0 0 0 198
EMEA -23 0 0 0 -23 2 0 0 0 2 -66 0 0 0 -66
Kuwait -2 0 0 0 -2 -1 0 0 0 -1 -1 0 0 0 -1
Poland 5 0 0 0 5 -3 0 0 0 -3 38 0 0 0 38
South Africa -10 0 0 0 -10 7 0 0 0 7 -9 0 0 0 -9
Turkey -14 0 0 0 -14 -8 0 0 0 -8 11 0 0 0 11
Europe broad -4 0 0 0 -4 5 0 0 0 5 -155 0 0 0 -155
Middle East & Africa 3 0 0 0 3 3 0 0 0 3 50 0 0 0 50
Global Markets 286 0 0 0 286 911 0 0 0 911 127 0 0 0 127
Global 286 0 0 0 286 911 0 0 0 911 127 0 0 0 127
EM Total 6 0 0 0 6 825 0 0 -1 824 -1,851 0 0 -1 -1,852
Total (EM + DM) 1,463 0 0 -21 1,442 2,043 0 0 -3 2,041 27,795 0 0 -269 27,526
Nov-15 Oct-15 YTD
Source: Deutsche Bank, Bloomberg Finance LP, Reuters.
Figure 53: European Fixed Income ETF cash flows (€ million) | ETFs | Europe |
Fixed Income Cash Flows
All figures in € million Beta Beta+Semi-
activeAlpha Total Beta Beta+
Semi-
activeAlpha Total Beta Beta+
Semi-
activeAlpha Total
Overall 77 0 0 -114 -37 45 0 0 272 317 657 0 0 1,350 2,007
Corporates 1,688 0 0 17 1,705 1,453 0 0 4 1,457 12,899 0 0 188 13,087
Covered Bonds -6 0 0 1 -5 -135 0 0 -35 -170 -322 0 0 -55 -377
Credit Exposure 6 -29 0 0 -22 -2 -7 0 0 -10 45 -8 0 0 37
Sovereign -1,275 3 0 0 -1,272 1,998 -11 0 -4 1,983 8,285 538 0 -169 8,654
Money Market 147 0 0 0 147 -53 0 0 0 -53 1,390 0 0 0 1,390
Total Fixed Income 637 -26 0 -96 515 3,305 -18 0 237 3,524 22,954 530 0 1,314 24,798
YTDNov-15 Oct-15
Source: Deutsche Bank, Bloomberg Finance LP, Reuters.
10 December 2015
European Monthly ETF Market Review
Deutsche Bank AG/London Page 27
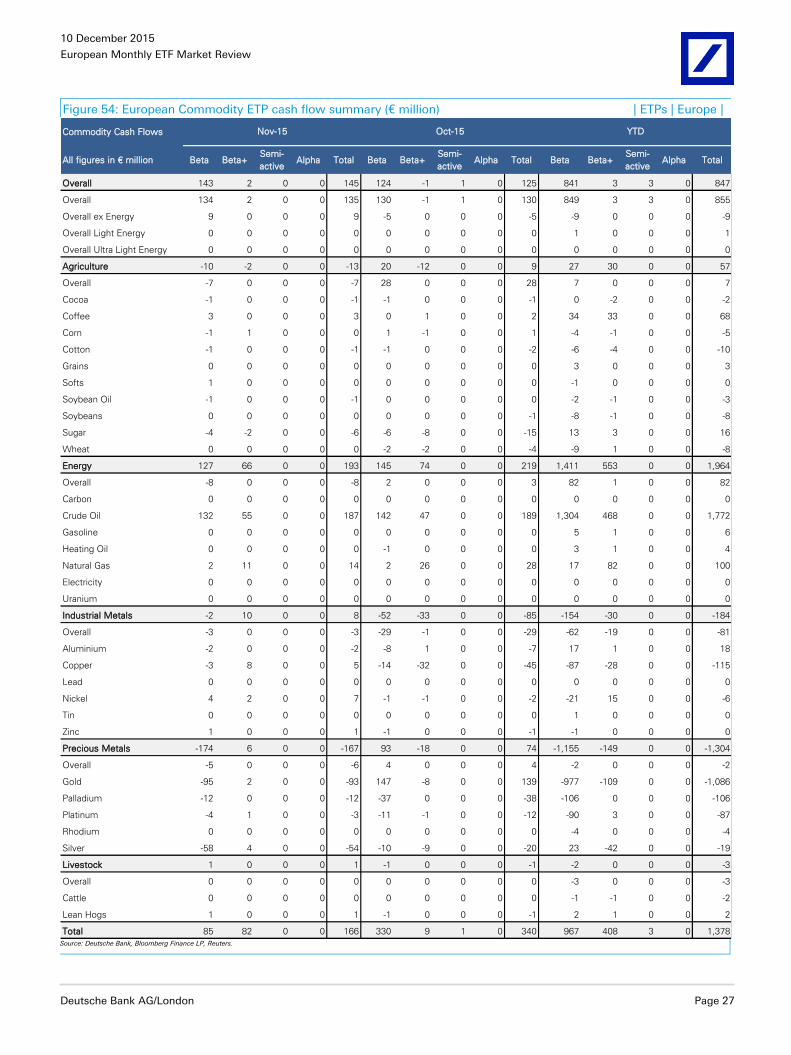
Figure 54: European Commodity ETP cash flow summary (€ million) | ETPs | Europe |
Commodity Cash Flows
All figures in € million Beta Beta+Semi-
activeAlpha Total Beta Beta+
Semi-
activeAlpha Total Beta Beta+
Semi-
activeAlpha Total
Overall 143 2 0 0 145 124 -1 1 0 125 841 3 3 0 847
Overall 134 2 0 0 135 130 -1 1 0 130 849 3 3 0 855
Overall ex Energy 9 0 0 0 9 -5 0 0 0 -5 -9 0 0 0 -9
Overall Light Energy 0 0 0 0 0 0 0 0 0 0 1 0 0 0 1
Overall Ultra Light Energy 0 0 0 0 0 0 0 0 0 0 0 0 0 0 0
Agriculture -10 -2 0 0 -13 20 -12 0 0 9 27 30 0 0 57
Overall -7 0 0 0 -7 28 0 0 0 28 7 0 0 0 7
Cocoa -1 0 0 0 -1 -1 0 0 0 -1 0 -2 0 0 -2
Coffee 3 0 0 0 3 0 1 0 0 2 34 33 0 0 68
Corn -1 1 0 0 0 1 -1 0 0 1 -4 -1 0 0 -5
Cotton -1 0 0 0 -1 -1 0 0 0 -2 -6 -4 0 0 -10
Grains 0 0 0 0 0 0 0 0 0 0 3 0 0 0 3
Softs 1 0 0 0 0 0 0 0 0 0 -1 0 0 0 0
Soybean Oil -1 0 0 0 -1 0 0 0 0 0 -2 -1 0 0 -3
Soybeans 0 0 0 0 0 0 0 0 0 -1 -8 -1 0 0 -8
Sugar -4 -2 0 0 -6 -6 -8 0 0 -15 13 3 0 0 16
Wheat 0 0 0 0 0 -2 -2 0 0 -4 -9 1 0 0 -8
Energy 127 66 0 0 193 145 74 0 0 219 1,411 553 0 0 1,964
Overall -8 0 0 0 -8 2 0 0 0 3 82 1 0 0 82
Carbon 0 0 0 0 0 0 0 0 0 0 0 0 0 0 0
Crude Oil 132 55 0 0 187 142 47 0 0 189 1,304 468 0 0 1,772
Gasoline 0 0 0 0 0 0 0 0 0 0 5 1 0 0 6
Heating Oil 0 0 0 0 0 -1 0 0 0 0 3 1 0 0 4
Natural Gas 2 11 0 0 14 2 26 0 0 28 17 82 0 0 100
Electricity 0 0 0 0 0 0 0 0 0 0 0 0 0 0 0
Uranium 0 0 0 0 0 0 0 0 0 0 0 0 0 0 0
Industrial Metals -2 10 0 0 8 -52 -33 0 0 -85 -154 -30 0 0 -184
Overall -3 0 0 0 -3 -29 -1 0 0 -29 -62 -19 0 0 -81
Aluminium -2 0 0 0 -2 -8 1 0 0 -7 17 1 0 0 18
Copper -3 8 0 0 5 -14 -32 0 0 -45 -87 -28 0 0 -115
Lead 0 0 0 0 0 0 0 0 0 0 0 0 0 0 0
Nickel 4 2 0 0 7 -1 -1 0 0 -2 -21 15 0 0 -6
Tin 0 0 0 0 0 0 0 0 0 0 1 0 0 0 0
Zinc 1 0 0 0 1 -1 0 0 0 -1 -1 0 0 0 0
Precious Metals -174 6 0 0 -167 93 -18 0 0 74 -1,155 -149 0 0 -1,304
Overall -5 0 0 0 -6 4 0 0 0 4 -2 0 0 0 -2
Gold -95 2 0 0 -93 147 -8 0 0 139 -977 -109 0 0 -1,086
Palladium -12 0 0 0 -12 -37 0 0 0 -38 -106 0 0 0 -106
Platinum -4 1 0 0 -3 -11 -1 0 0 -12 -90 3 0 0 -87
Rhodium 0 0 0 0 0 0 0 0 0 0 -4 0 0 0 -4
Silver -58 4 0 0 -54 -10 -9 0 0 -20 23 -42 0 0 -19
Livestock 1 0 0 0 1 -1 0 0 0 -1 -2 0 0 0 -3
Overall 0 0 0 0 0 0 0 0 0 0 -3 0 0 0 -3
Cattle 0 0 0 0 0 0 0 0 0 0 -1 -1 0 0 -2
Lean Hogs 1 0 0 0 1 -1 0 0 0 -1 2 1 0 0 2
Total 85 82 0 0 166 330 9 1 0 340 967 408 3 0 1,378
Nov-15 Oct-15 YTD
Source: Deutsche Bank, Bloomberg Finance LP, Reuters.
10 December 2015
European Monthly ETF Market Review
Page 28 Deutsche Bank AG/London
Product Rankings
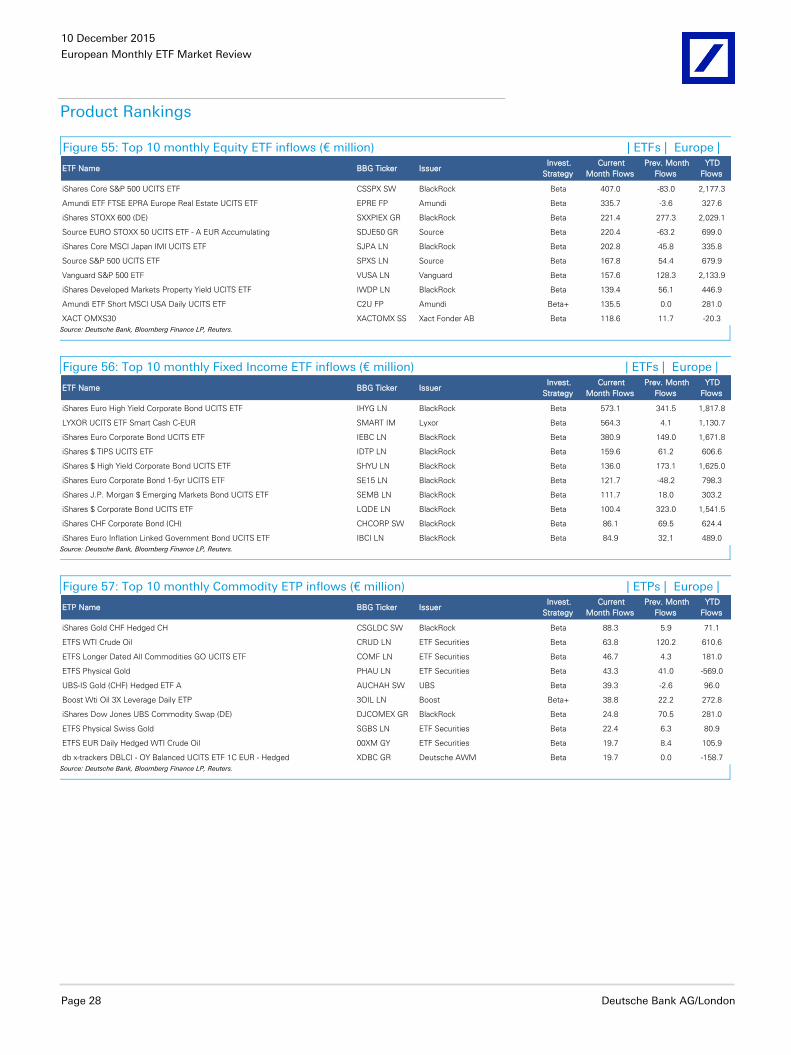
Figure 55: Top 10 monthly Equity ETF inflows (€ million) | ETFs | Europe |
ETF Name BBG Ticker Issuer Invest.
Strategy
Current
Month Flows
Prev. Month
Flows
YTD
Flows
iShares Core S&P 500 UCITS ETF CSSPX SW BlackRock Beta 407.0 -83.0 2,177.3
Amundi ETF FTSE EPRA Europe Real Estate UCITS ETF EPRE FP Amundi Beta 335.7 -3.6 327.6
iShares STOXX 600 (DE) SXXPIEX GR BlackRock Beta 221.4 277.3 2,029.1
Source EURO STOXX 50 UCITS ETF - A EUR Accumulating SDJE50 GR Source Beta 220.4 -63.2 699.0
iShares Core MSCI Japan IMI UCITS ETF SJPA LN BlackRock Beta 202.8 45.8 335.8
Source S&P 500 UCITS ETF SPXS LN Source Beta 167.8 54.4 679.9
Vanguard S&P 500 ETF VUSA LN Vanguard Beta 157.6 128.3 2,133.9
iShares Developed Markets Property Yield UCITS ETF IWDP LN BlackRock Beta 139.4 56.1 446.9
Amundi ETF Short MSCI USA Daily UCITS ETF C2U FP Amundi Beta+ 135.5 0.0 281.0
XACT OMXS30 XACTOMX SS Xact Fonder AB Beta 118.6 11.7 -20.3 Source: Deutsche Bank, Bloomberg Finance LP, Reuters.
Figure 56: Top 10 monthly Fixed Income ETF inflows (€ million) | ETFs | Europe |
ETF Name BBG Ticker Issuer Invest.
Strategy
Current
Month Flows
Prev. Month
Flows
YTD
Flows
iShares Euro High Yield Corporate Bond UCITS ETF IHYG LN BlackRock Beta 573.1 341.5 1,817.8
LYXOR UCITS ETF Smart Cash C-EUR SMART IM Lyxor Beta 564.3 4.1 1,130.7
iShares Euro Corporate Bond UCITS ETF IEBC LN BlackRock Beta 380.9 149.0 1,671.8
iShares $ TIPS UCITS ETF IDTP LN BlackRock Beta 159.6 61.2 606.6
iShares $ High Yield Corporate Bond UCITS ETF SHYU LN BlackRock Beta 136.0 173.1 1,625.0
iShares Euro Corporate Bond 1-5yr UCITS ETF SE15 LN BlackRock Beta 121.7 -48.2 798.3
iShares J.P. Morgan $ Emerging Markets Bond UCITS ETF SEMB LN BlackRock Beta 111.7 18.0 303.2
iShares $ Corporate Bond UCITS ETF LQDE LN BlackRock Beta 100.4 323.0 1,541.5
iShares CHF Corporate Bond (CH) CHCORP SW BlackRock Beta 86.1 69.5 624.4
iShares Euro Inflation Linked Government Bond UCITS ETF IBCI LN BlackRock Beta 84.9 32.1 489.0 Source: Deutsche Bank, Bloomberg Finance LP, Reuters.
Figure 57: Top 10 monthly Commodity ETP inflows (€ million) | ETPs | Europe |
ETP Name BBG Ticker Issuer Invest.
Strategy
Current
Month Flows
Prev. Month
Flows
YTD
Flows
iShares Gold CHF Hedged CH CSGLDC SW BlackRock Beta 88.3 5.9 71.1
ETFS WTI Crude Oil CRUD LN ETF Securities Beta 63.8 120.2 610.6
ETFS Longer Dated All Commodities GO UCITS ETF COMF LN ETF Securities Beta 46.7 4.3 181.0
ETFS Physical Gold PHAU LN ETF Securities Beta 43.3 41.0 -569.0
UBS-IS Gold (CHF) Hedged ETF A AUCHAH SW UBS Beta 39.3 -2.6 96.0
Boost Wti Oil 3X Leverage Daily ETP 3OIL LN Boost Beta+ 38.8 22.2 272.8
iShares Dow Jones UBS Commodity Swap (DE) DJCOMEX GR BlackRock Beta 24.8 70.5 281.0
ETFS Physical Swiss Gold SGBS LN ETF Securities Beta 22.4 6.3 80.9
ETFS EUR Daily Hedged WTI Crude Oil 00XM GY ETF Securities Beta 19.7 8.4 105.9
db x-trackers DBLCI - OY Balanced UCITS ETF 1C EUR - Hedged XDBC GR Deutsche AWM Beta 19.7 0.0 -158.7 Source: Deutsche Bank, Bloomberg Finance LP, Reuters.
10 December 2015
European Monthly ETF Market Review
Deutsche Bank AG/London Page 29
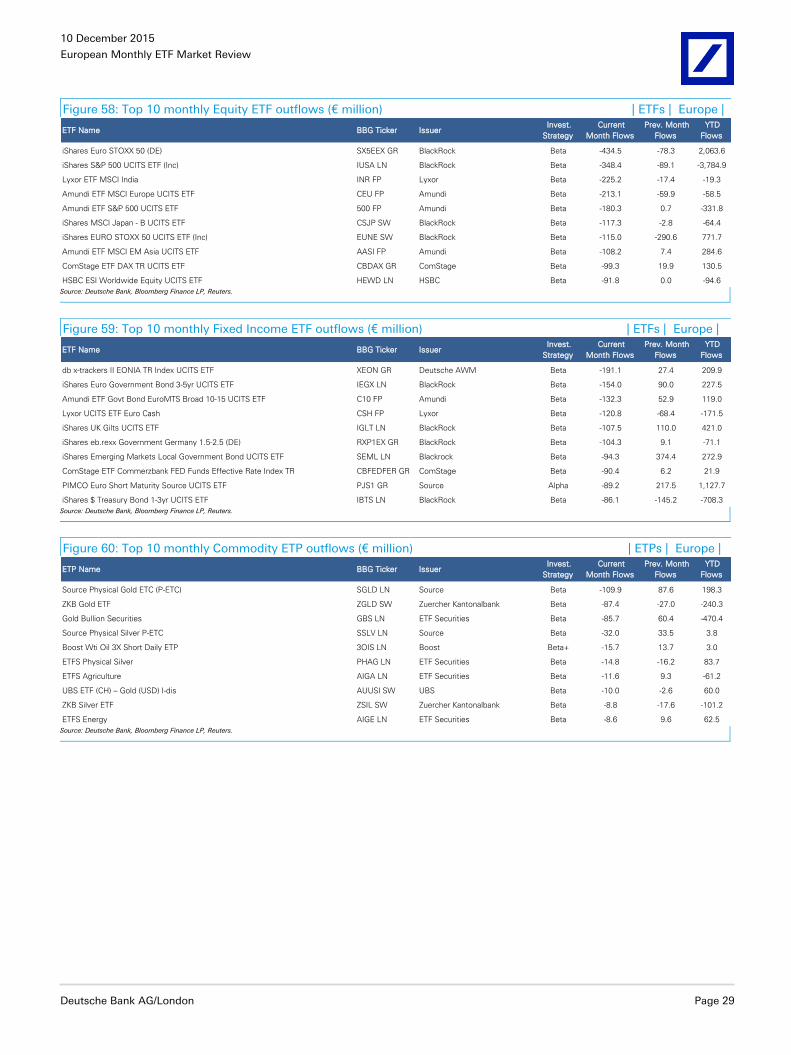
Figure 58: Top 10 monthly Equity ETF outflows (€ million) | ETFs | Europe |
ETF Name BBG Ticker Issuer Invest.
Strategy
Current
Month Flows
Prev. Month
Flows
YTD
Flows
iShares Euro STOXX 50 (DE) SX5EEX GR BlackRock Beta -434.5 -78.3 2,063.6
iShares S&P 500 UCITS ETF (Inc) IUSA LN BlackRock Beta -348.4 -89.1 -3,784.9
Lyxor ETF MSCI India INR FP Lyxor Beta -225.2 -17.4 -19.3
Amundi ETF MSCI Europe UCITS ETF CEU FP Amundi Beta -213.1 -59.9 -58.5
Amundi ETF S&P 500 UCITS ETF 500 FP Amundi Beta -180.3 0.7 -331.8
iShares MSCI Japan - B UCITS ETF CSJP SW BlackRock Beta -117.3 -2.8 -64.4
iShares EURO STOXX 50 UCITS ETF (Inc) EUNE SW BlackRock Beta -115.0 -290.6 771.7
Amundi ETF MSCI EM Asia UCITS ETF AASI FP Amundi Beta -108.2 7.4 284.6
ComStage ETF DAX TR UCITS ETF CBDAX GR ComStage Beta -99.3 19.9 130.5
HSBC ESI Worldwide Equity UCITS ETF HEWD LN HSBC Beta -91.8 0.0 -94.6 Source: Deutsche Bank, Bloomberg Finance LP, Reuters.
Figure 59: Top 10 monthly Fixed Income ETF outflows (€ million) | ETFs | Europe |
ETF Name BBG Ticker Issuer Invest.
Strategy
Current
Month Flows
Prev. Month
Flows
YTD
Flows
db x-trackers II EONIA TR Index UCITS ETF XEON GR Deutsche AWM Beta -191.1 27.4 209.9
iShares Euro Government Bond 3-5yr UCITS ETF IEGX LN BlackRock Beta -154.0 90.0 227.5
Amundi ETF Govt Bond EuroMTS Broad 10-15 UCITS ETF C10 FP Amundi Beta -132.3 52.9 119.0
Lyxor UCITS ETF Euro Cash CSH FP Lyxor Beta -120.8 -68.4 -171.5
iShares UK Gilts UCITS ETF IGLT LN BlackRock Beta -107.5 110.0 421.0
iShares eb.rexx Government Germany 1.5-2.5 (DE) RXP1EX GR BlackRock Beta -104.3 9.1 -71.1
iShares Emerging Markets Local Government Bond UCITS ETF SEML LN Blackrock Beta -94.3 374.4 272.9
ComStage ETF Commerzbank FED Funds Effective Rate Index TR CBFEDFER GR ComStage Beta -90.4 6.2 21.9
PIMCO Euro Short Maturity Source UCITS ETF PJS1 GR Source Alpha -89.2 217.5 1,127.7
iShares $ Treasury Bond 1-3yr UCITS ETF IBTS LN BlackRock Beta -86.1 -145.2 -708.3 Source: Deutsche Bank, Bloomberg Finance LP, Reuters.
Figure 60: Top 10 monthly Commodity ETP outflows (€ million) | ETPs | Europe |
ETP Name BBG Ticker Issuer Invest.
Strategy
Current
Month Flows
Prev. Month
Flows
YTD
Flows
Source Physical Gold ETC (P-ETC) SGLD LN Source Beta -109.9 87.6 198.3
ZKB Gold ETF ZGLD SW Zuercher Kantonalbank Beta -87.4 -27.0 -240.3
Gold Bullion Securities GBS LN ETF Securities Beta -85.7 60.4 -470.4
Source Physical Silver P-ETC SSLV LN Source Beta -32.0 33.5 3.8
Boost Wti Oil 3X Short Daily ETP 3OIS LN Boost Beta+ -15.7 13.7 3.0
ETFS Physical Silver PHAG LN ETF Securities Beta -14.8 -16.2 83.7
ETFS Agriculture AIGA LN ETF Securities Beta -11.6 9.3 -61.2
UBS ETF (CH) – Gold (USD) I-dis AUUSI SW UBS Beta -10.0 -2.6 60.0
ZKB Silver ETF ZSIL SW Zuercher Kantonalbank Beta -8.8 -17.6 -101.2
ETFS Energy AIGE LN ETF Securities Beta -8.6 9.6 62.5 Source: Deutsche Bank, Bloomberg Finance LP, Reuters.
10 December 2015
European Monthly ETF Market Review
Page 30 Deutsche Bank AG/London
4. Product Review
New Products Launched in the Month
Figure 61: Number of ETPs by Asset Class | ETPs | Global |
Nov-15 Oct-15 End of 2014
Asset Class Nu.Mkt
Share %Nu. Nu. % Nu. Nu. %
ETFs
Equity 2,924 66.6% 2,885 39 66.9% 2,602 322 64.7%
Fixed income 705 16.1% 693 12 16.1% 665 40 16.5%
Commodity 110 2.5% 110 - 2.6% 107 3 2.7%
Currency 16 0.4% 15 1 0.3% 17 (1) 0.4%
Multi Asset 43 1.0% 43 - 1.0% 45 (2) 1.1%
Alternative 51 1.2% 51 - 1.2% 47 4 1.2%
Total 3,849 87.7% 3,797 52 88.0% 3,483 366 86.7%
ETC/Vs
Equity - 0.0% 0 - 0.0% 0 - 0.0%
Commodity 412 9.4% 394 18 9.1% 406 6 10.1%
Currency 124 2.8% 118 6 2.7% 126 (2) 3.1%
Alternative 4 0.1% 4 - 0.1% 4 - 0.1%
Total 540 12.3% 516 24 12.0% 536 4 13.3%
Total ETPs 4,389 100.0% 4,313 76 100.0% 4,019 370 100.0%
MoM Change YTD Change
Source: Deutsche Bank, Bloomberg Finance LP, Reuters.
Figure 62: Number of ETPs by Asset Class | ETPs | Europe |
Nov-15 Oct-15 End of 2014
Asset Class Nu.Mkt
Share %Nu. Nu. % Nu. Nu. %
ETFs
Equity 1,091 55.2% 1,074 17 0.9% 1,021 70 3.7%
Fixed income 356 18.0% 349 7 0.4% 341 15 0.8%
Commodity 50 2.5% 50 - 0.0% 49 1 0.1%
Currency - 0.0% 0 - 0.0% 1 (1) -0.1%
Multi Asset 8 0.4% 8 - 0.0% 8 - 0.0%
Alternative 15 0.8% 15 - 0.0% 20 (5) -0.3%
Total 1,520 76.9% 1,496 24 1.2% 1,440 80 4.2%
ETCs
Commodity 349 17.7% 331 18 0.9% 342 7 0.4%
Currency 107 5.4% 101 6 0.3% 109 (2) -0.1%
Total 456 23.1% 432 24 1.2% 451 5 0.3%
Total ETPs 1,976 100.0% 1,928 48 2.5% 1,891 85 4.5%
MoM Change YTD Change
Source: Deutsche Bank, Bloomberg Finance LP, Reuters.
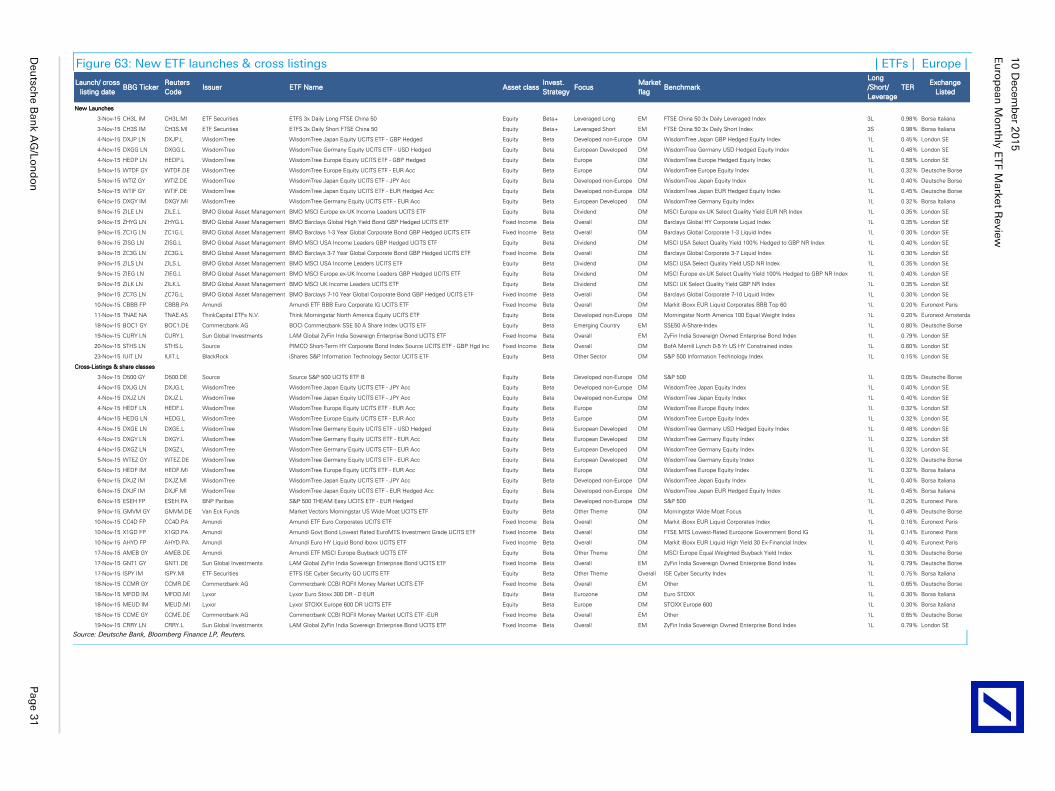
Eu
rop
ean
Mo
nth
ly E
TF M
ark
et R
evie
w
10
Decem
ber 2
01
5
Deu
tsch
e B
an
k A
G/L
on
do
n
Pag
e 3
1
Figure 63: New ETF launches & cross listings | ETFs | Europe |
Launch/ cross
listing dateBBG Ticker
Reuters
CodeIssuer ETF Name Asset class
Invest.
StrategyFocus
Market
flagBenchmark
Long
/Short/
Leverage
TERExchange
Listed
New Launches
3-Nov-15 CH3L IM CH3L.MI ETF Securities ETFS 3x Daily Long FTSE China 50 Equity Beta+ Leveraged Long EM FTSE China 50 3x Daily Leveraged Index 3L 0.98% Borsa Italiana
3-Nov-15 CH3S IM CH3S.MI ETF Securities ETFS 3x Daily Short FTSE China 50 Equity Beta+ Leveraged Short EM FTSE China 50 3x Daily Short Index 3S 0.98% Borsa Italiana
4-Nov-15 DXJP LN DXJP.L WisdomTree WisdomTree Japan Equity UCITS ETF - GBP Hedged Equity Beta Developed non-Europe DM WisdomTree Japan GBP Hedged Equity Index 1L 0.45% London SE
4-Nov-15 DXGG LN DXGG.L WisdomTree WisdomTree Germany Equity UCITS ETF - USD Hedged Equity Beta European Developed DM WisdomTree Germany USD Hedged Equity Index 1L 0.48% London SE
4-Nov-15 HEDP LN HEDP.L WisdomTree WisdomTree Europe Equity UCITS ETF - GBP Hedged Equity Beta Europe DM WisdomTree Europe Hedged Equity Index 1L 0.58% London SE
5-Nov-15 WTDF GY WTDF.DE WisdomTree WisdomTree Europe Equity UCITS ETF - EUR Acc Equity Beta Europe DM WisdomTree Europe Equity Index 1L 0.32% Deutsche Borse
5-Nov-15 WTIZ GY WTIZ.DE WisdomTree WisdomTree Japan Equity UCITS ETF - JPY Acc Equity Beta Developed non-Europe DM WisdomTree Japan Equity Index 1L 0.40% Deutsche Borse
5-Nov-15 WTIF GY WTIF.DE WisdomTree WisdomTree Japan Equity UCITS ETF - EUR Hedged Acc Equity Beta Developed non-Europe DM WisdomTree Japan EUR Hedged Equity Index 1L 0.45% Deutsche Borse
6-Nov-15 DXGY IM DXGY.MI WisdomTree WisdomTree Germany Equity UCITS ETF - EUR Acc Equity Beta European Developed DM WisdomTree Germany Equity Index 1L 0.32% Borsa Italiana
9-Nov-15 ZILE LN ZILE.L BMO Global Asset Management BMO MSCI Europe ex-UK Income Leaders UCITS ETF Equity Beta Dividend DM MSCI Europe ex-UK Select Quality Yield EUR NR Index 1L 0.35% London SE
9-Nov-15 ZHYG LN ZHYG.L BMO Global Asset Management BMO Barclays Global High Yield Bond GBP Hedged UCITS ETF Fixed Income Beta Overall DM Barclays Global HY Corporate Liquid Index 1L 0.35% London SE
9-Nov-15 ZC1G LN ZC1G.L BMO Global Asset Management BMO Barclays 1-3 Year Global Corporate Bond GBP Hedged UCITS ETF Fixed Income Beta Overall DM Barclays Global Corporate 1-3 Liquid Index 1L 0.30% London SE
9-Nov-15 ZISG LN ZISG.L BMO Global Asset Management BMO MSCI USA Income Leaders GBP Hedged UCITS ETF Equity Beta Dividend DM MSCI USA Select Quality Yield 100% Hedged to GBP NR Index 1L 0.40% London SE
9-Nov-15 ZC3G LN ZC3G.L BMO Global Asset Management BMO Barclays 3-7 Year Global Corporate Bond GBP Hedged UCITS ETF Fixed Income Beta Overall DM Barclays Global Corporate 3-7 Liquid Index 1L 0.30% London SE
9-Nov-15 ZILS LN ZILS.L BMO Global Asset Management BMO MSCI USA Income Leaders UCITS ETF Equity Beta Dividend DM MSCI USA Select Quality Yield USD NR Index 1L 0.35% London SE
9-Nov-15 ZIEG LN ZIEG.L BMO Global Asset Management BMO MSCI Europe ex-UK Income Leaders GBP Hedged UCITS ETF Equity Beta Dividend DM MSCI Europe ex-UK Select Quality Yield 100% Hedged to GBP NR Index 1L 0.40% London SE
9-Nov-15 ZILK LN ZILK.L BMO Global Asset Management BMO MSCI UK Income Leaders UCITS ETF Equity Beta Dividend DM MSCI UK Select Quality Yield GBP NR Index 1L 0.35% London SE
9-Nov-15 ZC7G LN ZC7G.L BMO Global Asset Management BMO Barclays 7-10 Year Global Corporate Bond GBP Hedged UCITS ETF Fixed Income Beta Overall DM Barclays Global Corporate 7-10 Liquid Index 1L 0.30% London SE
10-Nov-15 CBBB FP CBBB.PA Amundi Amundi ETF BBB Euro Corporate IG UCITS ETF Fixed Income Beta Overall DM Markit iBoxx EUR Liquid Corporates BBB Top 60 1L 0.20% Euronext Paris
11-Nov-15 TNAE NA TNAE.AS ThinkCapital ETFs N.V. Think Morningstar North America Equity UCITS ETF Equity Beta Developed non-Europe DM Morningstar North America 100 Equal Weight Index 1L 0.20% Euronext Amsterdam
18-Nov-15 BOC1 GY BOC1.DE Commerzbank AG BOCI Commerzbank SSE 50 A Share Index UCITS ETF Equity Beta Emerging Country EM SSE50 A-Share-Index 1L 0.80% Deutsche Borse
19-Nov-15 CURY LN CURY.L Sun Global Investments LAM Global ZyFin India Sovereign Enterprise Bond UCITS ETF Fixed Income Beta Overall EM ZyFin India Sovereign Owned Enterprise Bond Index 1L 0.79% London SE
20-Nov-15 STHS LN STHS.L Source PIMCO Short-Term HY Corporate Bond Index Source UCITS ETF - GBP Hgd Inc Fixed Income Beta Overall DM BofA Merrill Lynch 0-5 Yr US HY Constrained index 1L 0.60% London SE
23-Nov-15 IUIT LN IUIT.L BlackRock iShares S&P Information Technology Sector UCITS ETF Equity Beta Other Sector DM S&P 500 Information Technology Index 1L 0.15% London SE
Cross-Listings & share classes
3-Nov-15 D500 GY D500.DE Source Source S&P 500 UCITS ETF B Equity Beta Developed non-Europe DM S&P 500 1L 0.05% Deutsche Borse
4-Nov-15 DXJG LN DXJG.L WisdomTree WisdomTree Japan Equity UCITS ETF - JPY Acc Equity Beta Developed non-Europe DM WisdomTree Japan Equity Index 1L 0.40% London SE
4-Nov-15 DXJZ LN DXJZ.L WisdomTree WisdomTree Japan Equity UCITS ETF - JPY Acc Equity Beta Developed non-Europe DM WisdomTree Japan Equity Index 1L 0.40% London SE
4-Nov-15 HEDF LN HEDF.L WisdomTree WisdomTree Europe Equity UCITS ETF - EUR Acc Equity Beta Europe DM WisdomTree Europe Equity Index 1L 0.32% London SE
4-Nov-15 HEDG LN HEDG.L WisdomTree WisdomTree Europe Equity UCITS ETF - EUR Acc Equity Beta Europe DM WisdomTree Europe Equity Index 1L 0.32% London SE
4-Nov-15 DXGE LN DXGE.L WisdomTree WisdomTree Germany Equity UCITS ETF - USD Hedged Equity Beta European Developed DM WisdomTree Germany USD Hedged Equity Index 1L 0.48% London SE
4-Nov-15 DXGY LN DXGY.L WisdomTree WisdomTree Germany Equity UCITS ETF - EUR Acc Equity Beta European Developed DM WisdomTree Germany Equity Index 1L 0.32% London SE
4-Nov-15 DXGZ LN DXGZ.L WisdomTree WisdomTree Germany Equity UCITS ETF - EUR Acc Equity Beta European Developed DM WisdomTree Germany Equity Index 1L 0.32% London SE
5-Nov-15 WTEZ GY WTEZ.DE WisdomTree WisdomTree Germany Equity UCITS ETF - EUR Acc Equity Beta European Developed DM WisdomTree Germany Equity Index 1L 0.32% Deutsche Borse
6-Nov-15 HEDF IM HEDF.MI WisdomTree WisdomTree Europe Equity UCITS ETF - EUR Acc Equity Beta Europe DM WisdomTree Europe Equity Index 1L 0.32% Borsa Italiana
6-Nov-15 DXJZ IM DXJZ.MI WisdomTree WisdomTree Japan Equity UCITS ETF - JPY Acc Equity Beta Developed non-Europe DM WisdomTree Japan Equity Index 1L 0.40% Borsa Italiana
6-Nov-15 DXJF IM DXJF.MI WisdomTree WisdomTree Japan Equity UCITS ETF - EUR Hedged Acc Equity Beta Developed non-Europe DM WisdomTree Japan EUR Hedged Equity Index 1L 0.45% Borsa Italiana
6-Nov-15 ESEH FP ESEH.PA BNP Paribas S&P 500 THEAM Easy UCITS ETF - EUR Hedged Equity Beta Developed non-Europe DM S&P 500 1L 0.20% Euronext Paris
9-Nov-15 GMVM GY GMVM.DE Van Eck Funds Market Vectors Morningstar US Wide Moat UCITS ETF Equity Beta Other Theme DM Morningstar Wide Moat Focus 1L 0.49% Deutsche Borse
10-Nov-15 CC4D FP CC4D.PA Amundi Amundi ETF Euro Corporates UCITS ETF Fixed Income Beta Overall DM Markit iBoxx EUR Liquid Corporates Index 1L 0.16% Euronext Paris
10-Nov-15 X1GD FP X1GD.PA Amundi Amundi Govt Bond Lowest Rated EuroMTS Investment Grade UCITS ETF Fixed Income Beta Overall DM FTSE MTS Lowest-Rated Eurozone Government Bond IG 1L 0.14% Euronext Paris
10-Nov-15 AHYD FP AHYD.PA Amundi Amundi Euro HY Liquid Bond iboxx UCITS ETF Fixed Income Beta Overall DM Markit iBoxx EUR Liquid High Yield 30 Ex-Financial Index 1L 0.40% Euronext Paris
17-Nov-15 AMEB GY AMEB.DE Amundi Amundi ETF MSCI Europe Buyback UCITS ETF Equity Beta Other Theme DM MSCI Europe Equal Weighted Buyback Yield Index 1L 0.30% Deutsche Borse
17-Nov-15 GNT1 GY GNT1.DE Sun Global Investments LAM Global ZyFin India Sovereign Enterprise Bond UCITS ETF Fixed Income Beta Overall EM ZyFin India Sovereign Owned Enterprise Bond Index 1L 0.79% Deutsche Borse
17-Nov-15 ISPY IM ISPY.MI ETF Securities ETFS ISE Cyber Security GO UCITS ETF Equity Beta Other Theme Overall ISE Cyber Security Index 1L 0.75% Borsa Italiana
18-Nov-15 CCMR GY CCMR.DE Commerzbank AG Commerzbank CCBI RQFII Money Market UCITS ETF Fixed Income Beta Overall EM Other 1L 0.65% Deutsche Borse
18-Nov-15 MFDD IM MFDD.MI Lyxor Lyxor Euro Stoxx 300 DR - D EUR Equity Beta Eurozone DM Euro STOXX 1L 0.30% Borsa Italiana
18-Nov-15 MEUD IM MEUD.MI Lyxor Lyxor STOXX Europe 600 DR UCITS ETF Equity Beta Europe DM STOXX Europe 600 1L 0.30% Borsa Italiana
18-Nov-15 CCME GY CCME.DE Commerzbank AG Commerzbank CCBI RQFII Money Market UCITS ETF -EUR Fixed Income Beta Overall EM Other 1L 0.65% Deutsche Borse
19-Nov-15 CRRY LN CRRY.L Sun Global Investments LAM Global ZyFin India Sovereign Enterprise Bond UCITS ETF Fixed Income Beta Overall EM ZyFin India Sovereign Owned Enterprise Bond Index 1L 0.79% London SE Source: Deutsche Bank, Bloomberg Finance LP, Reuters.
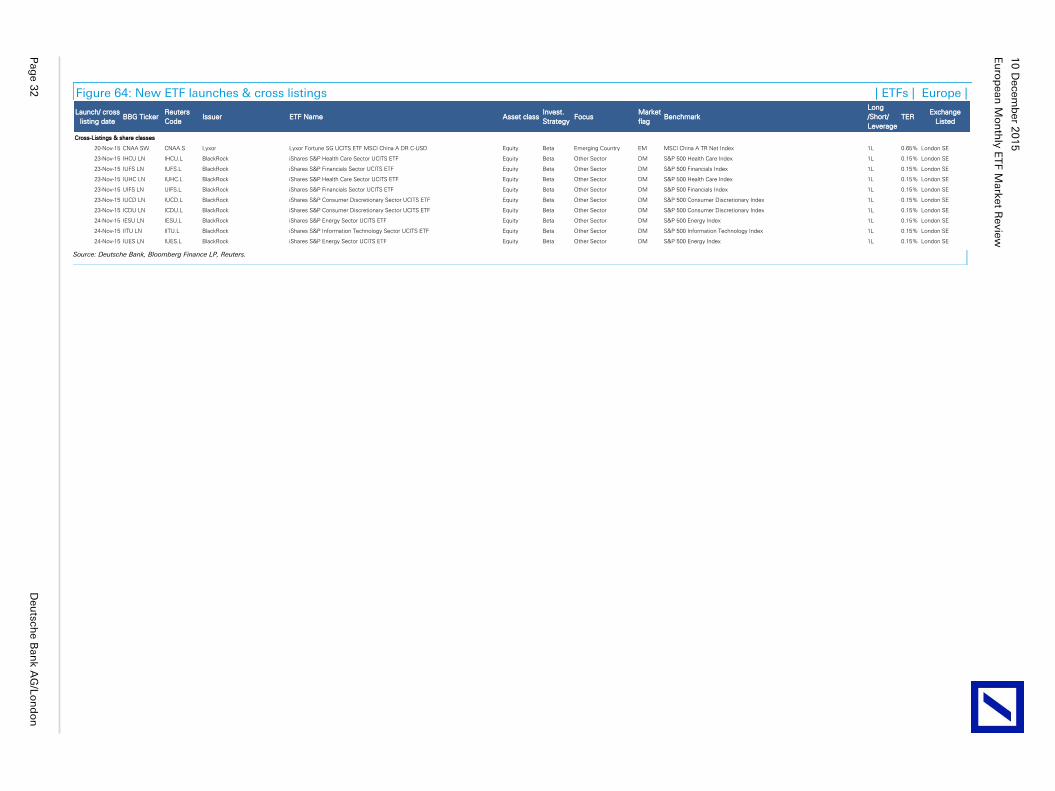
Eu
rop
ean
Mo
nth
ly E
TF M
ark
et R
evie
w
10
Decem
ber 2
01
5
Pag
e 3
2
Deu
tsch
e B
an
k A
G/L
on
do
n
Figure 64: New ETF launches & cross listings | ETFs | Europe |
Launch/ cross
listing dateBBG Ticker
Reuters
CodeIssuer ETF Name Asset class
Invest.
StrategyFocus
Market
flagBenchmark
Long
/Short/
Leverage
TERExchange
Listed
Cross-Listings & share classes
20-Nov-15 CNAA SW CNAA.S Lyxor Lyxor Fortune SG UCITS ETF MSCI China A DR C-USD Equity Beta Emerging Country EM MSCI China A TR Net Index 1L 0.65% London SE
23-Nov-15 IHCU LN IHCU.L BlackRock iShares S&P Health Care Sector UCITS ETF Equity Beta Other Sector DM S&P 500 Health Care Index 1L 0.15% London SE
23-Nov-15 IUFS LN IUFS.L BlackRock iShares S&P Financials Sector UCITS ETF Equity Beta Other Sector DM S&P 500 Financials Index 1L 0.15% London SE
23-Nov-15 IUHC LN IUHC.L BlackRock iShares S&P Health Care Sector UCITS ETF Equity Beta Other Sector DM S&P 500 Health Care Index 1L 0.15% London SE
23-Nov-15 UIFS LN UIFS.L BlackRock iShares S&P Financials Sector UCITS ETF Equity Beta Other Sector DM S&P 500 Financials Index 1L 0.15% London SE
23-Nov-15 IUCD LN IUCD.L BlackRock iShares S&P Consumer Discretionary Sector UCITS ETF Equity Beta Other Sector DM S&P 500 Consumer Discretionary Index 1L 0.15% London SE
23-Nov-15 ICDU LN ICDU.L BlackRock iShares S&P Consumer Discretionary Sector UCITS ETF Equity Beta Other Sector DM S&P 500 Consumer Discretionary Index 1L 0.15% London SE
24-Nov-15 IESU LN IESU.L BlackRock iShares S&P Energy Sector UCITS ETF Equity Beta Other Sector DM S&P 500 Energy Index 1L 0.15% London SE
24-Nov-15 IITU LN IITU.L BlackRock iShares S&P Information Technology Sector UCITS ETF Equity Beta Other Sector DM S&P 500 Information Technology Index 1L 0.15% London SE
24-Nov-15 IUES LN IUES.L BlackRock iShares S&P Energy Sector UCITS ETF Equity Beta Other Sector DM S&P 500 Energy Index 1L 0.15% London SE Source: Deutsche Bank, Bloomberg Finance LP, Reuters.
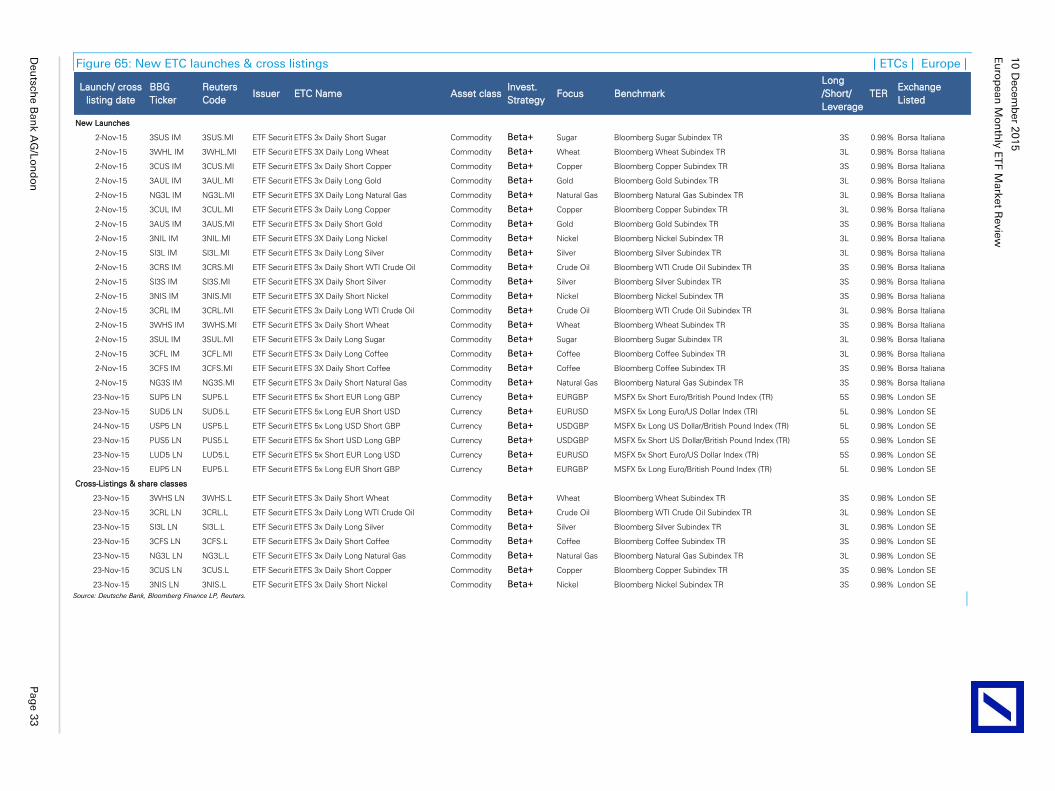
Eu
rop
ean
Mo
nth
ly E
TF M
ark
et R
evie
w
10
Decem
ber 2
01
5
Deu
tsch
e B
an
k A
G/L
on
do
n
Pag
e 3
3
Figure 65: New ETC launches & cross listings | ETCs | Europe |
Launch/ cross
listing date
BBG
Ticker
Reuters
CodeIssuer ETC Name Asset class
Invest.
StrategyFocus Benchmark
Long
/Short/
Leverage
TERExchange
Listed
New Launches
2-Nov-15 3SUS IM 3SUS.MI ETF SecuritiesETFS 3x Daily Short Sugar Commodity Beta+ Sugar Bloomberg Sugar Subindex TR 3S 0.98% Borsa Italiana
2-Nov-15 3WHL IM 3WHL.MI ETF SecuritiesETFS 3X Daily Long Wheat Commodity Beta+ Wheat Bloomberg Wheat Subindex TR 3L 0.98% Borsa Italiana
2-Nov-15 3CUS IM 3CUS.MI ETF SecuritiesETFS 3x Daily Short Copper Commodity Beta+ Copper Bloomberg Copper Subindex TR 3S 0.98% Borsa Italiana
2-Nov-15 3AUL IM 3AUL.MI ETF SecuritiesETFS 3x Daily Long Gold Commodity Beta+ Gold Bloomberg Gold Subindex TR 3L 0.98% Borsa Italiana
2-Nov-15 NG3L IM NG3L.MI ETF SecuritiesETFS 3X Daily Long Natural Gas Commodity Beta+ Natural Gas Bloomberg Natural Gas Subindex TR 3L 0.98% Borsa Italiana
2-Nov-15 3CUL IM 3CUL.MI ETF SecuritiesETFS 3x Daily Long Copper Commodity Beta+ Copper Bloomberg Copper Subindex TR 3L 0.98% Borsa Italiana
2-Nov-15 3AUS IM 3AUS.MI ETF SecuritiesETFS 3x Daily Short Gold Commodity Beta+ Gold Bloomberg Gold Subindex TR 3S 0.98% Borsa Italiana
2-Nov-15 3NIL IM 3NIL.MI ETF SecuritiesETFS 3X Daily Long Nickel Commodity Beta+ Nickel Bloomberg Nickel Subindex TR 3L 0.98% Borsa Italiana
2-Nov-15 SI3L IM SI3L.MI ETF SecuritiesETFS 3x Daily Long Silver Commodity Beta+ Silver Bloomberg Silver Subindex TR 3L 0.98% Borsa Italiana
2-Nov-15 3CRS IM 3CRS.MI ETF SecuritiesETFS 3x Daily Short WTI Crude Oil Commodity Beta+ Crude Oil Bloomberg WTI Crude Oil Subindex TR 3S 0.98% Borsa Italiana
2-Nov-15 SI3S IM SI3S.MI ETF SecuritiesETFS 3X Daily Short Silver Commodity Beta+ Silver Bloomberg Silver Subindex TR 3S 0.98% Borsa Italiana
2-Nov-15 3NIS IM 3NIS.MI ETF SecuritiesETFS 3X Daily Short Nickel Commodity Beta+ Nickel Bloomberg Nickel Subindex TR 3S 0.98% Borsa Italiana
2-Nov-15 3CRL IM 3CRL.MI ETF SecuritiesETFS 3x Daily Long WTI Crude Oil Commodity Beta+ Crude Oil Bloomberg WTI Crude Oil Subindex TR 3L 0.98% Borsa Italiana
2-Nov-15 3WHS IM 3WHS.MI ETF SecuritiesETFS 3x Daily Short Wheat Commodity Beta+ Wheat Bloomberg Wheat Subindex TR 3S 0.98% Borsa Italiana
2-Nov-15 3SUL IM 3SUL.MI ETF SecuritiesETFS 3x Daily Long Sugar Commodity Beta+ Sugar Bloomberg Sugar Subindex TR 3L 0.98% Borsa Italiana
2-Nov-15 3CFL IM 3CFL.MI ETF SecuritiesETFS 3x Daily Long Coffee Commodity Beta+ Coffee Bloomberg Coffee Subindex TR 3L 0.98% Borsa Italiana
2-Nov-15 3CFS IM 3CFS.MI ETF SecuritiesETFS 3X Daily Short Coffee Commodity Beta+ Coffee Bloomberg Coffee Subindex TR 3S 0.98% Borsa Italiana
2-Nov-15 NG3S IM NG3S.MI ETF SecuritiesETFS 3x Daily Short Natural Gas Commodity Beta+ Natural Gas Bloomberg Natural Gas Subindex TR 3S 0.98% Borsa Italiana
23-Nov-15 SUP5 LN SUP5.L ETF SecuritiesETFS 5x Short EUR Long GBP Currency Beta+ EURGBP MSFX 5x Short Euro/British Pound Index (TR) 5S 0.98% London SE
23-Nov-15 SUD5 LN SUD5.L ETF SecuritiesETFS 5x Long EUR Short USD Currency Beta+ EURUSD MSFX 5x Long Euro/US Dollar Index (TR) 5L 0.98% London SE
24-Nov-15 USP5 LN USP5.L ETF SecuritiesETFS 5x Long USD Short GBP Currency Beta+ USDGBP MSFX 5x Long US Dollar/British Pound Index (TR) 5L 0.98% London SE
23-Nov-15 PUS5 LN PUS5.L ETF SecuritiesETFS 5x Short USD Long GBP Currency Beta+ USDGBP MSFX 5x Short US Dollar/British Pound Index (TR) 5S 0.98% London SE
23-Nov-15 LUD5 LN LUD5.L ETF SecuritiesETFS 5x Short EUR Long USD Currency Beta+ EURUSD MSFX 5x Short Euro/US Dollar Index (TR) 5S 0.98% London SE
23-Nov-15 EUP5 LN EUP5.L ETF SecuritiesETFS 5x Long EUR Short GBP Currency Beta+ EURGBP MSFX 5x Long Euro/British Pound Index (TR) 5L 0.98% London SE
Cross-Listings & share classes
23-Nov-15 3WHS LN 3WHS.L ETF SecuritiesETFS 3x Daily Short Wheat Commodity Beta+ Wheat Bloomberg Wheat Subindex TR 3S 0.98% London SE
23-Nov-15 3CRL LN 3CRL.L ETF SecuritiesETFS 3x Daily Long WTI Crude Oil Commodity Beta+ Crude Oil Bloomberg WTI Crude Oil Subindex TR 3L 0.98% London SE
23-Nov-15 SI3L LN SI3L.L ETF SecuritiesETFS 3x Daily Long Silver Commodity Beta+ Silver Bloomberg Silver Subindex TR 3L 0.98% London SE
23-Nov-15 3CFS LN 3CFS.L ETF SecuritiesETFS 3x Daily Short Coffee Commodity Beta+ Coffee Bloomberg Coffee Subindex TR 3S 0.98% London SE
23-Nov-15 NG3L LN NG3L.L ETF SecuritiesETFS 3x Daily Long Natural Gas Commodity Beta+ Natural Gas Bloomberg Natural Gas Subindex TR 3L 0.98% London SE
23-Nov-15 3CUS LN 3CUS.L ETF SecuritiesETFS 3x Daily Short Copper Commodity Beta+ Copper Bloomberg Copper Subindex TR 3S 0.98% London SE
23-Nov-15 3NIS LN 3NIS.L ETF SecuritiesETFS 3x Daily Short Nickel Commodity Beta+ Nickel Bloomberg Nickel Subindex TR 3S 0.98% London SE Source: Deutsche Bank, Bloomberg Finance LP, Reuters.
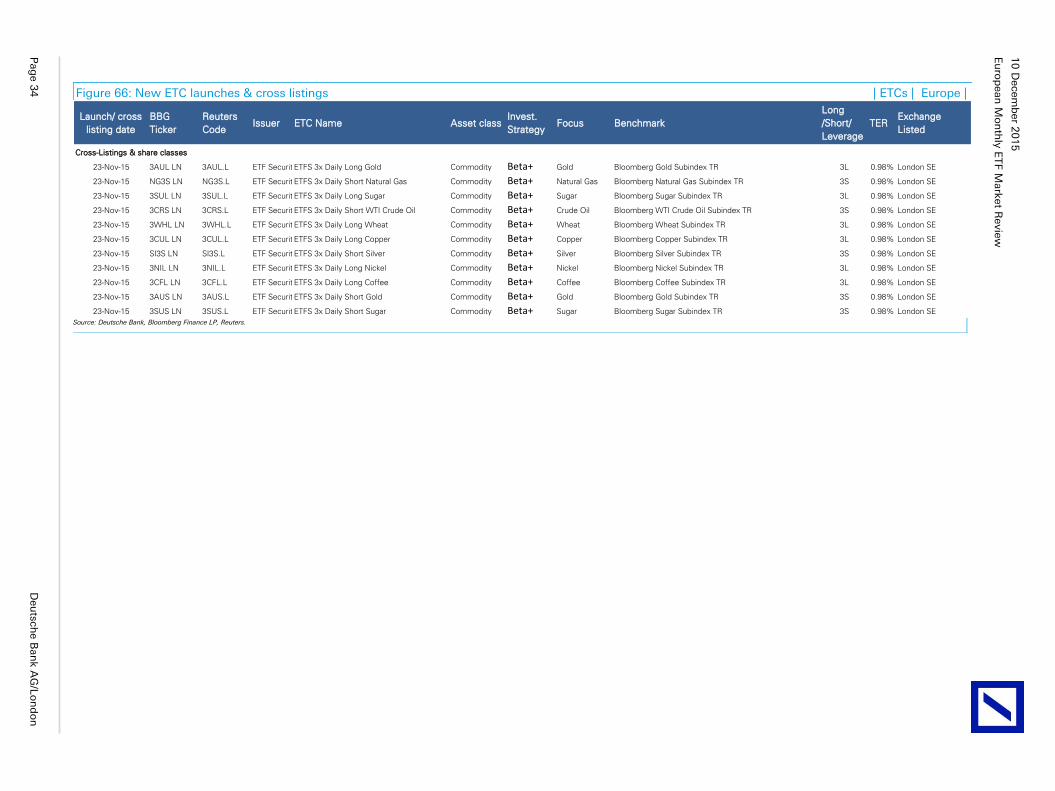
Eu
rop
ean
Mo
nth
ly E
TF M
ark
et R
evie
w
10
Decem
ber 2
01
5
Pag
e 3
4
Deu
tsch
e B
an
k A
G/L
on
do
n
Figure 66: New ETC launches & cross listings | ETCs | Europe |
Launch/ cross
listing date
BBG
Ticker
Reuters
CodeIssuer ETC Name Asset class
Invest.
StrategyFocus Benchmark
Long
/Short/
Leverage
TERExchange
Listed
Cross-Listings & share classes
23-Nov-15 3AUL LN 3AUL.L ETF SecuritiesETFS 3x Daily Long Gold Commodity Beta+ Gold Bloomberg Gold Subindex TR 3L 0.98% London SE
23-Nov-15 NG3S LN NG3S.L ETF SecuritiesETFS 3x Daily Short Natural Gas Commodity Beta+ Natural Gas Bloomberg Natural Gas Subindex TR 3S 0.98% London SE
23-Nov-15 3SUL LN 3SUL.L ETF SecuritiesETFS 3x Daily Long Sugar Commodity Beta+ Sugar Bloomberg Sugar Subindex TR 3L 0.98% London SE
23-Nov-15 3CRS LN 3CRS.L ETF SecuritiesETFS 3x Daily Short WTI Crude Oil Commodity Beta+ Crude Oil Bloomberg WTI Crude Oil Subindex TR 3S 0.98% London SE
23-Nov-15 3WHL LN 3WHL.L ETF SecuritiesETFS 3x Daily Long Wheat Commodity Beta+ Wheat Bloomberg Wheat Subindex TR 3L 0.98% London SE
23-Nov-15 3CUL LN 3CUL.L ETF SecuritiesETFS 3x Daily Long Copper Commodity Beta+ Copper Bloomberg Copper Subindex TR 3L 0.98% London SE
23-Nov-15 SI3S LN SI3S.L ETF SecuritiesETFS 3x Daily Short Silver Commodity Beta+ Silver Bloomberg Silver Subindex TR 3S 0.98% London SE
23-Nov-15 3NIL LN 3NIL.L ETF SecuritiesETFS 3x Daily Long Nickel Commodity Beta+ Nickel Bloomberg Nickel Subindex TR 3L 0.98% London SE
23-Nov-15 3CFL LN 3CFL.L ETF SecuritiesETFS 3x Daily Long Coffee Commodity Beta+ Coffee Bloomberg Coffee Subindex TR 3L 0.98% London SE
23-Nov-15 3AUS LN 3AUS.L ETF SecuritiesETFS 3x Daily Short Gold Commodity Beta+ Gold Bloomberg Gold Subindex TR 3S 0.98% London SE
23-Nov-15 3SUS LN 3SUS.L ETF SecuritiesETFS 3x Daily Short Sugar Commodity Beta+ Sugar Bloomberg Sugar Subindex TR 3S 0.98% London SE Source: Deutsche Bank, Bloomberg Finance LP, Reuters.
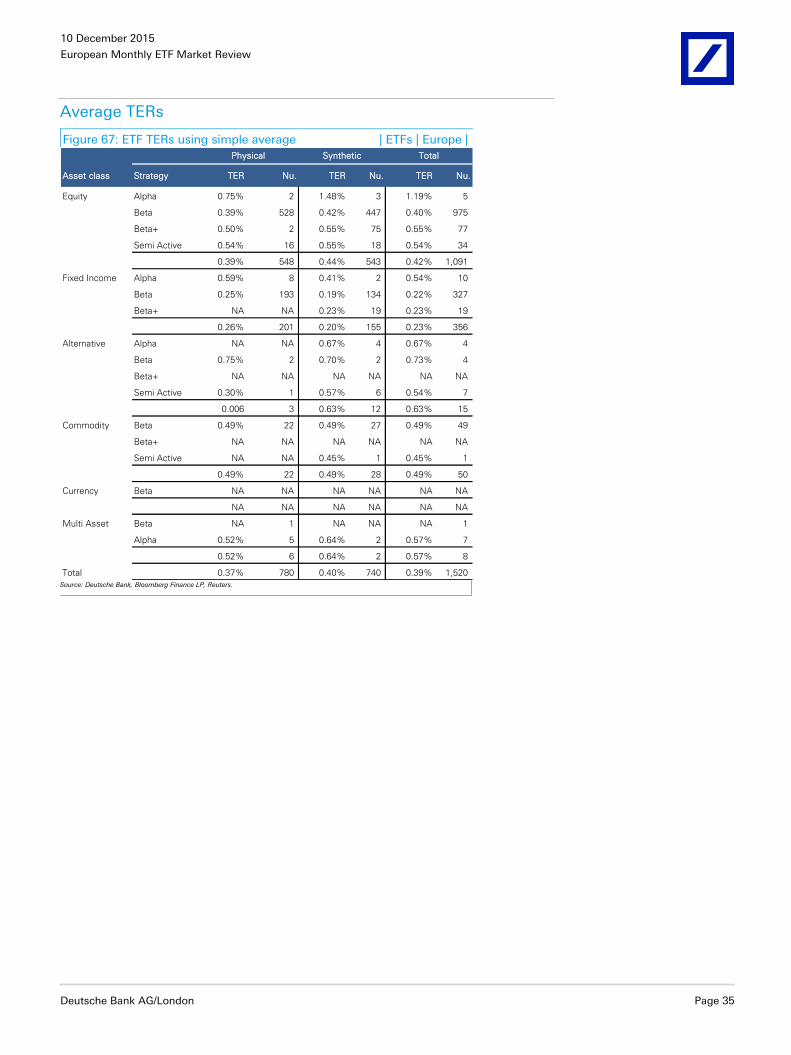
10 December 2015
European Monthly ETF Market Review
Deutsche Bank AG/London Page 35
Average TERs
Figure 67: ETF TERs using simple average | ETFs | Europe |
Asset class Strategy TER Nu. TER Nu. TER Nu.
Equity Alpha 0.75% 2 1.48% 3 1.19% 5
Beta 0.39% 528 0.42% 447 0.40% 975
Beta+ 0.50% 2 0.55% 75 0.55% 77
Semi Active 0.54% 16 0.55% 18 0.54% 34
0.39% 548 0.44% 543 0.42% 1,091
Fixed Income Alpha 0.59% 8 0.41% 2 0.54% 10
Beta 0.25% 193 0.19% 134 0.22% 327
Beta+ NA NA 0.23% 19 0.23% 19
0.26% 201 0.20% 155 0.23% 356
Alternative Alpha NA NA 0.67% 4 0.67% 4
Beta 0.75% 2 0.70% 2 0.73% 4
Beta+ NA NA NA NA NA NA
Semi Active 0.30% 1 0.57% 6 0.54% 7
0.006 3 0.63% 12 0.63% 15
Commodity Beta 0.49% 22 0.49% 27 0.49% 49
Beta+ NA NA NA NA NA NA
Semi Active NA NA 0.45% 1 0.45% 1
0.49% 22 0.49% 28 0.49% 50
Currency Beta NA NA NA NA NA NA
NA NA NA NA NA NA
Multi Asset Beta NA 1 NA NA NA 1
Alpha 0.52% 5 0.64% 2 0.57% 7
0.52% 6 0.64% 2 0.57% 8
Total 0.37% 780 0.40% 740 0.39% 1,520
Physical Synthetic Total
Source: Deutsche Bank, Bloomberg Finance LP, Reuters.
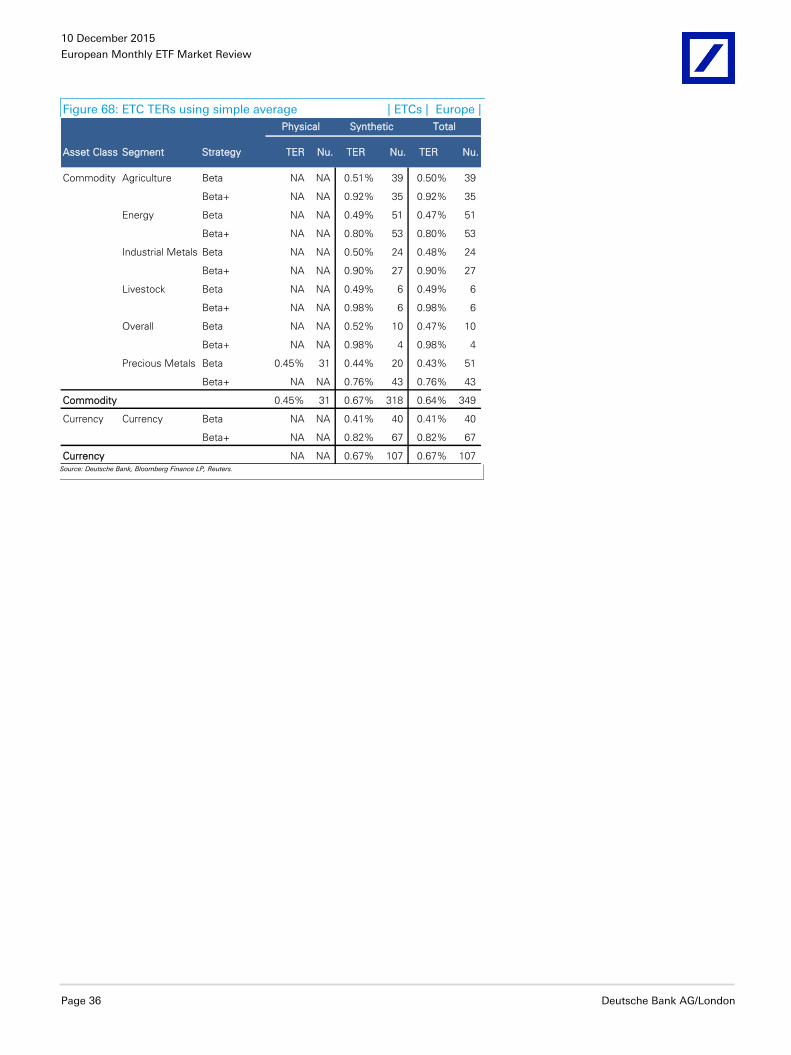
10 December 2015
European Monthly ETF Market Review
Page 36 Deutsche Bank AG/London
Figure 68: ETC TERs using simple average | ETCs | Europe |
Asset Class Segment Strategy TER Nu. TER Nu. TER Nu.
Commodity Agriculture Beta NA NA 0.51% 39 0.50% 39
Beta+ NA NA 0.92% 35 0.92% 35
Energy Beta NA NA 0.49% 51 0.47% 51
Beta+ NA NA 0.80% 53 0.80% 53
Industrial Metals Beta NA NA 0.50% 24 0.48% 24
Beta+ NA NA 0.90% 27 0.90% 27
Livestock Beta NA NA 0.49% 6 0.49% 6
Beta+ NA NA 0.98% 6 0.98% 6
Overall Beta NA NA 0.52% 10 0.47% 10
Beta+ NA NA 0.98% 4 0.98% 4
Precious Metals Beta 0.45% 31 0.44% 20 0.43% 51
Beta+ NA NA 0.76% 43 0.76% 43
Commodity 0.45% 31 0.67% 318 0.64% 349
Currency Currency Beta NA NA 0.41% 40 0.41% 40
Beta+ NA NA 0.82% 67 0.82% 67
Currency NA NA 0.67% 107 0.67% 107
Physical Synthetic Total
Source: Deutsche Bank, Bloomberg Finance LP, Reuters.
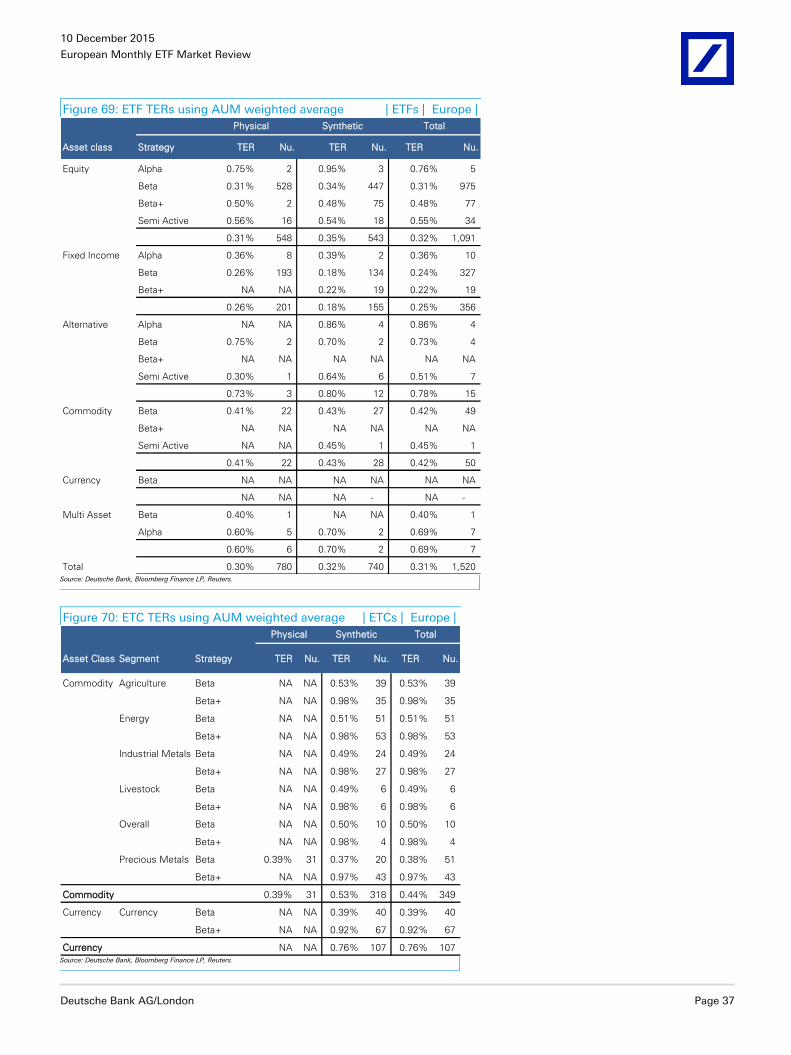
10 December 2015
European Monthly ETF Market Review
Deutsche Bank AG/London Page 37
Figure 69: ETF TERs using AUM weighted average | ETFs | Europe |
Asset class Strategy TER Nu. TER Nu. TER Nu.
Equity Alpha 0.75% 2 0.95% 3 0.76% 5
Beta 0.31% 528 0.34% 447 0.31% 975
Beta+ 0.50% 2 0.48% 75 0.48% 77
Semi Active 0.56% 16 0.54% 18 0.55% 34
0.31% 548 0.35% 543 0.32% 1,091
Fixed Income Alpha 0.36% 8 0.39% 2 0.36% 10
Beta 0.26% 193 0.18% 134 0.24% 327
Beta+ NA NA 0.22% 19 0.22% 19
0.26% 201 0.18% 155 0.25% 356
Alternative Alpha NA NA 0.86% 4 0.86% 4
Beta 0.75% 2 0.70% 2 0.73% 4
Beta+ NA NA NA NA NA NA
Semi Active 0.30% 1 0.64% 6 0.51% 7
0.73% 3 0.80% 12 0.78% 15
Commodity Beta 0.41% 22 0.43% 27 0.42% 49
Beta+ NA NA NA NA NA NA
Semi Active NA NA 0.45% 1 0.45% 1
0.41% 22 0.43% 28 0.42% 50
Currency Beta NA NA NA NA NA NA
NA NA NA - NA -
Multi Asset Beta 0.40% 1 NA NA 0.40% 1
Alpha 0.60% 5 0.70% 2 0.69% 7
0.60% 6 0.70% 2 0.69% 7
Total 0.30% 780 0.32% 740 0.31% 1,520
Synthetic TotalPhysical
Source: Deutsche Bank, Bloomberg Finance LP, Reuters.
Figure 70: ETC TERs using AUM weighted average | ETCs | Europe |
Asset Class Segment Strategy TER Nu. TER Nu. TER Nu.
Commodity Agriculture Beta NA NA 0.53% 39 0.53% 39
Beta+ NA NA 0.98% 35 0.98% 35
Energy Beta NA NA 0.51% 51 0.51% 51
Beta+ NA NA 0.98% 53 0.98% 53
Industrial Metals Beta NA NA 0.49% 24 0.49% 24
Beta+ NA NA 0.98% 27 0.98% 27
Livestock Beta NA NA 0.49% 6 0.49% 6
Beta+ NA NA 0.98% 6 0.98% 6
Overall Beta NA NA 0.50% 10 0.50% 10
Beta+ NA NA 0.98% 4 0.98% 4
Precious Metals Beta 0.39% 31 0.37% 20 0.38% 51
Beta+ NA NA 0.97% 43 0.97% 43
Commodity 0.39% 31 0.53% 318 0.44% 349
Currency Currency Beta NA NA 0.39% 40 0.39% 40
Beta+ NA NA 0.92% 67 0.92% 67
Currency NA NA 0.76% 107 0.76% 107
TotalPhysical Synthetic
Source: Deutsche Bank, Bloomberg Finance LP, Reuters.
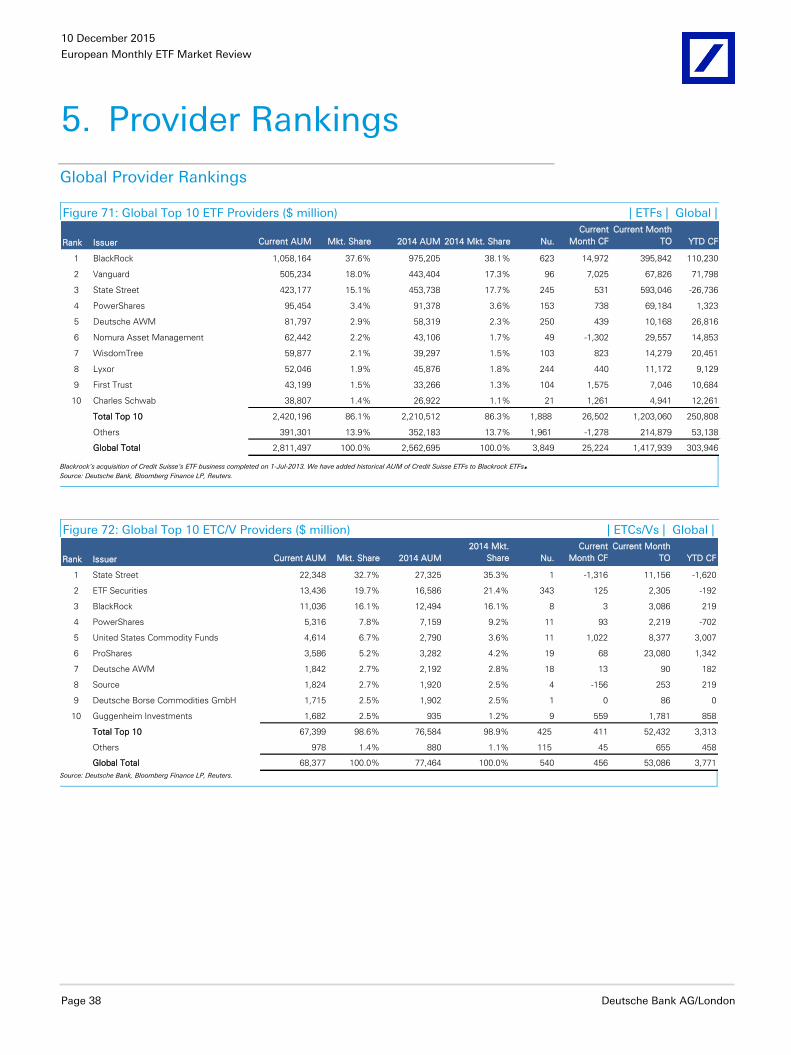
10 December 2015
European Monthly ETF Market Review
Page 38 Deutsche Bank AG/London
5. Provider Rankings
Global Provider Rankings
Figure 71: Global Top 10 ETF Providers ($ million) | ETFs | Global |
Rank Issuer Current AUM Mkt. Share 2014 AUM 2014 Mkt. Share Nu.
Current
Month CF
Current Month
TO YTD CF
1 BlackRock 1,058,164 37.6% 975,205 38.1% 623 14,972 395,842 110,230
2 Vanguard 505,234 18.0% 443,404 17.3% 96 7,025 67,826 71,798
3 State Street 423,177 15.1% 453,738 17.7% 245 531 593,046 -26,736
4 PowerShares 95,454 3.4% 91,378 3.6% 153 738 69,184 1,323
5 Deutsche AWM 81,797 2.9% 58,319 2.3% 250 439 10,168 26,816
6 Nomura Asset Management 62,442 2.2% 43,106 1.7% 49 -1,302 29,557 14,853
7 WisdomTree 59,877 2.1% 39,297 1.5% 103 823 14,279 20,451
8 Lyxor 52,046 1.9% 45,876 1.8% 244 440 11,172 9,129
9 First Trust 43,199 1.5% 33,266 1.3% 104 1,575 7,046 10,684
10 Charles Schwab 38,807 1.4% 26,922 1.1% 21 1,261 4,941 12,261
Total Top 10 2,420,196 86.1% 2,210,512 86.3% 1,888 26,502 1,203,060 250,808
Others 391,301 13.9% 352,183 13.7% 1,961 -1,278 214,879 53,138
Global Total 2,811,497 100.0% 2,562,695 100.0% 3,849 25,224 1,417,939 303,946
Blackrock’s acquisition of Credit Suisse’s ETF business completed on 1-Jul-2013. We have added historical AUM of Credit Suisse ETFs to Blackrock ETFs.
Source: Deutsche Bank, Bloomberg Finance LP, Reuters.
Figure 72: Global Top 10 ETC/V Providers ($ million) | ETCs/Vs | Global |
Rank Issuer Current AUM Mkt. Share 2014 AUM
2014 Mkt.
Share Nu.
Current
Month CF
Current Month
TO YTD CF
1 State Street 22,348 32.7% 27,325 35.3% 1 -1,316 11,156 -1,620
2 ETF Securities 13,436 19.7% 16,586 21.4% 343 125 2,305 -192
3 BlackRock 11,036 16.1% 12,494 16.1% 8 3 3,086 219
4 PowerShares 5,316 7.8% 7,159 9.2% 11 93 2,219 -702
5 United States Commodity Funds 4,614 6.7% 2,790 3.6% 11 1,022 8,377 3,007
6 ProShares 3,586 5.2% 3,282 4.2% 19 68 23,080 1,342
7 Deutsche AWM 1,842 2.7% 2,192 2.8% 18 13 90 182
8 Source 1,824 2.7% 1,920 2.5% 4 -156 253 219
9 Deutsche Borse Commodities GmbH 1,715 2.5% 1,902 2.5% 1 0 86 0
10 Guggenheim Investments 1,682 2.5% 935 1.2% 9 559 1,781 858
Total Top 10 67,399 98.6% 76,584 98.9% 425 411 52,432 3,313
Others 978 1.4% 880 1.1% 115 45 655 458
Global Total 68,377 100.0% 77,464 100.0% 540 456 53,086 3,771 Source: Deutsche Bank, Bloomberg Finance LP, Reuters.
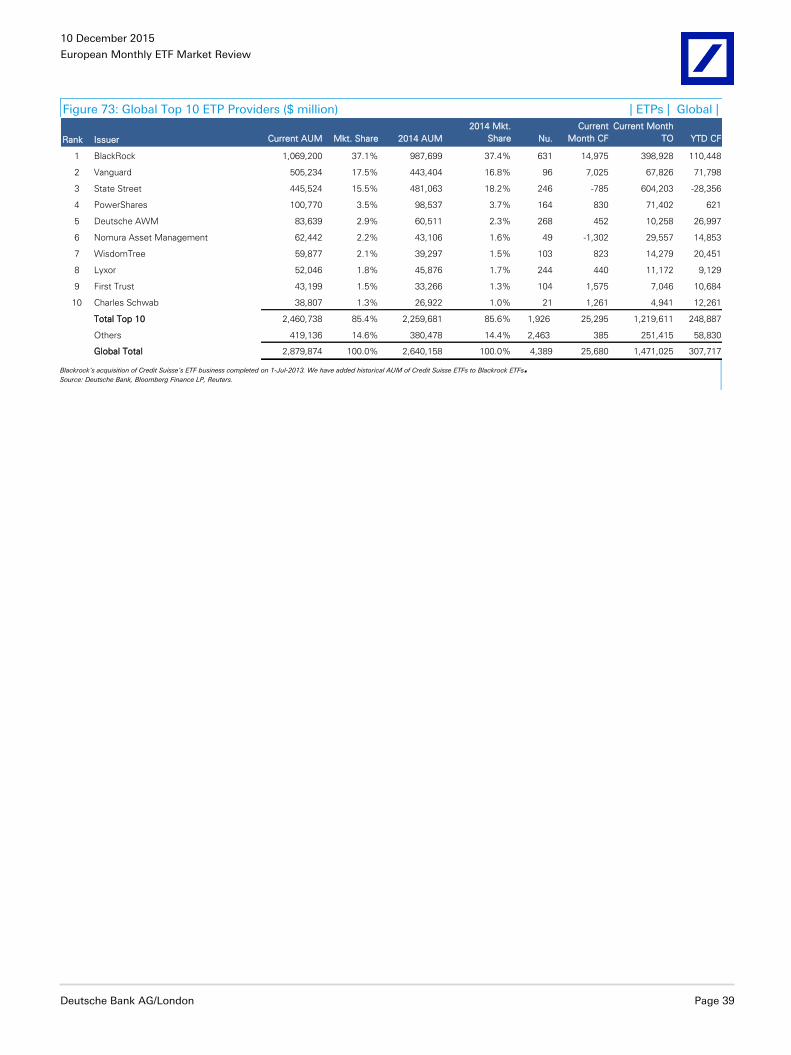
10 December 2015
European Monthly ETF Market Review
Deutsche Bank AG/London Page 39
Figure 73: Global Top 10 ETP Providers ($ million) | ETPs | Global |
Rank Issuer Current AUM Mkt. Share 2014 AUM
2014 Mkt.
Share Nu.
Current
Month CF
Current Month
TO YTD CF
1 BlackRock 1,069,200 37.1% 987,699 37.4% 631 14,975 398,928 110,448
2 Vanguard 505,234 17.5% 443,404 16.8% 96 7,025 67,826 71,798
3 State Street 445,524 15.5% 481,063 18.2% 246 -785 604,203 -28,356
4 PowerShares 100,770 3.5% 98,537 3.7% 164 830 71,402 621
5 Deutsche AWM 83,639 2.9% 60,511 2.3% 268 452 10,258 26,997
6 Nomura Asset Management 62,442 2.2% 43,106 1.6% 49 -1,302 29,557 14,853
7 WisdomTree 59,877 2.1% 39,297 1.5% 103 823 14,279 20,451
8 Lyxor 52,046 1.8% 45,876 1.7% 244 440 11,172 9,129
9 First Trust 43,199 1.5% 33,266 1.3% 104 1,575 7,046 10,684
10 Charles Schwab 38,807 1.3% 26,922 1.0% 21 1,261 4,941 12,261
Total Top 10 2,460,738 85.4% 2,259,681 85.6% 1,926 25,295 1,219,611 248,887
Others 419,136 14.6% 380,478 14.4% 2,463 385 251,415 58,830
Global Total 2,879,874 100.0% 2,640,158 100.0% 4,389 25,680 1,471,025 307,717
Blackrock’s acquisition of Credit Suisse’s ETF business completed on 1-Jul-2013. We have added historical AUM of Credit Suisse ETFs to Blackrock ETFs.
Source: Deutsche Bank, Bloomberg Finance LP, Reuters.
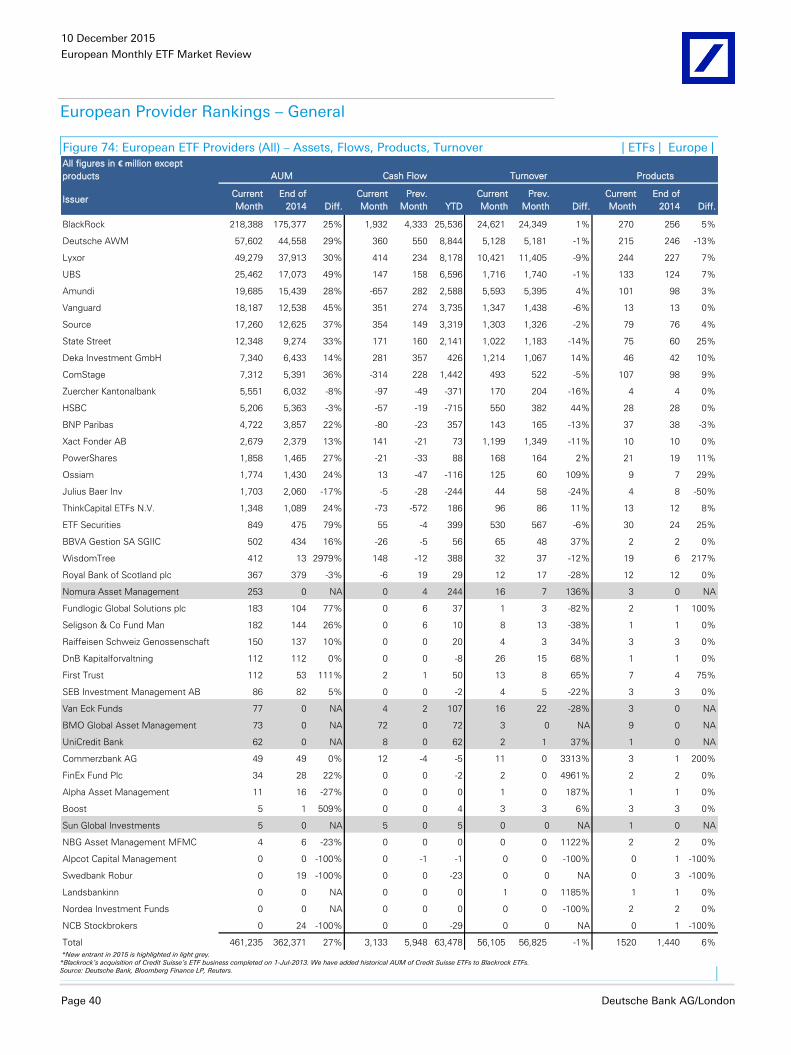
10 December 2015
European Monthly ETF Market Review
Page 40 Deutsche Bank AG/London
European Provider Rankings – General
Figure 74: European ETF Providers (All) – Assets, Flows, Products, Turnover | ETFs | Europe |
All figures in € million except
products
Issuer Current
Month
End of
2014 Diff.
Current
Month
Prev.
Month YTD
Current
Month
Prev.
Month Diff.
Current
Month
End of
2014 Diff.
BlackRock 218,388 175,377 25% 1,932 4,333 25,536 24,621 24,349 1% 270 256 5%
Deutsche AWM 57,602 44,558 29% 360 550 8,844 5,128 5,181 -1% 215 246 -13%
Lyxor 49,279 37,913 30% 414 234 8,178 10,421 11,405 -9% 244 227 7%
UBS 25,462 17,073 49% 147 158 6,596 1,716 1,740 -1% 133 124 7%
Amundi 19,685 15,439 28% -657 282 2,588 5,593 5,395 4% 101 98 3%
Vanguard 18,187 12,538 45% 351 274 3,735 1,347 1,438 -6% 13 13 0%
Source 17,260 12,625 37% 354 149 3,319 1,303 1,326 -2% 79 76 4%
State Street 12,348 9,274 33% 171 160 2,141 1,022 1,183 -14% 75 60 25%
Deka Investment GmbH 7,340 6,433 14% 281 357 426 1,214 1,067 14% 46 42 10%
ComStage 7,312 5,391 36% -314 228 1,442 493 522 -5% 107 98 9%
Zuercher Kantonalbank 5,551 6,032 -8% -97 -49 -371 170 204 -16% 4 4 0%
HSBC 5,206 5,363 -3% -57 -19 -715 550 382 44% 28 28 0%
BNP Paribas 4,722 3,857 22% -80 -23 357 143 165 -13% 37 38 -3%
Xact Fonder AB 2,679 2,379 13% 141 -21 73 1,199 1,349 -11% 10 10 0%
PowerShares 1,858 1,465 27% -21 -33 88 168 164 2% 21 19 11%
Ossiam 1,774 1,430 24% 13 -47 -116 125 60 109% 9 7 29%
Julius Baer Inv 1,703 2,060 -17% -5 -28 -244 44 58 -24% 4 8 -50%
ThinkCapital ETFs N.V. 1,348 1,089 24% -73 -572 186 96 86 11% 13 12 8%
ETF Securities 849 475 79% 55 -4 399 530 567 -6% 30 24 25%
BBVA Gestion SA SGIIC 502 434 16% -26 -5 56 65 48 37% 2 2 0%
WisdomTree 412 13 2979% 148 -12 388 32 37 -12% 19 6 217%
Royal Bank of Scotland plc 367 379 -3% -6 19 29 12 17 -28% 12 12 0%
Nomura Asset Management 253 0 NA 0 4 244 16 7 136% 3 0 NA
Fundlogic Global Solutions plc 183 104 77% 0 6 37 1 3 -82% 2 1 100%
Seligson & Co Fund Man 182 144 26% 0 6 10 8 13 -38% 1 1 0%
Raiffeisen Schweiz Genossenschaft 150 137 10% 0 0 20 4 3 34% 3 3 0%
DnB Kapitalforvaltning 112 112 0% 0 0 -8 26 15 68% 1 1 0%
First Trust 112 53 111% 2 1 50 13 8 65% 7 4 75%
SEB Investment Management AB 86 82 5% 0 0 -2 4 5 -22% 3 3 0%
Van Eck Funds 77 0 NA 4 2 107 16 22 -28% 3 0 NA
BMO Global Asset Management 73 0 NA 72 0 72 3 0 NA 9 0 NA
UniCredit Bank 62 0 NA 8 0 62 2 1 37% 1 0 NA
Commerzbank AG 49 49 0% 12 -4 -5 11 0 3313% 3 1 200%
FinEx Fund Plc 34 28 22% 0 0 -2 2 0 4961% 2 2 0%
Alpha Asset Management 11 16 -27% 0 0 0 1 0 187% 1 1 0%
Boost 5 1 509% 0 0 4 3 3 6% 3 3 0%
Sun Global Investments 5 0 NA 5 0 5 0 0 NA 1 0 NA
NBG Asset Management MFMC 4 6 -23% 0 0 0 0 0 1122% 2 2 0%
Alpcot Capital Management 0 0 -100% 0 -1 -1 0 0 -100% 0 1 -100%
Swedbank Robur 0 19 -100% 0 0 -23 0 0 NA 0 3 -100%
Landsbankinn 0 0 NA 0 0 0 1 0 1185% 1 1 0%
Nordea Investment Funds 0 0 NA 0 0 0 0 0 -100% 2 2 0%
NCB Stockbrokers 0 24 -100% 0 0 -29 0 0 NA 0 1 -100%
Total 461,235 362,371 27% 3,133 5,948 63,478 56,105 56,825 -1% 1520 1,440 6%
AUM Cash Flow Turnover Products
*New entrant in 2015 is highlighted in light grey. *Blackrock’s acquisition of Credit Suisse’s ETF business completed on 1-Jul-2013. We have added historical AUM of Credit Suisse ETFs to Blackrock ETFs. Source: Deutsche Bank, Bloomberg Finance LP, Reuters.
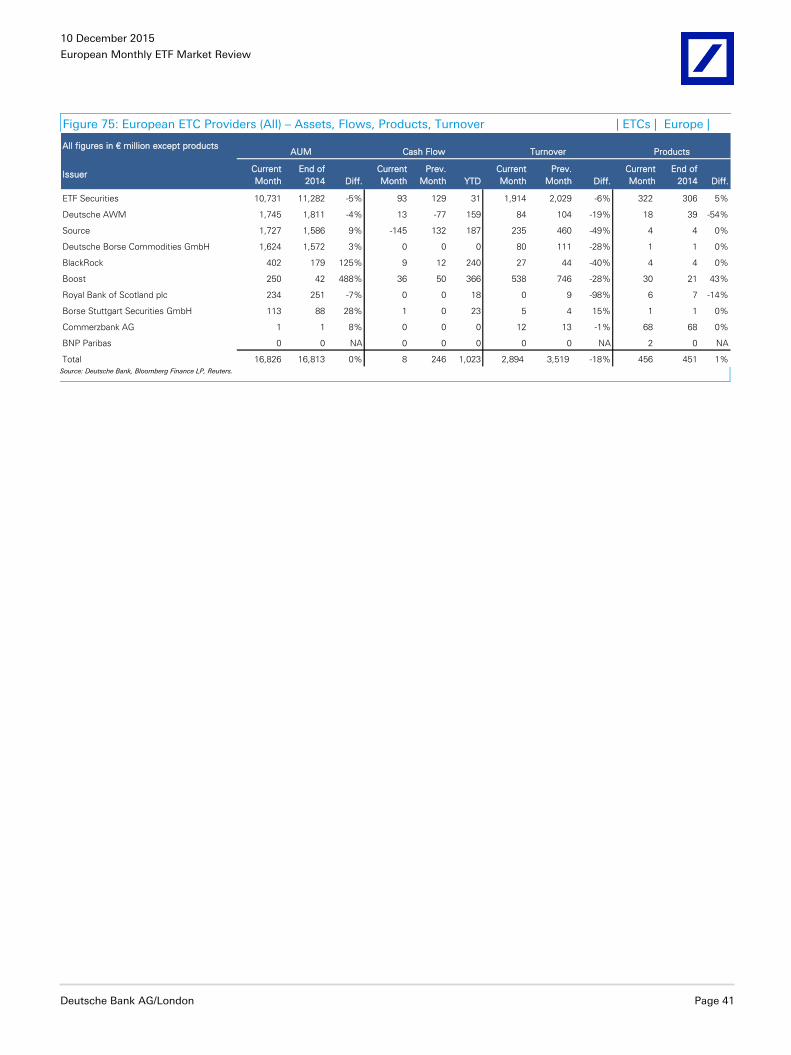
10 December 2015
European Monthly ETF Market Review
Deutsche Bank AG/London Page 41
Figure 75: European ETC Providers (All) – Assets, Flows, Products, Turnover | ETCs | Europe |
All figures in € million except products
Issuer Current
Month
End of
2014 Diff.
Current
Month
Prev.
Month YTD
Current
Month
Prev.
Month Diff.
Current
Month
End of
2014 Diff.
ETF Securities 10,731 11,282 -5% 93 129 31 1,914 2,029 -6% 322 306 5%
Deutsche AWM 1,745 1,811 -4% 13 -77 159 84 104 -19% 18 39 -54%
Source 1,727 1,586 9% -145 132 187 235 460 -49% 4 4 0%
Deutsche Borse Commodities GmbH 1,624 1,572 3% 0 0 0 80 111 -28% 1 1 0%
BlackRock 402 179 125% 9 12 240 27 44 -40% 4 4 0%
Boost 250 42 488% 36 50 366 538 746 -28% 30 21 43%
Royal Bank of Scotland plc 234 251 -7% 0 0 18 0 9 -98% 6 7 -14%
Borse Stuttgart Securities GmbH 113 88 28% 1 0 23 5 4 15% 1 1 0%
Commerzbank AG 1 1 8% 0 0 0 12 13 -1% 68 68 0%
BNP Paribas 0 0 NA 0 0 0 0 0 NA 2 0 NA
Total 16,826 16,813 0% 8 246 1,023 2,894 3,519 -18% 456 451 1%
AUM Cash Flow Turnover Products
Source: Deutsche Bank, Bloomberg Finance LP, Reuters.
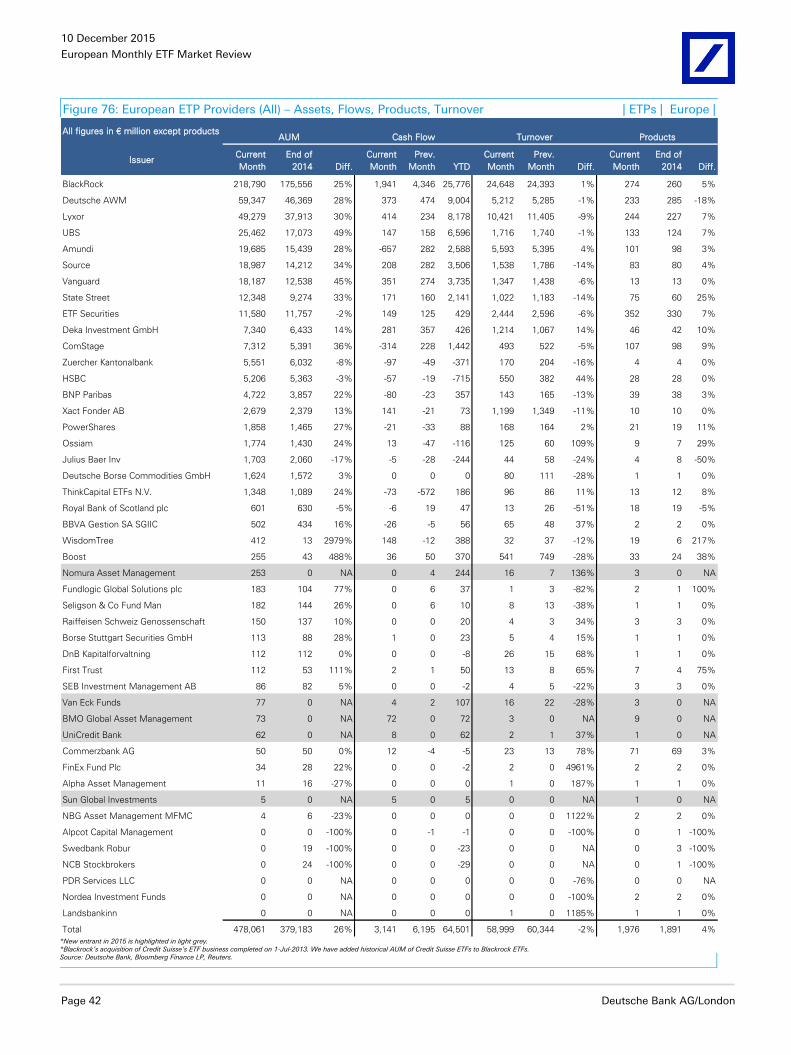
10 December 2015
European Monthly ETF Market Review
Page 42 Deutsche Bank AG/London
Figure 76: European ETP Providers (All) – Assets, Flows, Products, Turnover | ETPs | Europe |
All figures in € million except products
Issuer Current
Month
End of
2014 Diff.
Current
Month
Prev.
Month YTD
Current
Month
Prev.
Month Diff.
Current
Month
End of
2014 Diff.
BlackRock 218,790 175,556 25% 1,941 4,346 25,776 24,648 24,393 1% 274 260 5%
Deutsche AWM 59,347 46,369 28% 373 474 9,004 5,212 5,285 -1% 233 285 -18%
Lyxor 49,279 37,913 30% 414 234 8,178 10,421 11,405 -9% 244 227 7%
UBS 25,462 17,073 49% 147 158 6,596 1,716 1,740 -1% 133 124 7%
Amundi 19,685 15,439 28% -657 282 2,588 5,593 5,395 4% 101 98 3%
Source 18,987 14,212 34% 208 282 3,506 1,538 1,786 -14% 83 80 4%
Vanguard 18,187 12,538 45% 351 274 3,735 1,347 1,438 -6% 13 13 0%
State Street 12,348 9,274 33% 171 160 2,141 1,022 1,183 -14% 75 60 25%
ETF Securities 11,580 11,757 -2% 149 125 429 2,444 2,596 -6% 352 330 7%
Deka Investment GmbH 7,340 6,433 14% 281 357 426 1,214 1,067 14% 46 42 10%
ComStage 7,312 5,391 36% -314 228 1,442 493 522 -5% 107 98 9%
Zuercher Kantonalbank 5,551 6,032 -8% -97 -49 -371 170 204 -16% 4 4 0%
HSBC 5,206 5,363 -3% -57 -19 -715 550 382 44% 28 28 0%
BNP Paribas 4,722 3,857 22% -80 -23 357 143 165 -13% 39 38 3%
Xact Fonder AB 2,679 2,379 13% 141 -21 73 1,199 1,349 -11% 10 10 0%
PowerShares 1,858 1,465 27% -21 -33 88 168 164 2% 21 19 11%
Ossiam 1,774 1,430 24% 13 -47 -116 125 60 109% 9 7 29%
Julius Baer Inv 1,703 2,060 -17% -5 -28 -244 44 58 -24% 4 8 -50%
Deutsche Borse Commodities GmbH 1,624 1,572 3% 0 0 0 80 111 -28% 1 1 0%
ThinkCapital ETFs N.V. 1,348 1,089 24% -73 -572 186 96 86 11% 13 12 8%
Royal Bank of Scotland plc 601 630 -5% -6 19 47 13 26 -51% 18 19 -5%
BBVA Gestion SA SGIIC 502 434 16% -26 -5 56 65 48 37% 2 2 0%
WisdomTree 412 13 2979% 148 -12 388 32 37 -12% 19 6 217%
Boost 255 43 488% 36 50 370 541 749 -28% 33 24 38%
Nomura Asset Management 253 0 NA 0 4 244 16 7 136% 3 0 NA
Fundlogic Global Solutions plc 183 104 77% 0 6 37 1 3 -82% 2 1 100%
Seligson & Co Fund Man 182 144 26% 0 6 10 8 13 -38% 1 1 0%
Raiffeisen Schweiz Genossenschaft 150 137 10% 0 0 20 4 3 34% 3 3 0%
Borse Stuttgart Securities GmbH 113 88 28% 1 0 23 5 4 15% 1 1 0%
DnB Kapitalforvaltning 112 112 0% 0 0 -8 26 15 68% 1 1 0%
First Trust 112 53 111% 2 1 50 13 8 65% 7 4 75%
SEB Investment Management AB 86 82 5% 0 0 -2 4 5 -22% 3 3 0%
Van Eck Funds 77 0 NA 4 2 107 16 22 -28% 3 0 NA
BMO Global Asset Management 73 0 NA 72 0 72 3 0 NA 9 0 NA
UniCredit Bank 62 0 NA 8 0 62 2 1 37% 1 0 NA
Commerzbank AG 50 50 0% 12 -4 -5 23 13 78% 71 69 3%
FinEx Fund Plc 34 28 22% 0 0 -2 2 0 4961% 2 2 0%
Alpha Asset Management 11 16 -27% 0 0 0 1 0 187% 1 1 0%
Sun Global Investments 5 0 NA 5 0 5 0 0 NA 1 0 NA
NBG Asset Management MFMC 4 6 -23% 0 0 0 0 0 1122% 2 2 0%
Alpcot Capital Management 0 0 -100% 0 -1 -1 0 0 -100% 0 1 -100%
Swedbank Robur 0 19 -100% 0 0 -23 0 0 NA 0 3 -100%
NCB Stockbrokers 0 24 -100% 0 0 -29 0 0 NA 0 1 -100%
PDR Services LLC 0 0 NA 0 0 0 0 0 -76% 0 0 NA
Nordea Investment Funds 0 0 NA 0 0 0 0 0 -100% 2 2 0%
Landsbankinn 0 0 NA 0 0 0 1 0 1185% 1 1 0%
Total 478,061 379,183 26% 3,141 6,195 64,501 58,999 60,344 -2% 1,976 1,891 4%
ProductsAUM Cash Flow Turnover
*New entrant in 2015 is highlighted in light grey. *Blackrock’s acquisition of Credit Suisse’s ETF business completed on 1-Jul-2013. We have added historical AUM of Credit Suisse ETFs to Blackrock ETFs. Source: Deutsche Bank, Bloomberg Finance LP, Reuters.
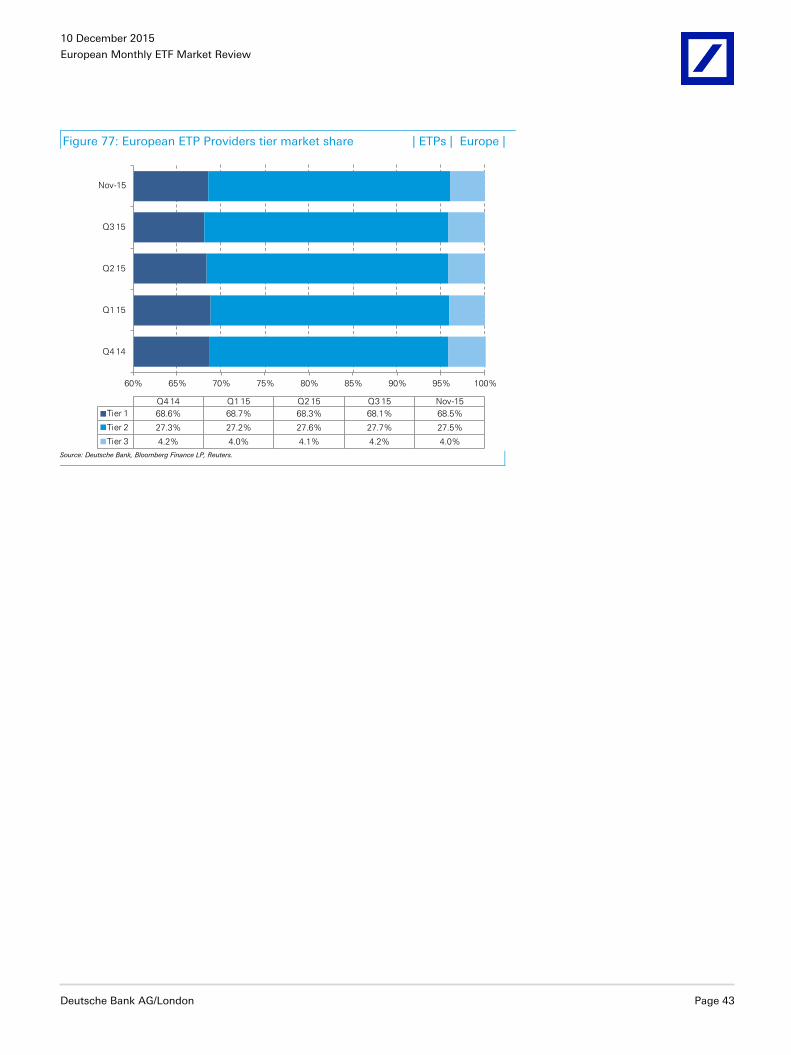
10 December 2015
European Monthly ETF Market Review
Deutsche Bank AG/London Page 43
Figure 77: European ETP Providers tier market share | ETPs | Europe |
60% 65% 70% 75% 80% 85% 90% 95% 100%
Q4 14
Q1 15
Q2 15
Q3 15
Nov-15
Q4 14 Q1 15 Q2 15 Q3 15 Nov-15
Tier 1 68.6% 68.7% 68.3% 68.1% 68.5%
Tier 2 27.3% 27.2% 27.6% 27.7% 27.5%
Tier 3 4.2% 4.0% 4.1% 4.2% 4.0%
Source: Deutsche Bank, Bloomberg Finance LP, Reuters.
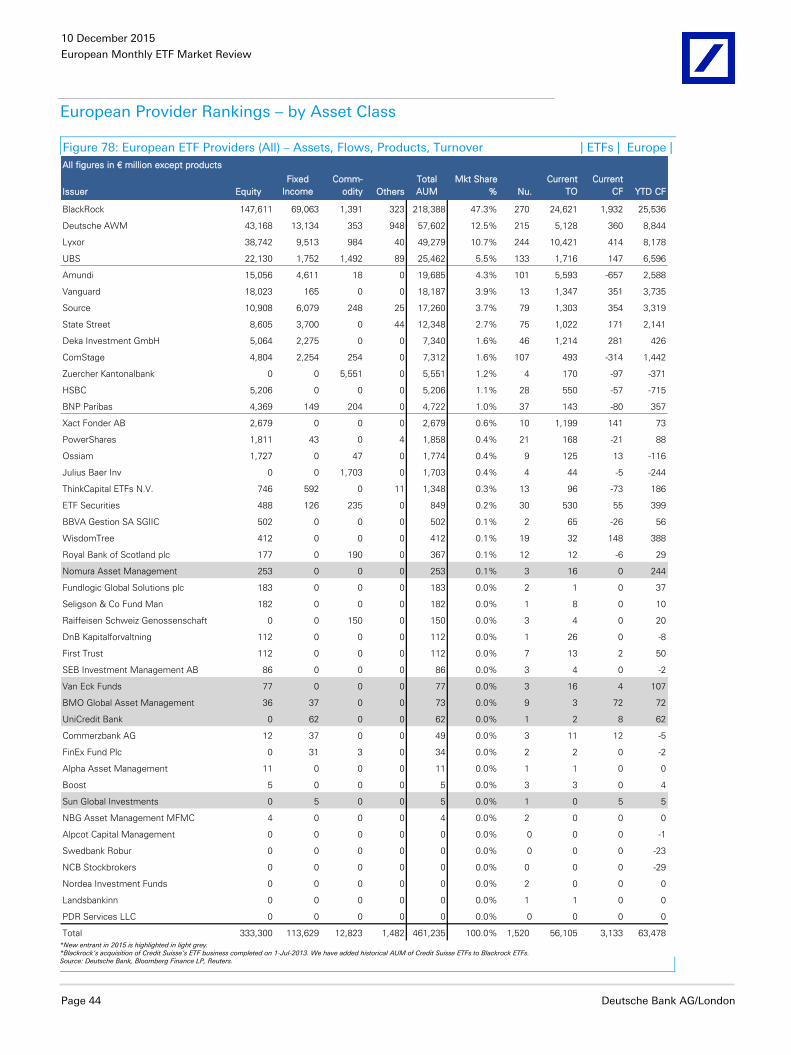
10 December 2015
European Monthly ETF Market Review
Page 44 Deutsche Bank AG/London
European Provider Rankings – by Asset Class
Figure 78: European ETF Providers (All) – Assets, Flows, Products, Turnover | ETFs | Europe |
Issuer Equity
Fixed
Income
Comm-
odity Others
Total
AUM
Mkt Share
% Nu.
Current
TO
Current
CF YTD CF
BlackRock 147,611 69,063 1,391 323 218,388 47.3% 270 24,621 1,932 25,536
Deutsche AWM 43,168 13,134 353 948 57,602 12.5% 215 5,128 360 8,844
Lyxor 38,742 9,513 984 40 49,279 10.7% 244 10,421 414 8,178
UBS 22,130 1,752 1,492 89 25,462 5.5% 133 1,716 147 6,596
Amundi 15,056 4,611 18 0 19,685 4.3% 101 5,593 -657 2,588
Vanguard 18,023 165 0 0 18,187 3.9% 13 1,347 351 3,735
Source 10,908 6,079 248 25 17,260 3.7% 79 1,303 354 3,319
State Street 8,605 3,700 0 44 12,348 2.7% 75 1,022 171 2,141
Deka Investment GmbH 5,064 2,275 0 0 7,340 1.6% 46 1,214 281 426
ComStage 4,804 2,254 254 0 7,312 1.6% 107 493 -314 1,442
Zuercher Kantonalbank 0 0 5,551 0 5,551 1.2% 4 170 -97 -371
HSBC 5,206 0 0 0 5,206 1.1% 28 550 -57 -715
BNP Paribas 4,369 149 204 0 4,722 1.0% 37 143 -80 357
Xact Fonder AB 2,679 0 0 0 2,679 0.6% 10 1,199 141 73
PowerShares 1,811 43 0 4 1,858 0.4% 21 168 -21 88
Ossiam 1,727 0 47 0 1,774 0.4% 9 125 13 -116
Julius Baer Inv 0 0 1,703 0 1,703 0.4% 4 44 -5 -244
ThinkCapital ETFs N.V. 746 592 0 11 1,348 0.3% 13 96 -73 186
ETF Securities 488 126 235 0 849 0.2% 30 530 55 399
BBVA Gestion SA SGIIC 502 0 0 0 502 0.1% 2 65 -26 56
WisdomTree 412 0 0 0 412 0.1% 19 32 148 388
Royal Bank of Scotland plc 177 0 190 0 367 0.1% 12 12 -6 29
Nomura Asset Management 253 0 0 0 253 0.1% 3 16 0 244
Fundlogic Global Solutions plc 183 0 0 0 183 0.0% 2 1 0 37
Seligson & Co Fund Man 182 0 0 0 182 0.0% 1 8 0 10
Raiffeisen Schweiz Genossenschaft 0 0 150 0 150 0.0% 3 4 0 20
DnB Kapitalforvaltning 112 0 0 0 112 0.0% 1 26 0 -8
First Trust 112 0 0 0 112 0.0% 7 13 2 50
SEB Investment Management AB 86 0 0 0 86 0.0% 3 4 0 -2
Van Eck Funds 77 0 0 0 77 0.0% 3 16 4 107
BMO Global Asset Management 36 37 0 0 73 0.0% 9 3 72 72
UniCredit Bank 0 62 0 0 62 0.0% 1 2 8 62
Commerzbank AG 12 37 0 0 49 0.0% 3 11 12 -5
FinEx Fund Plc 0 31 3 0 34 0.0% 2 2 0 -2
Alpha Asset Management 11 0 0 0 11 0.0% 1 1 0 0
Boost 5 0 0 0 5 0.0% 3 3 0 4
Sun Global Investments 0 5 0 0 5 0.0% 1 0 5 5
NBG Asset Management MFMC 4 0 0 0 4 0.0% 2 0 0 0
Alpcot Capital Management 0 0 0 0 0 0.0% 0 0 0 -1
Swedbank Robur 0 0 0 0 0 0.0% 0 0 0 -23
NCB Stockbrokers 0 0 0 0 0 0.0% 0 0 0 -29
Nordea Investment Funds 0 0 0 0 0 0.0% 2 0 0 0
Landsbankinn 0 0 0 0 0 0.0% 1 1 0 0
PDR Services LLC 0 0 0 0 0 0.0% 0 0 0 0
Total 333,300 113,629 12,823 1,482 461,235 100.0% 1,520 56,105 3,133 63,478
All figures in € million except products
*New entrant in 2015 is highlighted in light grey. *Blackrock’s acquisition of Credit Suisse’s ETF business completed on 1-Jul-2013. We have added historical AUM of Credit Suisse ETFs to Blackrock ETFs. Source: Deutsche Bank, Bloomberg Finance LP, Reuters.
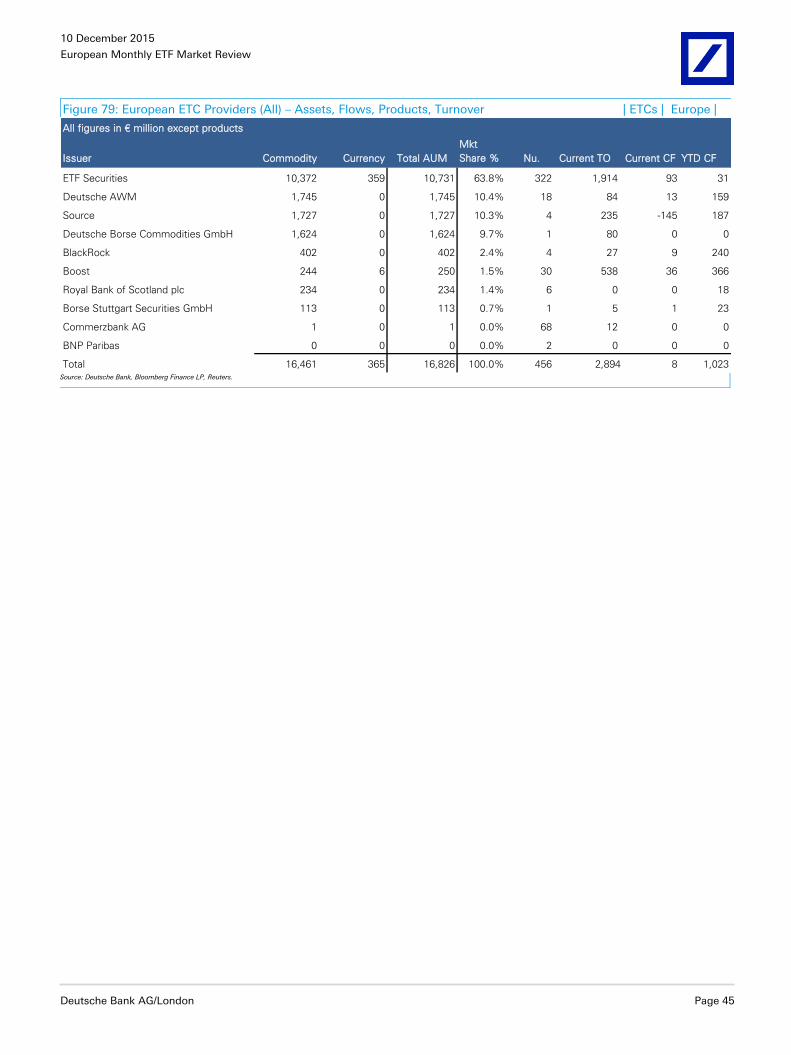
10 December 2015
European Monthly ETF Market Review
Deutsche Bank AG/London Page 45
Figure 79: European ETC Providers (All) – Assets, Flows, Products, Turnover | ETCs | Europe |
Issuer Commodity Currency Total AUM
Mkt
Share % Nu. Current TO Current CF YTD CF
ETF Securities 10,372 359 10,731 63.8% 322 1,914 93 31
Deutsche AWM 1,745 0 1,745 10.4% 18 84 13 159
Source 1,727 0 1,727 10.3% 4 235 -145 187
Deutsche Borse Commodities GmbH 1,624 0 1,624 9.7% 1 80 0 0
BlackRock 402 0 402 2.4% 4 27 9 240
Boost 244 6 250 1.5% 30 538 36 366
Royal Bank of Scotland plc 234 0 234 1.4% 6 0 0 18
Borse Stuttgart Securities GmbH 113 0 113 0.7% 1 5 1 23
Commerzbank AG 1 0 1 0.0% 68 12 0 0
BNP Paribas 0 0 0 0.0% 2 0 0 0
Total 16,461 365 16,826 100.0% 456 2,894 8 1,023
All figures in € million except products
Source: Deutsche Bank, Bloomberg Finance LP, Reuters.
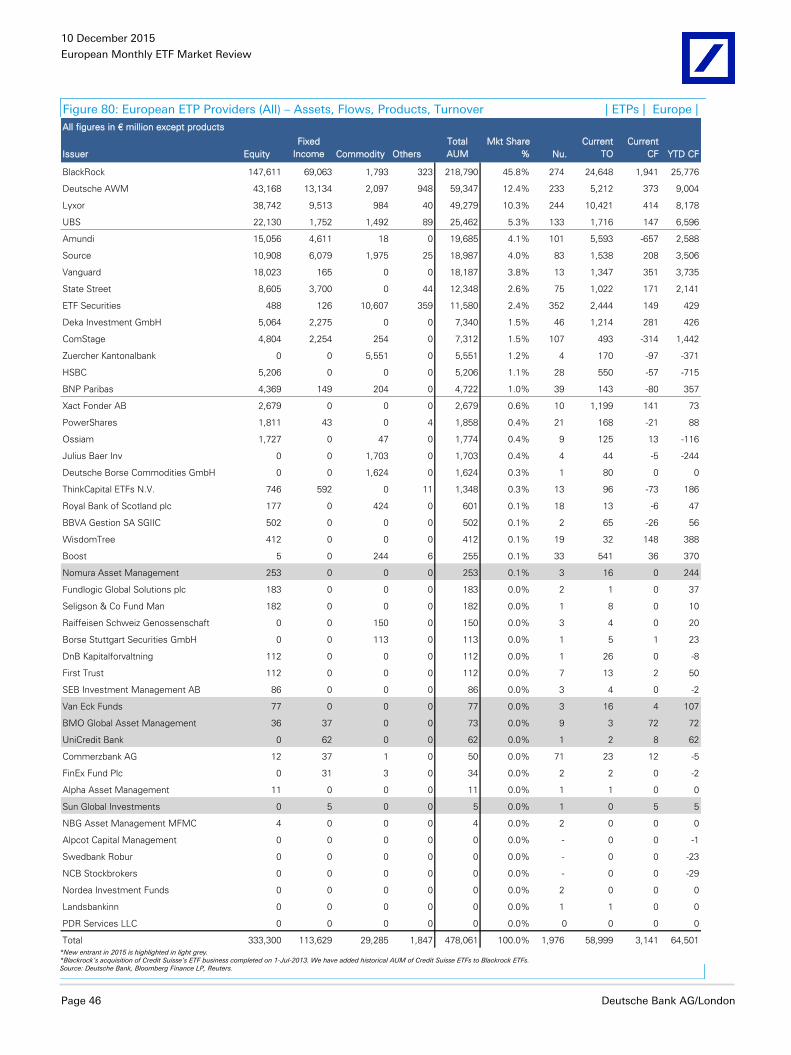
10 December 2015
European Monthly ETF Market Review
Page 46 Deutsche Bank AG/London
Figure 80: European ETP Providers (All) – Assets, Flows, Products, Turnover | ETPs | Europe |
Issuer Equity
Fixed
Income Commodity Others
Total
AUM
Mkt Share
% Nu.
Current
TO
Current
CF YTD CF
BlackRock 147,611 69,063 1,793 323 218,790 45.8% 274 24,648 1,941 25,776
Deutsche AWM 43,168 13,134 2,097 948 59,347 12.4% 233 5,212 373 9,004
Lyxor 38,742 9,513 984 40 49,279 10.3% 244 10,421 414 8,178
UBS 22,130 1,752 1,492 89 25,462 5.3% 133 1,716 147 6,596
Amundi 15,056 4,611 18 0 19,685 4.1% 101 5,593 -657 2,588
Source 10,908 6,079 1,975 25 18,987 4.0% 83 1,538 208 3,506
Vanguard 18,023 165 0 0 18,187 3.8% 13 1,347 351 3,735
State Street 8,605 3,700 0 44 12,348 2.6% 75 1,022 171 2,141
ETF Securities 488 126 10,607 359 11,580 2.4% 352 2,444 149 429
Deka Investment GmbH 5,064 2,275 0 0 7,340 1.5% 46 1,214 281 426
ComStage 4,804 2,254 254 0 7,312 1.5% 107 493 -314 1,442
Zuercher Kantonalbank 0 0 5,551 0 5,551 1.2% 4 170 -97 -371
HSBC 5,206 0 0 0 5,206 1.1% 28 550 -57 -715
BNP Paribas 4,369 149 204 0 4,722 1.0% 39 143 -80 357
Xact Fonder AB 2,679 0 0 0 2,679 0.6% 10 1,199 141 73
PowerShares 1,811 43 0 4 1,858 0.4% 21 168 -21 88
Ossiam 1,727 0 47 0 1,774 0.4% 9 125 13 -116
Julius Baer Inv 0 0 1,703 0 1,703 0.4% 4 44 -5 -244
Deutsche Borse Commodities GmbH 0 0 1,624 0 1,624 0.3% 1 80 0 0
ThinkCapital ETFs N.V. 746 592 0 11 1,348 0.3% 13 96 -73 186
Royal Bank of Scotland plc 177 0 424 0 601 0.1% 18 13 -6 47
BBVA Gestion SA SGIIC 502 0 0 0 502 0.1% 2 65 -26 56
WisdomTree 412 0 0 0 412 0.1% 19 32 148 388
Boost 5 0 244 6 255 0.1% 33 541 36 370
Nomura Asset Management 253 0 0 0 253 0.1% 3 16 0 244
Fundlogic Global Solutions plc 183 0 0 0 183 0.0% 2 1 0 37
Seligson & Co Fund Man 182 0 0 0 182 0.0% 1 8 0 10
Raiffeisen Schweiz Genossenschaft 0 0 150 0 150 0.0% 3 4 0 20
Borse Stuttgart Securities GmbH 0 0 113 0 113 0.0% 1 5 1 23
DnB Kapitalforvaltning 112 0 0 0 112 0.0% 1 26 0 -8
First Trust 112 0 0 0 112 0.0% 7 13 2 50
SEB Investment Management AB 86 0 0 0 86 0.0% 3 4 0 -2
Van Eck Funds 77 0 0 0 77 0.0% 3 16 4 107
BMO Global Asset Management 36 37 0 0 73 0.0% 9 3 72 72
UniCredit Bank 0 62 0 0 62 0.0% 1 2 8 62
Commerzbank AG 12 37 1 0 50 0.0% 71 23 12 -5
FinEx Fund Plc 0 31 3 0 34 0.0% 2 2 0 -2
Alpha Asset Management 11 0 0 0 11 0.0% 1 1 0 0
Sun Global Investments 0 5 0 0 5 0.0% 1 0 5 5
NBG Asset Management MFMC 4 0 0 0 4 0.0% 2 0 0 0
Alpcot Capital Management 0 0 0 0 0 0.0% - 0 0 -1
Swedbank Robur 0 0 0 0 0 0.0% - 0 0 -23
NCB Stockbrokers 0 0 0 0 0 0.0% - 0 0 -29
Nordea Investment Funds 0 0 0 0 0 0.0% 2 0 0 0
Landsbankinn 0 0 0 0 0 0.0% 1 1 0 0
PDR Services LLC 0 0 0 0 0 0.0% 0 0 0 0
Total 333,300 113,629 29,285 1,847 478,061 100.0% 1,976 58,999 3,141 64,501
All figures in € million except products
*New entrant in 2015 is highlighted in light grey. *Blackrock’s acquisition of Credit Suisse’s ETF business completed on 1-Jul-2013. We have added historical AUM of Credit Suisse ETFs to Blackrock ETFs. Source: Deutsche Bank, Bloomberg Finance LP, Reuters.
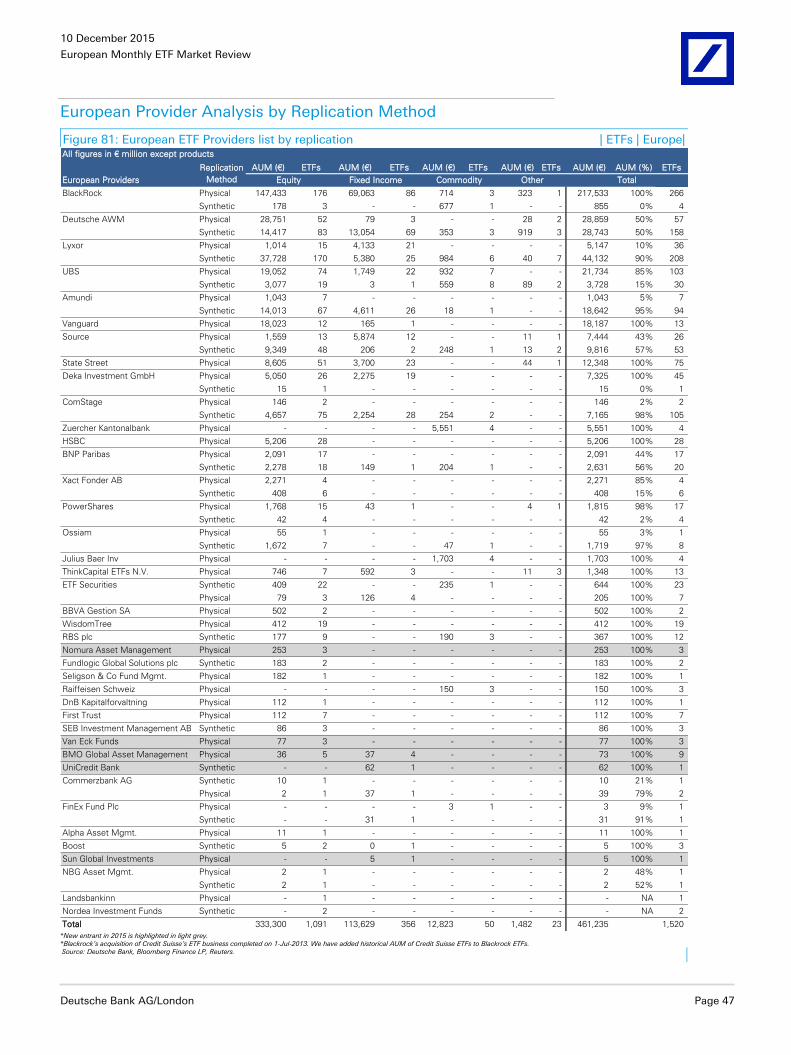
10 December 2015
European Monthly ETF Market Review
Deutsche Bank AG/London Page 47
European Provider Analysis by Replication Method
Figure 81: European ETF Providers list by replication | ETFs | Europe|
AUM (€) ETFs AUM (€) ETFs AUM (€) ETFs AUM (€) ETFs AUM (€) AUM (%) ETFs
European Providers
BlackRock Physical 147,433 176 69,063 86 714 3 323 1 217,533 100% 266
Synthetic 178 3 - - 677 1 - - 855 0% 4
Deutsche AWM Physical 28,751 52 79 3 - - 28 2 28,859 50% 57
Synthetic 14,417 83 13,054 69 353 3 919 3 28,743 50% 158
Lyxor Physical 1,014 15 4,133 21 - - - - 5,147 10% 36
Synthetic 37,728 170 5,380 25 984 6 40 7 44,132 90% 208
UBS Physical 19,052 74 1,749 22 932 7 - - 21,734 85% 103
Synthetic 3,077 19 3 1 559 8 89 2 3,728 15% 30
Amundi Physical 1,043 7 - - - - - - 1,043 5% 7
Synthetic 14,013 67 4,611 26 18 1 - - 18,642 95% 94
Vanguard Physical 18,023 12 165 1 - - - - 18,187 100% 13
Source Physical 1,559 13 5,874 12 - - 11 1 7,444 43% 26
Synthetic 9,349 48 206 2 248 1 13 2 9,816 57% 53
State Street Physical 8,605 51 3,700 23 - - 44 1 12,348 100% 75
Deka Investment GmbH Physical 5,050 26 2,275 19 - - - - 7,325 100% 45
Synthetic 15 1 - - - - - - 15 0% 1
ComStage Physical 146 2 - - - - - - 146 2% 2
Synthetic 4,657 75 2,254 28 254 2 - - 7,165 98% 105
Zuercher Kantonalbank Physical - - - - 5,551 4 - - 5,551 100% 4
HSBC Physical 5,206 28 - - - - - - 5,206 100% 28
BNP Paribas Physical 2,091 17 - - - - - - 2,091 44% 17
Synthetic 2,278 18 149 1 204 1 - - 2,631 56% 20
Xact Fonder AB Physical 2,271 4 - - - - - - 2,271 85% 4
Synthetic 408 6 - - - - - - 408 15% 6
PowerShares Physical 1,768 15 43 1 - - 4 1 1,815 98% 17
Synthetic 42 4 - - - - - - 42 2% 4
Ossiam Physical 55 1 - - - - - - 55 3% 1
Synthetic 1,672 7 - - 47 1 - - 1,719 97% 8
Julius Baer Inv Physical - - - - 1,703 4 - - 1,703 100% 4
ThinkCapital ETFs N.V. Physical 746 7 592 3 - - 11 3 1,348 100% 13
ETF Securities Synthetic 409 22 - - 235 1 - - 644 100% 23
Physical 79 3 126 4 - - - - 205 100% 7
BBVA Gestion SA Physical 502 2 - - - - - - 502 100% 2
WisdomTree Physical 412 19 - - - - - - 412 100% 19
RBS plc Synthetic 177 9 - - 190 3 - - 367 100% 12
Nomura Asset Management Physical 253 3 - - - - - - 253 100% 3
Fundlogic Global Solutions plc Synthetic 183 2 - - - - - - 183 100% 2
Seligson & Co Fund Mgmt. Physical 182 1 - - - - - - 182 100% 1
Raiffeisen Schweiz
Genossenschaft
Physical - - - - 150 3 - - 150 100% 3
DnB Kapitalforvaltning Physical 112 1 - - - - - - 112 100% 1
First Trust Physical 112 7 - - - - - - 112 100% 7
SEB Investment Management AB Synthetic 86 3 - - - - - - 86 100% 3
Van Eck Funds Physical 77 3 - - - - - - 77 100% 3
BMO Global Asset Management Physical 36 5 37 4 - - - - 73 100% 9
UniCredit Bank Synthetic - - 62 1 - - - - 62 100% 1
Commerzbank AG Synthetic 10 1 - - - - - - 10 21% 1
Physical 2 1 37 1 - - - - 39 79% 2
FinEx Fund Plc Physical - - - - 3 1 - - 3 9% 1
Synthetic - - 31 1 - - - - 31 91% 1
Alpha Asset Mgmt. Physical 11 1 - - - - - - 11 100% 1
Boost Synthetic 5 2 0 1 - - - - 5 100% 3
Sun Global Investments Physical - - 5 1 - - - - 5 100% 1
NBG Asset Mgmt. Physical 2 1 - - - - - - 2 48% 1
Synthetic 2 1 - - - - - - 2 52% 1
Landsbankinn Physical - 1 - - - - - - - NA 1
Nordea Investment Funds Synthetic - 2 - - - - - - - NA 2
Total 333,300 1,091 113,629 356 12,823 50 1,482 23 461,235 1,520
Total
All figures in € million except products
Replication
Method Equity Fixed Income Commodity Other
*New entrant in 2015 is highlighted in light grey. *Blackrock’s acquisition of Credit Suisse’s ETF business completed on 1-Jul-2013. We have added historical AUM of Credit Suisse ETFs to Blackrock ETFs. Source: Deutsche Bank, Bloomberg Finance LP, Reuters.
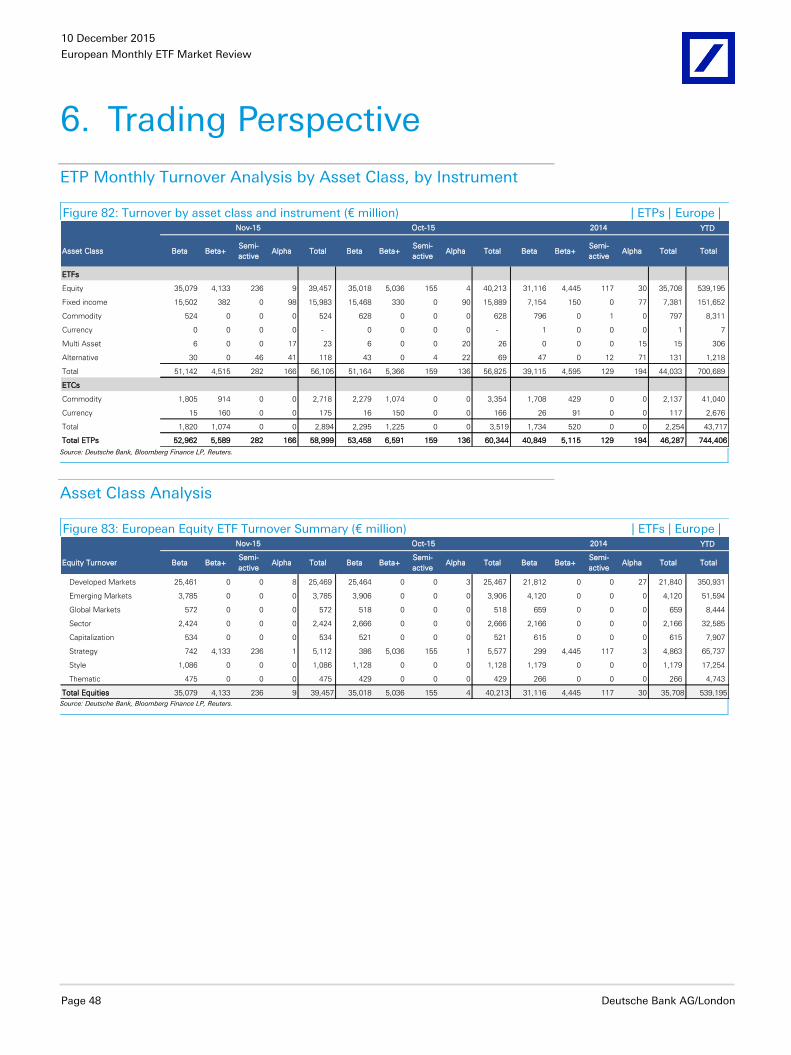
10 December 2015
European Monthly ETF Market Review
Page 48 Deutsche Bank AG/London
6. Trading Perspective
ETP Monthly Turnover Analysis by Asset Class, by Instrument
Figure 82: Turnover by asset class and instrument (€ million) | ETPs | Europe | YTD
Asset Class Beta Beta+Semi-
activeAlpha Total Beta Beta+
Semi-
activeAlpha Total Beta Beta+
Semi-
activeAlpha Total Total
ETFs
Equity 35,079 4,133 236 9 39,457 35,018 5,036 155 4 40,213 31,116 4,445 117 30 35,708 539,195
Fixed income 15,502 382 0 98 15,983 15,468 330 0 90 15,889 7,154 150 0 77 7,381 151,652
Commodity 524 0 0 0 524 628 0 0 0 628 796 0 1 0 797 8,311
Currency 0 0 0 0 - 0 0 0 0 - 1 0 0 0 1 7
Multi Asset 6 0 0 17 23 6 0 0 20 26 0 0 0 15 15 306
Alternative 30 0 46 41 118 43 0 4 22 69 47 0 12 71 131 1,218
Total 51,142 4,515 282 166 56,105 51,164 5,366 159 136 56,825 39,115 4,595 129 194 44,033 700,689
ETCs
Commodity 1,805 914 0 0 2,718 2,279 1,074 0 0 3,354 1,708 429 0 0 2,137 41,040
Currency 15 160 0 0 175 16 150 0 0 166 26 91 0 0 117 2,676
Total 1,820 1,074 0 0 2,894 2,295 1,225 0 0 3,519 1,734 520 0 0 2,254 43,717
Total ETPs 52,962 5,589 282 166 58,999 53,458 6,591 159 136 60,344 40,849 5,115 129 194 46,287 744,406
Nov-15 Oct-15 2014
Source: Deutsche Bank, Bloomberg Finance LP, Reuters.
Asset Class Analysis
Figure 83: European Equity ETF Turnover Summary (€ million) | ETFs | Europe | YTD
Equity Turnover Beta Beta+Semi-
activeAlpha Total Beta Beta+
Semi-
activeAlpha Total Beta Beta+
Semi-
activeAlpha Total Total
Developed Markets 25,461 0 0 8 25,469 25,464 0 0 3 25,467 21,812 0 0 27 21,840 350,931
Emerging Markets 3,785 0 0 0 3,785 3,906 0 0 0 3,906 4,120 0 0 0 4,120 51,594
Global Markets 572 0 0 0 572 518 0 0 0 518 659 0 0 0 659 8,444
Sector 2,424 0 0 0 2,424 2,666 0 0 0 2,666 2,166 0 0 0 2,166 32,585
Capitalization 534 0 0 0 534 521 0 0 0 521 615 0 0 0 615 7,907
Strategy 742 4,133 236 1 5,112 386 5,036 155 1 5,577 299 4,445 117 3 4,863 65,737
Style 1,086 0 0 0 1,086 1,128 0 0 0 1,128 1,179 0 0 0 1,179 17,254
Thematic 475 0 0 0 475 429 0 0 0 429 266 0 0 0 266 4,743
Total Equities 35,079 4,133 236 9 39,457 35,018 5,036 155 4 40,213 31,116 4,445 117 30 35,708 539,195
Nov-15 Oct-15 2014
Source: Deutsche Bank, Bloomberg Finance LP, Reuters.
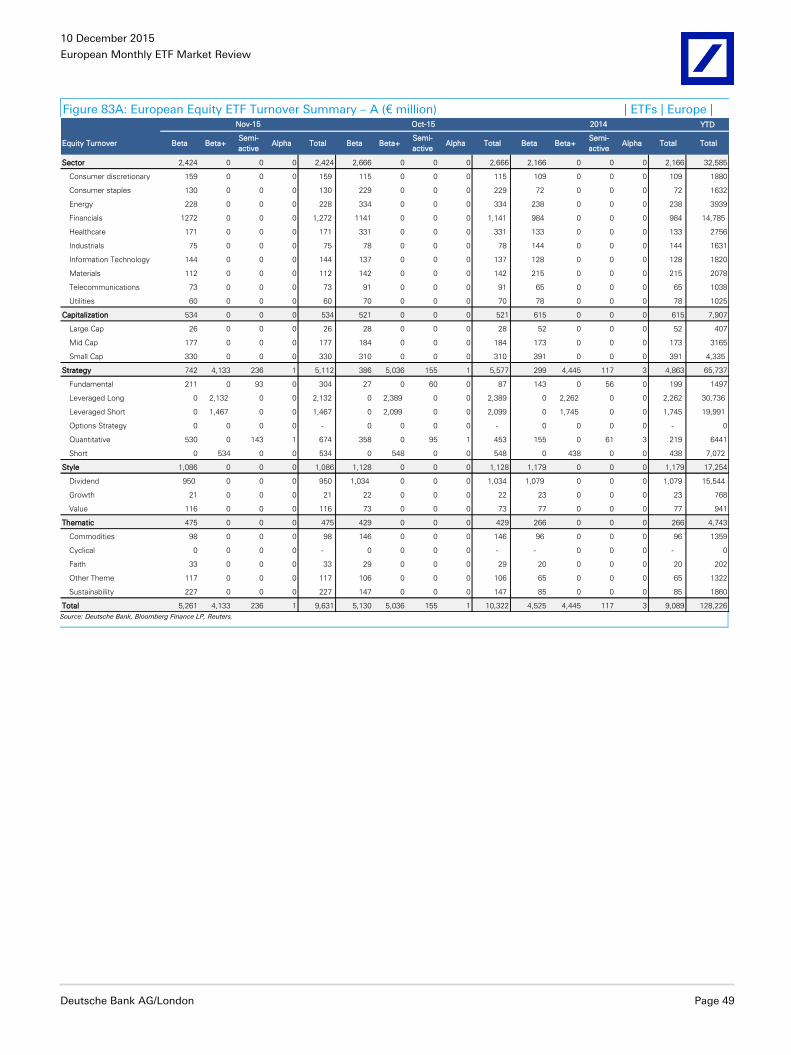
10 December 2015
European Monthly ETF Market Review
Deutsche Bank AG/London Page 49
Figure 83A: European Equity ETF Turnover Summary – A (€ million) | ETFs | Europe | YTD
Equity Turnover Beta Beta+Semi-
activeAlpha Total Beta Beta+
Semi-
activeAlpha Total Beta Beta+
Semi-
activeAlpha Total Total
Sector 2,424 0 0 0 2,424 2,666 0 0 0 2,666 2,166 0 0 0 2,166 32,585
Consumer discretionary 159 0 0 0 159 115 0 0 0 115 109 0 0 0 109 1880
Consumer staples 130 0 0 0 130 229 0 0 0 229 72 0 0 0 72 1632
Energy 228 0 0 0 228 334 0 0 0 334 238 0 0 0 238 3939
Financials 1272 0 0 0 1,272 1141 0 0 0 1,141 984 0 0 0 984 14,785
Healthcare 171 0 0 0 171 331 0 0 0 331 133 0 0 0 133 2756
Industrials 75 0 0 0 75 78 0 0 0 78 144 0 0 0 144 1631
Information Technology 144 0 0 0 144 137 0 0 0 137 128 0 0 0 128 1820
Materials 112 0 0 0 112 142 0 0 0 142 215 0 0 0 215 2078
Telecommunications 73 0 0 0 73 91 0 0 0 91 65 0 0 0 65 1038
Utilities 60 0 0 0 60 70 0 0 0 70 78 0 0 0 78 1025
Capitalization 534 0 0 0 534 521 0 0 0 521 615 0 0 0 615 7,907
Large Cap 26 0 0 0 26 28 0 0 0 28 52 0 0 0 52 407
Mid Cap 177 0 0 0 177 184 0 0 0 184 173 0 0 0 173 3165
Small Cap 330 0 0 0 330 310 0 0 0 310 391 0 0 0 391 4,335
Strategy 742 4,133 236 1 5,112 386 5,036 155 1 5,577 299 4,445 117 3 4,863 65,737
Fundamental 211 0 93 0 304 27 0 60 0 87 143 0 56 0 199 1497
Leveraged Long 0 2,132 0 0 2,132 0 2,389 0 0 2,389 0 2,262 0 0 2,262 30,736
Leveraged Short 0 1,467 0 0 1,467 0 2,099 0 0 2,099 0 1,745 0 0 1,745 19,991
Options Strategy 0 0 0 0 - 0 0 0 0 - 0 0 0 0 - 0
Quantitative 530 0 143 1 674 358 0 95 1 453 155 0 61 3 219 6441
Short 0 534 0 0 534 0 548 0 0 548 0 438 0 0 438 7,072
Style 1,086 0 0 0 1,086 1,128 0 0 0 1,128 1,179 0 0 0 1,179 17,254
Dividend 950 0 0 0 950 1,034 0 0 0 1,034 1,079 0 0 0 1,079 15,544
Growth 21 0 0 0 21 22 0 0 0 22 23 0 0 0 23 768
Value 116 0 0 0 116 73 0 0 0 73 77 0 0 0 77 941
Thematic 475 0 0 0 475 429 0 0 0 429 266 0 0 0 266 4,743
Commodities 98 0 0 0 98 146 0 0 0 146 96 0 0 0 96 1359
Cyclical 0 0 0 0 - 0 0 0 0 - - 0 0 0 - 0
Faith 33 0 0 0 33 29 0 0 0 29 20 0 0 0 20 202
Other Theme 117 0 0 0 117 106 0 0 0 106 65 0 0 0 65 1322
Sustainability 227 0 0 0 227 147 0 0 0 147 85 0 0 0 85 1860
Total 5,261 4,133 236 1 9,631 5,130 5,036 155 1 10,322 4,525 4,445 117 3 9,089 128,226
Nov-15 Oct-15 2014
Source: Deutsche Bank, Bloomberg Finance LP, Reuters.
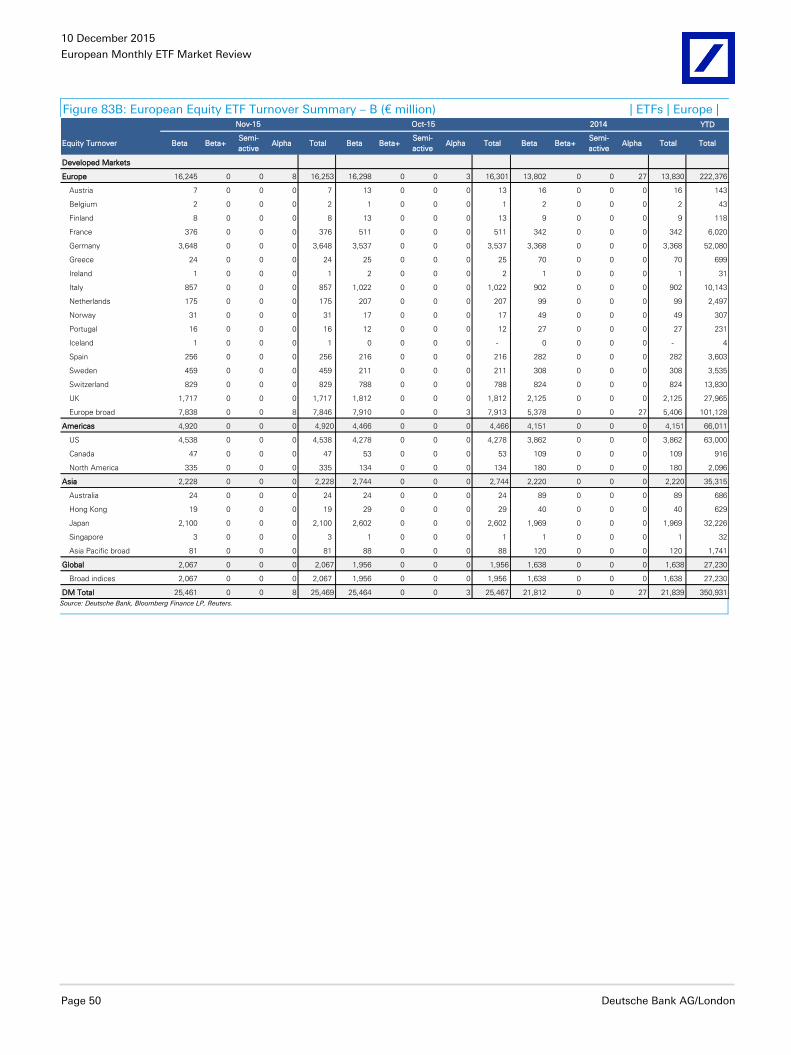
10 December 2015
European Monthly ETF Market Review
Page 50 Deutsche Bank AG/London
Figure 83B: European Equity ETF Turnover Summary – B (€ million) | ETFs | Europe | YTD
Equity Turnover Beta Beta+Semi-
activeAlpha Total Beta Beta+
Semi-
activeAlpha Total Beta Beta+
Semi-
activeAlpha Total Total
Developed Markets
Europe 16,245 0 0 8 16,253 16,298 0 0 3 16,301 13,802 0 0 27 13,830 222,376
Austria 7 0 0 0 7 13 0 0 0 13 16 0 0 0 16 143
Belgium 2 0 0 0 2 1 0 0 0 1 2 0 0 0 2 43
Finland 8 0 0 0 8 13 0 0 0 13 9 0 0 0 9 118
France 376 0 0 0 376 511 0 0 0 511 342 0 0 0 342 6,020
Germany 3,648 0 0 0 3,648 3,537 0 0 0 3,537 3,368 0 0 0 3,368 52,080
Greece 24 0 0 0 24 25 0 0 0 25 70 0 0 0 70 699
Ireland 1 0 0 0 1 2 0 0 0 2 1 0 0 0 1 31
Italy 857 0 0 0 857 1,022 0 0 0 1,022 902 0 0 0 902 10,143
Netherlands 175 0 0 0 175 207 0 0 0 207 99 0 0 0 99 2,497
Norway 31 0 0 0 31 17 0 0 0 17 49 0 0 0 49 307
Portugal 16 0 0 0 16 12 0 0 0 12 27 0 0 0 27 231
Iceland 1 0 0 0 1 0 0 0 0 - 0 0 0 0 - 4
Spain 256 0 0 0 256 216 0 0 0 216 282 0 0 0 282 3,603
Sweden 459 0 0 0 459 211 0 0 0 211 308 0 0 0 308 3,535
Switzerland 829 0 0 0 829 788 0 0 0 788 824 0 0 0 824 13,830
UK 1,717 0 0 0 1,717 1,812 0 0 0 1,812 2,125 0 0 0 2,125 27,965
Europe broad 7,838 0 0 8 7,846 7,910 0 0 3 7,913 5,378 0 0 27 5,406 101,128
Americas 4,920 0 0 0 4,920 4,466 0 0 0 4,466 4,151 0 0 0 4,151 66,011
US 4,538 0 0 0 4,538 4,278 0 0 0 4,278 3,862 0 0 0 3,862 63,000
Canada 47 0 0 0 47 53 0 0 0 53 109 0 0 0 109 916
North America 335 0 0 0 335 134 0 0 0 134 180 0 0 0 180 2,096
Asia 2,228 0 0 0 2,228 2,744 0 0 0 2,744 2,220 0 0 0 2,220 35,315
Australia 24 0 0 0 24 24 0 0 0 24 89 0 0 0 89 686
Hong Kong 19 0 0 0 19 29 0 0 0 29 40 0 0 0 40 629
Japan 2,100 0 0 0 2,100 2,602 0 0 0 2,602 1,969 0 0 0 1,969 32,226
Singapore 3 0 0 0 3 1 0 0 0 1 1 0 0 0 1 32
Asia Pacific broad 81 0 0 0 81 88 0 0 0 88 120 0 0 0 120 1,741
Global 2,067 0 0 0 2,067 1,956 0 0 0 1,956 1,638 0 0 0 1,638 27,230
Broad indices 2,067 0 0 0 2,067 1,956 0 0 0 1,956 1,638 0 0 0 1,638 27,230
DM Total 25,461 0 0 8 25,469 25,464 0 0 3 25,467 21,812 0 0 27 21,839 350,931
Nov-15 Oct-15 2014
Source: Deutsche Bank, Bloomberg Finance LP, Reuters.
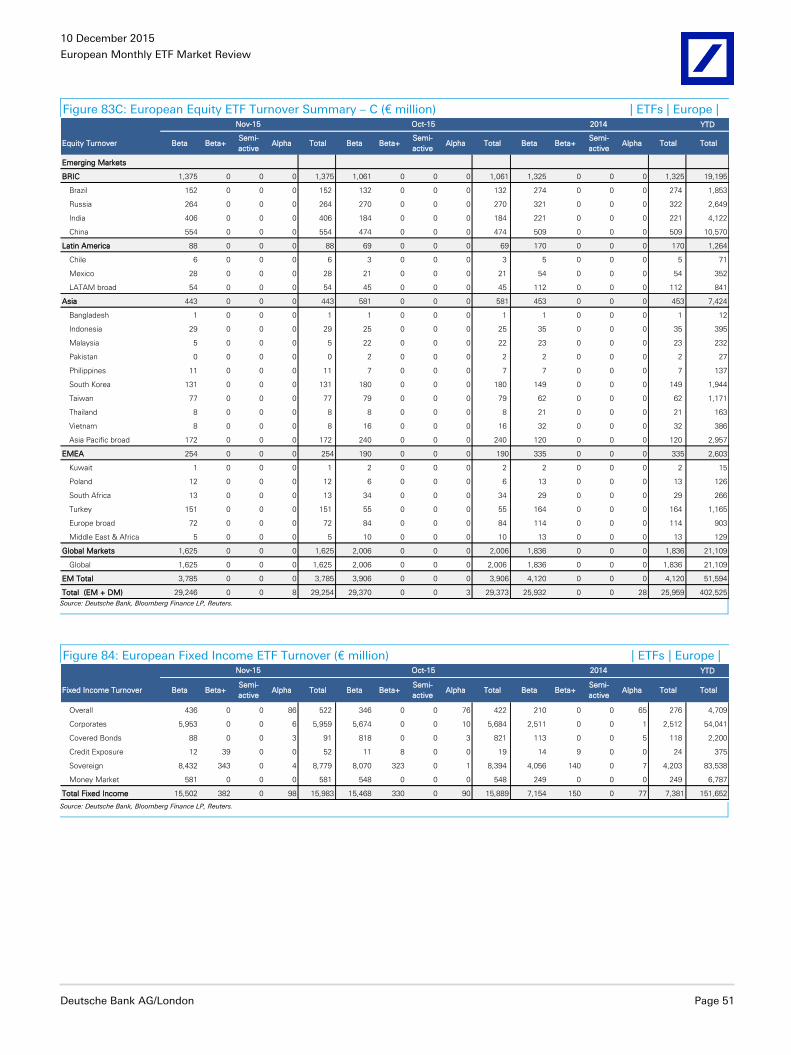
10 December 2015
European Monthly ETF Market Review
Deutsche Bank AG/London Page 51
Figure 83C: European Equity ETF Turnover Summary – C (€ million) | ETFs | Europe | YTD
Equity Turnover Beta Beta+Semi-
activeAlpha Total Beta Beta+
Semi-
activeAlpha Total Beta Beta+
Semi-
activeAlpha Total Total
Emerging Markets
BRIC 1,375 0 0 0 1,375 1,061 0 0 0 1,061 1,325 0 0 0 1,325 19,195
Brazil 152 0 0 0 152 132 0 0 0 132 274 0 0 0 274 1,853
Russia 264 0 0 0 264 270 0 0 0 270 321 0 0 0 322 2,649
India 406 0 0 0 406 184 0 0 0 184 221 0 0 0 221 4,122
China 554 0 0 0 554 474 0 0 0 474 509 0 0 0 509 10,570
Latin America 88 0 0 0 88 69 0 0 0 69 170 0 0 0 170 1,264
Chile 6 0 0 0 6 3 0 0 0 3 5 0 0 0 5 71
Mexico 28 0 0 0 28 21 0 0 0 21 54 0 0 0 54 352
LATAM broad 54 0 0 0 54 45 0 0 0 45 112 0 0 0 112 841
Asia 443 0 0 0 443 581 0 0 0 581 453 0 0 0 453 7,424
Bangladesh 1 0 0 0 1 1 0 0 0 1 1 0 0 0 1 12
Indonesia 29 0 0 0 29 25 0 0 0 25 35 0 0 0 35 395
Malaysia 5 0 0 0 5 22 0 0 0 22 23 0 0 0 23 232
Pakistan 0 0 0 0 0 2 0 0 0 2 2 0 0 0 2 27
Philippines 11 0 0 0 11 7 0 0 0 7 7 0 0 0 7 137
South Korea 131 0 0 0 131 180 0 0 0 180 149 0 0 0 149 1,944
Taiwan 77 0 0 0 77 79 0 0 0 79 62 0 0 0 62 1,171
Thailand 8 0 0 0 8 8 0 0 0 8 21 0 0 0 21 163
Vietnam 8 0 0 0 8 16 0 0 0 16 32 0 0 0 32 386
Asia Pacific broad 172 0 0 0 172 240 0 0 0 240 120 0 0 0 120 2,957
EMEA 254 0 0 0 254 190 0 0 0 190 335 0 0 0 335 2,603
Kuwait 1 0 0 0 1 2 0 0 0 2 2 0 0 0 2 15
Poland 12 0 0 0 12 6 0 0 0 6 13 0 0 0 13 126
South Africa 13 0 0 0 13 34 0 0 0 34 29 0 0 0 29 266
Turkey 151 0 0 0 151 55 0 0 0 55 164 0 0 0 164 1,165
Europe broad 72 0 0 0 72 84 0 0 0 84 114 0 0 0 114 903
Middle East & Africa 5 0 0 0 5 10 0 0 0 10 13 0 0 0 13 129
Global Markets 1,625 0 0 0 1,625 2,006 0 0 0 2,006 1,836 0 0 0 1,836 21,109
Global 1,625 0 0 0 1,625 2,006 0 0 0 2,006 1,836 0 0 0 1,836 21,109
EM Total 3,785 0 0 0 3,785 3,906 0 0 0 3,906 4,120 0 0 0 4,120 51,594
Total (EM + DM) 29,246 0 0 8 29,254 29,370 0 0 3 29,373 25,932 0 0 28 25,959 402,525
Nov-15 Oct-15 2014
Source: Deutsche Bank, Bloomberg Finance LP, Reuters.
Figure 84: European Fixed Income ETF Turnover (€ million) | ETFs | Europe | YTD
Fixed Income Turnover Beta Beta+Semi-
activeAlpha Total Beta Beta+
Semi-
activeAlpha Total Beta Beta+
Semi-
activeAlpha Total Total
Overall 436 0 0 86 522 346 0 0 76 422 210 0 0 65 276 4,709
Corporates 5,953 0 0 6 5,959 5,674 0 0 10 5,684 2,511 0 0 1 2,512 54,041
Covered Bonds 88 0 0 3 91 818 0 0 3 821 113 0 0 5 118 2,200
Credit Exposure 12 39 0 0 52 11 8 0 0 19 14 9 0 0 24 375
Sovereign 8,432 343 0 4 8,779 8,070 323 0 1 8,394 4,056 140 0 7 4,203 83,538
Money Market 581 0 0 0 581 548 0 0 0 548 249 0 0 0 249 6,787
Total Fixed Income 15,502 382 0 98 15,983 15,468 330 0 90 15,889 7,154 150 0 77 7,381 151,652
Nov-15 Oct-15 2014
Source: Deutsche Bank, Bloomberg Finance LP, Reuters.
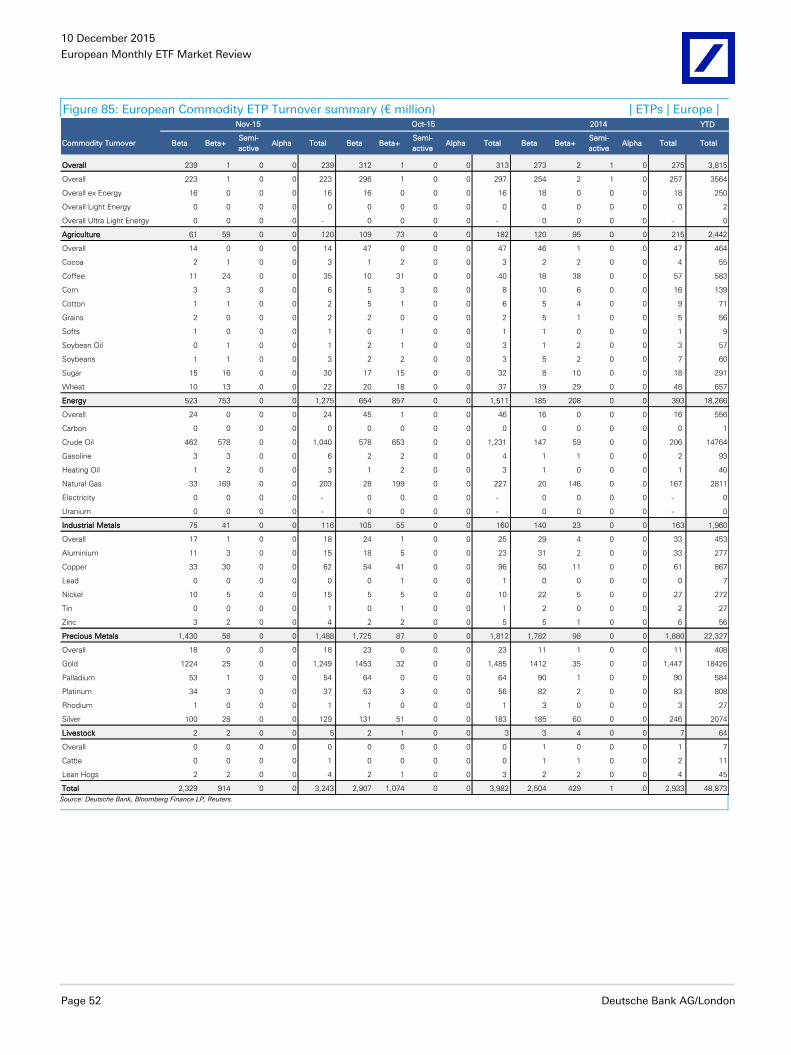
10 December 2015
European Monthly ETF Market Review
Page 52 Deutsche Bank AG/London
Figure 85: European Commodity ETP Turnover summary (€ million) | ETPs | Europe | YTD
Commodity Turnover Beta Beta+Semi-
activeAlpha Total Beta Beta+
Semi-
activeAlpha Total Beta Beta+
Semi-
activeAlpha Total Total
Overall 239 1 0 0 239 312 1 0 0 313 273 2 1 0 275 3,815
Overall 223 1 0 0 223 296 1 0 0 297 254 2 1 0 257 3564
Overall ex Energy 16 0 0 0 16 16 0 0 0 16 18 0 0 0 18 250
Overall Light Energy 0 0 0 0 0 0 0 0 0 0 0 0 0 0 0 2
Overall Ultra Light Energy 0 0 0 0 - 0 0 0 0 - 0 0 0 0 - 0
Agriculture 61 59 0 0 120 109 73 0 0 182 120 95 0 0 215 2,442
Overall 14 0 0 0 14 47 0 0 0 47 46 1 0 0 47 464
Cocoa 2 1 0 0 3 1 2 0 0 3 2 2 0 0 4 55
Coffee 11 24 0 0 35 10 31 0 0 40 18 38 0 0 57 583
Corn 3 3 0 0 6 5 3 0 0 8 10 6 0 0 16 139
Cotton 1 1 0 0 2 5 1 0 0 6 5 4 0 0 9 71
Grains 2 0 0 0 2 2 0 0 0 2 5 1 0 0 5 56
Softs 1 0 0 0 1 0 1 0 0 1 1 0 0 0 1 9
Soybean Oil 0 1 0 0 1 2 1 0 0 3 1 2 0 0 3 57
Soybeans 1 1 0 0 3 2 2 0 0 3 5 2 0 0 7 60
Sugar 15 16 0 0 30 17 15 0 0 32 8 10 0 0 18 291
Wheat 10 13 0 0 22 20 18 0 0 37 19 29 0 0 48 657
Energy 523 753 0 0 1,275 654 857 0 0 1,511 185 208 0 0 393 18,266
Overall 24 0 0 0 24 45 1 0 0 46 16 0 0 0 16 556
Carbon 0 0 0 0 0 0 0 0 0 0 0 0 0 0 0 1
Crude Oil 462 578 0 0 1,040 578 653 0 0 1,231 147 59 0 0 206 14764
Gasoline 3 3 0 0 6 2 2 0 0 4 1 1 0 0 2 93
Heating Oil 1 2 0 0 3 1 2 0 0 3 1 0 0 0 1 40
Natural Gas 33 169 0 0 203 28 199 0 0 227 20 146 0 0 167 2811
Electricity 0 0 0 0 - 0 0 0 0 - 0 0 0 0 - 0
Uranium 0 0 0 0 - 0 0 0 0 - 0 0 0 0 - 0
Industrial Metals 75 41 0 0 116 105 55 0 0 160 140 23 0 0 163 1,960
Overall 17 1 0 0 18 24 1 0 0 25 29 4 0 0 33 453
Aluminium 11 3 0 0 15 18 5 0 0 23 31 2 0 0 33 277
Copper 33 30 0 0 62 54 41 0 0 96 50 11 0 0 61 867
Lead 0 0 0 0 0 0 1 0 0 1 0 0 0 0 0 7
Nickel 10 5 0 0 15 5 5 0 0 10 22 5 0 0 27 272
Tin 0 0 0 0 1 0 1 0 0 1 2 0 0 0 2 27
Zinc 3 2 0 0 4 2 2 0 0 5 5 1 0 0 6 56
Precious Metals 1,430 58 0 0 1,488 1,725 87 0 0 1,812 1,782 98 0 0 1,880 22,327
Overall 18 0 0 0 18 23 0 0 0 23 11 1 0 0 11 408
Gold 1224 25 0 0 1,249 1453 32 0 0 1,485 1412 35 0 0 1,447 18426
Palladium 53 1 0 0 54 64 0 0 0 64 90 1 0 0 90 584
Platinum 34 3 0 0 37 53 3 0 0 56 82 2 0 0 83 808
Rhodium 1 0 0 0 1 1 0 0 0 1 3 0 0 0 3 27
Silver 100 28 0 0 129 131 51 0 0 183 185 60 0 0 246 2074
Livestock 2 2 0 0 5 2 1 0 0 3 3 4 0 0 7 64
Overall 0 0 0 0 0 0 0 0 0 0 1 0 0 0 1 7
Cattle 0 0 0 0 1 0 0 0 0 0 1 1 0 0 2 11
Lean Hogs 2 2 0 0 4 2 1 0 0 3 2 2 0 0 4 45
Total 2,329 914 0 0 3,243 2,907 1,074 0 0 3,982 2,504 429 1 0 2,933 48,873
Nov-15 Oct-15 2014
Source: Deutsche Bank, Bloomberg Finance LP, Reuters.
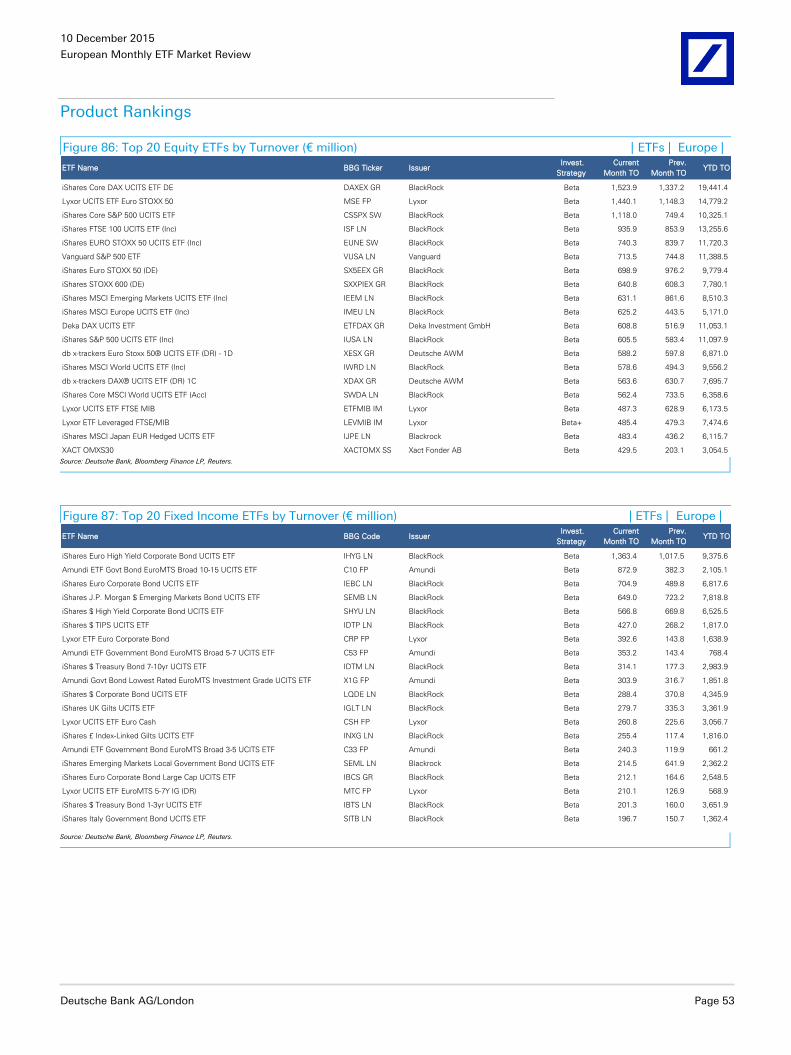
10 December 2015
European Monthly ETF Market Review
Deutsche Bank AG/London Page 53
Product Rankings
Figure 86: Top 20 Equity ETFs by Turnover (€ million) | ETFs | Europe |
ETF Name BBG Ticker Issuer Invest.
Strategy
Current
Month TO
Prev.
Month TO YTD TO
iShares Core DAX UCITS ETF DE DAXEX GR BlackRock Beta 1,523.9 1,337.2 19,441.4
Lyxor UCITS ETF Euro STOXX 50 MSE FP Lyxor Beta 1,440.1 1,148.3 14,779.2
iShares Core S&P 500 UCITS ETF CSSPX SW BlackRock Beta 1,118.0 749.4 10,325.1
iShares FTSE 100 UCITS ETF (Inc) ISF LN BlackRock Beta 935.9 853.9 13,255.6
iShares EURO STOXX 50 UCITS ETF (Inc) EUNE SW BlackRock Beta 740.3 839.7 11,720.3
Vanguard S&P 500 ETF VUSA LN Vanguard Beta 713.5 744.8 11,388.5
iShares Euro STOXX 50 (DE) SX5EEX GR BlackRock Beta 698.9 976.2 9,779.4
iShares STOXX 600 (DE) SXXPIEX GR BlackRock Beta 640.8 608.3 7,780.1
iShares MSCI Emerging Markets UCITS ETF (Inc) IEEM LN BlackRock Beta 631.1 861.6 8,510.3
iShares MSCI Europe UCITS ETF (Inc) IMEU LN BlackRock Beta 625.2 443.5 5,171.0
Deka DAX UCITS ETF ETFDAX GR Deka Investment GmbH Beta 608.8 516.9 11,053.1
iShares S&P 500 UCITS ETF (Inc) IUSA LN BlackRock Beta 605.5 583.4 11,097.9
db x-trackers Euro Stoxx 50® UCITS ETF (DR) - 1D XESX GR Deutsche AWM Beta 588.2 597.8 6,871.0
iShares MSCI World UCITS ETF (Inc) IWRD LN BlackRock Beta 578.6 494.3 9,556.2
db x-trackers DAX® UCITS ETF (DR) 1C XDAX GR Deutsche AWM Beta 563.6 630.7 7,695.7
iShares Core MSCI World UCITS ETF (Acc) SWDA LN BlackRock Beta 562.4 733.5 6,358.6
Lyxor UCITS ETF FTSE MIB ETFMIB IM Lyxor Beta 487.3 628.9 6,173.5
Lyxor ETF Leveraged FTSE/MIB LEVMIB IM Lyxor Beta+ 485.4 479.3 7,474.6
iShares MSCI Japan EUR Hedged UCITS ETF IJPE LN Blackrock Beta 483.4 436.2 6,115.7
XACT OMXS30 XACTOMX SS Xact Fonder AB Beta 429.5 203.1 3,054.5 Source: Deutsche Bank, Bloomberg Finance LP, Reuters.
Figure 87: Top 20 Fixed Income ETFs by Turnover (€ million) | ETFs | Europe |
ETF Name BBG Code Issuer Invest.
Strategy
Current
Month TO
Prev.
Month TO YTD TO
iShares Euro High Yield Corporate Bond UCITS ETF IHYG LN BlackRock Beta 1,363.4 1,017.5 9,375.6
Amundi ETF Govt Bond EuroMTS Broad 10-15 UCITS ETF C10 FP Amundi Beta 872.9 382.3 2,105.1
iShares Euro Corporate Bond UCITS ETF IEBC LN BlackRock Beta 704.9 489.8 6,817.6
iShares J.P. Morgan $ Emerging Markets Bond UCITS ETF SEMB LN BlackRock Beta 649.0 723.2 7,818.8
iShares $ High Yield Corporate Bond UCITS ETF SHYU LN BlackRock Beta 566.8 669.8 6,525.5
iShares $ TIPS UCITS ETF IDTP LN BlackRock Beta 427.0 268.2 1,817.0
Lyxor ETF Euro Corporate Bond CRP FP Lyxor Beta 392.6 143.8 1,638.9
Amundi ETF Government Bond EuroMTS Broad 5-7 UCITS ETF C53 FP Amundi Beta 353.2 143.4 768.4
iShares $ Treasury Bond 7-10yr UCITS ETF IDTM LN BlackRock Beta 314.1 177.3 2,983.9
Amundi Govt Bond Lowest Rated EuroMTS Investment Grade UCITS ETF X1G FP Amundi Beta 303.9 316.7 1,851.8
iShares $ Corporate Bond UCITS ETF LQDE LN BlackRock Beta 288.4 370.8 4,345.9
iShares UK Gilts UCITS ETF IGLT LN BlackRock Beta 279.7 335.3 3,361.9
Lyxor UCITS ETF Euro Cash CSH FP Lyxor Beta 260.8 225.6 3,056.7
iShares £ Index-Linked Gilts UCITS ETF INXG LN BlackRock Beta 255.4 117.4 1,816.0
Amundi ETF Government Bond EuroMTS Broad 3-5 UCITS ETF C33 FP Amundi Beta 240.3 119.9 661.2
iShares Emerging Markets Local Government Bond UCITS ETF SEML LN Blackrock Beta 214.5 641.9 2,362.2
iShares Euro Corporate Bond Large Cap UCITS ETF IBCS GR BlackRock Beta 212.1 164.6 2,548.5
Lyxor UCITS ETF EuroMTS 5-7Y IG (DR) MTC FP Lyxor Beta 210.1 126.9 568.9
iShares $ Treasury Bond 1-3yr UCITS ETF IBTS LN BlackRock Beta 201.3 160.0 3,651.9
iShares Italy Government Bond UCITS ETF SITB LN BlackRock Beta 196.7 150.7 1,362.4
Source: Deutsche Bank, Bloomberg Finance LP, Reuters.
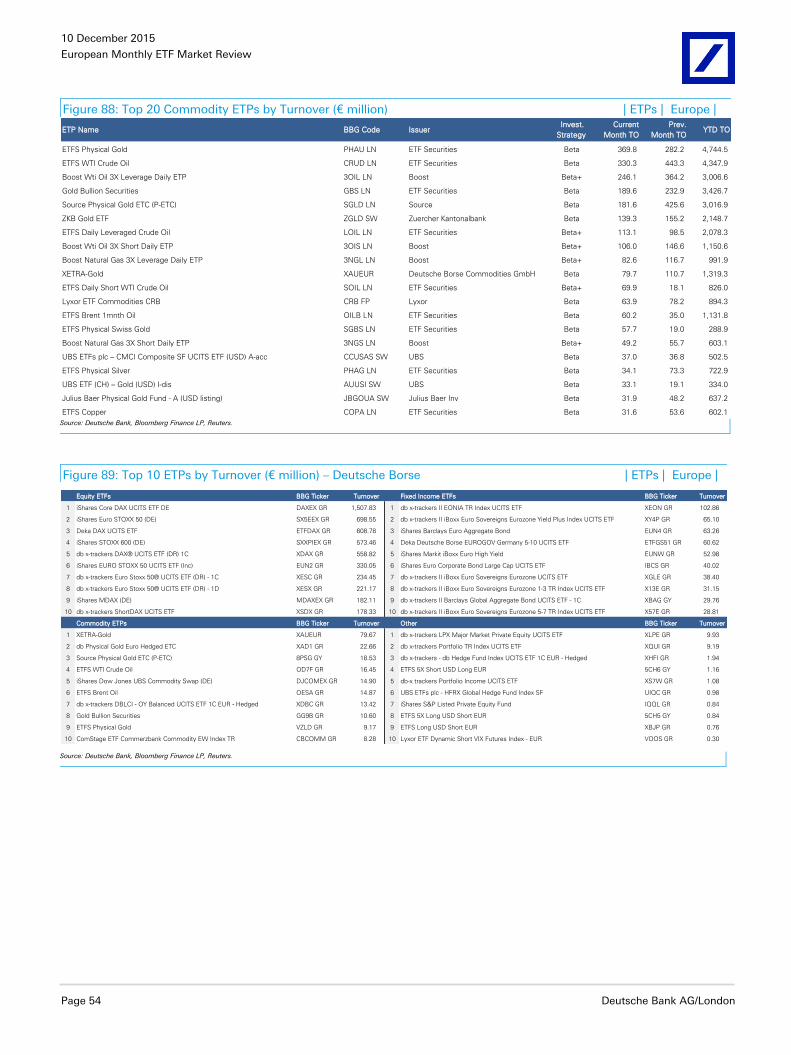
10 December 2015
European Monthly ETF Market Review
Page 54 Deutsche Bank AG/London
Figure 88: Top 20 Commodity ETPs by Turnover (€ million) | ETPs | Europe |
ETP Name BBG Code Issuer Invest.
Strategy
Current
Month TO
Prev.
Month TO YTD TO
ETFS Physical Gold PHAU LN ETF Securities Beta 369.8 282.2 4,744.5
ETFS WTI Crude Oil CRUD LN ETF Securities Beta 330.3 443.3 4,347.9
Boost Wti Oil 3X Leverage Daily ETP 3OIL LN Boost Beta+ 246.1 364.2 3,006.6
Gold Bullion Securities GBS LN ETF Securities Beta 189.6 232.9 3,426.7
Source Physical Gold ETC (P-ETC) SGLD LN Source Beta 181.6 425.6 3,016.9
ZKB Gold ETF ZGLD SW Zuercher Kantonalbank Beta 139.3 155.2 2,148.7
ETFS Daily Leveraged Crude Oil LOIL LN ETF Securities Beta+ 113.1 98.5 2,078.3
Boost Wti Oil 3X Short Daily ETP 3OIS LN Boost Beta+ 106.0 146.6 1,150.6
Boost Natural Gas 3X Leverage Daily ETP 3NGL LN Boost Beta+ 82.6 116.7 991.9
XETRA-Gold XAUEUR Deutsche Borse Commodities GmbH Beta 79.7 110.7 1,319.3
ETFS Daily Short WTI Crude Oil SOIL LN ETF Securities Beta+ 69.9 18.1 826.0
Lyxor ETF Commodities CRB CRB FP Lyxor Beta 63.9 78.2 894.3
ETFS Brent 1mnth Oil OILB LN ETF Securities Beta 60.2 35.0 1,131.8
ETFS Physical Swiss Gold SGBS LN ETF Securities Beta 57.7 19.0 288.9
Boost Natural Gas 3X Short Daily ETP 3NGS LN Boost Beta+ 49.2 55.7 603.1
UBS ETFs plc – CMCI Composite SF UCITS ETF (USD) A-acc CCUSAS SW UBS Beta 37.0 36.8 502.5
ETFS Physical Silver PHAG LN ETF Securities Beta 34.1 73.3 722.9
UBS ETF (CH) – Gold (USD) I-dis AUUSI SW UBS Beta 33.1 19.1 334.0
Julius Baer Physical Gold Fund - A (USD listing) JBGOUA SW Julius Baer Inv Beta 31.9 48.2 637.2
ETFS Copper COPA LN ETF Securities Beta 31.6 53.6 602.1 Source: Deutsche Bank, Bloomberg Finance LP, Reuters.
Figure 89: Top 10 ETPs by Turnover (€ million) – Deutsche Borse | ETPs | Europe |
Equity ETFs BBG Ticker Turnover Fixed Income ETFs BBG Ticker Turnover
1 iShares Core DAX UCITS ETF DE DAXEX GR 1,507.83 1 db x-trackers II EONIA TR Index UCITS ETF XEON GR 102.86
2 iShares Euro STOXX 50 (DE) SX5EEX GR 698.55 2 db x-trackers II iBoxx Euro Sovereigns Eurozone Yield Plus Index UCITS ETF XY4P GR 65.10
3 Deka DAX UCITS ETF ETFDAX GR 608.78 3 iShares Barclays Euro Aggregate Bond EUN4 GR 63.26
4 iShares STOXX 600 (DE) SXXPIEX GR 573.46 4 Deka Deutsche Borse EUROGOV Germany 5-10 UCITS ETF ETFGS51 GR 60.62
5 db x-trackers DAX® UCITS ETF (DR) 1C XDAX GR 558.82 5 iShares Markit iBoxx Euro High Yield EUNW GR 52.98
6 iShares EURO STOXX 50 UCITS ETF (Inc) EUN2 GR 330.05 6 iShares Euro Corporate Bond Large Cap UCITS ETF IBCS GR 40.02
7 db x-trackers Euro Stoxx 50® UCITS ETF (DR) - 1C XESC GR 234.45 7 db x-trackers II iBoxx Euro Sovereigns Eurozone UCITS ETF XGLE GR 38.40
8 db x-trackers Euro Stoxx 50® UCITS ETF (DR) - 1D XESX GR 221.17 8 db x-trackers II iBoxx Euro Sovereigns Eurozone 1-3 TR Index UCITS ETF X13E GR 31.15
9 iShares MDAX (DE) MDAXEX GR 182.11 9 db x-trackers II Barclays Global Aggregate Bond UCITS ETF - 1C XBAG GY 29.76
10 db x-trackers ShortDAX UCITS ETF XSDX GR 178.33 10 db x-trackers II iBoxx Euro Sovereigns Eurozone 5-7 TR Index UCITS ETF X57E GR 28.81
Commodity ETPs BBG Ticker Turnover Other BBG Ticker Turnover
1 XETRA-Gold XAUEUR 79.67 1 db x-trackers LPX Major Market Private Equity UCITS ETF XLPE GR 9.93
2 db Physical Gold Euro Hedged ETC XAD1 GR 22.66 2 db x-trackers Portfolio TR Index UCITS ETF XQUI GR 9.19
3 Source Physical Gold ETC (P-ETC) 8PSG GY 18.53 3 db x-trackers - db Hedge Fund Index UCITS ETF 1C EUR - Hedged XHFI GR 1.94
4 ETFS WTI Crude Oil OD7F GR 16.45 4 ETFS 5X Short USD Long EUR 5CH6 GY 1.16
5 iShares Dow Jones UBS Commodity Swap (DE) DJCOMEX GR 14.90 5 db-x trackers Portfolio Income UCITS ETF XS7W GR 1.08
6 ETFS Brent Oil OESA GR 14.87 6 UBS ETFs plc - HFRX Global Hedge Fund Index SF UIQC GR 0.98
7 db x-trackers DBLCI - OY Balanced UCITS ETF 1C EUR - Hedged XDBC GR 13.42 7 iShares S&P Listed Private Equity Fund IQQL GR 0.84
8 Gold Bullion Securities GG9B GR 10.60 8 ETFS 5X Long USD Short EUR 5CH5 GY 0.84
9 ETFS Physical Gold VZLD GR 9.17 9 ETFS Long USD Short EUR XBJP GR 0.76
10 ComStage ETF Commerzbank Commodity EW Index TR CBCOMM GR 8.28 10 Lyxor ETF Dynamic Short VIX Futures Index - EUR VOOS GR 0.30
Source: Deutsche Bank, Bloomberg Finance LP, Reuters.
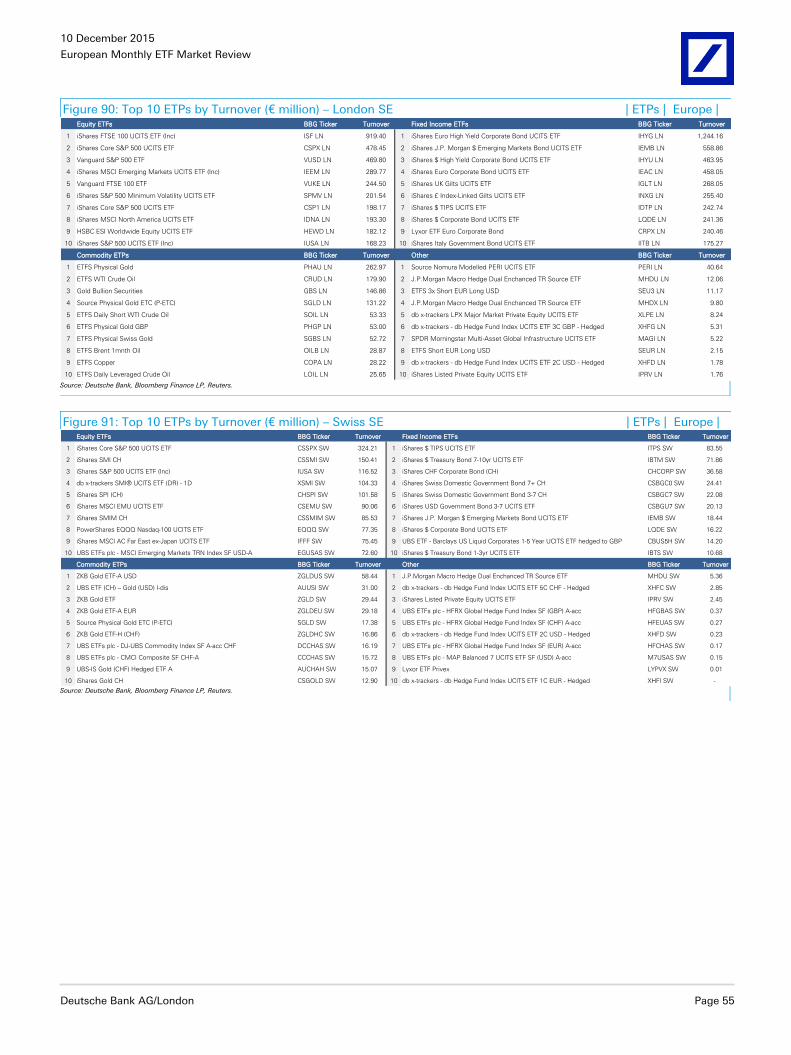
10 December 2015
European Monthly ETF Market Review
Deutsche Bank AG/London Page 55
Figure 90: Top 10 ETPs by Turnover (€ million) – London SE | ETPs | Europe | Equity ETFs BBG Ticker Turnover Fixed Income ETFs BBG Ticker Turnover
1 iShares FTSE 100 UCITS ETF (Inc) ISF LN 919.40 1 iShares Euro High Yield Corporate Bond UCITS ETF IHYG LN 1,244.16
2 iShares Core S&P 500 UCITS ETF CSPX LN 478.45 2 iShares J.P. Morgan $ Emerging Markets Bond UCITS ETF IEMB LN 558.86
3 Vanguard S&P 500 ETF VUSD LN 469.80 3 iShares $ High Yield Corporate Bond UCITS ETF IHYU LN 463.95
4 iShares MSCI Emerging Markets UCITS ETF (Inc) IEEM LN 289.77 4 iShares Euro Corporate Bond UCITS ETF IEAC LN 458.05
5 Vanguard FTSE 100 ETF VUKE LN 244.50 5 iShares UK Gilts UCITS ETF IGLT LN 268.05
6 iShares S&P 500 Minimum Volatility UCITS ETF SPMV LN 201.54 6 iShares £ Index-Linked Gilts UCITS ETF INXG LN 255.40
7 iShares Core S&P 500 UCITS ETF CSP1 LN 198.17 7 iShares $ TIPS UCITS ETF IDTP LN 242.74
8 iShares MSCI North America UCITS ETF IDNA LN 193.30 8 iShares $ Corporate Bond UCITS ETF LQDE LN 241.36
9 HSBC ESI Worldwide Equity UCITS ETF HEWD LN 182.12 9 Lyxor ETF Euro Corporate Bond CRPX LN 240.46
10 iShares S&P 500 UCITS ETF (Inc) IUSA LN 168.23 10 iShares Italy Government Bond UCITS ETF IITB LN 175.27
Commodity ETPs BBG Ticker Turnover Other BBG Ticker Turnover
1 ETFS Physical Gold PHAU LN 262.97 1 Source Nomura Modelled PERI UCITS ETF PERI LN 40.64
2 ETFS WTI Crude Oil CRUD LN 179.90 2 J.P.Morgan Macro Hedge Dual Enchanced TR Source ETF MHDU LN 12.06
3 Gold Bullion Securities GBS LN 146.86 3 ETFS 3x Short EUR Long USD SEU3 LN 11.17
4 Source Physical Gold ETC (P-ETC) SGLD LN 131.22 4 J.P.Morgan Macro Hedge Dual Enchanced TR Source ETF MHDX LN 9.80
5 ETFS Daily Short WTI Crude Oil SOIL LN 53.33 5 db x-trackers LPX Major Market Private Equity UCITS ETF XLPE LN 8.24
6 ETFS Physical Gold GBP PHGP LN 53.00 6 db x-trackers - db Hedge Fund Index UCITS ETF 3C GBP - Hedged XHFG LN 5.31
7 ETFS Physical Swiss Gold SGBS LN 52.72 7 SPDR Morningstar Multi-Asset Global Infrastructure UCITS ETF MAGI LN 5.22
8 ETFS Brent 1mnth Oil OILB LN 28.87 8 ETFS Short EUR Long USD SEUR LN 2.15
9 ETFS Copper COPA LN 28.22 9 db x-trackers - db Hedge Fund Index UCITS ETF 2C USD - Hedged XHFD LN 1.78
10 ETFS Daily Leveraged Crude Oil LOIL LN 25.65 10 iShares Listed Private Equity UCITS ETF IPRV LN 1.76 Source: Deutsche Bank, Bloomberg Finance LP, Reuters.
Figure 91: Top 10 ETPs by Turnover (€ million) – Swiss SE | ETPs | Europe | Equity ETFs BBG Ticker Turnover Fixed Income ETFs BBG Ticker Turnover
1 iShares Core S&P 500 UCITS ETF CSSPX SW 324.21 1 iShares $ TIPS UCITS ETF ITPS SW 83.55
2 iShares SMI CH CSSMI SW 150.41 2 iShares $ Treasury Bond 7-10yr UCITS ETF IBTM SW 71.86
3 iShares S&P 500 UCITS ETF (Inc) IUSA SW 116.52 3 iShares CHF Corporate Bond (CH) CHCORP SW 36.58
4 db x-trackers SMI® UCITS ETF (DR) - 1D XSMI SW 104.33 4 iShares Swiss Domestic Government Bond 7+ CH CSBGC0 SW 24.41
5 iShares SPI (CH) CHSPI SW 101.58 5 iShares Swiss Domestic Government Bond 3-7 CH CSBGC7 SW 22.08
6 iShares MSCI EMU UCITS ETF CSEMU SW 90.06 6 iShares USD Government Bond 3-7 UCITS ETF CSBGU7 SW 20.13
7 iShares SMIM CH CSSMIM SW 85.53 7 iShares J.P. Morgan $ Emerging Markets Bond UCITS ETF IEMB SW 18.44
8 PowerShares EQQQ Nasdaq-100 UCITS ETF EQQQ SW 77.35 8 iShares $ Corporate Bond UCITS ETF LQDE SW 16.22
9 iShares MSCI AC Far East ex-Japan UCITS ETF IFFF SW 75.45 9 UBS ETF - Barclays US Liquid Corporates 1-5 Year UCITS ETF hedged to GBP CBUS5H SW 14.20
10 UBS ETFs plc - MSCI Emerging Markets TRN Index SF USD-A EGUSAS SW 72.60 10 iShares $ Treasury Bond 1-3yr UCITS ETF IBTS SW 10.68
Commodity ETPs BBG Ticker Turnover Other BBG Ticker Turnover
1 ZKB Gold ETF-A USD ZGLDUS SW 58.44 1 J.P.Morgan Macro Hedge Dual Enchanced TR Source ETF MHDU SW 5.36
2 UBS ETF (CH) – Gold (USD) I-dis AUUSI SW 31.00 2 db x-trackers - db Hedge Fund Index UCITS ETF 5C CHF - Hedged XHFC SW 2.85
3 ZKB Gold ETF ZGLD SW 29.44 3 iShares Listed Private Equity UCITS ETF IPRV SW 2.45
4 ZKB Gold ETF-A EUR ZGLDEU SW 29.18 4 UBS ETFs plc - HFRX Global Hedge Fund Index SF (GBP) A-acc HFGBAS SW 0.37
5 Source Physical Gold ETC (P-ETC) SGLD SW 17.38 5 UBS ETFs plc - HFRX Global Hedge Fund Index SF (CHF) A-acc HFEUAS SW 0.27
6 ZKB Gold ETF-H (CHF) ZGLDHC SW 16.86 6 db x-trackers - db Hedge Fund Index UCITS ETF 2C USD - Hedged XHFD SW 0.23
7 UBS ETFs plc - DJ-UBS Commodity Index SF A-acc CHF DCCHAS SW 16.19 7 UBS ETFs plc - HFRX Global Hedge Fund Index SF (EUR) A-acc HFCHAS SW 0.17
8 UBS ETFs plc - CMCI Composite SF CHF-A CCCHAS SW 15.72 8 UBS ETFs plc - MAP Balanced 7 UCITS ETF SF (USD) A-acc M7USAS SW 0.15
9 UBS-IS Gold (CHF) Hedged ETF A AUCHAH SW 15.07 9 Lyxor ETF Privex LYPVX SW 0.01
10 iShares Gold CH CSGOLD SW 12.90 10 db x-trackers - db Hedge Fund Index UCITS ETF 1C EUR - Hedged XHFI SW - Source: Deutsche Bank, Bloomberg Finance LP, Reuters.
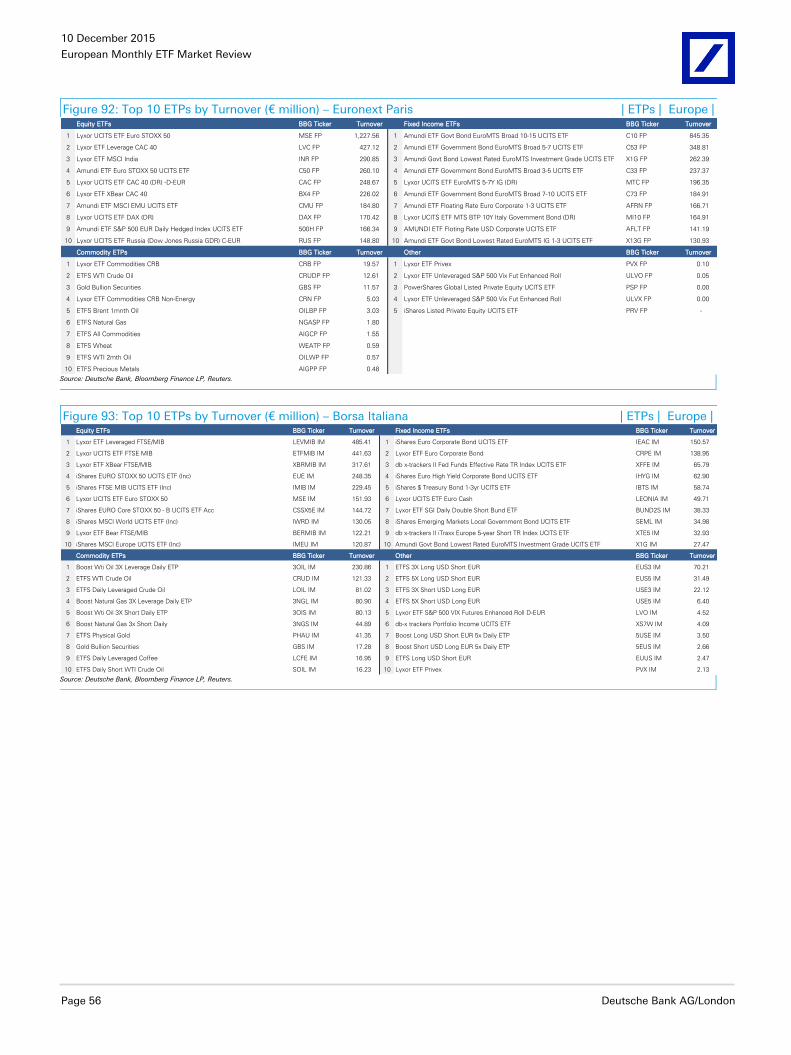
10 December 2015
European Monthly ETF Market Review
Page 56 Deutsche Bank AG/London
Figure 92: Top 10 ETPs by Turnover (€ million) – Euronext Paris | ETPs | Europe | Equity ETFs BBG Ticker Turnover Fixed Income ETFs BBG Ticker Turnover
1 Lyxor UCITS ETF Euro STOXX 50 MSE FP 1,227.56 1 Amundi ETF Govt Bond EuroMTS Broad 10-15 UCITS ETF C10 FP 845.35
2 Lyxor ETF Leverage CAC 40 LVC FP 427.12 2 Amundi ETF Government Bond EuroMTS Broad 5-7 UCITS ETF C53 FP 348.81
3 Lyxor ETF MSCI India INR FP 290.85 3 Amundi Govt Bond Lowest Rated EuroMTS Investment Grade UCITS ETF X1G FP 262.39
4 Amundi ETF Euro STOXX 50 UCITS ETF C50 FP 260.10 4 Amundi ETF Government Bond EuroMTS Broad 3-5 UCITS ETF C33 FP 237.37
5 Lyxor UCITS ETF CAC 40 (DR) -D-EUR CAC FP 248.67 5 Lyxor UCITS ETF EuroMTS 5-7Y IG (DR) MTC FP 196.35
6 Lyxor ETF XBear CAC 40 BX4 FP 226.02 6 Amundi ETF Government Bond EuroMTS Broad 7-10 UCITS ETF C73 FP 184.91
7 Amundi ETF MSCI EMU UCITS ETF CMU FP 184.80 7 Amundi ETF Floating Rate Euro Corporate 1-3 UCITS ETF AFRN FP 166.71
8 Lyxor UCITS ETF DAX (DR) DAX FP 170.42 8 Lyxor UCITS ETF MTS BTP 10Y Italy Government Bond (DR) MI10 FP 164.91
9 Amundi ETF S&P 500 EUR Daily Hedged Index UCITS ETF 500H FP 166.34 9 AMUNDI ETF Floting Rate USD Corporate UCITS ETF AFLT FP 141.19
10 Lyxor UCITS ETF Russia (Dow Jones Russia GDR) C-EUR RUS FP 148.80 10 Amundi ETF Govt Bond Lowest Rated EuroMTS IG 1-3 UCITS ETF X13G FP 130.93
Commodity ETPs BBG Ticker Turnover Other BBG Ticker Turnover
1 Lyxor ETF Commodities CRB CRB FP 19.57 1 Lyxor ETF Privex PVX FP 0.10
2 ETFS WTI Crude Oil CRUDP FP 12.61 2 Lyxor ETF Unleveraged S&P 500 Vix Fut Enhanced Roll ULVO FP 0.05
3 Gold Bullion Securities GBS FP 11.57 3 PowerShares Global Listed Private Equity UCITS ETF PSP FP 0.00
4 Lyxor ETF Commodities CRB Non-Energy CRN FP 5.03 4 Lyxor ETF Unleveraged S&P 500 Vix Fut Enhanced Roll ULVX FP 0.00
5 ETFS Brent 1mnth Oil OILBP FP 3.03 5 iShares Listed Private Equity UCITS ETF PRV FP -
6 ETFS Natural Gas NGASP FP 1.80
7 ETFS All Commodities AIGCP FP 1.55
8 ETFS Wheat WEATP FP 0.59
9 ETFS WTI 2mth Oil OILWP FP 0.57
10 ETFS Precious Metals AIGPP FP 0.48 Source: Deutsche Bank, Bloomberg Finance LP, Reuters.
Figure 93: Top 10 ETPs by Turnover (€ million) – Borsa Italiana | ETPs | Europe | Equity ETFs BBG Ticker Turnover Fixed Income ETFs BBG Ticker Turnover
1 Lyxor ETF Leveraged FTSE/MIB LEVMIB IM 485.41 1 iShares Euro Corporate Bond UCITS ETF IEAC IM 150.57
2 Lyxor UCITS ETF FTSE MIB ETFMIB IM 441.63 2 Lyxor ETF Euro Corporate Bond CRPE IM 138.95
3 Lyxor ETF XBear FTSE/MIB XBRMIB IM 317.61 3 db x-trackers II Fed Funds Effective Rate TR Index UCITS ETF XFFE IM 65.79
4 iShares EURO STOXX 50 UCITS ETF (Inc) EUE IM 248.35 4 iShares Euro High Yield Corporate Bond UCITS ETF IHYG IM 62.90
5 iShares FTSE MIB UCITS ETF (Inc) IMIB IM 229.45 5 iShares $ Treasury Bond 1-3yr UCITS ETF IBTS IM 58.74
6 Lyxor UCITS ETF Euro STOXX 50 MSE IM 151.93 6 Lyxor UCITS ETF Euro Cash LEONIA IM 49.71
7 iShares EURO Core STOXX 50 - B UCITS ETF Acc CSSX5E IM 144.72 7 Lyxor ETF SGI Daily Double Short Bund ETF BUND2S IM 38.33
8 iShares MSCI World UCITS ETF (Inc) IWRD IM 130.05 8 iShares Emerging Markets Local Government Bond UCITS ETF SEML IM 34.98
9 Lyxor ETF Bear FTSE/MIB BERMIB IM 122.21 9 db x-trackers II iTraxx Europe 5-year Short TR Index UCITS ETF XTE5 IM 32.93
10 iShares MSCI Europe UCITS ETF (Inc) IMEU IM 120.87 10 Amundi Govt Bond Lowest Rated EuroMTS Investment Grade UCITS ETF X1G IM 27.47
Commodity ETPs BBG Ticker Turnover Other BBG Ticker Turnover
1 Boost Wti Oil 3X Leverage Daily ETP 3OIL IM 230.86 1 ETFS 3X Long USD Short EUR EUS3 IM 70.21
2 ETFS WTI Crude Oil CRUD IM 121.33 2 ETFS 5X Long USD Short EUR EUS5 IM 31.49
3 ETFS Daily Leveraged Crude Oil LOIL IM 81.02 3 ETFS 3X Short USD Long EUR USE3 IM 22.12
4 Boost Natural Gas 3X Leverage Daily ETP 3NGL IM 80.90 4 ETFS 5X Short USD Long EUR USE5 IM 6.40
5 Boost Wti Oil 3X Short Daily ETP 3OIS IM 80.13 5 Lyxor ETF S&P 500 VIX Futures Enhanced Roll D-EUR LVO IM 4.52
6 Boost Natural Gas 3x Short Daily 3NGS IM 44.89 6 db-x trackers Portfolio Income UCITS ETF XS7W IM 4.09
7 ETFS Physical Gold PHAU IM 41.35 7 Boost Long USD Short EUR 5x Daily ETP 5USE IM 3.50
8 Gold Bullion Securities GBS IM 17.28 8 Boost Short USD Long EUR 5x Daily ETP 5EUS IM 2.66
9 ETFS Daily Leveraged Coffee LCFE IM 16.95 9 ETFS Long USD Short EUR EUUS IM 2.47
10 ETFS Daily Short WTI Crude Oil SOIL IM 16.23 10 Lyxor ETF Privex PVX IM 2.13 Source: Deutsche Bank, Bloomberg Finance LP, Reuters.
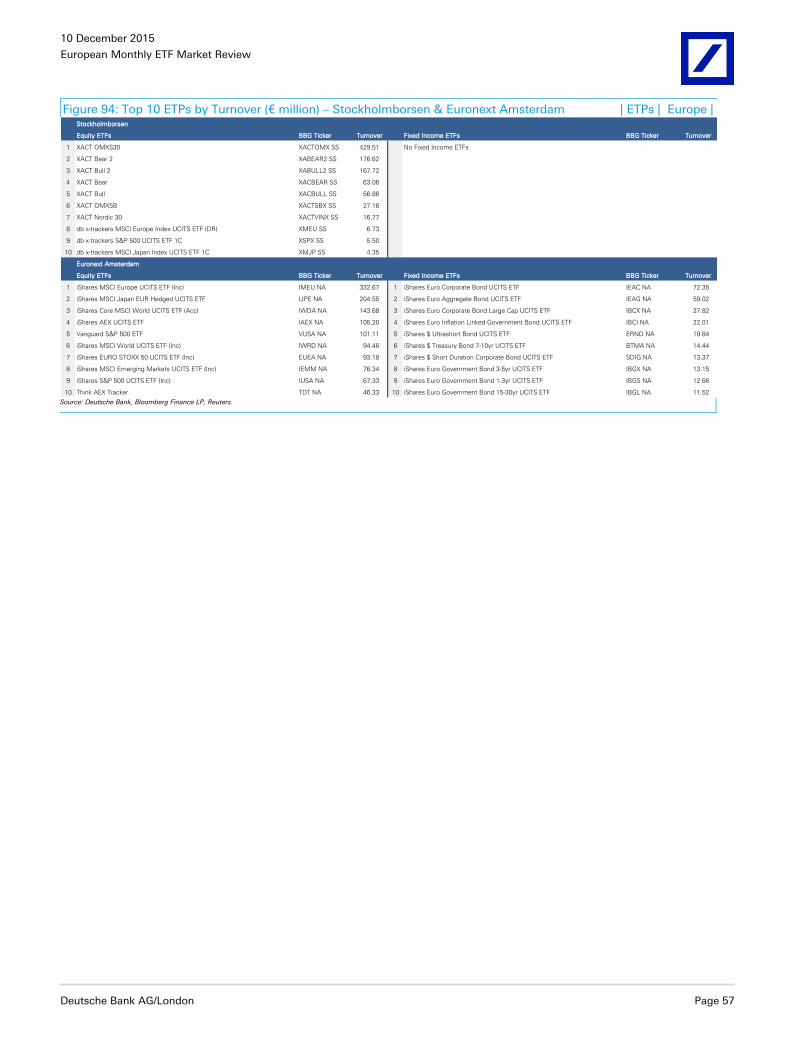
10 December 2015
European Monthly ETF Market Review
Deutsche Bank AG/London Page 57
Figure 94: Top 10 ETPs by Turnover (€ million) – Stockholmborsen & Euronext Amsterdam | ETPs | Europe | Stockholmborsen
Equity ETFs BBG Ticker Turnover Fixed Income ETFs BBG Ticker Turnover
1 XACT OMXS30 XACTOMX SS 429.51 No Fixed Income ETFs
2 XACT Bear 2 XABEAR2 SS 176.62
3 XACT Bull 2 XABULL2 SS 167.72
4 XACT Bear XACBEAR SS 63.06
5 XACT Bull XACBULL SS 56.86
6 XACT OMXSB XACTSBX SS 27.16
7 XACT Nordic 30 XACTVINX SS 16.77
8 db x-trackers MSCI Europe Index UCITS ETF (DR) XMEU SS 6.73
9 db x-trackers S&P 500 UCITS ETF 1C XSPX SS 5.50
10 db x-trackers MSCI Japan Index UCITS ETF 1C XMJP SS 4.35
Euronext Amsterdam
Equity ETFs BBG Ticker Turnover Fixed Income ETFs BBG Ticker Turnover
1 iShares MSCI Europe UCITS ETF (Inc) IMEU NA 332.67 1 iShares Euro Corporate Bond UCITS ETF IEAC NA 72.35
2 iShares MSCI Japan EUR Hedged UCITS ETF IJPE NA 204.55 2 iShares Euro Aggregate Bond UCITS ETF IEAG NA 59.02
3 iShares Core MSCI World UCITS ETF (Acc) IWDA NA 143.68 3 iShares Euro Corporate Bond Large Cap UCITS ETF IBCX NA 27.82
4 iShares AEX UCITS ETF IAEX NA 105.20 4 iShares Euro Inflation Linked Government Bond UCITS ETF IBCI NA 22.01
5 Vanguard S&P 500 ETF VUSA NA 101.11 5 iShares $ Ultrashort Bond UCITS ETF ERND NA 19.84
6 iShares MSCI World UCITS ETF (Inc) IWRD NA 94.46 6 iShares $ Treasury Bond 7-10yr UCITS ETF BTMA NA 14.44
7 iShares EURO STOXX 50 UCITS ETF (Inc) EUEA NA 93.18 7 iShares $ Short Duration Corporate Bond UCITS ETF SDIG NA 13.37
8 iShares MSCI Emerging Markets UCITS ETF (Inc) IEMM NA 76.34 8 iShares Euro Government Bond 3-5yr UCITS ETF IBGX NA 13.15
9 iShares S&P 500 UCITS ETF (Inc) IUSA NA 67.33 9 iShares Euro Government Bond 1-3yr UCITS ETF IBGS NA 12.66
10 Think AEX Tracker TDT NA 46.33 10 iShares Euro Government Bond 15-30yr UCITS ETF IBGL NA 11.52 Source: Deutsche Bank, Bloomberg Finance LP, Reuters.
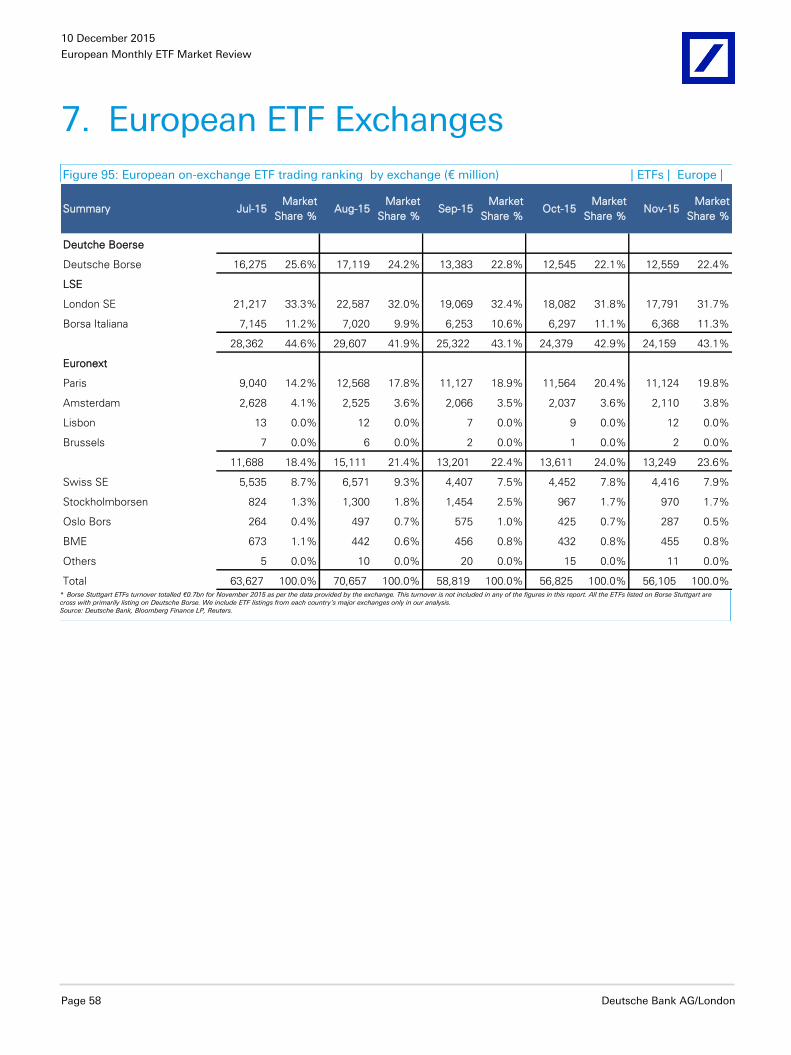
10 December 2015
European Monthly ETF Market Review
Page 58 Deutsche Bank AG/London
7. European ETF Exchanges
Figure 95: European on-exchange ETF trading ranking by exchange (€ million) | ETFs | Europe |
Summary Jul-15Market
Share %Aug-15
Market
Share %Sep-15
Market
Share %Oct-15
Market
Share %Nov-15
Market
Share %
Deutche Boerse
Deutsche Borse 16,275 25.6% 17,119 24.2% 13,383 22.8% 12,545 22.1% 12,559 22.4%
LSE
London SE 21,217 33.3% 22,587 32.0% 19,069 32.4% 18,082 31.8% 17,791 31.7%
Borsa Italiana 7,145 11.2% 7,020 9.9% 6,253 10.6% 6,297 11.1% 6,368 11.3%
28,362 44.6% 29,607 41.9% 25,322 43.1% 24,379 42.9% 24,159 43.1%
Euronext
Paris 9,040 14.2% 12,568 17.8% 11,127 18.9% 11,564 20.4% 11,124 19.8%
Amsterdam 2,628 4.1% 2,525 3.6% 2,066 3.5% 2,037 3.6% 2,110 3.8%
Lisbon 13 0.0% 12 0.0% 7 0.0% 9 0.0% 12 0.0%
Brussels 7 0.0% 6 0.0% 2 0.0% 1 0.0% 2 0.0%
11,688 18.4% 15,111 21.4% 13,201 22.4% 13,611 24.0% 13,249 23.6%
Swiss SE 5,535 8.7% 6,571 9.3% 4,407 7.5% 4,452 7.8% 4,416 7.9%
Stockholmborsen 824 1.3% 1,300 1.8% 1,454 2.5% 967 1.7% 970 1.7%
Oslo Bors 264 0.4% 497 0.7% 575 1.0% 425 0.7% 287 0.5%
BME 673 1.1% 442 0.6% 456 0.8% 432 0.8% 455 0.8%
Others 5 0.0% 10 0.0% 20 0.0% 15 0.0% 11 0.0%
Total 63,627 100.0% 70,657 100.0% 58,819 100.0% 56,825 100.0% 56,105 100.0%
* Borse Stuttgart ETFs turnover totalled €0.7bn for November 2015 as per the data provided by the exchange. This turnover is not included in any of the figures in this report. All the ETFs listed on Borse Stuttgart are cross with primarily listing on Deutsche Borse. We include ETF listings from each country’s major exchanges only in our analysis. Source: Deutsche Bank, Bloomberg Finance LP, Reuters.
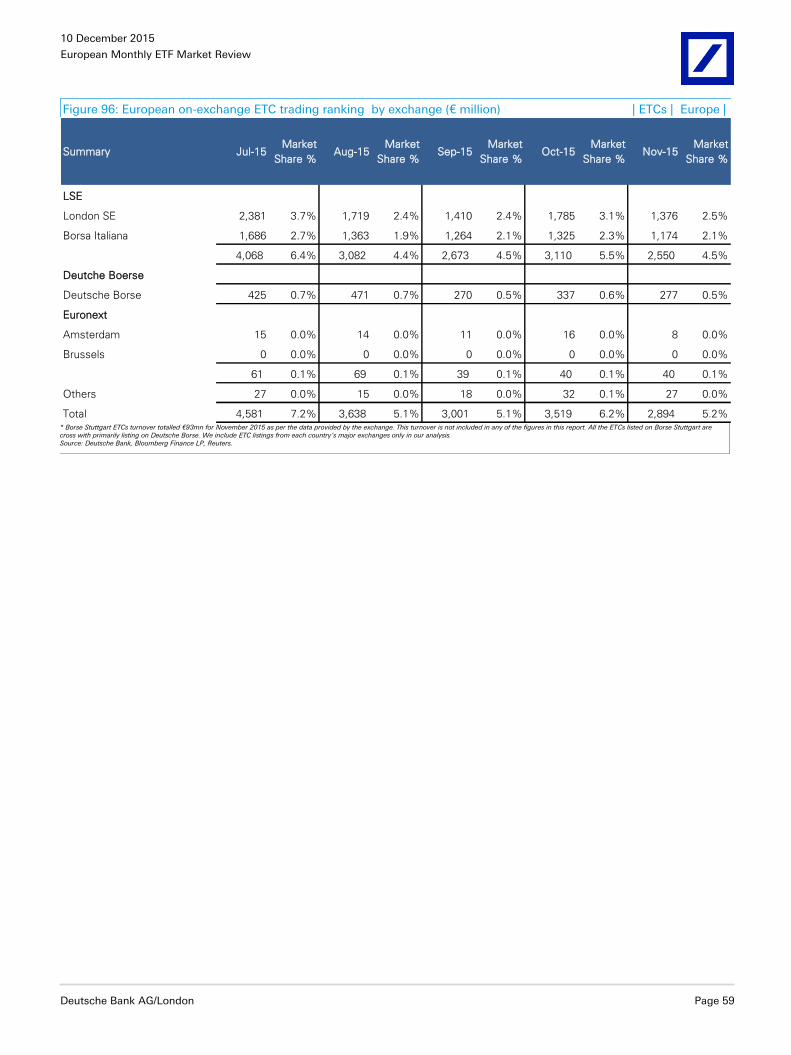
10 December 2015
European Monthly ETF Market Review
Deutsche Bank AG/London Page 59
Figure 96: European on-exchange ETC trading ranking by exchange (€ million) | ETCs | Europe |
Summary Jul-15Market
Share %Aug-15
Market
Share %Sep-15
Market
Share %Oct-15
Market
Share %Nov-15
Market
Share %
LSE
London SE 2,381 3.7% 1,719 2.4% 1,410 2.4% 1,785 3.1% 1,376 2.5%
Borsa Italiana 1,686 2.7% 1,363 1.9% 1,264 2.1% 1,325 2.3% 1,174 2.1%
4,068 6.4% 3,082 4.4% 2,673 4.5% 3,110 5.5% 2,550 4.5%
Deutche Boerse
Deutsche Borse 425 0.7% 471 0.7% 270 0.5% 337 0.6% 277 0.5%
Euronext
Amsterdam 15 0.0% 14 0.0% 11 0.0% 16 0.0% 8 0.0%
Brussels 0 0.0% 0 0.0% 0 0.0% 0 0.0% 0 0.0%
61 0.1% 69 0.1% 39 0.1% 40 0.1% 40 0.1%
Others 27 0.0% 15 0.0% 18 0.0% 32 0.1% 27 0.0%
Total 4,581 7.2% 3,638 5.1% 3,001 5.1% 3,519 6.2% 2,894 5.2%
* Borse Stuttgart ETCs turnover totalled €93mn for November 2015 as per the data provided by the exchange. This turnover is not included in any of the figures in this report. All the ETCs listed on Borse Stuttgart are cross with primarily listing on Deutsche Borse. We include ETC listings from each country’s major exchanges only in our analysis. Source: Deutsche Bank, Bloomberg Finance LP, Reuters.
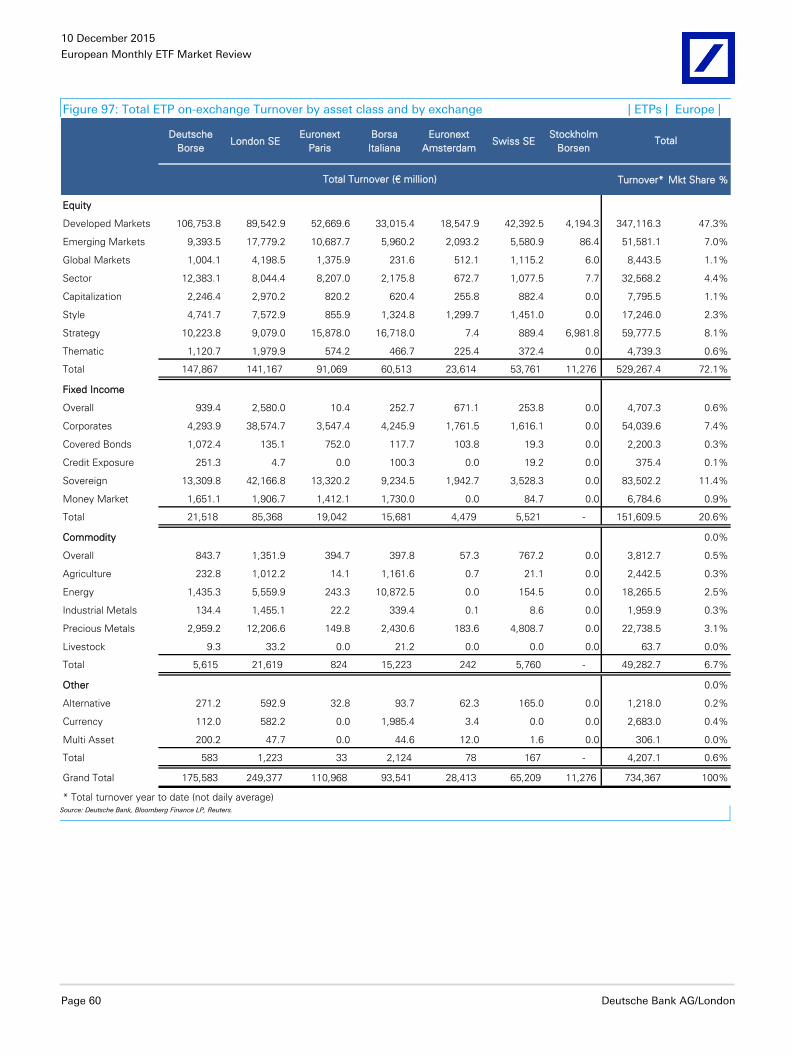
10 December 2015
European Monthly ETF Market Review
Page 60 Deutsche Bank AG/London
Figure 97: Total ETP on-exchange Turnover by asset class and by exchange | ETPs | Europe |
Deutsche
BorseLondon SE
Euronext
Paris
Borsa
Italiana
Euronext
AmsterdamSwiss SE
Stockholm
Borsen
Turnover* Mkt Share %
Equity
Developed Markets 106,753.8 89,542.9 52,669.6 33,015.4 18,547.9 42,392.5 4,194.3 347,116.3 47.3%
Emerging Markets 9,393.5 17,779.2 10,687.7 5,960.2 2,093.2 5,580.9 86.4 51,581.1 7.0%
Global Markets 1,004.1 4,198.5 1,375.9 231.6 512.1 1,115.2 6.0 8,443.5 1.1%
Sector 12,383.1 8,044.4 8,207.0 2,175.8 672.7 1,077.5 7.7 32,568.2 4.4%
Capitalization 2,246.4 2,970.2 820.2 620.4 255.8 882.4 0.0 7,795.5 1.1%
Style 4,741.7 7,572.9 855.9 1,324.8 1,299.7 1,451.0 0.0 17,246.0 2.3%
Strategy 10,223.8 9,079.0 15,878.0 16,718.0 7.4 889.4 6,981.8 59,777.5 8.1%
Thematic 1,120.7 1,979.9 574.2 466.7 225.4 372.4 0.0 4,739.3 0.6%
Total 147,867 141,167 91,069 60,513 23,614 53,761 11,276 529,267.4 72.1%
Fixed Income
Overall 939.4 2,580.0 10.4 252.7 671.1 253.8 0.0 4,707.3 0.6%
Corporates 4,293.9 38,574.7 3,547.4 4,245.9 1,761.5 1,616.1 0.0 54,039.6 7.4%
Covered Bonds 1,072.4 135.1 752.0 117.7 103.8 19.3 0.0 2,200.3 0.3%
Credit Exposure 251.3 4.7 0.0 100.3 0.0 19.2 0.0 375.4 0.1%
Sovereign 13,309.8 42,166.8 13,320.2 9,234.5 1,942.7 3,528.3 0.0 83,502.2 11.4%
Money Market 1,651.1 1,906.7 1,412.1 1,730.0 0.0 84.7 0.0 6,784.6 0.9%
Total 21,518 85,368 19,042 15,681 4,479 5,521 - 151,609.5 20.6%
Commodity 0.0%
Overall 843.7 1,351.9 394.7 397.8 57.3 767.2 0.0 3,812.7 0.5%
Agriculture 232.8 1,012.2 14.1 1,161.6 0.7 21.1 0.0 2,442.5 0.3%
Energy 1,435.3 5,559.9 243.3 10,872.5 0.0 154.5 0.0 18,265.5 2.5%
Industrial Metals 134.4 1,455.1 22.2 339.4 0.1 8.6 0.0 1,959.9 0.3%
Precious Metals 2,959.2 12,206.6 149.8 2,430.6 183.6 4,808.7 0.0 22,738.5 3.1%
Livestock 9.3 33.2 0.0 21.2 0.0 0.0 0.0 63.7 0.0%
Total 5,615 21,619 824 15,223 242 5,760 - 49,282.7 6.7%
Other 0.0%
Alternative 271.2 592.9 32.8 93.7 62.3 165.0 0.0 1,218.0 0.2%
Currency 112.0 582.2 0.0 1,985.4 3.4 0.0 0.0 2,683.0 0.4%
Multi Asset 200.2 47.7 0.0 44.6 12.0 1.6 0.0 306.1 0.0%
Total 583 1,223 33 2,124 78 167 - 4,207.1 0.6%
Grand Total 175,583 249,377 110,968 93,541 28,413 65,209 11,276 734,367 100%
* Total turnover year to date (not daily average)
Total
Total Turnover (€ million)
Source: Deutsche Bank, Bloomberg Finance LP, Reuters.
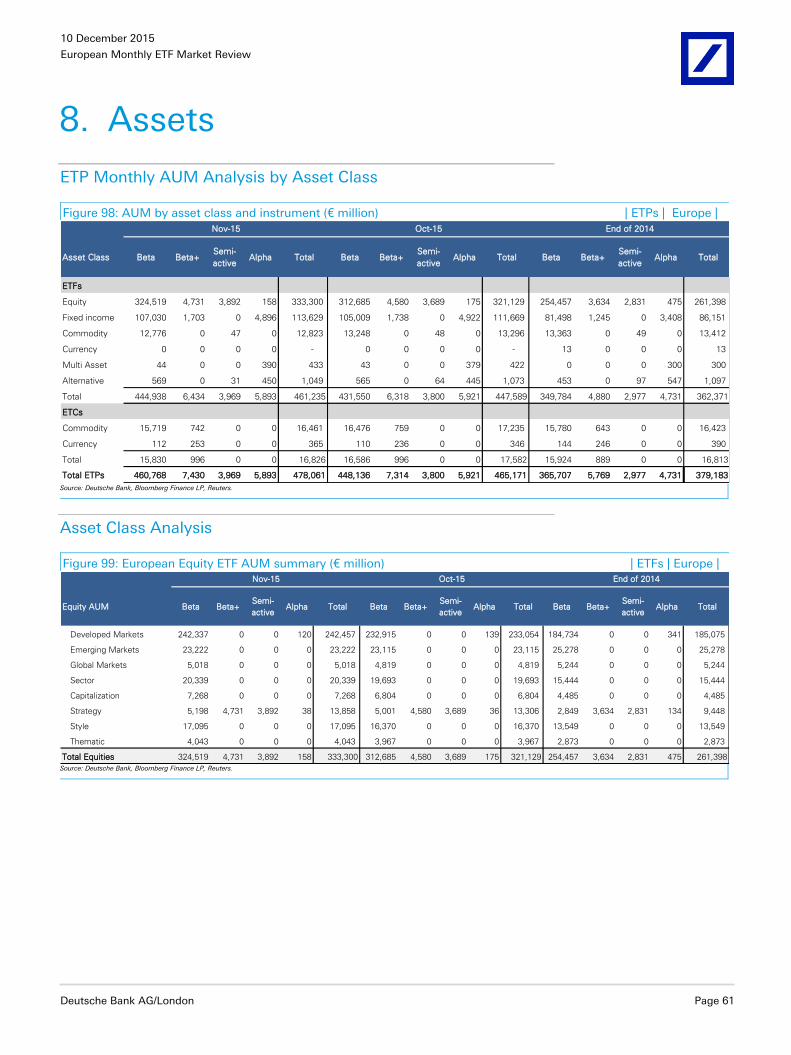
10 December 2015
European Monthly ETF Market Review
Deutsche Bank AG/London Page 61
8. Assets
ETP Monthly AUM Analysis by Asset Class
Figure 98: AUM by asset class and instrument (€ million) | ETPs | Europe |
Asset Class Beta Beta+Semi-
activeAlpha Total Beta Beta+
Semi-
activeAlpha Total Beta Beta+
Semi-
activeAlpha Total
ETFs
Equity 324,519 4,731 3,892 158 333,300 312,685 4,580 3,689 175 321,129 254,457 3,634 2,831 475 261,398
Fixed income 107,030 1,703 0 4,896 113,629 105,009 1,738 0 4,922 111,669 81,498 1,245 0 3,408 86,151
Commodity 12,776 0 47 0 12,823 13,248 0 48 0 13,296 13,363 0 49 0 13,412
Currency 0 0 0 0 - 0 0 0 0 - 13 0 0 0 13
Multi Asset 44 0 0 390 433 43 0 0 379 422 0 0 0 300 300
Alternative 569 0 31 450 1,049 565 0 64 445 1,073 453 0 97 547 1,097
Total 444,938 6,434 3,969 5,893 461,235 431,550 6,318 3,800 5,921 447,589 349,784 4,880 2,977 4,731 362,371
ETCs
Commodity 15,719 742 0 0 16,461 16,476 759 0 0 17,235 15,780 643 0 0 16,423
Currency 112 253 0 0 365 110 236 0 0 346 144 246 0 0 390
Total 15,830 996 0 0 16,826 16,586 996 0 0 17,582 15,924 889 0 0 16,813
Total ETPs 460,768 7,430 3,969 5,893 478,061 448,136 7,314 3,800 5,921 465,171 365,707 5,769 2,977 4,731 379,183
Nov-15 Oct-15 End of 2014
Source: Deutsche Bank, Bloomberg Finance LP, Reuters.
Asset Class Analysis
Figure 99: European Equity ETF AUM summary (€ million) | ETFs | Europe |
Equity AUM Beta Beta+Semi-
activeAlpha Total Beta Beta+
Semi-
activeAlpha Total Beta Beta+
Semi-
activeAlpha Total
Developed Markets 242,337 0 0 120 242,457 232,915 0 0 139 233,054 184,734 0 0 341 185,075
Emerging Markets 23,222 0 0 0 23,222 23,115 0 0 0 23,115 25,278 0 0 0 25,278
Global Markets 5,018 0 0 0 5,018 4,819 0 0 0 4,819 5,244 0 0 0 5,244
Sector 20,339 0 0 0 20,339 19,693 0 0 0 19,693 15,444 0 0 0 15,444
Capitalization 7,268 0 0 0 7,268 6,804 0 0 0 6,804 4,485 0 0 0 4,485
Strategy 5,198 4,731 3,892 38 13,858 5,001 4,580 3,689 36 13,306 2,849 3,634 2,831 134 9,448
Style 17,095 0 0 0 17,095 16,370 0 0 0 16,370 13,549 0 0 0 13,549
Thematic 4,043 0 0 0 4,043 3,967 0 0 0 3,967 2,873 0 0 0 2,873
Total Equities 324,519 4,731 3,892 158 333,300 312,685 4,580 3,689 175 321,129 254,457 3,634 2,831 475 261,398
End of 2014Nov-15 Oct-15
Source: Deutsche Bank, Bloomberg Finance LP, Reuters.
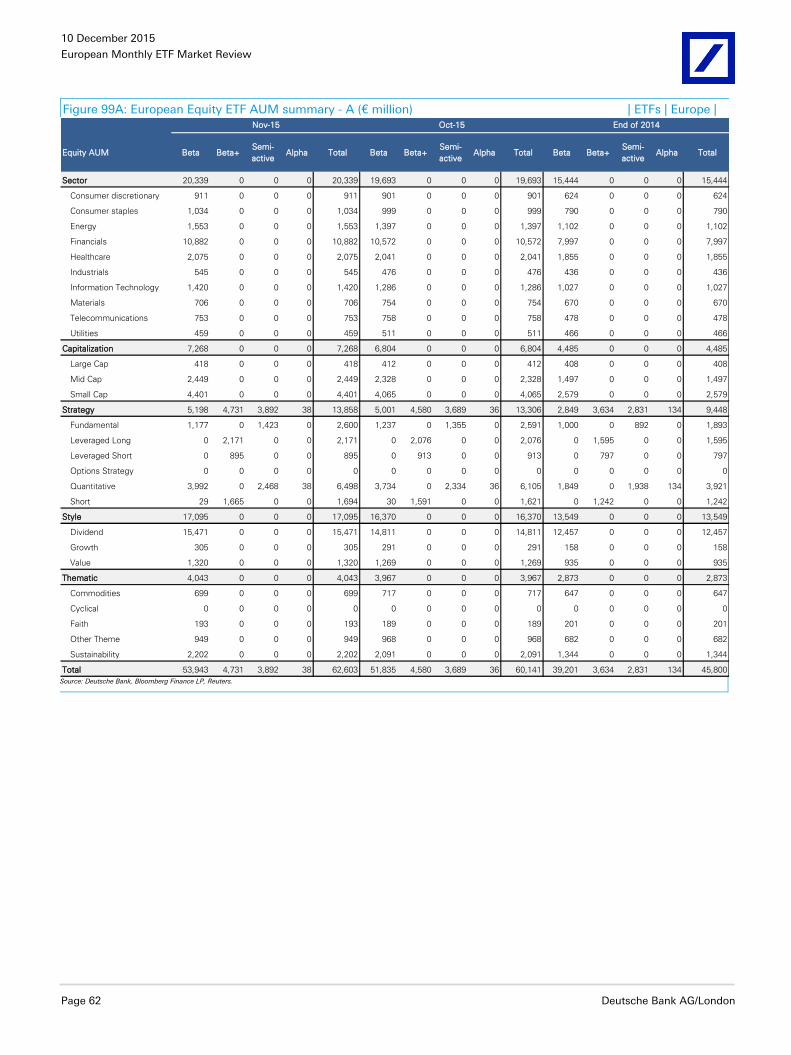
10 December 2015
European Monthly ETF Market Review
Page 62 Deutsche Bank AG/London
Figure 99A: European Equity ETF AUM summary - A (€ million) | ETFs | Europe |
Equity AUM Beta Beta+Semi-
activeAlpha Total Beta Beta+
Semi-
activeAlpha Total Beta Beta+
Semi-
activeAlpha Total
Sector 20,339 0 0 0 20,339 19,693 0 0 0 19,693 15,444 0 0 0 15,444
Consumer discretionary 911 0 0 0 911 901 0 0 0 901 624 0 0 0 624
Consumer staples 1,034 0 0 0 1,034 999 0 0 0 999 790 0 0 0 790
Energy 1,553 0 0 0 1,553 1,397 0 0 0 1,397 1,102 0 0 0 1,102
Financials 10,882 0 0 0 10,882 10,572 0 0 0 10,572 7,997 0 0 0 7,997
Healthcare 2,075 0 0 0 2,075 2,041 0 0 0 2,041 1,855 0 0 0 1,855
Industrials 545 0 0 0 545 476 0 0 0 476 436 0 0 0 436
Information Technology 1,420 0 0 0 1,420 1,286 0 0 0 1,286 1,027 0 0 0 1,027
Materials 706 0 0 0 706 754 0 0 0 754 670 0 0 0 670
Telecommunications 753 0 0 0 753 758 0 0 0 758 478 0 0 0 478
Utilities 459 0 0 0 459 511 0 0 0 511 466 0 0 0 466
Capitalization 7,268 0 0 0 7,268 6,804 0 0 0 6,804 4,485 0 0 0 4,485
Large Cap 418 0 0 0 418 412 0 0 0 412 408 0 0 0 408
Mid Cap 2,449 0 0 0 2,449 2,328 0 0 0 2,328 1,497 0 0 0 1,497
Small Cap 4,401 0 0 0 4,401 4,065 0 0 0 4,065 2,579 0 0 0 2,579
Strategy 5,198 4,731 3,892 38 13,858 5,001 4,580 3,689 36 13,306 2,849 3,634 2,831 134 9,448
Fundamental 1,177 0 1,423 0 2,600 1,237 0 1,355 0 2,591 1,000 0 892 0 1,893
Leveraged Long 0 2,171 0 0 2,171 0 2,076 0 0 2,076 0 1,595 0 0 1,595
Leveraged Short 0 895 0 0 895 0 913 0 0 913 0 797 0 0 797
Options Strategy 0 0 0 0 0 0 0 0 0 0 0 0 0 0 0
Quantitative 3,992 0 2,468 38 6,498 3,734 0 2,334 36 6,105 1,849 0 1,938 134 3,921
Short 29 1,665 0 0 1,694 30 1,591 0 0 1,621 0 1,242 0 0 1,242
Style 17,095 0 0 0 17,095 16,370 0 0 0 16,370 13,549 0 0 0 13,549
Dividend 15,471 0 0 0 15,471 14,811 0 0 0 14,811 12,457 0 0 0 12,457
Growth 305 0 0 0 305 291 0 0 0 291 158 0 0 0 158
Value 1,320 0 0 0 1,320 1,269 0 0 0 1,269 935 0 0 0 935
Thematic 4,043 0 0 0 4,043 3,967 0 0 0 3,967 2,873 0 0 0 2,873
Commodities 699 0 0 0 699 717 0 0 0 717 647 0 0 0 647
Cyclical 0 0 0 0 0 0 0 0 0 0 0 0 0 0 0
Faith 193 0 0 0 193 189 0 0 0 189 201 0 0 0 201
Other Theme 949 0 0 0 949 968 0 0 0 968 682 0 0 0 682
Sustainability 2,202 0 0 0 2,202 2,091 0 0 0 2,091 1,344 0 0 0 1,344
Total 53,943 4,731 3,892 38 62,603 51,835 4,580 3,689 36 60,141 39,201 3,634 2,831 134 45,800
Nov-15 Oct-15 End of 2014
Source: Deutsche Bank, Bloomberg Finance LP, Reuters.
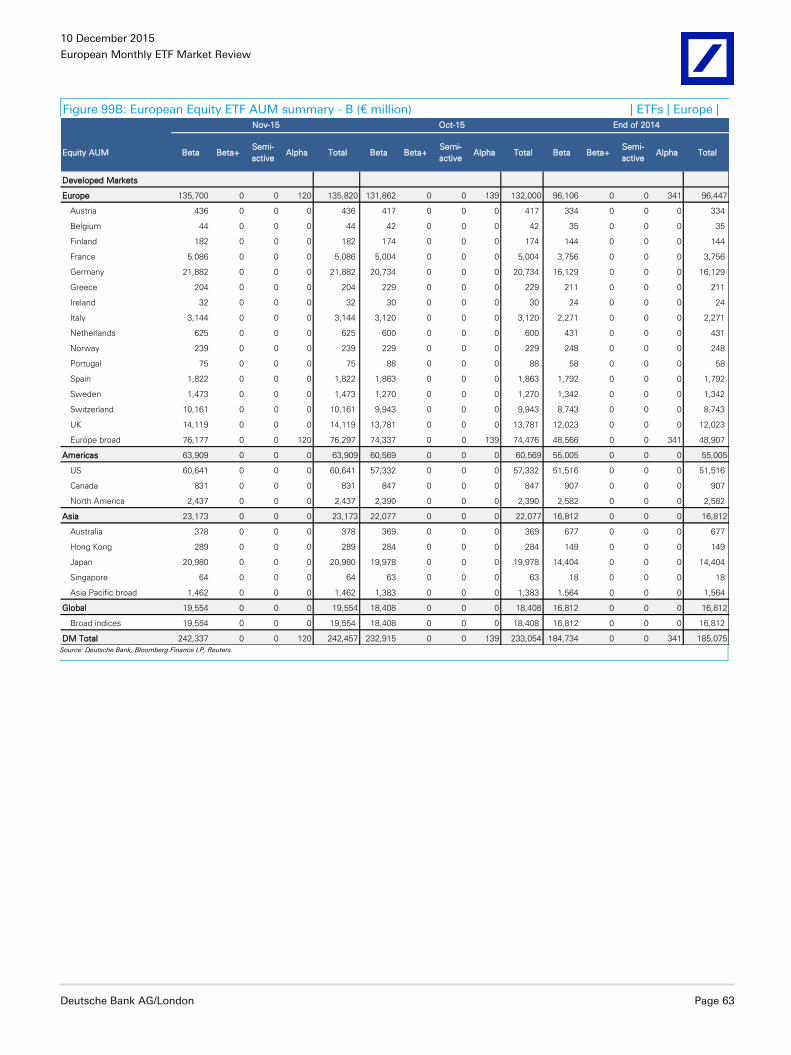
10 December 2015
European Monthly ETF Market Review
Deutsche Bank AG/London Page 63
Figure 99B: European Equity ETF AUM summary - B (€ million) | ETFs | Europe |
Equity AUM Beta Beta+Semi-
activeAlpha Total Beta Beta+
Semi-
activeAlpha Total Beta Beta+
Semi-
activeAlpha Total
Developed Markets
Europe 135,700 0 0 120 135,820 131,862 0 0 139 132,000 96,106 0 0 341 96,447
Austria 436 0 0 0 436 417 0 0 0 417 334 0 0 0 334
Belgium 44 0 0 0 44 42 0 0 0 42 35 0 0 0 35
Finland 182 0 0 0 182 174 0 0 0 174 144 0 0 0 144
France 5,086 0 0 0 5,086 5,004 0 0 0 5,004 3,756 0 0 0 3,756
Germany 21,882 0 0 0 21,882 20,734 0 0 0 20,734 16,129 0 0 0 16,129
Greece 204 0 0 0 204 229 0 0 0 229 211 0 0 0 211
Ireland 32 0 0 0 32 30 0 0 0 30 24 0 0 0 24
Italy 3,144 0 0 0 3,144 3,120 0 0 0 3,120 2,271 0 0 0 2,271
Netherlands 625 0 0 0 625 600 0 0 0 600 431 0 0 0 431
Norway 239 0 0 0 239 229 0 0 0 229 248 0 0 0 248
Portugal 75 0 0 0 75 88 0 0 0 88 58 0 0 0 58
Spain 1,822 0 0 0 1,822 1,863 0 0 0 1,863 1,792 0 0 0 1,792
Sweden 1,473 0 0 0 1,473 1,270 0 0 0 1,270 1,342 0 0 0 1,342
Switzerland 10,161 0 0 0 10,161 9,943 0 0 0 9,943 8,743 0 0 0 8,743
UK 14,119 0 0 0 14,119 13,781 0 0 0 13,781 12,023 0 0 0 12,023
Europe broad 76,177 0 0 120 76,297 74,337 0 0 139 74,476 48,566 0 0 341 48,907
Americas 63,909 0 0 0 63,909 60,569 0 0 0 60,569 55,005 0 0 0 55,005
US 60,641 0 0 0 60,641 57,332 0 0 0 57,332 51,516 0 0 0 51,516
Canada 831 0 0 0 831 847 0 0 0 847 907 0 0 0 907
North America 2,437 0 0 0 2,437 2,390 0 0 0 2,390 2,582 0 0 0 2,582
Asia 23,173 0 0 0 23,173 22,077 0 0 0 22,077 16,812 0 0 0 16,812
Australia 378 0 0 0 378 369 0 0 0 369 677 0 0 0 677
Hong Kong 289 0 0 0 289 284 0 0 0 284 149 0 0 0 149
Japan 20,980 0 0 0 20,980 19,978 0 0 0 19,978 14,404 0 0 0 14,404
Singapore 64 0 0 0 64 63 0 0 0 63 18 0 0 0 18
Asia Pacific broad 1,462 0 0 0 1,462 1,383 0 0 0 1,383 1,564 0 0 0 1,564
Global 19,554 0 0 0 19,554 18,408 0 0 0 18,408 16,812 0 0 0 16,812
Broad indices 19,554 0 0 0 19,554 18,408 0 0 0 18,408 16,812 0 0 0 16,812
DM Total 242,337 0 0 120 242,457 232,915 0 0 139 233,054 184,734 0 0 341 185,075
Nov-15 Oct-15 End of 2014
Source: Deutsche Bank, Bloomberg Finance LP, Reuters.
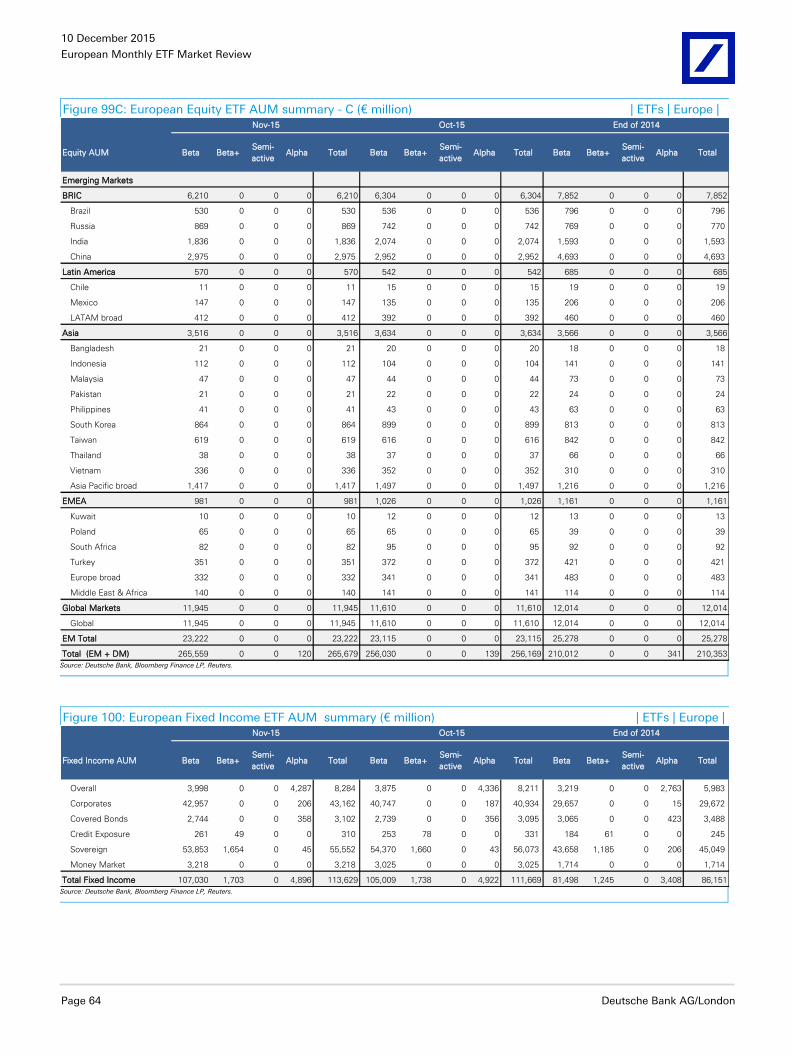
10 December 2015
European Monthly ETF Market Review
Page 64 Deutsche Bank AG/London
Figure 99C: European Equity ETF AUM summary - C (€ million) | ETFs | Europe |
Equity AUM Beta Beta+Semi-
activeAlpha Total Beta Beta+
Semi-
activeAlpha Total Beta Beta+
Semi-
activeAlpha Total
Emerging Markets
BRIC 6,210 0 0 0 6,210 6,304 0 0 0 6,304 7,852 0 0 0 7,852
Brazil 530 0 0 0 530 536 0 0 0 536 796 0 0 0 796
Russia 869 0 0 0 869 742 0 0 0 742 769 0 0 0 770
India 1,836 0 0 0 1,836 2,074 0 0 0 2,074 1,593 0 0 0 1,593
China 2,975 0 0 0 2,975 2,952 0 0 0 2,952 4,693 0 0 0 4,693
Latin America 570 0 0 0 570 542 0 0 0 542 685 0 0 0 685
Chile 11 0 0 0 11 15 0 0 0 15 19 0 0 0 19
Mexico 147 0 0 0 147 135 0 0 0 135 206 0 0 0 206
LATAM broad 412 0 0 0 412 392 0 0 0 392 460 0 0 0 460
Asia 3,516 0 0 0 3,516 3,634 0 0 0 3,634 3,566 0 0 0 3,566
Bangladesh 21 0 0 0 21 20 0 0 0 20 18 0 0 0 18
Indonesia 112 0 0 0 112 104 0 0 0 104 141 0 0 0 141
Malaysia 47 0 0 0 47 44 0 0 0 44 73 0 0 0 73
Pakistan 21 0 0 0 21 22 0 0 0 22 24 0 0 0 24
Philippines 41 0 0 0 41 43 0 0 0 43 63 0 0 0 63
South Korea 864 0 0 0 864 899 0 0 0 899 813 0 0 0 813
Taiwan 619 0 0 0 619 616 0 0 0 616 842 0 0 0 842
Thailand 38 0 0 0 38 37 0 0 0 37 66 0 0 0 66
Vietnam 336 0 0 0 336 352 0 0 0 352 310 0 0 0 310
Asia Pacific broad 1,417 0 0 0 1,417 1,497 0 0 0 1,497 1,216 0 0 0 1,216
EMEA 981 0 0 0 981 1,026 0 0 0 1,026 1,161 0 0 0 1,161
Kuwait 10 0 0 0 10 12 0 0 0 12 13 0 0 0 13
Poland 65 0 0 0 65 65 0 0 0 65 39 0 0 0 39
South Africa 82 0 0 0 82 95 0 0 0 95 92 0 0 0 92
Turkey 351 0 0 0 351 372 0 0 0 372 421 0 0 0 421
Europe broad 332 0 0 0 332 341 0 0 0 341 483 0 0 0 483
Middle East & Africa 140 0 0 0 140 141 0 0 0 141 114 0 0 0 114
Global Markets 11,945 0 0 0 11,945 11,610 0 0 0 11,610 12,014 0 0 0 12,014
Global 11,945 0 0 0 11,945 11,610 0 0 0 11,610 12,014 0 0 0 12,014
EM Total 23,222 0 0 0 23,222 23,115 0 0 0 23,115 25,278 0 0 0 25,278
Total (EM + DM) 265,559 0 0 120 265,679 256,030 0 0 139 256,169 210,012 0 0 341 210,353
Nov-15 Oct-15 End of 2014
Source: Deutsche Bank, Bloomberg Finance LP, Reuters.
Figure 100: European Fixed Income ETF AUM summary (€ million) | ETFs | Europe |
Fixed Income AUM Beta Beta+Semi-
activeAlpha Total Beta Beta+
Semi-
activeAlpha Total Beta Beta+
Semi-
activeAlpha Total
Overall 3,998 0 0 4,287 8,284 3,875 0 0 4,336 8,211 3,219 0 0 2,763 5,983
Corporates 42,957 0 0 206 43,162 40,747 0 0 187 40,934 29,657 0 0 15 29,672
Covered Bonds 2,744 0 0 358 3,102 2,739 0 0 356 3,095 3,065 0 0 423 3,488
Credit Exposure 261 49 0 0 310 253 78 0 0 331 184 61 0 0 245
Sovereign 53,853 1,654 0 45 55,552 54,370 1,660 0 43 56,073 43,658 1,185 0 206 45,049
Money Market 3,218 0 0 0 3,218 3,025 0 0 0 3,025 1,714 0 0 0 1,714
Total Fixed Income 107,030 1,703 0 4,896 113,629 105,009 1,738 0 4,922 111,669 81,498 1,245 0 3,408 86,151
Nov-15 Oct-15 End of 2014
Source: Deutsche Bank, Bloomberg Finance LP, Reuters.
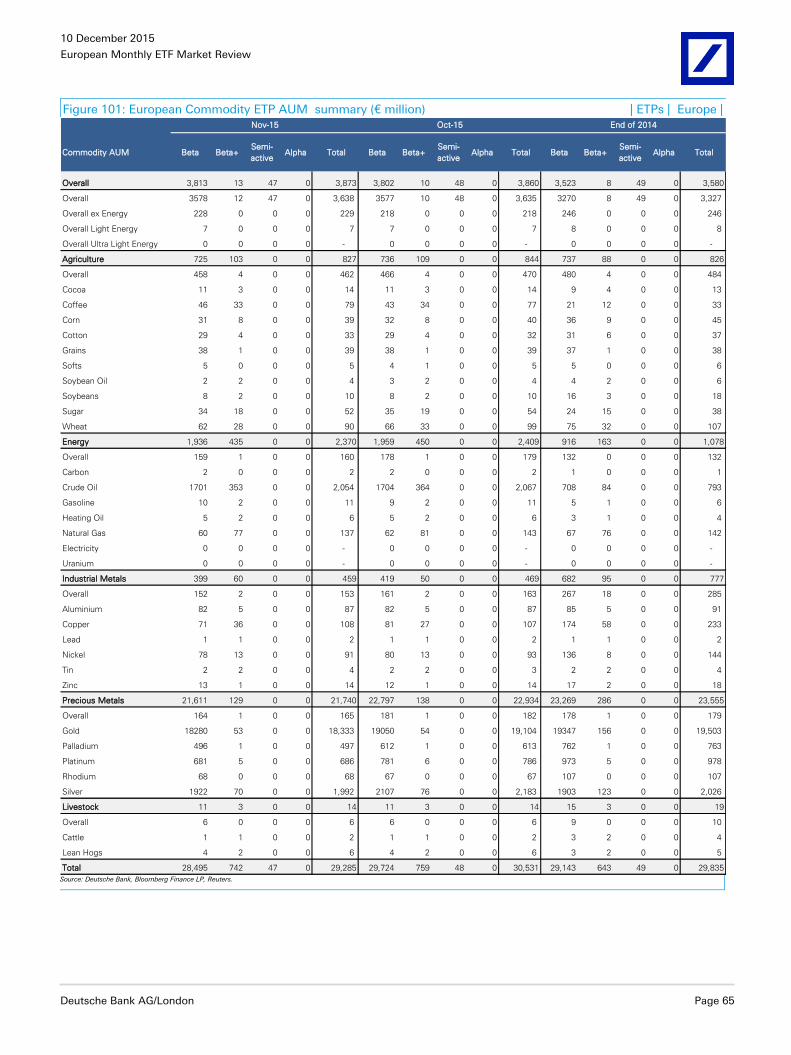
10 December 2015
European Monthly ETF Market Review
Deutsche Bank AG/London Page 65
Figure 101: European Commodity ETP AUM summary (€ million) | ETPs | Europe |
Commodity AUM Beta Beta+Semi-
activeAlpha Total Beta Beta+
Semi-
activeAlpha Total Beta Beta+
Semi-
activeAlpha Total
Overall 3,813 13 47 0 3,873 3,802 10 48 0 3,860 3,523 8 49 0 3,580
Overall 3578 12 47 0 3,638 3577 10 48 0 3,635 3270 8 49 0 3,327
Overall ex Energy 228 0 0 0 229 218 0 0 0 218 246 0 0 0 246
Overall Light Energy 7 0 0 0 7 7 0 0 0 7 8 0 0 0 8
Overall Ultra Light Energy 0 0 0 0 - 0 0 0 0 - 0 0 0 0 -
Agriculture 725 103 0 0 827 736 109 0 0 844 737 88 0 0 826
Overall 458 4 0 0 462 466 4 0 0 470 480 4 0 0 484
Cocoa 11 3 0 0 14 11 3 0 0 14 9 4 0 0 13
Coffee 46 33 0 0 79 43 34 0 0 77 21 12 0 0 33
Corn 31 8 0 0 39 32 8 0 0 40 36 9 0 0 45
Cotton 29 4 0 0 33 29 4 0 0 32 31 6 0 0 37
Grains 38 1 0 0 39 38 1 0 0 39 37 1 0 0 38
Softs 5 0 0 0 5 4 1 0 0 5 5 0 0 0 6
Soybean Oil 2 2 0 0 4 3 2 0 0 4 4 2 0 0 6
Soybeans 8 2 0 0 10 8 2 0 0 10 16 3 0 0 18
Sugar 34 18 0 0 52 35 19 0 0 54 24 15 0 0 38
Wheat 62 28 0 0 90 66 33 0 0 99 75 32 0 0 107
Energy 1,936 435 0 0 2,370 1,959 450 0 0 2,409 916 163 0 0 1,078
Overall 159 1 0 0 160 178 1 0 0 179 132 0 0 0 132
Carbon 2 0 0 0 2 2 0 0 0 2 1 0 0 0 1
Crude Oil 1701 353 0 0 2,054 1704 364 0 0 2,067 708 84 0 0 793
Gasoline 10 2 0 0 11 9 2 0 0 11 5 1 0 0 6
Heating Oil 5 2 0 0 6 5 2 0 0 6 3 1 0 0 4
Natural Gas 60 77 0 0 137 62 81 0 0 143 67 76 0 0 142
Electricity 0 0 0 0 - 0 0 0 0 - 0 0 0 0 -
Uranium 0 0 0 0 - 0 0 0 0 - 0 0 0 0 -
Industrial Metals 399 60 0 0 459 419 50 0 0 469 682 95 0 0 777
Overall 152 2 0 0 153 161 2 0 0 163 267 18 0 0 285
Aluminium 82 5 0 0 87 82 5 0 0 87 85 5 0 0 91
Copper 71 36 0 0 108 81 27 0 0 107 174 58 0 0 233
Lead 1 1 0 0 2 1 1 0 0 2 1 1 0 0 2
Nickel 78 13 0 0 91 80 13 0 0 93 136 8 0 0 144
Tin 2 2 0 0 4 2 2 0 0 3 2 2 0 0 4
Zinc 13 1 0 0 14 12 1 0 0 14 17 2 0 0 18
Precious Metals 21,611 129 0 0 21,740 22,797 138 0 0 22,934 23,269 286 0 0 23,555
Overall 164 1 0 0 165 181 1 0 0 182 178 1 0 0 179
Gold 18280 53 0 0 18,333 19050 54 0 0 19,104 19347 156 0 0 19,503
Palladium 496 1 0 0 497 612 1 0 0 613 762 1 0 0 763
Platinum 681 5 0 0 686 781 6 0 0 786 973 5 0 0 978
Rhodium 68 0 0 0 68 67 0 0 0 67 107 0 0 0 107
Silver 1922 70 0 0 1,992 2107 76 0 0 2,183 1903 123 0 0 2,026
Livestock 11 3 0 0 14 11 3 0 0 14 15 3 0 0 19
Overall 6 0 0 0 6 6 0 0 0 6 9 0 0 0 10
Cattle 1 1 0 0 2 1 1 0 0 2 3 2 0 0 4
Lean Hogs 4 2 0 0 6 4 2 0 0 6 3 2 0 0 5
Total 28,495 742 47 0 29,285 29,724 759 48 0 30,531 29,143 643 49 0 29,835
Nov-15 Oct-15 End of 2014
Source: Deutsche Bank, Bloomberg Finance LP, Reuters.
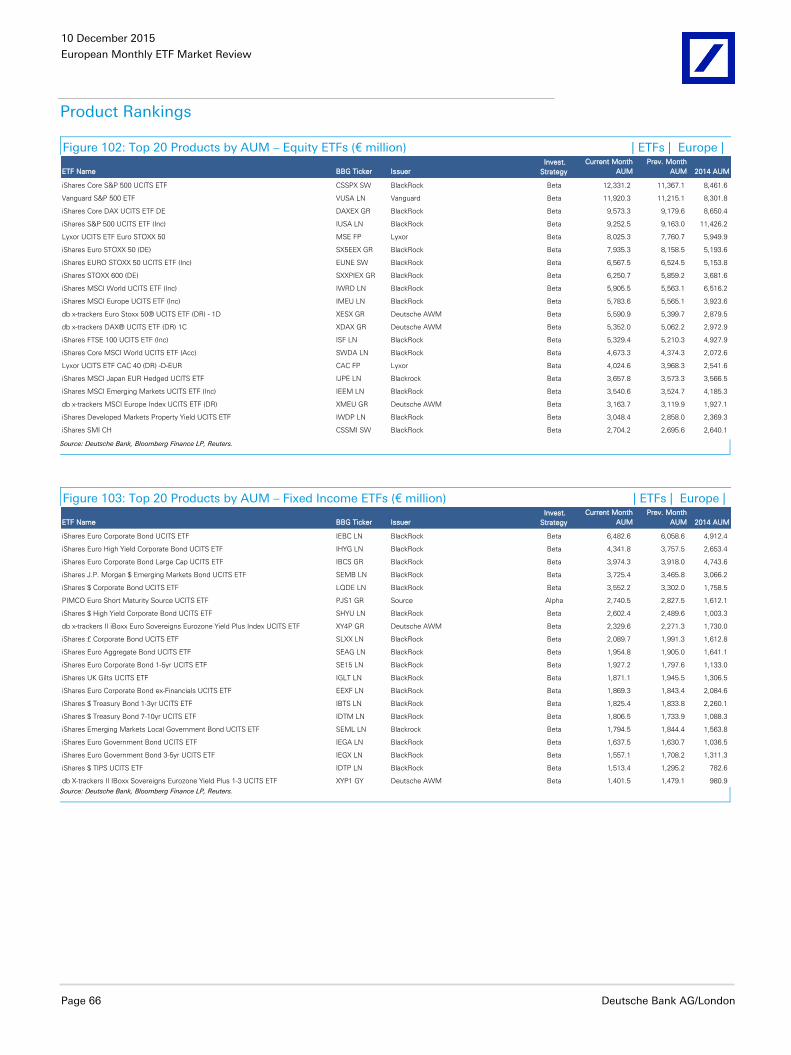
10 December 2015
European Monthly ETF Market Review
Page 66 Deutsche Bank AG/London
Product Rankings
Figure 102: Top 20 Products by AUM – Equity ETFs (€ million) | ETFs | Europe |
ETF Name BBG Ticker Issuer
Invest.
Strategy
Current Month
AUM
Prev. Month
AUM 2014 AUM
iShares Core S&P 500 UCITS ETF CSSPX SW BlackRock Beta 12,331.2 11,367.1 8,461.6
Vanguard S&P 500 ETF VUSA LN Vanguard Beta 11,920.3 11,215.1 8,301.8
iShares Core DAX UCITS ETF DE DAXEX GR BlackRock Beta 9,573.3 9,179.6 8,650.4
iShares S&P 500 UCITS ETF (Inc) IUSA LN BlackRock Beta 9,252.5 9,163.0 11,426.2
Lyxor UCITS ETF Euro STOXX 50 MSE FP Lyxor Beta 8,025.3 7,760.7 5,949.9
iShares Euro STOXX 50 (DE) SX5EEX GR BlackRock Beta 7,935.3 8,158.5 5,193.6
iShares EURO STOXX 50 UCITS ETF (Inc) EUNE SW BlackRock Beta 6,567.5 6,524.5 5,153.8
iShares STOXX 600 (DE) SXXPIEX GR BlackRock Beta 6,250.7 5,859.2 3,681.6
iShares MSCI World UCITS ETF (Inc) IWRD LN BlackRock Beta 5,905.5 5,563.1 6,516.2
iShares MSCI Europe UCITS ETF (Inc) IMEU LN BlackRock Beta 5,783.6 5,565.1 3,923.6
db x-trackers Euro Stoxx 50® UCITS ETF (DR) - 1D XESX GR Deutsche AWM Beta 5,590.9 5,399.7 2,879.5
db x-trackers DAX® UCITS ETF (DR) 1C XDAX GR Deutsche AWM Beta 5,352.0 5,062.2 2,972.9
iShares FTSE 100 UCITS ETF (Inc) ISF LN BlackRock Beta 5,329.4 5,210.3 4,927.9
iShares Core MSCI World UCITS ETF (Acc) SWDA LN BlackRock Beta 4,673.3 4,374.3 2,072.6
Lyxor UCITS ETF CAC 40 (DR) -D-EUR CAC FP Lyxor Beta 4,024.6 3,968.3 2,541.6
iShares MSCI Japan EUR Hedged UCITS ETF IJPE LN Blackrock Beta 3,657.8 3,573.3 3,566.5
iShares MSCI Emerging Markets UCITS ETF (Inc) IEEM LN BlackRock Beta 3,540.6 3,524.7 4,185.3
db x-trackers MSCI Europe Index UCITS ETF (DR) XMEU GR Deutsche AWM Beta 3,163.7 3,119.9 1,927.1
iShares Developed Markets Property Yield UCITS ETF IWDP LN BlackRock Beta 3,048.4 2,858.0 2,369.3
iShares SMI CH CSSMI SW BlackRock Beta 2,704.2 2,695.6 2,640.1 Source: Deutsche Bank, Bloomberg Finance LP, Reuters.
Figure 103: Top 20 Products by AUM – Fixed Income ETFs (€ million) | ETFs | Europe |
ETF Name BBG Ticker Issuer
Invest.
Strategy
Current Month
AUM
Prev. Month
AUM 2014 AUM
iShares Euro Corporate Bond UCITS ETF IEBC LN BlackRock Beta 6,482.6 6,058.6 4,912.4
iShares Euro High Yield Corporate Bond UCITS ETF IHYG LN BlackRock Beta 4,341.8 3,757.5 2,653.4
iShares Euro Corporate Bond Large Cap UCITS ETF IBCS GR BlackRock Beta 3,974.3 3,918.0 4,743.6
iShares J.P. Morgan $ Emerging Markets Bond UCITS ETF SEMB LN BlackRock Beta 3,725.4 3,465.8 3,066.2
iShares $ Corporate Bond UCITS ETF LQDE LN BlackRock Beta 3,552.2 3,302.0 1,758.5
PIMCO Euro Short Maturity Source UCITS ETF PJS1 GR Source Alpha 2,740.5 2,827.5 1,612.1
iShares $ High Yield Corporate Bond UCITS ETF SHYU LN BlackRock Beta 2,602.4 2,489.6 1,003.3
db x-trackers II iBoxx Euro Sovereigns Eurozone Yield Plus Index UCITS ETF XY4P GR Deutsche AWM Beta 2,329.6 2,271.3 1,730.0
iShares £ Corporate Bond UCITS ETF SLXX LN BlackRock Beta 2,089.7 1,991.3 1,612.8
iShares Euro Aggregate Bond UCITS ETF SEAG LN BlackRock Beta 1,954.8 1,905.0 1,641.1
iShares Euro Corporate Bond 1-5yr UCITS ETF SE15 LN BlackRock Beta 1,927.2 1,797.6 1,133.0
iShares UK Gilts UCITS ETF IGLT LN BlackRock Beta 1,871.1 1,945.5 1,306.5
iShares Euro Corporate Bond ex-Financials UCITS ETF EEXF LN BlackRock Beta 1,869.3 1,843.4 2,084.6
iShares $ Treasury Bond 1-3yr UCITS ETF IBTS LN BlackRock Beta 1,825.4 1,833.8 2,260.1
iShares $ Treasury Bond 7-10yr UCITS ETF IDTM LN BlackRock Beta 1,806.5 1,733.9 1,088.3
iShares Emerging Markets Local Government Bond UCITS ETF SEML LN Blackrock Beta 1,794.5 1,844.4 1,563.8
iShares Euro Government Bond UCITS ETF IEGA LN BlackRock Beta 1,637.5 1,630.7 1,036.5
iShares Euro Government Bond 3-5yr UCITS ETF IEGX LN BlackRock Beta 1,557.1 1,708.2 1,311.3
iShares $ TIPS UCITS ETF IDTP LN BlackRock Beta 1,513.4 1,295.2 782.6
db X-trackers II IBoxx Sovereigns Eurozone Yield Plus 1-3 UCITS ETF XYP1 GY Deutsche AWM Beta 1,401.5 1,479.1 980.9 Source: Deutsche Bank, Bloomberg Finance LP, Reuters.
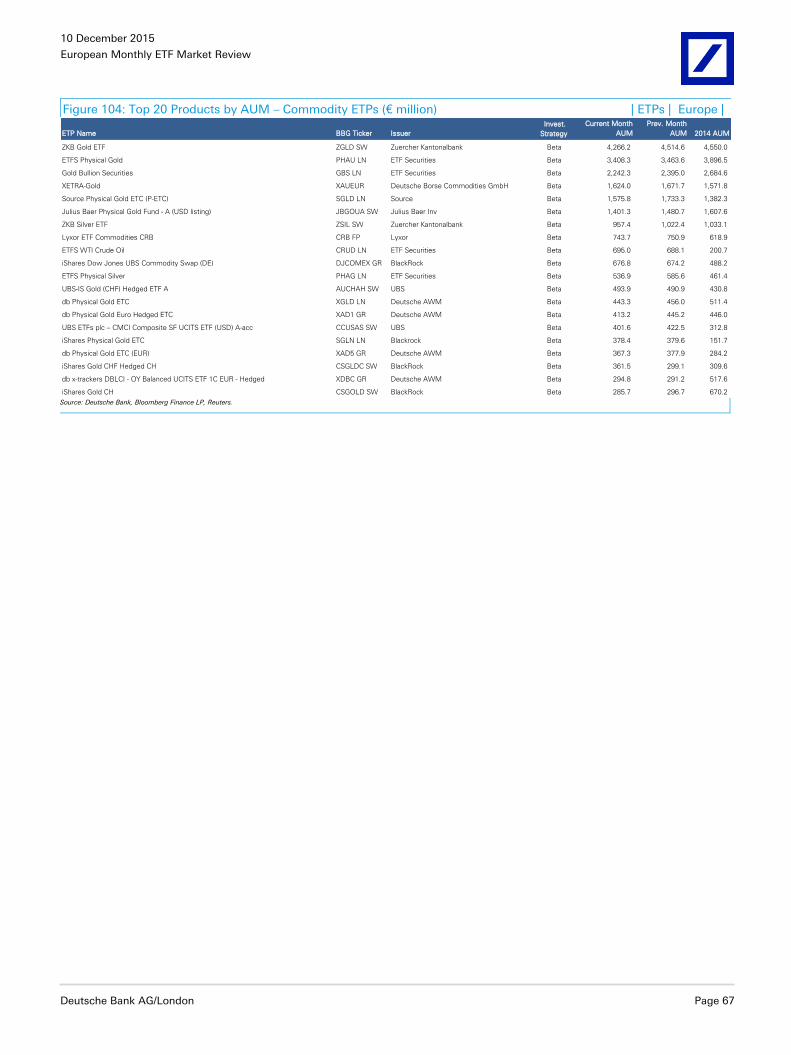
10 December 2015
European Monthly ETF Market Review
Deutsche Bank AG/London Page 67
Figure 104: Top 20 Products by AUM – Commodity ETPs (€ million) | ETPs | Europe |
ETP Name BBG Ticker Issuer
Invest.
Strategy
Current Month
AUM
Prev. Month
AUM 2014 AUM
ZKB Gold ETF ZGLD SW Zuercher Kantonalbank Beta 4,266.2 4,514.6 4,550.0
ETFS Physical Gold PHAU LN ETF Securities Beta 3,408.3 3,463.6 3,896.5
Gold Bullion Securities GBS LN ETF Securities Beta 2,242.3 2,395.0 2,684.6
XETRA-Gold XAUEUR Deutsche Borse Commodities GmbH Beta 1,624.0 1,671.7 1,571.8
Source Physical Gold ETC (P-ETC) SGLD LN Source Beta 1,575.8 1,733.3 1,382.3
Julius Baer Physical Gold Fund - A (USD listing) JBGOUA SW Julius Baer Inv Beta 1,401.3 1,480.7 1,607.6
ZKB Silver ETF ZSIL SW Zuercher Kantonalbank Beta 957.4 1,022.4 1,033.1
Lyxor ETF Commodities CRB CRB FP Lyxor Beta 743.7 750.9 618.9
ETFS WTI Crude Oil CRUD LN ETF Securities Beta 695.0 688.1 200.7
iShares Dow Jones UBS Commodity Swap (DE) DJCOMEX GR BlackRock Beta 676.8 674.2 488.2
ETFS Physical Silver PHAG LN ETF Securities Beta 536.9 585.6 461.4
UBS-IS Gold (CHF) Hedged ETF A AUCHAH SW UBS Beta 493.9 490.9 430.8
db Physical Gold ETC XGLD LN Deutsche AWM Beta 443.3 456.0 511.4
db Physical Gold Euro Hedged ETC XAD1 GR Deutsche AWM Beta 413.2 445.2 446.0
UBS ETFs plc – CMCI Composite SF UCITS ETF (USD) A-acc CCUSAS SW UBS Beta 401.6 422.5 312.8
iShares Physical Gold ETC SGLN LN Blackrock Beta 378.4 379.6 151.7
db Physical Gold ETC (EUR) XAD5 GR Deutsche AWM Beta 367.3 377.9 284.2
iShares Gold CHF Hedged CH CSGLDC SW BlackRock Beta 361.5 299.1 309.6
db x-trackers DBLCI - OY Balanced UCITS ETF 1C EUR - Hedged XDBC GR Deutsche AWM Beta 294.8 291.2 517.6
iShares Gold CH CSGOLD SW BlackRock Beta 285.7 296.7 670.2 Source: Deutsche Bank, Bloomberg Finance LP, Reuters.
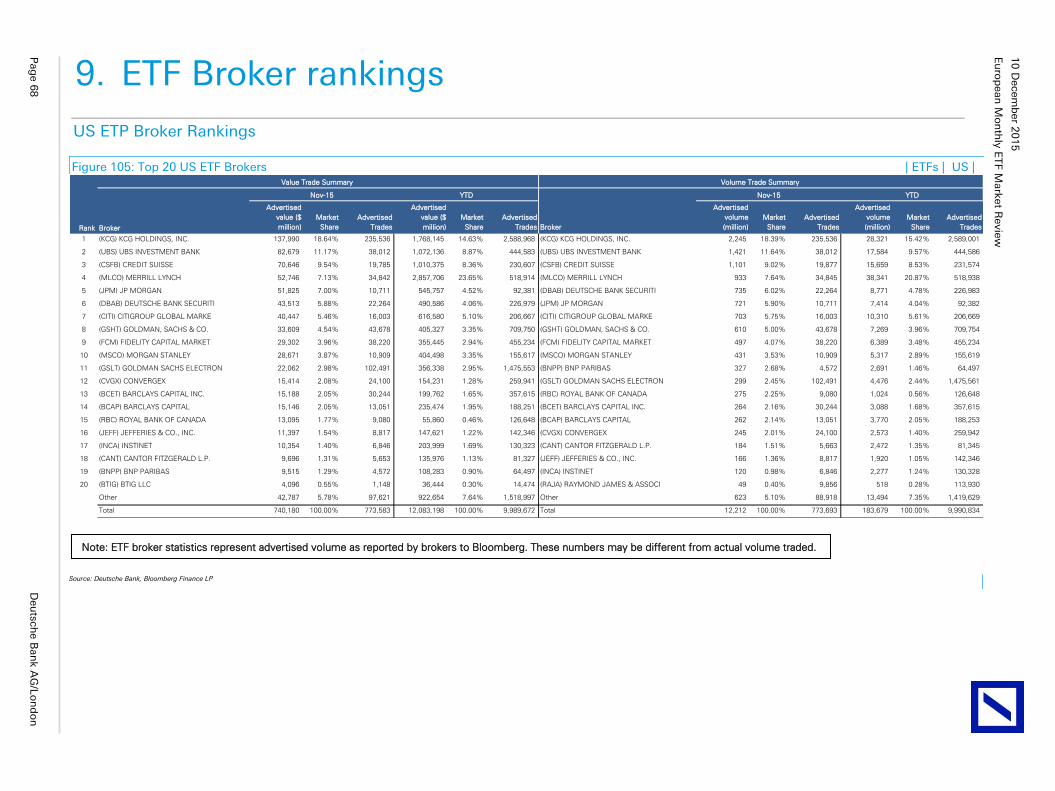
Eu
rop
ean
Mo
nth
ly E
TF M
ark
et R
evie
w
10
Decem
ber 2
01
5
Pag
e 6
8
Deu
tsch
e B
an
k A
G/L
on
do
n
9. ETF Broker rankings
US ETP Broker Rankings
Figure 105: Top 20 US ETF Brokers | ETFs | US |
Rank Broker
Advertised
value ($
million)
Market
Share
Advertised
Trades
Advertised
value ($
million)
Market
Share
Advertised
Trades Broker
Advertised
volume
(million)
Market
Share
Advertised
Trades
Advertised
volume
(million)
Market
Share
Advertised
Trades
1 (KCG) KCG HOLDINGS, INC. 137,990 18.64% 235,536 1,768,145 14.63% 2,588,968 (KCG) KCG HOLDINGS, INC. 2,245 18.39% 235,536 28,321 15.42% 2,589,001
2 (UBS) UBS INVESTMENT BANK 82,679 11.17% 38,012 1,072,136 8.87% 444,583 (UBS) UBS INVESTMENT BANK 1,421 11.64% 38,012 17,584 9.57% 444,586
3 (CSFB) CREDIT SUISSE 70,646 9.54% 19,785 1,010,375 8.36% 230,607 (CSFB) CREDIT SUISSE 1,101 9.02% 19,877 15,659 8.53% 231,574
4 (MLCO) MERRILL LYNCH 52,746 7.13% 34,842 2,857,706 23.65% 518,914 (MLCO) MERRILL LYNCH 933 7.64% 34,845 38,341 20.87% 518,938
5 (JPM) JP MORGAN 51,825 7.00% 10,711 545,757 4.52% 92,381 (DBAB) DEUTSCHE BANK SECURITI 735 6.02% 22,264 8,771 4.78% 226,983
6 (DBAB) DEUTSCHE BANK SECURITI 43,513 5.88% 22,264 490,586 4.06% 226,979 (JPM) JP MORGAN 721 5.90% 10,711 7,414 4.04% 92,382
7 (CITI) CITIGROUP GLOBAL MARKE 40,447 5.46% 16,003 616,580 5.10% 206,667 (CITI) CITIGROUP GLOBAL MARKE 703 5.75% 16,003 10,310 5.61% 206,669
8 (GSHT) GOLDMAN, SACHS & CO. 33,609 4.54% 43,678 405,327 3.35% 709,750 (GSHT) GOLDMAN, SACHS & CO. 610 5.00% 43,678 7,269 3.96% 709,754
9 (FCM) FIDELITY CAPITAL MARKET 29,302 3.96% 38,220 355,445 2.94% 455,234 (FCM) FIDELITY CAPITAL MARKET 497 4.07% 38,220 6,389 3.48% 455,234
10 (MSCO) MORGAN STANLEY 28,671 3.87% 10,909 404,498 3.35% 155,617 (MSCO) MORGAN STANLEY 431 3.53% 10,909 5,317 2.89% 155,619
11 (GSLT) GOLDMAN SACHS ELECTRON 22,062 2.98% 102,491 356,338 2.95% 1,475,553 (BNPP) BNP PARIBAS 327 2.68% 4,572 2,691 1.46% 64,497
12 (CVGX) CONVERGEX 15,414 2.08% 24,100 154,231 1.28% 259,941 (GSLT) GOLDMAN SACHS ELECTRON 299 2.45% 102,491 4,476 2.44% 1,475,561
13 (BCET) BARCLAYS CAPITAL INC. 15,188 2.05% 30,244 199,762 1.65% 357,615 (RBC) ROYAL BANK OF CANADA 275 2.25% 9,080 1,024 0.56% 126,648
14 (BCAP) BARCLAYS CAPITAL 15,146 2.05% 13,051 235,474 1.95% 188,251 (BCET) BARCLAYS CAPITAL INC. 264 2.16% 30,244 3,088 1.68% 357,615
15 (RBC) ROYAL BANK OF CANADA 13,095 1.77% 9,080 55,860 0.46% 126,648 (BCAP) BARCLAYS CAPITAL 262 2.14% 13,051 3,770 2.05% 188,253
16 (JEFF) JEFFERIES & CO., INC. 11,397 1.54% 8,817 147,621 1.22% 142,346 (CVGX) CONVERGEX 245 2.01% 24,100 2,573 1.40% 259,942
17 (INCA) INSTINET 10,354 1.40% 6,846 203,999 1.69% 130,323 (CANT) CANTOR FITZGERALD L.P. 184 1.51% 5,663 2,472 1.35% 81,345
18 (CANT) CANTOR FITZGERALD L.P. 9,696 1.31% 5,653 135,976 1.13% 81,327 (JEFF) JEFFERIES & CO., INC. 166 1.36% 8,817 1,920 1.05% 142,346
19 (BNPP) BNP PARIBAS 9,515 1.29% 4,572 108,283 0.90% 64,497 (INCA) INSTINET 120 0.98% 6,846 2,277 1.24% 130,328
20 (BTIG) BTIG LLC 4,096 0.55% 1,148 36,444 0.30% 14,474 (RAJA) RAYMOND JAMES & ASSOCI 49 0.40% 9,856 518 0.28% 113,930
Other 42,787 5.78% 97,621 922,654 7.64% 1,518,997 Other 623 5.10% 88,918 13,494 7.35% 1,419,629
Total 740,180 100.00% 773,583 12,083,198 100.00% 9,989,672 Total 12,212 100.00% 773,693 183,679 100.00% 9,990,834
Value Trade Summary Volume Trade Summary
Nov-15 YTD Nov-15 YTD
Source: Deutsche Bank, Bloomberg Finance LP
Note: ETF broker statistics represent advertised volume as reported by brokers to Bloomberg. These numbers may be different from actual volume traded.
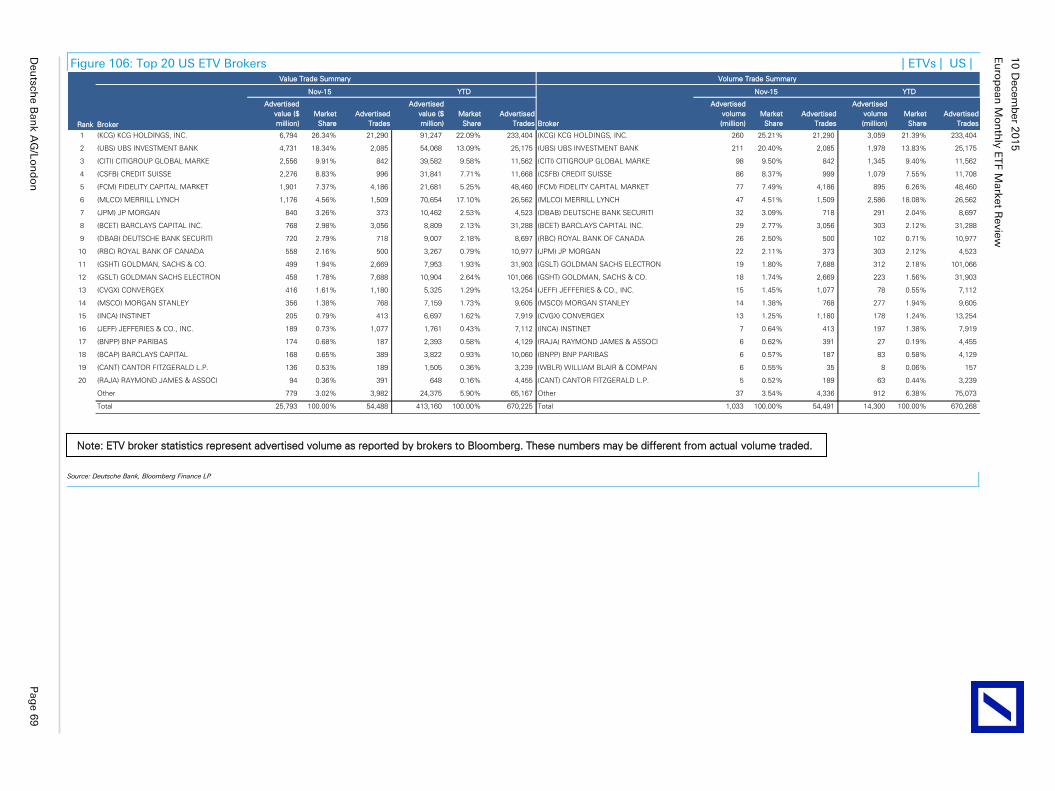
Eu
rop
ean
Mo
nth
ly E
TF M
ark
et R
evie
w
10
Decem
ber 2
01
5
Deu
tsch
e B
an
k A
G/L
on
do
n
Pag
e 6
9
Figure 106: Top 20 US ETV Brokers | ETVs | US |
Rank Broker
Advertised
value ($
million)
Market
Share
Advertised
Trades
Advertised
value ($
million)
Market
Share
Advertised
Trades Broker
Advertised
volume
(million)
Market
Share
Advertised
Trades
Advertised
volume
(million)
Market
Share
Advertised
Trades
1 (KCG) KCG HOLDINGS, INC. 6,794 26.34% 21,290 91,247 22.09% 233,404 (KCG) KCG HOLDINGS, INC. 260 25.21% 21,290 3,059 21.39% 233,404
2 (UBS) UBS INVESTMENT BANK 4,731 18.34% 2,085 54,068 13.09% 25,175 (UBS) UBS INVESTMENT BANK 211 20.40% 2,085 1,978 13.83% 25,175
3 (CITI) CITIGROUP GLOBAL MARKE 2,556 9.91% 842 39,582 9.58% 11,562 (CITI) CITIGROUP GLOBAL MARKE 98 9.50% 842 1,345 9.40% 11,562
4 (CSFB) CREDIT SUISSE 2,276 8.83% 996 31,841 7.71% 11,668 (CSFB) CREDIT SUISSE 86 8.37% 999 1,079 7.55% 11,708
5 (FCM) FIDELITY CAPITAL MARKET 1,901 7.37% 4,186 21,681 5.25% 48,460 (FCM) FIDELITY CAPITAL MARKET 77 7.49% 4,186 895 6.26% 48,460
6 (MLCO) MERRILL LYNCH 1,176 4.56% 1,509 70,654 17.10% 26,562 (MLCO) MERRILL LYNCH 47 4.51% 1,509 2,586 18.08% 26,562
7 (JPM) JP MORGAN 840 3.26% 373 10,462 2.53% 4,523 (DBAB) DEUTSCHE BANK SECURITI 32 3.09% 718 291 2.04% 8,697
8 (BCET) BARCLAYS CAPITAL INC. 768 2.98% 3,056 8,809 2.13% 31,288 (BCET) BARCLAYS CAPITAL INC. 29 2.77% 3,056 303 2.12% 31,288
9 (DBAB) DEUTSCHE BANK SECURITI 720 2.79% 718 9,007 2.18% 8,697 (RBC) ROYAL BANK OF CANADA 26 2.50% 500 102 0.71% 10,977
10 (RBC) ROYAL BANK OF CANADA 558 2.16% 500 3,267 0.79% 10,977 (JPM) JP MORGAN 22 2.11% 373 303 2.12% 4,523
11 (GSHT) GOLDMAN, SACHS & CO. 499 1.94% 2,669 7,953 1.93% 31,903 (GSLT) GOLDMAN SACHS ELECTRON 19 1.80% 7,688 312 2.18% 101,066
12 (GSLT) GOLDMAN SACHS ELECTRON 458 1.78% 7,688 10,904 2.64% 101,066 (GSHT) GOLDMAN, SACHS & CO. 18 1.74% 2,669 223 1.56% 31,903
13 (CVGX) CONVERGEX 416 1.61% 1,180 5,325 1.29% 13,254 (JEFF) JEFFERIES & CO., INC. 15 1.45% 1,077 78 0.55% 7,112
14 (MSCO) MORGAN STANLEY 356 1.38% 768 7,159 1.73% 9,605 (MSCO) MORGAN STANLEY 14 1.38% 768 277 1.94% 9,605
15 (INCA) INSTINET 205 0.79% 413 6,697 1.62% 7,919 (CVGX) CONVERGEX 13 1.25% 1,180 178 1.24% 13,254
16 (JEFF) JEFFERIES & CO., INC. 189 0.73% 1,077 1,761 0.43% 7,112 (INCA) INSTINET 7 0.64% 413 197 1.38% 7,919
17 (BNPP) BNP PARIBAS 174 0.68% 187 2,393 0.58% 4,129 (RAJA) RAYMOND JAMES & ASSOCI 6 0.62% 391 27 0.19% 4,455
18 (BCAP) BARCLAYS CAPITAL 168 0.65% 389 3,822 0.93% 10,060 (BNPP) BNP PARIBAS 6 0.57% 187 83 0.58% 4,129
19 (CANT) CANTOR FITZGERALD L.P. 136 0.53% 189 1,505 0.36% 3,239 (WBLR) WILLIAM BLAIR & COMPAN 6 0.55% 35 8 0.06% 157
20 (RAJA) RAYMOND JAMES & ASSOCI 94 0.36% 391 648 0.16% 4,455 (CANT) CANTOR FITZGERALD L.P. 5 0.52% 189 63 0.44% 3,239
Other 779 3.02% 3,982 24,375 5.90% 65,167 Other 37 3.54% 4,336 912 6.38% 75,073
Total 25,793 100.00% 54,488 413,160 100.00% 670,225 Total 1,033 100.00% 54,491 14,300 100.00% 670,268
Value Trade Summary Volume Trade Summary
Nov-15 YTD Nov-15 YTD
Source: Deutsche Bank, Bloomberg Finance LP
Note: ETV broker statistics represent advertised volume as reported by brokers to Bloomberg. These numbers may be different from actual volume traded.
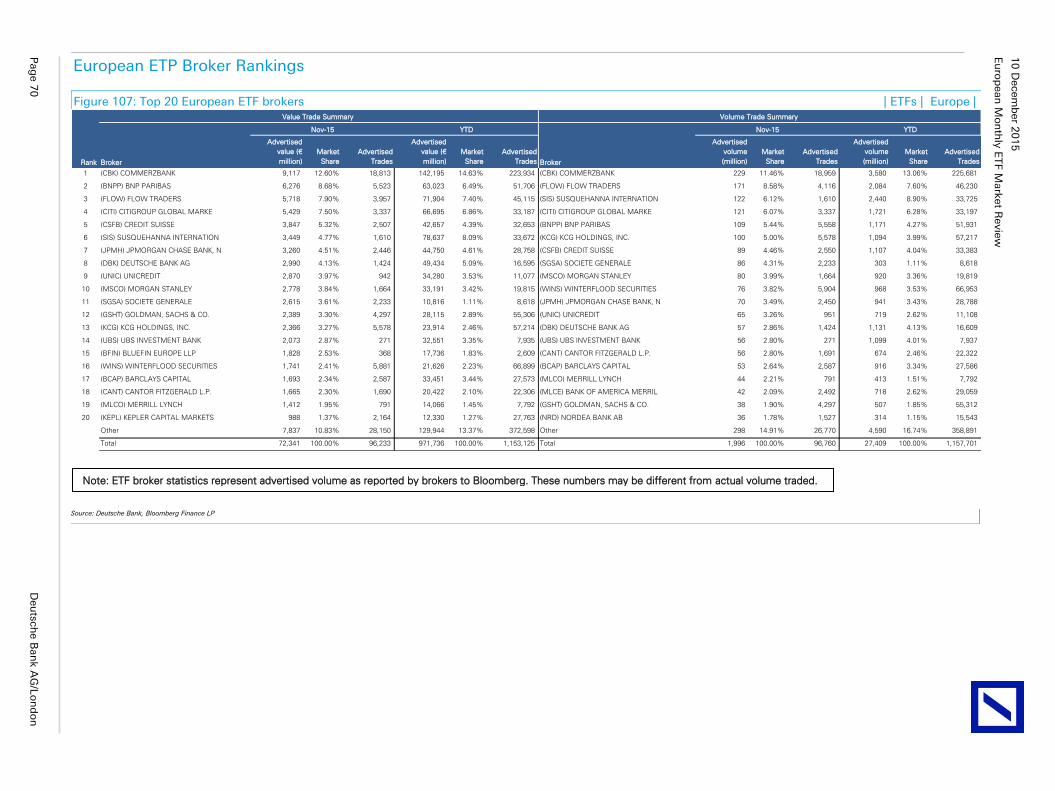
Eu
rop
ean
Mo
nth
ly E
TF M
ark
et R
evie
w
10
Decem
ber 2
01
5
Pag
e 7
0
Deu
tsch
e B
an
k A
G/L
on
do
n
European ETP Broker Rankings
Figure 107: Top 20 European ETF brokers | ETFs | Europe |
Rank Broker
Advertised
value (€
million)
Market
Share
Advertised
Trades
Advertised
value (€
million)
Market
Share
Advertised
Trades Broker
Advertised
volume
(million)
Market
Share
Advertised
Trades
Advertised
volume
(million)
Market
Share
Advertised
Trades
1 (CBK) COMMERZBANK 9,117 12.60% 18,813 142,195 14.63% 223,934 (CBK) COMMERZBANK 229 11.46% 18,959 3,580 13.06% 225,681
2 (BNPP) BNP PARIBAS 6,276 8.68% 5,523 63,023 6.49% 51,706 (FLOW) FLOW TRADERS 171 8.58% 4,116 2,084 7.60% 46,230
3 (FLOW) FLOW TRADERS 5,718 7.90% 3,957 71,904 7.40% 45,115 (SIS) SUSQUEHANNA INTERNATION 122 6.12% 1,610 2,440 8.90% 33,725
4 (CITI) CITIGROUP GLOBAL MARKE 5,429 7.50% 3,337 66,695 6.86% 33,187 (CITI) CITIGROUP GLOBAL MARKE 121 6.07% 3,337 1,721 6.28% 33,197
5 (CSFB) CREDIT SUISSE 3,847 5.32% 2,507 42,657 4.39% 32,653 (BNPP) BNP PARIBAS 109 5.44% 5,558 1,171 4.27% 51,931
6 (SIS) SUSQUEHANNA INTERNATION 3,449 4.77% 1,610 78,637 8.09% 33,672 (KCG) KCG HOLDINGS, INC. 100 5.00% 5,578 1,094 3.99% 57,217
7 (JPMH) JPMORGAN CHASE BANK, N 3,260 4.51% 2,446 44,750 4.61% 28,758 (CSFB) CREDIT SUISSE 89 4.46% 2,550 1,107 4.04% 33,383
8 (DBK) DEUTSCHE BANK AG 2,990 4.13% 1,424 49,434 5.09% 16,595 (SGSA) SOCIETE GENERALE 86 4.31% 2,233 303 1.11% 8,618
9 (UNIC) UNICREDIT 2,870 3.97% 942 34,280 3.53% 11,077 (MSCO) MORGAN STANLEY 80 3.99% 1,664 920 3.36% 19,819
10 (MSCO) MORGAN STANLEY 2,778 3.84% 1,664 33,191 3.42% 19,815 (WINS) WINTERFLOOD SECURITIES 76 3.82% 5,904 968 3.53% 66,953
11 (SGSA) SOCIETE GENERALE 2,615 3.61% 2,233 10,816 1.11% 8,618 (JPMH) JPMORGAN CHASE BANK, N 70 3.49% 2,450 941 3.43% 28,788
12 (GSHT) GOLDMAN, SACHS & CO. 2,389 3.30% 4,297 28,115 2.89% 55,306 (UNIC) UNICREDIT 65 3.26% 951 719 2.62% 11,108
13 (KCG) KCG HOLDINGS, INC. 2,366 3.27% 5,578 23,914 2.46% 57,214 (DBK) DEUTSCHE BANK AG 57 2.86% 1,424 1,131 4.13% 16,609
14 (UBS) UBS INVESTMENT BANK 2,073 2.87% 271 32,551 3.35% 7,935 (UBS) UBS INVESTMENT BANK 56 2.80% 271 1,099 4.01% 7,937
15 (BFIN) BLUEFIN EUROPE LLP 1,828 2.53% 368 17,736 1.83% 2,609 (CANT) CANTOR FITZGERALD L.P. 56 2.80% 1,691 674 2.46% 22,322
16 (WINS) WINTERFLOOD SECURITIES 1,741 2.41% 5,881 21,626 2.23% 66,899 (BCAP) BARCLAYS CAPITAL 53 2.64% 2,587 916 3.34% 27,586
17 (BCAP) BARCLAYS CAPITAL 1,693 2.34% 2,587 33,451 3.44% 27,573 (MLCO) MERRILL LYNCH 44 2.21% 791 413 1.51% 7,792
18 (CANT) CANTOR FITZGERALD L.P. 1,665 2.30% 1,690 20,422 2.10% 22,306 (MLCE) BANK OF AMERICA MERRIL 42 2.09% 2,492 718 2.62% 29,059
19 (MLCO) MERRILL LYNCH 1,412 1.95% 791 14,066 1.45% 7,792 (GSHT) GOLDMAN, SACHS & CO. 38 1.90% 4,297 507 1.85% 55,312
20 (KEPL) KEPLER CAPITAL MARKETS 988 1.37% 2,164 12,330 1.27% 27,763 (NRD) NORDEA BANK AB 36 1.78% 1,527 314 1.15% 15,543
Other 7,837 10.83% 28,150 129,944 13.37% 372,598 Other 298 14.91% 26,770 4,590 16.74% 358,891
Total 72,341 100.00% 96,233 971,736 100.00% 1,153,125 Total 1,996 100.00% 96,760 27,409 100.00% 1,157,701
Value Trade Summary Volume Trade Summary
Nov-15 YTD Nov-15 YTD
Source: Deutsche Bank, Bloomberg Finance LP
Note: ETF broker statistics represent advertised volume as reported by brokers to Bloomberg. These numbers may be different from actual volume traded.
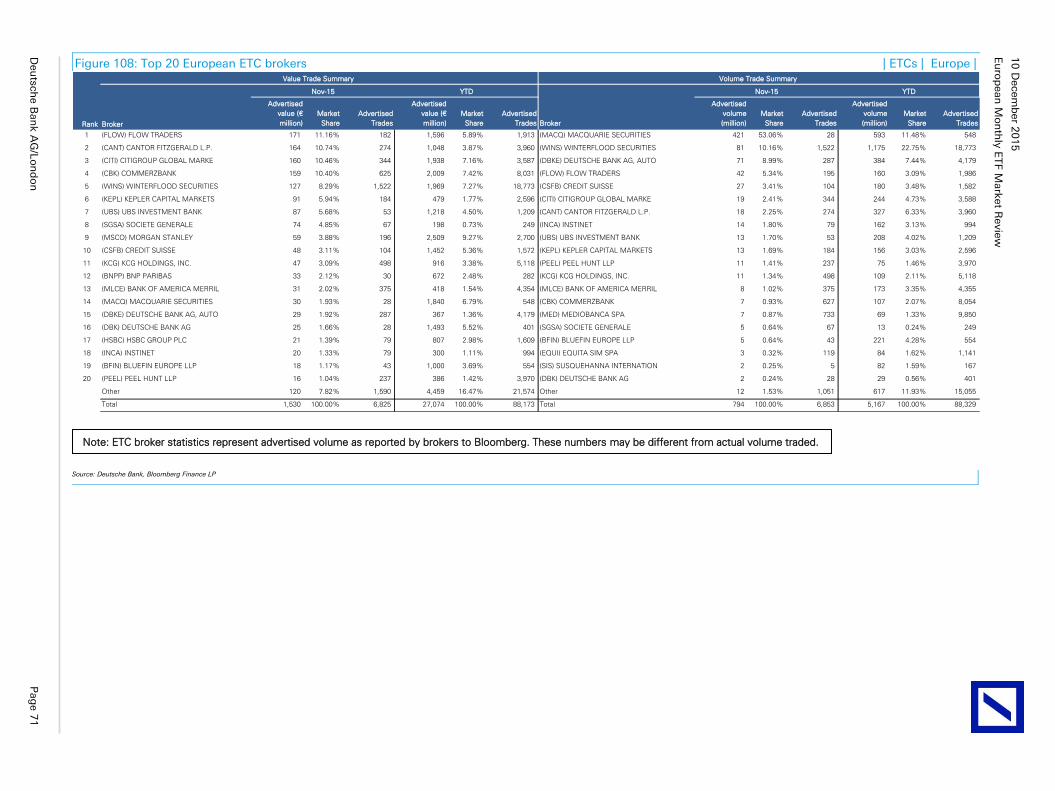
Eu
rop
ean
Mo
nth
ly E
TF M
ark
et R
evie
w
10
Decem
ber 2
01
5
Deu
tsch
e B
an
k A
G/L
on
do
n
Pag
e 7
1
Figure 108: Top 20 European ETC brokers | ETCs | Europe |
Rank Broker
Advertised
value (€
million)
Market
Share
Advertised
Trades
Advertised
value (€
million)
Market
Share
Advertised
Trades Broker
Advertised
volume
(million)
Market
Share
Advertised
Trades
Advertised
volume
(million)
Market
Share
Advertised
Trades
1 (FLOW) FLOW TRADERS 171 11.16% 182 1,596 5.89% 1,913 (MACQ) MACQUARIE SECURITIES 421 53.06% 28 593 11.48% 548
2 (CANT) CANTOR FITZGERALD L.P. 164 10.74% 274 1,048 3.87% 3,960 (WINS) WINTERFLOOD SECURITIES 81 10.16% 1,522 1,175 22.75% 18,773
3 (CITI) CITIGROUP GLOBAL MARKE 160 10.46% 344 1,938 7.16% 3,587 (DBKE) DEUTSCHE BANK AG, AUTO 71 8.99% 287 384 7.44% 4,179
4 (CBK) COMMERZBANK 159 10.40% 625 2,009 7.42% 8,031 (FLOW) FLOW TRADERS 42 5.34% 195 160 3.09% 1,986
5 (WINS) WINTERFLOOD SECURITIES 127 8.29% 1,522 1,969 7.27% 18,773 (CSFB) CREDIT SUISSE 27 3.41% 104 180 3.48% 1,582
6 (KEPL) KEPLER CAPITAL MARKETS 91 5.94% 184 479 1.77% 2,596 (CITI) CITIGROUP GLOBAL MARKE 19 2.41% 344 244 4.73% 3,588
7 (UBS) UBS INVESTMENT BANK 87 5.68% 53 1,218 4.50% 1,209 (CANT) CANTOR FITZGERALD L.P. 18 2.25% 274 327 6.33% 3,960
8 (SGSA) SOCIETE GENERALE 74 4.85% 67 198 0.73% 249 (INCA) INSTINET 14 1.80% 79 162 3.13% 994
9 (MSCO) MORGAN STANLEY 59 3.88% 196 2,509 9.27% 2,700 (UBS) UBS INVESTMENT BANK 13 1.70% 53 208 4.02% 1,209
10 (CSFB) CREDIT SUISSE 48 3.11% 104 1,452 5.36% 1,572 (KEPL) KEPLER CAPITAL MARKETS 13 1.69% 184 156 3.03% 2,596
11 (KCG) KCG HOLDINGS, INC. 47 3.09% 498 916 3.38% 5,118 (PEEL) PEEL HUNT LLP 11 1.41% 237 75 1.46% 3,970
12 (BNPP) BNP PARIBAS 33 2.12% 30 672 2.48% 282 (KCG) KCG HOLDINGS, INC. 11 1.34% 498 109 2.11% 5,118
13 (MLCE) BANK OF AMERICA MERRIL 31 2.02% 375 418 1.54% 4,354 (MLCE) BANK OF AMERICA MERRIL 8 1.02% 375 173 3.35% 4,355
14 (MACQ) MACQUARIE SECURITIES 30 1.93% 28 1,840 6.79% 548 (CBK) COMMERZBANK 7 0.93% 627 107 2.07% 8,054
15 (DBKE) DEUTSCHE BANK AG, AUTO 29 1.92% 287 367 1.36% 4,179 (MED) MEDIOBANCA SPA 7 0.87% 733 69 1.33% 9,850
16 (DBK) DEUTSCHE BANK AG 25 1.66% 28 1,493 5.52% 401 (SGSA) SOCIETE GENERALE 5 0.64% 67 13 0.24% 249
17 (HSBC) HSBC GROUP PLC 21 1.39% 79 807 2.98% 1,609 (BFIN) BLUEFIN EUROPE LLP 5 0.64% 43 221 4.28% 554
18 (INCA) INSTINET 20 1.33% 79 300 1.11% 994 (EQUI) EQUITA SIM SPA 3 0.32% 119 84 1.62% 1,141
19 (BFIN) BLUEFIN EUROPE LLP 18 1.17% 43 1,000 3.69% 554 (SIS) SUSQUEHANNA INTERNATION 2 0.25% 5 82 1.59% 167
20 (PEEL) PEEL HUNT LLP 16 1.04% 237 386 1.42% 3,970 (DBK) DEUTSCHE BANK AG 2 0.24% 28 29 0.56% 401
Other 120 7.82% 1,590 4,459 16.47% 21,574 Other 12 1.53% 1,051 617 11.93% 15,055
Total 1,530 100.00% 6,825 27,074 100.00% 88,173 Total 794 100.00% 6,853 5,167 100.00% 88,329
Value Trade Summary Volume Trade Summary
Nov-15 YTD Nov-15 YTD
Source: Deutsche Bank, Bloomberg Finance LP
Note: ETC broker statistics represent advertised volume as reported by brokers to Bloomberg. These numbers may be different from actual volume traded.
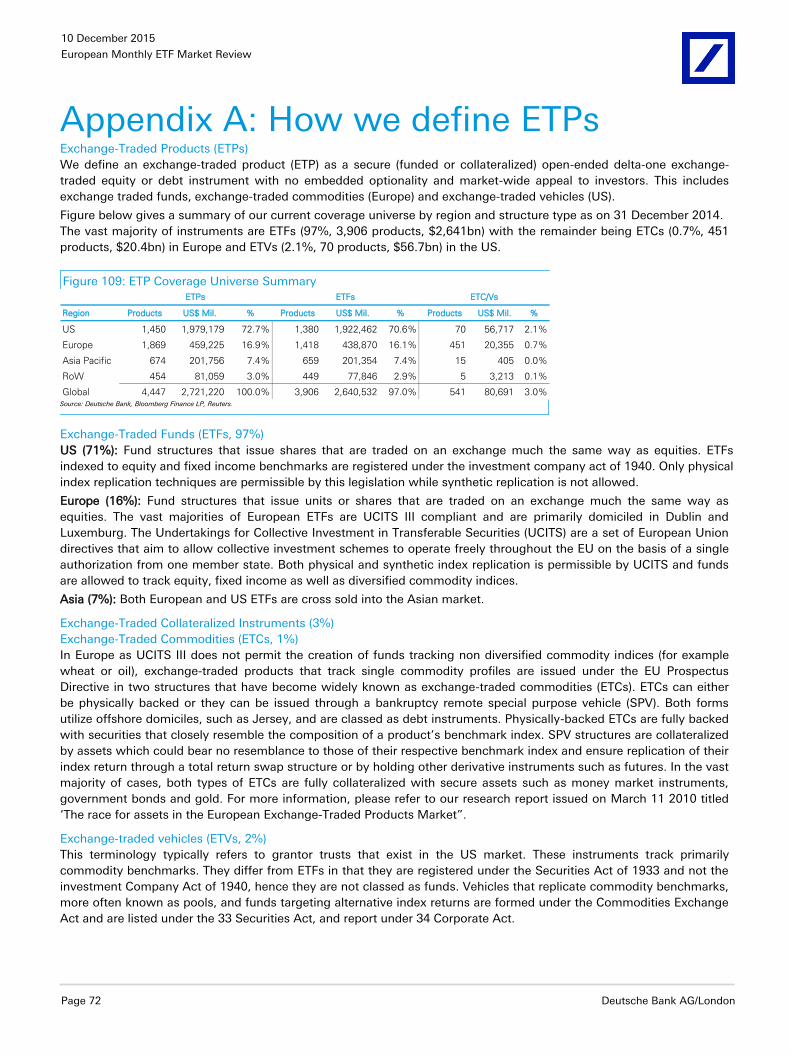
10 December 2015
European Monthly ETF Market Review
Page 72 Deutsche Bank AG/London
Appendix A: How we define ETPs Exchange-Traded Products (ETPs)
We define an exchange-traded product (ETP) as a secure (funded or collateralized) open-ended delta-one exchange-
traded equity or debt instrument with no embedded optionality and market-wide appeal to investors. This includes
exchange traded funds, exchange-traded commodities (Europe) and exchange-traded vehicles (US).
Figure below gives a summary of our current coverage universe by region and structure type as on 31 December 2014.
The vast majority of instruments are ETFs (97%, 3,906 products, $2,641bn) with the remainder being ETCs (0.7%, 451
products, $20.4bn) in Europe and ETVs (2.1%, 70 products, $56.7bn) in the US.
Figure 109: ETP Coverage Universe Summary
Region Products US$ Mil. % Products US$ Mil. % Products US$ Mil. %
US 1,450 1,979,179 72.7% 1,380 1,922,462 70.6% 70 56,717 2.1%
Europe 1,869 459,225 16.9% 1,418 438,870 16.1% 451 20,355 0.7%
Asia Pacific 674 201,756 7.4% 659 201,354 7.4% 15 405 0.0%
RoW 454 81,059 3.0% 449 77,846 2.9% 5 3,213 0.1%
Global 4,447 2,721,220 100.0% 3,906 2,640,532 97.0% 541 80,691 3.0%
ETPs ETFs ETC/Vs
Source: Deutsche Bank, Bloomberg Finance LP, Reuters.
Exchange-Traded Funds (ETFs, 97%)
US (71%): Fund structures that issue shares that are traded on an exchange much the same way as equities. ETFs
indexed to equity and fixed income benchmarks are registered under the investment company act of 1940. Only physical
index replication techniques are permissible by this legislation while synthetic replication is not allowed.
Europe (16%): Fund structures that issue units or shares that are traded on an exchange much the same way as
equities. The vast majorities of European ETFs are UCITS III compliant and are primarily domiciled in Dublin and
Luxemburg. The Undertakings for Collective Investment in Transferable Securities (UCITS) are a set of European Union
directives that aim to allow collective investment schemes to operate freely throughout the EU on the basis of a single
authorization from one member state. Both physical and synthetic index replication is permissible by UCITS and funds
are allowed to track equity, fixed income as well as diversified commodity indices.
Asia (7%): Both European and US ETFs are cross sold into the Asian market.
Exchange-Traded Collateralized Instruments (3%)
Exchange-Traded Commodities (ETCs, 1%)
In Europe as UCITS III does not permit the creation of funds tracking non diversified commodity indices (for example
wheat or oil), exchange-traded products that track single commodity profiles are issued under the EU Prospectus
Directive in two structures that have become widely known as exchange-traded commodities (ETCs). ETCs can either
be physically backed or they can be issued through a bankruptcy remote special purpose vehicle (SPV). Both forms
utilize offshore domiciles, such as Jersey, and are classed as debt instruments. Physically-backed ETCs are fully backed
with securities that closely resemble the composition of a product’s benchmark index. SPV structures are collateralized
by assets which could bear no resemblance to those of their respective benchmark index and ensure replication of their
index return through a total return swap structure or by holding other derivative instruments such as futures. In the vast
majority of cases, both types of ETCs are fully collateralized with secure assets such as money market instruments,
government bonds and gold. For more information, please refer to our research report issued on March 11 2010 titled
‘The race for assets in the European Exchange-Traded Products Market”.
Exchange-traded vehicles (ETVs, 2%)
This terminology typically refers to grantor trusts that exist in the US market. These instruments track primarily
commodity benchmarks. They differ from ETFs in that they are registered under the Securities Act of 1933 and not the
investment Company Act of 1940, hence they are not classed as funds. Vehicles that replicate commodity benchmarks,
more often known as pools, and funds targeting alternative index returns are formed under the Commodities Exchange
Act and are listed under the 33 Securities Act, and report under 34 Corporate Act.
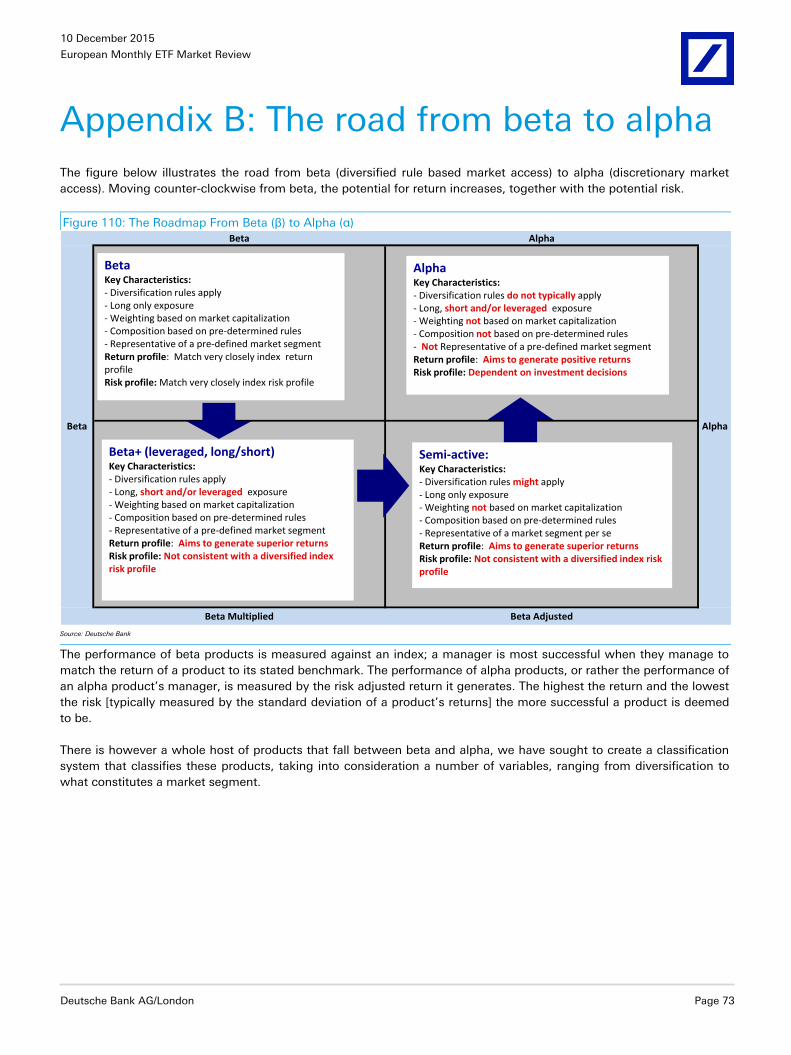
10 December 2015
European Monthly ETF Market Review
Deutsche Bank AG/London Page 73
Appendix B: The road from beta to alpha
The figure below illustrates the road from beta (diversified rule based market access) to alpha (discretionary market
access). Moving counter-clockwise from beta, the potential for return increases, together with the potential risk.
Figure 110: The Roadmap From Beta (β) to Alpha (α) Beta Alpha
Beta Multiplied Beta Adjusted
Beta Alpha
BetaKey Characteristics:- Diversification rules apply- Long only exposure- Weighting based on market capitalization- Composition based on pre-determined rules- Representative of a pre-defined market segmentReturn profile: Match very closely index return profileRisk profile: Match very closely index risk profile
Semi-active:Key Characteristics:- Diversification rules might apply- Long only exposure- Weighting not based on market capitalization- Composition based on pre-determined rules- Representative of a market segment per seReturn profile: Aims to generate superior returnsRisk profile: Not consistent with a diversified index risk profile
Beta+ (leveraged, long/short)Key Characteristics:- Diversification rules apply- Long, short and/or leveraged exposure- Weighting based on market capitalization- Composition based on pre-determined rules- Representative of a pre-defined market segmentReturn profile: Aims to generate superior returnsRisk profile: Not consistent with a diversified index risk profile
AlphaKey Characteristics:- Diversification rules do not typically apply- Long, short and/or leveraged exposure- Weighting not based on market capitalization- Composition not based on pre-determined rules- Not Representative of a pre-defined market segmentReturn profile: Aims to generate positive returnsRisk profile: Dependent on investment decisions
Source: Deutsche Bank
The performance of beta products is measured against an index; a manager is most successful when they manage to
match the return of a product to its stated benchmark. The performance of alpha products, or rather the performance of
an alpha product’s manager, is measured by the risk adjusted return it generates. The highest the return and the lowest
the risk [typically measured by the standard deviation of a product’s returns] the more successful a product is deemed
to be.
There is however a whole host of products that fall between beta and alpha, we have sought to create a classification
system that classifies these products, taking into consideration a number of variables, ranging from diversification to
what constitutes a market segment.
10 December 2015
European Monthly ETF Market Review
Page 74 Deutsche Bank AG/London
The authors of this report wish to acknowledge the contribution made by Vibhor
Mahalwala and Varun Sachdeva, employees of Evalueserve, a third party
provider to Deutsche Bank of offshore research support services.
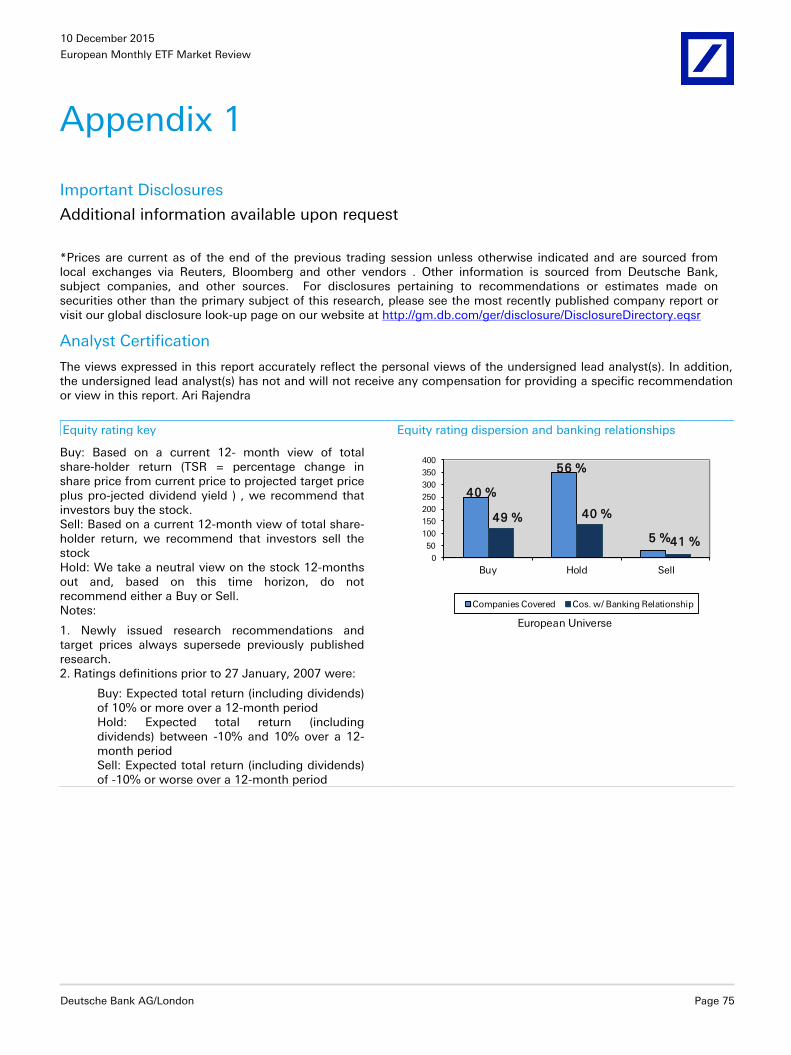
10 December 2015
European Monthly ETF Market Review
Deutsche Bank AG/London Page 75
Appendix 1
Important Disclosures
Additional information available upon request
*Prices are current as of the end of the previous trading session unless otherwise indicated and are sourced from local exchanges via Reuters, Bloomberg and other vendors . Other information is sourced from Deutsche Bank, subject companies, and other sources. For disclosures pertaining to recommendations or estimates made on securities other than the primary subject of this research, please see the most recently published company report or visit our global disclosure look-up page on our website at http://gm.db.com/ger/disclosure/DisclosureDirectory.eqsr
Analyst Certification
The views expressed in this report accurately reflect the personal views of the undersigned lead analyst(s). In addition, the undersigned lead analyst(s) has not and will not receive any compensation for providing a specific recommendation or view in this report. Ari Rajendra
Equity rating key Equity rating dispersion and banking relationships
Buy: Based on a current 12- month view of total share-holder return (TSR = percentage change in share price from current price to projected target price plus pro-jected dividend yield ) , we recommend that investors buy the stock. Sell: Based on a current 12-month view of total share-holder return, we recommend that investors sell the stock Hold: We take a neutral view on the stock 12-months out and, based on this time horizon, do not recommend either a Buy or Sell. Notes:
1. Newly issued research recommendations and target prices always supersede previously published research. 2. Ratings definitions prior to 27 January, 2007 were:
Buy: Expected total return (including dividends) of 10% or more over a 12-month period Hold: Expected total return (including dividends) between -10% and 10% over a 12-month period Sell: Expected total return (including dividends) of -10% or worse over a 12-month period
40 %
56 %
5 %
49 % 40 %
41 %
0
50
100
150
200
250
300
350
400
Buy Hold Sell
European Universe
Companies Covered Cos. w/ Banking Relationship
10 December 2015
European Monthly ETF Market Review
Page 76 Deutsche Bank AG/London
Regulatory Disclosures
1.Additional Information
Information on ETFs is provided strictly for illustrative purposes and should not be deemed an offer to sell or a
solicitation of an offer to buy shares of any fund that is described in this document. Consider carefully any fund's
investment objectives, risk factors, and charges and expenses before investing. This and other information can be found
in the fund's prospectus. Prospectuses about db X-trackers funds and Powershares DB funds can be obtained by calling
1-877-369-4617 or by visiting www.DBXUS.com. Read prospectuses carefully before investing. Past performance is not
necessarily indicative of future results. Investing involves risk, including possible loss of principal. To better understand
the similarities and differences between investments, including investment objectives, risks, fees and expenses, it is
important to read the products' prospectuses. Shares of ETFs may be sold throughout the day on an exchange through
any brokerage account. However, shares may only be redeemed directly from an ETF by authorized participants, in very
large creation/redemption units. Transactions in shares of ETFs will result in brokerage commissions and will generate
tax consequences. ETFs are obliged to distribute portfolio gains to shareholders. Deutsche Bank may be an issuer,
advisor, manager, distributor or administrator of, or provide other services to, an ETF included in this report, for which it
receives compensation. db X-trackers and Powershares DB funds are distributed by ALPS Distributors, Inc. The opinions
expressed are those of the authors and do not necessarily reflect the views of DB, ALPS or their affiliates.
Aside from within this report, important conflict disclosures can also be found at https://gm.db.com/equities under the
"Disclosures Lookup" and "Legal" tabs. Investors are strongly encouraged to review this information before investing.
2. Short-Term Trade Ideas
Deutsche Bank equity research analysts sometimes have shorter-term trade ideas (known as SOLAR ideas) that are
consistent or inconsistent with Deutsche Bank's existing longer term ratings. These trade ideas can be found at the
SOLAR link at http://gm.db.com.
10 December 2015
European Monthly ETF Market Review
Deutsche Bank AG/London Page 77
Additional Information
The information and opinions in this report were prepared by Deutsche Bank AG or one of its affiliates (collectively
"Deutsche Bank"). Though the information herein is believed to be reliable and has been obtained from public sources
believed to be reliable, Deutsche Bank makes no representation as to its accuracy or completeness.
Deutsche Bank may consider this report in deciding to trade as principal. It may also engage in transactions, for its own
account or with customers, in a manner inconsistent with the views taken in this research report. Others within
Deutsche Bank, including strategists, sales staff and other analysts, may take views that are inconsistent with those
taken in this research report. Deutsche Bank issues a variety of research products, including fundamental analysis,
equity-linked analysis, quantitative analysis and trade ideas. Recommendations contained in one type of communication
may differ from recommendations contained in others, whether as a result of differing time horizons, methodologies or
otherwise. Deutsche Bank and/or its affiliates may also be holding debt securities of the issuers it writes on.
Analysts are paid in part based on the profitability of Deutsche Bank AG and its affiliates, which includes investment
banking revenues.
Opinions, estimates and projections constitute the current judgment of the author as of the date of this report. They do
not necessarily reflect the opinions of Deutsche Bank and are subject to change without notice. Deutsche Bank has no
obligation to update, modify or amend this report or to otherwise notify a recipient thereof if any opinion, forecast or
estimate contained herein changes or subsequently becomes inaccurate. This report is provided for informational
purposes only. It is not an offer or a solicitation of an offer to buy or sell any financial instruments or to participate in any
particular trading strategy. Target prices are inherently imprecise and a product of the analyst’s judgment. The financial
instruments discussed in this report may not be suitable for all investors and investors must make their own informed
investment decisions. Prices and availability of financial instruments are subject to change without notice and
investment transactions can lead to losses as a result of price fluctuations and other factors. If a financial instrument is
denominated in a currency other than an investor's currency, a change in exchange rates may adversely affect the
investment. Past performance is not necessarily indicative of future results. Unless otherwise indicated, prices are
current as of the end of the previous trading session, and are sourced from local exchanges via Reuters, Bloomberg and
other vendors. Data is sourced from Deutsche Bank, subject companies, and in some cases, other parties.
Macroeconomic fluctuations often account for most of the risks associated with exposures to instruments that promise
to pay fixed or variable interest rates. For an investor who is long fixed rate instruments (thus receiving these cash
flows), increases in interest rates naturally lift the discount factors applied to the expected cash flows and thus cause a
loss. The longer the maturity of a certain cash flow and the higher the move in the discount factor, the higher will be the
loss. Upside surprises in inflation, fiscal funding needs, and FX depreciation rates are among the most common adverse
macroeconomic shocks to receivers. But counterparty exposure, issuer creditworthiness, client segmentation, regulation
(including changes in assets holding limits for different types of investors), changes in tax policies, currency
convertibility (which may constrain currency conversion, repatriation of profits and/or the liquidation of positions), and
settlement issues related to local clearing houses are also important risk factors to be considered. The sensitivity of fixed
income instruments to macroeconomic shocks may be mitigated by indexing the contracted cash flows to inflation, to
FX depreciation, or to specified interest rates – these are common in emerging markets. It is important to note that the
index fixings may -- by construction -- lag or mis-measure the actual move in the underlying variables they are intended
to track. The choice of the proper fixing (or metric) is particularly important in swaps markets, where floating coupon
rates (i.e., coupons indexed to a typically short-dated interest rate reference index) are exchanged for fixed coupons. It is
also important to acknowledge that funding in a currency that differs from the currency in which coupons are
denominated carries FX risk. Naturally, options on swaps (swaptions) also bear the risks typical to options in addition to
the risks related to rates movements.
Derivative transactions involve numerous risks including, among others, market, counterparty default and illiquidity risk.
The appropriateness or otherwise of these products for use by investors is dependent on the investors' own
circumstances including their tax position, their regulatory environment and the nature of their other assets and
liabilities, and as such, investors should take expert legal and financial advice before entering into any transaction similar
10 December 2015
European Monthly ETF Market Review
Page 78 Deutsche Bank AG/London
to or inspired by the contents of this publication. The risk of loss in futures trading and options, foreign or domestic, can
be substantial. As a result of the high degree of leverage obtainable in futures and options trading, losses may be
incurred that are greater than the amount of funds initially deposited. Trading in options involves risk and is not suitable
for all investors. Prior to buying or selling an option investors must review the "Characteristics and Risks of Standardized
Options”, at http://www.optionsclearing.com/about/publications/character-risks.jsp. If you are unable to access the
website please contact your Deutsche Bank representative for a copy of this important document.
Participants in foreign exchange transactions may incur risks arising from several factors, including the following: ( i)
exchange rates can be volatile and are subject to large fluctuations; ( ii) the value of currencies may be affected by
numerous market factors, including world and national economic, political and regulatory events, events in equity and
debt markets and changes in interest rates; and (iii) currencies may be subject to devaluation or government imposed
exchange controls which could affect the value of the currency. Investors in securities such as ADRs, whose values are
affected by the currency of an underlying security, effectively assume currency risk.
Unless governing law provides otherwise, all transactions should be executed through the Deutsche Bank entity in the
investor's home jurisdiction.
United States: Approved and/or distributed by Deutsche Bank Securities Incorporated, a member of FINRA, NFA and
SIPC. Non-U.S. analysts may not be associated persons of Deutsche Bank Securities Incorporated and therefore may not
be subject to FINRA regulations concerning communications with subject company, public appearances and securities
held by the analysts.
Germany: Approved and/or distributed by Deutsche Bank AG, a joint stock corporation with limited liability incorporated
in the Federal Republic of Germany with its principal office in Frankfurt am Main. Deutsche Bank AG is authorized under
German Banking Law (competent authority: European Central Bank) and is subject to supervision by the European
Central Bank and by BaFin, Germany’s Federal Financial Supervisory Authority.
United Kingdom: Approved and/or distributed by Deutsche Bank AG acting through its London Branch at Winchester
House, 1 Great Winchester Street, London EC2N 2DB. Deutsche Bank AG in the United Kingdom is authorised by the
Prudential Regulation Authority and is subject to limited regulation by the Prudential Regulation Authority and Financial
Conduct Authority. Details about the extent of our authorisation and regulation are available on request.
Hong Kong: Distributed by Deutsche Bank AG, Hong Kong Branch.
Korea: Distributed by Deutsche Securities Korea Co.
South Africa: Deutsche Bank AG Johannesburg is incorporated in the Federal Republic of Germany (Branch Register
Number in South Africa: 1998/003298/10).
Singapore: by Deutsche Bank AG, Singapore Branch or Deutsche Securities Asia Limited, Singapore Branch (One Raffles
Quay #18-00 South Tower Singapore 048583, +65 6423 8001), which may be contacted in respect of any matters
arising from, or in connection with, this report. Where this report is issued or promulgated in Singapore to a person who
is not an accredited investor, expert investor or institutional investor (as defined in the applicable Singapore laws and
regulations), they accept legal responsibility to such person for its contents.
Japan: Approved and/or distributed by Deutsche Securities Inc.(DSI). Registration number - Registered as a financial
instruments dealer by the Head of the Kanto Local Finance Bureau (Kinsho) No. 117. Member of associations: JSDA,
Type II Financial Instruments Firms Association and The Financial Futures Association of Japan. Commissions and risks
involved in stock transactions - for stock transactions, we charge stock commissions and consumption tax by
multiplying the transaction amount by the commission rate agreed with each customer. Stock transactions can lead to
losses as a result of share price fluctuations and other factors. Transactions in foreign stocks can lead to additional
losses stemming from foreign exchange fluctuations. We may also charge commissions and fees for certain categories
of investment advice, products and services. Recommended investment strategies, products and services carry the risk
of losses to principal and other losses as a result of changes in market and/or economic trends, and/or fluctuations in
market value. Before deciding on the purchase of financial products and/or services, customers should carefully read the
relevant disclosures, prospectuses and other documentation. "Moody's", "Standard & Poor's", and "Fitch" mentioned in
10 December 2015
European Monthly ETF Market Review
Deutsche Bank AG/London Page 79
this report are not registered credit rating agencies in Japan unless Japan or "Nippon" is specifically designated in the
name of the entity. Reports on Japanese listed companies not written by analysts of DSI are written by Deutsche Bank
Group's analysts with the coverage companies specified by DSI. Some of the foreign securities stated on this report are
not disclosed according to the Financial Instruments and Exchange Law of Japan.
Malaysia: Deutsche Bank AG and/or its affiliate(s) may maintain positions in the securities referred to herein and may
from time to time offer those securities for purchase or may have an interest to purchase such securities. Deutsche Bank
may engage in transactions in a manner inconsistent with the views discussed herein.
Qatar: Deutsche Bank AG in the Qatar Financial Centre (registered no. 00032) is regulated by the Qatar Financial Centre
Regulatory Authority. Deutsche Bank AG - QFC Branch may only undertake the financial services activities that fall
within the scope of its existing QFCRA license. Principal place of business in the QFC: Qatar Financial Centre, Tower,
West Bay, Level 5, PO Box 14928, Doha, Qatar. This information has been distributed by Deutsche Bank AG. Related
financial products or services are only available to Business Customers, as defined by the Qatar Financial Centre
Regulatory Authority.
Russia: This information, interpretation and opinions submitted herein are not in the context of, and do not constitute,
any appraisal or evaluation activity requiring a license in the Russian Federation.
Kingdom of Saudi Arabia: Deutsche Securities Saudi Arabia LLC Company, (registered no. 07073-37) is regulated by the
Capital Market Authority. Deutsche Securities Saudi Arabia may only undertake the financial services activities that fall
within the scope of its existing CMA license. Principal place of business in Saudi Arabia: King Fahad Road, Al Olaya
District, P.O. Box 301809, Faisaliah Tower - 17th Floor, 11372 Riyadh, Saudi Arabia.
United Arab Emirates: Deutsche Bank AG in the Dubai International Financial Centre (registered no. 00045) is regulated
by the Dubai Financial Services Authority. Deutsche Bank AG - DIFC Branch may only undertake the financial services
activities that fall within the scope of its existing DFSA license. Principal place of business in the DIFC: Dubai
International Financial Centre, The Gate Village, Building 5, PO Box 504902, Dubai, U.A.E. This information has been
distributed by Deutsche Bank AG. Related financial products or services are only available to Professional Clients, as
defined by the Dubai Financial Services Authority.
Australia: Retail clients should obtain a copy of a Product Disclosure Statement (PDS) relating to any financial product
referred to in this report and consider the PDS before making any decision about whether to acquire the product. Please
refer to Australian specific research disclosures and related information at
https://australia.db.com/australia/content/research-information.html
Australia and New Zealand: This research, and any access to it, is intended only for "wholesale clients" within the
meaning of the Australian Corporations Act and New Zealand Financial Advisors Act respectively.
Additional information relative to securities, other financial products or issuers discussed in this report is available upon
request. This report may not be reproduced, distributed or published by any person for any purpose without Deutsche
Bank's prior written consent. Please cite source when quoting.
Copyright © 2015 Deutsche Bank AG
David Folkerts-Landau Chief Economist and Global Head of Research
Raj Hindocha Global Chief Operating Officer
Research
Marcel Cassard Global Head
FICC Research & Global Macro Economics
Steve Pollard Global Head
Equity Research
Michael Spencer Regional Head
Asia Pacific Research
Ralf Hoffmann Regional Head
Deutsche Bank Research, Germany
Andreas Neubauer Regional Head
Equity Research, Germany
International Locations
Deutsche Bank AG
Deutsche Bank Place
Level 16
Corner of Hunter & Phillip Streets
Sydney, NSW 2000
Australia
Tel: (61) 2 8258 1234
Deutsche Bank AG
Große Gallusstraße 10-14
60272 Frankfurt am Main
Germany
Tel: (49) 69 910 00
Deutsche Bank AG
Filiale Hongkong
International Commerce Centre,
1 Austin Road West,Kowloon,
Hong Kong
Tel: (852) 2203 8888
Deutsche Securities Inc.
2-11-1 Nagatacho
Sanno Park Tower
Chiyoda-ku, Tokyo 100-6171
Japan
Tel: (81) 3 5156 6770
Deutsche Bank AG London
1 Great Winchester Street
London EC2N 2EQ
United Kingdom
Tel: (44) 20 7545 8000
Deutsche Bank Securities Inc.
60 Wall Street
New York, NY 10005
United States of America
Tel: (1) 212 250 2500