european report on quality indicators of lifelong learning
TRANSCRIPT

EUROPEAN COMMISSIONDirectorate-General for Education and Culture
Brussels, June 2002
EUROPEAN REPORT ON
QUALITY INDICATORS OF
LIFELONG LEARNING
FIFTEEN QUALITY INDICATORS
Report based on the work of theWorking Group on Quality Indicators
Participating countries: Albania . Austria . Belgium . Bosnia Herzegovina . Bulgaria . CyprusCzech Republic . Denmark . Estonia . Finland . Former Yugoslav Republic of MacedoniaFrance . Germany . Greece . Hungary . Iceland . Ireland . Italy . Latvia . LiechtensteinLithuania . Luxembourg . Malta . The Netherlands . Norway . Poland . Portugal . SlovakRepublic . Republic of Slovenia . Romania . Spain . Sweden . Turkey . United Kingdom

2
CONTENTS
I INTRODUCTION 3
(i) Quality of Lifelong Learning 5(ii) Definition of Lifelong Learning 7(iii) Quality Indicators of Lifelong Learning 7
II FIFTEEN QUALITY 9INDICATORS OF LIFELONG LEARNING
Area A : Skills, Competencies 10 and Attitudes
1. Literacy 122. Numeracy 183. New Skills for the Learning Society 224. Learning-to-Learn Skills 315. Active Citizenship, Cultural and
Social Skills 35
Area B : Access and Participation 40
6. Access to Lifelong Learning 427. Participation in Lifelong Learning 44
Area C : Resources for Lifelong Learning 47
8. Investment in Lifelong learning 499. Educators and Learning 5310. ICT in Learning 56
Area D : Strategies and SystemDevelopment 59
11. Strategies for Lifelong Learning 6112. Coherence of Supply 6413. Guidance and Counselling 6514. Accreditation and Certification 6615. Quality Assurance 68
III CONCLUSIONS 70
Five Challenges to the Quality ofLifelong Learning in Europe 71
(i) The Skills, Competencies and AttitudesChallenge 71
(ii) The Resource Challenge 71(iii) The Challenge of Social Inclusion 72(iv) The Challenge of Change 73(v) The Challenge of Data and
Comparability 73
V ANNEXES 77
1. A Brief Conceptual Outline of the Lifelong Learning Paradigm 78
2. Extended Information on QualityIndicators of Lifelong Learningand other data used 81
3. List of Indicators used in the Field of Education and Training within Selected Community Initiatives 85
4. List of Participants in the WorkingGroup on Quality of Lifelong Learning 88

3
I Introduction

4
“People are Europe’s main asset and should be the focal point of the Union’sPolicies”1
In a knowledge society education and training rank among the highest politicalpriorities. Acquiring and continuously updating and upgrading a high level ofknowledge, skills and competencies is considered a prerequisite for the personaldevelopment of all citizens and for participation in all aspects of society from activecitizenship through to labour market integration. Lifelong learning has emerged as anoverarching strategy for enabling citizens to meet new challenges.
The Lisbon European Council (March, 2000) set the strategic goal for Europe, ofbecoming, by 2010: ‘the most competitive and dynamic knowledge-based economy inthe world, capable of sustainable economic growth with more and better jobs andgreater social cohesion’ and furthermore, the Heads of State in their conclusions inLisbon emphasised the central role of education and training in responding to thechallenges of such an objective and invited the Ministers of Education to agree uponconcrete objectives for education and training systems. On the basis of a proposalfrom the Commission, the Ministers of Education adopted a Report on the concretefuture objectives of education and training systems in February 2001 and a Detailedwork programme for its implementation in February 2002 2.
Three overall strategic objectives, defined in these documents, will influence thedevelopment of education and training systems in Europe over the course of the nextdecade:
1. Improving the quality and effectiveness of education and training systems in theEU;
2. Facilitating the access of all to education and training systems and;3. Opening-up education and training systems to the wider world.
Within these three strategic objectives, thirteen concrete objectives and a series of keyissues within each one of them was defined. In order to implement these objectives,the “open method of co-ordination” is to be applied. This will entail the use of co-operation tools such as indicators, benchmarks, exchange of good practice and peer-review. The Barcelona European Council (March, 2002) endorsed the Detailed workprogramme on the follow-up of the objectives of education and training systems inEurope and set the following overall goal for Europe 3:
“The European Council sets the objective to make Europe’s education andtraining systems a world quality reference by 2010”
Lifelong learning is an overarching strategy of European co-operation in educationand training policies and for the individual. The lifelong learning approach is anessential policy strategy for the development of citizenship, social cohesion,employment and for individual fulfilment. 1 Lisbon European Council: Presidency Conclusions, point 242 Detailed work programme on the follow-up of the objective of education and training systems inEurope3 http://europa.eu.int/council/off/conclu/index.htm

5
The principal aims of lifelong learning are:
� to build an inclusive society which offers equal opportunities for access to qualitylearning throughout life to all people, and in which education and trainingprovision is based first and foremost on the needs and demands of individuals,
� to adjust the ways in which education and training is provided and at the sametime to ensure that people’s knowledge and skills match the changing demands ofjobs and occupations, workplace organisation and working methods and,
� to encourage and equip people to participate in all spheres of modern public life,especially in social and political life at all levels of the community, including atEuropean level.
The Commission has recently adopted a Communication ‘Making a European Area ofLifelong Learning a Reality’4 which lays out a coherent strategy for implementing itsobjectives including the following ‘building blocks’:
� developing a partnership approach: all relevant actors, in and outside the formalsystems, must collaborate for strategies to work ‘on the ground’,
� gaining insight into the needs of the learner, or the potential learner, along withlearning needs of organisations, communities, wider society and the labourmarket,
� ensuring adequate resourcing, in terms of financing and of effective andtransparent allocation of resources,
� matching learning opportunities to learners’ needs and interests,
� facilitating access by developing the supply side to enable learning by anyone,anywhere, at any time,
� valuing non-formal and informal learning,
� creating a culture of learning by increasing learning opportunities, raisingparticipation levels and stimulating demand for learning and,
� setting up mechanisms for quality assurance, evaluation and monitoring in orderto ensure constant progression towards quality improvement with a view tostriving for excellence on an ongoing basis.
(i) Quality of Lifelong Learning
Quality of education is a central issue in European co-operation. Article 149 of the ECTreaty states that ‘the Community shall contribute to the development of qualityeducation by encouraging co-operation between Member States and, if necessary, by
4 (COM (2001) 678 final)

6
supporting and supplementing their actions while fully respecting the responsibility ofthe Member States for the content of teaching and organisation of educationalsystems and their cultural and linguistic diversity’.
Enhancing the quality of education, training and ultimately lifelong learning is one ofthe main priorities of the European Union action programmes, ’Socrates’ and‘Leonardo da Vinci’, which are concerned with education and vocational trainingrespectively. The Council and the European Parliament have given further emphasisto this issue by adopting, on the basis of proposals from the Commission,recommendations for the promotion of quality evaluations of school and highereducation respectively5. The quality objective has therefore been increasingly broughtto the fore in all aspects of co-operation in the field of education and training.
On the basis of this the Ministers of Education, at their meeting in Prague in June1998, invited the Commission to establish a group of experts, nominated by Ministers,with the objective of identifying a limited number of key indicators “to assist nationalevaluation of systems in the area of school standards”. A final ‘European Report onthe Quality of School Education – Sixteen Quality Indicators’ was presented to theMinisters at their annual meeting in Bucharest in 2000. In Bucharest the participatingMinisters invited the Commission and experts to continue this work and to extend theinitiative to cover all the strands of education and training encompassed by lifelonglearning.
The working group on Indicators on Quality of Lifelong Learning has been meetingregularly since January 2001. The group includes representatives from 34 Europeancountries, the OECD and UNESCO. Various Commission services, such as Eurostatand DG EMPL, together with Cedefop and Eurydice6 have also been represented inthe group.
Early in 2001 the working group together with the Commission agreed upon a limitednumber of relevant indicator areas. The most appropriate indicators for each of theseareas have subsequently been selected. The process of selecting indicators hasreflected the complexity of the lifelong learning process itself. Lifelong learningremains an emerging area within education policy and as such its measurement andassessment methodology remains under-developed in many of the existinginternational, European and national surveys.
The learner-centred orientation of lifelong learning is radically different from theinstitution-centred approach inherent in data collection pertaining to the formaleducation system. The methodological and statistical aspects of lifelong learning wereanalysed by the Eurostat Task Force on Measuring Lifelong Learning established inFebruary 2000. The Task Force delivered its final report in February 20017. Its 5 Recommendation of the European Parliament and of the council of 12 February 2001on European
cooperation in quality evaluation in school education (2001/166/EC).Council Recommendation of 24 September 1998 on European cooperation in quality assurance inhigher education (98/561/EC).
6 See list working group participants in Annexe 47 The public Eurostat site on Measuring lifelong learning is available at the address:
http://forum.europa.eu.int/Public/irc/dsis/edtcs/library?l=/public/measuring_lifelongIt includes among other things the report of the TFMLLL and the proceedings of the CEIES seminarheld in June 2001 in Parma

7
recommendations were endorsed at the seminar on measuring lifelong learning inParma, Italy, organised jointly by CEIES, Eurostat, DG EAC and ISTAT. Theproviders, producers and users of statistics who met in Parma agreed that numerousgaps needed to be filled and that existing data sources should be reviewed from alifelong learning perspective.
The indicators used in the present report are drawn from existing data in order to meetthe urgency of the demands for presenting and analysing internationally comparabledata on this subject. Wherever a choice of indicators was available, the working groupand the Commission favoured indicators which are based on the most recent data andthose which are considered most reliable, comparable and politically relevant to thepurpose of this report.
(ii) Definition of Lifelong Learning8
Definitions of lifelong learning vary according to the perspectives and priorities ofpolicy makers at a given moment. The working group decided, at an early stage, toadopt the definition of “lifelong learning” used in other Community activities such asthe Luxembourg process, in the co-ordination of employment policies and in theMemorandum on Lifelong Learning:
“Lifelong learning is seen as encompassing all purposeful learning activity, whetherformal or informal, undertaken on an ongoing basis with the aim of improvingknowledge, skills and competence”.
During the consultation process on the Commission’s proposed strategies for lifelonglearning, included in the Memorandum on lifelong learning, many comments weremade on the limitations of such a definition. In particular, the need for learningactivities to be undertaken on an “ongoing basis” was considered overly-restrictive ofwhat could and should be considered as lifelong learning as was also the term‘purposeful’. Furthermore, the scope of competencies and skills was extended toinclude non-job-related skills. In its final Communication on ‘Making a Europeanarea of lifelong learning a reality’ the Commission suggested that a slightly modifieddefinition of lifelong learning be applied:
‘All learning activity undertaken throughout life, with the aim of improvingknowledge, skills and competencies within a personal, civic, social and/oremployment-related perspective.’
(iii) Quality Indicators of Lifelong Learning
The decision to use specific quantitative and qualitative data as ‘indicators’ isincreasingly being taken at a high political level with a view to giving signals, toevaluate, promote dialogue and support planning in the field of education andtraining.
8 For a more detailed discussion on the definition of lifelong learning please refer to Annexe 1 ‘A Brief
Conceptual Outline of the Lifelong Learning Paradigm’.

8
The role of indicators could for example be:
- to describe the present situation,- to quantify the objectives which have been set,- to provide continuous updates on progress towards certain objectives or,- to provide insights into which factors might have contributed to achieving
results.
The present initiative taken by the Ministers of Education, representing some 34European countries is a clear illustration of the political importance attributed to thechoice of indicators in policy fields such as the present one on “quality of lifelonglearning”.
The indicators identified in this report coincide with the four areas identified by theworking group as relevant policy areas for quality of lifelong learning. The first areafocuses on the skills, attitudes and competencies of the individual. The second area,on access and participation, describes the interaction between the individual and thesystem. A third area on resources for lifelong learning has its focus on systemparameters and, to a lesser extent, individual parameters. ‘System’ issues areaddressed in the final area, keeping in mind that defining lifelong learning as a‘system’ is a challenge in itself.
The fifteen quality indicators are contained in the four areas (A-D) of this report.
Area A: Skills, Competencies and Attitudes
1. Literacy2. Numeracy3. New Skills in the Learning Society4. Learning-to-Learn Skills5. Active Citizenship Cultural and Social Skills
Area B: Access and Participation
6. Access to Lifelong Learning7. Participation in Lifelong Learning
Area C: Resources for Lifelong Learning
8. Investment in Lifelong Learning9. Educators and Training10. ICT in Learning
Area D: Strategies and System Development
11. Strategies of Lifelong Learning12. Coherence of Supply13. Counselling and Guidance14. Accreditation and Certification15. Quality Assurance

9
II Fifteen Quality Indicatorsof Lifelong Learning

10
Fifteen Quality Indicators ofLifelong Learning
Area A: Skills, Competencies and Attitudes

11
The working group concluded that indicators on the following skills or skill areas arerelevant:
� Literacy� Numeracy� New Skills for the learning society� Learning-to-learn skills� Active citizenship, cultural and social skills� Labour market related outcomes9
In a lifelong learning context, which includes formal, non-formal and informallearning, these are of fundamental value as meaningful outcome indicators. In spite ofthe importance of data on adults’ skills however, very little large-scale research hasbeen systematically conducted in this area. For this reason the data used are largelybased on samples from the school population and especially on 15 year-olds whowere the subject the PISA 2000 survey, which yields standardised and internationallycomparable data. While young people are clearly an important part of the populationbecause their attainment level gives information about their potential lifelong learningactivities. The availability of such data is no substitute for cross-nationallycomparable data concerning the adult population.
9 The working group identified labour market related outcomes as a relevant indicator area but, owing
to lack of data, it was not subsequently elaborated in the report.
Area A : Skills Competencies and Attitudes

12
Indicator: LiteracyDefinition: Percentage of students per country at proficiency level 1 or
below on the PISA reading literacy scaleData source: OECD: Programme on International Student Assessment, 2000
Ensuring that all citizens achieve an operational level of literacy and numeracy is anecessary precondition to attaining quality in lifelong learning. Along with numeracy,literacy is the key to developing all subsequent learning capabilities, as well as toemployability. Developing and maintaining these skills is essential for all learningsystems. Such skills facilitate participation in the wider context of lifelong learningand contribute to the social integration and personal development of individuals.
Learning, at any stage of life, is particularly dependent upon reading skills. Althoughwritten information is often complemented by oral communication most learningmaterial is still, and will continue to be in the near future, organised in a way thatrequires a broad range of reading skills. The requisite reading literacy includescompetencies at very different levels, ranging from simple information identificationskills to more complex competencies involving interpretation, evaluation andreflection. Moreover, different textual formats such as prose, poetry, tabular andgraphical presentations each require a specific kind of reading literacy.
In the context of lifelong learning it is essential for countries to have a soundknowledge of the literacy levels of the adult population and, above all, about theliteracy skills of the younger generation. Beyond a mere statement of the averagelevel of literacy in any one country, information about sub-populations at risk, i.e.those parts of a population who show particular deficits in reading skills andcompetencies, can be considered a specific indicator for the quality of lifelonglearning.
Based on the recent results of the PISA study, statistical information on literacy fordifferent countries will be provided below, together with one concrete indicatorderived from the PISA data.
The strong focus on PISA, which concentrates on 15-years-olds, reflects the fact thatliteracy data on the adult population is not currently available. Data from theInternational Adult Literacy Survey (IALS) are perceived by some countries to beoutdated, while results from the International Adult Literacy and Life Skills Survey(ALL) are not yet available.
The first table shows the reading literacy performances (European countries andselected reference countries) of the countries participating in PISA. The countries areranked on a scale with an average score of 500 points and a standard deviation of 100points. The standard deviation describes the degree of variability in a distribution.Approximately 68% of all cases will be found within one standard deviation of the
1. Literacy

13
mean score. Related to PISA, this means that 68% of all students who participated inthe test achieved scores of between 400 and 600 points.
In Table 1 the mean scores of the countries are presented in descending order. Not alldifferences around the OECD average of 500 points are statistically significant.Countries who score significantly above the OECD average are in the section shadeddark grey, those significantly below average are to be found in the section shadedlight grey, and the countries whose results do not significantly differ statistically fromthe OECD mean are located in the unshaded section. The international PISA reportshows in more detail the extent to which country performances differ significantlyfrom each other (OECD, 2001).
Table 1Average reading literacy in European countries and selected reference countries
Finland 546Canada 534Australia 528Ireland 527Korea 525United Kingdom 523Japan 522Sweden 516Austria 507Belgium 507Iceland 507Norway 505France 505United States 504Denmark 497Switzerland 494Spain 493Czech Rep. 492Italy 487Germany 484Liechtenstein 483Hungary 480Poland 479Greece 474Portugal 470Latvia 458Luxembourg 441
Score of the Netherlands: 532 (S.E. 3.35), see footnote10
Source: OECD/PISA, 2001.
The data presented in this table show the performance of 15-year-olds from thecountries involved in the PISA survey. If the reading literacy of the young generationis a key determinant of a successful lifelong learning system, it is apparent from thistable that some countries seem to be on track better than others.
10 The results of the Netherlands have been published only partially in the OECD PISA report, because
the Netherlands did not meet the required response rate of 80%. Nevertheless the response receivedwas representative (CITO, December 2001).
14
In the context of lifelong learning it is important to differentiate between thosestudents who attain adequate scores and those who do not. What is required of alifelong learning quality indicator is that it enables those who are inadequatelyprepared for lifelong learning to be identified. An indicator, which meets this demand,can be extracted from the PISA data.
The PISA study describes students’ proficiency in terms of five levels of readingliteracy (OECD, 2001). Each proficiency level is associated with certain tasks whichstudents at this proficiency level are assumed to be able to complete. Students whohave reached the highest level (5) are expected to be capable “of completingsophisticated reading tasks, such as managing information that is difficult to find inunfamiliar texts” or “ being able to evaluate critically and build hypotheses” (OECD,2001). At the lowest level (1) of proficiency, students are capable of “completing onlythe least complex reading tasks developed for PISA, such as locating a single piece ofinformation, identifying the main theme of a text, or making a simple connection witheveryday knowledge” (OECD, 2001).
The analysis of the PISA results show that a certain number of students do not reacheven the lowest proficiency level (1). While performance at level 1 or below cannotbe directly equated with illiteracy it is safe to assume that students at this level ofattainment will experience serious difficulties when dealing with written informationand thus with any learning process dependent upon written material. As the OECDsuggests: "Parents, educators, and policy-makers in systems with large proportions ofstudents performing at or below Level 1 need to recognise that significant numbers ofstudents are not benefiting sufficiently from available educational opportunities andare failing to acquire the necessary knowledge and skills to do so effectively in theirfuture school careers and beyond" (OECD, 2001).
For the purpose of lifelong learning it is unnecessary to differentiate between studentsachieving the higher proficiency levels. While their performance at different tasksvaries, all of them can be considered sufficiently well prepared for further learningopportunities – at least in so far as reading is concerned. By contrast, this may not betrue for students at level 1 or below. Inadequate levels of reading literacy constitute aserious obstacle to successful participation in the lifelong learning process.
On the basis of these considerations the most central quality indicator for literacy is:
The percentage of students per country at proficiency level 1 or below, as derivedfrom the PISA 2000 reading literacy scale.
Table 2Percentage of students per country at proficiency level 1 or below on the PISAreading literacy scale

15
Source: OECD/PISA, 2001.
Table 2: Percentage of students per country at proficiency level1 or belowon the PISA reading literacy scale
0 5 10 15 20 25 30 35 40
United Kingdom
Turkey
Switzerland
Sweden
Spain
Slovenia
Slovakia
Romania
Portugal
Poland
Norway
Netherlands
Malta
Macedonia
Luxembourg
Lithuania
Liechtenstein
Latvia
Italy
Ireland
Iceland
Hungary
Greece
Germany
France
Finland
Estonia
Denmark
Czech Republic
Cyprus
Croatia
Bulgaria
Bosnia-Herzegovina
Belgium
Austria
Albania
Australia
Canada
Japan
Korea
United States

16
It is evident from this table that some countries face more challenges than others do.Even in top performing countries (according to Table 1) like Finland, Ireland or theUnited Kingdom a certain percentage of students will still lack the necessary skills toparticipate successfully in lifelong learning.
Adult Literacy
Aside from data on young people, quality indicators on lifelong learning should alsoinclude information concerning the reading literacy of the adult population. Theanalysis of the data from 12 OECD countries, among them 8 European countries,reveals that "low literacy is a much larger problem than previously assumed in everycountry surveyed. From one quarter to over one half of the adult population fail toreach the threshold level of performance considered as a suitable minimum skill levelfor coping with the demands of modern life and work" (OECD, 1997).
The most recent major study providing such information is the "International AdultLiteracy Survey" (OECD, 1995 and 1997) which was launched in 1994 with sevencountries participating. Additional countries joined the International Adult LiteracySurvey (IALS) in successive waves so that in all almost 30 countries participated.
Beyond generating a mere description of the literacy skills of the adult population,IALS provides ample evidence of both the social and economic benefits of a highlevel of literacy. The IALS findings demonstrate a positive relationship betweeneducational qualification and earnings, increasing labour force participation rates withincreasing levels of literacy, and between literacy and voluntary community workwhich may serve as examples of such benefits. Similar findings have also emanatedfrom the results of the Labour Force Surveys where the benefits are related to theeducational attainment (considered to be a proxy for competence levels) of theindividual.
In the past decade, IALS has been the only international study on adult literacy andmany of the results of this study remain highly relevant. Nevertheless, continuallyupdating our knowledge of adult literacy and extending our knowledge to other skillareas is of utmost importance if the European Union is to deal successfully with thechallenges it is facing today.
Another ongoing study in the field of adult skills is the "International Adult Literacyand Life Skills Survey" (ALL), a joint venture between Statistics Canada and the USNational Center for Education Statistics. ALL assesses the literacy, numeracy andproblem-solving skills of a representative sample of adults aged 16-65 years-oldwithin an international comparative framework. Developmental work on assessingICT literacy and team-working skills within ALL has been initiated. Currently, only afew European countries are participating in the survey (Italy, Norway, Switzerland,Belgium, and the Netherlands). The first results of this study will be available by theend of 2003.
An interesting attempt to overcome cultural bias in comparative studies of students’reading performances has recently been made by four European countries (Bonnet etal., 2001). Based on national "indigenous test material", this European Commissionfunded project tried to develop both a theoretical framework and assessment

17
instruments which go beyond the classical standardised assessment procedures used instudies like IALS or PISA. Although the study focused on initial education, the veryrationale of the approach can be extended to the assessment of adult skills as well.The results are promising, although it is quite clear that a substantial amount offurther research is needed if this approach is to be fully developed.
This international experience could be used to develop the specific tools necessary toobtain harmonised data on adult skills across Europe which take into account thespecific policy priorities of the European Union in this area and the cultural diversityof European societies.

18
Indicator: NumeracyDefinition: Percentage of students per country below the score of 380 points
on the PISA mathematical literacy scaleData source: OECD: Programme on International Student Assessment, 2000
While reading literacy is a key determinant of the ability to assimilate any writteninformation, the ability to deal with numerical information is of comparableimportance in daily life and in professional environments.
The "European Report on the Quality of School Education" advocated that: A solidgrounding in mathematics belongs at the very core of the education curriculum.Analytical skills, logic skills and reasoning are all enhanced through the study ofmathematics. Ensuring that all citizens achieve an operational level of numeracy is anessential precondition for quality of learning. Compulsory training of children inmathematics is therefore an important requirement for participation in society,ultimately making an indispensable contribution to national competitiveness and theknowledge society.
As is the case with literacy, it is accepted that knowledge about both adults’ numeracyand that of the younger generation are important to decision-makers and to anyoneinvolved in the planning, design, and implementation or quality assurance of lifelonglearning processes. Once again, priority is given to the situation of the younggeneration, as their ability to successfully progress along a lifelong learning pathwaywill be one of the determinants of the future economic and social well being of theEuropean Union.
As in the case of the indicator on literacy, the recently published PISA 2000 survey isthe most central source of information on numeracy. PISA defines “mathematicalliteracy” as follows:
“Mathematical literacy is defined in PISA as the capacity to identify, understand, andengage in mathematics, and to make well founded judgements about the role thatmathematics play in an individual’s current and future private life, social life withpeers and relatives, and life as constructive, concerned and reflective citizen…Mathematical literacy is used here to indicate the ability to put mathematicalknowledge and skills to functional use rather than just mastering them within a schoolcurriculum” (OECD, 2001).
As was the case with reading literacy, the average score for mathematical literacy is500 points with a standard deviation of 100 points. When compared to the OECDaverage (500 points), those countries scoring significantly higher than the meanperformance (dark grey), those attaining significantly lower than average scores (light
2. Numeracy

19
grey) and those countries whose scores do not differ significantly from the mean(unshaded) are shaded differently.
Table 3Mathematical literacy scores in European countries and selected referencecountries
Japan 557Korea 547Finland 536Australia 533Canada 533Switzerland 529United Kingdom 529Belgium 520France 517Austria 515Denmark 514Iceland 514Liechtenstein 514Sweden 510Ireland 503Norway 499Czech Republic 498United States 493Germany 490Hungary 488Spain 476Poland 470Latvia 463Italy 457Portugal 454Greece 447Luxembourg 446
(Score of the Netherlands: 564 (S.E. 4.01), see footnote 11)Source: OECD/PISA, 2001
As a somewhat more restricted set of items was used in the first PISA cycle tomeasure mathematical literacy it was not possible to construct meaningful proficiencylevels, similar to those used to describe levels of reading literacy, for mathematicalliteracy with the PISA 2000 data. However, as with reading literacy an indicator issought which identifies those students who are well prepared for aspects of lifelonglearning requiring a functional level of numeracy from those who are not.
11 The results of the Netherlands have been published only partially in the OECD PISA report, because
the Netherlands did not meet the required response rate of 80%. Nevertheless the response receivedwas representative (CITO, December 2001).

20
We have chosen to identify “inadequate performers” as students who score below 380points on the PISA mathematical literacy scale. This is the score around which,according to the international PISA report, a student is considered “able to completeonly a single processing step consisting of reproducing basic mathematical facts orprocesses, or applying simple computational skills” (OECD, 2001). Studentsperforming below this score may be expected to struggle with lifelong learningactivities involving numerical skills.
Table 4Percentage of students per country below the score of 380 points on the PISAmathematical literacy scale
Source: OECD/PISA, 2001

21
Table 4: Percentage of students per country below the score of 380 points on thePISA mathematical literacy scale
0 5 10 15 20 25 30
United Kingdom
Turkey
Switzerland
Sweden
Spain
Slovenia
Slovakia
Romania
Portugal
Poland
Norway
Netherlands
Malta
Macedonia
Luxembourg
Lithuania
Liechtenstein
Latvia
Italy
Ireland
Iceland
Hungary
Greece
Germany
France
Finland
Estonia
Denmark
Czech Republic
Cyprus
Croatia
Bulgaria
Bosnia-Herzegovina
Belgium
Austria
Albania
United States
Canada
Japan
Korea
Australia

22
Indicator: New Skills for the Learning SocietyDefinition: Percentage of students per country below the score of 400 points
on the PISA scientific literacy scaleData source: OECD: Programme on International Student Assessment, 2000
Today’s learning society requires citizens to master a range of skills and competencieswhich have always been important, but have acquired additional priority in ourcontemporary world with its manifold challenges and increased opportunities forlifelong learning. The Lisbon Summit Conclusions called for a European Frameworkwhich should define the "new" basic competencies to be provided through lifelonglearning, namely: IT skills, foreign languages, technological culture, entrepreneurshipand social skills. These have been included in the priority areas set out in theObjectives Report submitted by the Education Council to the Stockholm EuropeanCouncil.
The joint work programme on the follow-up of the objectives of education andtraining systems in Europe makes reference to the Commission’s working group onBasic Competencies. This group has suggested that the key competencies include thefollowing principal areas, aside from a general readiness throughout life for personalefforts in the learning domain:
� Numeracy and literacy (foundationskills)
� Basic competencies in mathematics,science and technology
� Foreign languages� ICT skills and use of technology
� Learning to learn� Social skills� Entrepreneurship� General Culture
A significant problem arises from the fact that many of these skills have yet to receiveadequate conceptual elaboration and clarification. As a consequence, measuringinstruments capable of yielding both valid and reliable data about a person’scompetencies in these areas are still lacking. Furthermore, the prospect of havinginstruments that can be used in large-scale, comparative European surveys is evenmore distant. Given these methodological constraints the indicators cover only areaswhere cross-nationally comparable data regarded as valid and reliable are available.
Scientific Literacy
A close inspection of the requirements to attaining successful scientific thinkingreveals that quite a few of the skills mentioned above relate more or less directly tothe conceptual construct of “scientific literacy”. Scientific and technologicaldevelopment is of fundamental importance to a competitive knowledge society.General and specialised scientific or technological knowledge is increasingly called
3. New Skills for the Learning Society

23
upon in professional and daily life, in public debates and discourse, decision makingand legislation.
Together, TIMMS and PISA constitute the largest body of knowledge of competencyin the fields of scientific literacy, science knowledge, etc. While TIMSS is acurriculum-based evaluation of students' knowledge in the fields of mathematics andscience, PISA is principally concerned with the application of mathematical andscientific knowledge in real-life settings. One further difference is evident in theorganisations responsible for the two studies. TIMSS, led by the non-governmental"International Association for the Evaluation of Educational Achievement" (IEA), isat least for the moment, closer to everyday school life. By contrast, the OECD-drivenPISA study has aimed at delivering policy-relevant indicators on student achievementfrom the very beginning.
As with reading literacy and numeracy, an indicator is defined which is based on the“scientific literacy” data found in the PISA 2000 study. The "scientific literacy"concept underlying the PISA study is summarised as follows:
“Scientific literacy relates to the ability to think scientifically in a world in whichscience and technology shape lives. Such literacy requires an understanding ofscientific concepts as well as an ability to apply a scientific perspective. PISA definesscientific literacy as the capacity to use scientific knowledge, to identify questions,and to draw evidence based conclusions in order to understand and help makedecisions about the natural world and the changes made to it through humanactivity.”
PISA is concerned with assessing the basic scientific thinking required for individualsto participate fully in all aspects of daily life and society. As in its other assessmentdomains, PISA scientific literacy is particularly concerned with the application ofknowledge and a certain way of thinking, rather than with the mere accumulation ofknowledge. It is on this basis that it has been selected as an indicator of the quality ofnew skills.
Table 5 provides an overview of the scientific literacy results from the countriesparticipating in PISA. Country performances significantly above or below the OECDaverage of 500 points are highlighted in dark and light grey shading respectively.

24
Table 5Scientific literacy scores in European countries and selected reference countries
Korea 552Japan 550Finland 538United Kingdom 532Canada 529Australia 528Austria 519Ireland 513Sweden 512Czech Republic 511France 500Norway 500United States 499Hungary 496Iceland 496Belgium 496Switzerland 496Spain 491Germany 487Poland 483Denmark 481Italy 478Liechtenstein 476Greece 461Latvia 460Portugal 459Luxembourg 443
(Score of the Netherlands: 529 (S.E. 3.61), see footnote 12)Source: OECD/PISA, 2001
It is worth reiterating that in using data from the PISA 2000 survey it is young people,aged 15, who are the focus of the results presented.
Again, low and inadequate performers can be in danger of being insufficientlyprepared for learning throughout life in a knowledge society. Low performers in thearea of scientific literacy could be identified as those that have attained scores of lessthan 400 in the PISA scientific literacy scale.
According to the OECD PISA report, a score of approximately 400 points indicatesthat "students are able to recall simple factual knowledge (e.g. names, facts,terminology, simple rules) and to use common scientific knowledge in drawing orevaluating conclusions" (OECD, 2001). Students performing at the higher levels of 12 The results of the Netherlands have been published only partially in the OECD PISA report, because
the Netherlands did not meet the required response rate of 80%. Nevertheless the response receivedwas representative (CITO, December 2001).

25
the scale "are able to use scientific concepts to make predictions or provideexplanations"; they can deal with competing information, do more complex scientificreasoning or even use or create conceptual scientific models.
Students who score below 400 points cannot be expected to have the requiredscientific literacy, which is a basis, or at least highly beneficial, for many of therequisite “new” skills in our modern learning society, such as ICT skills,technological culture or even entrepreneurship.
Although this report focuses on the analysis of scientific literacy these statistics serveas a proxy for new skills in a learning society. Attention is focused on theidentification of particular sub-populations with poor results as these indicate thepeople inadequately prepared for the contemporary challenges of lifelong learning.National interventions in the field of lifelong learning should carefully analyse thesedata, in order to focus and optimise efforts.
Table 6Percentage of students per country with less than 400 points on the PISAscientific literacy scale

26
Source: OECD/PISA, 2001.
Table 6: Percentage of students per country below the score of 400 points on thePISA Scientific literacy scale
0 5 10 15 20 25 30 35
United Kingdom
Turkey
Switzerland
Sweden
Spain
Slovenia
Slovakia
Romania
Portugal
Poland
Norway
Netherlands
Malta
Macedonia
Luxembourg
Lithuania
Liechtenstein
Latvia
Italy
Ireland
Iceland
Hungary
Greece
Germany
France
Finland
Estonia
Denmark
Czech Republic
Cyprus
Croatia
Bulgaria
Bosnia-Herzegovina
Belgium
Austria
Albania
United States
Canada
Japan
Korea
Australia
27
Eurostat provides additional information on “new skills for the learning society”. Thenumber of graduates in scientific and technological subjects (per 1000 citizens) indifferent European countries paint very different pictures and show rather unequaldistributions for men and women. Since graduates in scientific and technologicalsubjects need to possess the required "new skills", the number of graduates in thesesubjects may be interpreted as an indirect indicator for the skills distribution in agiven country.
Table 7Share of tertiary graduates in science and technology per 1000 inhabitants aged20-29, 1993-2000 in Member States and candidate countries

28
Table 7 (%)1993 1994 1995 1996 1997 1998 1999 2000
EU (:) (:) (:) (:) (:) (:) (:) (:)B 9,2 (:) (:) (:) (:) (:) (:) 9,7
DK 9,8 (:) 9,6 9,4 (:) 8,1 8,3 (:)D 8,2 8,9 9,3 9,3 9,1 8,8 8,6 8,2
EL 3,8 (:) (:) (:) (:) (:) (:) (:)E 4,4 5,1 5,8 6,6 7,6 8,0 9,6 9,9F 14,1 (:) (:) (:) 17,2 18,2 (:) (:)
IRL 19,1 21,0 21,4 21,9 21,8 22,4 (:) 23,2I 2,9 2,8 2,9 4,1 5,0 5,1 5,6 (:)L (:) (:) (:) (:) (:) 1,4 (:) 1,8
NL 5,5 5,4 5,6 6,6 (:) 6,0 5,8 5,5A (:) 3,2 3,3 3,6 4,3 7,7 6,8 7,1P 2,5 3,9 4,0 4,2 4,8 (:) (:) 6,3
FIN 13,5 13,2 13,2 13,3 15,9 16,1 17,8 (:)S 6,2 6,3 7,3 7,4 7,8 7,9 9,7 11,6
UK 12,9 13,7 13,5 14,3 14,5 15,2 15,6 16,2
IS (:) (:) (:) 7,9 6,4 7,0 6,3 8,4LI (:) (:) (:) (:) (:) (:) (:) (:)
NO (:) (:) 8,5 9,1 8,3 7,5 7,2 7,9
BG (:) (:) (:) (:) 6,0 5,5 6,5 6,6CZ (:) (:) (:) (:) (:) 4,6 4,0 5,5EE (:) (:) (:) (:) 3,5 2,9 5,7 6,4LV (:) (:) (:) (:) 6,6 5,9 6,3 7,3LT (:) (:) (:) (:) 7,0 8,6 10,8 12,1HU (:) (:) (:) (:) (:) 5,0 5,1 4,5PL (:) (:) (:) (:) 3,8 4,3 5,5 5,9RO (:) (:) (:) (:) 2,9 4,2 4,1 4,5SI (:) (:) (:) (:) 6,3 8,0 8,4 (:)SK (:) (:) (:) (:) 4,9 4,3 5,1 5,3
CY (:) (:) (:) (:) (:) (:) 52,9 (:)MT (:) (:) (:) (:) (:) (:) 1,3 3,8
AL (:) (:) (:) (:) (:) (:) (:) (:)MK (:) (:) (:) (:) (:) 3,8 3,6 (:)
Source: Eurostat, UOE and population statistics (2000)13
13
Additional notes:Netherlands, Poland, Romania, Albania, FYR of Macedonia: Excludes advanced research programmes (ISCED level 6)Luxembourg: Luxembourg does not have a complete universitary system; refers only to ISCED level 5B first degreeAustria: ISCED level 5B refers to previous years except for 1998/99: ISCED level 5B is missingIceland: Full-time graduates onlyRomania: Excludes second qualifications

29
ICT Skills
Concrete information on other new skills such as ICT skills will become available inthe near future. For example, the direct assessment of ICT skills is currently underdevelopment in several contexts:
1) the IEA is preparing for a large-scale assessment of ICT skills amongst schoolpupils,
2) the US Educational Testing Services (ETS) recently published a framework onICT literacy. A direct skills assessment of ICT literacy, based on this frameworkwill be developed for the "International Adult Literacy and Life Skills Survey" tobe used in future rounds and,
3) the OECD “network A” on student outcomes is preparing a framework to be usedin the 2006 PISA cycle.
Foreign Language Skills
The Education Council noted in February 2002 that no reliable data on the actualforeign language skills of young people are available; further work must therefore becarried out to obtain them. In the context of deliberations on ‘a competitive economybased on knowledge’, the Barcelona European Council of March 2002 called forfurther action to improve the mastery of basic competencies, in particular by teachingat least two foreign languages from a very early age: the establishment of a linguisticcompetence indicator in 2003.
The Council of Europe's "Common European Framework of Reference forLanguages: learning, teaching, assessment" is a possible starting point for the futuredevelopment of indicators in this domain because it provides common scales oflanguage ability, based upon practical communication skills. It is gaining acceptanceamongst the language testing community; for example, the Association of LanguageTesters in Europe (which brings together 27 language testing institutions acrossEurope) uses it as a way of relating the levels of the different language tests of itsmember organisations to a common benchmark; this kind of work may well provide abasis for developing a useful indicator of foreign language skills.
The Framework is also the basis of the Commission’s DIALANG project thatprovides on-line diagnostic assessment of language skills in 14 European languagesfor five different skills within each language (reading, writing, listening, structuresand vocabulary); test takers receive an assessment of their language skills expressedon the scales of the Framework, together with advice and guidance on furtherlearning14.
« Effectiveness of the teaching of English in the European Union » is a transnationalproject supported by the Socrates programme and conducted within the Europeannetwork of policy makers for the evaluation of education systems which, wasconducted in 1997 in France, Sweden and Spain is to be repeated in 2002. The
14 www.DIALANG.org

30
European Network is repeating this project in 2003 with an additional 5 countries(Norway, Finland, Netherlands, Germany, Denmark) participating. The projectinvolves administering a common instrument in the 8 countries to test 15/16 year olds'written comprehension, written expression and oral comprehension in the Englishlanguage. As the original test has been retained, some degree of comparison over timewill be possible for the three original countries. This will be the first time thatcomparative data on foreign language achievements will be available on so manycountries in Europe.
While the above examples show how European methodology is attempting to developother promising methodological work in the field includes the PISA survey in whichforeign language reading skills (as yet only in English as a foreign language) havebeen provided for.

31
Indicator: Learning-to-learn SkillsDefinition: Percentage of students per country in the lower 25% of overall
performance on the PISA “elaboration strategies” indexData source: OECD: Programme on International Student Assessment, 2000
Learning-to-learn skills were mentioned in the chapter on new skills for the learningsociety and were featured among the principle areas of “basic competencies”. Themost important of these competencies is "the ability to learn - maintaining curiosityand interest in new developments and skills - without which lifelong learning cannotexist". The importance of learning-to-learn in all aspects of societal participationthroughout life is well established. Learning how to learn, adapt to change and makesense of vast information flows are now generic skills that everyone should possess.Employers are increasingly demanding the ability to learn and acquire new skillsrapidly and to adapt to new challenges and situations.
Learners should have at their disposal a set of meta-skills which enable them tosuccessfully construct and shape their own learning process. While there is broadconsensus regarding the role and the value of learning–to-learn skills a review of thescientific literature and the available (comparative) data tells us that the situation is farfrom satisfactory.
Probably the largest and best-developed research in this field is a transnational projectled by Finland (with some support from the Commission under the Socrates Iprogramme), "Learning-to-learn as part of Cross Curriculum Competencies”. Finnishresearchers, in close co-operation with schools and educational authorities in Finland,achieved a consensus on how to define learning-to-learn-skills, and they have alsodeveloped a large and impressive set of assessment instruments. These instrumentshave been extensively tested and developed over the last few years to adapt it for usewith different age cohorts and reduce the volume of the battery. The test package isnow available for the three levels: 6th graders (the 12 year-old age cohort); 9th graders(the 15 year-old age cohort) and; the 17+ cohort. An additional version for the 10year-old cohort is under development. Although this commendable Finnish nationaleffort will most probably exert a strong influence on future European andinternational work in this area, it cannot yet be directly used to deliver indicators at aEuropean level. Co-operation between several European countries has been initiatedto develop indicators on the basis of the Finnish experiences but has not yet beenconcluded.
An examination of existing data reveals the extent of the deficit in the availability ofreliable data on the learning-to-learn concept at a European level. The most tangibleinformation can once again be distilled from the PISA data. Beyond the assessment ofthe PISA domains of reading literacy, mathematical literacy and scientific literacy,PISA also had an option dealing with cross-curricular competencies, with a focus on
4. Learning-to-Learn Skills
32
self-regulated learning. We propose an indicator based on the students’ elaborationstrategies, which is based on data from the students’ self-reports of their learningstrategies.
The PISA index on “elaboration strategies” comprised from this information (OECD,2001) proved to be successful in explaining variations on the PISA achievementscales.
An indicator based on the elaboration index provides an adequate starting point forassessing the quality of learning-to-learn skills. An indicator based on the percentageof students scoring in the lowest 25% of overall OECD performance in elaborationstrategies is proposed
Table 8The percentage of students per country in the lower 25% of overall OECDperformance in European countries and some selected reference countries on thePISA elaboration index
Source: OECD/PISA, 2001.

33
Table 8: Elaboration index: Percentage of students per country in the lower 25%of overall OECD performance
0 10 20 30 40 50
Turkey
Switzerland
Sweden
Spain
Slovenia
Slovakia
Romania
Portugal
Poland
Norway
Netherlands
Malta
Macedonia
Luxembourg
Lithuania
Liechtenstein
Latvia
Italy
Ireland
Iceland
Hungary
Greece
Germany
France
Finland
Estonia
Denmark
Czech Republic
Cyprus
Croatia
Bulgaria
Bosnia-Herzegovina
Belgium (Fl)
Austria
Australia
Canada
Japan
Korea
United Kingdom
United States

34
When the available data is compared with the ambitions and expectationsaccompanying the assessment of learning-to-learn skills, it is evident that substantialprogress still needs to be made in this domain.

35
Indicator: Active Citizenship, Cultural and Social SkillsDefinition: Qualitative indicator on civic knowledge, civic engagement and
civic attitudes across countries from the IEA studyData source: Different sources
The promotion of active citizenship is part of the learning process. In activecitizenship the focus is on whether and how people participate in all spheres of socialand economic life, the opportunities and risks they face in trying to do so, and theextent to which they therefore feel that they belong to and have a fair say in thesociety in which they live.
Here, as with data elsewhere in the report, the subjects of the survey were youngpeople: The IEA study on “Citizenship and Education in Twenty-Eight Countries:Civic Knowledge and Engagement at Age Fourteen”.
The goal of the IEA Civic Education Study is “to identify and examine in acomparative framework the ways in which young people are prepared to undertaketheir role as citizens in democracies”. Besides formal curricular aspects the focus is on“participation outside the school, especially in the community’’. The IEA studyaddresses both knowledge and attitudes, and reports on a wide range of issues. In thischapter we present the results of a study results of students’ civic knowledge and theirability to interpret “civic-related information”.
The study framework covers three different “core international domains”:1) Democracy, Democratic Institutions and Citizenship,2) National Identity, Regional and International Relationships and,3) Social Cohesion and Diversity.
The focus of the study was on the first domain. For each of these domains differenttypes of items have been developed. Items “assessing knowledge of content” and the“skills in interpretation of material with civic or political content” comprised the testbattery used in the study. The scores in the table reflect performances on the twoscales “civic content knowledge” and “interpretative skills”. High scores correspondto a good level of knowledge or good interpretative skills. More information on theconstruction of the total civic knowledge scale and the two sub-scales can be found inthe study report (IEA, 2001).
A quality indicator providing insight into how well the young generation is preparedfor the lifelong learning process is integral to the design, running, monitoring andevaluation of lifelong learning activities. The IEA study shows clearly that many ofthe young students’ skills and attitudes in this domain are shaped by the oldergeneration’s attitudes and behaviour, and more specifically, by their parents’ attitudes
5. Active Citizenship, Cultural and Social Skills

36
and behaviour and as such may, to some extent, reflect the attitudes of adults as well(IEA, 2001).
The following table gives an overview of students’ knowledge and interpretativeskills, together with combined score for the two aspects (IEA, 2001).
Table 9Civic knowledge and interpretative skills
ContentKnowledge
Interpretative Skills Total CivicKnowledge
Poland 112 106 111Finland 108 110 109Cyprus 108 108 108Greece 109 105 108Hong Kong 108 104 107United States 102 114 106Italy 105 105 105Slovak Republic 107 103 105Norway 103 103 103Czech Republic 103 102 103Australia 99 107 102Hungary 102 101 102Slovenia 102 99 101Denmark 100 100 100Germany 99 101 100Russian Federation 102 96 100England 96 105 99Sweden 97 102 99Switzerland 96 102 98Bulgaria 99 95 98Portugal 97 95 96Belgium (French) 94 96 95Estonia 94 95 94Lithuania 94 93 94Romania 93 90 92Latvia 92 92 92Chile 89 88 88Colombia 89 84 86
Source: IEA, 2001
The table shows interesting differences between the two aspects: content knowledgeand interpretative skills.
A comparison of students from the USA and the Russian Federation may serve as anexample: while both have the same scores for civic knowledge, there is a largedifference between students from these two countries in terms of their interpretativeskills when dealing with civic-related information. Although this result is not

37
necessarily surprising, given the extremely different political systems of the past, itshows how this type of information may be used to design appropriate measures.The following table (Table 10.1 is taken directly from the IEA Civic Education Study)gives a more qualitative overview of all the aspects assessed in the IEA study:

38

39
Out of the nine European Union countries for which data can be found in the tableabove, seven of them (Bfr, DK, Eng, Fin, DE, I, S) have levels of “expectedparticipation in political activities” significantly lower than the international meanaccording to the survey. Similarly, it can interpreted as showing that five MemberStates have levels of “interpretative skills” which are significantly above the mean(Eng, FIN, GR, I, S).
A completely different type of information on citizenship is derived fromparticipation rates in elections. While the IEA data offers information about the extentof (young) people’s civic knowledge and how capable they are of adequately applyingthis knowledge, election participation offers a concrete behavioural measure. Thefollowing table shows participation rates in national elections for fifteen Europeancountries from 1990 to date.
Table 11Ranking of average turnout in the 1990's parliamentary elections in MemberStatesCountry (no. of elections)* Vote/Reg%
Belgium (3) 91.5%Luxembourg (2) 87.8%Italy (3) 85.5%Sweden (3) 85.4%Denmark (3) 84.3%Austria (4) 83.8%Germany (3) 79.9%Greece (2) 79.7%Spain (2) 77.6%Netherlands (2) 76.0%United Kingdom (2) 74.7%France (2) 68.5%Finland (3) 67.4%Ireland (2) 67.3%Portugal (3) 65.2%*Included in the average are only those elections for which there are statistics available on therespective country page/table.
Source: The International Institute for Democracy and Electoral Assistance
It should of course be noted that participation in some countries is a civil obligation(e.g. Belgium) whereas in others it constitutes a civil right. The participation rates inparliamentary elections in European countries vary widely, as the table shows.

40
Fifteen Quality Indicators ofLifelong Learning
Area B: Access and Participation

41
Access and participation relate to the opportunities and chances, obstacles and barriersthat confront individuals along their lifelong learning pathway. While access isconcerned mainly with structural and logistical questions, participation encompassesmotivational issues, as well as financial and cultural ones, which must also beconsidered when assessing the success of a system or of a process.
While information about access and participation in formal and non-formal settings isvery often available at a national level, there is a considerable need for harmonisationof the data in this field. Some promising efforts can be identified from the formal andnon-formal education sectors, but the field of informal learning has thus far yieldedonly a very limited amount of tangible information.15
15 Initiatives in this field include, for instance :
- the ad hoc module on lifelong learning to be included in the EU-Labour Force Survey- the EU Time – use survey- the EU Adult Education Survey planned for 2006
Area B : Access and Participation

42
Indicator: Access to Lifelong LearningDefinition: Not availableData Source: Not available
Lifelong learning requires a dual approach: making what is already on offer morevisible, flexible, integrated and effective on the one hand, while also developing newlearning processes, products and environments on the other.
Strategies aimed at guaranteeing widespread and equal access to learning need to gofar beyond legalistic notions of equality. Specific groups need to be targeted. Non-traditional forms of learning and the competencies acquired through them need to bevalued and recognised. All learners also need to be able to access the formaleducation system at any stage of life.
The access issue lies at the core of any lifelong learning strategy. One of the mostchallenging policy tasks will be to create a lifelong learning environment which isopen to as large a proportion of the population as possible. Once lifelong learningbecomes an operational possibility for all citizens, the quality of access to learningopportunities will be an elementary indicator of the overall quality of lifelong learningin a society.
However, in society as it is at present, access to learning opportunities is limited bynumerous factors. Both formal and non-formal education suffer access limitationswhich can usually be attributed to the institutional framework to which they belong.At an institutional level, the rationale underlying access policies of companies willdiffer from the political rationale of public institutions. In addition to the institutionalimpediments to access, factors inhibiting access to informal learning opportunities arefrequently related to the learners themselves. Learners may lack the required skills(e.g. language or social skills) to make use of opportunities otherwise within reach, orthey may not have the required technical equipment to access certain opportunities(e.g. the Internet). At the level of the individual access can also be hampered by a lackof information or by a lack of financial support. This brief and certainly non-exhaustive enumeration of the different facets of the access issue demonstrates why ithas not been possible to identify a significant indicator on access, or even a plausibleproxy, for the purpose of this report.
Potential indicators to be developed in this area should pertain to the possibility ofnon-traditional students accessing the formal system, to the linkages and pathwaysbetween different learning systems and routes, and to the provision of mechanisms foraccreditation and certification. More attention should also be given to accessindicators in the domain of non-formal education and training and to the developmentof meaningful indicators of access to informal learning opportunities. In all cases it is
6. Access to Lifelong Learning

43
of crucial importance to have time series data at our disposal in order to performeffective monitoring over time.
Further work is required in order to develop and agree upon policy-relevant indicatorsin this field which is so central to lifelong learning.

44
Indicator: Participation in Lifelong LearningDefinition: Participation in education and training of those aged 25 to 64Data source: Eurostat: Labour Force Survey, 2001
While access to lifelong learning is a necessary precondition to any learning activity,it does not necessarily follow that people will use the learning opportunities they canaccess. Numerous factors determine a person’s decision whether or not to participatein a learning activity. From a policy perspective, it must be a major goal to increasethe actual participation levels in lifelong learning. While a mere increase in thequantity of participation alone is, most probably not sufficient, high participation ratesnonetheless remain a prerequisite for a high quality lifelong learning process.
When measuring participation it becomes apparent that participation in the variousforms of learning is a complex issue that can only be partially explained by someexisting indicators referring to time invested in learning and early school leavingrates. In this context, the examination of attitudes and patterns of participation are ofparamount importance.
Participation in formal education can be directly influenced by either public or privateinstitutions. Companies may also control participation in continuous training to alarge extent. However, participation in non-formal education and informal learningactivities could be encouraged by direct or indirect incentives.
At the moment there is a lack of reliable data on participation in non-formal learningand virtually no data on informal learning. We can however refer to data onparticipation in adult (25–64 year-olds) education and training obtained from theLabour Force Survey (LFS) and compare these data to the rates of early schoolleavers.
Table 12Percentage of population, aged 25-54, participating in education and trainingand share of the population aged 18-24 with only lower secondary education andnot in education or training16
Source: EUROSTAT, Labour force survey.17
16 This information corresponds to the Structural Indicators ‘Life-long learning (adult participation in
education and training)’ and ‘Early school-leavers not in further education or training’.17 Due to particular socio-economic and geographical situation of Luxembourg (notably the high
proportion of students enrolled in higher education outside the country and the very high percentageof non residents working in Luxembourg), the data of this indicator are not comparable with those ofother countries.
7. Participation in Lifelong Learning

45
Participation in education and training (25-64 year-olds) & Early school leavers (18-24y)
0 10 20 30 40 50
Albania
Austria
Belgium
Bosnia-Herzegovina
Bulgaria
Croatia
Cyprus
Czech Republic
Denmark
Estonia
Finland
France
Germany
Greece
Hungary
Iceland
Ireland
Italy
Latvia
Liechtenstein
Lithuania
Luxembourg
Macedonia
Malta
Netherlands
Norway
Poland
Portugal
Romania
Slovakia
Slovenia
Spain
Sweden
Switzerland
United Kingdom
Turkey
%
Early school leaversParticipation
46
N.B. Data from the UK on early school leavers are not considered by Eurostat to becomparable to those from other countries.
High rates of early school leavers coupled with rather low levels of participation ofadults in continuing education and training should be a clear signal of the necessity toimprove the quality of lifelong learning. Some countries are making significantattempts to ‘counteract’ high levels of early school leavers with relatively high levelsof adult participation in education and training. The indicator above shows that this isclearly the case in Iceland and the Netherlands. Countries like Finland, Sweden,Denmark and Switzerland all have relatively high levels of adult participation andrelatively low of drop out rates – surely a solid foundation from which to developsuccessful lifelong learning strategies.
Once more, it should be stressed that successful participation in adult education andtraining is largely dependent upon successful participation in initial education. Takentogether with the fact that high educational attainment has a positive impact onemployment rates, the importance of looking at education and training from a lifelonglearning perspective becomes accentuated. Indeed, available evidence suggests thatindividuals without adequate qualifications are four times more likely to beunemployed (OECD, EAG 2001). Hence, preventing and combating unemploymentand social exclusion begins with increasing the quality of education and trainingprovision, including work-based learning.

47
Fifteen Quality Indicators ofLifelong Learning
Area C: Resources for Lifelong Learning

48
As in many other contexts, the quantity of resources spent on lifelong learning, andabove all, the adequacy and the quality of these resources will be a critical factor indetermining the success of lifelong learning. Indeed, OECD has described lifelonglearning as an ‘affordable investment’19.
At present, the relationship between resources and the quality of lifelong learningremains unclear. Most models rely heavily upon experience in the field of formaleducation. While this is certainly a good starting point, there is a definite need forinformation more closely tailored to the complex field of lifelong learning, includingnon-formal education and informal learning.
In this area the same logic is followed as in previous ones with priority being given toexisting data sources in order to begin wherever possible with quantitative indicators.Nevertheless, we retain the vision of indicators covering broad and policy relevantareas, and refer to national experiences to point to potential solutions for the whole ofEurope.
In contrast with formal education in a school setting, the sources of investmentimportant in a lifelong learning setting are much more diverse. Information andCommunication Technologies must be considered from different perspectives: asystems’ (e.g.: country, company) perspective, an individual, learner perspective.Finally, the mere definition of what an “educator” or “learning facilitator” alone is inthe different areas of lifelong learning (formal, non-formal, informal) is a matter forconsiderable debate.
In this report we try to find a pragmatic solution by presenting indicators whichalthough they do not cover in a satisfactory way, the resource areas proposed, aresufficiently concrete and meaningful to serve as a starting point for a long-termanalysis of the adequacy of resources for a lifelong learning process.
19 See for instance « Economics and finance of lifelong learning », OECD, 2001.
Area C : Resources for Lifelong Learning

49
Indicator: Investment in Lifelong LearningDefinition: Total public expenditure on education as a percentage of GDPData source: Eurostat: Structural Indicator
The Lisbon conclusions call for a substantial annual increase in per capita investmentin human resources, pointing out that the future of the European economy is largelydependent upon the skills of its citizens, and these in turn need the continuousupdating which is characteristic of the knowledge society. On the other hand, theeducation and training sector must use financial constraints to ensure that resourcesare distributed and used as efficiently as possible and to achieve the highest levels ofquality.
Investment in lifelong learning is a particularly complex issue. It is important todifferentiate between different types of investment. At least three different typesshould be taken into account:
1) Public investment2) Companies' investment3) Private investment
Keeping in mind that this is a report on quality indicators of lifelong learning thequestion of return on investment arises immediately. A recent OECD report points tothe growing evidence that learning and investment in human capital are associated notjust with increased GDP, but also with greater civic participation, higher reportedwell-being and lower criminality (OECD, 1998).
Although a certain quantity of investment is a necessary precondition to successfullearning it is known, from different sources, that a mere increase in investment alonedoes not necessarily increase quality. At the level of formal education, a reanalysis ofthe TIMSS-data (Wößmann, 2001) shows that more costly education systems do notnecessarily perform better in terms of student outcomes. The PISA 2000 results alsoshow that caution should be applied when examining the relationship betweenspending on, and quality of, provision. Beyond the level of investment, the timing ofinvestment in education may also have a significant impact. From the point-of-viewof private investment an empirical study by Wolter and Weber (1999), based on Swissdata, shows that an investment in education which happens too late may yieldinsignificant or even negative returns on investment.
This brief description already shows how difficult it will be to treat the question ofinvestment in lifelong learning appropriately and how important it will be to havereliable data at our disposal. Consequently, caution should be exercised wheninterpreting investment as a quality indicator for lifelong learning. A sustainablestrategy in this area should build on established descriptors and be continuouslyrefined, above all, by linking further information to the investment information as
8. Investment in Lifelong Learning

50
well as including information on whether strategies being developed adequatelyincorporate investment strategies. As well as the existence and adequacy of publicfunding strategies, information on the existence of private funding strategies isequally important, these include the existence of incentives for employers, individualsand households to increase investment in lifelong learning. Data on privatecompanies’ and household investment are available though the data was notconsidered sufficiently comparable to be included here.
In this report we use an existing structural indicator, namely the total publicexpenditure on education as a percentage of GDP. Total public expenditure oneducation includes direct public expenditure on educational institutions as well aspublic subsidies to other private entities for education (e.g. subsidies to companies orlabour market organisations that operate apprenticeship programmes). It also includespublic subsidies to households (e.g. scholarships and loans to students for tuition feesand student living costs), including those not attributable to household payments foreducational institutions, such as subsidies for student living costs (Eurostat, 2002 ;idem for more details on the methodology).
Table 13Total public expenditure on education as a percentage of GDP
Source: Eurostat20
20. EU15: are calculated only when data for 9 or more countries are available
France: Educational expenditure figures do not include DOM (Overseas Departments).All countries: Data for 2000 and 2001 are forecastUK: Estimates, based on data for UK financial years which run from 1 April to 31 MarchBE, DK, DE: change in coverage in 1999

51
*(p)21 1991 1992 1993 1994 1995 1996 1997 1998 1999 2000 2001EU 5,68% 5,71% 5,52% 5,40% 5,44% 5,44% 5,34% 5,35% 5,23% 5,18% 5,03%
Belgium : : : : 5,19% 5,64% : :
Denmark : : : : 7,67% 8,09% 7,94% 8,22% 8,00% : :
Germany : : : : 4,71% 4,80% 4,73% 4,66% : : :
Greece : : 2,66% 3,04% 2,87% 3,07% 3,44% 3,48% 3,66% 3,51% 3,52%
Spain : 4,77% 4,89% 4,71% 4,66% 4,68% 4,54% 4,49% 4,50% 4,46% 4,45%
France 5,35% 5,59% 5,93% 5,93% 5,97% 5,95% 5,97% 5,89% 5,89% 5,83% 5,75%
Ireland 5,95% 5,97% 6,10% 6,13% 5,74% 5,92% 5,74% 5,29% 5,00% 4,78% :
Italy 5,38% 5,39% 5,43% 5,04% 4,87% 4,86% 4,57% 4,55% 4,55% 4,62% 4,49%
Luxembourg : : : : 4,26% 4,00% 4,07% : : : :
Netherlands 5,09% 5,37% 5,17% 5,07% 5,01% 4,96% 4,79% 4,87% 4,78% 4,93% 4,91%
Austria : : : : 6,53% 6,41% 6,30% 6,28% 6,31% : :
Portugal : : : : 5,37% 5,53% 5,59% 5,60% 5,73% : :
Finland 7,26% 7,29% 6,88% 6,73% 6,87% 6,96% 6,47% 6,24% 6,19% 5,97% :
Sweden : : 7,61% 7,47% 7,46% 7,62% 7,89% 7,98% 7,74% 8,39% 8,33%
United Kingdom 4,96% 5,16% 5,21% 5,16% 5,04% 4,84% 4,66% 4,58% 4,60% 4,86% 4,76%
Iceland : : : : 4,88% 5,32% 5,41% 5,98% : : :
Norway 7,92% 8,02% 7,97% 7,83% 7,15% 7,00% 7,65% 7,68% 7,36% 6,60%
Bulgaria : : : : : : : : : : :
Czech Republic : : : : : : : : 4,4 %(p)
: :
Estonia : : : : : : : : 7,4%(p)
: :
Latvia : : : : : : : : 6,3%(p)
: :
Lithuania : : : : : : : : 6,5%(p)
: :
Hungary : : : : : : : : 6,5%(p)
: :
Poland : : : : : : : : 5,0%(p)
: :
Romania : : : : : : : : 3,4%(p)
: :
Slovenia : : : : : : : : : : :
Slovakia : : : : : : : : 4,3%(p)
: :
Cyprus : : : : : : : : 5,7%(p)
: :
Malta : : : : : : : : 4,7%(p)
: :
21 (p) PROVISIONAL as the figures are still being validated

52
This table (13) shows that levels of investment differ substantially between countries.While this indicator conveys an incomplete picture it does however reflect thefinancial commitment made by governments to education and training. It does notinclude the private expenditure of firms and households. Public expenditure can beconsidered as pointing to the prerequisites for successful lifelong learning. A "criticalmass" in terms of investment has to be reached in order to maintain a successfullifelong learning process. It is the responsibility of countries themselves to implementthe appropriate investment strategies in a way that takes into account the specificitiesof their own national context.

53
Indicator: Educators22 and LearningDefinition: Percentage of teachers having received education and training
during the previous four weeksData source: Eurostat: Labour Force Survey, 2002
Although the role and impact of teachers in a formal education setting has been thesubject of numerous studies and research projects, investigations in this area have yetto yield conclusive results. In such circumstances, it is not surprising that thediscussion about the role and, related to this role, the quality of teachers, educatorsand other learning facilitators in a lifelong learning setting is just beginning. Mostpeople agree that an "educator" in a lifelong learning context undertakes a morediverse array of tasks than a schoolteacher. These tasks differ depending on the typeand context of learning, the age of the learner, the type and complexity of the learningtask and numerous other factors. Not only do new teaching and learning methodschallenge the traditional roles and responsibilities of teachers, trainers and otherlearning facilitators but there is also a strong need to develop their training to ensurethat they are ready and motivated to face the new challenges, and to promotetolerance and democratic values.
This brief description of the situation makes it clear that it is difficult to isolate onerelevant and meaningful quality indicator for educators. In order to gain an overviewit is appropriate to begin with an indicator related to the initial training of educators.Availability of data limits this effort to the:
Percentage of teachers and teaching associates having received training
Participants in the Labour Force Survey (LFS) were asked whether they had receivededucation and training during the previous four weeks. The following table (14)shows the results for "teaching professionals" or "teaching associate professionals" (asdefined in ISCO-88) in member countries.
22 ‘Educator’ as used in the context of this report includes teachers, trainers and other learning
facilitators.
9. Educators and Learning

54
Table 14Percentage of teachers having received education and training during theprevious four weeks in Member States
The next table shows the same information for the candidate countries.
Percentage of teachers having received educationor training during previous four weeks
0% 10 20 30 40 50
Austria
Belgium
Denmark
Finnland
France
Germany
Greece
Ireland
Italy
Luxembourg
Netherlands
Portugal
Spain
Sweden
United Kingdom

55
Table 15Percentage of teachers having received education and training during theprevious four weeks in candidate countries
The tables show a relatively high level of ongoing training for teachers in mostcountries and especially in EU member countries. It is however necessary to get moredetailed information on the type and the length of the training. The LFS data alsoshow for example, divergent trends between the different types of teachingprofessionals (e.g. primary vs. secondary education teaching professionals, specialeducation teaching professionals, teaching associate professionals). Such informationis certainly necessary in order to accurately plan training for educators. Moreover,information on the certification related to different types of training for educators isrequired. Again, this is another area where significant work on developing indicatorswill have to be undertaken.
Percentage of teachers having received educationor training during previous four weeks
0% 10 20 30 40 50 60 70
BGCHCYCZEEHUISLTLVNOPLSI
SK

56
Indicator: ICT in LearningDefinition: Percentage of households who have Internet accessData source: Flash Eurobarometer 112, November 2001
The report on the concrete future objectives of education and training systems statesthat "the developing use of ICT within society has meant a revolution in the wayschools, training institutions and other learning centres could work, as indeed it haschanged the way in which very many people in Europe work. ICT is also of increasingimportance in open learning environments and in virtual teaching. As far as theeducation and training systems are concerned, the ability to respond to the rapiddevelopment and the need to stay competitive will continue to play an important role.In addition, flexibility will be needed for individuals to acquire ICT skills throughouttheir lives."
This quotation points to the multiple roles that information and communicationtechnologies have in the context of lifelong learning. In this chapter we focus on ICTas a resource. Computers as a tool both for learning activities (e.g. courseware) andfor learning assistance (word processors, spreadsheets) have a well-established placein today's education and training systems. In the context of lifelong learning anotheraspect becomes increasingly important. As an ever-increasing amount of informationis provided through the Internet it is becoming the primary mode of delivery forlearning material. Together with the ambition to bring "learning closer to the home, toprovide lifelong learning opportunities as close to learners as possible, in their owncommunities and supported through ICT-based facilities wherever appropriate", onecan imagine numerous indicators describing ICT as a resource for lifelong learning:
- percentage of households with at least one computer,- percentage of households with at least one phone line,- percentage of households with Internet access,- percentage of households with potential to broadband Internet access,- percentage of school classrooms with a certain ICT equipment,
In line with the selection criteria described in the introduction we focus in this sectionon one indicator, the level of Internet access defined as:
Percentage of households who have Internet access
The source for this indicator is the Flash Eurobarometer survey on "Internet and thePublic at Large", produced by EOS Gallup Europe upon the request of the EuropeanCommission (DG: Information Society). Data was obtained from a telephone pollinvolving 2000 residents in each country participating in the survey (4000 in the caseof Germany).
10. ICT in Learning

57
Table 16 Percentage of households who have Internet
Basis: All EUcountries
October 2000 June 2001 November 2001
Belgium 29 35 36Denmark 52 59 59Germany 27 38 38Greece 12 12 10Spain 16 23 25France 19 26 30Ireland 36 46 48Italy 24 33 34Luxembourg 36 44 43Netherlands 55 59 64Austria 38 46 47Portugal 18 23 26Finland 44 48 50Sweden 54 64 61United Kingdom 41 53 49European Union–all
28 36 38
Norway 62 58Iceland - 68 70
Source: Flash Eurobarometer 112, November 2001
Again, this single indicator cannot and does not fully describe the use of ICT as aresource for high quality lifelong learning in different countries. Furthermore,depending on demographic factors the role of Internet access at home may be ofvariable importance.
Singapore's master plan on ICT aims at a ratio of one computer, with Internet access,per two people. The major implementation strategy aims at providing these computersin libraries and community centres. While such a strategy can be expected to besuccessful in a small region with a high-density population, Internet access at homeseems to be a must for bigger countries with a more geographically dispersedpopulation. Thus, it will be very important to supplement this indicator with otherindicators and national information.
Besides the indicator on household access to the Internet the report provides moredetailed information which is also useful in the context of lifelong learning. Thesurvey found for example, that:
� women access the Internet less often than men,� elderly (55 and above) people appear more remote than other generations,� access to the Internet increases sharply with level of education,� the Internet appears to be more common in large cities, probably because
technical capacities are more favourable and,

58
� the more affluent section of society (liberal professions and executive officers), aswell as students, access the Internet more often.
In the context of lifelong learning this information clearly points out that ICTresources may be least common among those who need them most. If this is indeedthe case then low levels of access to the Internet together with, for example lack ofguidance, may prove to be a serious obstacle to successful lifelong learning for everycitizen.
Substantial efforts have been made in the past decade to set up programs for e.g. (re-)integrating women into employment, to develop specific measures (employment,training) for the elderly and to develop specific interventions for the rural populationfor example. A closer look at the different programs shows that all of them containimportant education and training aspects. If the population targeted by these measuressuffers from a lack of Internet connection then these people might be seriouslydisadvantaged in a lifelong learning context. As a result concerted efforts must bemade to improve the access these people have to the Internet. This is far more than atechnical issue: information, education and training as well as specifically designedmarketing campaigns will be necessary to overcome the problem.
Apart from underlining the need for availability of high quality ICT equipment, thedetailed programme on the follow-up of the objectives of education and trainingsystems in Europe focuses on the use of ICT and the quality of ICT teaching inparticular. On this basis therefore the report presents an indicative list of threeindicators:
- Percentage of teachers that have been trained in ICT use in schools,- Percentage of pupils and students using ICT in their studies,- Percentage of learning sessions in teaching and training institutions in
which ICT is used.
These considerations are in line with the blueprint for action: “eLearning actionplan”23 which is part of the comprehensive eEurope Action Plan adopted by theCommission in June 2000 24. The eLearning action plan sets among other objectivesto “achieve a ratio of 5-15 pupils per multimedia computer by 2004”. The planfurthermore supports the availability of support services and educational resources onthe Internet together with on-line learning platforms for teachers, pupils and parentsas well as the integration of new learning methods based on ICT.
23 Communication from the Commission “eLearning Action Plan: Designing tomorrows education”
COM(2001) 172 final 28.03.200124 The most recent strategic document on the eEurope action plan was adopted by the Commission the
28th of June 2002. Communication from the Commission “eEurope 2005: An Information society forall” COM(2002)263 fnal 28.05.2002

59
Fifteen Quality Indicatorsof Lifelong Learning
Area D: Strategies and System Development

60
This final section is concerned with the areas of lifelong learning where politicaldecisions (strategies) seek ways to turn the components of lifelong learning into anintegrated and coherent “system” (coherence of supply). Within this framework itshould be possible to assess the outcomes (quality assurance) while the individualshould draw a maximum benefit from his/her learning which would be accredited andcertified, and by receiving appropriate counselling and guidance.
Area D : Strategies and System Development
61
Indicator: Strategies of Lifelong LearningDefinition: Member States’ positions on developing lifelong learning
strategiesData source: European Commission: Joint Employment Report, 2001
There exists a considerable consensus around the recognition that political strategiesat local, regional and national level, aimed at ensuring the effectiveness of lifelonglearning will be a key determinant of sustainable success in the field of lifelonglearning.
Strategies must aim to develop not only a lifelong learning system as such, but alsoaddress issues of equality of opportunity in order to ensure that lifelong learningopportunities are genuinely available to all, especially to those at particular risk ofexclusion such as people on low income, disabled people, ethnic minorities,immigrants etc.
To a certain extent the "system level" indicators in this area are those closest topolitical planning and decision making. It should be noted that reliable indicators tobe used as a tool for decision-making remain a distant prospect at this stage. This isnot surprising given that in a complex and rather new field of work, general strategicand systemic indicators will normally be the last to develop. Hence, our basicapproach for selecting indicators, as applied in other areas, will to a certain extent failwhen applied to this area. Consequently more qualitative information is presented inthis area than in the previous chapters.
The Joint Employment Report 2001 provides an overview of the status of nationalstrategies in the field of lifelong learning. While the lifelong learning concept used inthis report is broader than the one used in the Joint Employment Report, the Reportremains the best indicator of strategies. The report observes that progress has beenmade on lifelong learning with significantly higher profile being given to the issues inthe 2001 National Action Plans (NAPs) and more generally, that it is now anestablished policy priority throughout the European Union. The report concludes thatwhile comprehensive lifelong learning strategies are now in place in about half of theMember States, such strategies remain in the early stages of implementation.Moreover, in the majority of Member States there is still insufficient evidence of co-ordination and synergy between the Ministries concerned.
11. Strategies for Lifelong Learning

Table 17: Member States' positions on developing lifelong learning strategies25
CHARACTERISTICS BE DK DE EL ES FR IRL IT LUX
NL AU PT FIN SW UK
COMPREHENSIVENESS OFSTRATEGIESCompulsory education P A A P P A P A P A P P A A AFormal adult education/training P A P P P P A P P A P P A A AWorkplace/other non-formal/ recognisedprior learning
P A A P P A P P I P P P A A A
Focus on disadvantaged groups P P P A I P P I P P P P A A POverall investment / funding schemes P A P I P P P P P A P P P A PCOHERENCE OF STRATEGIESSystem development(policy needs, planning, targets,implementation, monitoring)
P A P P P A P I P A P P A A P
Partnership working(social partners, public authorities, learningproviders, civil society)
P P A I P P A P P P P P P A A
Cross-cutting aspects(advice/guidance services, education/trainingmobility)
P A P P P A P P P P I I A P A
Notes:A = Adequate. 'Adequate' denotes that a particular criterion is given appropriate priority within both the Member State's strategy and concrete actions.P = Partial. 'Partial' indicates that some attention is given to the criterion in both the strategy and actions or that it given appropriate priority in one or the other.I = Insufficient. 'Insufficient' refers to when the particular criterion is absent from both the strategy and the actions or is given some attention in one or the other
Source: European Commission
25 The assessment is indicative and mainly based on the NAPs 2001, but also on other relevant information available. Further explanations can be found in the Commission Services' Supporting Document tothe Joint Employment Report.

63
Table 17 (previous page) shows that substantial effort still remains to be made withregard to disadvantaged groups. Investment strategies will also require more attentionin the future. Beyond these initial matters of strategy design there remains the issue ofsuccessful strategy implementation which requires effective co-ordination betweendifferent partners and structures, encompassing the whole range of lifewide andlifelong learning ‘providers’, from the formal school system to liberal adult education,to vocational training and to informal settings. The table shows that most countrieshave to improve the involvement and co-ordination of the different partners in theirlifelong learning strategies. Cross-cutting aspects in the implementation of thenational strategies also need to be given more attention.

64
Indicator: Coherence of SupplyDefinition: Not availableData source: Not available
When considering strategies for lifelong learning the coherence of supply becomes acentral issue. By supply we mean the availability of lifelong-lifewide (formal/non-formal/informal) learning opportunities in a given area or country.
At least three different aspects of coherence should be considered:a) coherence of supply in relation to the strategic goals as concretely stated inEuropean/national/regional plans ;b) coherence of supply in relation to (national, regional, local) providers and ;c) coherence of supply in relation to the demand.
Very tentatively, indicators like the following ones could be suggested:
1/ Depending on the objectives in the national strategy plans, a first global indicatorcould be
Percentage of elements in the strategy plans matched by concrete, available supply
This indicator can be easily refined by including different quality constraints toqualify offers and be measured on European national or sub-national levels.
2/ A useful indicator on coherence of supply should also relate the supply to thedemand. We propose to do this for each demand-related strategic element in thenational strategy papers.
Degree of coverage of demand (formal, non-formal, informal) by national strategyplans
It is clear that indicators on the coherence of supply cannot replace a more detailedand sophisticated analysis of the supply chains in any one country or Europe-wide.Nevertheless, such an indicator could point to the most important areas to focus on insuch an analysis.
Please note that one important issue has not been addressed until now: the coherenceover time of a lifelong learning process. In our opinion, it is far too early to tackle thiscomplex matter within the confines of this report. This does not however mean thatthis aspect has a lower priority. In fact, quite the opposite is case. Discussions inschool education have taught us that a well thought out distribution of learningprovision over time is a key factor in successful curriculum development. However,the much more varied nature of lifelong learning, the lack of sufficient research and
12. Coherence of Supply

65
the lack of consensual standards among the EU countries mean that for the moment itis not possible to focus on this dimension.
Indicator: Counselling and GuidanceDefinition: Not availableData source: Not available
Implementing a successful lifelong learning process requires substantial counsellingand guidance for citizens of all ages. Potential learners have to be informed of boththe "what" and the "how", i.e. counselling and guidance has to cover at least theprovision and the modes of delivery. Beyond this, a support and coaching structurefor active learners could be an invaluable instrument for speeding up the learningprocess. Guidance and counselling would therefore, when fully developed in alifelong learning perspective, support people in order to:
- access learning opportunities,- motivate people to learn,- develop individual pathways and,- make successful transitions between the education, training and employment
systems.
Quality indicators for the "counselling and guidance" domain remain to be developed.While a few countries have some information on counselling and guidance activities,it quickly becomes apparent that a common understanding of what should be includedin counselling and guidance is lacking. The same is true when comparing the numberand the type of counselling centres. If there is no consensus on how broad the conceptof counselling and guidance should be, it will be difficult to develop indicators thatguarantee comparability across Europe.
In the field of guidance and counselling the following indicators should beconsidered:
- Target group coverage of guidance and counselling,- Social, economic and learning benefits from counselling and guidance,- Qualifications of guidance and counselling practitioners,- Frequency of in-service training of practitioners.
The Eurydice information collection gives a qualitative overview of the legal situationconcerning guidance and counselling in the different countries and on the institutionsthat are set up to provide counselling and guidance. The participating countries havetaken a wide range of educational and guidance, support and orientation initiatives in
13. Counselling and Guidance

66
education at lower or upper secondary levels. Other initiatives have been set up foracademic, vocational and career guidance.
Coherence between the services of information, guidance and counselling servicesand the availability and quality of adequate training in the field are major challengesfor countries and institutions. In order support these central aspects of a lifelonglearning strategy the European Commission has proposed to set up a “EuropeanGuidance Forum” in co-operation with the Member States.
Indicator: Accreditation and CertificationDefinition: Not availableData source: Not available
One of the most significant structural aspects of lifelong learning is the issue ofcertification and accreditation. Ensuring that learning is visible and appropriatelyrecognised is an integral element of the quality of the services provided by educationand training systems and a core element of a successful lifelong learning process.Beyond the obvious implications for a learner's motivation, effective and transparentaccreditation and certification systems are of crucial importance for any high levelpolitical planning.
The mere existence of accreditation and certification systems says nothing about theirquality, transparency, or fairness and thus the comparability within Europe of anational accreditation and recognition processes. While it may be possible to cater fornon-formal education within a traditional certification framework, the recognition ofskills and competencies acquired in an informal learning setting must be processedthrough an assessment of both the learning process and the learning outcomes. Unlikein previous chapters, we have been unable to define a meaningfulaccreditation/certification indicator. An indicator on recognition in an informallearning setting requires information about the individual learners, their individuallearning outcomes and the transformation process leading to a formal recognition oftheir competencies.
Some national initiatives point the way to achieving a more harmonised Europeanapproach. The Norwegian approach as well as the Scottish, Irish, French andPortuguese policies may serve as examples:
"The Norwegian authorities have at the moment an ongoing process ondocumentation of non-formal and informal learning. One objective is to set up anational system for the documentation and recognition of non-formal and informallearning that has legitimacy in both the workplace and the education system. Non-formal and informal learning may be acquired through work in Norway or abroad or
14. Accreditation and Certification

67
through active participation in society, organisations or other voluntary activities.Such learning is accepted as equivalent to formal learning, even if it is not identical tothe requirements stipulated in curricula and public examinations" (communication bythe Norwegian Ministry of Education and Research).
In order to reach this goal the Norwegian authorities give particular attention to thedocumentation of non-formal and informal learning. "There are ongoing projects ondeveloping a system for documentation of non-formal and informal learning inworking life. An important part of the work is to develop and establish a scheme fordocumenting non-formal learning attained through paid and unpaid employment,organisational involvement, organised training etc. This documentation shall havelegitimacy and a user-value in relation to the workplace/the exercising of one’sprofession, the education system and/or organisational activities" (communication bythe Norwegian Ministry of Education and Research).
While a transparent and standardised system of documentation for non-formal andinformal learning is the prerequisite for further work, it is not a sufficient conditionfor a successful accreditation and certification process. If such documentation is tobecome a reality, the assessment of the learning process and the learning outcomeshas to be transparent and standardised throughout Europe. The Irish and Scottishinitiatives provide an example of how to proceed at a European level.
Both initiatives focus on the assessment of qualifications/learning outcomes within anexplicit framework.
The Scottish Credit and Qualifications Framework (SCQF) was introduced in 2001 toprovide a framework allowing comparison of different qualifications. The frameworkhas a scale that ranges from basic level to post-graduate level. Qualifications gainedin different ways, for example, at a university/college or in the workplace are placedon the scale at specific points. Two measures are used to place qualifications on theframework. These are the levels of outcomes of learning and the volume of theseoutcomes. They are described in terms of SCOTCAT points, for example, 15 points atlevel 2" (communicated by the Scottish HM Inspector of Education).
In Ireland a new framework is under development, which "sets out the principles andprocess guidelines" which will underpin the work of the National QualificationsAuthority of Ireland
"Key policy considerations under the new framework are to provide for a modularflexible system based on defined learning outcomes irrespective of the learning siteand catering inclusively for both the formal and informal sectors, to ensurestreamlined progression pathways to higher levels of education and training, toprovide mechanisms for accreditation of prior learning and work based learning, andto provide for the recognition of learning in all its contexts: knowledge, skills andcompetencies within a personal, civic, social and employment related perspective"(communicated by the Irish Office of the Inspectorate Department of Education andScience).
Portugal has recently developed the ‘National System for Recognising, Validating andCertifying Competencies’ (RVCC System) (Decree no. 1083-A/2001 of September 5th

68
– Ministry of Education and Ministry of Work and Solidarity) designed to formallyassess and recognise competencies and knowledge informally acquired. Open to everycitizen over 18, it targets in particular people with less formal schooling and theworking population, employed and unemployed alike. By formally acknowledging thecompetencies and know-how attained in diverse contexts over one’s life experience,the RVCC System aims at promoting and facilitating individual learning and trainingroutes within a broad lifelong learning perspective.
An example from France, ‘Validation des acquis professionnels (VAP) et Validationdes acquis de l'expérience (VAE)’, shows how accreditation mechanisms can beadapted to meet the demands of lifelong learning. A recent Act of Parliament (17th
January 2002) extended the possibilities, given by a previous piece of legislation, topeople with work experience to enrol for a course leading to a degree or diploma(secondary or higher education level). On the basis of an examination of thecandidates’ previous work experience or simply of the candidates’ experience, a boardof examiners may award credits for the relevant qualification. Candidates are allowedto enrol for the corresponding course even if they do not possess the formalqualifications normally required. The numbers of people who benefited from thischange increased by 20% between 1999 and 2000.
These national initiatives point to two crucial aspects of future European qualityindicators: they will have to describe the extent to which accreditation followstransparent and standardised guidelines, and to which the actual assessmentcomponent fits a European framework of qualifications.
Indicator: Quality AssuranceDefinition: Not availableData source: Not available
Quality assurance is an essential part of an effective education and training system.The techniques that enable quality to be measured are available, though not allcountries have the same experience of their use in education and training. Theintroduction of quality assurance mechanisms requires an investment in the training ofthose concerned and their application leads to an increase in the quality, not only ofthe administration involved in delivering education and training, but also in thequality of the learning experience provided.
It is beyond the scope of this report to give a theoretical definition of the term"quality" which would be acceptable to all European countries. Nevertheless, someattributes of the concept of quality of lifelong learning are widely accepted and thiswill make it possible to define indicators for quality assurance in the future.
15. Quality Assurance

69
Quality relates to values or standards that have been elaborated and agreed upon bypartners who have a shared concern in the quality of lifelong learning. In the contextof lifelong learning these partners are the European countries that want to share acommon standard for evaluating their work in the field of lifelong learning. Althougha closer look at the previous areas reveals that the areas and indicators chosenimplicitly define a quality concept it seems to be to early to develop a qualityassurance indicator based on this information. Indeed, the quality indicators presentedin this report describe the situation from an international level, where comparability isan important aspect. The quality indicators and the whole report do not reflect the -sometimes substantial – national efforts in the domain of quality management andquality assurance. Given this situation, we limit ourselves to describing someimportant aspects of quality assurance that will guide a future development of qualityassurance.
An established rationale for quality assurance very often looks at both the quality ofthe product and the process that led to this product. Following this logic, the skillsand competencies indicators presented in area A could be used as quality assuranceindicators at a product level. One major advantage of such an approach is that suchoutcome indicators reflect the impact of formal, non-formal and informal learning. Itis obvious that quality assurance at a national level will often go far beyond the scopeof the international indicators. National learning achievement tests and evaluationsmade by independent governmental or private institutions are important instrumentsfor this type of quality assurance.
At a process level too, some of the indicators already presented can be used as processquality assurance indicators, e.g. the coherence of supply indicator, the accessindicator, or to a certain extent the cost indicator. Again powerful instruments forquality assurance at a national level are at the disposal of the countries. Evaluationsby independent private or governmental institutions, inspectorates and systematic inservice training of teaching professionals may serve as examples of this type ofquality assurance mechanism.
Finally, it should be mentioned that an efficient quality assurance system should beclosely connected to the official accreditation, certification and recognition system,and that the indicators in these domains share common ground.

70
III Conclusions

71
Five key challenges for promoting quality of lifelong learning in the future can beidentified:
(i) The Skills, Competencies and Attitudes Challenge
The skills, competencies and attitudes required to participate in all spheres of life havechanged. One aspect of the quality of lifelong learning is the extent to which aneducation and training system is successful in equipping people to negotiate theshifting demands placed upon them. Individuals should be given the opportunity toupdate, extend and acquire new skills so that they are better placed to meet changes inthe work place and in society at large.
While the knowledge economy requires ‘new’ skills, the ‘traditional’ ones (e.g.mathematics and literacy) remain the fundamental key competencies and in fact, thegreater wealth of research now available underscores their importance. It is vital thateveryone has access to the opportunity to obtain a new basic profile of competencieswhich enhances their employability and their ability to participate in public life.
(ii) The Resource Challenge
The adoption of Lifelong Learning as a framework for structuring education andtraining systems carries implications for the ways in which the necessary resourcesare provided. Lifelong learning requires investment in equipment, physicalinfrastructure, educational content, teaching staff and learners’ time. Nor, is thechallenge of resourcing lifelong learning is simply a question of increasinginvestment. Arrangements for funding lifelong learning will have to reflect thecomplexity and diversity of the approach itself.
Lifelong learning accommodates the increasing demand for greater education andtraining provision both before and after compulsory schooling. At the one end of theeducational process pre-school attendance is becoming more prevalent. Thisdevelopment is supported by widespread recognition of the importance of earlychildhood experiences, though the timing and mechanisms remain debated, onsubsequent intellectual and social development. Investing in this critical phase indevelopment is a long-term investment.
The growth in post-compulsory education which extends throughout someone’s lifetakes more varied forms, vocational and non-vocational, retraining, further education,education focusing on basic skills acquisition and reflects the needs of differentindividuals and their particular circumstances. It is in the context of post-compulsoryeducation that the lifewide aspect of lifelong learning comes to the fore. Individuals
Five Challenges to the Quality of Lifelong Learning in Europe

72
should have the opportunity to learn through both their working and personal lives.This means that as well as people having different motivations for engaging inlearning activities they will also undertake learning in a range of contexts, throughdifferent organisations and over varying periods of time.
Teaching, which has a significant part to play in the quality of every aspect of alifelong learning system, is faced with a number of challenges. The first of theserelates to the training of teachers, educators, trainers and other learning facilitatorsand for example, their ability to adapt to the growing prevalence of ICT as part oftheir teaching methodology or to changes in curriculum requirements. Secondly,teachers and educators will have to become adept in the application of the learner-centred orientation espoused by the lifelong learning approach. The final challengerelates to the adequacy of teacher numbers in relation to students. The issue ofteaching shortages is already confronting certain countries. A failure to meet thesechallenges would represent a serious impediment to the drive to raise the quality oflifelong learning.
While funding from public authorities remains essential for lifelong learning this isparticularly the case for certain target groups such as the unemployed and those with avery low level of education. However, new patterns of education and training allowfor the possibility of developing bipartite and tripartite agreements, which enable awider variety of financial resources to be mobilised. Innovative ways of ensuring theresources required for lifelong learning, such as individual learning accounts, arebeing drawn up by many Member States.
Beyond the benefits policy-makers will derive from data on lifelong learning formonitoring purposes lie more complex issues about the nature and effectiveness ofprovision and the need for more and better data, sensitive enough to effectivelyinform decision-making in these areas.
(iii) The Challenge of Social Inclusion
Lifelong learning provides an opportunity for citizens to have equitable access toindividual socio-cultural development, and fulfil one’s rights and duties in thedemocratic decision making process. Providing the opportunity for people to improvetheir existing skills and acquire new ones is a way to tackle social exclusion andpromote equal opportunities in the widest sense.
Given the potential of lifelong learning in this respect it is vitally important that thelifelong learning process does not reinforce existing divisions and inequality throughunequal access and participation. In order for education and training systems tocontribute to the creation of an inclusive society it is necessary to ensure that barriersto participation are identified and dismantled. Within this context, specific regard hasto be paid to the obstacles faced by vulnerable groups and people with specialeducational needs. If individuals are unable, for whatever reason, to access theeducation they are aiming for, the capacity of lifelong learning to act as a changeagent for the transformation of our society, will be severely limited from the verybeginning.

73
(iv) The Challenge of Change
Lifelong learning needs to be developed as a coherent whole if it is to achieve itspotential. Education and training systems must undergo structural and proceduralchanges at the systemic level in order to successfully adapt to a lifelong learningapproach. It is the responsibility of each Member State to develop a political strategyfor the implementation of lifelong learning on a national scale in a way which goesbeyond what is currently in place and ensures that there is added emphasis on thedevelopment of individual capabilities and personal learning competencies. Thesenational strategies will have to respond to the demands of local and regionalgovernment, the labour market, public and private organisations providing educationand training as well as individual citizens.
Recognition of knowledge, skills and competencies acquired in a variety of settingsshould be achieved through the improvement of accreditation and certificationprocedures. Acknowledging that learning has taken place helps to create anenvironment in which individuals feel their learning activities to be of value andcreating clarity promotes the mobility of labour. In recognising forms of learningother than formal education the quality of lifelong learning faces the challenge of de-institutionalisation. Accreditation will be given for learning conducted in a greaterarray of institutions, in a wider variety of subjects than ever before and to diverse sub-populations. While such variety is well suited to meeting the needs of the individualit intensifies the complexity of the task of monitoring the quality of the learningprocess provided.
In order for people to be able to derive maximum benefit from lifelong learning theymust be informed of the possibilities, their options and the potential effects on theircircumstances. As such, an effective lifelong learning system should also provideguidance and counselling to users in order to see their effective transition betweendifferent parts of the lifelong learning system and working life.
(v) The Challenge of Data and Comparability
In its reply to the Parma seminar on measuring lifelong learning Eurostat accuratelydescribes the situation we are in as “between the primitive and complicated phases ofthe process of developing statistics for measuring lifelong learning”.
The following are reflections outline some of the challenges in measuring (quality) oflifelong learning.
1) Policy-makers should define policy needs. Data transform into indicators whenthey are related to political considerations and by incorporating them in adecision-making context.
2) In the complicated transition phase we are in right now, one of the biggestchallenges is to “make best use of existing sources”, that should be looked at fromdifferent angles and perspectives. This rationale is at the very basis of this report.

74
3) This short-term approach should not conceal the urgent need for substantialconceptual and development work. The development of new classificationschemata, the operational definition of new skills and the development of relatedassessment methods, the broadening of the scope to informal learning aspects andthe shift of data to a regional and sub-regional level are only a few of thechallenges we are facing and where we have to find solutions.
4) One overarching challenge of the highest importance is the transformation of atraditional approach to a more individual-centred view. The Eurostat driven EUAdult Education Survey, tentatively planned for 2006, is a promising enterprise todeal with this challenge.
5) Finally, finding efficient solutions for gathering comparable data while at thesame time respecting the subsidiary principle will also be one of the mostchallenging steps of future work.
The report illustrates many of the problems we encounter in the domain of measuringlifelong learning. Beyond the conceptual shortcomings of some of the indicatorspresented here, a brief look at the availability of data in the different countriesuncovers a further problem. Many countries do not have the data or at least they arenot available in a harmonised way. Not to be misunderstood: The ambition of thisreport is definitely not to « force » countries to implement all the indicators mentionedin the table. There may be very good reasons for a country not to implement one ormore indicators: resource limitations, availability of better national instruments,political sensitivity, etc. Nevertheless, if this effort of defining quality indicators oflifelong learning is to be taken seriously, then a certain level of coverage should bereached within the countries.
The following table (18) is a checklist showing for which indicators internationallycomparable data exist in each country. Blank cells in the table do not mean that acountry is not making any effort in this domain, sometimes very substantial nationalefforts exist.
Table 18Presence/Absence of comparable data related to quality indicators of lifelonglearning for the participating countries
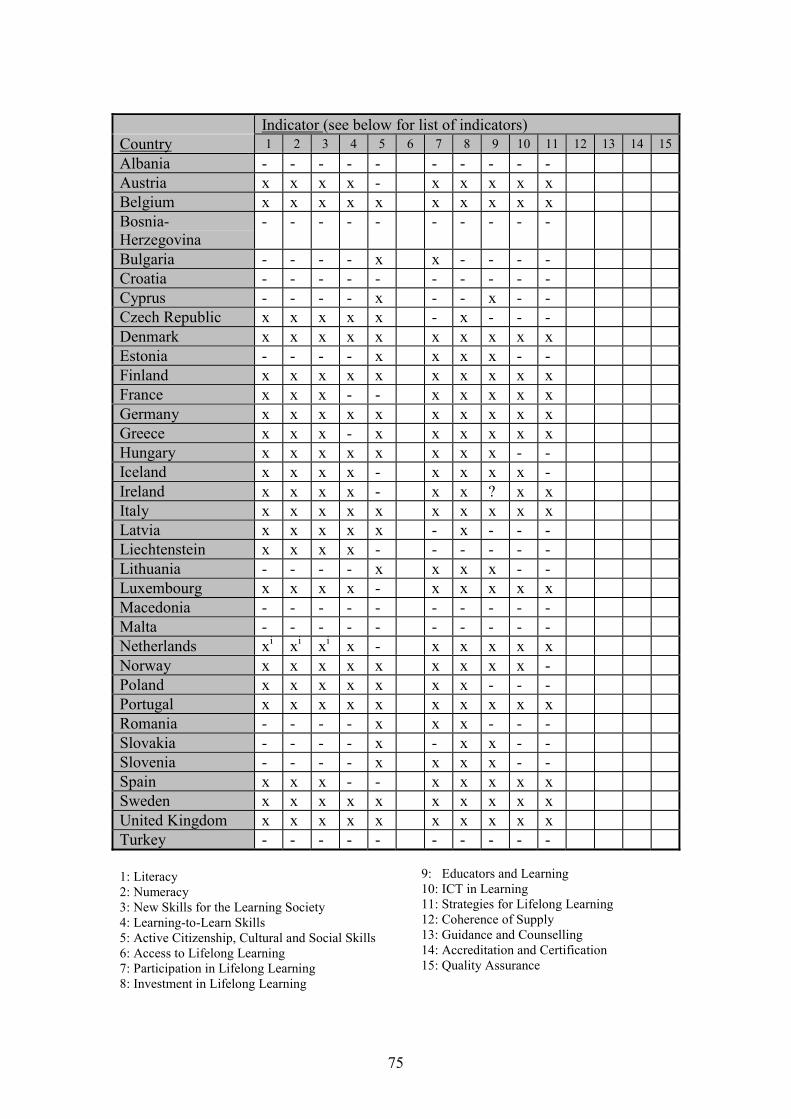
75
Indicator (see below for list of indicators)Country 1 2 3 4 5 6 7 8 9 10 11 12 13 14 15Albania - - - - - - - - - -Austria x x x x - x x x x xBelgium x x x x x x x x x xBosnia-Herzegovina
- - - - - - - - - -
Bulgaria - - - - x x - - - -Croatia - - - - - - - - - -Cyprus - - - - x - - x - -Czech Republic x x x x x - x - - -Denmark x x x x x x x x x xEstonia - - - - x x x x - -Finland x x x x x x x x x xFrance x x x - - x x x x xGermany x x x x x x x x x xGreece x x x - x x x x x xHungary x x x x x x x x - -Iceland x x x x - x x x x -Ireland x x x x - x x ? x xItaly x x x x x x x x x xLatvia x x x x x - x - - -Liechtenstein x x x x - - - - - -Lithuania - - - - x x x x - -Luxembourg x x x x - x x x x xMacedonia - - - - - - - - - -Malta - - - - - - - - - -Netherlands xi xi xi x - x x x x xNorway x x x x x x x x x -Poland x x x x x x x - - -Portugal x x x x x x x x x xRomania - - - - x x x - - -Slovakia - - - - x - x x - -Slovenia - - - - x x x x - -Spain x x x - - x x x x xSweden x x x x x x x x x xUnited Kingdom x x x x x x x x x xTurkey - - - - - - - - - -
1: Literacy 2: Numeracy3: New Skills for the Learning Society 4: Learning-to-Learn Skills5: Active Citizenship, Cultural and Social Skills 6: Access to Lifelong Learning7: Participation in Lifelong Learning8: Investment in Lifelong Learning
9: Educators and Learning10: ICT in Learning11: Strategies for Lifelong Learning12: Coherence of Supply13: Guidance and Counselling14: Accreditation and Certification15: Quality Assurance

76
From Table 18 it is possible to distinguish two groups of countries:1) those who have a very good coverage, i.e. generally only very few indicators are
missing for these countries and,2) a few countries which have not implemented any of these indicators or only very
few.
As four of the skill indicators are based on PISA data, those countries that did notparticipate in PISA are clearly disadvantaged in this table. The table also shows thatsome of the candidate countries, with a good coverage of skill indicators, are lackingdata in other domains. This often reflects the transition phase these countries are in,and sometimes the data have already been collected, but not yet submitted orvalidated. The situation in those countries that do not have any or only very fewindicators should be carefully analysed. The situation might reflect strong nationalefforts, which are not comparable with the international indicators described in thisreport, or alternatively, the lack of indicators may point to a more substantial problemin the domain of statistical information.

77
V Annexes

78
Annexe 1
A Brief Conceptual Outline of the Lifelong Learning Paradigm26
The enormous speed with which knowledge develops and ages today underlines atleast two points:
� Learning must be conceptualised as a permanent process which starts at birth andcontinues throughout life;
� Reflecting its diversity and complexity, learning needs to be understood in a widesocietal and personal sense, beyond the context of job-related training.
As a result, learning cannot be characterised as a limited phase in childhood and youthdedicated only to the promotion of the individual's vocational career. Rather, learningis a continuous task of the society and the individual that extends to all areas andphases of life. The perspective of learning "from cradle to grave" is a fundamentalelement in most approaches to lifelong learning.
Lifelong learning, however, is not just a simple summing-up or integration oftraditional education programmes and modern learning opportunities. Instead, theapproach to lifelong learning includes fundamental differences in educational contentand perspectives: While traditional educational institutions have been (and still are)primarily concerned with transmitting knowledge, modern learning opportunities andthe lifelong learning approach put the emphasis on the development of individualcapabilities and personal learning competencies. At the heart of the lifelong learningconcept is the idea of enabling and encouraging people "to learn how to learn".
In the past the time-dimension has often dominated the discussion about lifelonglearning. It underlines the fact that learning activities occur in different phases overthe lifecycle. However, there is also a lifewide dimension to be recognised, which isof growing importance today. It takes into account that learning increasingly takesplace in a multitude of settings and situations in real life:
26 This section is taken mainly from Walter Horner : Towards a statistical framework for monitoring
progress towards lifelong learning, in : OECD (ed) : The INES Compendium – Contributions fromthe Technical Group, Paper prepared for the INES General Assemby, Tokyo, 11-13 September2000.

79
Figure 1: The 'lifelong-lifewide framework'
With respect to the time dimension of lifelong learning (vertical axis) the sequence ofdifferent learning processes within the life cycle is of primary concern (lifelonglearning in a narrow sense). The lifewide dimension (horizontal axis) refers to thedifferent social settings in which learning takes place (lifewide learning).27
The more traditional educational processes have been institutionalised (e.g., withinformal education) and mostly embedded in a more or less strictly organised timeschedule (e.g., within compulsory education). Others might be used flexibly indifferent phases of life by the individuals according to their own occupational statusor situation at the workplace or according to their personal interest and motivation(e.g., within informal learning). The 'lifelong-lifewide framework' has now beenwidely accepted.28
In order to determine the specific learning situations that should be covered by astatistical framework on lifelong learning, it is important to differentiate betweeneducation and learning: The International Standard Classification of Education(ISCED) defines education as follows: "...the term education is [..] taken to compriseall deliberate and systematic activities designed to meet learning needs." (ISCED '97,Paragraph 7). Education consists of two sub-fields: formal and non-formal education.By contrast, learning is characterised from the perspective of the individual as "...anyimprovement in behaviour, information, knowledge, understanding, attitude, values orskills." (ISCED, Paragraph 9).
The activities to be covered therefore comprise three main areas: formal and non-formal education as well as informal learning:
� Formal education: According to ISCED formal education refers to "...the systemof schools, colleges, universities and other formal educational institutions thatnormally constitutes a continuous 'ladder' of full-time education for children andyoung people, generally beginning at age five to seven and continuing up to 20 or 25years old." (UNESCO 1997, p. 41). In some countries, however, these age limitsneed to be extended.
27 Cf. Faure (1972), Husén (1974).28 Cf. OECD Ad-hoc Group on Lifelong Learning (1999), Chapter 4.
Less formalised settings Formal settings
Old people
Young people
1
4
2
3
80
� Non-formal education comprises "any organised and sustained educationalactivities that do not correspond exactly to the above definition of formaleducation. Non-formal education may therefore take place both within and outsideeducational institutions, and cater to persons of all ages." (UNESCO 1997, p. 41).
� Informal learning consists of all intended learning activities and/or situations thatcannot be classified as formal or non-formal education. Informal learning activitiesare characterised by a relatively low level of organisation and may take place at theindividual level (e.g., self-directed learning) as well as in groups of people (e.g., atthe workplace or within the family). Some of these settings, such as computerbased learning modules or other structured learning material may to a large extentbe similar to non-formal programmes while others, such as learning within thefamily or by visiting cultural events, can hardly be captured statistically.
Formal educational programmes (compulsory and post-compulsory regular education)are already well documented in traditional education statistics. The development of astatistical approach of lifelong learning should therefore have an emphasis on theremaining fields of learning, which are not sufficiently represented in presenteducation statistics.
A comprehensive enumeration of learning activities is a prerequisite for anymeaningful statistical mapping of LLL. Approaches at different levels have beenprovided by the Eurostat Task Force Measuring Lifelong Learning and - very recently- in the context of a Eurostat project on a "Harmonised List of Learning Activities"(HaLLA).

81
Annexe 2
Quality Indicator Number 1
Indicator: LiteracyDefinition: Percentage of students per country at proficiency level 1 or
below on the PISA reading literacy scaleData source: OECD: Programme on International Student Assessment, 2000Related information: Average reading literacy (PISA)
Quality Indicator Number 2
Indicator: NumeracyDefinition: Percentage of students per country below the score of 380 points
on the PISA mathematical literacy scaleData source: OECD: Programme on International Student Assessment, 2000Relatedinformation: Average mathematical literacy (PISA)
Quality Indicator Number 3
Indicator: New Skills for the Learning SocietyDefinition: Percentage of students per country below the score of 400 points
on the PISA scientific literacy scaleData source: OECD: Programme on International Student Assessment, 2000Relatedinformation: Average scientific literacy (PISA), Share of tertiary graduates
in science and technology per 1000 inhabitants aged 20-29,1993-2000 in Member States and candidate countries
Extended Information on Quality Indicators of Lifelong Learningand other Data used

82
Quality Indicator Number 4
Indicator: Learning-to-learn SkillsDefinition: Percentage of students per country in the lower 25% of overall
performance on the PISA “elaboration strategies” indexData source: OECD: Programme on International Student Assessment, 2000
Quality Indicator Number 5
Indicator: Active Citizenship, Cultural and Social SkillsDefinition: qualitativeData source: different sourcesRelatedinformation: Civic knowledge and interpretative skills (IEA), Civic
knowledge, civic engagement and civic attitudes acrosscountries (IEA)
Quality Indicator Number 6
Indicator: Access to Lifelong Learning
Quality Indicator Number 7
Indicator: Participation in Lifelong LearningDefinition: Participation in education and training of those aged 25 to 64Data source: Eurostat: Labour Force Survey, 2001Relatedinformation: Early school leavers (18-25)

83
Quality Indicator Number 8
Indicator: Investment in Lifelong LearningDefinition: Total public expenditure on education as a percentage of GDPData source: Eurostat: Structural Indicator
Quality Indicator Number 9
Indicator: Educators and LearningDefinition: Percentage of teachers having received education and training
during the previous four weeksData source: Eurostat: Labour Force Survey, 2002
Quality Indicator Number 10
Indicator: ICT in LearningDefinition: Percentage of households who have Internet access at homeData source: Flash Eurobarometer 112, November 2001
Quality Indicator Number 11
Indicator: Strategies of Lifelong LearningDefinition: Member States’ positions on developing lifelong learning
strategiesData source: European Commission: Joint Employment Report, 2001

84
Quality Indicator Number 12
Indicator: Coherence of Supply
Quality Indicator Number 13
Indicator: Counselling and Guidance
Quality Indicator Number 14
Indicator: Accreditation and Certification
Quality Indicator Number 15
Indicator: Quality Assurance

85
Annexe 3
Co-Ordination of the Employment Policies: The Luxembourg Process
Indicators of Lifelong Learning Used in the Process of Employment Strategy29
Key indicators� Investment expenditure on education in relation to GDP. Source: Eurostat, UOE.� Participation rate in education and training. Source: Eurostat, UOE.� Rate of early-school leavers. Source: Eurostat, LFS.� Rate of Internet coverage in schools. Source: Eurobarometer 2001 and “eEurope 2002
Benchmarking”, Commission Staff Paper, SEC (2001) 1583/9-11-2001.� Share of teachers with IS literacy. Source: Eurobarometer 2001 and “eEurope 2002
Benchmarking”, Commission Staff Paper, SEC (2001) 1583/9-11-2001.� Share of employees participating in job-related training. Source: Eurostat – CVTS2,
reference year 1999.
Context indicators� Educational attainment rate of adult population. Source: Eurostat: LFS.� Participation rate in education and training. Source: Eurostat:UOE.� Literacy proficiency rate of adult population. Source: IALS, 1994-98, “Literacy in the
Information Age”, OECD and Statistics Canada, 2000.� Rate of student access to computers and to Internet. Source: Benchmarking Report
following up the “Strategies for Jobs in the IS”, COM (2000) 48 National data.� Share of employees participating in job-related training. Source: Eurostat: CTVS 1 and
CVTS 2, reference years 1993 and 1999.� Average hours spent on training per employee. Source: Eurostat: CVTS 2, reference year
1999.� Share of the workforce using computers for work. Source: Eurobarometer Survey on
ICT and Employment, Nov 2000, Oct 2001.� Rate of working population trained on job related ICT skills. Source: Eurobarometer
Survey on ICT and Employment, Nov 2000, Oct 2001.
Communication from the Commission: “Structural Indicators”COM (2001) 619 final� Total new science and technology doctorates per 1000 of population aged 25 to 34
years. Source: Eurostat, UOE.� Total public expenditure on education as a percentage of GDP. Source: Joint
Eurostat, UOE.
29 Directorate-General: Employment and Social Affairs IND/30/040302: Review of Lifelong Learning
Indicators
List of Indicators used in the Field of Education and Trainingwithin Selected Community Initiatives

86
� Percentage of population, aged 25-64, participating in education and training.Source: Eurostat: Labour Force Survey.
� Share of the population aged 18-24 with only lower secondary education and notin education or training. Source: Eurostat: Labour Force Survey.
Communication from the Commission: “Commission’s Action Plan For SkillsAnd Mobility” COM (2002) 72� Levels of occupational mobility and labour turnover. Source: Eurostat: Labour Force
Survey.� Impact of educational levels on employment and unemployment. Source: Eurostat:
Labour Force Survey.� Employment growth in high education sectors. Source: Eurostat: Labour Force Survey� Education attainment levels. Source: Eurostat: Labour Force Survey.� Early school leavers. Source: Eurostat: Labour Force Survey.� Basic skills (literacy and numeracy): Student performance on the combined
reading, scientific and mathematical literacy scales and national income. Source:OECD/Knowledge and Skills for Life, First result from PISA 2000.
� Participation of adult workers in training. Source: Eurostat: Labour Force Survey.� Shortages in ICT occupations and sectors. Source: IDC/EITO 2001 study.� Demographic developments: change of working age population and composition
by age groups. Source: Eurostat-Demographic database: Population by sex and age on1/1/2000 (for 2000), Eurostat-BASELINE scenario (for options).
� Levels of geographical mobility. Source: Eurostat: Labour Force Survey.� Commuting mobility. Source: Eurostat: Labour Force Survey.� High employment regions and skills needs. Source: Eurostat: Labour Force Survey and
Demographics Projections BASELINE scenario.� Foreign language teaching. Source: Eurostat.� Migration. Source: Eurostat.
Detailed Work programme on the Follow-Up of the Objectives of Education AndTraining Systems in Europe
Indicative List of Indicators to be used within The Open Method of Co-Ordination� Shortage/surplus of qualified teachers and trainers on the labour market.� Progression in number of applicants for training programmes (teachers and
trainers).� Percentage of teachers who follow continuous professional training.� People completing secondary education. Source : Eurostat, UOE� Continuous training of teachers in areas of emerging skills needs.� Literacy attainment levels. Source: OECD 2001.� Numeracy/Mathematics attainment levels. Source: OECD 2001.� Learning to learn attainment levels.� Percentage of adults with less than upper secondary education who have
participated in any form of adult education or training, by age group.� Percentage of teachers that have been trained in ICT use in schools.� Percentage of pupils and students using ICT in their studies.
87
� Percentage of learning sessions in teaching and training institutions in which ICTis used.
� Increase in number of entries into mathematics, science and technology courses(upper secondary advanced levels and tertiary levels, by gender).
� Increase of graduates in mathematics, science and technology courses, by gender.� Increase in number of scientists and engineers in society, by gender.� Increase in number of qualified teachers in MST (secondary level).� Increase in per capita investment in human resources.� Percentage of population between 25 and 64 participating in education and
training. Source: Eurostat: Labour Force Survey.� Percentage of working time spent by employees on training per age groups.� Participation in tertiary education.� Proportion of the population aged 18-24 with only lower secondary education and
not in education or training. Source: Eurostat: Labour Force Survey.� Percentage of students and trainees in initial training benefiting from placement
agreements (éducation en alterance).� Proportion of self-employed in various sectors of knowledge economy
(particularly age group 25-35).� Percentage of education and training institutions providing counselling and
guidance for setting up business.� Percentage of pupils and students who reach a level of proficiency in two foreign
languages.� Percentage of language teachers having participated in initial training or in-service
training courses involving mobility providing direct contact with thelanguage/culture they teach.
� Proportion of national students and trainees carrying out part of their studies inanother EU or third country.
� Proportion of teachers, researches and academics from other EU countriesemployed at different educational levels.
� Number and distribution of EU and non-EU students and trainees in education andtraining.
� Proportion of undergraduate and postgraduate students continuing their studies inanother EU or third country.
� Percentage of graduates obtaining joint degrees in Europe.� Percentage of students and trainees within ECTS or EUROPASS and/or obtaining
Diploma/Certificate Supplement.

88
Annexe 4
ALBANIA
Ms Yllka SPAHIUInstitute of Pedagogical Research
AUSTRIA
Dr. Werner SPECHTZSEII – Zentrum für SchulentwicklungAbt. II : Evaluation und Schulforschung
BELGIUM
Dr. Philippe RENARDExpert au Cabinet du Ministre de l’Enseignement
Ms Fanny CONSTANTAttachée auprès du Ministère de la Communauté françaiseAdministration générale de l’Enseignement et de laRecherche scientifiqueService général des Affaires générales, de la Rechercheen éducation et du Pilotage interréseaux
Ms Liselotte VAN DE PERREMinistry of the Flemish CommunityEducation DepartmentBudget and Data Management Division
Herr Georges HECKMinisterium der Deutschsprachigen GemeinschaftAbteilung Organisation des UnterrichtswesensPädagogische Dienststelle des Ministeriums / Inspektion
Herr Roger HECKMinisterium der Deutschsprachigen GemeinschaftAbteilung Organisation des UnterrichtswesensPädagogische Dienststelle des Ministeriums / Inspektion
List of participants in the working group onQuality Indicators of Lifelong Learning

89
BOSNIA-HERZEGOVINA
Ms Viktorija-Mira MERLOAdvisor of MinisterFederal Ministry of Education, Science, Culture and Sport
BULGARIA
Mr Pencho MIHNEVHead of “Analysis, planning, and qualification” deptand Expert “Information technologies”Directorate “General Education”Ministry of Education and Science
CYPRUS
Dr Tryphon PNEUMATICOSActing DirectorDepartment of Higher and Tertiary EducationMinistry of Education & Culture
CZECH REPUBLIC
Dr Martin ŠOLCAssociate ProfessorAssociation of Universities of the Third Age (President)Charles University Prague
DENMARK
Ms Birgitte BOVINHead of SectionUndervisningsministeriet
ESTONIA
Ms Reet NEUDORFRepresented by Ms Silja KIMMELMinistry of EducationInformation and Statistics SectionDepartment of Planning

90
FINLAND
Ms Kirsi LINDROOSRepresented by Dr Ritva JAKKU-SIHVONENDirectorMinistry of EducationGeneral Education Division
FORMER YUGOSLAV REPUBLIC OF MACEDONIA (MISSION)
Ms Agneza RUSIMission of the Former Yugoslav Republic of Macedonia
FRANCE
Mr Gérard BONNETChargé de mission auprès du directeurDirection de la programmation et du développementMinistère de l'éducation nationale
GERMANY
Herr Ingo RUßRepresented by Herr Rainer WILHELM - Statistisches BundesamtBundesministerium für Bildung und Forschung
Herr Ministerialrat Dittrich MAGERKURTHBayerisches Staatsministerium für Wissenschaft, Forschung und Kunst
GREECE
Prof Nikitas PATINIOTISLaboratory of Sociology and EducationUniversity of Patras
HUNGARY
Mr Zoltán BOGDÁNYAdvisorMinistry of Education

91
ICELAND
Mr Ólafur H. JÓHANNSSONAssistant ProfessorThe Iceland University of Education
IRELAND
Mr Jerome LEONARDThe Office of the InspectorateDepartment of Education and Science
ITALY
Prof. Luigi BIGGERID. to di Statistica G. ParentiUniversitò di Firenze
Prof. Pietro LUCISANOOrdinario Pedagogia SperimentaleUniversita “La Sapienza”
LATVIA
Ms Aija LEJAS-SAUSAHead of Eurydice Unit of LatviaEuropean Integration and TechnicalAssistance Coordination DepartmentMinistry of Education and Science
LIECHTENSTEIN
Herr Helmut KONRAD
LITHUANIA
Prof. Vincentas DIENYSDirector of the Methodical Centre forVocational Education and Training
Ms Lina VAITKUTENational Observatory in LithuaniaMethodological Centre forVocational Education and Training

92
LUXEMBOURG
Mr Dominique PORTANTEInstitut supérieur d’Etudes et Recherche pédagogiques
MALTA
Mr Alfred MALLIADepartment of Further Studies and Adult EducationMinistry of Education
THE NETHERLANDS
Mr J. van RAVENSHead of Department of multilateral affairsMinisterie van Onderwijs, Cultuur en WetenschappenDirectie IB – multilateral affairs
Ms J. TIMMERMinisterie van Onderwijs, Cultuur en WetenschappenDirectie IB – multilateral affairs
NORWAY
Mr Ole-Jacob SKODVINSenior AdviserMinistry of Education and Research
POLAND
Mr Stanislaw DRZAŻDŻEWSKIGeneral CounsellorDepartment of Economy, Statistical DivisionMinistry of National Education and Sport
PORTUGAL
Dr António FAZENDEIRORepresented by Ms. Sylvia ALMEIDADAPP - Director do Departamento Avaliação Prospectiva e PlaneamentoMinistério da Educação

93
REPUBLIC OF SLOVAKIA
Mr Juraj VANTUCHFaculty of EducationComenius University
REPUBLIC OF SLOVENIA
Ms Olga DROFENIKSlovenian Institute for Adult Education (SIAE)
ROMANIA
Prof. Mihai KORKAExpertMinistry of Education and Research
SPAIN
Mr Ismael CRESPO MARTÍNEZGeneral Director for UniversitiesMinisterio de Educación, Cultura y Deporte
Dr Gerardo MUÑOZ SÁNCHEZ-BRUNETERepresented by Ms. Flora GIL TRAVERDirector del Instituto Nacional de Calidad y Evaluación
SWEDEN
Dr Sverker HÄRDDeputy Director, Head of unit for statistics and analysesMinistry of Education and Science
TURKEY
Ms Meral HACIPAŞAOĞLUDeputy General Director of External RelationsDiş Ilişkiler Genel MüdürlüğüMinistry of Education

94
UNITED KINGDOM
Mr John SEYMOUR
Mr Alan WATTHM Inspectorate of Education
OECD – Organisation for Economic Co-operation & Development
Mr Andreas SCHLEICHERDeputy HeadStatistics and Indicators Division
UNESCO
Mr Adama OUANEDirectorUnesco Institute for Education
EUROPEAN EURYDICE UNIT
Ms Patricia WASTIAU-SCHLÜTERHead
Ms Arlette DELHAXHEDeputy-Head
CEDEFOP
Mr Michael-James ADAMSProject manager
95
THE EUROPEAN COMMISSION DG EDUCATION AND CULTURE
Mr Anders J. HINGELHead of Unit
Ms Angela VEGLIANTE
Ms Jacqueline CRAIG
Ms Solrun FLEISCHER
Mr Jean-Paul REEF (External Expert)LIFE Research and Consult
Mr Mikaël LE BOURHIS (Secretariat)
Ms Sophie POUPE (Secretariat)
DG EUROSTAT
Mr Michail SKALIOTISHead of Unit
Mr Spyridon PILOS