european structural and investment funds 2014 -2020...
TRANSCRIPT
EN EN
EUROPEAN COMMISSION
Brussels, 20.12.2016
COM(2016) 812 final
REPORT FROM THE COMMISSION TO THE EUROPEAN PARLIAMENT, THE
COUNCIL, THE EUROPEAN ECONOMIC AND SOCIAL COMMITTEE AND THE
COMMITTEE OF THE REGIONS
European Structural and Investment Funds 2014-2020
2016 Summary Report of the programme annual implementation reports
covering implementation in 2014-2015
2
European Structural and Investment Funds 2014-2020
2016 Summary report of the programme annual implementation reports
covering implementation in 2014-2015
1. INTRODUCTION
In the context of signs of economic recovery, many Member States and regions still face
fragile growth and structural weaknesses. Economic and social disparities between and within
Member States persist while the overall level of investment remains below pre-crisis levels.
The new generation of programmes under the European Structural and Investment Funds
(ESI Funds) 2014-2020 offer significant opportunities for public and private investment to
support growth, employment and structural transformation.
An overall investment effort worth EUR 638 billion between 2014 and 2020; around one
million projects selected worth EUR 58.8 billion (already increased to EUR 128.8 billion by
autumn 2016); 274 000 enterprises receiving support; 2.7 million people supported in their
search for a job, training, or education; and investment to improve the biodiversity of 11.1
million hectares of agricultural land. These are some of the preliminary results emerging from
the 2016 Annual Implementation Reports (AIRs) submitted by Member States on the
implementation of the ESI Funds in the first two years of the programming cycle.
In December 2015 the Communication "Investing in jobs and growth - maximising the
contribution of European Structural and Investment Funds" summarised the outcomes of the
negotiations with all Member States on Partnership Agreements and programmes1. It also
highlighted the expected contribution of the five ESI Funds2 to the EU's growth strategy, the
Investment Plan for Europe and to address structural challenges and reforms in the Member
States. The ESI Funds also make direct contributions to the Commission's political priorities.
This report is the first in a series of annual reports to the EU institutions on the
implementation of the ESI Funds. This stock-taking is done in the context of major novelties
introduced in 2014 to enhance the quality of spending, such as thematic concentration,
stronger links to economic governance, ex-ante conditionalities, enhanced results focus and
performance measurement mechanisms. It responds to two formal requirements: (a) to
summarise the 2016 annual implementation reports on the 533 programmes provided by the
Member States and regions covering the period 2014-2015 and (b) to synthesise the available
evaluations of those programmes3.
It summarises information on project selection and indicator achievements on the ground and
on the building of delivery mechanisms by the Member States and regions. It provides a
1 Communication COM(2015) 639 of 14 December 2015 under Article 16.3 of the Common Provisions
Regulation (CPR) - Regulation (EU) No 1303/2013 of 17 December 2013. 2 The five ESI Funds are the European Regional Development Fund (ERDF), the European Social Fund
(ESF); the Cohesion Fund (CF), the European Agricultural Fund for Rural Development (EAFRD), the
European Maritime and Fisheries Fund (EMFF). Cohesion policy includes the ERDF, the ESF and the CF. 3 Article 53.1, CPR.

3
complement to the May 2016 technical analysis from the EU budget perspective of the ESI
Funds budgetary implementation4.
Section 2 below provides an overview of implementation progress until end-2015 and
describes the efforts to build sound strategies and mechanisms to deliver effective
investments. Section 3 presents in more detail the progress in the key thematic areas. Section
4 presents a summary of the work under way to deliver robust evaluation of policy
implementation.
2. OVERVIEW OF THE EFFORTS TO PROGRAMME THE ESI FUNDS AND KICK-START
INVESTMENT
During 2014 and 2015 the national and regional authorities had three primary objectives (a) to
complete negotiations and secure the adoption of the new programmes, (b) to launch the new
programmes and (c) to complete implementation of the 2007-2013 programmes successfully.
The late adoption of the multiannual financial framework for the period 2014-2020 had a
knock-on effect on the adoption of the legislation governing the ESI Funds. The process to
agree the 2014-2020 programmes, together with the expected achievements of those
programmes, were presented in December 20155. By end 2014, 220 programmes were
adopted. However, the majority - 313 programmes - were finalised in 2015, with 181 finalised
only in the second semester. As a result, while the majority of the programmes adopted in
2015 have reported progress, many were still working to select their first projects by end
2015.
The 2014-2020 generation of ESI Fund programmes have a stronger focus on results,
transparency and accountability: until 2023 all programmes will submit AIRs that should
present a detailed quantification of progress in relation to finances, outputs and expected
results. This aligns the programmes clearly within the "EU Budget Focussed on Results"
initiative6.
2.1. Overview of implementation progress
The ESI Funds Open Data Platform7 has been updated to show the financial volume of
project selection and the forecasts and achievements for common indicator as reported by the
programmes in the 2016 AIRs.
4 http://ec.europa.eu/budget/library/biblio/documents/2015/analysis-of-the-budgetary-implementation-of-the-
european-structural-and-investment-funds-in-2015_en.pdf 5 Communication COM(2015) 639 – see footnote 1.
6 The initiative "EU Budget Focussed on Results" was launched in 2015:
http://ec.europa.eu/budget/budget4results/index_en.cfm 7 ESI Funds Open Data Platform: https://cohesiondata.ec.europa.eu/

4
2.1.1. Financial overview
In terms of EU payments to the Member States a total of EUR 15.4 billion was paid by end-
2015. This represented 13.8% of the 2014 and 2015 EU commitments8 and was
predominantly made up of pre-financing payments.
In the 2016 AIRs, covering the years 2014 and 2015, the Member States have notified the
Commission of the financial allocations to selected projects. The total volume of the projects
selected for support was EUR 58.8 billion representing 9.2% of the total investment
volume planned over the period 2014-2020. The EU contribution to the projects selected is
estimated at EUR 41.8 billion. The breakdown of the volume of project selection by thematic
objective, notified by Member State at end-2015, is presented in Table 1 below.
Table 1: Total cost of selected projects by Thematic Objective (EUR millions) and rate
of project selection by end-2015
TO code Thematic Objectives
Total planned
investment
EUR Million9
Total eligible
cost of selected
projects at end-
2015
EUR Million
2015 Rate of
project
selection
01 Research & Innovation 59,549.3 3,378.4 5.7%
02 Information & Communication
Technologies
18,297.6 736.7 4.0%
03 Competitiveness of SMEs 83,593.6 7,476.6 8.9%
04 Low-Carbon Economy 52,777.2 2,274.0 4.3%
05 Climate Change Adaptation & Risk
Prevention
37,783.6 6,554.2 17.3%
06 Environment Protection & Resource
Efficiency
72,316.2 7,573.0 10.5%
07 Network Infrastructures in Transport
and Energy
66,659.5 4,139.6 6.2%
08 Sustainable & Quality Employment 46,390.9 6,456.9 13.9%
09 Social Inclusion 53,551.9 4,966.8 9.3%
10 Educational & Vocational Training 42,315.6 5,749.8 13.6%
11 Efficient Public Administration 6,080.2 680.7 11.2%
12 Outermost & Sparsely Populated 220.5 47.8 21.7%
DM Discontinued Measures 928.0 - 0.0%
Multiple Thematic Objectives
(ERDF/CF/ESF)
78,980.5 6,077.2 7.7%
TA Technical Assistance 18,712.1 2,674.3 14.3%
Total 638,157 58,786 9.2%
Source: Commission based on data reported by programmes
Based on the most recently reported financial data to autumn 2016, implementation shows a
sharp acceleration in terms of the volume of projects selection. The total financial volume of
8 Commitments covering the main allocation of programmes (not including commitments made for the
performance reserve). 9 The reporting of financial data by MS for ERDF, CF and ESF does not provide a complete breakdown by
TO in particular for priority axis that cover multiple TOs. As a result the planned investment and total cost
of selected projects by TO presented above are understated by a share of the amounts found under the
heading "Multiple Thematic Objectives".

5
the selected projects had more than doubled in 9 months from EUR 58.8 billion to EUR 128.8
billion (20.2% of planned investment).
The financial data from 2014-2015 gives a first snapshot of early progress. There are
indications that, overall, early progress on the ground in selecting projects is broadly
comparable to the position at end-2009 (under the period 2007-2013) when Cohesion Policy
project selection was at a similar level. As then however, progress in selecting projects and
progress towards indicator targets is varied by Member State and by programme. This results
from a combination of the timing of the reporting obligation and the fact that many
programmes were only just adopted in 2015 and had still to start implementation.
As the 2015 data is very partial it does not provide a basis to draw robust conclusions across
the board on the success or likely success of the launch of programming in the Member
States. The 2015 snapshot clearly does not represent a full year's activity. It is expected that
the data by end-2016 will present a more representative picture of progress with
implementation activities at or approaching a full year's activity in terms of project selection,
expenditure and delivery of real benefits.
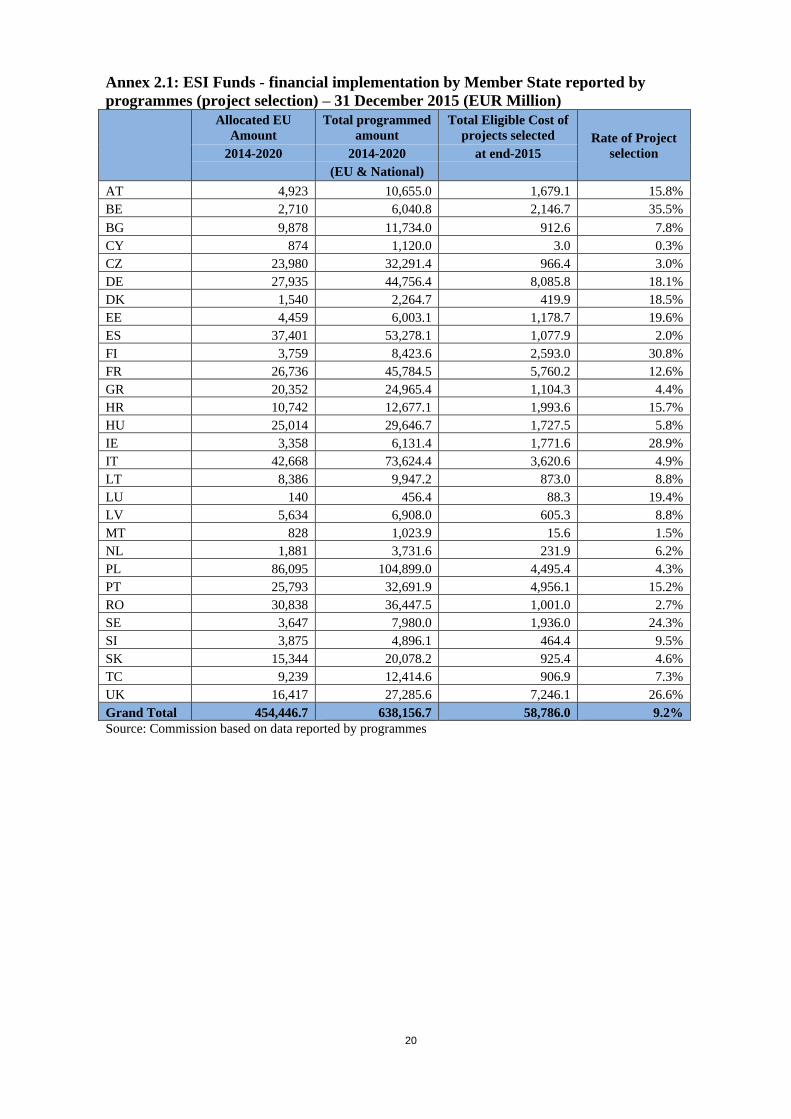
Annexes 1.1 and 1.2 show the breakdown by fund of project selection volumes at end-2015
and at autumn 2016 respectively. Annex 2.1 and 2.2 present the same financial data as
reported by each Member State. It can already be seen by comparing the two snapshots that
the early implementation trends are dynamic with, by autumn 2016, more homogenous
project selection rates across Member states and thematic objectives. While the Commission
is aware of some under reporting of project selection in some programmes by autumn 2016,
there are also indications in the most recent data of slow progress in specific areas.
2.1.2. Progress towards programme objectives
The 2016 AIRs provide information on progress towards the programmes' objectives.
Progress is measured by the number of project selected and their expected contribution to
those objectives.
By end-2015, Member States and regions selected 989 000 projects, ranging from large
infrastructure investments to individual support to farm holdings. The headline figures
reported by end-2015 among the different measures of programme performance are:
- All ESI Funds finance so far projects supporting 274 000 firms the projects selected;
- 2.7 million participants have benefitted from ESF supported projects;
- 11.1 million hectares of agricultural land or 6% of the Utilized Agricultural Area
(UAA) are selected for support for land management to better protect biodiversity;
- 24% of the total rural population (69 million inhabitants) is covered by selected
LEADER Local Action Groups (LAGs);
- More than 10% of Fisheries Local Action Groups (FLAGs) are operational and local
development strategies are selected.

6
Box 1: Overview of support to enterprises across ESI Funds
Support to enterprises - including farm and fishing enterprises - is planned mainly under the dedicated thematic
objective to improve SME competitiveness but also, for example, under the TOs on research and innovation,
digital economy and the low carbon economy. All ESI Funds target enterprise support. Progress in supporting
enterprises by end-2015 is prominent in the 2016 AIRs.
- A total of 274,000 firms are targeted by selected operations. That represents around 13.6% of the target of 2
million firms to be supported by the end of the period.
- The selected projects will support, or have delivered support to 138 000 firms under ERDF, 89 000 micro,
small and medium-sized enterprises under ESF and 47 000 rural firms under EAFRD (young farmers and
investments in physical assets in farm holdings).
2.2. Building programme delivery mechanisms
The effectiveness and quality of the programmes relies on three pillars: (a) sound structures
and procedures, (b) fulfilment of pre-requisites to overcome existing barriers to investment,
and (c) clear alignment with the priorities of the European Semester.
First, the successful launch of a programme under shared management requires that national
or regional managing authorities set up the programme structures and processes to ensure
sound and good quality investments over the life of the programme. Key activities included:
Designating responsible authorities;
Mobilising stakeholders, implementing bodies, and potential beneficiaries;
Establishing monitoring committees (selecting members and developing rules and
procedures);
Adapting or building IT applications (including e-cohesion to facilitate communication
with beneficiaries) and project monitoring systems (including in some cases data on
individual participants);
Defining selection criteria and launching calls for proposals for the different investment
areas, providing sufficient time to applicants to develop proposals and submit
application and evaluating the application, followed by finalising the offers and
agreeing physical (indicator) information on the selected operations.
All these elements were a major preoccupation of the programme authorities in 2014 and
2015 and are often described in the AIRs. Putting these elements in place was important for
the successful launch of the programmes but also underpins the medium and long term effort
needed to deliver quality investments focussed on results with the support of multiple
stakeholders in each programme.
Second, Member States and regions have to fulfil the prerequisites for the effective and
efficient investments co-financed by the ESI Funds - so-called ex ante conditionalities.
At programme adoption around 75% of all ex ante conditionalities were fulfilled. For the rest,
the Commission agreed specific action plans, which the majority of Member States have to

7
complete by end-2016. By 31 October 2016, the Commission has confirmed a third of the
action plans were completed. Significant progress has also been made on most of the
remaining action plans. Member States are obliged to include information on the completion
of ex ante conditionality action plans in the AIRs or the national progress reports to be
presented in mid-2017.
Box 2: Value added of ex ante conditionalities
Ex ante conditionalities improve the effectiveness and efficiency of investments supported by ESI Funds but also
have a positive impact on wider public and private investment in the Member States. They mainly concern:
- Establishing Strategic frameworks and management plans which contribute to prioritising investments in
order to reflect the needs of the European, national and regional level, as appropriate.
- Removing barriers to investment in a number of areas co-financed by the ESI Funds.
- Ensuring the presence of national regulatory frameworks that are compliant with legislation in the key areas
of the ESI Funds interventions.
- Improving institutional and administrative capacity of the public administration, as well as of the
beneficiaries of ESI Funds support.
Some examples of the implementation of ex-ante conditionalities and their benefits:
- Italy has adopted a National Strategy on broadband (conditionality 2.2) aligned to the EU 2020 targets
which aims to reduce the persisting gaps. The strategy envisages to provide coverage for up to 85% of the
Italian population with at least 100 Mbps broadband and coverage of at least 30 Mbps to all the Italian
population by 2020.
- Poland successfully completed the process of implementing the Directive on Energy Performance of
Buildings (conditionality 4.1 on energy efficiency). Without this ex ante conditionality, this process would
have taken longer to complete.
- In Latvia, elaboration of the national smart specialisation strategy (conditionality 1.1) contributed to the
structural reforms in the R&I sector, including a reform of research institutions. It also helped to focus
support on priority areas.
- In Romania, the national strategy for reducing early school leaving was adopted (conditionality 10.1) which
was translated into the relevant territorial levels. The objective is to increase school attendance and reduce
early school leaving, through a partnership approach and a robust monitoring mechanism.
- In Poland, General Ex-Ante Conditionality 3 on disability was fulfilled in 2015 by adoption of an agenda
for actions on equal opportunities, non-discrimination and gender equality for EU funds. The Polish
Ministry of Economic Development ensured that corresponding guidelines were compulsory for all
Managing Authorities. Moreover, Accessibility Officers have been designated and Commission services,
jointly with the Polish Ministry of Economic Development, monitor the implementation of these provisions
giving effect to Articles 6 and 7 of the CPR.
- Estonia developed and improved the Public Health Development Plan 2009–2020 in order to fulfil ex ante
conditionality 9.3 for the health sector. It contains a long-term mapping of necessary infrastructure
investment needs taking into account the expected demographic trends and a framework to launch
investment and enhance the cost-effectiveness of and the access to health care systems.
- Finland adopted national legislation that ensures administrative capacity is available to comply with the
implementation of a control inspection and enforcement system required by the Common Fisheries Policy.
The Commission will produce a staff working document on the added value of ex ante
conditionalities in spring 2017. A final analysis of fulfilment of ex ante conditionalities across
the ESI Funds will be presented in the Strategic report by end 2017. By mid-2017, a
communication on smart specialisation (EAC 1.1) will outline the achievements, challenges,
lessons learnt and future Commission actions to help the over 120 national and regional smart
specialisation strategies deliver on innovation-driven growth and jobs. It will in particular
outline how these strategies can bring together a bottom-up territorial approach with the

8
Commission's priorities and policies and foster synergies between directly and shared
managed EU funds supporting innovation, research, and competitiveness.
Third, as to the stronger link to EU economic governance and the European Semester,
more than two thirds of the Country Specific Recommendations (CSRs) in 2014 were relevant
for ESI Funds investment (in particular the ERDF and ESF) and have thus been integrated
into the Member States' programme priorities. They cover reforms in six main areas: research
and innovation, energy and transport, health care, labour market participation, education,
social inclusion and reform of the public administration. The Commission will finalise in
spring 2017 the study "Support of ESI Funds to the implementation of the Country Specific
Recommendations and to structural reforms in Member States". It will analyse how the
investment relevant CSRs of the years leading to programme adoption were taken into
account in the ESI Funded programmes. The national progress reports due in 2017 will also
set out information on and assess how the programmes are contributing to the Union's growth
strategy and to relevant CSRs.
3. IMPLEMENTATION OVERVIEW BY KEY THEMES
The volume of planned investments and expected achievements from the ESI Funds were
presented in the December 201510
. This report provides an overview of the early progress in
implementing the programmes in 2014 and 2015 in terms of the financial volume of the
projects selected and progress in contracting and delivering common outputs and results
focussing on the contents of the 2016 programme annual implementation reports.
Table 1 above provides an overview of the financial volume and rate of project selection
reported by thematic objective as at end-2015 for the ESI funds. In relation to the indicators
this report relies on the forecasts of the contribution expected from the selected projects and
the achievements reported under the common indicators for each fund. Examples of projects
already supported are also provided.
3.1. R&I, ICT and SME competitiveness
Overall, around EUR 181 billion support investments in this area, mainly from the ERDF and
the EAFRD. Projects amounting to around 7% of this amount (more than EUR 11.5 billion11
)
were selected and many were already in the implementation phase at the end of 2015.
The EUR 3.4 billion allocated to specific research and innovation projects under ERDF and
EAFRD represents 5.7% of the 2014-2020 total planned. By end-2015, 19 000 firms were
forecast to benefit from selected ERDF schemes promoting cooperation with research
institutes (15% of the target), while 5 000 researchers are forecast to benefit from improved
RTD infrastructure (7 % of the target).
Some 200 operational groups have already been set up under the European Innovation
Partnership for Agriculture Productivity and Sustainability (EIP-AGRI). These projects
10 Communication COM(2015) 639 - see footnote 1. 11 A share of the selection volume under "multi-thematic objectives" falls under this areas – see Table 1 (See
footnote 9).

9
funded by the EAFRD aim to foster innovative solutions for a competitive and sustainable
farming and forestry sector.
Phase II of the pan-European project "Extreme Light Infrastructure – nuclear physics" in Magurele,
Romania has been selected for EUR 140 million support from the ERDF. This research project on high
intensity lasers is open to researchers from public and private bodies worldwide with 100 researchers
already working there and a further 100 researchers expected to join on completion. The project also
brings socio-economic benefits and creates added value for the region (new jobs, modern infrastructure,
business development and increased the visibility and development potential).
A major cross border partnership is being supported in the Öresund-Kattegat-Skagerrak cross border area
to exploit existing neutron and synchrotron research facilities and develop an international RTDI capacity.
The project includes the creation of a new network for 150 researchers from universities and business, and
is the largest such partnership ever supported by Interreg in that region.
A local food cluster in Lower Austria initiated an EIP operational group for seasonal, low energy and
innovative vegetable production. The operational group brings together farmers, researchers, advisors and
an innovation broker to develop an innovative market niche, including the analysis and optimization of the
work flow towards winter vegetable production and marketing. A further expected result is the economic
and ecological assessment of the winter vegetable cultivation.
The EUR 737 million allocated to projects under the digital economy themes at end-2015
was 4% of the total planned. For the ERDF this activity was mainly related to project
selection in EE, FI, FR, IT, PL SE and SK. Most activities selected so far do not relate to the
fund common indicators available under this theme.
Early examples of progress are below.
In Finland the first phase Open Data of the Six Cities (Helsinki, Espoo, Vantaa, Tampere, Turku and Oulu)
is supported with EUR 3.4 million EU and national funds. The support will lead to common publishing
platforms and licencing to make public data widely available. The objective is to foster innovation as
business and developers use the data as the raw material for new services. The six participating cities offer
an attractive test environment and market for new trials and services.
In France a project was selected to connect 77 000 households in Provence-Alpes-Côte d'Azur to high
speed broadband.
Competiveness of SMEs is a priority under ERDF, EAFRD and EMFF programmes. EU
support of EUR 7.5 billion was allocated to specific projects by end-2015 (8.9% of the total
planned).
ERDF financing was granted to projects supporting 113 000 SMEs. Eight Member States
(DE, ES, FI, FR, IE, PT, SE, UK) and several Interreg programmes provide 95% of these
forecasts; 85 000 of those companies will be supported with advice and counselling; 25 000
start-ups are forecasted; At this early stage 65 000 jobs are expected to be directly created in
the supported firms.
More than 30 000 farm holdings were selected for investment operations to improve
competitiveness (9% of the overall target). 10 000 farmers were selected to receive support to
participate in quality schemes (8% of the target).
Around 80% of the EMFF projects, foreseen over the period, aim to strengthen SMEs and
increase the competitiveness of the fleet and of aquaculture enterprises. The start of
implementation has been relatively slow as only 10% of the projects selected until end-2015
focus on SME development.

10
The SME Initiative in Spain adopted in 2015 is the largest and the first instrument of this type set up with
ERDF support. Implementation is progressing quicker than expected. By March 2016 contracts with
financial institutions had already been signed for 76% of the total ERDF allocation for guarantees and the
financial intermediaries had already provided loans to some 14 000 SMEs for a total volume of EUR 1.4
billion. In view of its success, it is possible that Spain will increase the ERDF allocation to the SME
Initiative.
EAFRD will also play an important role in Spain addressing the needs of the agri-food SMEs for
investments and innovative solutions. The first projects have already been selected and benefit from a
public support of 170 million EUR (EAFRD will support 8 500 projects, which are expected to receive 1.5
billion EUR of public support). These investments will, for instance, improve the quality of the agricultural
products, or enable a more efficient use of water and energy.
The Hungarian Economic Development and Innovation programme targets the increase of
competitiveness and productivity of SMEs. Almost 2 900 contracts have been signed and close to EUR 200
million was paid to enterprises varying from micro to medium-sized companies. Many of these enterprises
are from the poorest areas of the country, where more favourable conditions encourage project promoters.
In France, 9 150 young farmers have been selected to benefit from 195 million EUR of EAFRD business
start-up aid in 2015. At the same time, under EAFRD transitional rules, 3 600 young farmers successfully
completed the implementation of their start-up projects supported by 57 million EUR.
3.2. Low carbon economy, climate change, environment and transport and energy
networks
The ESI Funds invest more than EUR 260 billion in the areas addressing sustainable
development. At the end of 2015, more than EUR 20 billion12
was already allocated to
specific projects, representing around 9% of the total amount (ranging from 4.3% to 10.5%)
across all funds that directly contribute (ERDF, CF, EAFRD and EMFF)13
.
In relation to Low carbon economy priorities EUR 2.3 billion of investment was supported
(4.3% of planned investment). The EAFRD project selected forecast coverage of 1 million
hectares of agricultural or forestry land for sequestration or conservation actions (25% of the
overall target corresponding to 2.4% of the overall Utilized Agricultural Area (UAA)) and 1.6
million hectares of agricultural land is under management contracts in view of reduce
greenhouse gases and ammonia emissions (31% of the target corresponding to 3% of the
overall UAA).
Lithuania has supported “Jessica II” Fund with EUR 150 million to finance the “Multi-apartment Building
Modernisation Programme". It targets energy efficiency modernisation of residential buildings across
Lithuania through preferential loans. By December 2015, EUR 100 million was paid to the fund and EUR
40 million was disbursed through 270 loan contracts. This resulted in improved energy consumption for
over 1 014 households and reduced GHG emissions by 2 400 tons.
Latvia has launched a project to create a network of 218 electro vehicles charging points to cover the
whole country by 2021. The aim of the project is to decrease dependency in the transport system on oil
products as well the use of innovative technologies in the transport sector.
In relation to climate and risk prevention, EUR 6.6 billion of project selection was reported
(17.3% of total planned). EAFRD has so far supported 11.1 million hectares of agricultural
land for specific land management aiming at better protection of biodiversity (36% of the
12 See footnote 11.
13 The ESF contributes to sustainable development objectives, i.e, green skills, through the secondary
objectives of support under thematic objective 8 and 10 in particular.
11
farmed area to be supported) and 1.6 million hectares were under support to convert/maintain
organic farming (15.7% of the farmed area to be supported).
In Thuringia, Germany, a region prone to flooding having faced several severe floods in the past 15 years,
almost 13 000 persons are benefiting from ERDF flood protection measures in 2014 and 2015. In Eisenach
for example, it is estimated that a damage potential of around EUR 180 million could be avoided as a
result.
In the German region of Schleswig-Holstein, selected investments projects to provide flood and coastal
protection for rural areas will benefit from EUR 102 million. In 2015, EAFRD already contributed to the
flood and coastal protection with EUR 73 million.
In relation to environment and resource efficiency priorities total investment of EUR 7.6
billion was allocated to projects (10.5% of total planned). That includes selected EAFRD
projects of more than 420 million in total public expenditure addressing renewable energy and
water and energy efficiency objectives. Under ERDF and CF no significant values were yet
reported for the common indicators measuring waste recycling capacity, improved wastewater
treatment or improved water supply outputs, though programmes have reported values for
specific indicators. Around 90% of all projects selected for EMFF support by end-2015
promote resource efficiency and the protection of the environment. Most of those projects aim
at protecting and restoring marine biodiversity by substantially increasing physical control of
landings and lowering the volume of unwanted catches thereby supporting the implementation
of the Common Fisheries Policy.
In the Netherlands, 130 000 hectares benefited from EAFRD support to enhance biodiversity or to improve
water management, e.g., through better use of fertilisers and pesticides. Efficiency of the environmental
actions has also been increased through a new innovative cooperative approach. Farmers have more
flexibility to adapt the actions to changing factor such as weather conditions.
In relation to investment in strategic networks, significant TEN-T and other transport
investments are planned under the ERDF and Cohesion Fund. Overall project selection by
end-2015 was EUR 4.1 billion (6.2% of planned). In the case of transport projects the notable
examples of projects selected are:
Almost 150 km of reconstructed or upgraded TEN-T railways in Estonia and close to 140 km in Poland are
already selected for funding;
In Poland nearly 320 km of new TEN-T roads will be delivered under the selected projects;
Box 3: Mainstreaming of climate action into ESI Funds 2014-2020
Climate action is mainstreamed into the ESI Funds through the regulatory framework. A common methodology
applies to the calculation of climate change support in all funds14. The methodology identifies specific categories
of support that contribute to climate action giving them a zero, 40% or 100% weighting. All funds contribute
positively to climate action. Overall, about 25% of ESI Funds will support climate action objectives in the period
2014-2020. ERDF and EAFRD are the two funds that contribute most of the support for climate action.
The 2017 AIRs from the programmes will report for the first time on support used for climate change objectives.
The Commission in its 2017 summary report will summarise the reported information on climate action and
provide a detailed breakdown of the climate related expenditure on the ESI Funds Open Data Platform.
14 Commission Implementing Regulation (EU) No 215/2014 of 7 March 2014

12
3.3. Employment, social inclusion and education
Over EUR 168 billion in support is planned in this area, particularly from the ESF, with
ERDF, EAFRD and EMFF also investing. Projects amounting to more than 12% of this
amount (more than EUR 11.5 billion15
) were selected and many had already delivered support
to people at the end of 2015.
The ESF is the main EU fund investing in employment, social inclusion and education,
alongside the YEI, ERDF, EAFRD and EMFF.
Overall, implementation of the ESF by end-2015 showed an average ESF project selection
rate of 13.3%, paving the way for a strong contribution of the ESI Funds to the Europe 2020
objectives in these areas. The breakdown of the project selection rate by thematic objective
for the ESI Funds as a whole is provided in Table 1 above.
In aggregate terms the ESF and YEI actions delivered:
2.7 million participants16
, including 1.6 million unemployed and 700 000 inactive;
Amongst those participants 235 000 were in employment following an ESF or YEI
operation, 181 000 had gained a qualification upon leaving an ESF or YEI operation;
100 000 participants were in education or training thanks to ESF or YEI support;
275 000 disadvantaged participants in ESF or YEI-funded operations were engaged in
job searching, education/training, gained a qualification or were in employment,
including self-employment.
Implementation of operations in the area of employment (TO8) was ongoing in all Member
States by end-2015, albeit to varying degrees as regards the different investment priorities.
ESF interventions seeking to increase access to the labour market are already adequately
reaching unemployed (1.1 million) and inactive (230 000) individuals. Implementation of
self-employment and active and healthy ageing operations had a relatively slow start.
In Poland, the ESF funded national programme provided support to 122,900 participants, of which
110,600 unemployed (90% of all participants), 11,100 inactive (9%) and 1,200 in work. As a result, over
46,600 people found a job, 7,500 people gained qualifications, and 1,500 people started education or
training.
Sweden is one of the Member State where YEI implementation has progressed rapidly. 6 215 young persons
(15-24 years old) participated in YEI-supported activities, or 31% of the 20 000 participants targeted until
2018. 3 362 participants finished the activities before the end of December 2015, of whom 25% found full
time employment and another 25% part time employment.
15 See footnote 11.
16 96 % of which is reported by 10 Member States (ES, FR, IT, DE, BE, IE, PL, GR, NL, PT).
13
Box 4: Youth Employment Initiative (YEI)
The Commission's communication on "The Youth Guarantee and the Youth Employment Initiative Three
Years On"17 already provided important insights on the first results of the YEI.
Despite the early eligibility of the YEI (from 1 September 2013) and the increased pre-financing in 2015,
Member States have encountered challenges, which have resulted in lower implementation on the ground than
anticipated. The AIRs report that Member States took steps to overcome these challenges by strengthening and
fine-tuning implementation structures, procedures and tools. The vast majority of YEI programmes (75%)
identify YEI implementation as completely or mostly in line with their initial planning. This is a very positive
signal for future implementation. By end-2015, out of the 501 000 young participants, who took part in a YEI-
supported operation:
- 203 000 had completed a YEI intervention, including 80,250 long-term unemployed;
- 82 000 had received an offer of employment, continued education, apprenticeship or traineeship upon
leaving;
- And 109 000 were in education or training, gained a qualification or in employment following a YEI
intervention.
By end of July 2016 Member States had already declared that 1.4 million young people had benefitted from the
YEI.
Social inclusion (TO9) is the area after TO 10 Education and Vocational Training where the
most noticeable progress for the ESF can be witnessed. First data on implementation is
promising. Out of the 631 000 ESF participants, 39.8% were coming from jobless households
and 32.1% were migrants, with a foreign background or belonged to a minority – showing the
focus on those most in need of support. 55 000 participants already found a job.
Under the ERDF progress by end-2015 in supporting health infrastructure was marginal.
Support to selected integrated urban development strategies covers 1.7 million people (5% of
the target set).
In the Netherlands, 94 000 participants far from the labour market have benefitted from ESF support under
the active inclusion strand, out of which 89% were disadvantaged participants and 49% young people
under 25.
Germany has set up an on-the-job training programme providing language support to up to 20 000
participants with migrant background.
In Bulgaria, support was provided to vulnerable groups (old people and disabled of all ages) through
integrated social and health services in all 28 regions of the country. 14 000 old people and persons with
permanent disabilities and inability to self-service have been supported by 13 600 personal assistants and
by provision of integrated services facilitating access to social and health care facilities, specialised
vehicle, professional psychological counselling and rehabilitation procedures.
785 (out of the planned 2 530) LEADER Local Action Groups (LAGs), funded under EAFRD, were
selected. They cover 24% of the total rural population or 69 million inhabitants (the target is 57% of the
total rural population). Leader projects in Sweden, Finland and Germany have supported the social
inclusion of migrants through activities ranging from socio-cultural integration to initiatives with a longer-
term perspective, seeking to integrate them into the labour market.
In Denmark and Sweden projects have been selected under the EMFF supporting employability and labour
mobility in coastal communities.
17 Communication COM(2016) 646 final of 4 October 2016, The Youth Guarantee and Youth Employment
Initiative three years on

14
Education and Vocational Training investments (TO10) also showed significant
implementation progress with 539 000 participants, of which at least 47% had only a primary
and lower secondary educational level and 83 000 participants had already gained a
qualification thanks to ESF support by end-2015.
In Portugal, scholarships under the "Human Capital" OP have provide better access to higher education
opportunities to nearly 50 000 participants. In addition, more than 60 000 participants have already
benefited from professional courses.
Lithuania supported the creation of 42 000 new spaces in childcare or education infrastructure with ERDF
support.
3.4. Strengthening institutional capacity and efficient public administration
Overall around EUR 6 billion has been programmed to support the strengthening of
institutional capacity and efficient public administration purpose mainly from the ESF with
support also planned from the ERDF. Over 11% of the total budget was allocated to projects
by end-2015.
The operations selected by end-2015 have a total value of EUR 680 million. The projects are
found in BG, EE, FR, HR, IT, PL and under Interreg. 97 000 public administration staff
members had been supported by ESF with and 31 projects targeting public administrations or
public services at national, regional or local level been reported by the Member States. Under
planned ERDF support the Interreg programmes had made significant progress in selecting
projects for support.
3.5. Progress implementing financial instruments
The 2016 AIRs also included the first detailed reporting on financial instruments (FIs) to end-
2015. The overall outlook is positive with 21 Member States reporting progress on FIs. The
total volume of programme contributions committed to FIs amounts to EUR 5 737 million (of
which EUR 5 163 million ESIF). Around 20% of the amounts committed have been paid to
FIs (almost exclusively under ERDF and CF). There are significant differences across MS
regarding the roll out of FIs at this early stage, ranging from countries that are taking steps to
complete ex-ante assessments to FIs which have already demonstrated concrete results in
terms of leverage and resources returned for further investments.
The progress by end-2015 in implementing financial instruments by Fund and by theme was
presented in the summaries of data published by the Commission on 30th November 201618
.
3.6. Interreg
The ERDF funded Interreg programmes falling under the Territorial Cooperation goal had
generated a financial volume of EUR 900 million of selected projects by end-2015 (7.4% of
planned). Examples of early evidence of physical progress under INTERREG are reflected in
the aggregated indicators (see above), in some of the examples provided under key investment
themes and on the Interreg "country" page on the ESI Funds Open Data Platform.
18 2016 Summaries of data under CPR Article 46.4:
http://ec.europa.eu/regional_policy/sources/thefunds/fin_inst/pdf/summary_data_fi_1420_2015.pdf

15
4. REINFORCING THE EVALUATION OF THE PROGRAMMES
For 2014-2020 a stronger emphasis is placed on the need to evaluate the effects of the policies
co-financed through the ESI Fund programmes. The programmes define objectives that are
specific and articulate the change sought by the investments. Evaluations are essential for
confirming whether those changes take place and whether the contributions made by the
programmes contribute to their specific objectives.
By end-2015 there were few evaluations of the results and impacts linked to the 2014-2020
period, largely due to an insufficient volume of completed projects. The principal exception
relates to the Youth Employment Initiative where 19 national evaluations were completed by
June 2016. The studies and evaluations that were conducted by programmes during 2014-
2015 focussed on ex-post evaluation of the 2007-2013 programmes and implementation
issues related to 2014-2020. According to the evaluation plans this pattern is likely to be
repeated in 2016 and 2017.
While actual evaluations conducted were understandably few in number, Cohesion Policy
programmes were active in preparing evaluation plans in line the obligations for 2014-2020.
While for the EAFRD and the EMFF evaluation plans were adopted as part of the operational
programmes, for the Cohesion Policy funds evaluation plans need to be defined within
12 months of programme adoption. Evaluation plans are now largely in place to deliver on
this obligation. The Commission has examined the evaluation plans received until 30 June
2016 which confirm that unprecedented work is under way in the programmes to provide
more robust evaluation of the implementation and achievements.
The evaluation plans are clear on the governance of the evaluation and on the communication
of results. They are however weaker on evaluation design and methods as well as on data
availability and systems. The Commission considers that the plans for the Cohesion Policy
programmes should be regularly reviewed and will need further improvements especially on
those aspects that require more specific expertise in planning and carrying out evaluations, on
consolidating the number of evaluations and delivering evidence of impacts earlier than
currently planned in some cases in order to inform future policy making.
A separate Staff Working Document19
provides a detailed overview of the evaluations
delivered so far and of the evaluation effort planned during the 2014-2020 period. It also
describes the different work strands pursued by the Commission to support the work of the
programmes (networking, guidance, helpdesks, etc.) and the evaluation work that is planned
by the Commission in the coming years.
Separately, the Commission's own ex post evaluations for the period 2007-2013 are finalised
or will soon be finalised20
.
19 SWD(2016) 447 available on this webpage: http://ec.europa.eu/regional_policy/en/policy/how/stages-step-
by-step/strategic-report/ 20 For the ERDF/CF ex post evaluation 2007-2013 – SWD(2016) 318 of 19 September 2016:
http://ec.europa.eu/regional_policy/sources/docgener/evaluation/pdf/expost2013/wp1_swd_report_en.pdf
For the ESF the forthcoming Ex-post evaluation 2007-2013 – will be made available here:
http://ec.europa.eu/social/main.jsp?langId=en&catId=701

16
5. CONCLUSIONS
The ESI Fund programmes represent a major investment instrument of the European Union
and every region and country in the European Union benefits from the policy. Its enhanced
legal framework for the 2014-2020 programming period brings significant policy innovation
contributing to the initiative EU Budget Focussed on Results. A series of modern elements to
deliver high quality investments has been introduced as part of the reform. Putting this
ambitious new approach into practice in Member States and regions required time and
resources in the start-up phase to ensure that the necessary conditions for effective spending
are in place. This coincided with the effort to complete the 2007-2013 programmes in order to
exploit fully the investment opportunities they presented.
It is now imperative that the implementation of the new programmes accelerates across
all the European Union. In particular the selection of good quality projects and their
effective implementation must be accelerated to deliver on the investment ambitions and
expected socio economic benefits for our citizens and firms. Member States must also present
evidence of expenditure to the Commission more promptly to allow an orderly execution of
the EU budget.
Project selection and expenditure on the ground provide a more accurate picture of
implementation than EU payment execution. The evidence from 2016 financial monitoring
shows that implementation has already started to accelerate with EUR 128.8 billion of
investments – 20.2% of the total for the period - allocated to specific projects by autumn 2016
compared to EUR 58.8 billion by end-2015. This more recent data shows more homogeneous
progress across most of the Member States and themes. The development of these trends will
be further assessed in the context of the 2017 reporting cycle.
The programme reporting cycle in mid-2017, involving comprehensive programme reports by
June 2017 and national progress reports by end-August 2017, will provide a fuller picture of
implementation, progress towards investment and policy objectives and will bring more
qualitative reporting. In particular those reports will contain more information and assess
implementation against a list of strategic issues21
, including for example on:
An assessment of the contribution to the achievement of Europe 2020 objectives, to the
Fund-specific missions, including to the implementation of relevant country specific
recommendations under the European Semester;
A first report on progress towards the financial and physical milestones under the
performance frameworks to be used to award the performance reserve in 2019;
A stocktaking on completion of the action plans linked to outstanding ex ante
conditionalities. (In case of failure to complete action plans to fulfil ex ante
conditionalities the Commission may suspend payments to the programme(s) concerned
in 2017.);
Implementation of mechanisms to ensure coordination between ESI Funds and other
Union and national funding instruments and with the EIB (to include synergies and
complementarity with the European Fund for Strategic Investments).
21 See Article 52 of the CPR

17
Those reports from the Member States will be synthesised by the Commission in a strategic
report by end-2017.

18
ANNEXES
Annex 1.1: ESI Funds - financial implementation by thematic objective reported by programmes (project selection)
31 December 2015 (EUR million)
TO Thematic Objectives Total planned
investment
Total eligible cost of selected projects at end-2015 Rate of project
selection ERDF EAFRD ESF/ YEI CF EMFF Total
01 Research & Innovation 59,549.3 3,230.8 147.6 - - - 3,378.4 5.7%
02 Information &
Communication Technologies
18,297.6 629.9 106.7 - - - 736.7 4.0%
03 Competitiveness of SMEs 83,593.6 3,145.9 4,294.3 - - 36.4 7,476.6 8.9%
04 Low-Carbon Economy 52,777.2 1,131.3 1,129.7 - 13.0 - 2,274.0 4.3%
05 Climate Change Adaptation &
Risk Prevention
37,783.6 263.1 6,176.0 - 115.0 - 6,554.2 17.3%
06 Environment Protection &
Resource Efficiency
72,316.2 196.5 6,587.4 - 663.0 126.1 7,573.0 10.5%
07 Network Infrastructures in
Transport and Energy
66,659.5 648.3 - - 3,491.3 - 4,139.6 6.2%
08 Sustainable & Quality
Employment
46,390.9 29.9 199.2 6,226.2 - 1.6 6,456.9 13.9%
09 Social Inclusion 53,551.9 73.9 821.3 4,071.5 - - 4,966.8 9.3%
10 Educational & Vocational
Training
42,315.6 79.8 128.1 5,542.0 - - 5,749.8 13.6%
11 Efficient Public
Administration
6,080.2 180.2 - 500.5 - - 680.7 11.2%
12 Outermost & Sparsely
Populated
220.5 47.8 - - - - 47.8 21.7%
DM Discontinued Measures 928.0 - - - - - - 0.0%
Multiple Thematic Objectives
(ERDF/CF/ESF)
78,980.5 3,046.1 - 2,986.7 44.4 - 6,077.2 7.7%
TA Technical Assistance 18,712.1 1,159.4 298.7 851.6 363.7 1.0 2,674.3 14.3%
Total 638,156.7 13,862.9 19,889.0 20,178.5 4,690.4 165.1 58,786.0 9.2%
Source: Commission based on data reported by programmes

19
Annex 1.2: ESI Funds - financial implementation by thematic objective reported by programmes (project selection)
Autumn 2016 (EUR million)
TO Thematic Objectives
Total
programmed
amount
2014-2020
Total eligible cost of selected projects at Autumn 2016 Rate of project
selection ERDF EAFRD ESF/ YEI CF EMFF Total
01 Research & Innovation 59,549.3 10,196.8 321.2 - - - 10,518.0 17.7%
02 Information &
Communication Technologies
18,297.6 1,816.5 370.7 - - - 2,187.2 12.0%
03 Competitiveness of SMEs 83,593.6 8,532.7 7,831.7 - - 36.4 16,400.8 19.6%
04 Low-Carbon Economy 52,777.2 2,709.8 1,518.8 - 1,174.0 - 5,402.6 10.2%
05 Climate Change Adaptation &
Risk Prevention
37,783.6 497.1 8,555.7 - 1,178.0 - 10,230.7 27.1%
06 Environment Protection &
Resource Efficiency
72,316.2 1,734.5 9,464.8 - 2,393.4 126.1 13,718.8 19.0%
07 Network Infrastructures in
Transport and Energy
66,659.5 3,474.4 - - 7,751.7 - 11,226.0 16.8%
08 Sustainable & Quality
Employment
46,390.9 247.2 498.2 11,222.4 - 1.6 11,969.4 25.8%
09 Social Inclusion 53,551.9 939.6 2,670.9 7,100.1 - 10,710.6 20.0%
10 Educational & Vocational
Training
42,315.6 951.8 226.5 7,584.8 - 8,763.1 20.7%
11 Efficient Public
Administration
6,080.2 378.1 - 909.2 - 1,287.3 21.2%
12 Outermost & Sparsely
Populated
220.5 234.0 - - - 234.0 106.1%
DM Discontinued Measures 928.0 - - - - - 0.0%
Multiple Thematic Objectives
(ERDF/CF/ESF/EMFF)
78,980.5 10,381.4 - 4,800.7 917.1 356.8 (2) 16,456.1 20.4%
TA Technical Assistance 18,712.1 2,213.3 490.4 1,588.9 902.0 5,195.6 27.8%
Total 638,156.7 44,307.1 31,948.8 33,206.1 14,316.1 521.9 124,300.0 19.4%
Ad-Hoc reporting (ES) 4,500.0
Corrected Total 638,156.7 48,807.1 31,948.8 33,206.1 14,316.1 521.9 128,800.0 20.2%
Source: Commission based on data reported by programmes Notes: (1) For more information on the source of this data see footnotes to Annex 2.2
(2) Ad-Hoc reporting by EMFF programmes to end October 2016.
20
Annex 2.1: ESI Funds - financial implementation by Member State reported by
programmes (project selection) – 31 December 2015 (EUR Million)
Allocated EU
Amount
Total programmed
amount
Total Eligible Cost of
projects selected Rate of Project
selection 2014-2020 2014-2020 at end-2015
(EU & National)
AT 4,923 10,655.0 1,679.1 15.8%
BE 2,710 6,040.8 2,146.7 35.5%
BG 9,878 11,734.0 912.6 7.8%
CY 874 1,120.0 3.0 0.3%
CZ 23,980 32,291.4 966.4 3.0%
DE 27,935 44,756.4 8,085.8 18.1%
DK 1,540 2,264.7 419.9 18.5%
EE 4,459 6,003.1 1,178.7 19.6%
ES 37,401 53,278.1 1,077.9 2.0%
FI 3,759 8,423.6 2,593.0 30.8%
FR 26,736 45,784.5 5,760.2 12.6%
GR 20,352 24,965.4 1,104.3 4.4%
HR 10,742 12,677.1 1,993.6 15.7%
HU 25,014 29,646.7 1,727.5 5.8%
IE 3,358 6,131.4 1,771.6 28.9%
IT 42,668 73,624.4 3,620.6 4.9%
LT 8,386 9,947.2 873.0 8.8%
LU 140 456.4 88.3 19.4%
LV 5,634 6,908.0 605.3 8.8%
MT 828 1,023.9 15.6 1.5%
NL 1,881 3,731.6 231.9 6.2%
PL 86,095 104,899.0 4,495.4 4.3%
PT 25,793 32,691.9 4,956.1 15.2%
RO 30,838 36,447.5 1,001.0 2.7%
SE 3,647 7,980.0 1,936.0 24.3%
SI 3,875 4,896.1 464.4 9.5%
SK 15,344 20,078.2 925.4 4.6%
TC 9,239 12,414.6 906.9 7.3%
UK 16,417 27,285.6 7,246.1 26.6%
Grand Total 454,446.7 638,156.7 58,786.0 9.2%
Source: Commission based on data reported by programmes

21
Annex 2.2: ESI Funds - financial implementation by Member State reported by
programmes (project selection) – Autumn 2016 (EUR million)
Allocated EU
Amount
Total
programmed
amount
Total Eligible Cost of
projects selected Rate of Project
selection 2014-2020 2014-2020 at Autumn 2016
(EU & National)
AT 4,923 10,655.0 2,011.2 18.9%
BE 2,710 6,040.8 2,538.5 42.0%
BG 9,878 11,734.0 2,846.6 24.3%
CY 874 1,120.0 56.9 5.1%
CZ 23,980 32,291.4 3,092.4 9.6%
DE 27,935 44,756.4 13,466.6 30.1%
DK 1,540 2,264.7 651.6 28.8%
EE 4,459 6,003.1 2,187.6 36.4%
ES 37,401 53,278.1 7,086.4 1 13.3%
FI 3,759 8,423.6 3,401.7 40.4%
FR 26,736 45,784.5 9,481.7 20.7%
GR 20,352 24,965.4 2,991.7 12.0%
HR 10,742 12,677.1 1,148.9 9.1%
HU 25,014 29,646.7 11,578.2 39.1%
IE 3,358 6,131.4 2,058.7 33.6%
IT 42,668 73,624.4 10,394.8 14.1%
LT 8,386 9,947.2 2,248.4 22.6%
LU 140 456.4 92.4 20.2%
LV 5,634 6,908.0 1,654.0 23.9%
MT 828 1,023.9 185.1 18.1%
NL 1,881 3,731.6 1,019.0 27.3%
PL 86,095 104,899.0 14,314.2 13.6%
PT 25,793 32,691.9 11,063.9 33.8%
RO 30,838 36,447.5 2,617.1 7.2%
SE 3,647 7,980.0 2,689.1 33.7%
SI 3,875 4,896.1 1,073.0 21.9%
SK 15,344 20,078.2 3,436.7 17.1%
TC 9,239 12,414.6 2,849.8 23.0%
UK 16,417 27,285.6 10,207.3 37.4%
Grand Total 454,446.7 638,156.7 128,443.2 20.1%
EMFF ad-hoc
reporting
30/10/2016 356,8
Total with EMFF 128,800.0 20.2%
Source: Commission based on data reported by programmes
Notes:
In Annexes 1.2 and 2.2, the period covered by the financial data reported by Fund is as follows:
1. For Cohesion Policy programmes the most recent data on project selection relate to 30 September
2016. For ES an amount of EUR 4 500 million was reported as allocated by Autumn 2016 under the
ERDF (ad-hoc reporting).
2. For EAFRD programmes the most recent data on project selection relate to 31 August 2016.
3. For EMFF programmes the most recent data formally reported on project selection relate to 31
December 2015. Additional ad-hoc reporting is added separately at the end of the table above.
The financial data presented above is a snapshot of the data notified by the programmes as at 9 November
2016 and may subsequently be corrected or completed by programmes where necessary.
The next reporting deadline for Cohesion Policy programmes is 31 January 2017 (for financial data until
end 2016).