european weed research society - ewrs · european weed research society ... centro...
TRANSCRIPT

Europäische Gesellschaftfür Herbologie
EUROPEANWEEDRESEARCHSOCIETYSociété Européennede Malherbologie
Proceedings
5th EWRS Workshop onPhysical and Cultural Weed Control
Pisa, Italy
scuola superiore Sant'Anna
di studi universitari e di perfezionamento
11-13 March 2002
ii
The Proceedings were compiled and produced by
Daniel C. CloutierInstitut de malherbologieP.O. Box 222Sainte-Anne-de-Bellevue(Québec) H9X 3R9CanadaTel. 514-630-4658Fax 514-695-2365E-mail: [email protected]
Scientific organisers
Dr Paolo BàrberiScuola Superiore Sant'Anna di Studi Universitari e di PerfezionamentoClasse di Scienze Sperimentali - Settore di Scienze AgrarieP.za Martiri della Libertà 3356127 Pisa, ItalyTel. +39-050-883.448/9Fax +39-050-883.215E-mail: [email protected]: www.sssup.it/~barberi/index.htm
Dr Daniel C. CloutierInstitut de malherbologieP.O. Box 222Sainte-Anne-de-Bellevue(Québec) H9X 3R9CanadaTel. 514-630-4658Fax 514-695-2365E-mail: [email protected]
Produced February 19, 2002, corrected March 31, 2003

iii
Local organisers
Dr Paolo BàrberiScuola Superiore Sant'Anna di Studi Universitari e di PerfezionamentoClasse di Scienze Sperimentali - Settore di Scienze AgrarieP.za Martiri della Libertà 3356127 Pisa, ItalyTel. +39-050-883.448/9Fax +39-050-883.215E-mail: [email protected]: www.sssup.it/~barberi/index.htm
Dr Marco GinanniCentro Interdipartimentale di Ricerche Agro-ambientali "E. Avanzi"Università di PisaVia Vecchia di Marina 656010 S. Piero a Grado (PI), ItalyTel. +39-050-96.35.32Fax +39-050-96.03.30E-mail: [email protected]
Camilla MoonenScuola Superiore Sant'Anna di Studi Universitari e di PerfezionamentoClasse di Scienze Sperimentali - Settore di Scienze AgrarieP.za Martiri della Libertà 3356127 Pisa, ItalyTel.+39-050-883.448/9Fax +39-050-883.215E-mail: [email protected]
Prof. Andrea PeruzziDipartimento di Agronomia e Gestione dell'Agro-ecosistema - SettoreMeccanica AgrariaUniversità di PisaVia S. Michele degli Scalzi 256124 Pisa, ItalyTel. +39-050-59.92.63Fax +39-050-54.06.33E-mail: [email protected]
Dr. Michele RaffaelliDipartimento di Agronomia e Gestione dell'Agro-ecosistema - SettoreMeccanica AgrariaUniversità di PisaVia S. Michele degli Scalzi 256124 Pisa, ItalyTel. +39-050-59.92.66Fax +39-050-54.06.33E-mail: [email protected]

iv
Table of contents
Preventive/cultural weed control and weed community dynamics . . . . . . . . . . . 1
Weed growth and control as influenced by soyabean row spacing and soil tillage for seed bed preparationFrancesco Vidotto, Aldo Ferrero, Roberto Busi, Anna Saglia . . . . . . . . . . . . . . . . . . . . . . . . . . . . 2
Simple innovations to improve the effect of the false seedbed techniqueR.Y. van der Weide, P.O. Bleeker and L.A.P. Lotz . . . . . . . . . . . . . . . . . . . . . . . . . . . . . . . . . . . . 3
Assessment of cropping system effects on weed managementusing matrix population models Adam S. Davis and Matt Liebman . . . . . . . . . . . . . . . . . . . . . . . . . . . . . . . . . . . . . . . . . . . . . . . . . 5
Computer model for simulating the long-term dynamics of annual weeds under different cultivation practicesI.A. Rasmussen, N. Holst, L. Petersen, K. Rasmussen . . . . . . . . . . . . . . . . . . . . . . . . . . . . . . . . . 6
Optimization of cultivation timing by using a weed emergence modelMaryse L. Leblanc and Daniel C. Cloutier . . . . . . . . . . . . . . . . . . . . . . . . . . . . . . . . . . . . . . . . . 14
Effect of the combination of the stale seedbed technique with cultivations on weed control in maizeDaniel C. Cloutier and Maryse L. Leblanc . . . . . . . . . . . . . . . . . . . . . . . . . . . . . . . . . . . . . . . . . 17
Mechanical and physical weed control in maizeP. Balsari, G. Airoldi, A. Ferrero . . . . . . . . . . . . . . . . . . . . . . . . . . . . . . . . . . . . . . . . . . . . . . . . . 18
Analysis of weeds succession and competitiveness as related to the sowing date and another crop techniques of sugar beetG. Campagna, G. Rapparini . . . . . . . . . . . . . . . . . . . . . . . . . . . . . . . . . . . . . . . . . . . . . . . . . . . . 32
Influence of fallow land-use intensity on weed dynamics and crop yield in southern CameroonM. Ngobo, S. Weise and M. McDonald . . . . . . . . . . . . . . . . . . . . . . . . . . . . . . . . . . . . . . . . . . . 41
Effects of crop density, spatial uniformity and weed specieson competition with spring wheat Triticum aestivum.Jannie Maj Olsen, Lars Kristensen, Hans-Werner Griepentrog and Jacob Weiner . . . . . . . . . . . 45
Preventive weed control in lower input farming systemV. Pilipavicius . . . . . . . . . . . . . . . . . . . . . . . . . . . . . . . . . . . . . . . . . . . . . . . . . . . . . . . . . . . . . . . 46
The effects of cultural practices on crop and weed growth in organic spring oatsB. R. Taylor and D. Younie . . . . . . . . . . . . . . . . . . . . . . . . . . . . . . . . . . . . . . . . . . . . . . . . . . . . . 57
v
Effect of crop competition and cultural practices on the growth of Sonchus arvensisP. Vanhala, T. Lötjönen & J. Salonen . . . . . . . . . . . . . . . . . . . . . . . . . . . . . . . . . . . . . . . . . . . . . 67
The action spectrum for maximal photosensitivity of germination and significance forlightless tillage K. M. Hartmann & A. Mollwo . . . . . . . . . . . . . . . . . . . . . . . . . . . . . . . . . . . . . . . . . . . . . . . . . . 70
A degree-day model of Cirsium arvense predicting shoot emergence from root budsR. K. Jensen, D. Archer & F. Forcella . . . . . . . . . . . . . . . . . . . . . . . . . . . . . . . . . . . . . . . . . . . . . 79
Weediness in 40- year period without herbicideL. Zarina . . . . . . . . . . . . . . . . . . . . . . . . . . . . . . . . . . . . . . . . . . . . . . . . . . . . . . . . . . . . . . . . . . . . 81
Inter- and intra-row mechanical weed control . . . . . . . . . . . . . . . . . . . . . . . . . . . . . 82
Relationship between speed, soil movement into the cereal row and intra-row weed control efficacy by weed harrowingA. Cirujeda, B. Melander, K. Rasmussen, I. A. Rasmussen . . . . . . . . . . . . . . . . . . . . . . . . . . . . 83
Experiences and experiments with new intra-row weedersPiet Bleeker, Rommie van der Weide and Dirk Kurstjens . . . . . . . . . . . . . . . . . . . . . . . . . . . . . 97
An experimental study of lateral positional accuracy achieved duringinter-row cultivation.M C W Home, N D Tillett, T Hague, R J Godwin . . . . . . . . . . . . . . . . . . . . . . . . . . . . . . . . . . 101
Weed control by a rolling cultivator in potatoesKarsten Rasmussen . . . . . . . . . . . . . . . . . . . . . . . . . . . . . . . . . . . . . . . . . . . . . . . . . . . . . . . . . . 111
Options for mechanical weed control in string bean – work parameters and crop yieldM. Raffaelli, P. Bàrberi, A. Peruzzi & M. Ginanni . . . . . . . . . . . . . . . . . . . . . . . . . . . . . . . . . . 119
Mechanical intra-row weed control in organic onion productionJ. Ascard & F. Fogelberg . . . . . . . . . . . . . . . . . . . . . . . . . . . . . . . . . . . . . . . . . . . . . . . . . . . . . 125
Experiences related to the use of the weeding harrow and of the roll-star cultivator inEmilia-Romagna for weed control on hard and common wheat, sunflower and soyabean inorganic agricultureL. Dal Re and A. Innocenti . . . . . . . . . . . . . . . . . . . . . . . . . . . . . . . . . . . . . . . . . . . . . . . . . . . . 126
Physical methods for weed control in potatoesJ.A. Ivany . . . . . . . . . . . . . . . . . . . . . . . . . . . . . . . . . . . . . . . . . . . . . . . . . . . . . . . . . . . . . . . . . . 129
Different combinations of weed management methods in organic carrotL. Radics, I. Gál, P. Pusztai . . . . . . . . . . . . . . . . . . . . . . . . . . . . . . . . . . . . . . . . . . . . . . . . . . . . 137
Options for mechanical weed control in grain maize – effects on weedsM. Raffaelli, P. Bàrberi, A. Peruzzi & M. Ginanni . . . . . . . . . . . . . . . . . . . . . . . . . . . . . . . . . . 147

vi
Options for mechanical weed control in grain maize - work parameters and crop yieldM. Raffaelli, A. Peruzzi, P. Bàrberi & M. Ginanni . . . . . . . . . . . . . . . . . . . . . . . . . . . . . . . . . . 153
Options for mechanical weed control in string bean – effects on weedsM. Raffaelli, P. Bàrberi, A. Peruzzi & M. Ginanni . . . . . . . . . . . . . . . . . . . . . . . . . . . . . . . . . . 159
Preliminary results on physical weed control in spinachTei F., Stagnari F., Granier A. . . . . . . . . . . . . . . . . . . . . . . . . . . . . . . . . . . . . . . . . . . . . . . . . . . 164
Cover crops, intercrops, mulches, manure . . . . . . . . . . . . . . . . . . . . . . . . . . . . . . . . 172
Impacts of composted swine manure on maize and three annual weed speciesM. Liebman, T. Richard, D.N. Sundberg, D.D. Buhler, and F.D. Menalled . . . . . . . . . . . . . . . 173
Cover crops and mulches for weed control in organically grown vegetablesLars Olav Brandsæter and Hugh Riley . . . . . . . . . . . . . . . . . . . . . . . . . . . . . . . . . . . . . . . . . . . 174
The role of cover cropping in renovating poor performing paddocksFrances Hoyle . . . . . . . . . . . . . . . . . . . . . . . . . . . . . . . . . . . . . . . . . . . . . . . . . . . . . . . . . . . . . . . 175
Managing intercrops to minimise weedsH.C. Lee & S. Lopez-Ridaura . . . . . . . . . . . . . . . . . . . . . . . . . . . . . . . . . . . . . . . . . . . . . . . . . . 176
Impact of composted swine manure on crop and weed establishment and growthFabián D. Menalled, Matt Liebman, and Douglas D. Buhler . . . . . . . . . . . . . . . . . . . . . . . . . . 183
A system-oriented approach to the study of weed suppression by cover crops and their residuesA.C. Moonen & P. Bàrberi . . . . . . . . . . . . . . . . . . . . . . . . . . . . . . . . . . . . . . . . . . . . . . . . . . . . 184
Comparison of different mulching methods for weed control in organic green bean and tomatoL. Radics & E. Székelyné Bognár . . . . . . . . . . . . . . . . . . . . . . . . . . . . . . . . . . . . . . . . . . . . . . . 192
No-tillage of arable crops into living mulches in SwitzerlandBernhard Streit, Juerg Hiltbrunner, Lucia Bloch and David Dubois . . . . . . . . . . . . . . . . . . . . . 205
Water and steam for weed control . . . . . . . . . . . . . . . . . . . . . . . . . . . . . . . . . . . . . . . . 206
Preliminary studies in the comparison of hot water and hot foam for weed control.R. M. Collins, A. Bertram, J-A. Roche, & M. E. Scott . . . . . . . . . . . . . . . . . . . . . . . . . . . . . . . 207
Band-steaming for intra-row weed controlB. Melander, T. Heisel & M. H. Jørgensen . . . . . . . . . . . . . . . . . . . . . . . . . . . . . . . . . . . . . . . . 216
Development of innovative machines for soil disinfectionby means of steam and substances in exothermic reactionA. Peruzzi, M. Raffaelli, M. Ginanni, M. Mainardi . . . . . . . . . . . . . . . . . . . . . . . . . . . . . . . . . 220
vii
Soil steaming with an innovative machine – effects on the weed seedbankA.C. Moonen, P. Bàrberi, M. Raffaelli, M. Mainardi, A. Peruzzi & M. Mazzoncini . . . . . . . . 230
Water-jet cutting for weed controlF. Fogelberg & A. Blom . . . . . . . . . . . . . . . . . . . . . . . . . . . . . . . . . . . . . . . . . . . . . . . . . . . . . . 237
Soil steaming with an innovative machine – effects on actual weed floraP. Bàrberi, A.C. Moonen, M. Raffaelli, A. Peruzzi, P. Belloni & M. Mainardi . . . . . . . . . . . . 238
Hot water for weed control on urban hard surface areasD. Hansson . . . . . . . . . . . . . . . . . . . . . . . . . . . . . . . . . . . . . . . . . . . . . . . . . . . . . . . . . . . . . . . . . 242
Thermal control of Vicia hirsuta and Vicia tetrasperma in winter cerealsP. Juroszek, M. Berg, P. Lukashyk, U. Köpke . . . . . . . . . . . . . . . . . . . . . . . . . . . . . . . . . . . . . . 244
Thermal weed control by water steamA. Sirvydas, P. Lazauskas , R. Vasinauskien, P. Kerpauskas . . . . . . . . . . . . . . . . . . . . . . . . . 253
Methodology and research in physical and cultural weed control . . . . . . . . . . 263
Effect of plant dry mass on uprooting by intra-row weedersD.A.G. Kurstjens, G.D. Vermeulen & P.O. Bleeker . . . . . . . . . . . . . . . . . . . . . . . . . . . . . . . . . 264
Evaluation of Physical WeedersJ. Meyer, N. Laun, B. Lenski . . . . . . . . . . . . . . . . . . . . . . . . . . . . . . . . . . . . . . . . . . . . . . . . . . . 267
Effect of cutting height on weed regrowthS. Baerveldt and J. Ascard . . . . . . . . . . . . . . . . . . . . . . . . . . . . . . . . . . . . . . . . . . . . . . . . . . . . 272
Yield effect of distance between plants and cutting of weedsT. Heisel, C. Andreasen & S. Christensen . . . . . . . . . . . . . . . . . . . . . . . . . . . . . . . . . . . . . . . . . 280
Semi-automatic machine guidance systemJ. Meyer . . . . . . . . . . . . . . . . . . . . . . . . . . . . . . . . . . . . . . . . . . . . . . . . . . . . . . . . . . . . . . . . . . . 287
Experimental assessment of the elements for the design ofa microwave prototype for weed controlC. De Zanche, F. Amistà, and S. Beria . . . . . . . . . . . . . . . . . . . . . . . . . . . . . . . . . . . . . . . . . . . 292
Video assessment techniques to monitor physical weed management N. M. Bromet and J.N.Tullberg . . . . . . . . . . . . . . . . . . . . . . . . . . . . . . . . . . . . . . . . . . . . . . . . 293

5th EWRS Workshop on Physical Weed Control 1 Pisa, Italy, 11-13 March 2002
Preventive/cultural weed control and weed community dynamics

5th EWRS Workshop on Physical Weed Control 2 Pisa, Italy, 11-13 March 2002
Weed growth and control as influenced by soyabean row spacing and soil tillage for seed bed preparation
Francesco Vidotto1, Aldo Ferrero1, Roberto Busi1, Anna Saglia2
1Dipartimento di Agronomia, Selvicoltura e Gestione del Territorio, Università degli Studi di Torino, Via Leonardo Da Vinci, 44 – 10095 Grugliasco- Italy.
2Regione Piemonte - Settore Fitosanitario, C.so Grosseto 71/6 – 10147 Torino
Abstract
This research was aimed at studying the effect of soyabean planting arrangement on efficacy of mechanical weed control. The following combinations of row spacing and weed control interventions were compared: 1) 15 cm and 1 or 2 harrowings; 2) 30 cm and 1 or 2 harrowings; 3) 75 cm and 1 or 2 harrowings + inter-row tillage. All treatments were tested in soil subject to ploughing or minimum tillage for seed bed preparation. Harrowing was carried out on total plot surface by means of a harrow equipped with flexible tines. Inter-row tillage was performed with a rotary harrow. Main weeds recorded before mechanical weed control were AMARE, ECHCG, POLPE and POROL. AMARE density determined in plots subject to minimum tillage was more than twice that assessed in ploughed plots. Greatest efficacy of weed control (about 95%) was obtained in plots were soyabean was planted at 75 cm, even if in these conditions grain yield was significantly lower than that recorded in other plots with closer rows.

5th EWRS Workshop on Physical Weed Control 3 Pisa, Italy, 11-13 March 2002
Simple innovations to improve the effect of the false seedbed technique
R.Y. van der Weide1, P.O. Bleeker1 and L.A.P. Lotz2
1Applied Plant Research, P.O. Box 430, 8200 AK Lelystad, The Netherlands 2Plant Research International, P.O.box 16, 6700 AA Wageningen, The Netherlands
Email: [email protected]; [email protected]; [email protected]
Objective In crops cultivated without the use of herbicides, preventive methods can be useful to decrease the weed problem. The effects of the false seedbed technique varies with the method and timing used. Research to increase the insight in the efficacy of this technique is presented in this paper.
Method In several field experiments the effects of false seedbeds at the weed density and the total weed control have been counted. Varying factors in these experiments were the time and length of the false seedbed and the method of cultivating the soil after the false seedbed. Research of the method included the effect of covering the machinery used and/or the effect of additional farred light under the cover.
Research and discussion Weed species which germinate relative early can be suppressed by a false seedbed before sowing and/or late sowing of silage maïze in the Netherlands (see table 1). Late germinating species as for example Echinocloa crus galli and Solanum nigrum however, can even be stimulated by late sowing. A false seedbed sometimes also increase the density of these warmed loving species. This especially occurred in a relative cold period during the false seedbed as for example in may 1996 where the mean soil temperature was 2 oC lower than in the other years.
Table 1. Percentage decrease (-) or increase (+) of different weed species in silage maïze caused by relative late sowing (half may in stead of end april) or caused by the use of the false seedbed technique.
Weed species Year Number/m2
after early sowing*
Effect (in % increase or decrease) by:
late sowing false seedbed before early sowing late sowing Echinchloa crus galli '96 3.8 + 260 +400 +150
'97 105.0 + 68 - 78 - 82 '98 213.7** - 66
Chenopodium album '96 15.0 + 40 - 45 - 49 '97 22.7 - 30 - 81 - 92
Stellaria media '96 13.5 + 2 - 28 - 39 '97 53.3 + 2 - 86 - 99
Polygonum persicaria '97 69.3 + 2 - 33 - 50 Poa annua '96 18.3 - 57 - 43 - 27
'98 326.0** - 48 '99 10.0 - 77 - 30 - 57
Atriplex patula '99 1.7 - 82 - 24 - 100 Solanum nigrum '96 6.0 - 12 - 50 - 37 '99 233.3 + 104 - 31 - 70
* in untreated fields without false seedbed ** after late sowing

5th EWRS Workshop on Physical Weed Control 4 Pisa, Italy, 11-13 March 2002
The technique of false seedbed can be improved by covering the machinery used by destroying the emerged weeds around crop sowing time (see Figure 1). In iceberg lettuce only coverring the machinery gave 60% less weeds (see table 2).
Table 2. The effect of a false seedbed and/or coverring the machinery used for destroying the emerged weeds at the soil at the (relative) weed density (data PPO Lelystad).
False seedbed Emerged weeds
controlled by
Coveredmachinery
% reduction in number of weeds*
1999 2000 2001 No Rotory
harrowNo 0 (28,0)1 0 (52,5)1 0 (45,5)1
Yes 63 69 4 weeks Glyfosate No 69 68 74 Rotory
harrowNo 44 60 71
Yes 74 73 81 Hoeing No 74 53 85 Yes 71 91
* relative to plantbedpreparation without false seedbed and without covering the machinery 1 number of weeds / m2 around 6 weeks after preparation of true seed/plantbed
Figure 1. Covered rotary harrow used the destroy weeds on the false seedbed experiment before planting iceberg lettuce.

5th EWRS Workshop on Physical Weed Control 5 Pisa, Italy, 11-13 March 2002
Assessment of cropping system effects on weed management using matrix population models
Adam S. Davis and Matt Liebman Department of Agronomy, Iowa State University, Ames, IA, 50011-1010, USA
Abstract
Cropping system characteristics can influence weed prevention efforts by altering key demographic rates of weeds. Our objective was to combine empirical and modeling methods to assess cropping system effects on weed population growth rate ( ). In a field experiment conducted in 2000 and 2001 in Boone, IA, Setaria faberi (giant foxtail) was grown in a wheat-corn-soybean crop sequence. Wheat was grown either as a sole-crop (‘RC-‘) or as an intercrop with red clover (‘RC+’). Six demographic parameters were measured for S. faberi in the two crop sequences, including seed survival from October to March (ss(OM)) and March to October (ss(MO)), germination (g), plant survival (sp), fecundity (f) and seed survival of post-dispersal predation (ss(pred)). These parameters were used in a periodic matrix model of cropping system effects on S. faberi population dynamics. For each of the three phases of the crop sequence, sub-annual transition matrices described recruitment, plant survival, reproduction, post-dispersal seed predation and overwinter seedbank decline.
Retrospective perturbation analysis of a model examines the correspondence between the sensitivity of to a particular parameter and the amount of variation observed in that parameter. We adapted the Life Table Response Experiment (LTRE) approach to retrospective perturbation analysis to include periodic matrix models. There was a two-fold difference in ( ) between the RC- treatment ( = 2.5) and the RC+ treatment ( = 1.2). We decomposed into contributions from each of the parameters in the periodic model. Three parameters accounted for 94% of the contributions to : ss(pred) in the wheat phase (-0.56), and g in the corn (-0.43) and wheat (-0.33) phases. Post-dispersal predation of S. faberi seeds was the parameter that was most sensitive to in each of the phases of the crop sequence. Daily seed removal rate did not differ between the RC- and RC+ treatments in the soybean (5.5%) and corn (17.5%) phases, whereas there was a two-fold difference in daily seed removal rates between the RC- (22.5%) and the RC+ (60%) treatments in the wheat phase. Analysis of periodic matrix models using the modified LTRE design should help guide the design and improvement of future weed prevention systems.
5th EWRS Workshop on Physical Weed Control 6 Pisa, Italy, 11-13 March 2002
Computer model for simulating the long-term dynamicsof annual weeds under different cultivation practices
I.A. Rasmussen, N. Holst, L. Petersen, K. Rasmussen Department of Crop Protection
Danish Institute of Agricultural Sciences, Research Centre Flakkebjerg, DK-4200 Slagelse, Denmark
Abstract
A model is being developed which describes the population dynamics of annual weeds and how it is affected by crop rotation, cultivation practices and weed control. The model aims to predict the development of a certain weed species in order to plan crop rotation and cultivation practices to minimize the risk of proliferation. The model does not predict the exact number of weeds expected to be found in a certain year or crop, but rather the general development over a number of years. The model includes documented knowledge, as well as informal expert knowledge, on seed survival in the soil, seed placement in soil after tillage, seed germination with respect to placement in soil, time of year and tillage, weed development in response to crop competitiveness and seed production of the weeds. The model is at present only accounting for the development of one weed species at a time, and only a few weed species are parameterised. However, the model can easily be extended with more weed species, crops and cultivation practices. Model predictions should match what knowledgeable weed scientists already know, perhaps with a little new insight.
Introduction
Weed control alone is not always enough to prevent proliferation of a certain weed species. This is particularly the case in organic farming, where the efficacy of mechanical weed control often is low. Because of this, many preventive methods including tillage, crop rotation, augmentation of the competitiveness of the crop against the weed, sowing time and harvest time etc. are included in the weed control strategy – particularly in organic farming (Kropff et al. 2000; Rasmussen et al. 2000).
A diversified crop rotation can prevent proliferation of a single weed species, since the demands of most weed species in terms of germination, growth and propagation cannot be met if sowing time, crop growth and harvest time are varied between years. An example is that winter annual species germinate primarily in the fall and their establishment is less successful in spring-sown crops than in crops sown in the fall. Experiments have shown that some of the problems with grass weeds, which can arise in crop rotations dominated by winter cereals, can be alleviated by incorporating larger proportions of spring cereals in the rotation (Melander 1993).
The competitiveness of the crop against the weeds is a very important parameter for the growth and propagation of the weeds. Choice of cultivar, seed rate, quality of the seedbed, row distance and geometrical arrangement, fertiliser level and fertiliser application/placement are among the most important factors influencing crop competitiveness (Espeby 1989; Kropff & van Laar 1993; Christensen & Rasmussen 1996; Weiner et al. 2001).

5th EWRS Workshop on Physical Weed Control 7 Pisa, Italy, 11-13 March 2002
There are many possibilities to prevent weed problems, but they have to be planned well in advance. Optimally, for a certain crop rotation, there would be a strategy for the utilisation of preventive methods within that crop rotation. The need for direct control should be restricted to as little as possible. However, it is quite complicated to characterize the way the different methods interact in the crop rotation and how the crop rotation itself may influence the weed proliferation.
In order to illustrate this, a computer model has been developed which describes the development of different annual weed species under different scenarios. The purpose of the model is to define the development in order to choose the best management to avoid proliferation of a certain weed. The model does not attempt to predict the exact number of weeds likely to germinate in any certain year, but to predict a general trend in the development over a course of several years. As such, it is not a decision support system to plan control in a given crop, but a management support system to plan crop rotation and other cultural measures to decrease reliance on high control efficacy.
Materials and Methods
Modelling approach Several models have been published, which describe the proliferation of field weeds (Cousens & Mortimer 1995). The system components and processes incorporated in these models reflect the interest of the modeller and the purpose of the model and include soil seed bank, germination, establishment, growth, competition, and seed production. Most of these models work in time steps of one year and under the common assumption that all individuals of a weed species germinate and shed seeds at the same time. Such models are well suited to describe the proliferation of a weed under uniform cropping conditions, such as grass weed propagation in no-till, continuous winter cereals. In contrast, models with a finer time step can capture the variation within a year. Most weed species emerge and shed seeds unevenly through the year; for example, new emergence is often seen after rain or tillage. Within a competitive crop, latecomers will suffer a high mortality thus depleting the soil seed bank, whereas in less competitive crops, plants are more likely to thrive and eventually contribute to the seed bank. To grasp such within-year processes, models with a time step finer than one year are needed. Thus Christensen et al. (1999), based upon the matrix model approach of Silvertown (1987), developed a model that operated in time steps of 14 days. This facilitated the modelling of weed cohorts, having emerged at different times through the year, and the effect of various control measures in different crop rotations could be predicted based upon the knowledge put into the model.
The model presented here is a continuation of this line of work. As a guideline for model design, we wish to keep it simple so that it can easily be extended with additional weed species, crops and cultivation practices. At the same time, we wish to maintain the overall realism so that the model can offer guidance on weed management through targeted planning of cropping cycle and cultivation practices. Model predictions should match what knowledgeable weeds scientists already know, perhaps with a little surprise and new insight now and then.
Weed life stages Our weed model is stage-structured (Fig. 1) and incorporates each life stage as a separate sub-population: number of seeds in or on the ground, or still fastened to the plant; number of emerging seedlings; number and mass of plants in the vegetative and the reproductive growth stage. In the first version of the model, the population dynamics of each weed species is considered separately with no inter-specific competition other than between crop and weed. The time step of the model is

5th EWRS Workshop on Physical Weed Control 8 Pisa, Italy, 11-13 March 2002
1 day. The vertical distribution of seeds in the soil is kept in 20 1-cm layers. Seed dormancy takes many forms (Baskin & Baskin 1998) but only primary dormancy is included directly in the model.
Soil tillage and seed germination During tillage seeds will be shifted around among the 20 soil layers (the seeds on the soil surface follow those in the top 1-cm layer). Cousens & Moss (1990) formulated two models of the movement of seeds caused by harrowing and ploughing, respectively. We use their equations directly in our model considering the seed bank split into four 5-cm layers as they did. In the case of shallower treatments, we simply scale down the thickness of the layers and apply the same equations, e.g., for ploughing at 16 cm depth, the four layers would each be considered 4 cm thick. Mechanical weed control, which properly operated only disturb the top cm of the soil, is assumed not to shift seeds around, except mixing seeds from the soil surface into the top layer.
In undisturbed soil seeds will perish at a rate specific to the species. In the model we use the mortality rates determined by Chancellor (1986), which leads to an exponential decrease in seed numbers. For lack of knowledge we assumed mortality rates to apply equally to seeds at all soil depths. For seeds upon the soil surface we assumed a fixed mortality rate per day-degree common to all species. This mortality is thought primarily to be caused by non-specific predation by insects and birds.
Figure 1. Weed life stages and processes included in the model. The population density of different life stages is kept in either individuals per m2 (N) or in biomass dry-weight per m2 (M).

5th EWRS Workshop on Physical Weed Control 9 Pisa, Italy, 11-13 March 2002
Figure 2. Seed emergence depending on soil depth summarised by log-normal curves (data after Chancellor 1964).
Figure 3. Phenology of seed germination (data after Chancellor 1986).
Jan Feb Mar Apr May Jun Jul Aug Sep Oct Nov Dec
Rel
ativ
e ge
rmin
atio
n
0.0
0.1
0.2
0.3
0.4
0.5
0.6
0.7
0.8
0.9
1.0Chamomilla recutita Stellaria media
Soil depth (cm)
0 1 2 3 4 5 6 7 8 9 10
Rel
ativ
e ge
rmin
atio
n
0.0
0.1
0.2
0.3
0.4
0.5
0.6
0.7
0.8
0.9
1.0
Polygonum persicariaChamomilla recutita Viola arvensis
5th EWRS Workshop on Physical Weed Control 10 Pisa, Italy, 11-13 March 2002
The germination rate of seeds depends on their vertical position in the soil, as described by Chancellor (1964). Based on his data we could summarise for each species the relative germination rate according to depth by a log-normal curve (Fig. 2). Furthermore, the propensity of seeds to germinate varies with the season. Sophisticated models of germination have been developed, incorporating the effects of soil temperature and humidity (Forcella 1998; Forcella et al. 2000) and dormancy (Vleeshouwers 1997; Benech-Arnold et al. 2000). However, we chose a simpler approach, because we are interested only in the typical course over the year of the weed life cycle and how it interacts with the typical timing of cultivation practices. Thus the phenology of germination was described, for each species, by a relative measure of germination for each calendar month, linearly interpolated to yield daily values (Fig. 3). These species-specific germination curves were determined by experts based on formal (Håkansson 1983; Chancellor 1986) and informal knowledge.
The number of seeds germinating from a certain soil layer on a specific date can now be obtained be multiplying the two relative rates (from Figs. 2 and 3) with the germination rate in undisturbed soil specific to the weed species. On dates when the soil is disturbed (to a certain depth by a certain cultivation practice), additional germination will occur. This is calculated multiplying the two relative rates with the maximum germination rate (determined experimentally under optimal conditions).
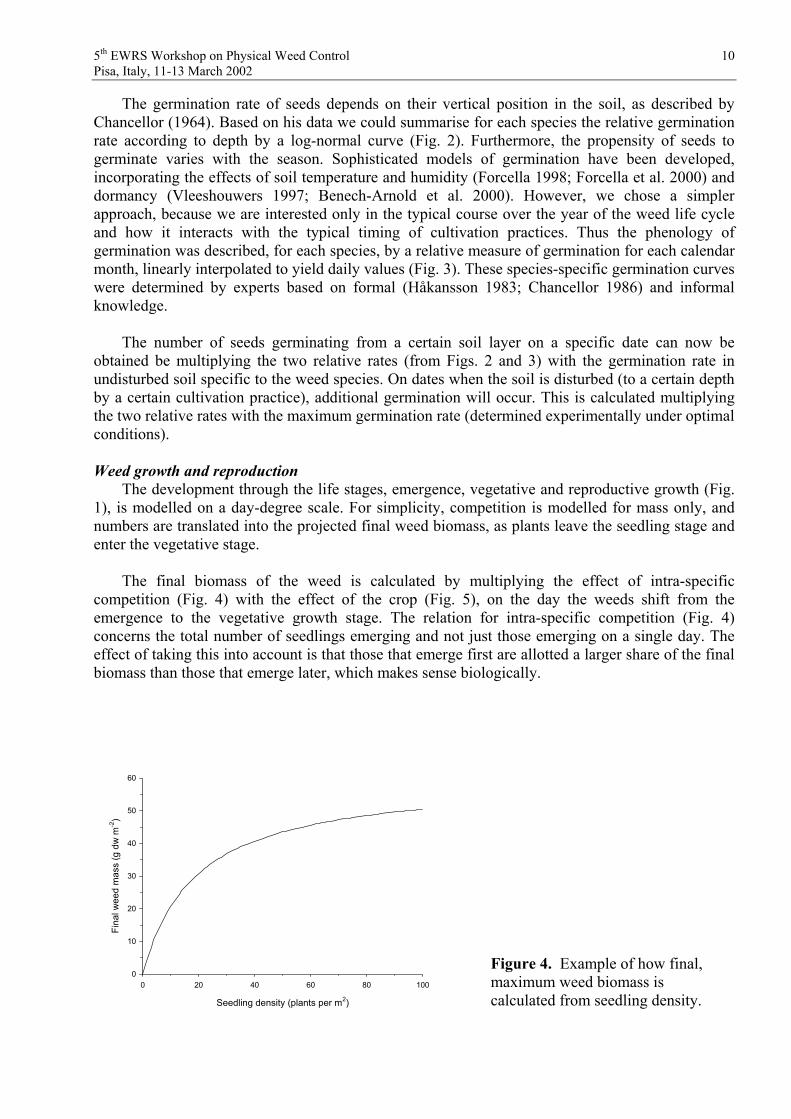
Weed growth and reproduction The development through the life stages, emergence, vegetative and reproductive growth (Fig. 1), is modelled on a day-degree scale. For simplicity, competition is modelled for mass only, and numbers are translated into the projected final weed biomass, as plants leave the seedling stage and enter the vegetative stage.
The final biomass of the weed is calculated by multiplying the effect of intra-specific competition (Fig. 4) with the effect of the crop (Fig. 5), on the day the weeds shift from the emergence to the vegetative growth stage. The relation for intra-specific competition (Fig. 4) concerns the total number of seedlings emerging and not just those emerging on a single day. The effect of taking this into account is that those that emerge first are allotted a larger share of the final biomass than those that emerge later, which makes sense biologically.
Figure 4. Example of how final, maximum weed biomass is calculated from seedling density.Seedling density (plants per m2)
0 20 40 60 80 100
Fina
l wee
d m
ass
(g d
w m
-2)
0
10
20
30
40
50
60

5th EWRS Workshop on Physical Weed Control 11 Pisa, Italy, 11-13 March 2002
Figure 5. The phenology of crop competitiveness in a field with a spring-sown followed by an autumn-sown crop (dotted line), and the relative final biomass that the weed population would achieve if it emerged at a certain date (full line).
Seed production is assumed to happen at a fixed daily rate, specific to each species, which is proportional to the weed mass in the reproductive stage (Rasmussen 1993; Wilson et al. 1995).
Weed mortality caused by cultural practices The effect of cultural practices depends on the mode of intervention (seeding, harrowing, ploughing, herbicide treatment, various mechanical weed control methods) and the life stage of the weed; seeds are unaffected (other than vertical movement: from plant to soil, from surface into soil, and between layers within soil), seedlings are the most sensitive, plants in the vegetative growth stage less sensitive, and reproductive plants the least sensitive. Effects are specified as the percentage mortality caused by each kind of cultural practice for each of the three susceptible life stages. In addition, the mortality caused by harvesting (removal) on seeds still on the plant can be specified.
Parameters for the model Currently, model parameters are being estimated from literature data or, when information is lacking, from informal expert knowledge. Important literature sources include (Stevens 1932; Chancellor 1964; Holm et al. 1991; Moss 1985; Chancellor 1986; Legere & Deschenes 1989; Milberg 1990; Cousens & Moss 1990; Baskin & Baskin 1998; Bouwmeester 2001).
Evaluation of the model At this early stage, the only evaluation carried out on the model is an expert panel assessing the results retrieved from the runs of the model under different scenarios. However, a great body of data from experiments over a long period of time with a record of crop rotation and cultivations, some with and without weed control, chemical as well as mechanical, will later be used to evaluate the model in a more objective manner.
Results
At the workshop, the model will be presented, and some examples of scenarios will be shown. The current version of model can be downloaded from www.agrsci.dk/plb/nho/fieldweeds.htm.
Jan Feb Mar Apr May Jun Jul Aug Sep Oct Nov Dec
Fina
l wee
d bi
omas
s -o
r- C
rop
com
petiv
enes
s
0.0
0.1
0.2
0.3
0.4
0.5
0.6
0.7
0.8
0.9
1.0
Relative final weed biomassRelative current crop competiveness

5th EWRS Workshop on Physical Weed Control 12 Pisa, Italy, 11-13 March 2002
Acknowledgements
This work is supported by a grant from The Danish Directorate for Food, Fisheries and Agro Business.
References
BASKIN CC & BASKIN JM (1998) Seeds - Ecology, Biogeography, and Evolution of Dormancy and Germination. Academic Press, San Diego, California.
BENECH-ARNOLD RL, SÁNCHEZ RA, FORCELLA F, KRUK BC, & GHERSA CM (2000) Environmental control of dormancy in weed seed banks in soil. Field crops research 67, 105-122.
BOUWMEESTER HJ (2001) The effect of environmental conditions on the annual dormancy pattern of seeds of Spergula arvensis. Canadian Journal of Botany 71, 64-73.
CHANCELLOR RJ (1964) The depth of weed seed germination in the field. In: Proceedings of the 7th British Weed Control Conference, 606-613.
CHANCELLOR RJ (1986) Decline of arable weed seeds during 20 years in soil under grass and the periodicity of seedling emergence after cultivation. Journal of Applied Ecology 23, 631-637.
CHRISTENSEN S & RASMUSSEN G (1996) Crop-weed competition and choice of variety, seed rate and drilling date in winter wheat (Original title: Konkurrence mellem afgrøde og ukrudt i relation til sortsvalg, såmængder og såtider i vinterhvede. With English summary). In: 13.Danske Planteværnskonference, Ukrudt, SP-rapport nr. 3, 103-112.
CHRISTENSEN S, RASMUSSEN K, MELANDER B & RASMUSSEN G (1999) Weed management in organic crop rotations. (Original title: Forebyggelse og regulering af ukrudt i økologiske sædskifter. With English summary) In: 16. Danske Planteværnskonference, Plantebeskyttelse i økologisk jordbrug, sygdomme og skadedyr. DJF Rapport Markbrug nr. 10,41-53.
COUSENS R & MORTIMER M (1995) Dynamics of Weed Populations. Cambridge University Press, Cambridge, UK.
COUSENS R & MOSS SR (1990) A model of the effects of cultivation on the vertical distribution of weed seeds within the soil. Weed Research 30, 61-70.
ESPEBY L (1989) Germination of weed seeds and competition in stands of weeds and barley. Influences of mineral nutrients. Crop Production Science, Sveriges lantbruksuniversitet, 6, 1-172.
FORCELLA F (1998) Real-time assessment of seed dormancy and seedling growth for weed management. Seed science research 8, 201-209.
FORCELLA F, BENECH-ARNOLD RL, SANCHEZ R & GHERSA CM (2000) Modelling seedling emergence. Field crops research 67, 123-139.
HÅKANSSON S (1983) Seasonal variation in the emergence of annual weeds - an introductory investigation in Sweden. Weed Research 23, 313-324.
HOLM LG, PLUCKNETT DL, PANCHO JV & HERBERGER JP (1991) The World’s Worst Weeds, Distribution and Biology. Krieger Publishing Company, Malabar, Florida.
KROPFF MJ, BAUMANN DT, BASTIAANS L (2000) Dealing with weeds in organic agriculture – challenge and cutting edge in weed management. In: Proceedings 13th IFOAM Scientific Conference: IFOAM 2000: the world grows organic, Basel, 175-177.
KROPFF MJ & VAN LAAR HH (1993) Modelling crop-weed interactions. CAB International, Walingford, UK.

5th EWRS Workshop on Physical Weed Control 13 Pisa, Italy, 11-13 March 2002
LEGERE A & DESCHENES JM (1989) Effects of time of emergence, population density and interspecific competition on Hemp-Nettle (Galeopsis tetrahit) seed production. Canadian Journal of Plant Science 69, 185-194.
MELANDER B (1993) Population dynamics of Apera spica-venti as influenced by cultural methods. Brighton Crop Protection Conference – Weeds, 107-112.
MILBERG P (1990) Hur länge kan ett frö leva? (With English summary) Svensk botanisk tidskrift 84, 323-351.
MOSS SR (1985) The survival of Alopecurus myosuroides Huds. seeds in soil. Weed Research 25,201-211.
RASMUSSEN IA (1993) Seed production of Chenopodium album in spring barley sprayed with different herbicides in normal to very low doses. In: 8th EWRS Symposium "Quantitative approaches in weed and herbicide research and their practical application", Braunschweig, 639-646.
RASMUSSEN IA, MELANDER B, RASMUSSEN K et al. (2000) Recent advances in weed management in cereals in Denmark. In: Proceedings 13th IFOAM Scientific Conference: IFOAM 2000: the world grows organic, Basel, 178.
SILVERTOWN J (1987) Introduction to Plant Population Ecology. Longman Scientific & Technical, Essex.
STEVENS OA (1932) The number and weight of seeds produced by weeds. American Journal of Botany 19, 784-794.
VLEESHOUWERS LM (1997) Modelling weed emergence patterns. PhD thesis, Wageningen Agricultural University.
WEINER J, GRIEPENTROG H-W & KRISTENSEN L (2001) Suppression of weeds by spring wheat Triticum aestivum increases with crop density and spatial uniformity. Journal of applied ecology 38, 784-790.
WILSON BJ, WRIGHT KJ, BRAIN P, CLEMENTS M & STEPHENS E (1995) Predicting the competitive effects of weed and crop density on weed biomass, weed seed production and crop yield in wheat. Weed Research 35, 265-278.

5th EWRS Workshop on Physical Weed Control 14 Pisa, Italy, 11-13 March 2002
Optimization of cultivation timing by using a weed emergence model
Maryse L. Leblanc1 and Daniel C. Cloutier2
1 Institut de Recherche et de Développement en Agroenvironnement, P.O. Box 480, Saint-Hyacinthe, Québec, Canada J2S 7B8; E-mail: [email protected]
2 Institut de malherbologie, P.O. Box 222, Sainte-Anne-de-Bellevue, Québec, Canada H9X 3R9. E-mail: [email protected]
In agriculture, weeds are very important since without crop protection, almost half of the world’s actual agricultural production would be lost (Vleeshouwers 1997). Due to this potential risk, growers developed an approach where weeds are controlled by systematically applying herbicide, regardless of whether it is needed or not. Herbicides have become dominant in many production systems resulting in environmental contamination and in the development of herbicide resistance (Beckie et al. 2001). Recognizing the problem, many governments in the world promote integrate weed management systems which minimize the use of herbicides by combining biological and physical controls with appropriate farming practices (Panneton et al. 2001).
In the current context in agriculture, integrated weed management systems emphasizes integration of techniques to anticipate and manage problems rather than react to them after they appear (Buhler 2001). As part of these systems, it is critical to treat weeds at the best time to optimize resources and time. Therefore, a predictive model of the timing of weed emergence becomes an essential tool in integrated weed management program. Common lambsquarters (Chenopodium album L.) was the species that was selected first to develop and validate our weed emergence model approach (Leblanc 2001). Common lambsquarters, widely distributed throughout the world, is the most common weed encountered in cropping systems grown in temperate zones (Bassett and Crompton 1978; Leblanc 2001).
In the model development process, most of the viable common lambsquarters seeds are assumed to be non dormant in the spring since their dormancy should have been released by the low winter temperatures under Québec climatic conditions. The timing of seed germination and seedling emergence from a non dormant population of seeds is mostly regulated by the soil environment where temperature and water content are the two main factors (King and Oliver 1984). Germination is primarily influenced by soil temperature and moisture whereas pre-emergence growth is under the control of soil temperature (Leblanc et al. 1998; Roman et al. 1999; Vleeshouwers 1997). Under Québec spring conditions, soil water content does not appear to be a limiting factor for common lambsquarters emergence since snow melting in the spring supplies the soil reserves. Consequently, there is generally enough water from April to June for common lambsquarters emergence (Leblanc 2001). In Québec, temperature is a more important factor in the spring than soil moisture in regulating the emergence of common lambsquarters.
Several weed emergence models have been developed based on the accumulation of thermal time (degree days) but the use of a single base temperature might result in the over- or underestimation of the thermal time units required for the emergence of a given proportion of the population when there are differences in field management (Oryokot et al. 1997; Roman et al. 2000). The use of a single base temperature to describe the complete seed population germination might also introduce some artefacts since it was observed that seeds had different thermal requirement for germination and a lower base temperature will not be adequate for cohorts that germinate later in the season (Dumur et al. 1990). Based on these statements, a mathematical model to predict common lambsquarters seedling emergence in relation to air cumulative thermal units (C degree days) was developed in Québec from endemic field weed populations. One of the
5th EWRS Workshop on Physical Weed Control 15 Pisa, Italy, 11-13 March 2002
assumptions of the model was that air temperature exchange is very rapid at the depth from which lambsquarters seedlings emerge and is closely related to the temperature of sandy soils in the spring (Leblanc 2001).
It was also observed in a laboratory experiment that the percentage of weed germination increased with temperature (Leblanc 2001). Within a weed species, it appears that there is variability in the thermal requirement of individual seeds. Those that germinate earliest in the season have lower requirements than those that germinate later. If the soil is disturbed, by seedbed preparation or cultivation for example, the disturbance will kill emerged and emerging seedlings, leaving behind seeds with higher thermal requirements (base temperature). Therefore, the model was built on the assumption that thermal requirements for emergence increases as the proportion of the emerged population increases, indicating that the base temperature becomes higher as the crop seedbed preparation date is delayed. The same concept could be applied on cultivation operations since they destroy the emerged fraction of weed population.
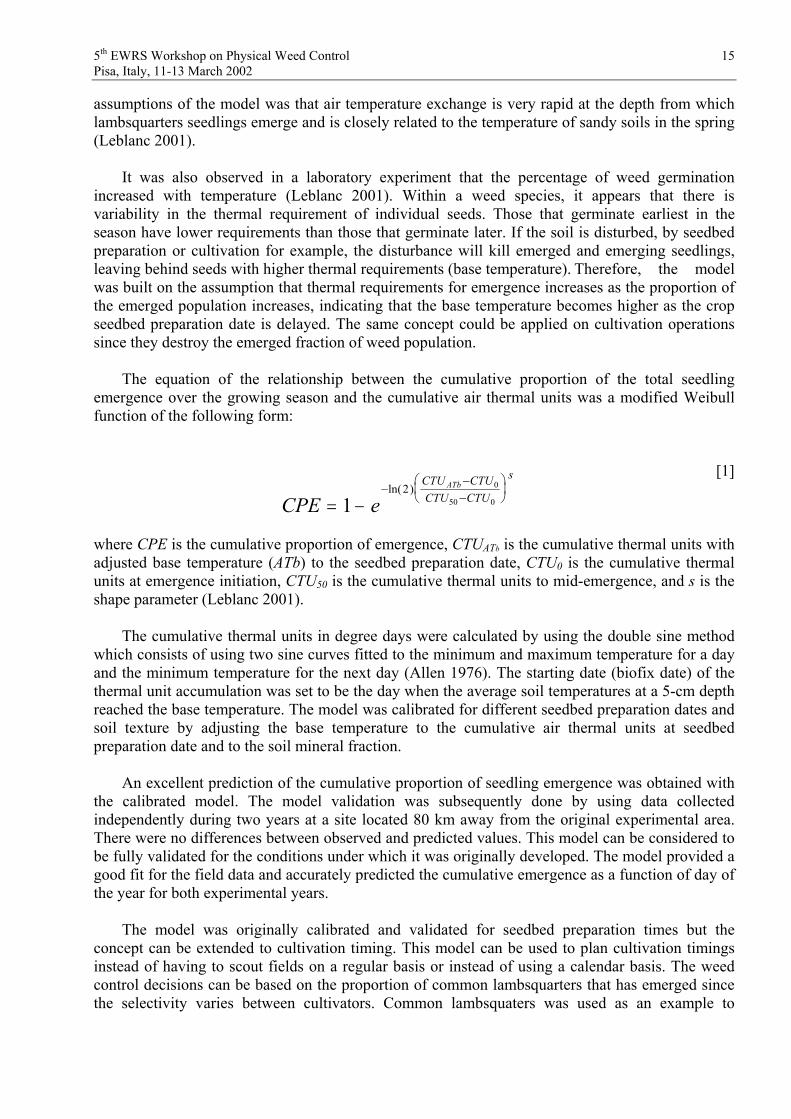
The equation of the relationship between the cumulative proportion of the total seedling emergence over the growing season and the cumulative air thermal units was a modified Weibull function of the following form:
[1]
where CPE is the cumulative proportion of emergence, CTUATb is the cumulative thermal units with adjusted base temperature (ATb) to the seedbed preparation date, CTU0 is the cumulative thermal units at emergence initiation, CTU50 is the cumulative thermal units to mid-emergence, and s is the shape parameter (Leblanc 2001).
The cumulative thermal units in degree days were calculated by using the double sine method which consists of using two sine curves fitted to the minimum and maximum temperature for a day and the minimum temperature for the next day (Allen 1976). The starting date (biofix date) of the thermal unit accumulation was set to be the day when the average soil temperatures at a 5-cm depth reached the base temperature. The model was calibrated for different seedbed preparation dates and soil texture by adjusting the base temperature to the cumulative air thermal units at seedbed preparation date and to the soil mineral fraction.
An excellent prediction of the cumulative proportion of seedling emergence was obtained with the calibrated model. The model validation was subsequently done by using data collected independently during two years at a site located 80 km away from the original experimental area. There were no differences between observed and predicted values. This model can be considered to be fully validated for the conditions under which it was originally developed. The model provided a good fit for the field data and accurately predicted the cumulative emergence as a function of day of the year for both experimental years.
The model was originally calibrated and validated for seedbed preparation times but the concept can be extended to cultivation timing. This model can be used to plan cultivation timings instead of having to scout fields on a regular basis or instead of using a calendar basis. The weed control decisions can be based on the proportion of common lambsquarters that has emerged since the selectivity varies between cultivators. Common lambsquaters was used as an example to
CPE eCTU CTUCTU CTU
sATb
12 0
50 0ln( )

5th EWRS Workshop on Physical Weed Control 16 Pisa, Italy, 11-13 March 2002
develop the thermal time approach for weed emergence but it could easily be adapted to other weed species whose emergence is limited by low spring temperature in temperate climate.
References
ALLEN, J. C. 1976. A modified sine wave method for calculating degree days. Environ. Entomol. 5:388-396.
BASSET, I. J. & C. W. CROMPTON. 1978. The biology of Canadian weeds. 32. Chenopodiumalbum L. Can. J. Plant Sci. 58:1061-1072.
BECKIE, H. J., L. M. HALL, & F. J. TARDIF. 2001. Herbicide resistance - where are we at today? Pages 1-36 in R. E. Blackshaw and L. M. Hall, eds. Integrated weed management: explore the potential. Expert Committee on Weeds, Ste-Anne-de-Bellevue, Québec, Canada.
BUHLER, D. D. 2001. Developing integrated weed management systems. Pages 37-46 in R. E. Blackshaw and L. M. Hall, eds. Integrated weed management: explore the potential. Expert Committee on Weeds, Ste-Anne-de-Bellevue, Québec, Canada.
DUMUR D., C. J. PILBEAM, & J. CRAIGON. 1990. Use of the Weibull function to calculate cardinal temperatures in Faba bean. J. Exp. Bot. 41:1423-1430.
KING, C. A. & L. R. OLIVER. 1984. A model for predicting large crabgrass (Digitaria sanguinalis) emergence as influenced by temperature and water potential. Weed Sci. 32:561-567.
LEBLANC, M. L. 2001. Modeling weed emergence as influenced by environmental conditions in corn in southwestern Québec. PhD thesis, McGill University, Ste-Anne-de-Bellevue, Québec, Canada.176 p.
LEBLANC, M. L., D. C. CLOUTIER, G. D. LEROUX, & C. HAMEL. 1998. Facteurs impliqués dans la levée des mauvaises herbes au champ. Phytoprotection 79(3):111-127.
ORYOKOT, J. O. E., S. D. MURPHY, & C. J. SWANTON. 1997. Effect of tillage and corn on pigweed (Amaranthus spp.) seedling emergence and density. Weed Sci. 45:120-126.
PANNETON, B., C. VINCENT, & F. FLEURAT-LESSARD. 2001. Plant protection and physical control methods, the need to protect crop plants. Pages 9-32 in C. Vincent, B. Panneton, and F. Fleurat-Lessard, eds. Physical control methods in plant protection. Springer-Verlag, Berlin Heidelberg, Germany, INRA, Paris, France.
ROMAN, E. S., A. G. THOMAS, S. D. MURPHY, & C. J. SWANTON. 1999. Modeling germination and seedling elongation of common lambsquarters (Chenopodium album). Weed Sci. 47:149-155.
ROMAN, E. S., S. D. MURPHY & C. J. SWANTON. 2000. Simulation of Chenopodium albumemergence. Weed Sci. 48:217-224.
VLEESHOUWERS, L. 1997. Modelling weed emergence patterns. PhD thesis, Wageningen Agricultural University, Wageningen, Netherlands. 165 p.

5th EWRS Workshop on Physical Weed Control 17 Pisa, Italy, 11-13 March 2002
Effect of the combination of the stale seedebd technique with cultivations on weed control in maize
Daniel C. Cloutier1 and Maryse L. Leblanc2
1 Institut de malherbologie, P.O. Box 222, Sainte-Anne-de-Bellevue, Québec, Canada H9X 3R9. E-mail: [email protected]
2 Institut de Recherche et de Développement en Agroenvironnement, P.O. Box 480, Saint-Hyacinthe, Québec, Canada J2S 7B8; E-mail: [email protected]
Abstract
Annual weed density was decreased by 67% in the stale seedbed technique compared to the conventional production system, without using any weed control measures. The pattern of emergence of the annual weeds remained the same but shifted in time, with a smaller amplitude. The maximum of emergence was twice as small as that of the conventional seedbed preparation. Mechanical cultivation in the stale seedbed treatment decreased the weed population level to 20% of the initial level. Maize yield was not affected by the delayed seeding in the stale seedbed. However, maize grain moisture content was 2% greater in the stale seedbed. This could increase production costs since it might require a longer drying period. Using a maize hybrid that reaches maturity earlier might alleviate this disadvantage and it might also decrease production risks in the advent of adverse weather conditions.

5th EWRS Workshop on Physical Weed Control 18 Pisa, Italy, 11-13 March 2002
Mechanical and physical weed control in maize
P. Balsari (1), G. Airoldi (1), A. Ferrero (2)(1) Dipartimento di Economia e Ingegneria Agraria, Forestale e Ambientale - Università di Torino
Via Leonardo da Vinci, 44 - 10095 Grugliasco (Torino) E-mail: [email protected] , [email protected]
(2) Dipartimento di Agronomia e Gestione del Territorio Agricolo - Università di Torino Via Leonardo da Vinci, 44 - 10095 Grugliasco (Torino)
E-mail: [email protected]
Abstract
Different weed control techniques, based on the use of mechanical means integrated with flaming band applications, were compared in a two-year experiment into an organic farm in the western Po Valley.
The control of the grown between the rows was obtained through hoeing and ridging, while flaming and spring teeth harrowing were used to control the weeds in the rows. The crop was planted at the end of May, both years, in three different systems of seed-bed preparation: minimum tillage, false seeding and ploughing just before planting. The main weeds found in the experimental plots were: Amaranthus retroflexux L., Polygonum persicaria L., Chenopodium Album L., Echinochloa crus-galli L.. The number of treatments was the same for the different seed-bed preparation techniques, but varied from year to year according to the degree of infestation. Inter-row cultivators were used at 4-7 leaves of maize, which was ridged at 9-11 leaves. The flame hoe was used at 4-6 leaves and at 7-8 leaves to control weeds at the base of the stalk, while a spring teeth harrow was used at 2-5 leaves.
The differences in the seed bed preparation greatly influenced both the weed development and crop yield which, respectively, obtained the highest and the lowest result in the minimum tillage. All the weed control techniques obtained results that were not statistically different, as regards the weed control, but which were nearly always near 85%, as was the crop yield, which was on average 7,5 Mgss ha-1.
From the economic and operative point of view, a great difference was found according to the implement that was used for the control. The flexible tine harrow resulted in the highest field capacity, thanks to the wide working width and the high speed, and was exactly the opposite of flame cultivator. The latter was also characterized by a considerable variable in costs, due to gas consumption.
Introduction
The use of physical and mechanical means (such as hoeing, ridging and flaming) allows, if properly planned and managed, the control of weeds in row crops that is similar to that obtained by chemicals (Balsari et. Al., 1989; Balsari et. Al. 1991; Peruzzi et Al., 1997). Mechanical interventions, however, require that the soil is in good workable conditions, and this mainly depends on the weather conditions, the physical characteristics and preparation of the soil.
When these weed control techniques are used, the preventive means of control applied during the seed bed preparation phase and at planting take on great importance. The planning of post-emergence weed control also has to take account of the selectivity towards the crop of the means of control, the time required, costs of intervention and the efficacy against weeds (Balsari et. Al., 1990; 1993; Anken et. Al., 1999).

5th EWRS Workshop on Physical Weed Control 19 Pisa, Italy, 11-13 March 2002
An experiment was carried out in 2000 and 2001 to try to resolve these problems; the scope of the experiment was to compare some of the techniques that were used for the control of weeds and which are based on different mechanical + physical interventions and using different time strategies.
Materials and Methods
The experiment was carried out in the western Po Valley, on a farm that began organic hoeing in 1997 and which is characterised by a loam soil.
Preventive weed control was planned in detail to reduce potential crop infestation and direct weed control was then introduced at the crop post-emergence stage through selective interventions.
In the first season (the year 2000) the preventive weed control was based on ploughing and disk harrowing (26 April) then, due to weather conditions, which was characterized by frequent rainfall, it was not possible to use the disk harrow on the ploughed soil for real early seed bed preparation, which was limited to early ploughing. The machine was used a second time (25 May) on the areas worked by disk harrow. A rotary harrow completed the seed bed preparation (27 May) both on the ploughed and disk harrowed soils, just before crop planting.
In the second season (the year 2001) the preventive weed control was based on the interventions that are reported in table 1.
Plough (24 May)
Early seed bed preparation -minimum tillage:
Disk harrow (3 April)Disk harrow (22 May)
Plough (6 April)
Rotary harrow and planter (31 May)Disk harrow (9 April)
Early seed bed preparation -traditional ploughing:
Seed bed preparation just beforeplanting:
Seed bed preparation Machine used and interventiontime
Rotary harrow and planter (31 May)
Rotary harrow and planter (31 May)
Table 1 - Interventions for preventive weed control carried out in the year 2001.
In both seasons, a hybrid FAO 600 class was planted with a distance of 75 cm between the rows and at a distance of 19 cm between the seeds, with initial density of 7 plants m-2.
Selective weed control in post emergence was based on different physical and mechanical techniques, as reported in table 2.

5th EWRS Workshop on Physical Weed Control 20 Pisa, Italy, 11-13 March 2002
2 - flaming + hoeing (4^-5^ leaf) (14 June) hoeing (8^-9^ leaf) (27 June) ridging (10^-11^ leaf) (3 July)
3 - flaming + hoeing (4^-5^ leaf) (14 June) flaming + hoeing (8^-9^ leaf) (27 June) ridging (10^-11^ leaf) (3 July)
1 - control plots
4 - hoeing n (4^-5^ leaf) (14 June) ridging (10^-11^ leaf) (3 July)
6 - spring teeth harrowing (3^ leaf) (8 June) spring teeth harrowing (4^-5^ leaf) (14 June) hoeing (8^-9^ leaf) (27 June)
5 - hoeing (4^-5^ leaf) (14 June) hoeing (8^-9^ leaf) (27 June) ridging (10^-11^ leaf) (3 July)
7 - spring teeth harrowing (3^ leaf) (8 June) spring teeth harrowing (4^-5^ leaf) (14 June) hoeing (8^-9^ leaf) (27 June) ridging (10^-11^ leaf) (3 July)
Season 2001
3 - flaming + hoeing (5^-6^ leaf) (20 June) flaming + ridging (8^-9^ leaf) (4 July)
4 - hoeing (5^-6^ leaf) (20 June) ridging (8^-9^ leaf) (4 July)
5 - ridging (8^-9^ leaf) (4 July)
2 - flaming + hoeing (5^-6^ leaf) (20 June) ridging (8^-9^ leaf) (4 July)
1 - control plots
Season 2000
Table 2 - Techniques used for the crop post emergence selective weed control.
A randomized block design with 360 m2 plots (30m x 12 m - 16 maize rows) was used.
Machines used.
Seed-bed preparation. Farm machines linked to a 4WD 95 kW tractor were used for the ploughing and disk
harrowing. A two-bottom two-way integral-mounted mouldboard plough was used for the first operation, operating at a depth of 40 cm and at a speed of 6 km h-1; a 2.5 wide tandem disk harrow was used for the second operation - operating at a depth of 15 cm and at a speed of 9 km h-1.
A contractor's machines were used for both harrowing and maize planting. The rotary harrow - 5.8 m wide and linked to a 110 kW 4WD tractor - operated at e depth of 15 cm and at a speed of 5 km h-1. The four-row pneumatic planter was linked to a 55 kW 2WD tractor and operated at a speed of 8 km h-1.
Post emergence weed control A 4 m, fixed frame, spring-toothed harrow was used, linked to a 60 kW 4WD tractor; it
operated at e depth of 2-3 cm and at a speed of 3 km h-1 in the first treatment and a speed of 5 km h-1 in the second one (fig. 1).
First intervention. Detail of the crop Figure 1 - The spring teeth harrow used in the trials.

5th EWRS Workshop on Physical Weed Control 21 Pisa, Italy, 11-13 March 2002
A four-row farm machine, linked to a 2WD 44 kW tractor was used for hoeing and ridging. The machine is made up of a series of working elements mounted on parallelograms with a
gauge wheel for a constant working depth. Each parallelogram was equipped with 5 'S'-shaped spring teeth for hoeing. In the early
treatment, each spring teeth set was equipped with two shields for crop protection. In this way the machine was able to operate at a depth of 4-6 cm and at a speed of 6 km h-1, allowing weed control of 80% of the soil, leaving an untreated band of just 9 cm along each side of the row (fig. 2).
Figure 2 - Effect of the hoeing .
Each parallelogram was equipped with 2 'S'-shaped spring teeth and a high-wing mouldboard furrower for the ridging. During the treatment care was taken to bury as many weeds as possible along the row and this lead to a reduction of the velocity to 4 km h-1 and required a working depth of 8 cm (about 16 cm between the top of the ridge and the bottom of the furrow - fig. 3).
Figure 3 - Effect of ridging.
The flaming equipment consists of a frame and 6 parallelograms with height adjusting wheels. Each parallelogram has two 25 cm long burners, that were adjustable in height and inclination above the ground. The burners were supplied by LP- Gas, in 10 kg gas cylinders, through a circuit with a pressure regulator and a minimum and maximum adjustment tap that can be activated directly by the tractor drivers. Each burner is fitted with a thermovalve that interrupts the supply of gas whenever the flame is accidentally extinguished. The machine was used with gas at 300 kPa and with a field speed of 3 km h-1. Eight burners (2 for each row) were used in post emergence, operating near the base of the stalk, burning the weeds on a 25 cm band that was not controlled with hoeing and ridging (fig. 4).

5th EWRS Workshop on Physical Weed Control 22 Pisa, Italy, 11-13 March 2002
First intervention. Second intervention. Figure 4 - The machine used for flaming.
Assessment of the weeds The degree of infestation was determined for the different treatments in 4 different periods in
both season at these stages: -before passage of the rotary harrow (before crop planting); -before the first intervention against weeds (4^-6^ maize leaf); -after all the interventions against weeds (at maize raising); -before harvesting. The density of the weeds was assessed for each determination, on at least 4 areas of 0,25 m2 in
each plot.
Assessment of the crop At crop maturity, the following parameters were determined:
- final crop density; - maize plant height; - incidence of abnormal, lodged and broken maize plant; - maize yield and dry matter content in grains.
The results were elaborated and all the data were subjected to factorial ANOVA. The means were separated using Duncan's test at a 0.05% level.
Results
The year 2000 - Assesment of the weeds A mean weed density of 136 plants m-2 was recorded before the intervention of the rotary
harrow in the early ploughed area with a density of 29 plants m-2 in the minimum tillage area. The main weeds in the ploughed soil were Chenopodium polyspermum L., Amaranthus
retroflexus L. and Chenopodium album L.. Amaranthus retroflexus, Vicia sativa L., Chenopodium polyspermum L. and Portulaca oleracea L. were prevalent in the minimum tillage soil (fig. 5).

5th EWRS Workshop on Physical Weed Control 23 Pisa, Italy, 11-13 March 2002
69.4
21.8
12.2
10.9
5.4
16.3
3.8
6.7
3.8
2.0
4.4
3.8
2.6
2.0
0.0 10.0 20.0 30.0 40.0 50.0 60.0 70.0 80.0
Chenopodium spp.
Amaranthus retroflexus
Portulaca oleracea
Capsella bursa-pastoris
Lolium spp.
Vicia sativa
Papaver rhoeasStellaria media
Vicia sativa
others
Weed density (plants m-2)
Early ploughing Minimum tillageFigure 5 - The year 2000. Weed density before rotary harrowing.
Just before the first intervention against the weeds, the total weed density was in the range of 13.3 and 26.3 plants m-2, with no significant differences between the different seed bed preparation techniques. The prevalent species were Amaranthus retroflexus, Chenopodium album, Echinochloacrus-galli L. and Portulaca oleracea (fig. 6).
7.8
10.5
4.0
4.0
6.0
13.5
7.5
10.6
0.0 2.0 4.0 6.0 8.0 10.0 12.0 14.0 16.0
Chenopodium spp.
Amaranthusretroflexus
Portulaca oleracea
Echinochloa crus-galli
Early ploughing Minimum tillage
Weed density (plants m-2)
Figure 6 - The year 2000. Density of the different species before the first intervention of weed control.
The weed density, 11 days after the last intervention for weed control, ranged from 72,7 to 141,1 plants m-2. The infestation level did not seem to be affected by the seed bed preparation techniques.
Of the different species, there was a higher presence of only Chenopodium album in the ploughed soil (fig. 7).
5th EWRS Workshop on Physical Weed Control 24 Pisa, Italy, 11-13 March 2002
21.0
21.0
52.0
1.0
3.0
27.0
44.0
2.0
0.0 10.0 20.0 30.0 40.0 50.0 60.0
Chenopodium spp.
Amaranthusretroflexus
Portulaca oleracea
Echinochloa crus-galli
Weed density (plants m-2)
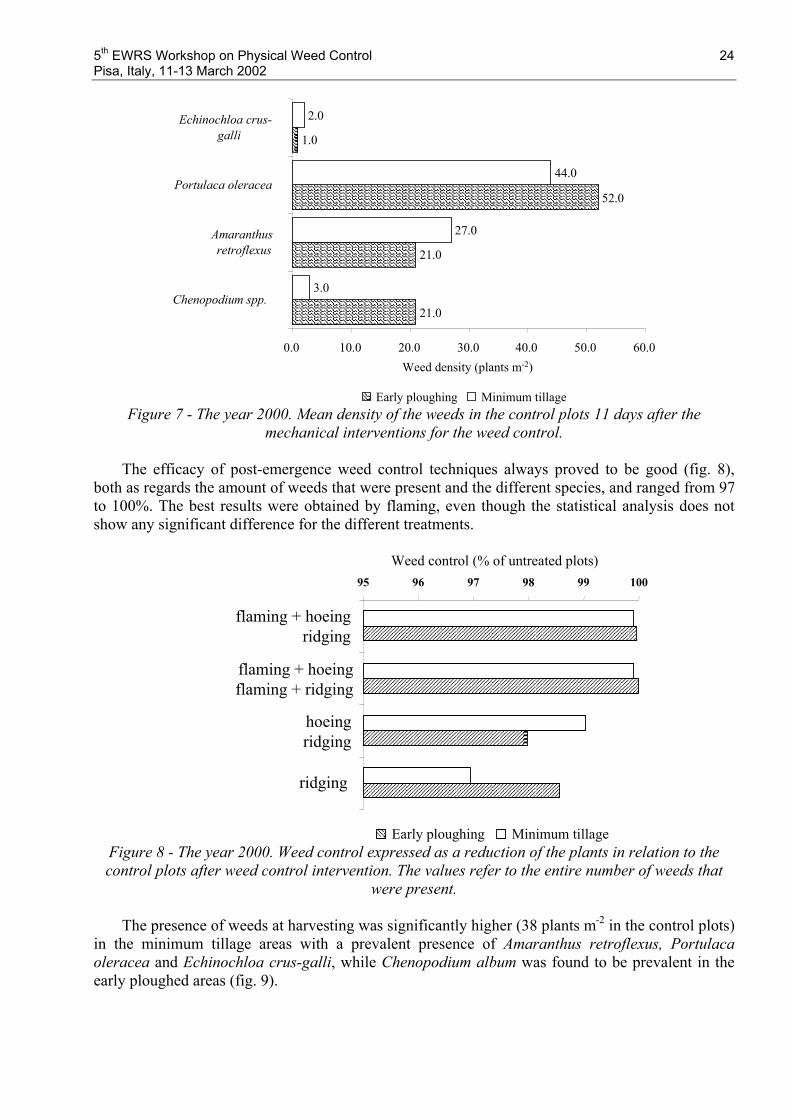
Early ploughing Minimum tillageFigure 7 - The year 2000. Mean density of the weeds in the control plots 11 days after the
mechanical interventions for the weed control.
The efficacy of post-emergence weed control techniques always proved to be good (fig. 8), both as regards the amount of weeds that were present and the different species, and ranged from 97 to 100%. The best results were obtained by flaming, even though the statistical analysis does not show any significant difference for the different treatments.
95 96 97 98 99 100
Weed control (% of untreated plots)
Early ploughing Minimum tillage
flaming + hoeingflaming + ridging
hoeingridging
ridging
flaming + hoeingridging
Figure 8 - The year 2000. Weed control expressed as a reduction of the plants in relation to the control plots after weed control intervention. The values refer to the entire number of weeds that
were present.
The presence of weeds at harvesting was significantly higher (38 plants m-2 in the control plots) in the minimum tillage areas with a prevalent presence of Amaranthus retroflexus, Portulaca oleracea and Echinochloa crus-galli, while Chenopodium album was found to be prevalent in the early ploughed areas (fig. 9).

5th EWRS Workshop on Physical Weed Control 25 Pisa, Italy, 11-13 March 2002
14.0
11.5
8.0
1.5
3.0
19.0
9.0
2.5
0.0 5.0 10.0 15.0 20.0
Chenopodium spp.
Amaranthusretroflexus
Portulaca oleracea
Echinochloa crus-galli
Weed density (plants m-2)
Early ploughing Minimum tillageFigure 9 - The year 2000. Mean density of weeds in the control plots at harvesting.
As in the previous determination, all the compared weed control techniques were characterized by a good efficacy level with no significant differences among them. The best weed control was obtained from the flaming applications, with a weed control of nearly 100% in both the single and double treatments (fig. 10). The flaming in fact allowed a reduction of the weed development throughout the entire maize growing season, while mechanical (hoeing and ridging) led to a late development of weeds. The ridging alone only allowed a acceptable weed control in the early ploughed areas.
0 20 40 60 80 100Weed control (% of untreated plots)
Early ploughing Minimum tillage
flaming + hoeingflaming + ridging
hoeing ridging
ridging
flaming + hoeingridging
Figura 10 - The year 2000. Weed control as a reduction of the plants in relation to the control plots at harvesting. The values refer to the entire number of weeds that were present.
The year 2001 - Assesment of the weeds Before intervention with the rotary harrow, a mean weed density of 22.4 plants m-2 was
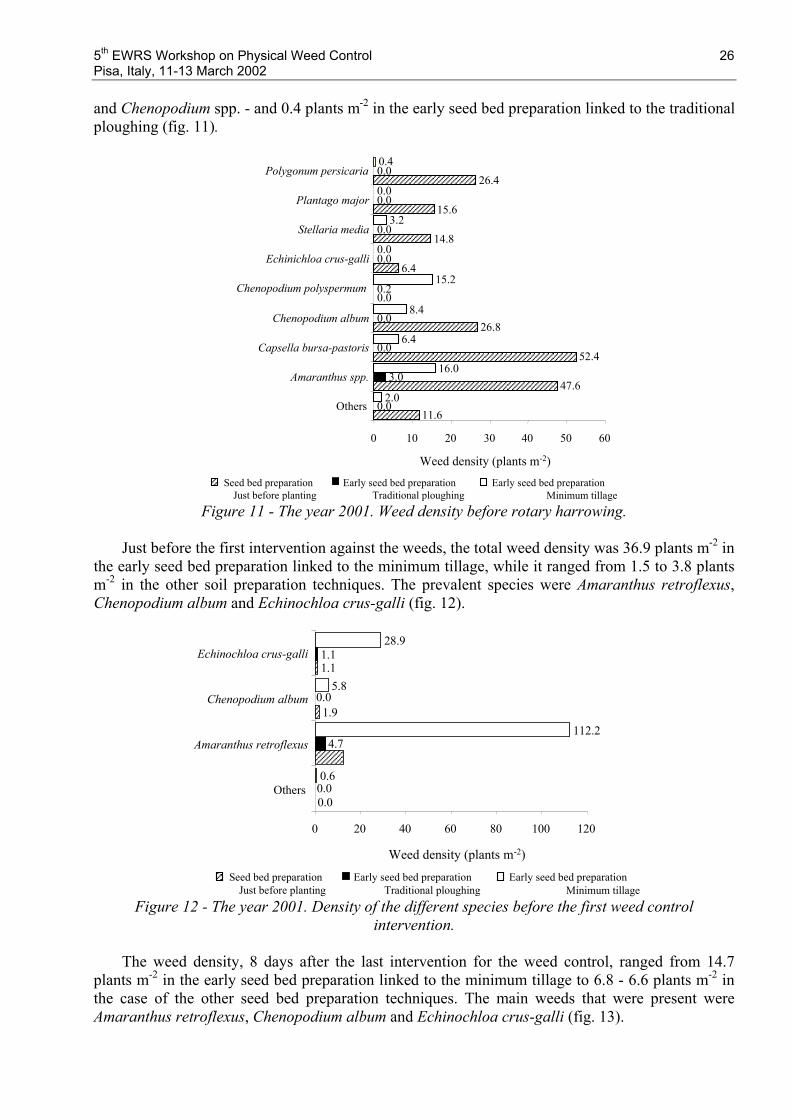
recorded in the areas in which the seed bed was prepared just before planting - with the prevalent presence of Capsella bursa pastoris L., Amaranthus spp., Chenopodium album, Poyigonumpersicaria L., Plantago major L. and Stellaria media Cyr. - a density of 5.7 plants m-2 in the early seed bed preparation linked to the minimum tillage - with a prevalent presence of Amaranthus spp.
5th EWRS Workshop on Physical Weed Control 26 Pisa, Italy, 11-13 March 2002
and Chenopodium spp. - and 0.4 plants m-2 in the early seed bed preparation linked to the traditional ploughing (fig. 11).
��������������������������������������
��������������������������������������������������������������������������������������������������������������������������������������������������
����������������������������������������������������������������������������������������������������������������������������������������������������������������
������������������������������������������
�����������
�����������������������
�������������������������
�����������������������������������������
11.6
47.6
52.4
26.8
0.0
6.4
14.8
15.6
26.4
0.0
3.0
0.0
0.0
0.2
0.0
0.0
0.0
0.0
2.0
16.0
6.4
8.4
15.2
0.0
3.2
0.0
0.4
0 10 20 30 40 50 60
Others
Amaranthus spp.
Capsella bursa-pastoris
Chenopodium album
Chenopodium polyspermum
Echinichloa crus-galli
Stellaria media
Plantago major
Polygonum persicaria
Early seed bed preparationMinimum tillage
Early seed bed preparationTraditional ploughing
Seed bed preparationJust before planting
���Weed density (plants m-2)
Figure 11 - The year 2001. Weed density before rotary harrowing.
Just before the first intervention against the weeds, the total weed density was 36.9 plants m-2 in the early seed bed preparation linked to the minimum tillage, while it ranged from 1.5 to 3.8 plants m-2 in the other soil preparation techniques. The prevalent species were Amaranthus retroflexus,Chenopodium album and Echinochloa crus-galli (fig. 12).
������������������������
������
��
0.0
1.9
1.1
0.0
1.1
0.6
112.2
5.8
28.9
0 20 40 60 80 100 120
Others
Amaranthus retroflexus
Chenopodium album
Echinochloa crus-galli
Early seed bed preparationMinimum tillage
Early seed bed preparationTraditional ploughing
Seed bed preparationJust before planting
��������
Weed density (plants m-2)
0.0
4.7
Figure 12 - The year 2001. Density of the different species before the first weed control intervention.
The weed density, 8 days after the last intervention for the weed control, ranged from 14.7 plants m-2 in the early seed bed preparation linked to the minimum tillage to 6.8 - 6.6 plants m-2 in the case of the other seed bed preparation techniques. The main weeds that were present were Amaranthus retroflexus, Chenopodium album and Echinochloa crus-galli (fig. 13).

5th EWRS Workshop on Physical Weed Control 27 Pisa, Italy, 11-13 March 2002
Early seed bed preparationMinimum tillage
Early seed bed preparationTraditional ploughing
Seed bed preparationJust before planting
����Weed density (plants m-2)
��������������������������������������������������������������������������������
����������������������������������������������������������������������������������������������
��������������������������������������
��������������
0.1
11.6
13.8
5.5
2.0
0.6
9.3
7.1
15.4
1.7
0.4
37.2
16.7
1.6
17.3
0 10 20 30 40
Others
Amaranthus retroflexus
Chenopodium album
Chenopodium polyspermum
Echinochloa crus-galli
Figure 13 - The year 2001. The mean density of the weeds in the control plots 8 days after the mechanical weed control intervention.
The efficacy of the post-emergence weed contol techniques ranged from 80 to 100%, except in the case of hoeing and ridging in the minimum tillage areas. The best results were obtained through flaming and spring teeth harrowing (fig. 14).
��������������������������������������������������������������������������������������������������������������������������������������������������������������������������������������������
������������������������������������������������������������������������������������������������������������������������������������������������������������������������������������������������
����������������������������������������������������������������������������������������������������������������������������������������������������
����������������������������������������������������������������������������������������������������������������������������������������������������������������������������
��������������������������������������������������������������������������������������������������������
����������������������������������������������������������������������������������������������������������
0% 20% 40% 60% 80% 100%
flaming + hoeinghoeing - ridging
2 flaming + hoeingridging
hoeingridging
2 spring teeth harrowinghoeing
2 hoeingridging
2 spring teeth harrowinghoeing - ridging
Early seed bed preparationMinimum tillage
Early seed bed preparationTraditional ploughing
Seed bed preparationJust before planting
���Weed control (% of untreated plots)
Figure 14 - The year 2001. Weed control expressed as a reduction of the plants in relation to the control plots after weed control intervention. The values refer to the entire number of weeds that
were present.
The presence of weeds at harvesting was significantly higher (38 plants m-2 in the control plots) in the minimum tillage areas with the prevalent presence of Amaranthus retroflexus, Echinochloa crus-galli, and Chenopodium album (fig. 15).

5th EWRS Workshop on Physical Weed Control 28 Pisa, Italy, 11-13 March 2002
����
��������������������������������������������������������������������������������
����������������������������������������������������������������������������������������������
������������������������������������������������������
����������������
0.3
18.4
22.1
12.1
3.1
0.3
13.1
5.4
9.4
3.1
0.5
40.3
7.3
2.5
16.5
0 10 20 30 40 50
Others
Amaranthus retroflexus
Chenopodium album
Chenopodium polyspermum
Echinochloa crus-galli
Early seed bed preparationMinimum tillage
Early seed bed preparationTraditional ploughing
Seed bed preparationJust before planting
��� Weed density (plants m-2)
Figure 15 - The year 2001. The mean density of weeds in untreated plots at harvesting.
The best weed control was obtained through spring teeth harrowing in the areas in which the seed bed was prepared just before planting, with a weed control of nearly 95-100% in both the single and double treatments (fig. 16). Flaming in fact led to a reduction of the weed development throughout the entire maize growing season, while mechanical (hoeing and ridging) led to a late development of weeds.
���������������������������������������������������������������������������������������������������
�������������������������������������������������������������������������������������������������
��������������������������������������������������������������������������������������
�����������������������������������������������������������������������������������������
����������������������������������������������������������������������������������������������������������
���������������������������������������������������������������������������������������������������������������
0% 20% 40% 60% 80% 100%
flaming + hoeinghoeing - ridging
2 flaming + hoeingridging
hoeingridging
2 spring teeth harrowinghoeing
2 hoeingridging
2 spring teeth harrowinghoeing - ridging
Early seed bed preparationMinimum tillage
Early seed bed preparationTraditional ploughing
Seed bed preparationJust before planting
����Weed control (% of not treated plots)
Figure 16 - 2001. Weed control expressed as a reduction of plants in relation to the control plots at harvesting. The values refer to the whole amount of weeds that were present.
The year 2000 - Assessment of the maize Factorial ANOVA showed significant differences between the early ploughed soil and
minimum tillage areas as regards:
5th EWRS Workshop on Physical Weed Control 29 Pisa, Italy, 11-13 March 2002
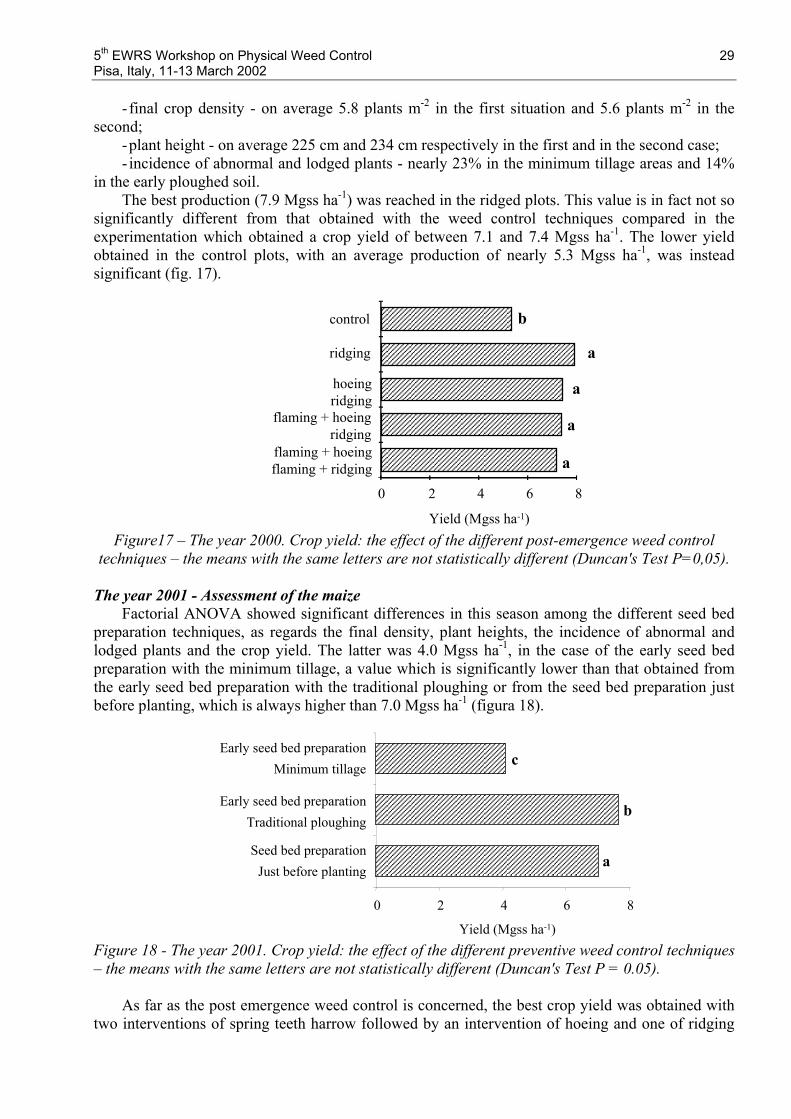
- final crop density - on average 5.8 plants m-2 in the first situation and 5.6 plants m-2 in the second;
-plant height - on average 225 cm and 234 cm respectively in the first and in the second case; - incidence of abnormal and lodged plants - nearly 23% in the minimum tillage areas and 14%
in the early ploughed soil. The best production (7.9 Mgss ha-1) was reached in the ridged plots. This value is in fact not so
significantly different from that obtained with the weed control techniques compared in the experimentation which obtained a crop yield of between 7.1 and 7.4 Mgss ha-1. The lower yield obtained in the control plots, with an average production of nearly 5.3 Mgss ha-1, was instead significant (fig. 17).
������������������������������������������������������������������������������������������������������������������������������������������
������������������������������������������������������������������������������������������������������������������������������������������������������������������������������������������������������������������������
������������������������������������������������������������������������������������������������������������������������������������������������������������������������������������������������������������������������
������������������������������������������������������������������������������������������������������������������������������������������������������������������������������������������������������������������������
����������������������������������������������������������������������������������������������������������������������������������������������������������
��������������������������������������������������������������������������������������������������������
0 2 4 6 8
a
a
a
a
b
flaming + hoeingflaming + ridging
hoeing ridging
control
flaming + hoeingridging
ridging
Yield (Mgss ha-1)Figure17 – The year 2000. Crop yield: the effect of the different post-emergence weed control
techniques – the means with the same letters are not statistically different (Duncan's Test P=0,05).
The year 2001 - Assessment of the maize Factorial ANOVA showed significant differences in this season among the different seed bed
preparation techniques, as regards the final density, plant heights, the incidence of abnormal and lodged plants and the crop yield. The latter was 4.0 Mgss ha-1, in the case of the early seed bed preparation with the minimum tillage, a value which is significantly lower than that obtained from the early seed bed preparation with the traditional ploughing or from the seed bed preparation just before planting, which is always higher than 7.0 Mgss ha-1 (figura 18).
������������������������������������������������������������������������������������������������������������������������������������������������������������������������������������������������������������������������������������������������������������������������
������������������������������������������������������������������������������������������������������������������������������������������������������������������������������������������������������������������������������������������������������������������������������������������������
������������������������������������������������������������������������������������������������������������������������������������������������������������
0 2 4 6 8
a
b
c
Yield (Mgss ha-1)
Early seed bed preparationMinimum tillage
Early seed bed preparationTraditional ploughing
Seed bed preparationJust before planting
Figure 18 - The year 2001. Crop yield: the effect of the different preventive weed control techniques – the means with the same letters are not statistically different (Duncan's Test P = 0.05).
As far as the post emergence weed control is concerned, the best crop yield was obtained with two interventions of spring teeth harrow followed by an intervention of hoeing and one of ridging
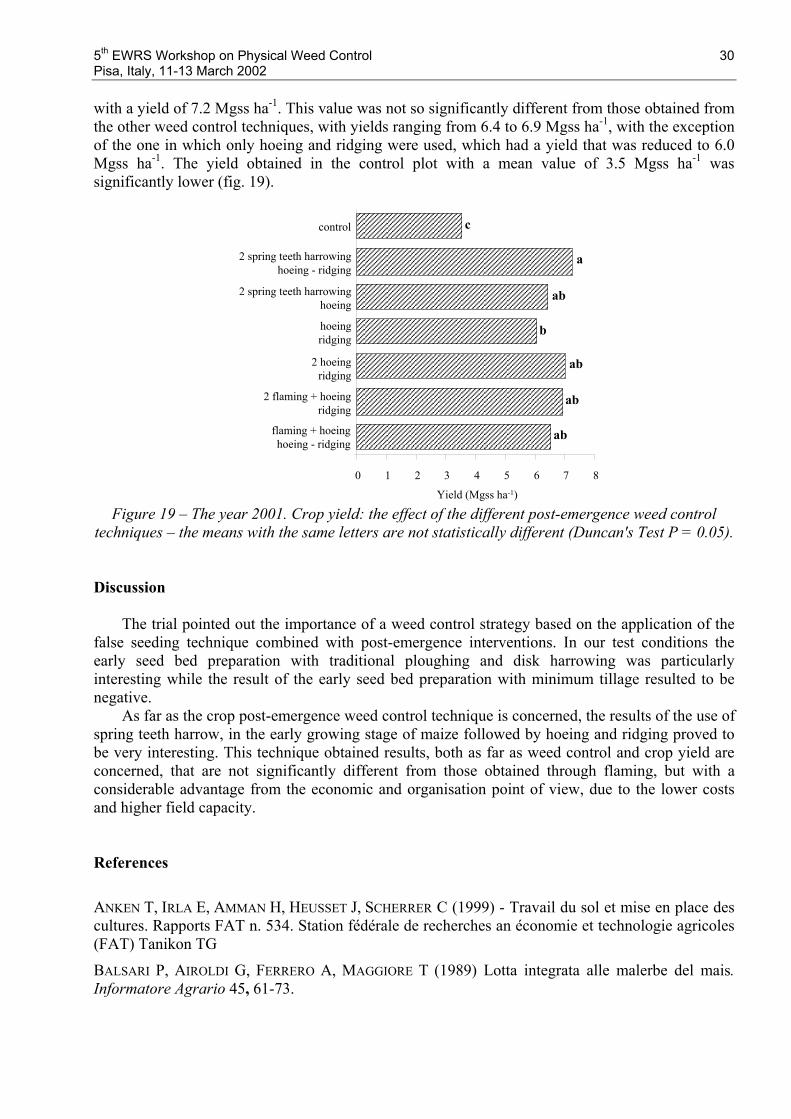
5th EWRS Workshop on Physical Weed Control 30 Pisa, Italy, 11-13 March 2002
with a yield of 7.2 Mgss ha-1. This value was not so significantly different from those obtained from the other weed control techniques, with yields ranging from 6.4 to 6.9 Mgss ha-1, with the exception of the one in which only hoeing and ridging were used, which had a yield that was reduced to 6.0 Mgss ha-1. The yield obtained in the control plot with a mean value of 3.5 Mgss ha-1 was significantly lower (fig. 19).
���������������������������������������������������������������������������������������������������������������������������������������������������������������������������������������������������������������������������������������
������������������������������������������������������������������������������������������������������������������������������������������������������������������������������������������������������������������������������������������������������
����������������������������������������������������������������������������������������������������������������������������������������������������������������������
������������������������������������������������������������������������������������������������������������������������������������������������������������������������������������������������������������������������
������������������������������������������������������������������������������������������������������������������������������������������������������������������������������������������������������������������������������������
����������������������������������������������������������������������������������������������������������������������������������������������������������������������������
���������������������������������������������������������������������������������������������������������������������������������
0 1 2 3 4 5 6 7 8
a
c
ab
b
ab
ab
abflaming + hoeinghoeing - ridging
2 flaming + hoeingridging
control
hoeingridging
2 spring teeth harrowinghoeing
2 hoeingridging
2 spring teeth harrowinghoeing - ridging
Yield (Mgss ha-1)
Figure 19 – The year 2001. Crop yield: the effect of the different post-emergence weed control techniques – the means with the same letters are not statistically different (Duncan's Test P = 0.05).
Discussion
The trial pointed out the importance of a weed control strategy based on the application of the false seeding technique combined with post-emergence interventions. In our test conditions the early seed bed preparation with traditional ploughing and disk harrowing was particularly interesting while the result of the early seed bed preparation with minimum tillage resulted to be negative.
As far as the crop post-emergence weed control technique is concerned, the results of the use of spring teeth harrow, in the early growing stage of maize followed by hoeing and ridging proved to be very interesting. This technique obtained results, both as far as weed control and crop yield are concerned, that are not significantly different from those obtained through flaming, but with a considerable advantage from the economic and organisation point of view, due to the lower costs and higher field capacity.
References
ANKEN T, IRLA E, AMMAN H, HEUSSET J, SCHERRER C (1999) - Travail du sol et mise en place des cultures. Rapports FAT n. 534. Station fédérale de recherches an économie et technologie agricoles (FAT) Tanikon TG
BALSARI P, AIROLDI G, FERRERO A, MAGGIORE T (1989) Lotta integrata alle malerbe del mais.Informatore Agrario 45, 61-73.

5th EWRS Workshop on Physical Weed Control 31 Pisa, Italy, 11-13 March 2002
BALSARI P, AIROLDI G, FERRERO A (1990) - Esperienze sulle tecniche a bassa o nulla chimicizzazione per il controllo delle in festanti del mais. In: Atti II Conferenza Nazionale sul Mais,Grado, Italia, 412- 422.
BALSARI P, FERRERO A, AIROLDI G (1991) - Weed Control in Maize by Flaming. In: Proceedings of the 43rd International Symposium on Crop Protection, Gent, Belgium, 681-689.
BALSARI P, AIROLDI G, FERRERO A (1993) Evaluation of the mechanical weed control in maize and soybean. In: Proceedings of 8th Symposium European Weed Research Society, Braunschweig, Germany, 341-348.
PERUZZI A, BARBERI P, GINANNI M, RAFFAELLI M, SILVESTRI N (1997) - Prove sperimentali di controllo meccanico delle infestanti del frumento mediante erpice strigliatore. Atti VI Convegno Nazionale di Ingegneria Agraria, Ancona, Italia 10-12 Settembre 669-678.
5th EWRS Workshop on Physical Weed Control 32 Pisa, Italy, 11-13 March 2002
Analysis of weeds succession and competitiveness as related to the sowing date and another crop techniques of sugar beet
G. CAMPAGNA*, G. RAPPARINICentro di Fitofarmacia - Dipartimento di Protezione e Valorizzazione Agroalimentare - Università
degli Studi - Via F. Re 8 - 40126 Bologna. *Servizio Agronomico CO.PRO.B.
ABSTRACT
This contribution refers the results obtained by the analysis of a floral succession and competitiveness as related to the planting date of sugar beet. This study, in a general context of a reduced environmental impact which expects the abandonment of chemical weed control by applying organic practices, examined the productivity of the crop sown early in the season in relation to the crop sown later, by comparing a more traditional complete weed control practice with a procedure which involves less use of herbicides or with a organic one.
The obtained results of this experiment, carried out in a fine-textured clayey soil, evidenced an increased crop productivity due to the extension of its life cycle and to the reduction of the emergence of those macrothermal weeds that are characterised by a graduated and tardy germination. Although this crop appears to be less infested at the beginning of the life cycle, the erect stems and the higher degree of competitiveness of Chenopodium album, C. opulifolium, C.ficifolium, Amaranthus retroflexus, A. albus among dicotyledons ed Echinochloa crus-galli among gramineae, determined a lower sugar beet productivity.
Sowing early the sugar beet it has been observed a higher level of weed occurrence especially mesothermal ones, among which the poligonaceae weeds characterised by a horizontal stems, such as Polygonum aviculare and Fallopia convolvulus, are dominant. The high weed infestation initially seems to cause disadvantage to the crop, while subsequently it represents under the crop leaves a grass layer that hinders the germination of the more competitive and tardy weeds, such as chenopodiaceae and amarantaceae.
Besides, by using weed control techniques in which insecticides are not applied as in the case of organic practices and procedures characterised by a reduced environmental impact, an early occurrence of Gatroidea poligoni is enhanced. This coleopter beetle attacks these polygonaceae and thus can limit the growth and the competitiveness of these two invasive weeds.
Key words: sugar beet, herbicides, sowing date, weeds, organic crop.
Introduction
Over the last decade, in Italy manual weeding has been gradually completely replaced by chemical weed control. On sugar beet, this practice has been rationalised to an extent unequalled on any other crop. This has led to a decrease in the herbicide doses used per hectare and thus to a reduction in environmental impact (Meriggi et al., 2000). The introduction of triflusulphuron methyl, the aid of new formulative technologies and agronomic crop management using the stale seed bed technique, mechanical weeding between rows, early sowing, etc., have contributed to the optimisation of weed control in this specialist crop. There is ever-increasing awareness of the problems relating to contamination and the possible environmental effects of herbicides, as well as

5th EWRS Workshop on Physical Weed Control 33 Pisa, Italy, 11-13 March 2002
the need to reduce costs and simplify beet growing techniques in order to enhance its competitiveness. The introduction of genetically modified varieties tolerant of total herbicides, together with the provision of incentives for the use of integrated weed control systems, could hold the key to the state of the art in sugar beet weed control (Wevers, 2000). In the meantime, there is a growing need to introduce growing techniques of low environmental impact, and the prospects for extending organic farming methods to this industrial crop are increasing. However, sugar beet grows at slower rates than weeds (Covarelli et al., 1998) and suffers a heavy reduction in yield as a result of them (Rosso et al., 1996) or as a consequence of incorrect use of weed control techniques (Campagna et al., 2000). As a result, the need for a more accurate assessment of the effects of weed competition on sugar beet in relation to sowing period and differentiated growing techniques is being increasingly felt. This is the aim behind the paper which follows, which sets out to evaluate this crop's response in terms of productivity to the succession of flora in a typical Italian beet-growing environment, comparing conventional growing techniques with low chemical impact and organic farming methods.
Materials and methods (Tab. 1)
The trial was performed at Minerbio in the province of Bologna during 2001, on a fine-consistency clayey soil. The trial field was laid out in randomised blocks repeated 4 times. Herbicides were applied using a trailed bar fitted with fan nozzles delivering a water volume of 400 L/ha pre-emergence and 200 L/ha post-emergence of the beet. On the organically-grown beet, finger harrows were used pre-sowing and a mower bar was employed to contain the growth of erect-stem weeds during the summer. Weeding was carried out when the beet was at the 8-10 leaf stage. Weed levels were monitored by counting the weeds present in the plots and estimating the % cover during the crop growth period. The weed biomass was analysed at the end of the growing cycle. Crop selectivity was evaluated on treated beet plants, which were compared with untreated plants, on the basis of an empirical scale of 0-10 (0=no symptoms; 10=crop destroyed). When the beet was harvested, the roots obtained from each plot were weighed.
Weather pattern (Fig. 1): the frequent rainfall which started at the end of the winter and the mild temperatures were a hindrance to sowing operations and at the same time provided favourable conditions for the emergence of weeds and for the weed-killing effects of the residual herbicides applied pre-emergence. The depression which brought very cold air from the North during the second ten days of April slowed down growth of the weeds and the beet, postponing the start of post-emergence procedures. On the other hand, in early May, during the final applications on the crop, temperatures were above the seasonal average. The rainfall during the same period was favourable for weed-killing operations and for the growth of the crop after the earlier unseasonable weather, and also favoured late-germinating, late-growing weeds. The hot, dry weather during June and July led to a below-normal crop growth rate, while the macrothermal weeds continued to develop.
Results (Tab. 2, 3 – Fig. 2, 3)
The results obtained during the trial conducted in 2001 in a fine-textured clayey soil indicated that if the sowing period is brought forward to late February, the degree of weed emergence and infestation is very high, especially during the first part of the growing cycle. The prevalent weeds were the early-germinating ones, including the creeping polygonaceae such as Polygonum aviculareand Fallopia convolvulus, as well as Polygonum lapathifolium and Chenopodium album.

5th EWRS Workshop on Physical Weed Control 34 Pisa, Italy, 11-13 March 2002
On the areas sown after the middle of March there was a considerable reduction in the degree of infestation by Polygonum aviculare and Fallopia convolvulus and to a lesser extent by Polygonum lapathifolium and Chenopodium album. In the meantime later-germinating weeds, including Amaranthus retroflexus and Solanum nigrum amongst the dicotyledons and Echinochloacrus-galli amongst the gramineae appeared, infesting the crop after the initial growth phases of the beet. In this later sowing period, the treatments performed to eliminate the weeds before emergence of the crop proved to be of vital importance, especially with regard to the weeds which germinated during the first half of March, slightly ahead of the beet itself, including polygonaceae and chenopodiaceae. However, due above all to the particularly mild, wet winter, the extermination of the weeds which had germinated during autumn and winter and had remained on the seed bed, including Papaver rhoesas, Sinapis arvensis, Stellaria media and Veronica persica, proved to be most important.
With the latest sowings at the end of March, we witnessed the almost complete exhaustion of emergence of Polygonum aviculare and Fallopia convolvulus and only partial exhaustion of Polygonum lapathifolium and Chenopodium album. As a result of the gaps created in the absence of weeds and the delay before the development of the later-growing crop, there was an increase in the germination of macrothermal weeds, especially the more competitive Amaranthus retroflexus,which enjoyed considerable growth and occupied the space required by the sugar beet.
With the organic growing methods, the floral succession tending to favour the macrothermal weeds was less obvious, since the use of finger harrows rather than chemical herbicides provided less radical weed reduction and the effects of the initial complete freeing of the soil were less noticeable. Weeding between the rows, followed by mowing of the erect weeds standing above the level of the beet leaves, was found to be vital for the reduction of competition and above all of dissemination.
Crop yields were higher with earlier sowings, where the growing cycle was longer and the emergence of later-germinating weeds requiring macrothermal conditions was reduced in favour of the creeping Polygonaceae. With later sowing dates, infestation levels were lower at the beginning of the growing cycle, but the erect habit and greater competitiveness shown by the chenopodiaceae Chenopodium album, C. opulifolium and C. ficifolium, and more especially by the amarantaceae including Amaranthus retroflexus and to a lesser extent A. albus amongst the dicotyledons, as well as Echinochloa crus-galli amongst the gramineae, led to a significant reduction in the weight of the crop's roots.
In the organic crops and also in those farmed by conventional methods with low environmental impact, where the use of insecticides was not necessary, conditions were favourable for the occurrence and development of Gastroidea poligoni (Fig. 4), a coleopter beetle which fed mainly on Polygonum aviculare but also on Fallopia convolvulus, keeping down their growth and thus their ability to compete, as well as their degree of dissemination. The high degree of infestation by these 2 invasive weeds in the earliest-sown sugar beet initially appeared to be putting the crop at a serious disadvantage, but subsequently the grassy layer they formed underneath the leaf system tended to prevent the emergence of the later-germinating weeds which are also more competitive in relation to the crop, including chenopodiaceae and amarantaceae, and they were subsequently almost completely destroyed by this extremely useful insect, leaving room for the crop.

5th EWRS Workshop on Physical Weed Control 35 Pisa, Italy, 11-13 March 2002
Discussion
The study performed on the analysis of the floral succession and the influence of weed competition in relation to sugar beet productivity on the basis of crop sowing period with conventional, reduced environmental impact and organic growing methods enabled us to reach the following conclusions.
With the earliest sowing dates, in spite of the greater initial weed density the sugar beet root yield was found to be greater. The creeping polygonaceae, Polygonum aviculare and Fallopiaconvolvulus, first provided a barrier to the germination of the other weeds, including in particular the more competitive, erect-growing, later-germinating species such as amarantaceae and summer gramineae, and were then almost completely destroyed in their turn by the coleopter beetle Gastroidea poligoni.
With the aid of extermination of the weeds which had germinated on the soil before the later sowings, the density of polygonaceae and chenopodiaceae, and thus the initial competition the crop has to face, is considerably reduced, but there is also the risk of increasing the level of infestation by the more competitive summer-growing amarantaceae and gramineae. What's more, the growing cycle of the sugar beet, necessary to allow production of the greatest possible quantity of roots before the arrival of summer with its drought and high temperatures, is reduced.
In the case of the earliest sowings, pre-emergence treatments to reduce initial weed competition with the crop were found to be extremely useful; the crop can also be aided at a later stage by mechanical weeding to limit floral competition, and attacks by Gastroidea poligoni to combat the growth of Polygonum aviculare and Fallopia convolvulus.
With organic growing methods, there are still considerable difficulties due to the problems of containing weed growth. Full use has to be made of finger harrowing and the exhaustion of seed germination through early preparation of the seed bed and weeding followed by slight earthing-up, without over-delaying the sowing period. It is also important to take care that the sugar beet is as competitive as possible, by reducing germination failure in order to limit weed growth and the damage arising from competition.
References
CAMPAGNA G., BARTOLINI D., RAPPARINI G., 2000. Ulteriori verifiche di integrazione tra diserbanti di pre e post-emergenza della barbabietola da zucchero. Atti XII Convegno S.I.R.F.I., 185-189.
CAMPAGNA G., ZAVANELLA M., VECCHI P., MAGRI F., 2000. Sugar beet weed control: yield in relation with herbicide selectivity and action. Proceedings of the 63rd IIRB Congress, 541-548.
COVARELLI G., ONOFRI A., 1998. Effects of timing of weed removal and emergence in sugar beet. Proceedings: 6th Mediterranean Symposium EWRS, 65-72.
MERIGGI P., SGATTONI P., 2000. L’ottimizzazione del diserbo nella barbabietola da zucchero. Atti XII Convegno S.I.R.F.I., 69-91.
ROSSO F., MERIGGI P., PAGANINI U., 1996. Barbabietola da zucchero: tecniche operative per il controllo delle erbe infestanti. Terra e Vita, 5 (supplemento), 14-19.
WEVERS J.D.A., 2000. Herbicide tolerance and the effects on the environmental contamination. Proceedings of the 63rd IIRB Congress, 179-185.

5th E
WR
S W
orks
hop
on P
hysi
cal W
eed
Con
trol
36
Pi
sa, I
taly
, 11-
13 M
arch
200
2
Tab.
1 -
Expe
rimen
tal t
ests
- Ye
ar 2
001
- Min
erbi
o (B
O) I
taly
Soil
type
: 23
% s
and;
45
% lo
am;
32 %
cla
y; p
H 8
; org
anic
mat
ter 1
,7 %
Pree
cedi
ng c
rop:
whe
at
C
ultiv
ar: M
onod
oro
(see
d tre
atm
ent w
ith im
idac
lopr
id)
Thes
is
Su
bthe
sis:
agr
onom
ic p
ract
ices
and
wee
d co
ntro
l app
licat
ions
: pro
duct
s, d
oses
, et
c.
Mec
hani
cal
Pr
e-so
win
g Pr
e-em
erge
nce
Post
-em
erge
nce*
(1)
w
eedi
ng
Full
Spec
ific
herb
icid
e H
erbi
cide
: g/h
a of
a.
i. A
: cot
yled
ons-
2 le
aves
B
: 4 le
aves
in
ter-r
ow
cove
ring
I 26
-Feb
1
- gl
ufos
inat
e-am
mon
ium
m
etam
itron
35
00
(ph.
+d.+
e.) +
met
. + o
il (p
h.+d
.+e.
) + m
et. +
oil
- be
ginn
ing
may
I
26-F
eb
2 -
gluf
osin
ate-
amm
oniu
m
met
amitr
on
3500
-
- -
begi
nnin
g m
ay
I 26
-Feb
3
- gl
ufos
inat
e-am
mon
ium
-
- -
- -
begi
nnin
g m
ay
II
19-M
ar
1 -
gluf
osin
ate-
amm
oniu
m
met
amitr
on
3500
(p
h.+d
.+e.
) + m
et. +
oil
(ph.
+d.+
e.) +
met
. + o
il -
mid
may
II
19-M
ar
2 -
gluf
osin
ate-
amm
oniu
m
met
amitr
on
3500
-
- -
mid
may
II
19-M
ar
3 -
gluf
osin
ate-
amm
oniu
m
- -
- -
- m
id m
ay
II 19
-Mar
4
- -
- -
- -
- m
id m
ay
II 19
-Mar
5
- gl
ufos
inat
e-am
mon
ium
m
etam
itron
21
00
- -
- m
id m
ay
II 19
-Mar
6
- gl
ufos
inat
e-am
mon
ium
m
etam
itron
35
00
(ph.
+d.+
e.) +
met
. + o
il (p
h.+d
.+e.
) + m
et. +
oil
8-10
leav
es
mid
may
II
19-M
ar
7
orga
nic
wee
d-co
ntro
l
8-
10 le
aves
m
id m
ay
III
26
-Mar
3
- gl
ufos
inat
e-am
mon
ium
-
- -
- -
end
may
III
26
-Mar
7
or
gani
c w
eed-
cont
rol
8-10
leav
es
end
may
*(1)
Not
e:
(ph.
+d.+
e.) =
(phe
nmed
ipha
m +
des
med
ipha
m +
eth
ofum
esat
e) O
il Fl
ow: (
52,5
+17,
5+10
5) g
/ha
in A
and
(75+
25+1
50) g
/ha
inB m
et. =
met
amitr
on: 3
50 g
/ha
in A
and
490
g/h
a in
B
oil =
min
eral
oil:
0,3
l/ha

5th E
WR
S W
orks
hop
on P
hysi
cal W
eed
Con
trol
37
Pi
sa, I
taly
, 11-
13 M
arch
200
2
Tab.
2 -
Wee
d nu
mbe
r (in
10
m2ar
ea) b
efor
e m
echa
nica
l wee
ding
(30-
04-2
001)
Thes
isSu
bthe
sis
in
em
erge
nce
afte
r sow
ing
on
the
bed
sow
ing
with
out g
lufo
sina
te-
amm
oniu
m
ECH
CG
AM
ARE
CH
ESS*
PO
LAV
POLC
O
POLL
A SO
LNI
othe
r**
tot.
broa
dlea
ves
PAPR
H
SIN
AR
STEM
E VE
RPE
to
tal
I 1
0 0
6 3
5 3
0 5
22
0 0
0 0
0 I
2 0
0 11
5
35
3 1
12
67
0 0
0 0
0 I
3 0
0 45
48
62
41
6
45
247
0 0
0 0
0
II
1 0
0 3
2 1
2 3
2 13
0
0 0
0 0
II 2
0 2
6 4
8 1
5 3
29
0 0
0 0
0 II
3 4
16
34
22
21
22
8 29
15
2 0
0 0
0 0
II 4
1 9
39
29
56
36
3 47
21
9 39
5
3 7
54
II 5
3 6
8 5
17
9 3
9 57
0
0 0
0 0
II 6
1 0
4 2
1 3
2 1
13
0 0
0 0
0 II
7 2
9 34
25
44
28
3
35
178
1 3
2 1
7
III
3
5 32
23
1
2 5
11
25
99
0 0
0 0
0 III
7
4 14
27
9
15
16
6 32
11
9 1
2 1
1 5
*C
HES
S=C
HEA
L, C
HEV
U, C
HEP
O, C
HEF
I
**ot
her w
eeds
: AN
GAR
, ELI
EU, K
ICSP
, VER
OF

5th E
WR
S W
orks
hop
on P
hysi
cal W
eed
Con
trol
38
Pi
sa, I
taly
, 11-
13 M
arch
200
2
Tab.
3 -
Perc
ent o
f wee
dy d
urin
g 30
Jul
y 20
01
Th
esi
s Su
bthe
sis
ECH
CG
AM
ARE
CH
ESS*
PO
LLA
polig
onac
eae
**
othe
r***
ot
her*
***
tot.
broa
d le
aves
I 1
0.2
0.1
1 1.
2 0.
8 0
0.5
3.6
I 2
0.2
0 21
5
7 0
2 35
I
3 0
0 55
15
25
0
3 98
II
1 0.
2 0.
2 0.
5 1
0.2
0 0.
3 2.
2 II
2 1
12
19
1 3
0 2
37
II 3
2 55
18
7
8 0
3 91
II
4 0
9 38
13
21
16
3
100
II 5
1 18
25
1
5 0
3 52
II
6 0.
1 0
0.2
0.6
0 0
0.2
1 II
7 1.
2 7
21
37
18
3 2
88
III
3 4
59
10
5 2
0 2
78
III
7 2.
7 11
14
26
5
2 1
59
*CH
ESS=
CH
EALl
, CH
EVU
, CH
EPO
, CH
EFI
**
othe
r pol
igon
acea
e: P
OLA
V, P
OLC
O
***o
ther
wee
ds fr
om b
ed s
owin
g: P
APR
H, S
INAR
****
othe
r wee
ds: A
IUC
H, A
NG
AR, E
LIEU
, EU
PSS,
KIC
SP, L
ACSE
, MIA
PE, R
APR
U, S
OLN
I, VE
RO
F
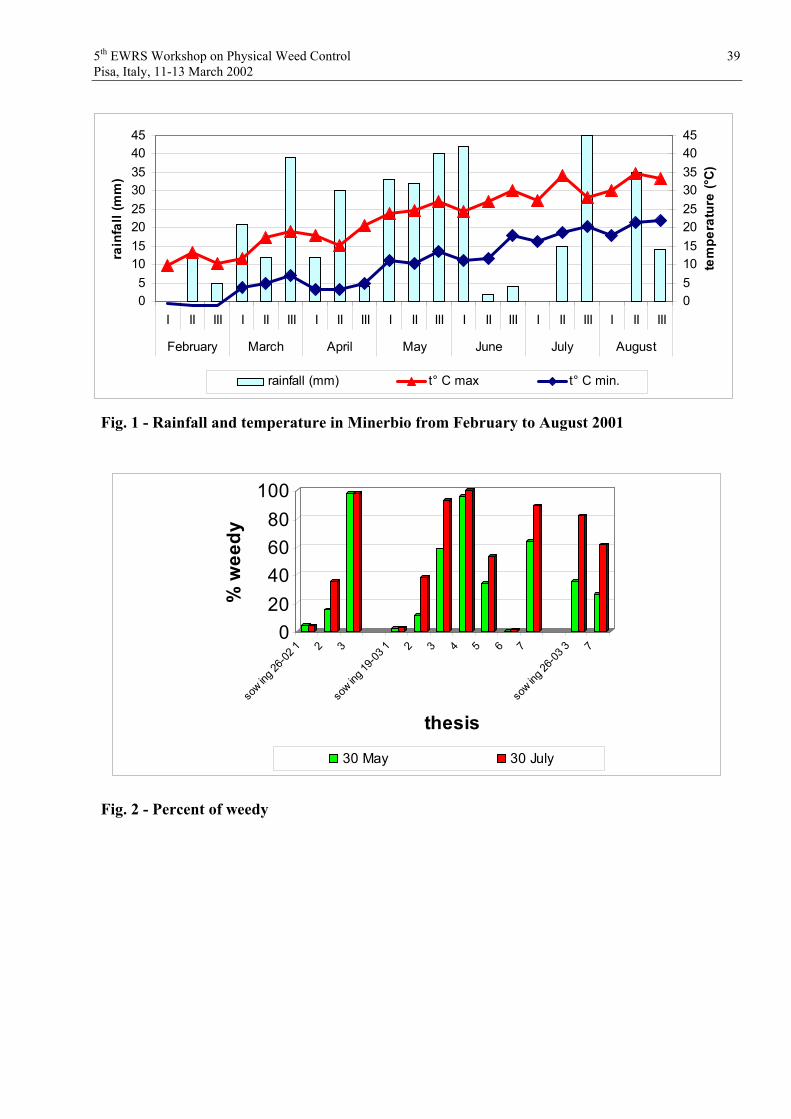
5th EWRS Workshop on Physical Weed Control 39 Pisa, Italy, 11-13 March 2002
Fig. 1 - Rainfall and temperature in Minerbio from February to August 2001
020406080
100
% w
eedy
sow ing
26-02
1 2 3so
w ing 19
-03 1 2 3 4 5 6 7
sow ing
26-03
3 7
thesis
30 May 30 July
Fig. 2 - Percent of weedy
05
1015202530354045
I II III I II III I II III I II III I II III I II III I II III
February March April May June July August
rain
fall
(mm
)
051015202530354045
tem
pera
ture
(°C)
rainfall (mm) t° C max t° C min.

5th EWRS Workshop on Physical Weed Control 40 Pisa, Italy, 11-13 March 2002
0102030405060708090
100
sow ing
26-02
1 2 3
sow ing
19-03
1 2 3 4 5 6 7
sow ing
26-03
3 7
thesis
root
yie
ld (t
/ha)
0102030405060708090100
wee
d dr
y w
eigh
t (in
dex
num
ber)
root yield weed dry weight
Fig. 3 - Root yield and weed dry weight at the sugar beet harvesting
Figure 4. Gastroidea poligoni

5th EWRS Workshop on Physical Weed Control 41 Pisa, Italy, 11-13 March 2002
Influence of fallow land-use intensity on weed dynamics and crop yield in southern Cameroon
M. Ngobo1a, S. Weise2 and M. McDonald1
1School of Agricultural and Forest Sciences, University of Wales, Gwynedd LL57 2UW, Bangor, UK.
2International Institute of Tropical Agriculture – Humid Forest Ecoregional Centre, P.O. Box 2008 (Messa) Yaounde, Cameroon.
aafpaØ[email protected]
Abstract
The influence of weeds community composition and dynamics on groundnuts intercropped with cassava was assessed in three different short fallow management systems, in the Forest Margins Benchmark Area of southern Cameroon (Central Africa). Fallow management intensities, indicated through differing fallow types, consisted of: recurrent Chromolaena odorata-dominated fallows (type I), C. odorata-dominated fallows that had been forest prior to the cropping phase (type II) and bush fallows not dominated by C. odorata that had previously been forest (type III). Weed species diversity, weed density and weed cover percentage were evaluated at six, 14 and 30 weeks after planting, in 30 mixed crop fields. Soil properties were determined at the beginning and at the end of the cropping period. Results showed that C. odorata thickets regulate the weed flora in natural short fallow-food crop farming systems of southern Cameroon. However, C. odorata seemed to have a detrimental effect on food crop productivity in 5-7 years old fallows. Cassava yields even appeared to be greater in recurrent fallow lands dominated by that asteraceous weed species.
Introduction
In the humid forest zone of Cameroon, sectoral and macroeconomic policy reforms that occurred in the late 1980s have led to a land-use intensification process. Long fallows (i.e. fallow lands of more than five-years-old) became less and less feasible in the area. The traditional farming system has been ‘short-circuited’. Herbaceous fallow lands dominated by one species are replacing bush fallows. In particular, bushes of Chromolaena odorata (L.) R. M. King & H. Robinson (Asteraceae) are gradually replacing secondary forest pioneer species. A trial was initiated in the forest zone of southern Cameroon to determine the effect of land use intensification and the invasion of Chromolaena odorata on weed dynamics and crop production in selected fallow classes with different land-use history.
Materials and methods
The experiment was laid out in a randomised complete block design with 10 replicates. Study fields included groundnuts intercropped with cassava and maize. Three fallow classes (of 5-7 years old), corresponding to three levels of land-use intensity, were distinguished:
C. odorata-dominated fallows that had been C. odorata-dominated fallows prior to the cropping phase (fallow type I, indicative of high land-use intensity).
C. odorata-dominated fallows that had been forest prior to the cropping phase (type II, indicative of moderate land-use intensity).
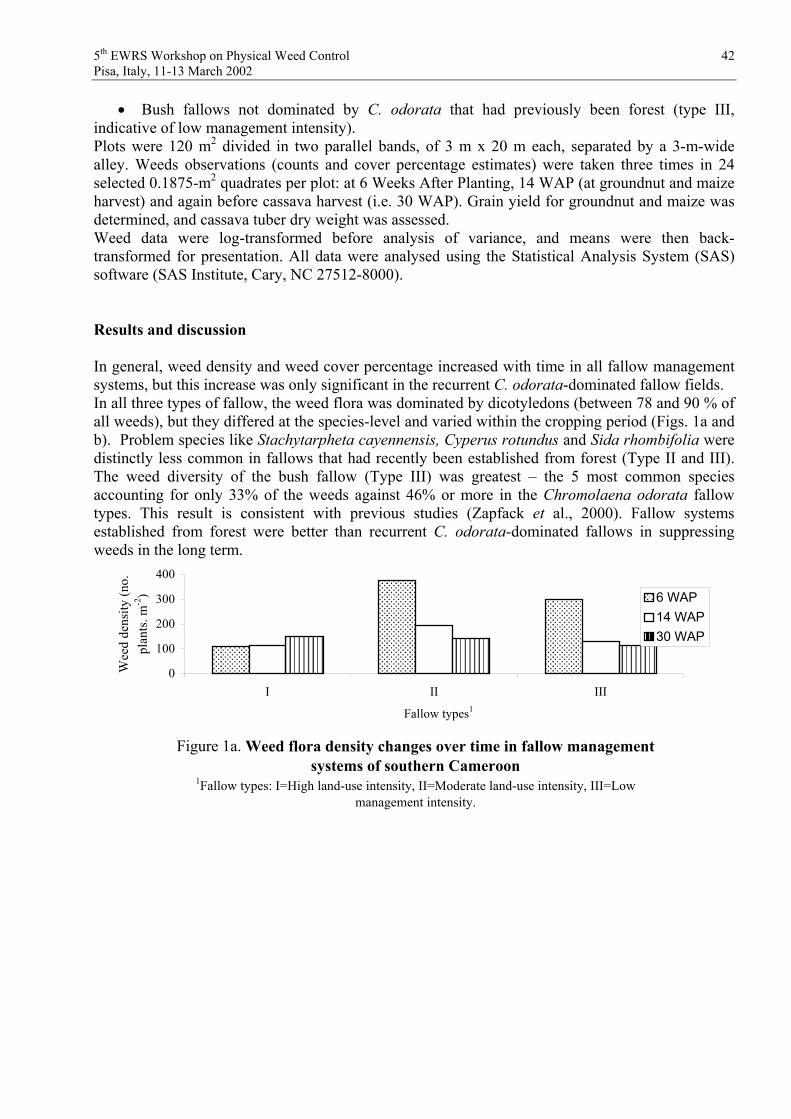
5th EWRS Workshop on Physical Weed Control 42 Pisa, Italy, 11-13 March 2002
Bush fallows not dominated by C. odorata that had previously been forest (type III, indicative of low management intensity). Plots were 120 m2 divided in two parallel bands, of 3 m x 20 m each, separated by a 3-m-wide alley. Weeds observations (counts and cover percentage estimates) were taken three times in 24 selected 0.1875-m2 quadrates per plot: at 6 Weeks After Planting, 14 WAP (at groundnut and maize harvest) and again before cassava harvest (i.e. 30 WAP). Grain yield for groundnut and maize was determined, and cassava tuber dry weight was assessed. Weed data were log-transformed before analysis of variance, and means were then back-transformed for presentation. All data were analysed using the Statistical Analysis System (SAS) software (SAS Institute, Cary, NC 27512-8000).
Results and discussion
In general, weed density and weed cover percentage increased with time in all fallow management systems, but this increase was only significant in the recurrent C. odorata-dominated fallow fields. In all three types of fallow, the weed flora was dominated by dicotyledons (between 78 and 90 % of all weeds), but they differed at the species-level and varied within the cropping period (Figs. 1a and b). Problem species like Stachytarpheta cayennensis, Cyperus rotundus and Sida rhombifolia were distinctly less common in fallows that had recently been established from forest (Type II and III). The weed diversity of the bush fallow (Type III) was greatest – the 5 most common species accounting for only 33% of the weeds against 46% or more in the Chromolaena odorata fallow types. This result is consistent with previous studies (Zapfack et al., 2000). Fallow systems established from forest were better than recurrent C. odorata-dominated fallows in suppressing weeds in the long term.
������������������������������
���������������������������������������������������������������������������������������������������������
��������������������������������������������������������������������������������
���������������������������������������������
���������������������������������������������
��������������������������������
Figure 1a. Weed flora density changes over time in fallow management systems of southern Cameroon
1Fallow types: I=High land-use intensity, II=Moderate land-use intensity, III=Low management intensity.
0
100
200
300
400
I II III
Fallow types1
Wee
d de
nsity
(no.
pl
ants
. m-2
)
�������� 6 WAP
14 WAP����
30 WAP

5th EWRS Workshop on Physical Weed Control 43 Pisa, Italy, 11-13 March 2002
��������������������������������
������������������������������������������������������������������������������������������������������������������������������������������������
����������������������������������������������������������������������������������������������������������������
����������������������������������������������������������������
������������������������������������������������
��������������������������������
Figure 1b. Effect of fallow management on C. odorata density changesover time in southern Cameroon
(1Fallow types: I=High land-use intensity, II=Moderate land-use intensity, III=Low management intensity.)
0
50
100
150
200
250
300
I II IIIFallow types1
C. o
dora
ta d
ensi
ty (n
o.
plan
ts. m
-2) ����
���� 6 WAP14 WAP����30 WAP
The means of groundnut grains and cassava tuber yields for each of the three fallow types are shown in Figs. 2a and 2b. Both yields appeared to be greatest after a C. odorata-dominated fallow, and lowest in the bush fallow fields’ type. The higher yield level observed in C. odorata-dominated fallow systems may be due to an improved soil fertility associated with the presence of C. odorata.Though supported by previous studies (see for example Weise, 1996; Muniappan, 1994), this conclusion, in the case of the study area, still need to be confirmed by further investigations of soil data collected during this experiment.
������������������������������������ ������������������� �������������������
��������������������������������������������������������������������������������������������������������������������������������������������������������������������������������������������������������������������������������������������������������������������������
������������������������������������������������������������������������������������������������������������������������������������������������������������������������������������������������������������������������
������������������������������������������������������������������������������������������
Figure 2. Effect of fallow management on crops yield in southern cameroon
(1Fallow types: I=High land-use intensity, II=Moderate land-use intensity, III=Low management intensity)
0.00
0.50
1.00
1.50
2.00
2.50
3.00
3.50
Ftype I Ftype II Ftype IIIFallow types1
Dry
wei
ght (
t.ha-1
)
�������� Groundnut grains ����
Cassava tuber

5th EWRS Workshop on Physical Weed Control 44 Pisa, Italy, 11-13 March 2002
Conclusion
In summary, as pressure on land increases, longer fallows become scarce. Although the weed density does not appear to increase with shorter fallows, more problematic species start to become more abundant. Grasses do not yet play a dominant role in the weed flora.
Acknowledgements
The USAID-Central African Regional Programme for Environment (CARPE) funded this research.
References
MUNIAPPAN, R. (1994). Chromolaena odorata (L.) R. M. King & Robinson in Weed management for developing countries. Labrada, R., Caseley, J. C. and Parker, C. (eds). FAO Plant Production and Protection Paper 120.
WEISE, S. F. (1993). Distribution and significance of Chromolaena odorata (L.) R. King & H. Robinson across ecological zones in Cameroon in Proceedings of the Third International Workshop on Biological Control and Management of Chromolaena odorata. Pp. 29-38.
ZAPFACK, L., WEISE, S. F., NGOBO, M., TCHAMOU, N. AND GILLISON, A. (2000). Biodiversité et produits forestiers non ligneux de trois types de jachères du Cameroun méridional in Floret, Ch. & Pontanier, R. (eds). La Jachère en Afrique Tropicale: Rôles, Aménagement, Alternatives. Vol I. Actes du Séminaire International, Dakar, 13-16 Avril 1999. Pp. 484-492.

5th EWRS Workshop on Physical Weed Control 45 Pisa, Italy, 11-13 March 2002
Effects of crop density, spatial uniformity and weed species on competition with spring wheat Triticum aestivum.
Jannie Maj Olsen, Lars Kristensen, Hans-Werner Griepentrog and Jacob Weiner The Royal Veterinary and Agricultural University, Department of Ecology,
Botanical Section, Rolighedsvej 21, DK 1958 Frederiksberg, Denmark E-mail: [email protected]
Abstract
The goal of reducing the use of herbicides in agriculture has increased interest in alternative methods in weed management. One approach is to increase the ability of the crop to itself suppress weeds by altering the crop density and spatial distribution. We hypothesize that (1) increasing the crop density and (2) sowing the crop in a grid pattern instead of traditional rows can substantially increase weed suppression. In a high density, uniformly-distributed crop population, crop plants start competing with weed plants before they start competing with other crop plants, and the competition between crop and weed begins before the crop loses its initial size advantage.
A field experiment was conducted to determine the effect of three densities (204, 449 and 721 plants m-2) and two spatial patterns (normal rows and a uniform grid pattern) of spring wheat (Triticum aestivum L. cv. Leguan) on interspecific competition with six weed species with various forms of growth (Sinapis alba, Lolium multiflorum cv. Liquattro, Papaver rhoeas, Chenopodiumalbum, Matricaria perforata and Stellaria media). The different weed species were sown in high densities to obtain high weed pressures. The biomass of the target weed species and other weeds was measured in early July.
There were strong and highly significant effects of both crop density and spatial distribution on weed biomass in all cases. The biomass of the target weed and target weed plus naturally-occurring weeds decreased with increasing crop density.
Overall, the total weed biomass was 30 % lower when the crop was sown in a uniform grid pattern than crop sown in traditional rows.
The total weed biomass was reduced by 60 % for S. alba, 66 % for L. multiflorum, 42 % for P. rhoeas, 85 % for C. album, 22 % for M. perforata and 78 % for S. media when the crop was sown in the uniform pattern and the high density in comparison to rows at 449 m-2, which is close to normal practice.

5th EWRS Workshop on Physical Weed Control 46 Pisa, Italy, 11-13 March 2002
Preventive weed control in lower input farming system
V. Pilipavicius Lithuanian University of Agriculture
Studentu g. 11, Akademija-Kaunas district, E-mail.: [email protected]
Abstract
Weed seed rain in the crop of spring barley begins when spring barley are in steam elongation stage and increases to the hard stage of maturity. The general number of all poured weed seed species covers from 5.8% to 22.7% - till the medium milk stage of maturity, 26.6% - 41.8% - till late milk-early-dough stage, 48.4% - 90.6% - till dough stage from the number of all weed seeds poured on the soil. Harvesting spring barley in medium milk or late milk-early dough stages of maturity, unpoured weed seeds would be taken out of the field together with yield. Therefore, harvesting spring barley in these stages, the amount of weed seeds getting into the soil and potential weedness of the future crop decreased.
Key words: weed seeds, weed seed rain, stages of spring barley maturity, lower input farming system
Introduction
Growing together with agricultural plants weeds adapted to their growth and biological cycle of development. The spreading of weed seeds in the fields is increasing by present processing technology of cereal when late weeds have already been poured their seeds.
Herbicides are used that soil would not be polluted by new weed seeds. Although herbicides cannot destroy all weeds, they damage them, and weeds ripen fewer amounts of seeds. However, weeds ripen seeds in the crops that are sprinkled with herbicides and pollute soil, straws and awns by them (Ciuberkis, 1995a, 1995b).
In recent years ecological and economic factors arouse a need and a necessity to decrease the use of herbicides or even to refuse of them (Wacker, 1989). That is possible only using alternative means of weedness control. It is necessary to pay attention that plants’ spreading by seeds is characteristic not only for annual but also for perrenial weeds, as Cirsium arvense, too (Zwerger, 1996).
The quality of weedness control in today’s agriculture depends on ability to eliminate seeds, which are still in the soil, and to limit the amount of new ones.
Materials and Methods
The place of the researches and the scheme of the trial Preventive weed control trial in lower input farming system was carried out in 1997, 1998 and 1999 at the Research station of Lithuanian University of Agriculture. The field trial was arranged and carried out according to the scheme, which was made on the basis of spring barley stages of maturity by Zadoks et al. (1974).

5th EWRS Workshop on Physical Weed Control 47 Pisa, Italy, 11-13 March 2002
The scheme. Spring barley are harvested in the stages of maturity: 1. Hard 92*, 91-92, 92 5. Early milk 71-73, 69-71, 69-71 2. Dough 87, 85, 87 6. Heading 57-59, 55, 57-59 3. Late milk-early dough 77-83, 77-83, 77-83 7. Steam elongation 39-41, 37-39, 31 4. Medium milk 75, 73-75, 73 Note. * - Decimal code for the growth stages of cereal in 1997, 1998 and 1999
Agrotechnics of spring barley cultivationPreceding crop for spring barley was winter wheat Triticum aestivum (1997), spring barley Hordeum vulgare (1998) and culturamaranth Amaranthus spp. (1999). In every year of the trial double –rowed barley “Roland” were grown. Herbicides were not used in the field, as in lower input farming system, for evaluation of alternative ways of weedness control. Soil tillage in every year of the trial was the same. Agrochemical characterisation of arable soil The soil allocated for the trial is sod-gleyic light loam clay. The agrochemical characteristics of arable soil where spring barley were grown did not vary a lot. In 1997, 1998 and 1999 arable layer of soil was: pHKCl 7.08-7.25, humus 2.22-2.45%, active P2O5 – 245.0-251.3 mg kg-1 and active K2O– 93.6-110.5 mg kg-1.Establishment of weedness Weed samples were taken at the early milk stage for general weedness establishment. There were taken for 10 samples from every field using wire frame of 20x30cm. Air-dried weeds were divided into species, calculated and weighed. Establishment of weed seed rain Dynamics of weed seed rain in spring barley crop was established according to Rabotnov’s (1960) methodics taking into account the crop weed seed rain trials of Stancevicius & Girkute (1972), Moss (1983) and Leguizamon & Roberts (1982). 50 troughs were laid out in each of four replications, in chess-order, in tens. The size of one trough was 20x2x0.5 cm. The general view of troughs is presented in Fig. 1. Weed seeds from the troughs were collected every 2, 3 or 4 days. The collected seeds were divided into species and calculated.
Figure 1. Troughs for collecting weed seeds in spring barley crop.

5th EWRS Workshop on Physical Weed Control 48 Pisa, Italy, 11-13 March 2002
Results
Weedness of spring barley crop Chenopodium album, Stellaria media, Sonchus asper prevailed of annual weeds and Sonchus arvensis from perenial ones, in spring barley crop over the period of 1997-1999. As predominated weed species, at the first year of the trial (1997), additionally were excluded Sinapis arvensis,Tripleurospermum inodorum and Erysimum cheiranthoides. The trial in 1997 was arranged in a very weedy field. There were 395.3 weeds m-2 and 255.4 g m-2 of air-dried weed biomass. In 1998 the amount of weeds was more than three times less and biomass was 2.6 times less than in 1997 and reached 122.5 weeds m-2 and 97.8 g m-2 of air-dried weed biomass. In 1999 the number of weeds was 135.0 weeds m-2 analogically as in 1998 but their air-dried biomass was more than 6 times less and covered only 18.9 g m-2 (Tab. 1.). Evaluating weedness of the crop, weeds dependence to biological groups was established: in 1997 annual weeds covered 98.2% and perennial - only 1.8%; in 1998 – 84.0% and 15.6% and in 1999 – 89.2% and 10.8% accordingly. Comparing biomass of weeds, a fewer gap between annual and a perennial weed was established. It was 97.7% and 2.3% in 1997, 70.2% and 29.8% in 1998 and 67.6% and 32.4% in 1999 accordingly. During all three years of trial annual weeds predominated which mainly spread by seeds (Tab. 1.). Weed seed rain in the crop of spring barley
Collected weed seeds during three years of trial belonged to 29 weed species from 12 families, presented in table 2. In the crop of spring barley in growth stage of steam elongation (usually it was in the second ten-day period of June), according to the data of the trial weeds of short vegetation period Stellaria media, Poa annua and early summer weeds Chenopodium albumripened and began to pour their seeds. Winter weeds as Capsella bursa-pastoris ripened and poured seeds in heading growth stage of spring barley, usually it was in the third ten-day period of June. Spring barley changing into milk stage of maturity (usually in the second ten-day period in July) Lamium purpureum, Apera spica-venti, Atriplex patula, Veronica arvensis, Sonchus asperand Myosotis arvensis ripened and began to pour seeds. But the beginning of ripeness and pouring of some weed species lasts more than presented growth stages of spring barley; Chenopodiumalbum seeds in 1997 began to pour in steam elongation stage, in 1999 – in heading and in 1998 – in medium milk stage of spring barley maturity. It depended on climate conditions and weedness of crop in each year. If the crop was weedier, seeds poured more intensively and it was easier to establish the beginning of weed seed rain. In 1997 in early milk stage of maturity 17.4%, in 1998 – 20.0%, in 1999 – 40.0% of weeds ripened seeds in the crop began to pour their seeds. In medium milk stage of spring barley (usually at the end of the second, till the beginning of the third, ten-day period in July) Thlaspi arvensis, Raphanus raphanistrum, Spergula arvensis, Galium aparine,Fallopia convolvulus and Polygonum laphatifolium ripened and began to pour seeds. Spring barley changing from milk into dough stage of maturity (usually at the end of the third ten-day period in July), Sinapis arvensis, Sonchus arvensis, Erysimum cheiranthoides and Cirsium arvense ripened and began to pour seeds. In spring barley late milk-early dough stage of maturity weeds ripened seeds: in 1997 - 74%, in 1998 – 90% and in 1999 – 80% of growing and ripening seeds weed species in the crop. In dough stage of maturity of spring barley, Avena fatua, Crepis tectorum,Anthemis arvensis and Anthemis tinctoria ripened and began to pour seeds. At that time all species of weeds, which poured seeds, were ripened except for in 1998 when Crepis tectorum seeds began to pour only when spring barley reached hard stage of maturity. The data of the trial showed thatCrepis tectorum, Cirsium arvense and Sonchus arvensis ripened seeds the most late and began to pour them (Tab. 2.).

5th EWRS Workshop on Physical Weed Control 49 Pisa, Italy, 11-13 March 2002
Table 1. Composition, number and air-dried biomass of weed species in spring barley crop, 1997- 1999
Number and air-dried biomass of weeds 1997 1998 1999
Weed species
weeds m-2 g m-2 weeds m-2 g m-2 weeds m-2 g m-2
1 2 3 4 5 6 7 Stellaria media (L.) Vill. 37.92 17.13 7.08 3.79 9.17 2.73 Poa annua L. 7.5 0.50 0 0 5.0 0.10
Annual ephemeral 45.42 17.63 7.08 3.79 14.17 2.83 Chenopodium album L. 29.48 131.25 70.0 53.96 66.25 5.67 Sinapis arvensis L. 147.92 69.23 1.67 1.05 0 0.0 Galeopsis tetrahit L. 0 0.0 1.67 0.29 0 0.0 Spergula arvensis L. 0 0.0 0.42 0.25 0 0.0 Galium aparine L. 2.50 0.30 2.08 1.08 0 0.0 Polygonum aviculare L. 0.42 0.07 0 0.0 0 0.0 Erysimum cheiranthoides L. 62.08 6.39 1.67 0.19 1.25 0.08 Galinsoga parviflora Cav. 0 0.0 0.83 0.17 0 0.0 Raphanus raphanistrum L. 0.42 0.17 0 0.0 0 0.0 Polygonum laphatifolium L. 8.33 0.91 3.75 0.56 0.42 0.01 Fallopia convolvulus (L.) A. Löve 2.08 0.14 5.42 1.45 0 0.0 Euphorbia helioscopia L. 3.75 0.18 0.83 0.20 0.83 0.05 Veronica arvensis L. 2.5 0.08 0 0.0 4.17 0.09 Amaranthus spp. L. 0 0.0 0 0.0 10.83 0.14 Chaenorrhinum minus (L.) Lange 0.42 0.01 1.25 0.04 2.50 1.57 Crepis tectorum L. 3.33 0.88 0 0.0 0 0.0 Sonchus asper (L.) Hill. 16.36 8.98 3.33 5.21 0.87 0.44
Summer annual 279.59 218.59 92.92 64.45 87.12 8.05 Medicago lupulina L. 1.25 0.18 0 0.0 0 0.0 Tripleurospermum inodorum (L.) Sch. Bip. 34.17 10.92 0 0.0 2.92 0.22 Thlaspi arvense L. 4.58 0.49 0 0.0 0.42 0.08 Viola arvensis Murray 3.33 0.18 0.42 0.04 1.67 0.05 Myosotis arvensis (L.) Hill. 1.67 0.13 0 0.0 0 0.0 Lamium purpureum L. 1.25 0.05 0 0.0 0.83 0.18 Capsella bursa-pastoris (L.) Medik. 17.08 1.37 2.50 0.44 13.33 1.40
Winter annual 63.33 13.32 2.92 0.48 19.17 1.93 Annual 388.34 249.54 102.92 68.72 120.46 12.81
Plantago major L. 2.5 0.13 0.42 0.81 2.92 0.06 Trifolium pratense L. 1.25 0.02 0 0.0 0 0.0
Perennial, spreading by seeds 3.75 0.15 0.42 0.81 2.92 0.06 Tussilago farfara L. 0 0.0 1.25 0.12 0.0 0.0 Elytrigia repens (L.) Nevski 0 0.0 0 0.0 2.5 2.3 Stellaria graminea L. 0 0.0 0 0.0 0.42 0.01 Sonchus arvensis L. 0.31 0.17 15.84 24.77 6.21 3.14 Cirsium arvensis (L.) Scop. 2.92 5.58 2.08 3.43 0.83 0.25 Mentha arvensis L. 0 0.0 0 0.0 1.67 0.28
Perennial, spreading vegetatively 3.23 5.75 19.17 28.32 11.63 6.07 Perennial 6.98 5.90 19.59 29.13 14.55 6.13 All weeds 395.32 255.44 122.51 97.85 135.01 18.94

5th EWRS Workshop on Physical Weed Control 50 Pisa, Italy, 11-13 March 2002
Table 2. Weed species pouring seeds in the crop of spring barley, 1997-1999
Families Species The beginning of weed seed rain 1997 1998 1999
Boraginaceae Juss. Myosotis arvensis (L.) Hill. M.m. N. M.e. Atriplex patula L. M.m. M.m. M.e. Chenopodiaceae Less.
Chenopodium album L. S.e. M.e. He. Capsella bursa-pastoris L. M.m. M.m. He.
Raphanus raphanistrum L. M.m. M.l.-D.e. N. Sinapis arvensis L. M.l.-D.e. M.l.-D.e. M.l.-D.e. Thlaspi arvense L. M.m. N. M.m.
Cruciferae B. Juss.
Erysimum cheiranthoides L. M.l.-D.e. D. N. Cirsium arvense (L.) Scop. D. M.l.-D.e. D.
Tripleurospermum inodora (L.) Sch. D. N. D.
Sonchus arvensis L. D. M.l.-D.e. D. Sonchus asper (L.) Hill. M.l.-D.e. M.m. M.e.
Crepis tectorum L. D. H. N. Anthemis arvensis L. D. N. N.
Compositae Giseke
Anthemis tinctoria L. D. N. N. Stellaria media (L.) Vill. S.e. M.e. He. Caryophyllaceae Juss.
Spergula arvensis L. N. M.l.-D.e. N. Euphorbiaceae J. St. Hill.
Euphorbia helioscopia L. N. N. M.m. Labiatae Juss. Lamium purpureum L. M.e. M.m. N.
Poaceae Barnhart Apera spica-venti L. N. M.e. N. Avena fatua L. N. M.m. N. Poa annua L. S.e. N. N.
Fallopia convolvulus L. D. M.m. M.m. Polygonum lapathifolium L. M.m. M.l.-D.e. M.m.
Polygonum aviculare L. M.m. N. N.
Polygonaceae Lindl.
Rumex crispus L. D. N. N. Rubiaceae Juss. Galium aparine L. M.l.-D.e. M.l.-D.e. N.
Scrophulariaceae Juss. Veronica arvensis L. M.m. M.e. M.m. Violaceae Juss. Viola arvensis Murr. N. M.l.-D.e. N.
Note. Growth stages of spring barley: S.e. – steam elongation, He. – heading, M.e. – early milk, M.m. – medium milk, M.l.-D.e. – late milk-early dough, D. – dough, H. – hard, N. – weed seed rain was not established.
When spring barley was ripening, weed seed rain was more intensive. During the first ten days from the beginning of weed seed rain in 1997 – 0.2% of seeds poured in the field, in 1998 – 0.3%, in 1999 – 7.2% accordingly; and at the end of spring barley vegetation in 1997 – 27.9%, in 1998 – 62.7% and in 1999 – 44.5% of all amount of poured seeds (Fig. 2.).

5th EWRS Workshop on Physical Weed Control 51 Pisa, Italy, 11-13 March 2002
0
50
100
150
200
250
300
350
`06,12
`06,15
`06,18
`06,21
`06,24
`06,27
`06,30
`07,03
`07,06
`07,09
`07,12
`07,15
`07,18
`07,21
`07,24
`07,27
`07,30
`08,02
`08,05
`08,08
`08,11
`08,14
`08,17
date
weed seeds m-2
1997 1998 1999
Figure 2. Dynamics of weed seed rain in spring barley crop, seeds m-2 every twenty-four hours, 1997-1999
The amount of all poured weed seeds was different. In 1997 the biggest amount of seeds was found of Stellaria media (1260 seeds), Sonchus asper (1173 seeds), Sinapis arvensis L. (496 seeds), Capsella bursa-pastoris L. (457 seeds) and Chenopodium album (289 seeds). It made 81% of all poured weed seeds in 1997. In 1998 seeds of Chenopodium album, Stellaria media and Sonchus arvensis predominated. 1484, 802 and 133 seeds poured accordingly and they made 88% of all poured weed seeds. In 1999 the biggest amount of Chenopodium album (519 seeds), Stellaria media (157 seeds) and Capsella bursa-pastoris (52 seeds) seeds was found; they made 89% of all poured weed seeds (Tab. 3.). In 1997 the general amount of all poured weed seeds made only 4.6% when spring barley were changing into milk stage of maturity. 16.8% of seeds poured till medium milk stage of maturity, 28.4% - till late milk-early dough stage and 85.2% - till dough stage of maturity. In 1998 the general amount of all poured weed seeds made 1.7%, 5.8%, 26.6% and 48.4% and in 1999 – 7.3%, 22.7%, 41.8% and 90.6% accordingly.
Analogical data were got analysing weed seed rain of separate species. About 70% of weed species which pour seeds till medium milk stage of spring barley maturity poured less than 20% of all their seeds pouring during vegetation, till late milk-early dough stage of maturity - about 65% of weeds species poured till 40% of their seeds and till dough stage – only 5% of weeds species poured less than 40% and even 37% of weed species poured more than 80% of all their seeds poured till hard stage of spring barley maturity.
Harvesting spring barley in milk or late milk-early dough stage of spring barley maturity, unpoured weed seeds are taken from the field together with yield. So, it helps to decrease the amount of weed seeds and potential weedness of the crop.
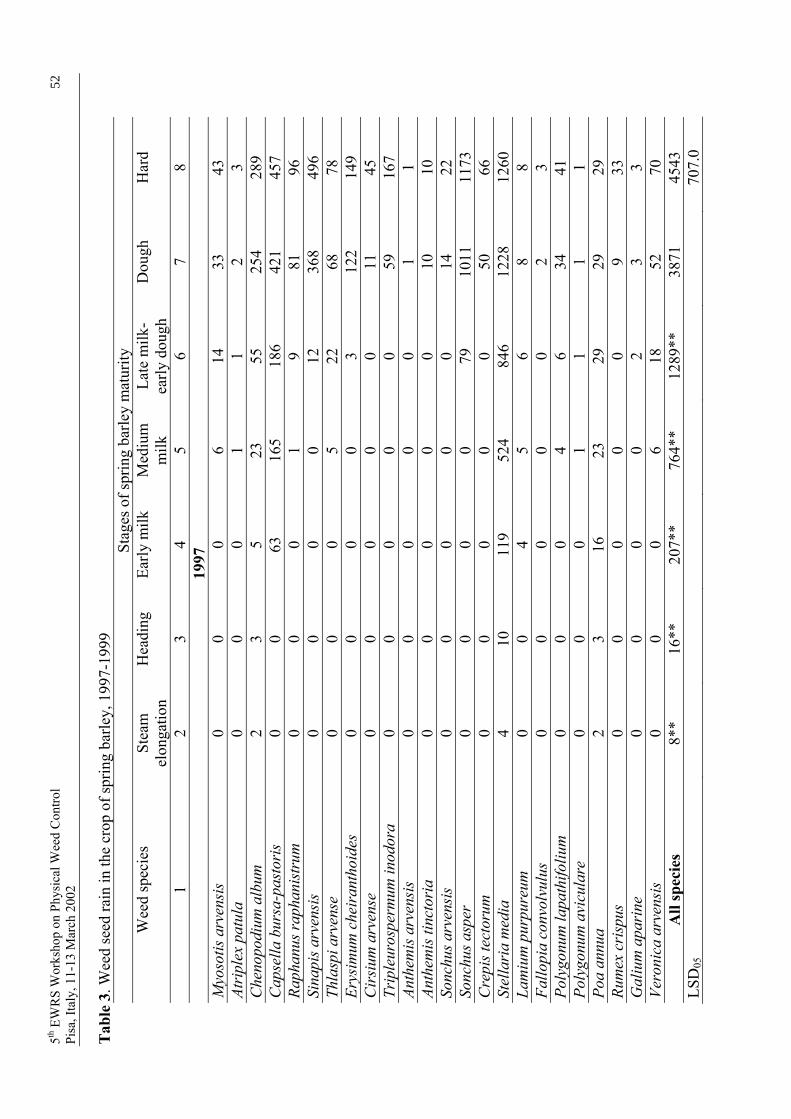
5thEW
RS
Wor
ksho
pon
Phys
ical
Wee
dC
ontro
l52
Pisa
, Ita
ly, 1
1-13
Mar
ch 2
002
Tab
le 3
. Wee
d se
ed ra
in in
the
crop
of s
prin
g ba
rley,
199
7-19
99
St
ages
of s
prin
g ba
rley
mat
urity
W
eed
spec
ies
Stea
m
elon
gatio
nH
eadi
ng
Early
milk
M
ediu
m
milk
La
te m
ilk-
early
dou
gh
Dou
gh
Har
d
1 2
3 4
5 6
7 8
1997
Myo
sotis
arv
ensi
s0
0 0
6 14
33
43
At
ripl
ex p
atul
a0
0 0
1 1
2 3
Che
nopo
dium
alb
um2
3 5
23
55
254
289
Cap
sella
bur
sa-p
asto
ris
0 0
63
165
186
421
457
Raph
anus
raph
anis
trum
0 0
0 1
9 81
96
Si
napi
s arv
ensi
s 0
0 0
0 12
36
8 49
6 Th
lasp
i arv
ense
0 0
0 5
22
68
78
Erys
imum
che
iran
thoi
des
0 0
0 0
3 12
2 14
9 C
irsi
um a
rven
se
0 0
0 0
0 11
45
Tr
iple
uros
perm
um in
odor
a0
0 0
0 0
59
167
Anth
emis
arv
ensi
s0
0 0
0 0
1 1
Anth
emis
tinc
tori
a0
0 0
0 0
10
10
Sonc
hus a
rven
sis
0 0
0 0
0 14
22
So
nchu
s asp
er0
0 0
0 79
10
11
1173
C
repi
s tec
toru
m0
0 0
0 0
50
66
Stel
lari
a m
edia
4
10
119
524
846
1228
12
60
Lam
ium
pur
pure
um0
0 4
5 6
8 8
Fallo
pia
conv
olvu
lus
0 0
0 0
0 2
3 Po
lygo
num
lapa
thifo
lium
0 0
0 4
6 34
41
Po
lygo
num
avi
cula
re
0 0
0 1
1 1
1 Po
a an
nua
2 3
16
23
29
29
29
Rum
ex c
risp
us0
0 0
0 0
9 33
G
aliu
m a
pari
ne0
0 0
0 2
3 3
Vero
nica
arv
ensi
s 0
0 0
6 18
52
70
A
ll sp
ecie
s 8*
* 16
**
207*
* 76
4**
1289
**
3871
45
43
LSD
05
707.
0

5thEW
RS
Wor
ksho
pon
Phys
ical
Wee
dC
ontro
l53
Pisa
, Ita
ly, 1
1-13
Mar
ch 2
002
LSD
01
968.
4 T
able
3. (
Con
tinue
d)
1 2
3 4
5 6
7 8
1998
Atri
plex
pat
ula
0 0
0 6
6 6
8 C
heno
podi
um a
lbum
0 0
12
36
265
526
1484
Av
ena
fatu
a 0
0 0
1 1
1 6
Cap
sella
bur
sa-p
asto
ris
0 0
8 30
53
65
85
Ap
era
spic
a-ve
nti
0 0
5 5
5 5
5 Ra
phan
us ra
phan
istr
um0
0 0
0 3
5 6
Sina
pis a
rven
sis
0 0
0 0
1 3
13
Erys
imum
che
iran
thoi
des
0 0
0 0
0 29
93
C
irsi
um a
rven
se
0 0
0 0
1 2
2 So
nchu
s arv
ensi
s0
0 0
0 1
31
133
Sonc
hus a
sper
0 0
0 4
7 18
28
C
repi
s tec
toru
m0
0 0
0 0
0 1
Stel
lari
a m
edia
0
0 21
73
36
3 59
2 80
2 Sp
ergu
la a
rven
sis
0 0
0 0
3 3
3 La
miu
m p
urpu
reum
0 0
0 1
1 1
1 Fa
llopi
a co
nvol
vulu
s0
0 0
4 13
22
32
Po
lygo
num
lapa
thifo
lium
0 0
0 0
2 6
30
Gal
ium
apa
rine
0 0
0 0
5 13
18
Ve
roni
ca a
rven
sis
0 0
1 1
1 2
2 Vi
ola
arve
nsis
0 0
0 0
0 1
1 A
ll sp
ecie
s 0*
* 0*
* 47
**
161*
* 73
1**
1331
**
2753
LS
D05
41
7.7
LSD
01
572.
1

5thEW
RS
Wor
ksho
pon
Phys
ical
Wee
dC
ontro
l54
Pisa
, Ita
ly, 1
1-13
Mar
ch 2
002
Tab
le 3
(Con
tinue
d)
1 2
3 4
5 6
7 8
1999
Myo
sotis
arv
ensi
s0
0 1
2 2
2 2
Atri
plex
pat
ula
0 0
2 2
6 16
19
C
heno
podi
um a
lbum
0 2
12
45
122
459
519
Cap
sella
bur
sa-p
asto
ris
0 10
29
44
45
51
52
Si
napi
s arv
ensi
s 0
0 0
0 1
1 1
Thla
spi a
rven
se0
0 0
4 4
4 4
Cir
sium
arv
ense
0
0 0
0 0
9 11
Tr
iple
uros
perm
um in
odor
a0
0 0
0 0
4 5
Sonc
hus a
rven
sis
0 0
0 0
0 9
18
Sonc
hus a
sper
0 0
3 3
3 3
3 St
ella
ria
med
ia
0 0
12
74
141
158
158
Euph
orbi
a he
liosc
opia
0
0 0
1 1
1 1
Fallo
pia
conv
olvu
lus
0 0
0 1
2 5
6 Po
lygo
num
lapa
thifo
lium
0 0
0 1
5 8
8 Ve
roni
ca a
rven
sis
0 0
0 9
10
15
15
All
spec
ies
0**
12**
60
**
186*
* 34
3**
744*
82
1 LS
D05
71
.5
LSD
01
97.9
Not
e. L
SD05
and
LSD
01 c
alcu
late
d es
sent
ial d
iffer
ence
s onl
y fo
r see
d su
m o
f all
wee
d sp
ecie
s.

5th EWRS Workshop on Physical Weed Control 55Pisa, Italy, 11-13 March 2002
Discussion
The data of the field trial proved that weeds ripened regularly. It was established that to 4543 seeds m-2 poured till harvesting of spring barley. Different number of weed seeds depended on crop density, agrotechnics, meteorological conditions and the characteristic of soil (Petraitis et al., 1993). Weed seed rain in spring barley crop began in steam elongation stage and gradually increased till hard stage of maturity. From 6% to 23% of all poured weed seeds poured till medium milk stage and from 27% to 42% - till late milk-early dough stage of maturity. Weed seeds which were left in the crop were taken from the field together with the biomass of spring barley and did not pollute the soil: 77% - 94% till medium milk stage and 58% - 73% - till late milk-early dough stage of maturity. Moreover, most of all poured weed seeds, which were in silage (Grigas 1980, 1981; Grigas & Smulkiene, 1989a; Blackshaw & Rode, 1991), in manure (Grigas 1980, 1981; Sarapatka et al., 1993), in sewage (Grigas & Smulkiene, 1989b) and in compost (Tereshchuk, 1995), or going through alimentary canal of cattles’ (Grigas, 1987; Blackshaw & Rode, 1991), lost their germinating power and did not pollute the crop. The presented way of spring barley management fully satisfy the criteria of ecological farms and are perspective in lower input farming system.
Acknowledgements
We thank Mrs. Vilma Pilipaviciene for article translation from Lithuanian into English.
References
1. BLACKSHAW RE & RODE LM (1991) Effect of ensiling and rumen digestion by cattle on weed seed viability. Weed Science 39, 104-108.
2. CIUBERKIS S (1995a) Piktzoliu ir ju seklu plitimas sejomainos laukuose. LZI mokslo darbai Augalu apsauga 45, 3-10.
3. CIUBERKIS S (1995b) The spreading of weed seeds in the fields of crop rotation. In: Proceedings 9th EWRS Symposium – Challenges for Weed Science in a Changing Europe, Budapest, Hungary, 161-165.
4. GRIGAS A (1980) Daugiameciu zoliu sekliniu paseliu ir seklu piktzoletumas bei piktzoliu seklu gyvybingumo issilaikymas. LZMTI mokslo darbai 25, 105-117.
5. GRIGAS A (1981) Issledovanie sochranenija ziznessposobnosti semian sornych rastenii. In: Proceedings Zashchita rastenii v respublikach pribaltiki i Belorusii, Chiast I. LNIIZ, Dotnuva-Akademija, Lithuania, 113-114.
6. GRIGAS A (1987) Seklu, perejusiu galviju virskinamaji trakta, gyvybingumas. LZMTI mokslo darbai Agronomija 35, 165-175.
7. GRIGAS A & SMULKIENE B (1989a) Piktzoliu seklu gyvybingumas, skirtinga laika joms isbuvus silose. LZMTI moksliniu straipsniu rinkinys Agronomija 63, 93-101.
8. GRIGAS A & SMULKIENE B (1989b) Piktzoliu seklu gyvybingumas, skirtinga laika joms isbuvus skystame mesle. LZMTI moksliniu straipsniu rinkinys Agronomija 63, 83-92.
9. LEGUIZAMON ES & ROBERTS HA (1982) Seed production by an arable weed community. WeedResearch 22, 35-39.
10. MOSS SR (1983) The production and shedding of Alopecurus myosuroides Huds. seeds in winter cereals crops. Weed Research 23, 45-51.
11. PETRAITIS V, SMULKIENE B & RACYS J (1993) Zieminiu kvieciu ir mieziu pjuties laiko itaka piktzoliu seklu issibarstymui ir grudu nuostoliams. LZI moksliniu straipsniu rinkinys Agronomija 72, 49-62.
5th EWRS Workshop on Physical Weed Control 56Pisa, Italy, 11-13 March 2002
12. RABOTNOV AT (1960) Metody izucenija semennovo razmnozenia travianistych rastenii v soobshchestvach. Polevaja geobotanika, 20-39.
13. SARAPATKA B, HOLUB M & LHOTSKA M (1993) The effect of farmyard manure anaerobic treatment on weed seed viability. Biological Agriculture and Horticulture 10, 1-8.
14. STANCEVICIUS A & GIRKUTE A (1972) Piktzoliu seklu byrejimo dinamika javu paseliuose. LZUA mokslo darbai Zemes ukio intensyvinimas 28, 25 - 34.
15. TERESHCHUK V (1995) Sources of weed infestation of agricultural land and the problems of weed control. In: Proceedings 9th EWRS Symposium – Challenges for Weed Science in a Changing Europe, Budapest, Hungary, 135-141.
16. WACKER P (1989) Bekampfung von Unkrautern bei der Getreideernte. Landtechnik 6, 215-219. 17. ZADOKS JC, CHANG TT & KONZAK CF (1974) A decimal code for the growth stages of cereals.
Weed Research 14, 415 – 421. 18. ZWERGER P (1996) Zur Samenproduktion der Acker-Kratzdistel (Cirsium arvense (L.) Scop.).
Zeitschrift für Pflanzenkrankheiten und Pflanzenschutz Sonderheft XV, 91–98.

5th EWRS Workshop on Physical Weed Control 57 Pisa, Italy, 11-13 March 2002
The effects of cultural practices on crop and weed growth in organic spring oats
B. R. Taylor and D. Younie SAC, Craibstone Estate, Bucksburn, Aberdeen AB21 9YA, UK
Abstract
Trials in 1993 and 1994 on organic farms near Aberdeen and Elgin, UK, evaluated a range of methods for controlling weeds in spring oats (Avena sativa). These included cultivars of different heights, seed rates, row spacings, undersowing with a grass/clover mixture and mechanical tined weeding. Crop and weed biomass were measured during the growing season, important weed species identified and grain yield assessed. Cereal varieties, despite being chosen for their different heights and competitive abilities, had no significant effect on weed biomass during the growing season. Weed biomass was reduced where the crop was sown at high seed rates and at narrrow row spacings. Mechanical weeding resulted in a reduction in weed biomass. The amount of crop present at a given time appeared to have the most influence on weed biomass at Elgin , whereas plant distribution had greater influence at Aberdeen. Grain yields were low in 1993 at both sites; there were increases in grain yield from the use of narrow rows and, at one site, from higher seed rates and undersowing with a grass/clover mixture. In 1994, yields were higher and there were significant increases from the use of higher seed rates but less effect of using close row spacing. There was no increase in grain yield from mechanical weeding in either year.
Introduction
Weeds are the most common problem faced by organic cereal farmers (Taylor et al., 2001). Where no herbicides are used, weeds may comprise more than 50% of the total above ground biomass in organic cereal fields with yield losses of 20% being reported (Rasmussen & Ascard, 1995).
The aim of weed management strategies in organic farming systems is not to eliminate weeds completely but to maintain them at a manageable level by indirect measures (rotation design, variety choice and sowing date) so that direct control measures can succeed in preventing crop losses (Taylor et al., 2001). Methods of weed control for organic farming systems are described by Davies & Welsh (2002), and as well as structural methods, these include manipulation of crop growth and cultivations before and after crop emergence. Harrow comb or spring-tine weeding is the most frequent direct method used (Bulson et al., 1996) and is most effective when done in the standing crop, after weed emergence but before cereal stem extension (Samuel & Guest, 1990).
Easson et al. (1995) found crop competitiveness to be important in weed suppression, even where low rates of herbicide were used in conventional cereals. Competitiveness is increased where the crop is tall, where plant establishment is rapid and where the crop quickly forms a complete ground cover, particularly against late-emerging weeds (Lolz et al., 1995). Richards & Whytock (1993) suggested that the visual assessment of 'early ground cover' at mid to late tillering and 'canopy density' between the flag leaf stage and ear emergence were useful indicators of the competitiveness of cereal varieties with weeds. Bertholdsson & Jonsson (1994) found that the fresh weight of plants grown in water for 14 days could be related to rapid early development and competitiveness in oats.

5th EWRS Workshop on Physical Weed Control 58 Pisa, Italy, 11-13 March 2002
Mailland-Rosset (2000) showed that for barley, but not for oats, there are several plant charcteristics which affect the ability of the crop to compete for light.
Materials and methods
Trials to manipulate the competitiveness of organically grown spring oats were sown at Tulloch, Craibstone Estate near Aberdeen, and at Woodside, Aldroughty Estate near Elgin, in Scotland. Tulloch is a mixed upland farm (155 m above sea level; annual rainfall 850 mm), marginal for crop production and has a sandy loam soil of the Countesswells Association with imperfect drainage. Woodside is a lowland arable farm (25 m above sea level; annual rainfall 730 mm) with a freely drained sandy loam soil of the Elgin Association. Trials followed grass/clover leys.
Treatments for the spring oats in 1993 were: 2 varieties of contrasting straw heights (Dula and Matra); 2 seedrates (150 and 300 kg ha-1); 2 row spacings (9 and 18 cm); 3 cultural weed control methods (none, undersowing with a grass/clover seeds mixture in spring, and mechanical weeding by Lely weeder carried out once through the crop on two separate occasions). The 24 treatment combinations were replicated twice at each location in randomised complete blocks.
Treatments for the spring oats in 1994 were: 3 seedrates (150, 225, and 300 kg ha-1); 3 row spacings (9, 13.5, and 18 cm); 2 cultural weed control methods (none, and mechanical weeding by Temple Harrow Comb carried out once through the crop on two separate occasions). The 18 treatment combinations were replicated three times at each location in randomised complete blocks.
The cereals were sown in plots of 20 m x 3.1 m using an Accord pneumatic drill. The grass/clover mixture was sown at the same time as the oats in 1993 using a Sisis roller feed drill. Dates of sowing and first and second mechanical weedings were 15 April, 26 May and 9 June respectively at Tulloch in 1993, 25 March, 25 May and 28 May at Woodside in 1993, 28 March, 12 May and 23 May for Tulloch in 1994, and 1 April, 11 May and 19 May for Woodside in 1994. The first mechanical weedings approximated to Zadok's growth stage 13-14 and the second to mid-tillering.
Sequential sampling of above ground vegetation was carried out by cutting three 0.27 m2 quadrats at ground level in each plot, initially at 2 week intervals but later at 4 week intervals, starting in mid May; dates of sampling are shown with the results. Trials were harvested by plot combine on 19 October 1993 and 5 September 1994 at Tulloch and 21 September 1993 and 31 August 1994 at Woodside, samples being taken for oven determination of grain dry matter. Grain yields were corrected to 85% dry matter content.
Results
In 1993 and 1994 chickweed (Stellaria media) and mayweeds (Matricaria spp.) contributed the majority of the weed biomass at Tulloch. At Woodside wild oats (Avena fatua), corn marigold (Chrysanthemum segetum) and chickweed dominated in 1993, and chickweed, mayweed spp., polygonums (Polygonum spp.) and field pansy (Viola arvensis) in 1994.
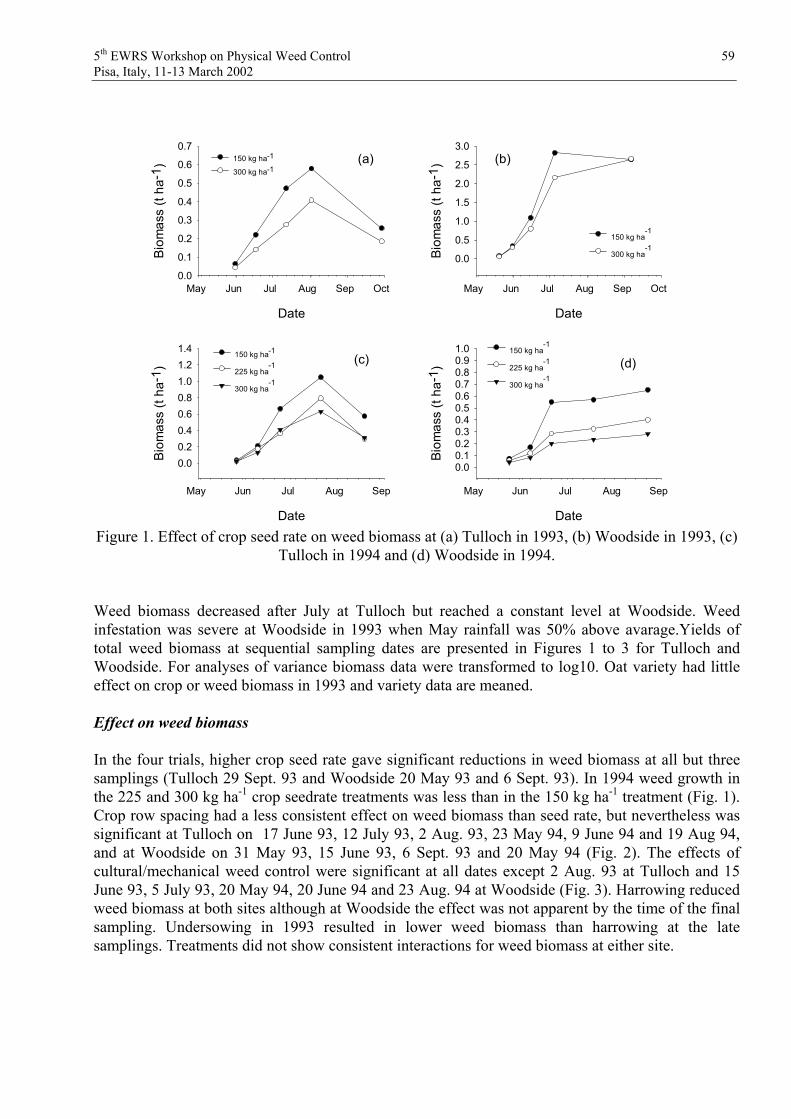
5th EWRS Workshop on Physical Weed Control 59 Pisa, Italy, 11-13 March 2002
Date
May Jun Jul Aug Sep Oct
Biom
ass
(t ha
-1)
0.0
0.1
0.2
0.3
0.4
0.5
0.6
0.7150 kg ha-1
300 kg ha-1
Date
May Jun Jul Aug Sep
Biom
ass
(t ha
-1)
0.00.20.40.60.81.01.21.4 150 kg ha-1
225 kg ha-1
300 kg ha-1
Date
May Jun Jul Aug Sep
Biom
ass
(t ha
-1)
0.00.10.20.30.40.50.60.70.80.91.0 150 kg ha
-1
225 kg ha-1
300 kg ha-1
Date
May Jun Jul Aug Sep Oct
Biom
ass
(t ha
-1)
0.0
0.5
1.0
1.5
2.0
2.5
3.0
150 kg ha-1
300 kg ha-1
(a) (b)
(c) (d)
Figure 1. Effect of crop seed rate on weed biomass at (a) Tulloch in 1993, (b) Woodside in 1993, (c) Tulloch in 1994 and (d) Woodside in 1994.
Weed biomass decreased after July at Tulloch but reached a constant level at Woodside. Weed infestation was severe at Woodside in 1993 when May rainfall was 50% above avarage.Yields of total weed biomass at sequential sampling dates are presented in Figures 1 to 3 for Tulloch and Woodside. For analyses of variance biomass data were transformed to log10. Oat variety had little effect on crop or weed biomass in 1993 and variety data are meaned.
Effect on weed biomass
In the four trials, higher crop seed rate gave significant reductions in weed biomass at all but three samplings (Tulloch 29 Sept. 93 and Woodside 20 May 93 and 6 Sept. 93). In 1994 weed growth in the 225 and 300 kg ha-1 crop seedrate treatments was less than in the 150 kg ha-1 treatment (Fig. 1). Crop row spacing had a less consistent effect on weed biomass than seed rate, but nevertheless was significant at Tulloch on 17 June 93, 12 July 93, 2 Aug. 93, 23 May 94, 9 June 94 and 19 Aug 94, and at Woodside on 31 May 93, 15 June 93, 6 Sept. 93 and 20 May 94 (Fig. 2). The effects of cultural/mechanical weed control were significant at all dates except 2 Aug. 93 at Tulloch and 15 June 93, 5 July 93, 20 May 94, 20 June 94 and 23 Aug. 94 at Woodside (Fig. 3). Harrowing reduced weed biomass at both sites although at Woodside the effect was not apparent by the time of the final sampling. Undersowing in 1993 resulted in lower weed biomass than harrowing at the late samplings. Treatments did not show consistent interactions for weed biomass at either site.

5th EWRS Workshop on Physical Weed Control 60 Pisa, Italy, 11-13 March 2002
Date
May Jun Jul Aug Sep Oct
Biom
ass
(t ha
-1)
0.0
0.1
0.2
0.3
0.4
0.5
0.6
0.79cm Rows18cm Rows
Date
May Jun Jul Aug Sep
Biom
ass
(t ha
-1)
0.00.20.40.60.81.01.21.4 9cm Rows
13.5cm Rows18cm Rows
Date
May Jun Jul Aug Sep Oct
Biom
ass
(t ha
-1)
0.00.51.01.52.02.53.03.5
9cm Rows18cm Rows
Date
May Jun Jul Aug Sep
Biom
ass
(t ha
-1)
0.0
0.1
0.2
0.3
0.4
0.5
0.6
0.7 9cm Rows13.5cm Rows18cm Rows
(a) (b)
(c) (d)
Figure 2. Effect of crop row spacing on weed biomass at (a) Tulloch in 1993, (b) Woodside in 1993, (c) Tulloch in 1994 and (d) Woodside in 1994.
Effects on crop biomass
Increased seedrate gave significantly more crop biomass in all trials at most sampling dates. Row spacing and mechanical weed control had relatively small effects on crop biomass, neither having significant effects at Tulloch in 1993. There were no consistent patterns of significance for interactions for crop biomass, although cultural weed control and seedrate showed significant interactions at Woodside; mechanical weeding reduced crop dry matter in the 150 kg ha-1 treatment and increased it in the 300 kg ha-1 treatment in 1993, with the opposite effect in 1994.
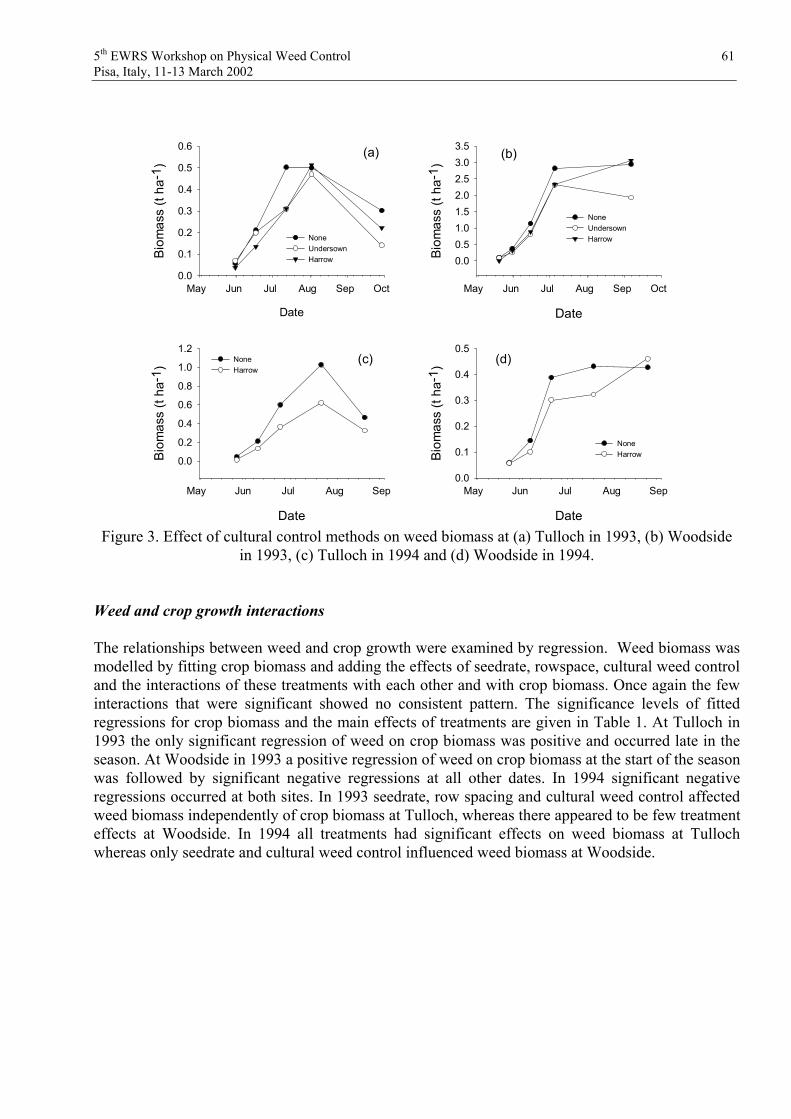
5th EWRS Workshop on Physical Weed Control 61 Pisa, Italy, 11-13 March 2002
Date
May Jun Jul Aug Sep
Biom
ass
(t ha
-1)
0.0
0.2
0.4
0.6
0.8
1.0
1.2None Harrow
Date
May Jun Jul Aug Sep Oct
Biom
ass
(t ha
-1)
0.0
0.1
0.2
0.3
0.4
0.5
0.6
None Undersown Harrow
Date
May Jun Jul Aug Sep Oct
Biom
ass
(t ha
-1)
0.00.51.01.52.02.53.03.5
None Undersown Harrow
Date
May Jun Jul Aug Sep
Biom
ass
(t ha
-1)
0.0
0.1
0.2
0.3
0.4
0.5
None Harrow
(a) (b)
(d)(c)
Figure 3. Effect of cultural control methods on weed biomass at (a) Tulloch in 1993, (b) Woodside in 1993, (c) Tulloch in 1994 and (d) Woodside in 1994.
Weed and crop growth interactions
The relationships between weed and crop growth were examined by regression. Weed biomass was modelled by fitting crop biomass and adding the effects of seedrate, rowspace, cultural weed control and the interactions of these treatments with each other and with crop biomass. Once again the few interactions that were significant showed no consistent pattern. The significance levels of fitted regressions for crop biomass and the main effects of treatments are given in Table 1. At Tulloch in 1993 the only significant regression of weed on crop biomass was positive and occurred late in the season. At Woodside in 1993 a positive regression of weed on crop biomass at the start of the season was followed by significant negative regressions at all other dates. In 1994 significant negative regressions occurred at both sites. In 1993 seedrate, row spacing and cultural weed control affected weed biomass independently of crop biomass at Tulloch, whereas there appeared to be few treatment effects at Woodside. In 1994 all treatments had significant effects on weed biomass at Tulloch whereas only seedrate and cultural weed control influenced weed biomass at Woodside.

5th EWRS Workshop on Physical Weed Control 62 Pisa, Italy, 11-13 March 2002
Table 1. Significance of crop biomass and main treatment effects on weed biomass at sequential sampling dates in regression analyses.
Trial Sample date Regression of log weed on log crop
+ seed rate + row space +cultural control
Tulloch 93 31 May -0.13 ns ** ns * 17 June 0.07 ns * ** * 12 Jul -0.43 ns *** ** ** 2 Aug 0.65 * *** ** ns 29 Sep 0.66 ns ns ns * Woodside 93 20 May 0.19 *** *** ns *** 31 May -0.54 ** ns ns ns 15 Jun -0.68 *** ns ns * 5 Jul -1.00 *** ns ns ns 6 Sep -1.25 *** ns ns ns Tulloch 94 26 May -1.72 *** ns ns *** 9 Jun -0.37 ns ** ** ** 24 Jun -0.98 ns ns ns ** 21 Jul -1.28 * ** ns *** 19 Aug 0.75 ns *** * ** Woodside 94 23 May -0.26 ns *** ns ns 6 Jun -1.61 *** ns ns * 20 Jun -0.62 * *** ns * 18 Jul -2.48 *** *** ns ** 23 Aug -0.91 ns *** * ns
ns: not significant, significant at *P=0.05, **P=0.01, ***P=0.001
Effects on grain yields
Table 2. Grain yield (t ha-1 at 85% d.m.): main effects of row spacing in 1993 and 1994.
Row space (cm) 9 13.5 18 SED+
Tulloch 1993 3.17 2.87 0.065 Woodside 1993 3.09 2.58 0.131 Tulloch 1994 5.39 5.67 5.24 0.126 Woodside 1994 5.84 5.86 5.77 0.111
Grain yields were higher in 1994 than 1993. The yields of the two varieties in 1993 were not significantly different, although the taller Dula yielded more than Matra on narrow rows at Tulloch, the interaction being significant at 10%. The 18 cm rows gave the lowest yields in all trials and row width differences were significant at Woodside in 1993 and Tulloch in 1994 where the intermediate 13.5 cm rows gave the highest yields (Table 2). The high seed rate gave a significant yield increase at Woodside in 1993 (Table 3) and in 1994 grain yields were increased by increasing seedrate above 150 kg/ha at both sites. Mechanical weeding reduced mean grain yield significantly only at Tulloch

5th EWRS Workshop on Physical Weed Control 63 Pisa, Italy, 11-13 March 2002
in 1993 but there were greater reductions in grain yield resulting from harrowing the low seed rate treatments than the high seed rate treatments in 1993 (Table 3).
Table 3. Grain yield (t ha-1 at 85% d.m.): interactions of seedrate and cultural weed control methods in 1993 and 1994.
Cultural weed control Seed rate (kg ha-1)
None U'sow Mech Mean
Tulloch 1993 150 3.20 3.18 2.65 3.01 300 3.05 3.10 2.94 3.03 Mean 3.12 3.14 2.80
SED+ a0.112 b0.079 c0.065*
Wooside 1993 150 2.45 3.08 2.36 2.63 300 3.05 2.96 3.12 3.04 Mean 2.75 3.02 2.74
SED+ a0.227 b0.160 c0.131*
Tulloch 1994 150 5.27 5.03 5.15 225 5.45 5.76 5.61 300 5.65 5.42 5.54 Mean 5.46 5.40
SED+ a0.178 b0.103 c0.126*
Woodside 1994 150 5.65 5.65 5.65 225 5.78 5.94 5.86 300 6.09 5.83 5.96 Mean 5.84 5.81
SED+ a0.157 b0.091 c0.111*
*SEDs for comparisons awithin table, bundersowing/harrowing means, cseed rate means
Weed growth and grain yield
To determine whether weed growth per se had affected grain yields, grain yields were regressed on weed biomass (untransformed data) at the different sampling dates, treatment effects having first been removed (Table 4). Although weeds had some negative effects on grain yield, only at Woodside in 1993, when weed biomass reached nearly 3 t ha-1, were there significant yield reductions from weed infestation.

5th EWRS Workshop on Physical Weed Control 64 Pisa, Italy, 11-13 March 2002
Table 4. Effects weed biomass (t ha-1 d.m.) at different dates on grain yields (t ha-1 at 85% d.m.).
Trial Sample date Regression Tulloch 1993 31 May +4.59 ns 17 June -0.04 ns 12 Jul +0.44 ns 2 Aug +0.08 ns 29 Sep +0.21 ns Woodside 1993 20 May -0.28 ns 31 May -1.95 ns 15 Jun -1.60 ** 5 Jul -0.71 *** 6 Sep -0.36 ** Tulloch 1994 26 May -2.93 ns 9 Jun +0.21 ns 24 Jun -0.26 ns 21 Jul -0.26 ns 19 Aug -0.34 ns Woodside 1994 23 May -1.69 ns 6 Jun -0.25 ns 20 Jun -0.12 ns 18 Jul -0.46 ns 23 Aug -0.13 ns
Discussion
Organic growers control weeds to maximise yields and minimise weed seed returns to the soil (Rasmussen et al., 2000). In the present trials the effects of crop growth on weed development were quantified during the growing season but weed seedbanks were not measured.
Control methods tested here included variety selection, sowing methods and cultivation. The two oat varieties, though chosen for their differences in straw length (SAC, 1992), did not differ greatly in growth or grain yield and gave no indication that varieties having a tall final straw length are more suppressive of weeds than those with a shorter straw. Davies & Welsh (2002) suggest that long straw is not the only requirement for weed suppression and that in wheat good overall shading ability is more important. Bertholdsson & Jonsson (1994) found that in oats plant fresh weight may indicate ability to compete with weeds. However, Mailland-Rosset (2000), working near Aberdeen, found that light penetration to ground level in oat varieties between stem elongation and ear emergence was not correlated with plant height or biomass, as it was in barley. Because oats are more vigorous than wheat or barley, weed suppression appears less affected by height differences.
Competition between crop and weeds is important for weed suppression. In practice weed and crop biomass may be correlated (Pearce & Gilliver, 1978) since environmental conditions which favour growth in the one may also favour growth in the other, giving a positive correlation, or the exploitation of resources by one may deprive the other, giving a negative correlation. On the other

5th EWRS Workshop on Physical Weed Control 65 Pisa, Italy, 11-13 March 2002
hand, Rasmussen & Ascard (1995) have suggested that where conditions favour crop growth, for example in situations of high soil fertility, the crop may be better able to compete effectively with weeds than in less favourable conditions. In this paper such correlations have not been taken into account. A significant positive regression occurred on two occasions and may have been a consequence of favourable conditions at particular stages of development when weed and crop were not interfering with each other.
Negative regressions indicating competition were more often significant at Woodside than at Tulloch. In 1993, crop growth rates were roughly similar at both sites, but the weed species at Woodside were particularly aggressive and weed biomass was greater than at Tulloch. In 1994 weed biomass was less at Woodside than at Tulloch, but crop growth was more rapid at Woodside. Competition appears to have followed the rapid development of one component of the association.
At Tulloch there were indications that row spacing and seedrate acted independently of crop biomass on weed biomass. This suggests that plant distribution was important, presumably through a larger number of smaller plants at the higher seedrate or a 'squarer' arrangement of plants more widely spaced in closer rows giving more uniform ground cover. Where growth of at least one component was rapid, as at Woodside, the advantage of uniform crop plant distribution would be quickly lost as crop or weed spread rapidly.
Mechanical weeding gave reductions in weed biomass, the effect being most apparent some time after weeding had occurred, presumably because damaged weeds did not recover. In 1994 there was some indication of increases in crop biomass as a result of mechanical weeding which may have been a consequence of less weed competition. Grain yields were unaffected by mechanical weeding, except at Tulloch in 1993 when they were reduced. This latter effect agrees with results from by Bulson et al. (1996) in which grain yields were not increased by spring tine weeding, attributed to reductions in plant density and generally poor levels of weed control.
Undersown grass and clover compete with weeds and in these trials weed biomass was reduced as a result of undersowing. Undersowing did not reduce crop biomass and or grain yields and should be regarded as a useful method of weed control, as well as for establishing grass/clover leys and adding N to the system (Younie, 2001).
The trials demonstrate that measures taken to control weeds do not necessarily result in increased grain yields unless weed competition is severe as at Woodside in 1993 where weed biomass approached 3 t ha-1. At Tulloch and Woodside in 1994 weed growth was less than this and yields responded to seed rates only up to 225 kg ha-1; seed rates above this had only marginal effects on weed growth.
Although a number of practices were effective in reducing weed growth, weeds had a relatively small effect on final grain yield in these trials. Nonetheless, organic growers are well aware of the need to minimise weed growth and weed seed production in order to avoid future problems.
Acknowledgements
The authors acknowledge the major contributions to the field work of these trials by John Wilson, Michael Coutts and Carey Dye, to the statistical analysis by Mike Franklin and to the presentation of data by Robin Walker. The trials were funded by the Scottish Executive Environment and Rural Affairs Department.

5th EWRS Workshop on Physical Weed Control 66 Pisa, Italy, 11-13 March 2002
References
BERTHOLDSSON NO & JONSSON R (1994) Weed competition in barley and oats. In: Proc. 3rd European Society of Agronomy Congress, Abano-Padova, Italy, 656-657.
BULSON H, WELSH J; STOPES C & WOODWARD L (1996) Weed Control in Organic Cereal Crops. Final Report of EU contract AIR-CT93-0852, Elm Farm Research Centre, UK.
DAVIES DHK & WELSH JP (2002) Weed control in organic cereals and pulses. In: OrganicCereal and Pulses (eds D Younie, BR Taylor, JP Welsh, & JM Wilkinson), 77-114, Chalcombe Publications, Lincoln, UK.
EASSON DL, COURTNEY AD & PICTON, J (1995) The effects of reduced fertilizer and herbicide input systems on the yield and performance of cereal crops. In: Integrated Crop Protection: Towards Sustainability? (eds D Atkinson & R McKinley), British Crop Protection Council Syposium Proceedings No.63.
LOLTZ LAP, WALLINGA J & KROPFF MJ (1995) Crop-weed interactions: quantification and prediction. In: Ecology and Integrated farming Systems (eds DM Glen, MP Greaves & HM Anderson), 31-47, John Wiley and Sons, Chichester, UK.
MAILLAND-ROSSET S (2000) Competitive ability of spring barley and spring oat varieties: plant traits and light interception. Agriculture Engineer Degree Thesis, ENITA, Clermont-Ferrand and SAC, Aberdeen.
PEARCE SC & GILLIVER B (1978) The statistical analysis of data from intercropping experiments. Journal of agricultural Science, Cambridge 91, 625-632.
RASMUSSEN IA, MELANDER B, RASMUSSEN K et al. (2000) Recent advances in weed management in cereals in Denmark. In: Proceedings of the 13th International IFOAM Scientific Conference, Basel,179.
RASMUSSEN J & ASCARD J (1995) Weed control in organic farming systems. In: Ecology and Integrated farming Systems (eds DM Glen, MP Greaves & HM Anderson), 49-67, John Wiley and Sons, Chichester, UK.
RICHARDS MC & WHYTOCK GP (1993) Varietal competiveness with weeds. Aspects of Applied Biology 34, 345-354.
SAC (1992). SAC Cereal Recommended List 1993. Scottish Agricultural College, Edinburgh, UK. SAMUEL AM & GUEST SJ (1990) Weed studies in organic and conventional cereals. In: Crop
Protection in Organic and Low Input Agriculture (ed R Unwin), British Crop Protection Council Monograph No.45, 183-186.
TAYLOR BR, WATSON CW, STOCKDALE EA, MCKINLAY RG, YOUNIE D & CRANSTOUN DAS (2001) Current practices and Future Prospects for Organic Cereal Production: Survey and Literature Review. Research Review No.45. HGCA, London.
YOUNIE D (2001). Weed Control in Organic Cereals. Organic Farming Technical Summary No.6, SAC, Edinburgh.

5th EWRS Workshop on Physical Weed Control 67 Pisa, Italy, 11-13 March 2002
Effect of crop competition and cultural practices on the growth of Sonchus arvensis
P. Vanhala1), T. Lötjönen2) & J. Salonen1)
1)MTT Agrifood Research Finland, Plant Protection, FIN-31600 Jokioinen E-mail [email protected]
2)MTT Agrifood Research Finland, Agricultural Engineering, FIN-03400 Vihti
Sonchus arvensis L. (perennial sowthistle) is an increasing problem in Finland, particularly in organic farming. Controlling S. arvensis with non-chemical methods is not an easy task. However, crop competition (Zollinger & Kells 1991) and cultural practices like mowing (Håkansson 1969), hoeing and fallowing (Håkansson 1969) provide some possibilities for S. arvensis management.
As a part of a larger research project focusing on perennial weeds S. arvensis, Cirsium arvense(L.) Scop. and Elymus repens (L.) Gould., a three-year field experiment was established in 2001 at Vihti, southern Finland, in order to study the biology and control of S. arvensis.
The experiment was placed in a clay soil (containing 6–12% organic matter) field under organic production and heavy infestation of S. arvensis. The experimental design was randomized blocks with five replicates. The treatments consisted of various crop plants and cultural practices (Table 1). All crops were sown on 16 May 2001.
Table 1. Experiment protocol for the first year of the 3-year field trial. Crop Weed control treatments Fiber hemp None Barley None Barley Hoeing Barley + undersown timothy & clover None Timothy & clover (sown in spring) Mowing twice during summer Fallow Power harrowing once + harrowing
several times during summer
The development of crop and weed plants was observed weekly (results not presented here). Prior to harvesting of barley, on 20 August 2001, plant samples from two 0.5 m × 0.5 m quadrats were cut at the soil surface. The growth stage (mainly according to Meier 1997) and the height of each S. arvensis shoot were assessed. Also the total dry mass of S. arvensis per sample area was assessed.
The beginning of the growing season 2001 was cool and rainy but turned to warm and dry in July-August.
S. arvensis was most abundant in fiber hemp and timothy + red clover (Fig. 1). Spring-sown timothy and clover remained short, and also the early growth of fiber hemp was slower than that of

5th EWRS Workshop on Physical Weed Control 68 Pisa, Italy, 11-13 March 2002
barley. Later on, after mid-July, hemp was the tallest crop and had taller S. arvensis shoots than the other crops.
In all crops, the majority of S. arvensis infestation even at the harvest time consisted of small plants with 1–6 leaves, thus being at the compensation point (Håkansson 1969) or smaller. The highest percentage (6%) of ripening S. arvensis seeds was in hemp.
In barley, hoeing reduced the number and mass of S. arvensis compared to other barley plots. In timothy+red clover, cutting kept the S. arvensis plants short, mostly below 40 cm, and delayed flowering. Fallow, cultivated six times during the summer when S. arvensis reached compensation point, produced the least amount of S. arvensis plants. S. arvensis produced the highest dry mass in hemp and lowest in fallow (Fig 2).
The S. arvensis infestation may be restrained with mowing or hoeing, but the effect of these methods is not equal to fallowing. Crops growing fast in early season, e.g. barley, reduce S.arvensis growth more than slow-growing crops.
The long-term effects of different treatments will be assessed in the next two summers.
Figure 1. Distribution of plant height and growth stages of S. arvensis in 20 Aug 2001, prior to harvest of barley.
Figure 2. S. arvensis dry mass in 20 Aug 2001.
Distribution of S. arvensis height
0
50
100
150
200
Fiber h
emp
Barley
Barley
+hoein
g
Barley
+tim&clo
v
Timoth
y&clo
ver
Fallow
plan
ts m
-2
120- cm100-119 cm80-99 cm60-79 cm40-59 cm20-39 cm1-19 cm
Growth stages of S. arvensis
0
50
100
150
200
Fiber h
emp
Barley
Barley
+hoe
ing
Barley
+tim&clo
v
Timoth
y&clo
verFallo
w
plan
ts m
-2
ripeningfruitfloweringinflorescence13- leaves7-12 leaves1-6 leaves
S. arvensis dry mass
0
100
200
300
Fiber
hemp
Barley
Barley
+hoe
ing
Barley
+tim&clo
v
Timoth
y&clo
verFa
llow
g m
-2

5th EWRS Workshop on Physical Weed Control 69 Pisa, Italy, 11-13 March 2002
References
HÅKANSSON S (1969) Experiments with Sonchus arvensis L. 1. Development and growth, and the response to burial and defoliation in different developmental stages. Lantbrukshögskolansannaler 35, 989–1030.
MEIER U (ed.) (1997) Phenological growth stages and BBCH-identification keys of weed species. p. 135–139 In: Growth Stages of Mono- and Dicotyledonous Plants (ed. U Meier), BBCH-Monograph. Berlin; Wien: Blackwell Wissenschafts-Verlag. 622 p.
ZOLLINGER RK & KELLS JJ (1991) Effect of soil pH, soil water, light intensity, and temperature on perennial sowthistle (Sonchus arvensis L.). Weed Science 39, 376–384.

5th EWRS Workshop on Physical Weed Control 70 Pisa, Italy, 11-13 March 2002
The action spectrum for maximal photosensitivity of germination and significance for lightless tillage
K. M. Hartmann & A. Mollwo Institut für Botanik und Pharmazeutische Biologie der Universität Erlangen-Nürnberg
Staudtstr. 5, 91058 Erlangen, Germany; E-mail: [email protected]
Abstract
The photosensitivity of the achenes of Garden Lettuce (Lactuca sativa) may differ by a factor of 108
after one week of chilling or warming. To characterize maximal photosensitivity of germination the action spectrum from 300 to 800 nm was elaborated, based on 20 fluence-response curves for 6 s to 10 min exposure. These run linearly and closely parallel to saturation in the logarithmic probability net. The apparent photoconversion spectrum, derived for 50 % germination, was corrected for the transmittance of the seedcoat. It is a photoconversion spectrum of the red-absorbing phytochrome A, with photoconversion cross-sections of 1.2 109 or 4.5 103 m² mol-1 at 666 or 800 nm, respec-tively. This means for half-saturated germination of sensitized lettuce fewer than 1 out of 200,000 molecules of phytochrome A have to be photoconverted to the far-red absorbing form. Hence, no photoinhibition of the germination by far-red to deep-red light between 735 and 800 nm was found. Therefore, all spectral colours of nightly moon- or sky-light may stimulate the germination of highly photosensitized weed seeds, if these are exposed at the soil surface between sequential tillage operations for more than 5 s or 5 min, respectively.
Keywords: photo-control, Lactuca sativa, Garden Lettuce, Arabidopsis thaliana, phytochrome A, very-low-fluence response
Introduction
Farming of our land started about 12,000 years ago, at the end of the last Ice Age, and weeds were only killed by hoeing and burning. During World War Two, after detection of 2,4-D (2,4-dichloro-phenoxyacetic acid), chemical control of weeds by herbicides started. In 1952 it was found that numerous developmental processes of plants can be controlled by light signals, absorbed by phytochromes (Borthwick et al. 1954; Smith 1995). Photo-control of seed germination is one of the most sensitive phytochrome reactions ever detected. Therefore, a lot of seeds only germinate if these are posed close to the soil surface. In this way young seedlings will grow into the daylight before reserves are used up. This property is typical of most of our small- and brown-seeded weeds, occurring in agricultural fields (Buhler 1997, Milberg et al. 2000). However, most large- and light-seeded crop plants as evolved by man have been selected to germinate in darkness, because it is advantageous to place large seeds into the soil, where water and minerals are more readily available and where the access for birds and other seedeaters is restricted (Radosevich & Holt 1984). This means that most weeds need some light to germinate whereas crop plants do germinate in darkness.
Every soil cultivation shifts some seeds from the soil seedbank up to the surface into the daylight and facilitates germination. This is also true for weed seeds that get a flashlight exposure during tillage operations (Scopel et al. 1994). This way the development of various weeds gets ahead of the crop plants (Jensen 1995). Therefore, it was possible to demonstrate that three times repeated nighttime cultivation of agricultural fields might act as an efficient weed killer (Hartmann

5th EWRS Workshop on Physical Weed Control 71 Pisa, Italy, 11-13 March 2002
Full sun, around noon
& Nezadal 1990). However, this method of lightless tillage proved to be unreliable, mainly if applied only once (Niemann 1996, Fogelberg 1999). One reason is the annual dormancy cycle in buried weed seeds (Baskin & Baskin 1985). Moreover, dependent on the local climatic and mineral conditions, the photosensitivity of the seeds in the soil seedbank may reversibly shift by a factor of 108 within one or two weeks (Hartmann & Mollwo 2000 a).
Freshly sown seeds of typical spring germinators, like Garden Lettuce (Lactuca sativa), normally do not respond to natural night- or moonlight, but short exposures to weak day- or twilight at dawn or dusk are needed for germination (Frankland & Taylorson 1983, Smith 1995). However, recently it was shown that germination is triggered by moon- and nightlight if seeds are chilled for about one week in the imbibed state (Hartmann et al. 1998). During maximal photosensitivity an exposure to 1 second of a full moon or to 1 microsecond of full sunlight will suffice. This corres-ponds to the illuminances measured in the open (Figure 1). Therefore, during experimentation with sensitized seeds no visible safe-light should be used (Hartmann 1977, Baskin & Baskin 1979). For a better understanding of these problems the action spectrum for maximal photosensitivity of germination was determined to discuss its meaning for the method of lightless tillage.
Figure 1. Spherical illuminances in lux (= lx) along a logarithmic scale, as measured close to Erlangen in the open. Below rain clouds (= nimbostratus) values drop to about 10 % (from Hartmann et al. 1998).
Materials and Methods
Germination conditions Achenes of the lettuce variety Lactuca sativa L. cv. Grand Rapids, tip-burn-resistant strain (crop 1978), were sealed, stored, selected and sown as described by Hartmann et al. (1998). Sowing was in 9 cm Petri dishes on 4 layers of washed filter paper (type 595, Schleicher & Schüll, D-Dassel), using 2.5 mL 0.01 molar KNO3 and 50 achenes per dish. For germination tests up to 20 sown Petri dishes were stored at 22.5±0.5 °C in metal boxes, tightly closed with black gardening foil and black
Thunderstorm, at noon
Sunset, fair
Twilight at dawn/dusk
Full moon, no clouds One hour after sunset, fair
Night-sky, no moon fair
Night-sky with rain clouds
105
104
103
102
1
10
10-1
10-2
10-3
lx

5th EWRS Workshop on Physical Weed Control 72 Pisa, Italy, 11-13 March 2002
cloth below the cover. For these conditions and all experiments the 68 % confidence interval of the dark germination was at 43.3±2.0 % from November 1998 until June 2000.
The sunlight-formed active maternal phytochrome B within the achenes has been depleted by irradiating with deep-red at 763 nm at an irradiance of 4.5 0.2 W m-2 for 5 min at the second hour after imbibition, followed by 1 day of darkness at 35 °C. Seven more days of chilling at 3.5 0.3 °C was given to obtain photosensitized achenes. The pretreated Petri dishes were subsequently exposed to diverse light through warmed new covers at 22.5 0.5 °C. Handling of the prepared dishes was in darkness within metal-coated black-walled growth chambers (BBC-York, D-Mannheim), using black frames for adjustment during exposure. After illumination the Petri dishes were again stored for at least 2 days in light-tight metal boxes at 22.5 0.5 °C. For further details see Hartmann & Mollwo 2000 a, b.
Monochromator systems Deep-red light was filtered from a 2.5 kW xenon arc cinema-projector (Zeiss-Ikon, D-Kiel; Raschke 1967) as described in detail by Hartmann et al. (1998). The isolated deep-red band was centred at 763 nm, with a half bandwidth of 23 nm and a tenth bandwidth of 43 nm, to expose up to 6 Petri dishes simultaneously at an irradiance of 4.5 0.2 W m-2, corresponding to a photon fluence of 15.5 0.7 mmol m-2 within 5 min.
Red light, centred at 657 nm with a half bandwidth of 16 nm, was emitted from an area of 13 3mm² of a black-coated red fluorescent tube (Philips TL 20 W/15, NL-Eindhoven; see Hartmann et al. 1997), to get 55 cm below the tube a photon irradiance of 6.5 nmol m-2 s-1, this is a photon fluence of 320 16 nmol m-2 in 30 s.
Table 1. Parameters of the fluence-response curves for photostimulated germination of sensitized Lettuce, cv. Grand Rapids tip-burn-resistant strain, as computed from the probit analysis with Eqs. 3 to 5.
Centre Half Half Factorial Correlation Transmit- Apparent Corrected wave-length
band-width
response fluence
standard deviation
coefficient tance of seed coat
conversion cross section
[nm] [nm] [nmol m2] r T [m2 mol-1] [m2 mol-1]
800 24.5 653400 2.26 0.9537 0.3403 1.53·103 4.50·103
772 15.0 24370 2.30 0.8828 0.3165 4.10·104 1.30·105
735 18.1 640.9 2.22 0.8640 0.2815 1.56·106 5.5·106
694 14.4 7.77 2.29 0.9135 0.2745 1.29·108 4.69·108
666 17.4 3.33 2.06 0.9204 0.2557 3.00·108 1.17·109
655 19.0 3.89 2.29 0.9390 0.2330 2.57·108 1.10·109
618 17.7 8.36 2.17 0.8860 0.2183 1.20·108 5.48·108
585 15.6 27.80 2.03 0.9043 0.1895 3.60·107 1.90·108
553 17.6 67.35 2.59 0.9533 0.1665 1.49·107 8.92·107
520 16.7 486.8 2.14 0.9458 0.1560 2.05·106 1.32·107
493 16.0 1536 2.10 0.9274 0.1260 6.51·105 5.17·106
478 16.5 1168 2.12 0.9001 0.1175 8.56·105 7.29·106
449 16.3 767.4 1.97 0.9352 0.1037 1.30·106 1.26·107
428 16.4 910.8 2.57 0.9505 0.0680 1.10·106 1.61·107
398 17.0 1707 2.15 0.9542 0.0377 5.86·105 1.55·107
377 8.0 16470 2.70 0.9709 0.0183 6.07·104 3.33·106
360 6.7 8440 2.10 0.9408 0.0115 1.19·105 1.03·107
345 5.9 12650 2.39 0.9382 0.0089 7.91·104 8.88·106
321 5.7 12860 1.81 0.9512 0.0097 7.78·104 8.05·106
301 9.1 13760 2.05 0.9144 0.0130 7.27·104 5.60·106

5th EWRS Workshop on Physical Weed Control 73 Pisa, Italy, 11-13 March 2002
Other monochromatic light was filtered from a modified slide projector (Noris AV 250; E.Plank, D-Nürnberg), with tungsten halogen bulb Xenophot HLX 24 V 250 W (Osram, D-Berlin), running at 21.5 V on stabilized alternating current. For wavelengths below 400 nm a xenon arc projector with quartz optics was used (XBO 450 W by Osram, in Leitz, D-Wetzlar, arranged according to Mohr & Schoser 1959, 1960). Filtering was by heat filters and interference filters (Schott, D-Mainz), both air-cooled. Double-bandpass filters of the type DAL were used above 380 nm, line filters of the type UV-IL below 380 nm. The spectral transmittance of all used filters was measured (Uvikon 860; Kontron, D-München) and cleaned down to <10-4 by combination with colour filters (Schott, D-Mainz). The realized half bandwidths of all combinations (Table 1) were 3±1 % of the centre wavelengths, and their tenth and hundredth bandwidths were smaller than two to three times the half bandwidths, respectively.
Light exposures The normal photon irradiance at the exposure level was adjusted by means of combined neutral-density filters (Schott, D-Mainz) to values between 0.1 nmol m-2 s-1 at 666 nm and 8 µmol m-2 s-1 at 800 nm, to obtain within the Petri dishes spherical photon fluxes between 0.18 nmol m-2 s-1 and 14.4 µmol m-2 s-1, respectively. An electronic shutter behind the projection lens modified the exposure time between 6 s and 10 min (Compur electronic 1; Prontor, D-Wildbad).
Vertical light beams have been measured at the exposure level by means of a calibrated thermopile system (CA1; Kipp & Zonen, NL-Delft; see Hartmann et al. 1998) and a silicon photodiode as the monitoring detector (Si 15; Dr. B. Lange, D-Berlin). The entrance port of the thermopile was closed by a pane of the Petri cover to correct for loss of transmittance, and the 80 % diffuse reflectance of the non-fluorescent wet white filter paper was added, to obtain the spherical photon flux within the Petri dishes, i. e. the photon fluence rate.
Evaluation Light-stimulated germination percentage, G, is based on the emerged radicles as counted in samples of size N = 50, earliest 2 days after the last light exposure and determined according to the equation:
G = (L – D)/(M – D) with 0 < G < 1, (1)
with L = number germinated after light exposure, D = number germinated in darkness, and M = maximal number germinated. G always saturated at 98.8±0.2 %. The binomial random error s of G is found from the square root of the variance s²:
s² = G(1 – G)/N (2)
For N = 50 and for G = 0 or 1 we get s < 0.02, and for G = 0.5 s is increasing to 0.071.
Fluence-response curves for germination of lettuce were obtained from 30 to 60 samples, exposed to at least 10 different photon fluences at each of the 20 spectral bands (Table 1). Three prepared Petri dishes were always exposed successively to the same photon fluence. The germination of all samples, determined from Eq. 1, was plotted versus the applied photon fluence, using the logarithmic probability net, this is germination percentage on a probit scale versus photon fluence on a logarithmic scale (Figure 2).
Seedcoat transmittance In addition, the spectral transmittance of the seedcoat was needed. For this purpose six halves of seedcoats of lettuce were prepared 3 h and 28 h after sowing, and fixed in parallel by means of two-sided adhesive tape to a strip of ultra-violet transmitting plexiglass (1 13 45 mm³), to cover an area of 5 to 7.5 times 3 mm². For these samples the mean spectral transmittance (= T in Table 1) was measured versus the blank at the entrance port of an integrating sphere, flanked to a spectro-

5th EWRS Workshop on Physical Weed Control 74 Pisa, Italy, 11-13 March 2002
photometer using a projected slit width of 0.1 0.3 mm² (KA plus objective at M4QIII with PMQII; Zeiss, D-Oberkochen). The standard deviation of 2 to 4 measurements was ±2.2 % at 800 nm and dropped to ±0.2 % at 301 nm.
Results
Firstly, in the imbibed achenes of lettuce the maternal phytochrome Bfr has been reduced to the minimum by saturating deep-red exposure, followed by 1 day at 35 °C. Secondly, achenes were photosensitized by 1 week of chilling at 4 °C. The elaborated fluence-response curves for photo-stimulated germination gave good linear regression fits in the logarithmic probability net (Figure 2). This means that the germination percentage, G, determined from Eq. 1, is increasing according to:
probit G = 5 + (log F – log H)/log (3)
where F = applied photon fluence in nmol m-2, H = half-response fluence in nmol m-2 (i.e. for G = 50 %), and = factorial standard deviation of the sensitivity distribution within the population. This version of the probit analysis stems from Harpley et al. (1973) and is similar to other approaches (e.g. Duke 1978, Cone et al. 1985). The computed parameters of Eq. 3, and the correlation coefficients, r, are listed in Table. 1.
Figure 2. Some selected fluence-response curves for photostimulated germination of lettuce fruits, presented in the logarithmic probability net. Wavelengths in nm are indicated.
A homogeneous photoresponse to all spectral bands from 300 to 800 nm may be assumed, because none of the factorial standard deviations, , significantly deviates from their arithmetic mean, g = 2.22 (P > 0.05), stating that all fluence-response curves run almost parallel and go to saturation. This means that classical action spectroscopy is applicable. Hence, we get the apparent conversion spectrum of the sensory pigments, or their apparent spectral molar conversion cross-section [= s( )], if we plot the reciprocal of the spectral half response fluence [= H( ) in Eq. 3] along the wavelength (Hartmann 1977, 1983; Schäfer et al. 1983):
s( ) = 1/H( ) with the unit [m2 mol-1] (4)
10-1
1 101
102
103
104
105
106
107
photon fluence / nmol.m-2
2
3
4
5
6
7
8
prob
it
99.86
97.7
84.1
50
15.9
2.3
0.14
germ
inat
ion
/%
377398520585666 800

5th EWRS Workshop on Physical Weed Control 75 Pisa, Italy, 11-13 March 2002
300 400 500 600 700 800
wavelength / nm
10 3
10 4
10 5
10 6
10 7
10 8
10 9
1010
con
vers
ion
cro
ss s
ecti
on
/ m
2 mo
l-1
rela
tive
ph
oto
n e
ffec
tive
nes
s1
10-1
10-2
10-3
10-4
10-5
10-6
in vitro x103
apparent
corrected
The quantity s( ) is also named absolute spectral photon effectiveness (or responsiveness) and gives the apparent spectral molar photoconversion cross-section of the controlling pigment(s). This quantity from Table 1 is plotted on a logarithmic scale versus the wavelength, to show the typical apparent conversion spectrum of the controlling pigment(s) in Figure 3. In addition, the corrected conversion spectrum was computed according to:
c( ) = s( )/T( ) (5)
with c( ) = corrected spectral (molar photo)conversion cross-section in [m2 mol-1] and T( ) = spectral transmittance of the seedcoat from Table 1.
The typical corrected conversion spectrum derived from Table 1 is shown in absolute and relative form, along the left and the right ordinate of Figure 3, respectively. Thus, the corrected molar photo-conversion cross-section at 666 nm reaches a maximum of 1.2·109 m2 mol-1, whereas at 800 nm a minimum of 4.5·103 m2 mol-1 is obtained. This means that for photo-control of germination the hitting probability or photon effectiveness at 800 nm is only 4·10-6 of 666 nm, confirming that the long wavelength slope of the conversion spectrum verges into a Gaussian function, as to be expected for conjugated chromophores and consequently also for phytochromes (Hartmann & Haupt 1977, 1983; Seyfried & Schäfer 1985).
The pattern of course of the corrected conversion spectrum resembles the conversion spectrum of phyAr phyAfr in vitro, as plotted in Figure 3. Therefore, a test for deep-red reversibility was performed, applying saturating exposures of 320 nmol m-2 at 657 nm and 1.5 mmol m-2 at 763 nm within 30 s, and 5 min darkness in between. As was to be expected from the fluence-response curves (Figure 2), fully saturated germination at 100–0.5 % was found for 657+763 nm and 763+657 nm, as well as for 657 nm or 763 nm alone, whereas the dark control gave 5±1.5 % germination.
Figure 3. Action spectra for germination of sensitized lettuce, showing the apparent and the corrected conversion spectrum, in absolute (left ordinate) and relative form (right ordinate). The given conversion spectrum for phytochrome A in vitro for the transition Pr
Pfr derives from Lagarias et al. (1987), as listed by Mancinelli (1994) and corrected according to Hartmann et al. (1997), however multiplied by 1000.

5th EWRS Workshop on Physical Weed Control 76 Pisa, Italy, 11-13 March 2002
Discussion
The corrected action spectrum in Figure 3 is similar to the typical colour curve of the red-absorbing form of phytochrome A. Both spectra run about parallel above 520 nm. However, down into the blue and ultra-violet progressively lower photon effectiveness is noted, and no identity to the action spectrum of the ‘Very Low Fluence Response’ in Arabidopsis thaliana (Thale Cress) by Shinomura et al. (1996) is ascertained. Nevertheless, some conclusions can be drawn:
Firstly, for sensitized lettuce the half-response fluence at 666 nm is 3 nmol m-2 whereas for A.thaliana at 655 nm around 25 nmol m-2 was reported (Shinomura et al. 1996). Therefore, lettuce was at least eight times more photosensitive.
Secondly, for sensitized lettuce all fluence-response curves from 300 to 800 nm run approxi-mately parallel and saturate germination. This indicates that also 800-nm-light forms enough active phytochrome A to saturate the VLFR in lettuce. However, fluence-response curves for A. thalianaat 780 nm and 800 nm showed flatter slopes and did not saturate (Shinomura et al. 1996).
Thirdly, accepting phytochrome A as the photoreceptor, the direct comparison of the photoconversion cross-sections in vitro and in vivo is possible, e.g. at 666 nm. This gives 6131/1.2·109 5·10-6, indicating that about 1 out of 200,000 phytochrome A molecules must become Pfr for half saturated germination. A similar value is also derived from the photoconversion kinetics of phytochrome A, if for the half-conversion fluence 113 µmol m-2 at 666 nm is used from Mancinelli (1994). Comparing this to the corrected half-response fluence of germination at 666 nm in Table1, this is 3.33 0.2557 0.85 nmol m-2, we calculate for 50 % germination and the photoconverted fraction of phytochrome A a value of 4.6·10-6 (Hartmann & Mollwo 2000 b). Thus, for half saturated VLFR of germination fewer than 5 out of 1 million or about 1 of 200,000 phyA molecules have to be photoconverted to Pfr. This corresponds to fewer than 40 molecules of phyAfr per root meristem cell of 50 µm size and is still high enough for a cellular control mechanism by phytochrome A (Hartmann & Haupt 1977, 1983).
Fourthly, the slope of fluence-response curves, defined by the factorial standard deviation in Eq. 3 and given in Table 1, is a measure for the photosensitivity distribution within the seed population, approximating a homogeneous Gaussian distribution. For example, at 666 nm about 95 % of the population respond to a photon fluence between 3.3/2.062 0.78 nmol m-2 and 3.3 2.062
14 nmol m-2 (see Figure 2).
These findings proof that all spectral colours – from the ultra-violet at 300 nm to the near infra-red at 800 nm – saturate the VLFR of germination and that no deep-red reversibility is realized. Therefore, also 5 s or 5 min of nightly moon- or skylight, respectively, stimulate the germination of highly sensitized seeds via the VLFR of phytochrome A (Hartmann et al. 1998). This means that the strategy to reduce the weediness of arable land by cultivation at night might be hampered, as soon as highly photosensitized weed seeds occur in the seedbank and are exposed at the soil surface in the imbibed state. Consequently, in a phase of high photosensitivity exposure periods of several minutes between timely separated nightly or lightless tillage operations should be avoided. This is also evident from Jensen (1995), reporting increasing weed emergence with increasing number of nightly soil cultivations. Whether light-shielded tillage equipment can serve for reliable reduction of the weediness of agricultural fields needs further trials (Ascard 1994, Gerhards et al. 1997, van der Weide et al. 2002). However, from our findings we have to conclude that an additional far-red or deep-red exposure during tillage operations is not promising. There is more evidence that germi-nation and emergence of weeds can be inhibited by reburial below 8 cm soil depth (Kasperbauer & Hunt 1988, Benvenuti et al. 2001).

5th EWRS Workshop on Physical Weed Control 77 Pisa, Italy, 11-13 March 2002
A fundamental limitation of the method of lightless tillage is heterogeneity and variability of the soil seedbank. Moreover, there are annual dormancy cycles in buried weed seeds, modified by climatic and mineral factors like temperature, humidity, nitrate and desiccation (Baskin & Baskin 1985, Hartmann et al. 1997, Vleeshouwers 1997). Recently it was demonstrated that the photo-sensitivity of seeds may reversibly change over eight orders of magnitude within one week (Hartmann & Mollwo 2000 a). This means that further refining of the method will depend on short-term predictions on the dormancy state of the weed seeds in the soil seedbank. For this purpose data on germination, seedlings growth and emergence of weeds in the field must be evaluated as a function of metereological and mineral data, to gain reliable model-based predictions on the photosensitivity state of buried weed seeds (Vleeshouwers 1997, Forcella 1998, Forcella et al. 2000, Grundy & Mead 2000).
Acknowledgements
Financial support by the “Deutsche Forschungsgemeinschaft“ and the “Universitätsbund Erlangen-Nürnberg“ is gratefully acknowledged.
References
ASCARD J (1990) Soil cultivation in darkness reduced weed emergence. Acta Horticulturae 372, 167-177. BASKIN JM & BASKIN CC (1979) Promotion of germination of Stellaria media seeds by light from a green
safe lamp. New Phytologist, 82, 381-383. BASKIN JM & BASKIN CC (1985) The annual dormancy cycle in buried weed seeds: a continuum.
Bioscience, 35, 492-498. BENVENUTI S, MACCHIA M & MIELE S (2001) Light, temperature and burial depth effects on Rumex
obtusifolius seed germination and emergence. Weed Research 41, 177-186. BUHLER DD (1997) Effects of tillage and light environment on emergence of 13 annual weeds. Weed
Technology 11, 496-501. BORTHWICK HA, HENDRICKS SB TOOLE EH & TOOLE VK (1954) Action of light on lettuce-seed
germination. Botanical Gazette 115, 205-225. FOGELBERG F (1999) Night-time soil cultivation and intra-row brush weeding for weed control in carrots
(Daucus carota L.). Biological Agriculture and Horticulture 17, 31-45. FORCELLA F (1998) Real-time assessment of seed dormancy and seedling growth for weed management.
Seed Science Research 8, 201-209. FORCELLA F, ARNOLD RLB, SANCHEZ R & GERSHA CM(2000) Modeling seedling emergence. Field Crops
Research 67, 123-139. FRANKLAND B & TAYLORSON R (1983) Light control of seed germination. In: Encyclopedia of Plant
Physiology, N.S. Vol. 16A, 428-456. Springer-Verlag, Berlin, Heidelberg, New York, Tokyo. GERHARDS R, KÜHBAUCH W & JUROSZEK P (1997) Tiefengrubber, Scheibenegge und zwei Krümelwalzen –
Lichtlose Bodenbearbeitung reduziert Unkrautwuchs. Forschung (DFG) 4, 14-16. GRUNDY AC & MEAD A (2000) Modeling weed emergence as a function of meteorological records. Weed
Science 48, 594-603. HARPLEY FW, STEWART GA & YOUNG PA (1973) Principles of biological assay. In: DELANOIS AL (ed)
Biostatistics in pharmacology, vol. 2, 971-1060. Pergamon, Oxford. HARTMANN KM (1977) Aktionsspektrometrie. In: HOPPE W, LOHMANN W, MARKL H, ZIEGLER H (Hrsg)
Biophysik, 197-222. Springer-Verlag, Berlin, Heidelberg, New York. HARTMANN KM (1983) Action spectroscopy. In: HOPPE W, LOHMANN W, MARKL H, ZIEGLER H (eds)
Biophysics, 115-144. Springer-Verlag, Berlin, Heidelberg, New York, Tokyo. HARTMANN KM & HAUPT W (1977) Photomorphogenese. In: HOPPE W, LOHMANN W, MARKL H, ZIEGLER
H (Hrsg) Biophysik, 449-468. Springer-Verlag, Berlin, Heidelberg, New York. HARTMANN KM & HAUPT W (1983) Photomorphogenesis. In: HOPPE W, LOHMANN W, MARKL H, ZIEGLER
H (eds) Biophysics, 542-559. Springer-Verlag, Berlin, Heidelberg, New York, Tokyo.

5th EWRS Workshop on Physical Weed Control 78 Pisa, Italy, 11-13 March 2002
HARTMANN KM & MOLLWO A (2000 a) Photocontrol of germination: sensitivity shift over eight decades within one week. Z. PflKrankh. PflSchutz, Sonderh. XVII, 125-131.
HARTMANN KM & MOLLWO A (2000 b) The action spectrum for maximal photosensitivity of germination.Natur-wissenschaften 87, 398-403.
HARTMANN KM & NEZADAL W (1990) Photocontrol of weeds without herbicides. Naturwissenschaften 77,158-163.
HARTMANN K, CROOSS C & MOLLWO A (1997) Phytochrome-mediated photocontrol of the germination of the scentless mayweed, Matricaria inodora L., and its sensitization by nitrate and temperature. J. Photochem. Photobiol. B40, 240-252 & B41, 255.
HARTMANN KM, MOLLWO A & TEBBE A (1998) Photocontrol of germination by moon- and starlight. Z.PflKrankh. PflSchutz, Sonderh. XVI, 119-127.
HAUPT W & HARTMANN KM (2000) Photobiologische Unkrautregulierung “Nachts geeggt ist halb gejätet”. Biologen heute 4, 6-7.
JENSEN PK (1995) Effect of light environment during soil disturbance on germination and emergence pattern of weeds. Ann. appl. Biol. 127, 561-571.
KASPERBAUER MJ & HUNT PG (1988) Biological and photometric measurements of light transmission through soils of various colors. Bot. Gaz. 149, 361-364.
LAGARIAS JC, KELLY JM, CYR KL & SMITH WO (1987) Comparative photochemical analysis of highly purified 124-kilodalton oat and rye phytochromes in vitro. Photochem. Photobiol. 46, 5-13.
MANCINELLI AL (1994) The physiology of phytochrome action. In: KENDRICK RE, KRONRNBERG GHM(eds) Photomorphogenesis in plants, 211-269. Kluwer, Dordrecht.
MILBERG P, ANDERSSON L & THOMSON K (2000) Large-seeded species are less dependent on light for germination than small-seeded ones. Seed Science Research 10, 99-104.
MOHR H & SCHOSER G (1959) Eine Interferenzfilter-Monochromatoranlage für photobiologische Zwecke. Planta 53, 1-17.
MOHR H & SCHOSER G (1960) Eine mit Xenonbögen ausgerüstete Interferenzfilter-Monochromatoranlage für kurzwellige sichtbare und langwellige ultraviolette Strahlung. Planta 55, 143-152.
NIEMANN P (1996) Unkrautbekämpfung durch Lichtausschluß während der Bodenbearbeitung. Z. PflKrankh. PflSchutz, Sonderh. XV, 315-324, 1996.
RADOSEVICH SR & HOLT JS (1984) Weed ecology. John Wiley and Sons, New York. RASCHKE K (1967) Eine Anlage zur monochromatischen Bestrahlung biologischer Objekte, ausgerüstet mit
Interferenz-filtern und einer elektronisch geregelten 2,5 kW-Xenonlampe. Planta 75, 55-72. SCHÄFER E, FUKSHANSKY L & SHROPSHIRE WJR (1983) Action spectroscopy of photoreversible pigment
systems. In: SHROPSHIRE WJR, MOHR H (eds) Encyclopedia of plant physiology, NS Vol. 16A, 39-68. SCOPEL AL, BALLARÉ SR & RADOSEVICH SR (1994) Photostimulation of seed germination during soil
tillage. New Phytologist 126, 145-152. SEYFRIED M & SCHÄFER E (1985) Action spectra of phytochrome in vivo. Photochem. Photobiol. 42, 319-
326. SHINOMURA TA, NAGATANI H, HANZAWA M, KUBOTA M, WATANABE M & FURUYA M (1996) Action
spectra for phytochrome A- and B-specific photoinduction of seed germination in Arabidopsis thaliana. Proc. Natl. Acad. Sci. USA 93, 8129-8133.
SMITH H (1995) Physiological and ecological function within the phytochrome family. Ann. Rev. Plant Physiol. Plant Mol. Biol. 46, 289-315.
VANDERWEIDE RY, BLEEKER PO & LOTZ LAP (2002) Simple innovations to improve the effect of the false seedbed technique. In:Proc. 5th EWRS Workshop on Physical Weed Control, Pisa, Italy, 11-13 March, 3-5.
VLEESHOUWERS LM (1997) Modelling the effect of temperature, soil penetration resistance, burial depth and seed weight on preemergence growth of weeds. Ann. Bot. 79, 553-563.

5th EWRS Workshop on Physical Weed Control 79 Pisa, Italy, 11-13 March 2002
A degree-day model of Cirsium arvense predicting shoot emergence from root buds
R. K. Jensen, D. Archer1 & F. Forcella1
Department of Crop Protection, Danish Institute of Agricultural Sciences, DK-4200 Slagelse, Denmark, [email protected], 1North Central Soil Conservation Research
Laboratory, USDA-ARS, Morris, MN 56267, USA.
Abstract
Reliable predictions of weed emergence can be very important in optimizing the timing of management operations. Most Canada thistle shoots arise from adventitious root buds, and because many shoots may be interconnected through the perennial root system, the species has an extremely high regenerative capacity. It is well known that one of the critical periods for perennial weed management is in the very early stages of shoot emergence, and information on shoot emergence and early-season growth of Canada thistle is very important in relation to timely and effective control. For this reason, Donald (2000) collected shoot emergence data in the field for Canada thistle in North Dakota. A logistic regression model was developed relating emergence to thermal time, based on air temperature accumulated from April 1.
The objective of this study was to generalize the model described by Donald (2000) to predict emergence of Canada thistle in other locations. In modeling annual weed phenology, Forcella et al. (2000) showed that soil temperature is one of the main environmental factors affecting seedling emergence. Consequently, the second objective of this analysis was to determine whether soil temperature, instead of air temperature would improve predictions of shoot emergence. Cumulative shoot emergence data from Donald’s (2000) figures were digitized. These data were recorded during 1987 and 1989 in field experiments at the research farm of North Dakota State University in Fargo. Climate data for the same years and from the same site were obtained to convert temperature into growing degree-days. Additionally, four field experiments were conducted in 2001, 20 km from the Research Centre Flakkebjerg at the Danish Institute of Agricultural Sciences. The field had a natural and long-term infestation of Canada thistle and the experiments consisted of four cropping systems. All the cropping systems contained subplots with and without under-sown pasture species. However, because neither the cropping systems nor the sub-treatments had any effect on thistle phenology, they were not considered further in the analyses. Thermal time (cumulative growing degree-days GDD) were calculated and accumulated with a base temperature of 0 C.
The logistic model based on the shoot emergence data from North Dakota slightly underestimated the shoot emergence of the Danish data. However, it was found that the date of seedbed preparation was a better starting date for accumulating thermal time in tillage systems. Changing the date of initial heat accumulation gave the relationship of shoot emergence and thermal time of all three data sets a more uniform appearance. Although the logistic function gave a good estimation, a Weibull function gave a better fit especially at the low emergence levels. Further, a Weibull function based on cumulative soil thermal time explained more variation (r2=0.96) than the same model using accumulated air temperature.

5th EWRS Workshop on Physical Weed Control 80 Pisa, Italy, 11-13 March 2002
The Weibull function model predicting shoot emergence based on accumulated soil temperature from seedbed preparation was:
Y = 1(1-exp(-(4.3219(GDD)2.9638)))
The model is based on data sets that transcend time and continents, capturing much of the variation in shoot emergence and is for that reason expected to be robust.
However, the model can only predict shoot emergence and not development stages. Further, the model is only based on shoot emergence data from well-established stands of Canada thistle. To optimize the timing and effect of mechanical treatments the model should be based upon shoot emergence and development through time from establishment or from the last control operation. In addition, the model also should be able to predict plant height, plant number and development stages successfully.
Reference
DONALD WW (2000) A degree-day model of Cirsium arvense shoot emergence from adventitious root buds in spring. Weed Science 48, 333-341.
FORCELLA F, ARNOLD RLB, SANCHEZ R & GERSHA CM (2000) Modeling seedling emergence. Field Crops Research 67, 123-139.

5th EWRS Workshop on Physical Weed Control 81 Pisa, Italy, 11-13 March 2002
Weediness in 40- year period without herbicide
L. Zarina Priekuli Plant Breeding Station, LV-4126, Cesis, Latvia
E-mail: [email protected]
Abstract
The competitive struggle between weeds and the crop plant takes place under very unequal conditions. As wild plants, weeds generally have the advantage over cultivated plants through their greater vitality and their usually lower demands on growth factors. Weeds with branched, vigorousroot systems make nutrient deprivation. Additional fertilizer, intended as compensation for nutrients, is lost to the crop. If the farmer does not interfere in favour of the disadvantaged crop plant, the struggle is often very quickly decided, and bad harvest or even ploughing under there is the result.
The most simple weeds control is by using of accordant herbicide, but apropos of increasing of interest in organic farming there are interest in mechanical and biological weed management to increase. To give answers on the questions- it is possible to provide economically based crops yields without herbicide? How big is the role of crop rotation? - analyse of results of long term crop rotations experiments were provided.
The experiment is located in Priekuli (57o19'N, 25o20'E) on a soddy podzolic light loam with the following characteristics in the year of establishing (1958): organic matter content 2.1 %, soil pHHCl 5.8 to 6.1, P2O5 80-100 mg kg-1, and K2O 100-120 mg kg-1. The normal mean temperature varies from -6.2 0C in January to 16.7 0C in July. The mean annual rainfall is 691 mm.
The experiment included five different crop rotations: 1. barley- potato- barley or oat; 2. barley-clover/grass-rye- potato; 3. barley- clover/grass- barley- rye- barley- potato; 4.barley- clover/grass- potato; 5.barley -clover/grass- clover/grass- rye- barley- potato.
Five different fertilisation treatments are compared with the crop rotations as sub-plots within each fertiliser treatment: 1. unfertilised; 2. farmyard manure, 10 t ha-1 till 1980 and 20 t ha-1 from 1981 (incorporated in soil in autumn before potato; 3. 66 kg N, 90 kg P, 135 kg K ha-1 ; 4. farmyard manure, 20 tha-1 plus 66 kg N, 90 kg P, 135 kg K ha-1 ;5. 130 kg N, 180 kg P, 270 kg K ha-1
In 1959, 22 tha-1 of spring lime was given. Measurements of soil nutrient content and of crop yield were performed every year. No pesticides were used.
During 40-years period, the influence on weediness of field was fixed. The most prevalent weeds were: Chenopodium album, Galeopsis tetrahit, Spergula arvensis, Stellaria media, Matricaria inodora, Centaurea cyanus, Viola arvensis, Taraxacum officinalis, Cirsium arvensis.
The best crop rotation for providing of economically based crop yields are crop rotations with including of clover of 25-30%.

5th EWRS Workshop on Physical Weed Control 82 Pisa, Italy, 11-13 March 2002
Inter- and intra-row mechanical weed control

5th EWRS Workshop on Physical Weed Control 83 Pisa, Italy, 11-13 March 2002
Relationship between speed, soil movement into the cereal row and intra-row weed control efficacy by weed harrowing
A. Cirujeda1, B. Melander2, K. Rasmussen2, I. A. Rasmussen2
1 Departament d’Hortofructicultura, Botànica i Jardineria; Universitat de Lleida; Avda. Alcalde Rovira Roure 177; 25198 Lleida-Spain
2 Department of Crop Protection, Danish Institute for Agriculturl Sciences, Research Centre Flakkebjerg; DK-4200 Slagelse-Denmark
Abstract
Field trials were conducted at one Danish and two Spanish locations. Winter wheat was sown at 24 cm spacing in Denmark allowing hoeing in the inter-row area. Hoeing speeds of 2, 5 and 8 km h-
1 were tested at the end of tillering stage, at the beginning of crop elongation and at both times. Harrowing was conducted immediately afterwards at the same speed. In the Spanish locations, only harrowing was conducted in winter barley sown at a row distance of 12 cm at pre-emergence + post-emergence and post-emergence alone at mid of tillering at 2, 4, 6 and 8 km h-1. The depth of the soil layer thrown into the cereal row was measured. This layer ranged between 0.4 and 1.4 cm depending on the site and on the treatment but was generally higher with a single treatment at all sites. A soil layer increasing with higher speed was found only in the Danish location when a single treatment was conducted at crop stage 22-24. Comparing soil types, in a more sandy soil and in a soil rolled prior to treatment, less soil was thrown into the cereal row. When two hoe + harrowing treatments were conducted, a finer soil structure was achieved. However, this did not affect the weed control. In the Danish location, initial intra-row efficacy based on plant number 7 days after treatment was found low (20-40%) but increased up to 70-80% when assessed after 45 days. Burial together with plant competition probably supressed weed plant growth and enhanced final mortality. In the Spanish locations, efficacy ranged also between 70-80%.
A thicker soil layer did not result in a higher efficacy. It was, thus, supposed that burial alone could not be the main factor responsible for weed control in any of the studied cases. Despite of the irregularity, the soil thickness thrown into the row was found to be a useful parameter for comparing the thickness of the soil layer on plants between different locations, but was found not appropriate to predict the weed control efficacy.
Introduction
A lot of work has been done since the 50’s on weed control by harrowing. Several studies have been conducted in Germany before the intensive use of herbicides (Habel 1954, Kees 1962, Koch 1964). The next big flush of research started in the late 80’s following the need of improving weed control methods alternative to herbicides for organic farming. Also the environmental concerns and the problems of herbicide resistance have enhanced these studies.
Field experiments have been conducted in order to find out the best timing, speed and implements (Rasmussen 1990, 1991, 1992, 1993; Böhrnsen 1993; Wilson et al. 1993; Rydberg 1993, 1994; Welsh et al. 1997). Simulations have been done recently in pot experiments in order to find out, which are the main factors causing mortality in plants with the aim of improving the control techniques (Cavers & Kane 1990; Jones et al. 1995, Jones & Blair, 1996; Baerveldt & Ascard 1999; Kurstjens et al. 2000; Kurstjens & Kropff 2001).
5th EWRS Workshop on Physical Weed Control 84 Pisa, Italy, 11-13 March 2002
Despite so much research, many aspects of mechanical weed control are still unclear or could be improved (Bàrberi et al., 2000; Kurstjens & Kropff, 2001). Regarding the weed control in cereals, low intra-row efficacy is known to be one of the weak points of weed harrowing, especially when the cereal plants have already reached the tillering stage (Rasmussen & Svenningsen, 1995). On the other hand, this is a strong point for the crop resistance towards mechanical weed control. Nevertheless, no studies on the processes occurring in the intra-row space have been published.
There is an interest for establishing experiments focusing on the processes occurring in the intra-row space in very different locations in order to adapt the mechanical weed control methods to each area. In Denmark and other Northern countries, the usually wet and cold autumn and winter makes harrowing difficult at this time (Koch 1964, Wilson et al., 1993). Treating the winter wheat in late autumn or winter can result in severe damage making recovery difficult and decreasing the yield (Rasmussen 1990, 1998). Often in spring, weeds germinated in autumn have grown large and are not well controlled by harrowing. Because of this, alternative methods are investigated, as e.g. increasing the row distance in order to be able to hoe. This method combined with weed harrowing has shown to improve the weed control efficacy (Melander et al., 2001). Still a weak point is the weed control in the cereal row, as it is in the row crops such as onions, carrots and sugar beet (Rasmussen & Ascard, 1995).
Also the influence of speed on the harrowing efficacy is not very clear. Rydberg (1994) and Rasmussen & Svenningsen (1995) tested different speeds in order to achieve different degrees of intensity in weed harrowing, reflecting the general opinion that the speed influences soil movement. Rydberg (1993), however, found that the reduction of weeds and of grain yield correlated much better with the degree of soil cover than with the driving speed. Concluding from other experiments, Rydberg (1994) described that increased driving speed caused more soil cover but only a limited increase in weed effect. He also found most of the weed efficacy was attained at 5 km h-1 so that higher speeds did not improve the weed control. Also Böhrnsen (1993) quotes the dependency of harrowing efficacy on the speed. And Rasmussen (1990) found it difficult to establish a relationship between speed and weed control.
Some confusion on the effect of covering and uprooting of the weeds exists in mechanical weed control, specifically in harrowing. While older works show that burial is the most important factor causing weed control (Habel 1954, Kees 1962 and Koch 1964), recent findings (Kurstjens etal. 2000, Kurstjens & Kropff 2001) show how the fraction of uprooted plants is important for the final weed control efficacy even in small plants.
Rasmussen (1996) also criticises that the quantification of the needed intensity of post-emergence harrowing is still a question of feeling. In the present work, a soil-based measure, the depth of the soil layer thrown into the row, was used to quantify the effect of weed harrowing on the weeds growing in the row and it was evaluated whether it would be a useful parameter for quantifying the post-emergence intensity. This objective measure also aims to relate the harrowing to the effect on the weeds as the visually measured crop cover proposed for predicting crop damage by Rasmussen (1990). The same author found a relationship between crop cover and weed control efficacy defined as selectivity (Rasmussen, 1990). In the present case, however, the measure is objective, aiming to allow comparisons between experiments and locations.
Baerveldt & Ascard (1999) also conclude from their laboratory coverage experiments that the exact depth of the soil layer on the plants needed for control will depend on the plant species, size of the plants and soil particle size. Any fieldwork related to the quantification of these parameters could contribute to improve the mechanical weed control methods.
5th EWRS Workshop on Physical Weed Control 85 Pisa, Italy, 11-13 March 2002
The objectives of this work were:
- To contribute to the study of intra-row processes occurring in mechanical weed control by measuring the depth of the soil layer in the row in an objective way and in one case also by weighing the soil aggregates after the treatments.
- To test the relationship between speed and efficacy in the cereal row at different locations with different soils and on weed species with different growth habits.
- To study the relationship between the thickness of the soil layer thrown into the row and the harrowing effect and to find out if this measure can be an objective physical measure for intra-row efficacy. This way, some new data would be added for discussion.
Materials and methods
Experiments were conducted at three locations: Flakkebjerg (Sealand, Denmark), Nalec and Baldomar (Catalonia, Spain). The Danish field belongs to the Flakkebjerg Research Station while both experiments in Spain were conducted on commercial fields. Four blocks with randomly distributed plots were established in Flakkebjerg and three in the Spanish experiments.
In Flakkebjerg, winter wheat cultivar Ritmo was grown at 24 cm row spacing, which is double the normal 12 cm row spacing, so that hoeing could be conducted in the inter-row area with a 16 cm wide hoe. The seed rate was the same as normally but as spacing was double, double wheat density was sown in the row. A post-emergence harrow treatment with a tine weed harrow trademark Rabewerk was conducted immediately after the hoeing at the same speed. The soil, which was thrown into the row, was the combined effect of these two implements. A post-emergence treatment was conducted in early April and a second treatment approximately two weeks later (Table 1). Some plots were treated one time only early, one time only later and others were treated at both times. The main weeds in Flakkebjerg were Brassica napus (rape sown out as weed the same day as the crop) and Stellaria media.
The wheat crop stage was mid tillering at the first treatment and starting pseudostem elongation at the second treatment, while the tap-rooted B. napus already had an erect stem and an average of 4 leaves both times, but started to flower in some cases at the second treatment. S. media had a diameter of 9 cm at the time of the first treatment and of 11.5 cm at the time of the second treatment. Before the first treatment mean of plant number was 77.1 B. napus plants m-2 and 28.6 S.media plants m-2. Before the second treatment, mean of weed number in all the plots was 64 B. napus plants m-2 and 31.4 S. media plants m-2.

5th EWRS Workshop on Physical Weed Control 86 Pisa, Italy, 11-13 March 2002
Table 1: Description of the experimental sites. Post-emergence harrowing was conducted once early, once later or both times in the Danish trial, whilst post-emergence alone and combined with pre-emergence was conducted in Spain.
Location and soil type
Treatmentdate
Cropgrowthstage
(BBCH)
Speed(km h-1) Plot size Treatments
Flakkebjerg(DK)
sandy loam
10/04/00 28/04/00
23-2430 2, 5, 8 2,5 m x 10 m
1. Post-emergence alone early 2. Post-emergence alone late 3. Post-emergence early + late
Nalec (E) silt loam
01/12/00 02/02/01 22-24 2, 4, 6, 8 3 m x 10 m
1. Post-emergence alone 2. Pre- + post-emergence 3. Rolling + pre- + post-
emergence Baldomar (E) loamy sand
15/11/00 13/02/01 22-24 2, 4, 6, 8 3 m x 10 m 1. Post-emergence alone
2. Pre- + post-emergence
Three pairs of flat wooden sticks measuring 3 x 0.3 x 32 cm marked the fixed measuring area at 1 m distance between two sticks in each plot at all three locations. They were placed inside the cereal row parallel to its direction. The soil level was marked on both sides of each stick before and immediately after harrowing. Measures were conducted in the early treated plots and in the twice treated plots. The sticks were placed deep enough to withstand the treatment without tilting. After removal, an average soil layer per measure was calculated. Twelve measures resulted per plot, summing to a total of 48 measures per treatment in Flakkebjerg and 36 measures per treatment in Spain.
Counts of alive plants were conducted in three 0.1 m2 frames 0.10 m wide and 1 m long per plot in the same measuring areas, where the soil thickness was determined. Assessments were done 7 and 45 days after the first treatment and 7 and 27 days after the second treatment. An untreated control plot and a herbicide-sprayed plot were included in each block. 7.5 g ha-1 a.i. tribenuron-methyl + 1.25 L ha-1 a.i. isoproturon were sprayed in autumn. In order to obtain more data on the relationship between the soil structure and the weed intra-row efficacy, an additional assessment was conducted in the Danish site after the hoe+harrow treatments. The 20 biggest soil aggregates found in a 0.2 x 0.2 m2 frame in the inter-row area were collected 6 days after the second treatment and weighed with a field balance.
In both experiments conducted in Spain winter barley cultivar Graphic was grown at the conventional row distance of 12 cm. A post-emergence harrowing was conducted in February as well as the combination of a pre-emergence harrowing with the post-emergence treatment. The used tine harrow was trademark Einböck and 3 m wide. In Nalec, the additional effect of a roll was studied. Following the traditional practice, the cereal was rolled few days after sowing allowing the seeds and seedlings to have a closer contact to the earth and preventing lack of moisture. Papaver rhoeas was the major and almost only weed species. Only the tap-rooted weeds namely P. rhoeasand B. napus were considered for comparisons between the three locations.
At treatment, the cereal was in early tillering stage at post-emergence treatment while the tap-rooted P. rhoeas was in rosette stage of 0.7 to 3 cm diameter. In both locations an untreated plot was included in each block and in Baldomar, a pre-emergence herbicide (trifluraline+linuron at 0.720 + 0.360 L a.i. ha-1 was sprayed in one plot of each block. Weed density and soil measures were recorded in the same way as in the Danish trial. In Nalec, counts were done 17, 45 and 66 days after

5th EWRS Workshop on Physical Weed Control 87 Pisa, Italy, 11-13 March 2002
treatment; in Baldomar, assessments were conducted 23 and 45 days after treatment. P. rhoeasdensity before the post-emergence treatment was around 260 plants m-2 in the untreated plots in Nalec and around 104 plants m-2 in the untreated plots in Baldomar.
Slow, middle and fast speed treatments were conducted at the three sites (Table 1). The speeds used were similar to the ones used in other experiments. Rasmussen (1992) used 4-7,5 km h-1,Wilson et al. (1993) used 8,2 km h-1, Kurstjens & Kropff (2001) used 5,4 up to 8,6 km h-1. Rydberg (1994) tested very aggressive speeds namely 5, 9 and 13 km h-1.
Efficacy was calculated comparing the plant number in each plot before and after harrowing for the counts: % Efficacy = (1- Ta/Tb)*100] where Tb is the infestation in the treated plot before treatment and Ta is the infestation in the treated plot afterwards .
The climatic conditions on the field sites during the experimental period are shown in Fig. 1. During the cropping season 432.6 mm rain was collected at Flakkebjerg, 372.2 mm at Baldomar and 262.0 mm at Nalec. The main difference between the Danish and the Spanish locations was the distribution of the rainfall, and a much higher evaporation in Spain, resulting in a more or less continuous moisture availability guaranteed only in Denmark. After a quite moist November and December for the local Spanish conditions, the rest of the winter and spring was dry. In Flakkebjerg, the spring was quite wet but this had no influence on the harrowing timings.
Figure 1. Monthly mean Temperature (line) in oC and monthly precipitation (column) in mm in the experimental sites during the cropping season at the experiment. A) Flakkebjerg (Sealand, Denmark). Data from the local climatic measuring station at 59.317o latitude, 11.417o longitude and 31.5 m altitude. B) Baldomar (La Noguera, Catalonia, Spain). Data from the nearby observatory in Vilanova de Meià located at 41.991º latitude, 1.022º longitude and 590 m altitude. C) Nalec (Urgell, Catalonia, Spain). Data from the nearby observatory in Tàrrega located at 41.668º latitude, 1.164º longitude and 420 m altitude. The horitzontal line indicates the cropping season.
0
10
20
30
40
50
60
S O N D J F M A M J J A
Tem
pera
ture
(oC
)
0
20
40
60
80
100
120
Prec
ipita
tion
(mm
)
A

5th EWRS Workshop on Physical Weed Control 88 Pisa, Italy, 11-13 March 2002
Figure 1 (continued)
0
10
20
30
40
50
60
S O N D J F M A M J J A
Tem
pera
ture
(oC
)
0
20
40
60
80
100
120
Prec
ipita
tion
(mm
)
B
0
10
20
30
40
50
60
S O N D J F M A M J J A
Tem
pera
ture
(oC
)
0
20
40
60
80
100
120
Prec
ipita
tion
(mm
)
C

5th EWRS Workshop on Physical Weed Control 89 Pisa, Italy, 11-13 March 2002
Data was subjected to an ANOVA-analysis using the SAS system (SAS, 1991). In the case of statistically significant differences found, means were separated using the Duncan’s test.
Results and discussion
Speed related to soil cover
Similar soil thickness ranging between 1 and 1.4 cm was thrown into the row in the Danish experiment and in Nalec; in these two locations the soil texture was similar, which could explain the similarity despite the different treatments in the two locations. Less soil was moved in the rolled experiment in Nalec and in the loamy-sand soil in Baldomar (0.4 to 0.8 cm) (Fig. 2a). In Flakkebjerg, less soil tended to be moved in the two-times than in the one-time treated plots. In Baldomar, a lower soil cover was found in the plots harrowed in pre- + post-emergence than harrowed in post-emergence only (P<0.05). In Nalec, less soil cover was found in the pre- + post-emergence harrowed plots using the roll than in the other two treatments (P<0.001).
Figure 2a. Soil layer (cm) thrown into the cereal row and efficacy in the three locations Baldomar, Flakkebjerg and Nalec for the different treatments. Efficacy for B. napus in the Danish location and for P. rhoeas in the Spanish sites after 45 days in all cases. Different letters refer to significant differences for the soil layer after the Duncan mean separation test (P<0.05). No differences were found for efficacy.
Probably, soil is thrown into the row in bigger earth pieces but in a more irregular way in the hoed plots, while harrowing has a more constant effect. By making an average of the soil cover on
����������������������������������������������������������������������������������������������������������������������������������
����������������������������������������������������������������������������������������������������
������������������������������������������������������������������������������������������������������������������������������������������������������������������������������������������������������������������
������������������������������������������������������������������������������������������������������������������������������������������������������������������������������������
����������������������������������������������������������������������������������������������������������������������������������������������������������������������������������������������
������������������������������������������������������������������������������������������������������������������������������������������������������
����������������������������������������������������������������������0
0.2
0.4
0.6
0.8
1
1.2
1.4
1.6
Postem. Pre- +Postem.
Postem. 2 timesPostem.
Postem. Pre- +Postem.
Roll + Pre- +Postem.
Soil
laye
r (cm
)
0
10
20
30
40
50
60
70
80
90
100
Effic
acy
(%)
������Soil layer Efficacy
cd
aab
de
ab
bc
e
Baldomar NalecFlakkebjerg
A
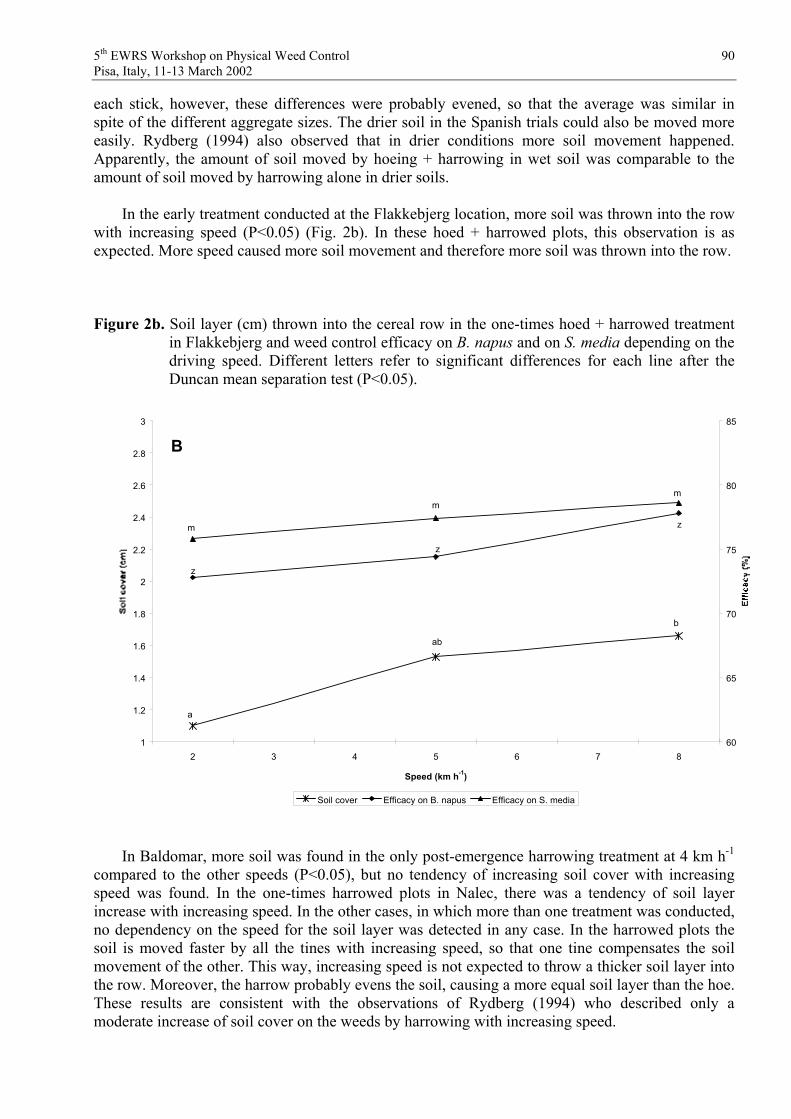
5th EWRS Workshop on Physical Weed Control 90 Pisa, Italy, 11-13 March 2002
each stick, however, these differences were probably evened, so that the average was similar in spite of the different aggregate sizes. The drier soil in the Spanish trials could also be moved more easily. Rydberg (1994) also observed that in drier conditions more soil movement happened. Apparently, the amount of soil moved by hoeing + harrowing in wet soil was comparable to the amount of soil moved by harrowing alone in drier soils.
In the early treatment conducted at the Flakkebjerg location, more soil was thrown into the row with increasing speed (P<0.05) (Fig. 2b). In these hoed + harrowed plots, this observation is as expected. More speed caused more soil movement and therefore more soil was thrown into the row.
Figure 2b. Soil layer (cm) thrown into the cereal row in the one-times hoed + harrowed treatment in Flakkebjerg and weed control efficacy on B. napus and on S. media depending on the driving speed. Different letters refer to significant differences for each line after the Duncan mean separation test (P<0.05).
In Baldomar, more soil was found in the only post-emergence harrowing treatment at 4 km h-1
compared to the other speeds (P<0.05), but no tendency of increasing soil cover with increasing speed was found. In the one-times harrowed plots in Nalec, there was a tendency of soil layer increase with increasing speed. In the other cases, in which more than one treatment was conducted, no dependency on the speed for the soil layer was detected in any case. In the harrowed plots the soil is moved faster by all the tines with increasing speed, so that one tine compensates the soil movement of the other. This way, increasing speed is not expected to throw a thicker soil layer into the row. Moreover, the harrow probably evens the soil, causing a more equal soil layer than the hoe. These results are consistent with the observations of Rydberg (1994) who described only a moderate increase of soil cover on the weeds by harrowing with increasing speed.
1
1.2
1.4
1.6
1.8
2
2.2
2.4
2.6
2.8
3
2 3 4 5 6 7 8
Speed (km h-1)
60
65
70
75
80
85
Soil cover Efficacy on B. napus Efficacy on S. media
B
a
ab
b
m
mm
z
z
z

5th EWRS Workshop on Physical Weed Control 91 Pisa, Italy, 11-13 March 2002
A second treatment did not enhance the relationship between speed and soil cover neither in the hoed + harrowed nor in the harrowed plots and tended to decrease the layer in all cases (Fig. 2a).
Speed related to intra-row efficacy
No increase in efficacy was observed with increasing speed in any case. Only in the post-emergence treatment in Baldomar there was a tendency of more efficacy in the 4 km h-1 treatment compared to the other tested speeds (data not shown). This was also the speed, which resulted in most soil cover. Differences between locations and between timing were also non-significant (Fig. 2a). Two-times treatments did not lead to higher control than one-time treatments. In the Spanish trials, the crop and P. rhoeas plants were less developed than the crop and B. napus in Denmark at the harrowing time. However, a very similar intra-row efficacy was obtained in the Spanish and in the Danish experiments ranging between 72 and 77% 45 days after treatment. (Fig. 2a).
This general lack of relationship is not consistent with the normal visual observation of the harrowing effect, which usually relate more speed to more efficacy (Rydberg 1994 and Rasmussen & Svenningsen 1995). Kurstjens et al. (2000) also found higher working speeds promoting uprooting in laboratory experiments with small seedlings. Anyway, Rasmussen (1990) did not find a clear relationship between forward speed and weed control, either. And Rydberg (1994) found most of the weed reduction already at 5 km h-1 compared to 9 and 13 km h-1, so that a speed increase did not have an important effect on efficacy.
A very similar behaviour was observed for B. napus and S. media control in the Danish trial for both treatments (Fig. 2b). Despite the different root system of the two species and the different growth habit (erect for B. napus and postrate for S. media) the plants in the row reacted in a very similar way. Again, speed did not have an influence on the efficacy (data not shown). The explanation could probably be that in both species burial was not the main mortality cause.
Figure 3. Efficacy on plant number (%) on B. napus and on S. media in Flakkebjerg 7 and 45 days after treatment. Different letters refer to significant differences after the Duncan means separation test (P<0.01).
0
10
20
30
40
50
60
70
80
90
100
Postem. T+7 Postem. T+45 2 timesPostem. T+7
2 timesPostem. T+27
Postem. T+7 Postem. T+45 2 timesPostem. T+7
2 timesPostem. T+27
Effic
acy
(%)
B. napus S. media
a
b
b
bb
aa
a

5th EWRS Workshop on Physical Weed Control 92 Pisa, Italy, 11-13 March 2002
Soil cover related to intra-row efficacy
No clear relationship between the soil cover and the intra-row efficacy was found for most of the experiments. Thus, higher soil cover did not lead to higher efficacy. The best relationship was found for the early treatment in the Danish trial (Fig. 2b). Again, the behaviour of both weed species studied in this location, B. napus and S. media was very similar. More control should have been expected for S. media than for B. napus as the first species is more easily covered than the second one. Nevertheless, as most of the plants were quite big, few S. media plants were completely covered so that partly covered plants probably survived. Additionally, S. media has a big regrowth capacity.
In the case of the Danish experiment, the hoe width left 4 cm of each side of the crop row untreated. Thus, in the measured 0.1m x 1 m space the main processes, which could be responsible for the weed mortality, were burial due to the soil thrown into the row by the hoe and the combined effect of burial and uprooting caused by the harrow. In the Spanish locations, the possible mortality factors were the combined effect of burial and uprooting caused by the harrow. Due to the lack of relationship found between the soil layer and the efficacy in the present experiments, the main mortality factor was probably the uprooting and removal of the plants, more than the burial, as found also by Kurstjens & Kropff (2001) with small seedlings. In fact, high amounts of S. mediaplants were found hanging on the harrow tines at the end of each pass, especially in the later treatment, as also observed by Wilson et al. (1993). This was not observed for the other two weed species.
In the experiments described by Bàrberi et al. (2000) the burial depth of the harrow tines adjusted to the different possible positions was measured. A deeper working depth of the tines, which probably also resulted in a higher coverage of crop and weeds by the loosened soil, did not clearly result in higher weed biomass reductions, either. Probably the main mortality cause in these experiments was not the burial of the weeds.
In the case of the tap-rooted plants, a low efficacy ranging between 20 and 40% was found for B. napus short time after treatment even in the two-times treatment (Fig. 3). In fact, few rape plants could be expected to be uprooted any more due to the advanced growth stage, so that main efficacy was probably due to burial or bending combined with burial. These observations are consistent with the findings of Kurstjens & Kropff (2001) who describe from their experiments that covering contributed less to mortality than uprooting assessed 6 days after treatment on small seedlings. In the present case, this efficacy, however, increased in field conditions up to high levels (Fig. 3). On one hand, some damaged plants could have finally died after some days. On the other hand, a possible explanation is that the crop had probably a higher competition ability after the first weed number reduction. Additionally, crop plant number was double as normal in the row, competing more than normal with the surviving weeds.
Also Kurstjens & Kropff (2001) state that plant species, growth stage and soil and weather conditions after harrowing may influence the impact of burying and uprooting on the final effectiveness of harrowing, as it was observed in the present experiment.
In pot experiments, Baerveldt and Ascard (1999) found that 1.5 cm tall tap-rooted S. albaplants were able to grow through a soil layer of up to 3 cm. In the present experiments, B. napus was only partially covered due to its big size and soil thickness was between 0.6 and 1.6 cm approximately, so that no important mortality could be expected by burial alone.

5th EWRS Workshop on Physical Weed Control 93 Pisa, Italy, 11-13 March 2002
In Spanish conditions, high efficacy was found already in the earliest counts (data not shown) probably due to the smaller size of both crop and weed plants at the treatment. So, on one hand, harrow tines could better enter the row in the Spanish experiments and on the other hand, weeds were smaller and plants could better be uprooted. In the Spanish trials, no increase in efficacy was observed with increasing soil cover, probably because burial was not the main mortality cause, either. Our results are consistent with Jones & Blair (1996) who found in pot experiments that P. rhoeas is susceptible to both uprooting and burial, but mainly to uprooting, regardless of the tested moisture conditions. The case of P. rhoeas in rosette stadium was more comparable to Matricaria inodora in the experiments conducted by Baerveldt and Ascard (1999) than to B. napus in the present experiment. These authors found no survival for plants covered by a 3 cm soil layer but 45% survival with the 2 cm layer when M. inodora was 1 to 2 cm high (comparable to P. rhoeas inthe present experiment). The soil thickness found in the present experiment was between 0.6 and 0.8 cm, so that survival had to be expected. These data support the idea that uprooting or at least the combination of burial and uprooting was the main mortality factor for P. rhoeas in the present experiment.
At the Spanish locations, natural weed mortality affected the harrow efficacy. The main natural plant number decrease, however, occurred after the harrow had already caused its control effect. It probably contributed mainly to making the recovery process of damaged weeds more difficult. Table 2 shows the data of the percentage of mortality in the untreated control plots.
Table 2: Natural plant mortality (%) in the untreated plots in the Spanish experimental sites Nalec and Baldomar. Mean ± SD. DAT = days after treatment.
NalecDAT 17 45 66
Mortality 14.7±15.77 32.0±22.74 46.1±22.56 Baldomar
DAT 23 45 Mortality 3.6±4.5 36.5±8.49
More rainfall in Baldomar (Fig. 1) was also reflected in less plant mortality compared to Nalec. If included in the efficacy calculations, this mortality would have decreased efficacy in time, the opposite of the behaviour observed in Denmark. The explanation could be that competition probably affected mainly smaller plants, present in the untreated plots. Less and probably mainly larger plants survived in the harrowed plots, so that less mortality was recorded among them.

5th EWRS Workshop on Physical Weed Control 94 Pisa, Italy, 11-13 March 2002
Description of the soil structure after treatment
At the Danish site, different-sized aggregates were found in the inter-row space after the treatments (Fig. 4). The soil weight was measured in the inter-row space, but it represents the soil, which was thrown into the row, so that it was considered that its size could have a relationship with the processes occurring in the intra-row space.
Although the early treatment was conducted in a wetter situation than the later treatment, the size of the aggregates was very similar (Fig. 4). Statistically significant differences were found between the two-times treated plots and the other plots (P<0.001). The smaller-sized soil aggregates can cover weed and crop plants in a more homogeneous and effective way. The tendency of the wheat biomass reduction in the two-times treated plots commented previously could be explained this way. Also Baerveldt & Ascard (1999) found in laboratory experiments that finer particle sizes had a bigger control effect after covering the plants.
Figure 4. Weight of the 20 biggest soil aggregates found in 0.2 x 0.2 m frames collected between the rows. A hoe+harrow treatment was conducted in early April, in late April or both times. LSD=Least signifficant difference with P<0.01.
Increasing speed reduced the aggregate size, especially the 8 km h-1 treatment (P<0.001). In spite of this, a much finer soil aggregate size was achieved with the two-times treatment than with a high speed in a single-treated plot. Referring to the weeds finer soil was not related to higher efficacy on weed number (Fig. 2a).
0
50
100
150
200
250
300
350
400
450
2 3 4 5 6 7 8
Speed (km h-1)
Wei
ght o
f the
20
bigg
est a
ggre
gate
s (g
)
early late both
LSD = 36.1

5th EWRS Workshop on Physical Weed Control 95 Pisa, Italy, 11-13 March 2002
Conclusions
Soil layers between 0.4 and 1.4 cm were found in the different sites. Speed was related to the soil layer in the one-time hoed + harrowed treatment, only, but not to the weed control efficacy. Two-times harrowing or two-times hoeing + harrowing resulted in smaller soil layers but not in lower efficacy. Two times hoeing + harrowing reduced the aggregate size but did not improve efficacy, either. The main weed mortality factor was, thus, not caused by burial.
In spite of the irregularity, the soil thickness thrown into the row was found to be a useful parameter for comparing the thickness of the soil layer on plants between different locations, but was found not appropriate to predict the weed control efficacy.
The present work confirms the opinion of Wilson et al. (1993) and Welsh et al. (1997) that tap-rooted weeds are better controlled at early growth stages, as in the Spanish trials P. rhoeas was better controlled in February than B. napus in Denmark in April. However, it was found that additional mortality of B. napus by crop competition increased the final efficacy up to the same levels as obtained for P. rhoeas.
Acknowledgements
The authors thank the technicians in Flakkebjerg: Henrik Grøndal, Trine S. Nielsen, Helle Petersen, Christian and others in the Danish experiments who assisted in the field even in rainy and cold conditions and Antonio Roque in the Spanish experiments. Alicia Cirujeda thanks the Spanish Ministry of Education and Sciences for the FPU grant, which allowed and supported economically this exchange.
References
BAERVELDT S & ASCARD J (1999) Effect of soil cover on weeds. Biological Agriculture and Horticulture 17, 101-111.
BÀRBERI P, SILVESTRI N, PERUZZI A & RAFFAELLI A (2000) Finger-harrowing of durum wheat under different tillage systems. Biological Agriculture and Horticulture 17, 285-303.
BÖHRNSEN A (1993) Several years results about mechanical weeding in cereals. In: Proceedings of the 4th International IFOAM Conference. Non-chemical weed control, Dijon, France, 93-99.
CAVERS PB & KANE M (1990) Responses of proso millet (Panicum miliaceum) seedlings to mechanical damage and/or drought treatments. Weed Technology 4, 425-432.
HABEL W (1954) Über die Wirkungsweise der Eggen gegen Samenunkräuter sowie die Empfindlichkeit der Unkrautarten und ihrer Altersstadien gegen den Eggvorgang. PhD Thesis, Landwirtschaftliche Universität Hohenheim, Germany.
JONES PA, BLAIR AM & ORSON JH (1995) The effect of different types of physical damage to four weed species. In: Proceedings 1995 Brighton Crop Protection Conference - Weeds,Brighton, United Kingdom, 653-658.
JONES PA & BLAIR AM (1996) Mechanical damage to kill weeds. In: Second International Weed Control Congress, Copenhagen, Denmark, 949-954.
KEES H (1962) Untersuchungen zur Unkrautbekämpfung durch Netzegge und Stoppelbearbeitungsmassnahmen unter besonderer Berücksichtigung des leichten Bodens. PhD Thesis, Landwirtschaftliche Universität Hohenheim, Germany.

5th EWRS Workshop on Physical Weed Control 96 Pisa, Italy, 11-13 March 2002
KOCH W (1964) Unkrautbekämpfung durch Eggen, Hacken und Meisseln im Getreide. I Wirkungsweise und Einsatzpunkt von Egge, Hacke und Bodenmeissel. Zeitschrift für Acker- und Pflanzenbau 120, 369-382.
KURSTJENS DAG, PERDOCK UD & GOENSE D (2000) Selective uprooting by weed harrowing on sandy soils. Weed Research 40, 431-447.
KURSTJENS DAG & KROPFF MJ (2001) The impact of uprooting and soil-covering on the effectiveness of weed harrowing. Weed Research 41, 211-228.
LACASTA C, GARCIA MURIEDAS G, ESTALRICH E & MECO R. (1997) Control mecánico de adventicias en cultivos herbáceos del secano. Congreso 1997 de la Sociedad Española de Malherbología, 37-40
MELANDER B, RASMUSSEN, K, RASMUSSEN, IA & JØRGENSEN MH (2001) Radrensning med og uden ukrudtsharvning i vintersæd om foråret i samspil med forkellige dyrkningsfaktorer. In: 18. Danske Planteværnskonference 2001, DJF-rapport 40, 211-225.
RASMUSSEN J (1990) Selectivity – an important parameter on establishing the optimum harrowing technique for weed control in growing cereals. In: Proceedings of the EWRS Symposium 1990, Integrated Weed Management in Cereals, 197-204.
RASMUSSEN J (1991) Optimising the intensity of harrowing for mechanical weed control in winter wheat. In: Proceedings 1991 Brighton Crop Protection Conference - Weeds, Brighton, United Kingdom, 177-184.
RASMUSSEN J (1992) Testing harrows for mechanical control of annual weeds in agricultural crops. Weed Research 32, 267-274.
RASMUSSEN J (1993) Can high densities of competitive weeds be controlled efficiently by harrowing or hoeing in agricultural crops? In: Proceedings of the 4th International IFOAM Conference. Non-chemical weed control, Dijon, France, 83-87.
RASMUSSEN J (1996) Mechanical weed management. In: Second International Weed Control Congress, Copenhagen, Denmark, 943-948.
RASMUSSEN J (1998) Weed harrowing in winter wheat. In: Proceedings 15th Dansk PlanteværnskonferenceUkrudt, 179-189.
RASMUSSEN J & ASCARD J (1995) Weed Control in Organic Farming Systems. In: Ecology and Integrated Farming Systems. Eds.: Glen DM, Greavers MP & Anderson HM, pp. 49-67. Wiley Publishers.
RASMUSSEN J & SVENNINGSEN T (1995) Selective weed harrowing in cereals. Biological Agriculture and Horticulture 12, 29-46.
RYDBERG T (1993) Weed harrowing-driving speed at different stages of development. SwedishJournal of Agricultural Research 23, 107-113.
RYDBERG T (1994) Weed harrowing - the influence of driving speed and driving direction on degree of soil covering and the growth of weed and crop plants. Biological Agriculture and Horticulture, Vol. 10, 197-205.
SAS Institute (1991) SAS Systems for linear models. SAS series in statistical applications.WELSH JP, BULSON HAJ, STOPES CE, FROUD-WILLIAMS RJ & MURDOCH AJ (1997)
Mechanical weed control in organic winter wheat. Aspects of Applied Biology 50, 375-384. WILSON BJ, WRIGHT KJ & BUTLER RC (1993) The effect of different frequencies of harrowing
in the autumn or spring on winter wheat and on the control of Stellaria media (L.) vill., Galiumaparine L. and Brassica napus L. Weed Research 33, 501-506.

5th EWRS Workshop on Physical Weed Control 97 Pisa, Italy, 11-13 March 2002
Experiences and experiments with new intra-row weeders
Piet Bleeker 1, Rommie van der Weide 1 and Dirk Kurstjens 21 Applied Plant Research P.O.Box 430, 8200 AK Lelystad, The Netherlands.
2 Wageningen University, Soil Technology Group, P.O. Box 43, 6700 AA Wageningen, The Netherlands.
Email: [email protected] , [email protected] and [email protected]
Introduction
The Dutch government aims at 10 % organic farming (area) in 2010. One of the problems is weed control special in the crop row. Several mechanisation companies in the Netherlands and Belgium have developed new equipment (different types of fingerweeders, a torsionweeder, a rotary weeder and a powered spike harrow) for weed control. In the Netherlands, a lot of new machinery is introduced. Researchers are asked to give an answer to the questions: What improvements are achievable using the new machinery as compared to the equipment presently used by farmers? In which crops and growth stages can the new equipment, are used?
Materials and methods
The first Dutch trials with fingerweeders and torsionweeders were done in planted leek and planted iceberg lettuce in 1998 and 1999. Every year each crop was grown and cultivated on two soil types (sand and clay). Two weeks after planting, the first time of weed control started with the harrow, the fingerweeder and the torsionweeder in combination with a hoe. In lettuce, weeding was performed one time and in leek two or three times. Weed control was assessed by counting weeds immediately before and after weeding at permanently marked areas. Crop plant numbers were counted and crop yield was assessed.
Research in onion and sugar beet started in 2000. The sugar beets were grown on sandy soil and the onions on clay soil. In 2001, these experiments were repeated and a trial with sugar beets on clay was carried out. In the trials with onions and sugar beets only intra-row, weeds were counted (in strips that were not disturbed by the hoe, with a width of 10 cm in sugar beets and 6 cm in onions).
Results
Weed control in planted crops such as leek and iceberg lettuce was improved by using the new machinery. In both crops, the fingerweeder yielded the best weed control and was selective for the crop too. On sandy soil, weed control was above 95 %. The torsionweeder gave a good result too. However, it was a little more aggressive and steering precision was critical. The harrow also showed possibilities but there is a risk of lettuce plants being uprooted when the soil and plant pots are dry. There were more possibilities with the new equipment in leek as compared to lettuce.
The trials in onions showed that there are possibilities in this crop too. The new equipment could be used from the second leave stage of the onions onwards. Two or three treatments could be carried out. In 2000, the onions emerged very quickly. The results of the trial were very hopeful.

5th EWRS Workshop on Physical Weed Control 98 Pisa, Italy, 11-13 March 2002
Intra-row weed control ranged from 36% until 71% (Table 2). Crop damage never resulted in yield losses above 10 %. The second year, half of the onions emerged quick and the other half after one week. In spite of this, weed control effects were good. However, plant loss and yield reduction was a little bit higher than in 2000.
The three sugar beets trials showed that, the new equipment provided possibilities from the 4-6 leave stage onwards. Intra-row weed control after two treatments ranged from 30% until 88% (Table 2). Loss of sugar beet plants ranged from 0 until 19 %. This plant reduction hardly affected crop yield.
Discussion
The trails in the different crops on different soil types demonstrated opportunities. In planted crops, there were more possibilities than in seeded crops. In planted crops, the crop plants have an advanced growth stage relative to the weeds. Trials made clear that when the weed plants are small they could be killed easily. When the weed plants are larger, it is more difficult. It is there where the new equipment can be an improvement. Further improvements should aim at increased selectivity or a wider range of environmental conditions in which the equipment can be successfully used.
Fingerweeders together with the torsionweeders proved to be more selective to especially broad-leaved crops than harrows. Another advantage of the fingerweeder is that it appears to move uprooted weed plants from the crop row. There are at this moment many different types: a small one (for a row distance from about 20 cm), the normal one (with rubber fingers) and the new ones from synthetic material of varying flexibility.
One of the problems of the fingerweeder was the effectivity on firm soil, as the fingers could not get into the soil. The new ones seemed to offer more possibilities, but additional tests are required.
Torsionweeders can been used in planted crops more effectively than in sown crops. In planted crops, tine tips can be crossed 5 cm without crop damage. Tines should be tilted about 30° backwards into the soil. In sown crops, it is very important that the tines are very precisely steered and in a young crop, the tine tips should be spaced a little. When heavy clay soils are dry, it is difficult to get the tines in the soil.
The rotor harrow can be used in many crops. It worked better on clay soils than on sandy soils. On sandy soils, the tines do not stir the soil enough. This tool was designed to work on heavy soils: the tines penetrate the soil better and weed and soil parts are being thrown out of the row. However, there is a higher probability of crop plant losses.
The powered harrow was especially developed for planted leek. The tines go through the crop row transversely. They could remove bigger weeds than the most other machinery. However, selectivity in other crops appeared to be lower, but more research is still needed.

5th EWRS Workshop on Physical Weed Control 99 Pisa, Italy, 11-13 March 2002
Table 1. Percentage weed control after using different machinery in iceberg lettuce and leek (PPO average of 1998 and 1999 in Horst (sand) and Lelystad (clay))
Iceberg lettuce Leek Clay Sand clay sand
hoeing and harrowing 73* 92 84 90 hoeing and fingerweeder 88 97 90 93 hoeing and torsionweeder 86 86 88 92 chemical 63 96 96 99
* In 1998, harrowing was impossible and only the hoe was used.
Table 2. Weed control results: % intra-row weed control in sugar beets (10- cm wide zone) and onions (6-cm wide zone)
sugar beet onion
2000 sand ` 2001 sand 2001 clay 2000 2001
hoeing + small fingerweeder 62 bc 47 b
hoeing + normal fingerweerder 64 b 65 bc 44 b 71 c 36 b
hoeing + fingerbrushweeder 35 c 46 b 54 b 55 b * 56 b
hoeing + torsionweeder 37 c 69 cd 32 b * 62 bc
hoeing+torsionw.+fingerweeder 41 c 88 de 38 b *
hoeing + powered harrow 45 b
hoeing + rotor harrow 48 bc 73 c 50 b
hoeing + harrow 38 c 3 a 63 bc
hoeing 0 a 0 a 0 a
Chemical 81 a 97 e 95 d 90 e 96 c
* = One weeding
Table 3. Percentage of crop plant reduction
sugar beet onion
2000 sand 2001 sand 2001 clay 2000 2001
hoeing + small fingerweeder 5.9 9.3
hoeing + normal fingerweerder 4.2 1.0 3.3 15.0 12.0
hoeing + fingerbrushweeder 3.5 0 1.4 6.8 * 8.2
hoeing + torsionweeder 2.3 2.8 5.6 * 19.6
hoeing+torsionw.+fingerweeder 5.7 5.0 3.2 *
hoeing + powered harrow 5.2
hoeing + rotor harrow 18.6 19.5 18.8
hoeing + harrow 3.5 0 0
hoeing 0 4.1 5.5
chemical 2.0 2.6 1.6 4.9 3.0
* = One weeding
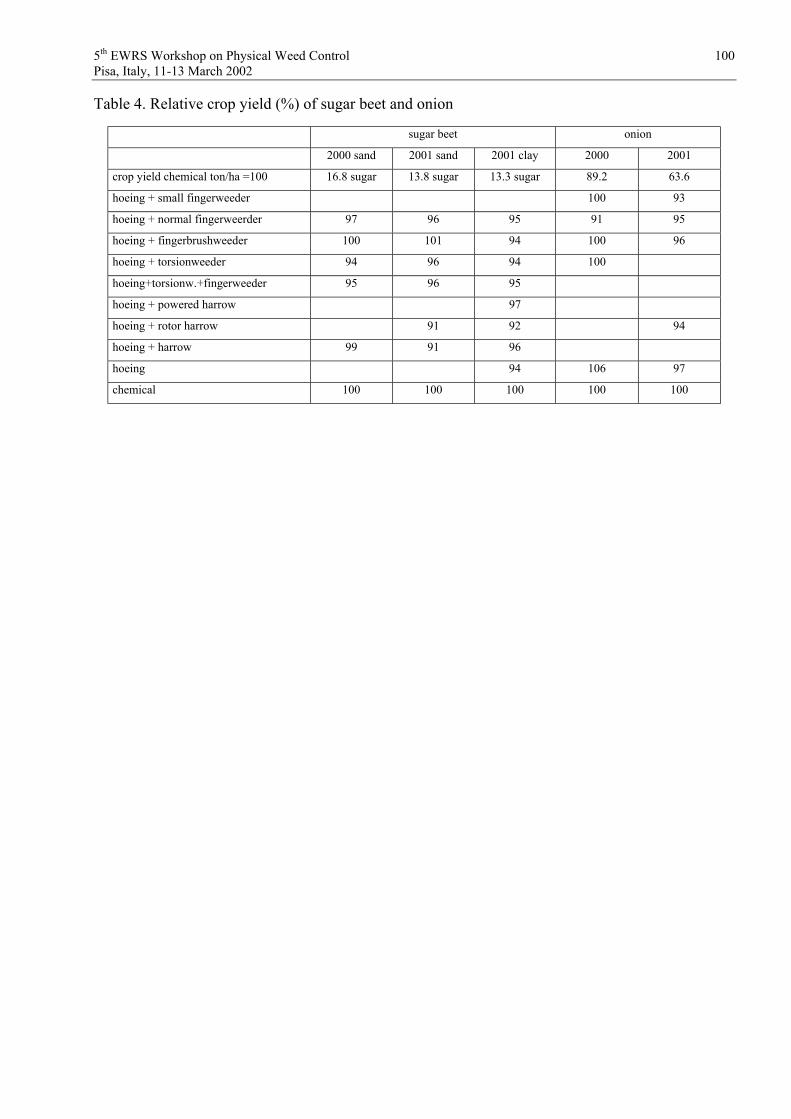
5th EWRS Workshop on Physical Weed Control 100 Pisa, Italy, 11-13 March 2002
Table 4. Relative crop yield (%) of sugar beet and onion
sugar beet onion
2000 sand 2001 sand 2001 clay 2000 2001
crop yield chemical ton/ha =100 16.8 sugar 13.8 sugar 13.3 sugar 89.2 63.6
hoeing + small fingerweeder 100 93
hoeing + normal fingerweerder 97 96 95 91 95
hoeing + fingerbrushweeder 100 101 94 100 96
hoeing + torsionweeder 94 96 94 100
hoeing+torsionw.+fingerweeder 95 96 95
hoeing + powered harrow 97
hoeing + rotor harrow 91 92 94
hoeing + harrow 99 91 96
hoeing 94 106 97
chemical 100 100 100 100 100

5th EWRS Workshop on Physical Weed Control 101 Pisa, Italy, 11-13 March 2002
An experimental study of lateral positional accuracy achieved during inter-row cultivation.
M C W Home1, N D Tillett1, T Hague1, R J Godwin2
1Silsoe Research Institute, Bedfordshire, England 2Cranfield University at Silsoe, Bedfordshire, England
Abstract
In order to ascertain the lateral positioning accuracy achieved during inter-row cultivation six different inter-row hoeing systems were evaluated. Systems tested included front and rear mounting, tractor driver guidance, second operator guidance and automatic computer vision guidance. Their performance was evaluated using an adaptable evaluation rig that enabled the true hoe path and forward speed to be recorded.
Analysis of the results has shown that an additional guidance system improves the lateral accuracy in hoeing operations and that an automatic vision guidance system provides the most accurate control giving a standard deviation of 9mm with a bias of –7 mm travelling at a speed of 6.5 kph. The vision guidance system also provides effective control at forward speeds of 11 kph, which offers the prospect of reducing costs by enabling more area to be covered in the number of workable days available.
The reliance on driver ability to achieve a good hoeing performance substantially reduced when a vision guidance system was used.
Establishment of lateral positioning data provides the opportunity to maximise weed kill and minimise crop damage by optimising inter-row cultivated width. In an example taken from our results, optimising the width of the hoe blade between the crop rows provided 13% extra weed kill.
Introduction
Up until half a century ago, inter-row weed control was carried out by hand and animal drawn implements. In motorised agriculture mechanical inter-row weed control was largely replaced by chemical weed control (Kouwenhoven,1994). However, in recent times, with a market demand for organic farming and a greater awareness of environmental damage caused by chemical application, there has been a shift back towards mechanical methods in a mechanised farming system.
Inter-row hoes operate between the crop rows and are generally effective against a wide range of weed species at a range of growth stages. Accurately guiding a mechanical inter-row hoe between crop rows demands high concentration as deviation from the centre-line results in crop damage, (Home et al 2001)
This experimental study compares some of the manual and automatic guidance techniques available for inter-row cultivation and establishes performance data in terms of lateral accuracy for best practice. We discuss how this information is essential to optimise implement configuration and how this might aid developments in intra-row weed control. The benefits that automatic guidance can offer are also discussed.

5th EWRS Workshop on Physical Weed Control 102 Pisa, Italy, 11-13 March 2002
Methods and materials
The experiments and experimental apparatus detailed in this paper were designed to record the true hoe path of mechanical inter-row hoes whilst operating under actual field conditions. To ascertain the lateral positioning of six hoeing systems an adaptable evaluation system was developed. Evaluation consisted of leaving a trace of dye on the ground to record the path taken by the hoe blades in normal operation. The position of that dye trace relative to the crop rows could then be measured manually.
The apparatus to deliver the dye trace is shown in Fig 1 mounted on a 4m inter-row hoe. The main components of the system are the pressure vessel containing vegetable dye, a solenoid valve and a control circuit.
Figure 1. Lateral position monitoring system fitted to an inter-row hoe
The evaluation of each hoe was undertaken on commercial crops, therefore a vegetable based dye trace was chosen to eliminate any harmful contamination.
The solenoid and jetting nozzle are mounted 200 mm directly behind a hoe tine and 60mm above the soil surface. The distance behind the hoe tine allows soil to settle after being hoed, thus leaving a visible dye trace on the surface. The dye is delivered to the nozzle at a pressure of 2 bar via the solenoid valve from the hand primed pressure vessel.
Activation of the system is by a remote radio link ensuring that the driver is unaware of precisely when monitoring is being undertaken, thus reducing the effect of unsustainable increases in concentration. Upon activating the control circuit, vegetable dye is pulsed from the jetting nozzle for 0.5 seconds per second. The dye pulses enable true forward speed to be calculated by measuring the length of dye trace on the ground. True hoe path is recorded by measuring the dye trace in

5th EWRS Workshop on Physical Weed Control 103 Pisa, Italy, 11-13 March 2002
relation to a number of crop rows using a template marked with the row crop spacing, a technique detailed by (Tillett et al.,1999).
Table 1 summarises the evaluations, in each case hoes were mounted to a traditional three-point linkage arrangement on the tractor. The 3 m fixed hoe (Run A) was the only hoe to be front mounted, all the others were mounted at the rear. All hoes except the 4m fixed hoe used in Run C and identified with an asterix in Table 1 had tight check chains to ensure the lower link arms did not move independently of the tractor, thus ensuring the hoe frame closely followed tractor position.
Table 1. Mechanical hoes under evaluation
Run Hoe type Steerage System
Operator (s) Mounting Crop Type
A 3m fixed hoe Tractor driver Professional Front Wheat B 9m steerage hoe Second operator Professionals Rear Sugar beet C 4m fixed hoe* Tractor driver Professional Rear Wheat D 4m steerage hoe Vision guidance Non-professional Rear Wheat E 4m fixed hoe Tractor driver Non-professional Rear Wheat F 4m steerage hoe Vision guidance Non-professional Rear Wheat
* Hoe mounted with slack check chains
Three out of the six evaluations relied entirely on the driver’s vision to guide the hoe accurately between crop rows. The other three trials involved steerage hoes that used a hydraulically operated lateral side shifting mechanism to make fine adjustments between a fixed frame on the tractor and a moving frame to which the hoe blades were attached.
Lateral movement of the 9m sugar beet steerage hoe (Run B) occurs through a second operator, who is located at one side of the hoe in a purpose built cabin, mounted onto the moving frame of the hoe. This second operator has a clear view of the crop rows ahead and controls a hydraulic orbital control valve. The control valve operates two hydraulic linear actuators that facilitate lateral movement between the fixed head stock and rear frame. A pointer mounted directly in front of the additional cab aids alignment with the crop rows. The tractor driver still has responsibility for aligning the tractor with the row, and the additional driver corrects/dampens any driver error resulting in hoe misalignment. Figure 2 shows the 9 m steerage hoe.
The remaining two trials (Runs D and E) used a vision guidance system developed at Silsoe Research Institute and now sold by Garford Farm Machinery under the name Robocrop. The hoe evaluated in this study used a pre-commercial system, as shown in Fig 3, but one that was very similar to the commercially available version. It consisted of two frames, the front frame was connected to the tractor via the 3-point linkage with check chains tight. Two flanged wheels mounted on the fixed frame provided further resistance to lateral movement. The rear frame was linked, via a parallel linkage, to the front frame allowing it +/- 15 cm of sideways movement controlled by hydraulic actuators. Single mounted spring tines with 13 cm wide A-blades were arranged to cultivate in between the winter wheat cereal rows at 22 cm spacing along the moving frame. A video camera was mounted on the moving frame inclined down at 45o such that it viewed five crop rows to one side of the tractor as illustrated in Fig 4. Images were passed at 25 Hz to a 200 MHZ Pentium PC and analysed to extract the lateral offset and heading angle of the camera with respect to all five crop rows. The analysis techniques employed (Tillett & Hague, 1999; Hague & Tillett 2001) were robust to moderate levels of missing crop and weed growth.

5th EWRS Workshop on Physical Weed Control 104 Pisa, Italy, 11-13 March 2002
Figure 2. 9m steerage hoe in sugar beet
Figure 3. Experimental vision guided cereal hoe

5th EWRS Workshop on Physical Weed Control 105 Pisa, Italy, 11-13 March 2002
Figure 4. View from vision guided hoe camera showing correctly located crop rows even in the presence of partial shadow in the image region.
With one exception all experimental runs were conducted at speeds regarded as appropriate for the crop and soil conditions present at the time of the trial. That exception was the vision guided run (Run F) conducted at 11 kph. This trial was conducted specifically to test previous experience suggesting vision guidance could perform without loss of accuracy at speeds in excess of normal cultivation limits or those that could be sustained manually for extended periods. The wheat crop chosen for this trial was hoed when the flag leaf was just visible [decimal code growth stage 37, (Tottman & Broad,1987)] and was sufficiently robust to withstand the amount of soil movement created at this elevated speed.
During each run a minimum sample size of 30 dye traces were recorded to ensure a representative measure of the lateral positioning. This was repeated several times across and throughout the field, to ensure the samples were random. All of the individual data sets from each run were collated, from which the standard deviation and bias were calculated.
Results
A summary of the results presented graphically in Fig 5 shows that in general it is not unreasonable to approximate the distribution of lateral errors to normal. Table 2 therefore characterises error distributions measured from each trial in terms of their mean errors and standard deviation about that mean.
Automatic vision guidance (Run D) provided the most accurate control with a standard deviation of 9 mm and a bias of –7mm operating at a speed 6.5 kph. The results also confirmed that vision guided performance was not greatly effected by speed as Run F at 11kph achieved very similar performance figures.
A direct comparison of Runs D and E (manual and vision guided 4m hoe at 6.5 kph) were undertaken with the same tractor, hoe and (non-professional) driver to ascertain differing lateral accuracy. The guidance system was locked centrally for the tractor driver guided run. Results show that vision guidance brought standard deviation down from 14 mm to 9 mm and bias down from –17 mm to –7 mm.

5th EWRS Workshop on Physical Weed Control 106 Pisa, Italy, 11-13 March 2002
-60 -40 -20 0 20 40 60Deviation (mm)
Rel
ativ
e Fr
eque
ncy
3m front mounted hoe at 4.5 kphRun A (Tractor Driver)9m Steerage hoe at 4.8 kphRun B (Second operator)4m fixed hoe at 5.1 kphRun C (Tractor Driver)4m steerage hoe at 6.5 kphRun D (Vision guidance)4 m fixed hoe at 6.5 kphRun E (Tractor driver)4m steerage hoe at 11 kphRun F (Vision guidance)
Figure 5. Lateral positioning accuracy of mechanical inter-row hoes
Table 2. Lateral positing accuracy results
Run Guidance Speed (kph)
Bias(mm)
StandardDeviation (sd)
Guidance error 95.4% (2 sd)
A Tractor driver (Front mounted ) 4.5 9 22 mm 44 mm B Second operator 4.8 -2 10 mm 20 mm C Tractor driver 5.1 7 11 mm 22 mm D* Vision guidance 6.5 -7 9 mm 18 mm E* Tractor driver 6.5 -17 14 mm 28 mm F* Vision guidance 11.0 -8 10 mm 20 mm
* Non –professional driver
Comparison between professional and non-professional drivers under manual guidance indicates, as might be expected, that the former out performed the later though performance was not as good as the vision guidance system, and was achieved at slower speeds. The front mounted hoe had the worst performance with a standard deviation of 22 mm. However, it would unreasonable to assume from one series of results that front mounted hoes have the worst lateral positioning. Further analysis of front mounted hoes would be required before further conclusions could be made.

5th EWRS Workshop on Physical Weed Control 107 Pisa, Italy, 11-13 March 2002
Discussion
The operators estimated hoeing speed was found to be slower than true measured hoeing speed. Each operator was asked to drive in their usual manner, but there is no way of judging whether they tried to excel by increasing concentration, or in fact they under performed due to the increased pressure they may have felt from being monitored. Remote monitoring via the radio link meant drivers were unaware exactly when they were being monitored and so it is hoped that performance was representative of normal hoeing conditions. Drivers were asked if they would feel comfortable operating at higher speeds and their replies were all the same in that increased speed would be to the detriment of the crop.
The vision guided hoe (Run F) enabled high speed hoeing (11 kph) to take place without loss of accuracy. One reason for this may have been that it was noticeable that there were fewer driving steerage corrections made at higher speeds. Such corrections are not measured by the control system and therefore represent a performance degrading disturbance. A reduction in these operator induced disturbances may balance negative factors such as the increased significance of control time delays as speed increases. Paarlberg et al (1998) reported that higher speed cultivation could improve the odds of timely completion of needed cultivation, and that faster speed did not impede weed control or yield in corn. If the pre-mentioned is accepted, then by increasing the forward speed of a 4m hoe from 6.5 kph to 11 kph changes the work-rate of the hoe from 1.95 ha/hr to 3.3 ha/hr respectively accounting for a field efficiency of 75%. Over an eight-hour day the high-speed hoe would cover an extra 10.8 hectares, thus substantially lowering the cost of that operation.
One of the major uncertainties relating to mechanical weed control is the number of workable days available. With timelines of operation being critical, high speed hoeing may be advantageous. In recent years the number of available workable days in the UK has reduced due to the wetter climate in autumn and spring, if this climatic change continues then high speed hoeing may well be a solution.
Melander and Hartvig in 1997 reported that inaccurate steering becomes much more important the closer the shares get to the crop, therefore hoeing close to the crop requires accurate and reliable steering of the hoe. The six evaluations undertaken have highlighted the variability in lateral hoe position and inherent positioning bias in the hoeing operation. Improving the lateral positioning accuracy of the hoes will enable the hoe blade width to be optimised, maximising weed kill by increasing cultivated area within the row, whilst keeping crop damage levels low.
The factors that affect blade optimisation, are illustrated in Fig 6, they are root zone clearance, guidance error and positioning bias. These three factors are critical when attempting to optimise the blade width.
The crop zone is left unhoed to ensure that minimal root damage occurs, which could result in reduced yield. Guidance error made up of bias and variability (represented in terms of standard deviation) result in a need to reduce blade width, therefore comparisons of different guidance techniques can be made by investigating the percentage increase in cultivated area between the crop by having improved lateral positioning of the hoe.

5th EWRS Workshop on Physical Weed Control 108 Pisa, Italy, 11-13 March 2002
Figure 6. Hoe blade optimisation
The generic formula below calculates the percentage hoed area accounting for the pre-mentioned variables. Hoe blade width has been calculated on the basis that variability in hoe blade position over the long term bias, is equal to twice the standard deviation. This ensures that 95.4% of the time no crop damage occurs.
100%
)]2([
CZRWHWareaHoed
VCZBRWHW
It should be noted that a direct comparison of the percentage hoed area can only be made if comparing two systems on the same crop spacing.
An example of the advantages that improved lateral positioning has on hoed area is calculated below.
Runs D and E are compared as all the variables were the same apart from the guidance of the hoe, run D having vision guidance and run E having no guidance.
Hoe Blade
HW
RW
KeyRW = Row widthHW = Hoe blade WidthCZ = Crop ZoneV = Error due to Variability
(V = 2 * S.D.)B = Error due to Bias
VVB
C Z
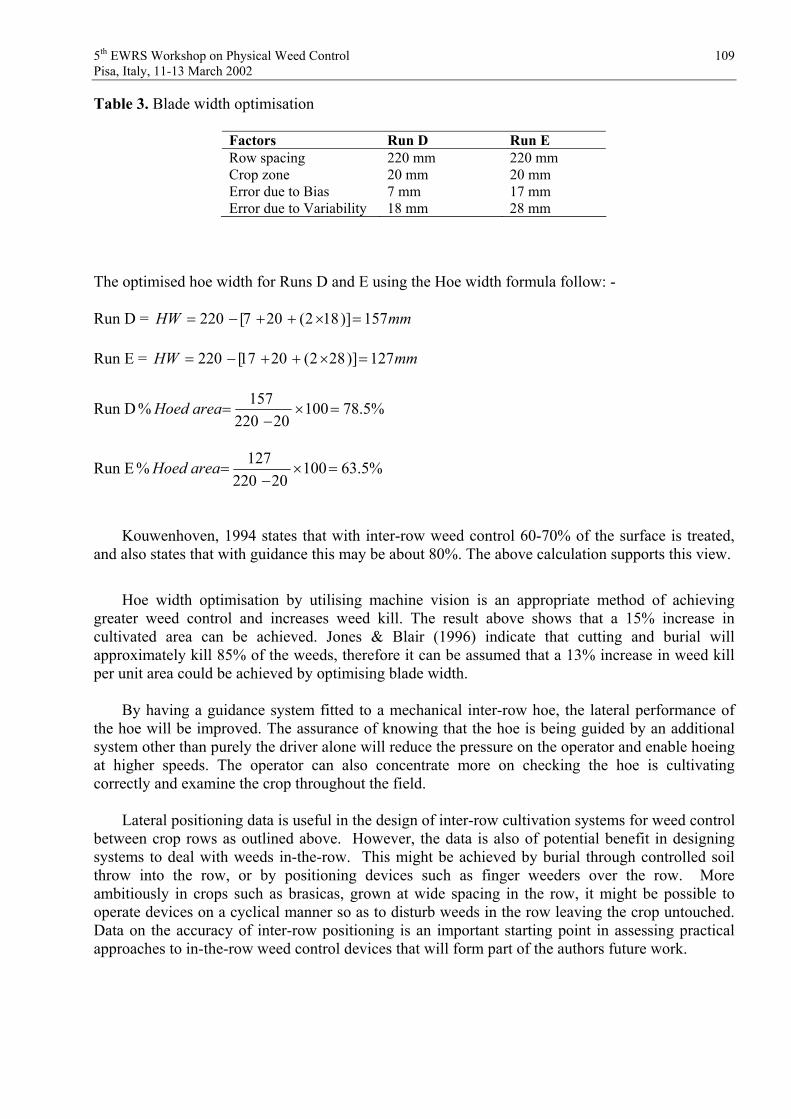
5th EWRS Workshop on Physical Weed Control 109 Pisa, Italy, 11-13 March 2002
Table 3. Blade width optimisation
Factors Run D Run E Row spacing 220 mm 220 mm Crop zone 20 mm 20 mm Error due to Bias 7 mm 17 mm Error due to Variability 18 mm 28 mm
The optimised hoe width for Runs D and E using the Hoe width formula follow: -
Run D = mmHW 157)]182(207[220
Run E = mmHW 127)]282(2017[220
Run D %5.7810020220
157% areaHoed
Run E %5.6310020220
127% areaHoed
Kouwenhoven, 1994 states that with inter-row weed control 60-70% of the surface is treated, and also states that with guidance this may be about 80%. The above calculation supports this view.
Hoe width optimisation by utilising machine vision is an appropriate method of achieving greater weed control and increases weed kill. The result above shows that a 15% increase in cultivated area can be achieved. Jones & Blair (1996) indicate that cutting and burial will approximately kill 85% of the weeds, therefore it can be assumed that a 13% increase in weed kill per unit area could be achieved by optimising blade width.
By having a guidance system fitted to a mechanical inter-row hoe, the lateral performance of the hoe will be improved. The assurance of knowing that the hoe is being guided by an additional system other than purely the driver alone will reduce the pressure on the operator and enable hoeing at higher speeds. The operator can also concentrate more on checking the hoe is cultivating correctly and examine the crop throughout the field.
Lateral positioning data is useful in the design of inter-row cultivation systems for weed control between crop rows as outlined above. However, the data is also of potential benefit in designing systems to deal with weeds in-the-row. This might be achieved by burial through controlled soil throw into the row, or by positioning devices such as finger weeders over the row. More ambitiously in crops such as brasicas, grown at wide spacing in the row, it might be possible to operate devices on a cyclical manner so as to disturb weeds in the row leaving the crop untouched. Data on the accuracy of inter-row positioning is an important starting point in assessing practical approaches to in-the-row weed control devices that will form part of the authors future work.

5th EWRS Workshop on Physical Weed Control 110 Pisa, Italy, 11-13 March 2002
Conclusions
Guidance systems for inter-row hoes whether using computer vision or an additional operator enabled improved accuracy compared to unguided hoes. Automatic vision guidance systems offer increased consistency of performance over long periods without operator fatigue, whilst maintaining high levels of accuracy. Driver ability affects lateral positioning of the hoe, but with vision guidance driver accuracy is not a key requirement. Greater forward speeds can be achieved with vision guidance providing accurate control that could not be achieved with conventional fixed inter-row hoes. Knowledge of achieved accuracy enables blade width to be optimised, increasing weed kill as the hoe can be safely guided closer to the crop. Lateral positioning data provides the essential information for the future development of an intra-row weeder.
Acknowledgements
We would like thank EPSRC and Douglas Bomford Trust for funding this work, Garford Farm Machinery and Robydome Electronics for equipment loan. We also acknowledge Mr R. Steele, Mr F Oldfield, Mr N. Watts for allowing field monitoring and the support of colleagues at Silsoe Research Institute and Cranfield University – Silsoe.
References
HAGUE, T. AND TILLETT, N. D. (2001) A bandpass filter approach to crop row location and tracking. Mechatronics 11(1), 1-12.
HOME M C W; TILLETT N D; GODWIN R J (2001). What lateral position accuracy is required for weed control by inter-row cultivation?, Proceedings of the BCPC Conference – Weeds 2001, 1: 325-328
JONES P.A.; BLAIR A.M. 1995 The effect of different types of physical damage to four weed species, Proceedings of British Crop Protection Conference – Weeds 1995
KOUWENHOVEN J K (1994), Some possibilities of Post-drilling mechanical weed control. Engineering for Reducing Pesticide Consumption & operator Hazards, Acta Horticulturae 372.
MELANDER B; HARTVIG P. (1997) Yield responses of weed free seeded onions [Allium cepa] to hoeing close to the row, Crop Protection 16: pp 687-691
PAARLBERG K R; HANNA H M; ERBACH D C; HARTZLER R G (1998). Cultivator Design for Interrow Weed Control in No-till Corn, American Society of Agricultural Engineers 14(4):353-361
TILLETT N D; HAGUE T; BLAIR A M; JONES P A; INGLE R; ORSON J H (1999), Precision inter-row weeding in winter wheat. Proceedings of the BCPC Conference – Weeds 1999, 2: 975-980
TILLETT N D; HAGUE T; (1999) Computer based hoe guidance for cereals – an initial trial, Journal of Agricultural Engineering Research 74 225-236
TOTTMAN D R; BROAD H (1987) Decimal code for the growth stage of cereals. The annals of Applied Biology 110 683-687

5th EWRS Workshop on Physical Weed Control 111 Pisa, Italy, 11-13 March 2002
Weed control by a rolling cultivator in potatoes
Karsten Rasmussen Danish Institute of Agricultural Sciences
Department of Crop Protection Research Centre Flakkebjerg, DK-4200 Slagelse Tlf.: + 45 5811 3399 Fax: + 45 5811 3301
E-mail: [email protected]
Abstract
A new project has been started in 2000 to optimise the efficiency of the rolling cultivator for weed control in potatoes. The objective is to minimise the number of treatments and the crop damage and to maximise the control effect on annual and perennial weeds. On a loamy soil, a tolerance (weed-free) and an efficiency experiment were conducted with 0, 2, 3 and 6 passes with the rolling cultivator. On a sandy soil, an efficiency experiment was conducted with 0, 1, 2 and 4 passes with the rolling cultivator and a herbicide treatment. The timing was approximately intervals of one week (pre-emerged weeds), two weeks (cotylodon-stage weeds) and three weeks (true-leaf-stage weeds) with the large intervals at the few passes. The effects on weed biomass of annual weeds were on both locations above 80%, even with one or two passes. The timing was adjusted to the weed size, but the efficiency seemed to be rather independent of the weed size. The efficiency was also independent of the species of the annual weeds. The perennial weeds Elymus repens L. and Cirsium arvense (L) Scop were less efficiently controlled, but still above a 50% reduction in weed biomass. Increasing the number of passes increased the efficiency to above 75%, but regrowth continued. The yield response was negative (-10 %) on the coarse sand soil and positive (+10 %) on the sandy loam soil compared with herbicides. The recommended speed is 10 to 12 km/h, which indicate a very high field capacity of the tool. The disadvantages are that it is difficult to adjust the implement without experience and that it hardly can keep the ridge size that is desirable.
Introduction
Focus on mechanical weed control in conventional potato production in Denmark has been intensified because of a general interest in reduction of the total use of pesticides. Potato is one of the most intensive sprayed agricultural crops in Denmark, mainly due to intensive spraying against potato late blight (Phytopthora infestans) and weeds. It has been decided to reduce the total number of sprayings by normal dosage per crop (‘Treatment Index’) in Denmark. Practical experiences indicate that mechanical weed control is an alternative to herbicide spraying, but few relevant experiments have been found in the literature.
In England, 3 years’ experiments with 1, 2 or 3 passes were conducted (Kilpatrick, 1995). One pass caused 59-87% reduction in weed biomass, two passes 85-87% reduction and three passes 70% reduction. The effects of herbicides were above 87%. The yield response depended on the weed pressure i.e. at a low weed pressure weed control reduced the yield, and at high weed pressures the yield increased. There were no major differences between yield response to chemical and mechanical weed control.
In two years with low weed pressure, experiments in the USA showed similar effects on weed biomass and yield of herbicides and ridging plus two times cultivation by a rolling cultivator

5th EWRS Workshop on Physical Weed Control 112 Pisa, Italy, 11-13 March 2002
(Eberlein et al., 1997). In a third year with high weed pressure, the effect of mechanical weed control (61%) was lower than the effect of herbicides (99%). This year the yield in mechanical controlled plots was reduced by 12% compared with herbicide controlled plots, but the difference was not significant.
In Schweitzerland, experience showed a 6% higher yield by three treatments with rolling cultivation compared to herbicides (Irla, 1995). Weeds were not measured, but the economy was significantly improved by the mechanical strategy.
The general impression is that, at moderate weed pressures weeds could be controlled as efficiently by rolling cultivators as by herbicides, without yield reductions. At high weed pressures, efficient mechanical weed control was more difficult, and a reduction in yield was seen due to crop damage or competition from surviving weeds was seen.
To gain more experience it was decided to start field experiments in Denmark with the objective of developing cost-effective strategies for non-chemical weed control in potatoes. The aim is to minimise the number of treatments and the crop damage and to maximise the control effect on annual and perennial weeds by the right timing. The experiments continue in 2002.
Material & methods
Experiments were conducted on sandy loam (Research Centre Flakkebjerg) without irrigation and one on coarse sand soil (Jyndevad Experimental Station) with irrigation in 2001. On the loamy soil a tolerance (weed free) and an efficiency experiment were conducted with 0, 2, 3 and 6 passes with the rolling cultivator. On the sandy soil, an efficiency experiment was conducted with 0, 1, 2 and 4 passes with the rolling cultivator and a herbicide treatment. Dates of treatments are seen in Table I. The timing was approximately intervals of one week (pre-emerged weeds), two weeks (cotylodon-stage weeds) and three weeks (true-leaf-stage weeds) with the large intervals at the few passes. The parcels in Flakkebjerg were 25 m long with two rows and 1.5 m bare soil between parcels – 15 m of two rows was harvested. The parcels in Jyndevad were 21 m long with four rows - 16.7 m of two rows was harvested. Row distance was 75 cm, and there were four replications at both locations. The rolling cultivator or Lelliston rotary weeder was trademark ’SAMKA’ at both locations (Fig. 1). Adjustment of the tool is complicated and, experience is important. Basic advises are:
The spider gangs have to be adjusted to follow the ridges (same angle) and to cultivate the outer 3-5 cm of the soil. Before crop emergence, the top of the ridge has to be cultivated. After crop emergence, the spider gangs are moved away from the top, but soil is still thrown onto the top of the ridges.
The speed was between 7 and 12 km/h depending on the circumstances.

5th EWRS Workshop on Physical Weed Control 113 Pisa, Italy, 11-13 March 2002
Table 1. Treatments and dates of treatments at the two locations.Treatmernt Flakkebjerg Jyndevad PlantingRidgingCrop emergenceStrategy 1 (control) Strategy 2 (true-leaf-stage) Strategy 3 (cotylodon-stage) Strategy 4 (pre-emerged) Herbicide Weed registrations Wine kill Harvest
3.57.522.5
-25.5 – 15.6
21.5 - 25.5 – 8.6 14.5 – 21.5 – 25.5 – 1.6 - 8.6 – 15.6
25.5 – 21.6*1
21.73.9 (mechanical)
12.10
19.419.420.5
-16.5
11.5 – 30.5 1.5 – 10.5 – 16.5 – 30.5
17.5 – 28.5*2
23.71.10 (natural)
10.10*1 25.5: Metribuzin 140 g a.i.ha-1 (Sencor, Bayer A/S) 21.6: Rimsulfuron 7.5 g a.i. ha-1 (Titus, Du Pont) *2 17/5: Metribuzin 140 g a.i.ha-1 (Sencor, Bayer A/S) & Linuron 550 g a.i.ha-1 (Afalon disp. Avensis) 28/5: Metribuzin 105 g a.i.ha-1 (Sencor, Bayer A/S) & Rimsulfuron 7.5 g a.i. ha-1 (Titus, Du Pont)
Figure 1. Spider gangs at the SAMKA rolling cultivator
Data analyses were carried out using the method of maximum likelihood by the Mixed Linear Model procedure in SAS (version 6.12, SAS Institute, Cary, NC, USA). An analysis of the residuals showed that a logarithmic transformation of the data was required to stabilise the variance.
Results & Discussion
The weed flora was very similar at the two locations apart from the perennial weeds in Flakkebjerg (Table 2 & 3). The effects on annual weeds are very high and consistent at both locations. One or two passes controlled 80 % of all the present annual weed species (both number and biomass). As in previous experiments (Eberlein et al., 1997; Kilpatrick, 1995), the effects are comparable to herbicide treatments – at least surviving weeds have no significant influence on the yield. The effects on weed biomass are slightly higher than the effects on the weed density, which indicates smaller plants after cultivation. An explanation might be that the cultivation stimulates new weed seeds to germinate, but weeds germinated after the last treatment have no competitive importance.

5th EWRS Workshop on Physical Weed Control 114 Pisa, Italy, 11-13 March 2002
Table 2. Biomass and density of weeds and effect of treatments on sandy loam in Flakkebjerg. Significant difference from control: NS = Non Significant; * : P < 0.05%; ** P < 0.01; *** P < 0.001.
Weed species Treatment Biomass Density Polygonum convolvulus L. Untreated control
2 x cultivation 3 x cultivation 6 x cultivation
62.6 g m-2
-82 % *-97 % *** -99 % ***
35.8 plants m-2
-81 % ** -84 % ** -92 % **
Chenopodium album L. Untreated control 2 x cultivation 3 x cultivation 6 x cultivation
238.7 g m-2
-93 % ** -98 % *** -100 % ***
31.9 plants m-2
-92 % *** -100 % *** -100 % ***
Other weeds Untreated control 2 x cultivation 3 x cultivation 6 x cultivation
39.6 g m-2
-97 % *** -99 % *** -100 %***
52.0 plants m-2
-95 % *** -95 % ** -89 % **
Elymus repens (L.) Untreated control 2 x cultivation 3 x cultivation 6 x cultivation
7.6 g m-2
-50 % NS -85 % ** -84 % *
13.1 shoots m-2
-24 % NS -63 % *
-52 % NS
Cirsium arvénse (L.) Scop. Untreated control 2 x cultivation 3 x cultivation 6 x cultivation
52.4 g m-2
-62 % NS -63 % NS -76 % NS
10,0 shoots m-2
-2 % NS -11 % NS -16 % NS
Total Untreated control 2 x cultivation 3 x cultivation 6 x cultivation
400.9 g m-2
-87 % -93 % -96 %
142.8 plants/shoots m-2
-78 % -84 % -84 %

5th EWRS Workshop on Physical Weed Control 115 Pisa, Italy, 11-13 March 2002
Table 3. Biomass and density of weeds and effect of treatments on coarse sand in Jyndevad. Significant difference from control: NS = Non Significant; * : P < 0.05%; ** P < 0.01; *** P < 0.001.
Weed species Treatment Biomass Density Polygonum convolvulus L. Untreated control
Herbicide 1 x cultivation 2 x cultivation 4 x cultivation
63.0 g m-2
-100 % *** -96 % ***-93 % ** -99 % ***
28.3 plants m-2
-100 % *** -86 % ** -82 % ** -96 % **
Chenopodium album L. Untreated control Herbicide 1 x cultivation 2 x cultivation 4 x cultivation
187.8 g m-2
-100 % *** -97 % *** -100 % *** -100 % ***
31.9 plants m-2
-100 % *** -97 % *** -94 % *** -100 % ***
Stellaria media L. Untreated control Herbicide 1 x cultivation 2 x cultivation 4 x cultivation
17.1 g m-2
100 % *** -100 % *** -100 % *** -99 % ***
17,0 plants m-2
-100 % *** -100 % *** -94 % *** -90 % ***
Other weeds Untreated control Herbicide 1 x cultivation 2 x cultivation 4 x cultivation
81.3 g m-2
-99 % *** -98 % *** -95 % *** -97 %***
55.0 plants m-2
96 % *** -90 % *** -81 % ** -93 % ***
Total Untreated control Herbicide 1 x cultivation 2 x cultivation 4 x cultivation
349.2 g m-2
-100 % *** -97 % *** -97 % *** -99 % ***
132.3 plants m-2
-98 % *** -90 % *** -86 % *** -95 % ***
The effects on biomass of perennial weeds (Elymus repens L. & Cirsium arvénse (L.) Scop) were remarkable but often not significant due to heterogeneous distribution in the field (Table 2). When looking at the implement, while it was working, it was amazing to see shoots being pulled out of the soil from up to 15 cm depth. The treatment did not kill these weeds, but regrowth was delayed, and several repeated treatments might be necessary to have high effects. In an unpublished Swedish experiment the biomass of Elymus repens roots was reduced by 97 % after two treatments with the rolling cultivator (Wagner, 1995). These experiences provide perspectives of a unique method to control both annual and perennial weeds without chemicals.
In the tolerance experiment (herbicide treated) at the loamy soil in Flakkebjerg, two and three cultivations increased the yield by 10 % compared with both the control and six times cultivation (Table 4). Here the results indicate a stimulation of the crop growth by cultivation, but by six times cultivation crop damage is possible. In the weedy efficiency experiment at the loamy soil, three and six cultivations increased the yield compared with the control and two cultivations (Table 4).

5th EWRS Workshop on Physical Weed Control 116 Pisa, Italy, 11-13 March 2002
Reduced control effects on Elymus repens and Polygonum convolvulus L (Table 2) mainly caused the yield difference between two and three cultivations.
The yield responses to the mechanical weed control were reduced around 10 %, compared with the chemical weed control on the coarse sand soil in Jyndevad (Table 5). The intensity of mechanical weed control did not influence the yield, which indicates that the reduction was not due to mechanical crop damage. Plausible explanations are that the cultivation reduced the original ridge size or that the cultivation influences nutrient and water utilisation on this soil type. In next years’ experiments, we will finish the cultivations by a ridging to rebuild the original ridge size.
The strategies for weed control were related to the weed size. The intervals between the cultivations turned out to be approximately 3, 2 and 1 week for strategy 1, 2 and 3 (Table 1). The experience was that the control effects were rather independent of the weed size (Fig. 3, 4, 5). Even large weed plants were easily controlled, and timing does not have to be related to the weed size. Instead timing should be related to the crop. Before crop emergence, cultivation was done by overlap of the spider gangs. After crop emergence the spider gangs were adjusted away from the top of the ridges to prevent crop damage. This implement control the weeds both by uprooting and soil covering in one operation, but weeds emerged on the top of the ridge after the crop were only controlled by soil covering. This is not as efficient as up-rooting (Kurstjens & Kropff, 2001), and it was notable that most of the surviving weeds in the experiments were growing on the top of the ridges.
Figure 3. Highly infested field in Jyndevad (outside experiment) before treatment.
Figure 4. Highly infested field in Jyndevad (outside experiment) after treatment.

5th EWRS Workshop on Physical Weed Control 117 Pisa, Italy, 11-13 March 2002
Figure 5. Highly infested field in Jyndevad (outside experiment) one week after treatment.
Table 4. Potato yield at sandy loam in Flakkebjerg. Significant difference from 3 cultivations: NS = Non Significant; * : P < 0.05%; ** P < 0.01; *** P < 0.001.
No herbicides Plus herbicides (weed free) Treatment
Mean yield (ton/ha)
Relative effects
Mean yield(ton/ha)
Relative effects
1. 0 x cultivation 2. 2 x cultivation 3. 3 x cultivation 4. 6 x cultivation
18.549.156.759.0
33 *** 87 ** 100104 NS
40.644.845.741.5
89 ** 98 NS 100 91 *
Table 5. Potato yield at coarse sand in Jyndevad. Significant difference from 2 cultivations: NS = Non Significant; * : P < 0.05%; ** P < 0.01; *** P < 0.001
Treatment Mean yield (ton/ha)
Relative effects
1. 0 x cultivation 2. 1 x cultivation 3. 2 x cultivation 4. 4 x cultivation 5. Herbicide
22.857.855.457.862.6
41 *** 104 NS 100104 NS 113 **
As an alternative to herbicides, the economy is very important. Assuming the same control effects and yields by 2 or 3 cultivations and herbicide treatments, which is realistic, the variable costs are very similar. The major difference is the investment if the farmer has a sprayer in advance. Economic calculations can be conducted with several assumptions, but if the implement can be used on large areas each year, it is seen as an economic alternative to herbicides. The rolling cultivating is less dependent on weather conditions (wind in Denmark!) than spraying and more days for control are available. Furthermore, with up to six row implements and driving speeds of 10-12 km/h the capacity is large. Additional environmental arguments and considerations could be listed as well.
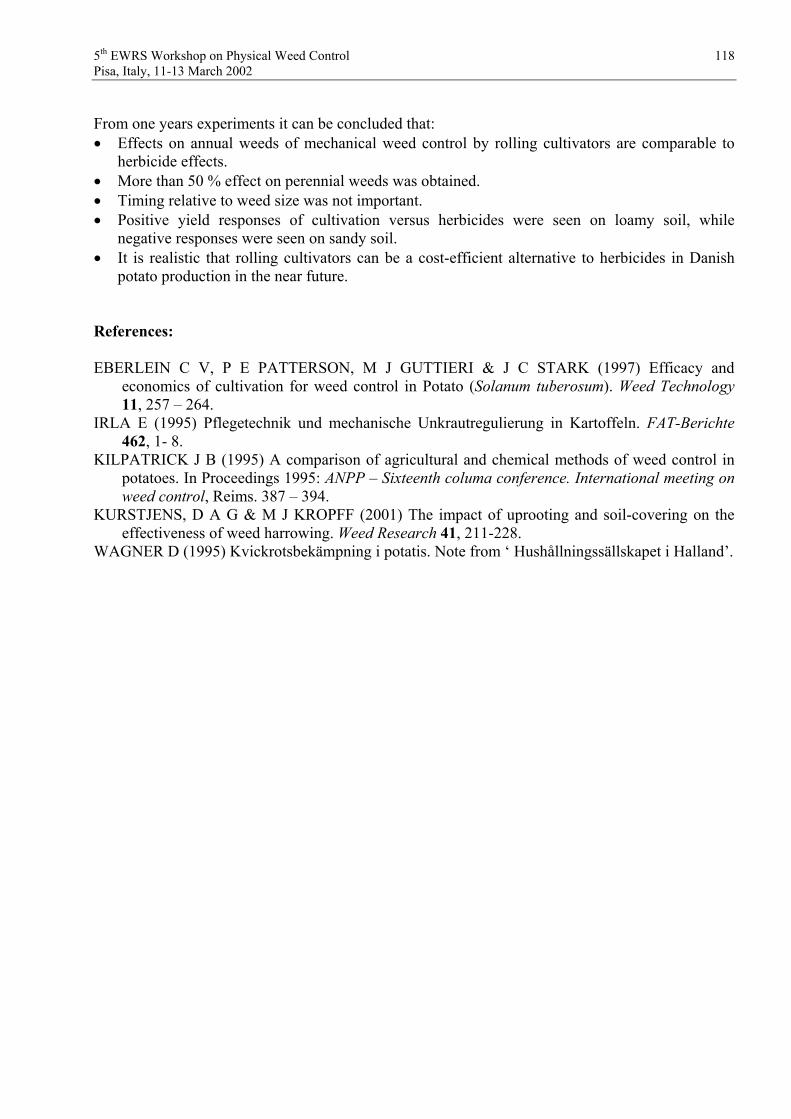
5th EWRS Workshop on Physical Weed Control 118 Pisa, Italy, 11-13 March 2002
From one years experiments it can be concluded that:Effects on annual weeds of mechanical weed control by rolling cultivators are comparable to herbicide effects. More than 50 % effect on perennial weeds was obtained.Timing relative to weed size was not important. Positive yield responses of cultivation versus herbicides were seen on loamy soil, while negative responses were seen on sandy soil.It is realistic that rolling cultivators can be a cost-efficient alternative to herbicides in Danish potato production in the near future.
References:
EBERLEIN C V, P E PATTERSON, M J GUTTIERI & J C STARK (1997) Efficacy and economics of cultivation for weed control in Potato (Solanum tuberosum). Weed Technology11, 257 – 264.
IRLA E (1995) Pflegetechnik und mechanische Unkrautregulierung in Kartoffeln. FAT-Berichte462, 1- 8.
KILPATRICK J B (1995) A comparison of agricultural and chemical methods of weed control in potatoes. In Proceedings 1995: ANPP – Sixteenth columa conference. International meeting on weed control, Reims. 387 – 394.
KURSTJENS, D A G & M J KROPFF (2001) The impact of uprooting and soil-covering on the effectiveness of weed harrowing. Weed Research 41, 211-228.
WAGNER D (1995) Kvickrotsbekämpning i potatis. Note from ‘ Hushållningssällskapet i Halland’.

5th EWRS Workshop on Physical Weed Control 119 Pisa, Italy, 11-13 March 2002
Options for mechanical weed control in string bean – work parameters and crop yield
M. Raffaelli1, P. Bàrberi2, A. Peruzzi1 & M. Ginanni3
1D.A.G.A.E., Settore Meccanica Agraria, University of Pisa, Italy; 2Scuola Superiore Sant’Anna, Pisa, Italy; 3Centro Interdipartimentale di Ricerche Agro-ambientali “E. Avanzi”, S. Piero a Grado,
Pisa, Italy
Introduction
The introduction of organic cultivation of many crops is rapidly gaining pace, leading to the need to devise techniques and equipment to ensure effective non chemical weed control (Bonifazi, 2001).
The increasing emphasis on physical means for integrated and organic weed management is in line with the mounting public concern for environmental safeguard and the growing consumer demand for high quality food products (Peruzzi et al., 1995 and 1999; Raffaelli & Peruzzi, 1998) and is in full agreement with the orientations of the EU agricultural policy in recent years ("Agenda2000").
In this perspective, a series of purpose-designed operative machines were studied and devised to perform efficient and economically viable selective and non-selective direct physical (mechanical and thermal) weed control. Numerous experiences have been carried out on these machines (Kress, 1989; Rasmussen, 1991 and 1992; Böhrnsen, 1993; Peruzzi et al., 1993 and 1995; Melander & Hartvig, 1995; Ascard & Bellinder, 1996; Kouwenhoven, 1997; Melander, 1997; Fogelberg, 1998 and 1999; Ascard et al., 2000; Bàrberi et al., 2000; Cloutier & Leblanc, 2000; Kurstjens & Bleeker, 2000). Results obtained are often very good, but analysis of data suggests that many factors can play an important role in determining the outcome of treatments. Machines having completely different mechanical and operative characteristics are often used on the same crop and/or soil and this is not always logic and explicable. This suggests that more detailed evaluations are necessary in order to analyse and fully interpret results. In order to optimise on-field treatments, experiments are required to allow in-depth analysis of the interactions between machine working parameters and soil conditions, crop typology and management practices, as well as weed density, developmental stage and competitiveness (Rasmussen, 1991 and 1992; Peruzzi et al., 1993 and 1995; Søgaard, 1996; Fogelberg & Dock Gustavsson, 1998; Bàrberi et al., 2000; Kurstjens et al., 2000; Raffaelli et al., 2000).
The present paper reports part of the results of a study aimed to investigate mechanical and agronomic performances of different weed control options having very different characteristics that were operated on the same soil and the same crop.
Materials and methods
Trials consisted of a spring-tine harrowing experiment comparing different tine adjustments, and of a hoeing experiment comparing the effects of different machines (a precision hoe plus or minus a torsion weeder and a PTO-powered rotary hoe). All the implements are 3 m wide. The experiments were conducted on adjacent fields with the same soil type (Table 1).

5th EWRS Workshop on Physical Weed Control 120 Pisa, Italy, 11-13 March 2002
The spring-tine harrow (Malin) is composed of two small (each 1.5 m wide) modular frames. Each frame is composed of 6 transverse rows of 8 tines; each tine is 36 cm long and has a diameter of 0.6 cm. The J-shaped tines, made of special-purpose steel, are composed of a 25 cm long vertical segment followed by a second shorter segment (11 cm) angled at 135˚ to the first segment towards the working direction.
The precision hoe, that is manually steered, has sweep and goose-foot shares and can be implemented with torsion weeders. The PTO-powered rotary hoe is a conventional machine with L-shaped tools.
Trials were conducted in 2000 and 2001 at the Centro Interdipartimentale di Ricerche Agro-ambientali "E. Avanzi" of the University of Pisa (43°40’ Lat. N, 10°19’ Long. E). A 30 kW 2WD tractor was used in any experiments. Further details on the experiments are reported by Raffaelli etal. (2002).
String bean (Phaseolus vulgaris L. cv. Delinel) was grown under irrigation regime according to the standard cultural practices in the study area (Raffaelli et al., 2002) and sown at a seeding rate of 29.6 seeds m-2 and an inter-row spacing of 75 cm.
Table 1. Soil physical and mechanical characteristics. Characteristics Values 2000 2001 Texture (%) Ø > 2mm Sand (%) 0.02 < Ø 2mm Silt (%) 0.002 < Ø 0.02 mm Clay (%) Ø 0.002 mm Classification ISSS System
0622216
sandy-loamy Liquid limit (LL, %) Plastic limit (PL, %) Plasticity index (LL-PL)
231310
Soil water content (%) 9 8 Consistency index 1.4 1.5 Dry bulk density kg dm
-3 1.3 1.4 Cone resistance (0-5 cm) MPa 0.2 0.8
Immediately prior to the mechanical treatments, percent soil water content, dry bulk density and penetration resistance were determined. The soil consistency index at the time of harrowing was calculated on the basis of Atterberg limits and soil water content.
The harrowing experiment included any combinations between four tine adjustments (ranging from –30° up to +15°, where values represent the angle between the upper part of the tine and the perpendicular to the soil surface, Fig. 1) of the spring-tine harrow. The hoeing experiment compared four different hoeing systems: (1) a PTO-powered rotary hoe, (2) a precision hoe with sweep and goose-foot shares, (3) a precision hoe (as before) + torsion weeders, (4) a precision hoe (as before) + torsion weeders operated with the tines crossed.
Several harrowing or hoeing work parameters were measured or calculated for any treatments, including working depth, speed and capacity; fuel consumption per hectare and hour, drawbar pull, useful power, direct input and tractor skidding.

5th EWRS Workshop on Physical Weed Control 121 Pisa, Italy, 11-13 March 2002
String bean yield was determined at different times (as soon as the pods were ready for harvest) by complete harvest of 2 m of crop row selected in the central part of each plot. Data on weeds and weed control are reported elsewhere (Raffaelli et al., 2002).
Results and discussion
Data shown in Table 1 indicate that at harrowing time the soil was in good condition for tillage. Compared to 2000, in 2001 cone resistance was 4 time higher, and also the consistency index was higher. This means that in the second year the tilled soil exerted a higher resistance to tine penetration.
Fig. 1. Shape and possible adjustments of the tines of the spring-tine harrow: = 135°, -45° +15°. The arrow indicates the driving direction.
Mechanical and working parameters of the different harrowing and hoeing treatments are shown in Tables 2 and 3.
In both years, the working depth of the spring-tine harrow increased with tine angle, ranging from 1.6-2.0 cm in the least aggressive adjustment (-30°) to 3.0-3.1 cm in the most aggressive one (+15°). Hardness of the soil influenced the working depth, even though mean absolute differences among treatments between years were small (3 mm). Working depth of the hoes was always invariable and much higher than that of the harrow; it is worth mentioning that with the precision hoe it was not possible to work at a shallower soil depth.
Working speed and productivity of the machines differed only slightly between the years. Values recorded for the spring-tine harrow were always very high (on average ca. 7 km h-1 and 1.8 ha h-1 respectively) and much higher than those recorded for the hoes. Among the latter, the rotary hoe emerged as the implement with the lower speed and productivity (ca. three times lower than the spring-tine harrow).
Fuel consumption increased with increasing treatment aggressiveness, with constant and very low values for the spring-tine harrow and the precision hoe. Compared to the other hoes, use of the PTO-powered rotary hoe resulted in higher fuel consumption per hour and hectare (due to lower working speed and productivity), which increased in 2001 because the soil was harder to till.
+ -

5th EWRS Workshop on Physical Weed Control 122 Pisa, Italy, 11-13 March 2002
Drawbar pull increased from the least to the most aggressive treatment, but absolute values were overall very low.
On average, the power needed for operating the harrow and the precision hoe was 3.5 and 2.5 kW respectively, while the PTO-powered rotary hoe needed 12.3 kW in 2000 and 14.3 kW in 2001.
Spring-tine harrowing required a very low direct input, that was not appreciably influenced by the change in soil conditions between the years. A low energy input was also required by the precision hoe (with values similar to those of the harrow), but soil conditions seemed to influence values. Direct input necessary for operating the PTO-powered rotary hoe was considerably (ca. 10 times) higher and was influenced by soil hardness.
In any case, tractor skidding, when present, was always unimportant.
To fully interpret the outcome of this study, parameters that link mechanical and agronomic results are hereafter presented.
Table 2. Work parameters of spring-tine harrowing performed with different tine adjustments. Parameter 2000 2001 - 30° -15° 0° +15° mean - 30° -15° 0° +15° mean Working depth (cm) 2.0 2.4 2.5 3.1 2.5 1.6 2.1 2.2 3.0 2.2 Working speed (km h-1) 7.1 6.8 6.7 6.5 6.8 7.0 6.8 6.7 6.5 6.7 Working productivity (ha h-1) 1.8 1.7 1.7 1.7 1.7 1.8 1.7 1.7 1.7 1.7 Fuel con. per hour (kg h-1) 0.7 1.2 1.6 1.7 1.3 0.7 1.1 1.5 1.7 1.2 Fuel con. per hectare (kg ha-1) 0.4 0.7 0.9 1.0 0.7 0.4 0.6 0.9 1.0 0.7 Drawbar pull (N) 1000 1800 2340 2630 1940 1000 1700 2180 2590 1867 Useful power (kW) 2.0 3.4 4.4 4.7 3.7 1.9 3.2 4.1 4.7 3.5 Direct input (MJ ha-1) 17.6 30.8 39.6 44.0 30.8 17.6 26.4 39.6 44.0 30.8 Tractor skidding (%) 1 5 7 9 5 3 6 7 10 6
Table 3. Work parameters of hoeing performed with different technical solutions. Parameter 2000 2001 PH PH + TW Rotary hoe PH PH + TW Rotary hoe Working depth (cm) 5.2 5.2 6.0 5.1 5.1 6.0 Working speed (km h-1) 3.8 3.8 2.4 3.6 3.6 2.4 Working productivity (ha h-1) 1.0 1.0 0.6 0.9 0.9 0.6 Fuel cons. per hour (kg h-1) 0.9 0.9 4.5 0.9 1.0 5.1 Fuel cons. per hectare (kg ha-1) 0.9 0.9 7.5 1.0 1.1 8.5 Drawbar pull (N) 2360 2500 - 2480 2740 - Useful power (kW) 2.5 2.6 12.3 2.5 2.7 14.3 Direct input (MJ ha-1) 39.6 39.6 337.5 44.0 48.4 382.5 Tractor skidding (%) 7 7 -1 10 10 -1 PH = precision hoe, PH + TW = precision hoe + torsion weeder.
Table 4 shows that string bean total yield per working hour obtained with spring-tine harrowing was nearly two- and four-fold those of the precision and rotary hoe respectively.

5th EWRS Workshop on Physical Weed Control 123 Pisa, Italy, 11-13 March 2002
It is also possible to observe that, to produce 1 Mg of string bean yield (fresh weight), 2.3 to 3.4 MJ were needed by harrowing, 2.9 to 5.4 MJ by precision hoeing and 30.7 to 41.0 MJ by PTO-powered rotary hoeing.
Table 4. String bean total yield (fresh weight) per working hour and direct energy input needed to produce 1 Mg of produce in the different harrowing and hoeing treatments (all the other cultural practices were kept constant in all treatments).
Treatment Kg h-1 MJ Mg-1
2000 2001 2000 2001 Spring-tine harrowing: +15° 24013 17503 3.1 4.3 0° 24307 15181 2.8 4.4 -15° 24778 16900 2.1 2.7 -30° 25670 13747 1.2 2.3 Mean 24692 15833 2.3 3.4
Hoeing: Precision hoe 12850 8081 3.1 4.9 Precision hoe + torsion weeder 13496 8082 2.9 5.4 Rotary hoe 6603 5593 30.7 41.0
The machines used in this experiments have different working characteristics, as it is clearly demonstrated by values of the measured parameters. Furthermore, their behaviour usually changes according to soil conditions. In harder soil, the spring-tine harrow works more shallowly and it is not possible for the tines to penetrate deeper in the soil. These data highlight the well recognised operative advantages linked to the use of the spring-tine harrow, such as the high timeliness and work productivity, and the very low demand for drawbar pull, power and energy. In contrast, by using the precision or the rotary hoe tillage depth is independent of soil conditions but is set to a minimum value that cannot be further lowered. Compared to harrowing, soil conditions influence work productivity and energetic requirement of the hoes to a much greater extent; this is especially true for the PTO-powered rotary hoe.
Further studies are required to allow in-depth analysis of the interactions between machine work parameters and soil conditions, weed density and composition, and crop management practices.
Acknowledgements
We are very grateful to R. Del Sarto, A. Pannocchia, M. Paracone, L. Pulga and S. Toniolo of the University of Pisa for their precious cooperation in running the experiments.
References
ASCARD J & BELLINDER RRB (1996) Mechanical in-row cultivation in row crops. In: Proceedings Second International Weed Control Congress, Copenhagen, Denmark, 1121-1126.
ASCARD J, OLSTEDT N & BENGTSSON H (2000) Mechanical weed control using inter-row cultivation and torsion weeders in vining pea. In: Proceedings 4th EWRS Workshop on Physical and Cultural Weed Control, Elspeet, 20-22 March, 41.

5th EWRS Workshop on Physical Weed Control 124 Pisa, Italy, 11-13 March 2002
BÀRBERI P, SILVESTRI N, PERUZZI A & RAFFAELLI M (2000) Finger-harrowing of durum wheat under different tillage systems. Biological Agriculture and Horticulture 17, 285-303.
BÖHRNSEN A (1993) Several years results about mechanical weeding in cereals. In: Proceedings4th International Conference I.F.O.A.M., Dijon, 5-9 May, 93-99.
BONIFAZI L (2001) L’alternativa biologica. Terra e Vita 4, 60-61. CLOUTIER D & LEBLANC ML (2000) Susceptibility of sweet maize (Zea mays L.) to the rotary
hoe: preliminary results. In: Proceedings 4th EWRS Workshop on Physical and Cultural Weed Control, Elspeet, 20-22 March, 37-39.
FOGELBERG F (1998) Physical weed control – intra-row brush weeding and photocontrol in carrots (Daucus carota L.). PhD Dissertation, Department of Agricultural Engineering, Swedish University of Agricultural Sciences, Alnarp.
FOGELBERG F (1999) Night-time soil cultivation and intra-row brush weeding for weed control in carrots (Daucus carota L.). Biological Agriculture and Horticulture 17, 31-45.
FOGELBERG F & DOCK GUSTAVSSON AM (1998) Resistance against uprooting in carrots (Daucus carota) and annual weeds: a basis for selective mechanical weed control. Weed Research 38, 183-190.
KOUWENHOVEN JK (1997) Intra-row mechanical weed control: possibilities and problems. Soil& Tillage Research 41, 87-104.
KRESS W (1989) La sarchiatrice a spazzole. Demetra 14, 39-41. KURSTJENS DAG & BLEEKER P (2000) Optimising torsion weeders and finger weeders. In:
Proceedings 4th EWRS Workshop on Physical and Cultural Weed Control, Elspeet, 20-22 March, 30-32.
KURSTJENS DAG, PERDOK UD & GOENSE D (2000) Selective uprooting by weed harrowing on sandy soils. Weed Research 40, 431-447.
MELANDER B (1997) Optimization of the adjustment of a vertical axis rotary brush weeder for intra-row weed control in row crops. Journal of Agricultural Engineering Research 68, 39-50.
MELANDER B & HARTVIG P (1995) Weed harrowing in seed onions. In: Proceedings 9th EWRS Symposium “Challenges for Weed science in Changing Europe”, Budapest, 543-549.
PERUZZI A, BÀRBERI P & SILVESTRI N (1995) La strigliatura del terreno. Macchine e Motori Agricoli 5, 29-36.
PERUZZI A, RAFFAELLI M & DI CIOLO S (1999) Tecniche per la produzione di olio di semi di girasole di alta qualità. In: Proceedings Convegno Nazionale A.I.I.A. – L’innovazione tecnologica per l’agricoltura di precisione e la qualità produttiva, Grugliasco, 22-23 June, 401-410.
PERUZZI A, SILVESTRI N, COLI A & GINI N (1993) Winter cereals weeds control by means of weeding harrows: first experimental results. Agricoltura Mediterranea 123, 236-242.
RAFFAELLI M & PERUZZI A (1998) Controllo delle infestanti, le attrezzature "ecologiche". Terra e Vita 4, 32-41.
RAFFAELLI M, PERUZZI A, BÀRBERI P (2000) Spring-tine harrowing in sunflower and soyabean: results of two-year trials. In: Proceedings 4th EWRS Workshop on Physical and Cultural Weed Control, Elspeet, 20-22 March, 37-39.
RAFFAELLI M, BÀRBERI P, PERUZZI A & GINANNI M (2002) Options for mechanical weed control in string bean – effects on weeds. In: Proceedings 5th EWRS Workshop on Physical and Cultural Weed Control, Pisa, 11-13 March 2002.
RASMUSSEN J (1991) Optimising the intensity of harrowing for mechanical weed control in winter wheat. In: Proceedings 1991 Brighton Crop Protection Conference – Weeds, 177-184.
RASMUSSEN J (1992) Testing harrows for mechanical control of annual weeds in agricultural crops. Weed Research 32, 267-274.
SØGAARD HT (1998) Automatic control of finger weeder with respect to the harrowing intensity at varying soil structures. Journal of Agricultural Engineering Research 70, 157-163.

5th EWRS Workshop on Physical Weed Control 125 Pisa, Italy, 11-13 March 2002
Mechanical intra-row weed control in organic onion production
J. Ascard & F. FogelbergSwedish University of Agricultural Sciences, Department of Crop Science,
Box 44, SE-230 53 Alnarp, Sweden E-mail: [email protected], [email protected]
Abstract
In organic production of direct-sown onions (Allium cepa), the labour requirement for intra-row weed control is a major problem. Therefore, many organic growers use onions from sets because it is easier to cope with the weeds. However, it is desirable to increase production of onions grown from seed because of the better onion skin quality and storage ability. Transplanting onion plants grown from seed is one way to combine high skin quality with ease of weed control. The torsion weeder, consisting of two flexible steel tines on each side of the row, is effective for intra-row weed control in several crops, but there are few reports of its use in onions.
The objective of this study was to evaluate effective strategies for mechanical intra-row weed control using the torsion weeder in direct-sown onions and in transplanted onions grown from seed, in terms of reduction of annual weeds, labour time for hand weeding, yield and quality. So far, two field experiments have been carried out in Southern Sweden in 2000 and 2001 as part of a three year study.
In transplanted onions, we evaluated a weed control strategy, using spring tine harrowing one week after transplanting plus 2-3 row crop cultivations with torsion weeders for in-row cultivation. The torsion weeders consist of two flexible steel tines on each side of the row, mounted on a row crop cultivator. The tines were set together with no distance between the tines, and they were used at two intensities, regulated by the driving speed. This strategy was compared with inter-row cultivation only and weed harrowing plus inter-row cultivation. In sown onions, we evaluated a strategy where we used flame weeding at crop emergence plus 2-3 row crop cultivations with torsion weeders. This was compared with inter-row cultivation only and flame weeding plus inter-row cultivation. All treatments were hand weeded and the labour time for hand weeding was recorded. Weeds were counted in the 10 cm uncultivated strip within the row only.
Generally there were fewer weeds, a lower labour requirement for hand weeding and higher yields in the transplanted onions than in the sown onions. In transplanted onions, a combination of one weed harrowing and three subsequent row crop cultivations using the torsion weeder provided about 90% weed reduction and over 75% labour reduction, compared to using inter-row cultivation only. A slightly lower weed control effect was obtained when the torsion weeder was driven at a lower speed. The weed harrowed and intra-row cultivated onion produced marketable yields of 47 and 38 ton/ha for the two years respectively, which was higher than the yield from the onions that were inter-row cultivated only.
In direct-sown onions, a combination of flame weeding at crop emergence and subsequent row crop cultivations using the torsion weeder provided about 80% reduction of in-row weeds and about 65% reduction of the labour use for hand weeding, with a higher yield and no quality reduction compared to using inter-row cultivation only. In the first year’s experiment in sown onions, flame weeding gave good control but the torsion weeder poor results, but the opposite was true in the second year.
The results so far clearly demonstrate the importance of creating conditions in which the crop is always ahead of the weeds, and of carrying out all the treatments at the right time and with proper adjustment of the equipment, in obtaining successful results.

5th EWRS Workshop on Physical Weed Control 126 Pisa, Italy, 11-13 March 2002
Experiences related to the use of the weeding harrow and of the roll-star cultivator in Emilia-Romagna for weed control on hard and common wheat,
sunflower and soyabean in organic agriculture
L. Dal Re and A. Innocenti (Experimental Station M. Marani, Ravenna – Italy)
Introduction
Since 1997 Experimental Station Marani of Ravenna has set itself the aim to support the spreading of organic farming methods in its own region. In order to achieve this aim, Marani Station has equipped itself with specific machinery and equipment used to implement experimental and demonstrative programmes. Weed control is frequently the most difficult problem to work out in production of organic arable crops in Po Valley and this is why weed harrowing and hoeing were particularly studied.
Method
Altogether, 20 experimental fields have been implemented in the years 1997-2000. The methodological choose was to work according to experimental schemes with repeated big plots (min. 0.5 ha) while using open field machinery and equipment on real-scale surfaces (2-10 ha). This approach has given us the possibility to obtain interesting results, also transferable in quite a short time. For the on-farms trials we used several machines: 2 weeding harrow (8 and 6 mm teeth of diameter) for trials on hard (Triticum durum) and common wheat (Triticum aestivum); 1 spring tines harrow, 1 weeding harrow; 1 roll-star cultivator for trials on sunflower (Helianthus annuus) and soyabean (Glycine max).
Results
Hard and common wheat.
The following technique has been developed for the use of the weeding harrow on common wheat with close row spacing (17-18 cm).
1) A false sowing with “heavy” weeding of the field (teeth weeding harrow 8 mm in diameter), in autumn; the second weeding and the sowing have been done at the end of traditional sowings.
2) 3 interventions of “light” weeding, intervening from the 2 leaves stage to the one of end of shooting, in winter. The speed ranged between 4 and 6 km/hour with 6 mm teeth and “light” winding up for the first intervention, and then “medium” winding up.
This technique allowed a sufficient weed control both for monocotyledons (Lolium multiflorum, Alopecurus mysuroides, Avena spp.) and dicotyledons (Papaver rhoeas, Matricaria camomilla, Sinapis spp, Veronica spp). The yields of common wheat decreased of 8-14 % against conventional agricultural test while of hard wheat increased of 3-10 %.
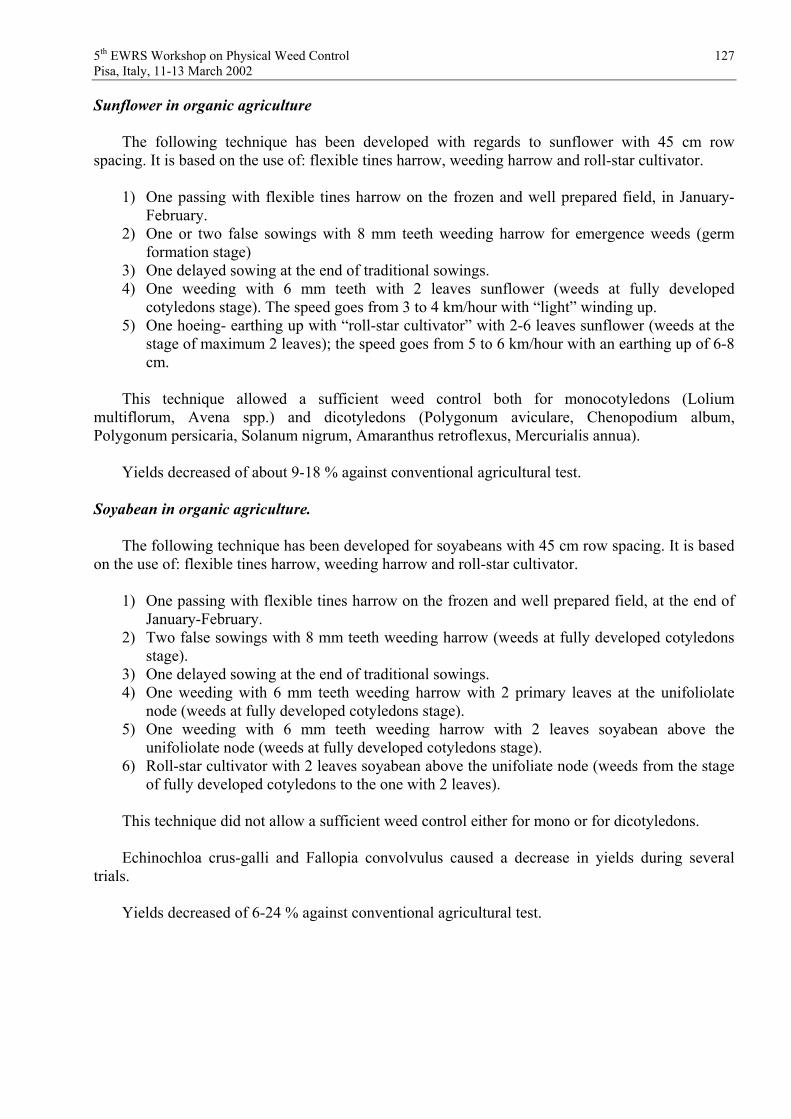
5th EWRS Workshop on Physical Weed Control 127 Pisa, Italy, 11-13 March 2002
Sunflower in organic agriculture
The following technique has been developed with regards to sunflower with 45 cm row spacing. It is based on the use of: flexible tines harrow, weeding harrow and roll-star cultivator.
1) One passing with flexible tines harrow on the frozen and well prepared field, in January-February.
2) One or two false sowings with 8 mm teeth weeding harrow for emergence weeds (germ formation stage)
3) One delayed sowing at the end of traditional sowings. 4) One weeding with 6 mm teeth with 2 leaves sunflower (weeds at fully developed
cotyledons stage). The speed goes from 3 to 4 km/hour with “light” winding up. 5) One hoeing- earthing up with “roll-star cultivator” with 2-6 leaves sunflower (weeds at the
stage of maximum 2 leaves); the speed goes from 5 to 6 km/hour with an earthing up of 6-8 cm.
This technique allowed a sufficient weed control both for monocotyledons (Lolium multiflorum, Avena spp.) and dicotyledons (Polygonum aviculare, Chenopodium album, Polygonum persicaria, Solanum nigrum, Amaranthus retroflexus, Mercurialis annua).
Yields decreased of about 9-18 % against conventional agricultural test.
Soyabean in organic agriculture.
The following technique has been developed for soyabeans with 45 cm row spacing. It is based on the use of: flexible tines harrow, weeding harrow and roll-star cultivator.
1) One passing with flexible tines harrow on the frozen and well prepared field, at the end of January-February.
2) Two false sowings with 8 mm teeth weeding harrow (weeds at fully developed cotyledons stage).
3) One delayed sowing at the end of traditional sowings. 4) One weeding with 6 mm teeth weeding harrow with 2 primary leaves at the unifoliolate
node (weeds at fully developed cotyledons stage). 5) One weeding with 6 mm teeth weeding harrow with 2 leaves soyabean above the
unifoliolate node (weeds at fully developed cotyledons stage). 6) Roll-star cultivator with 2 leaves soyabean above the unifoliate node (weeds from the stage
of fully developed cotyledons to the one with 2 leaves).
This technique did not allow a sufficient weed control either for mono or for dicotyledons.
Echinochloa crus-galli and Fallopia convolvulus caused a decrease in yields during several trials.
Yields decreased of 6-24 % against conventional agricultural test.

5th EWRS Workshop on Physical Weed Control 128 Pisa, Italy, 11-13 March 2002
Discussion
A single harrowing on hard and common wheat often stimulated the birth of weeds, therefore the most effective harrowing interventions were the ones made on couple or triplet
The technique of 3 harrowing turned out to be more effective in weed control in all cases and, in particular, to improve the control of winter grass weeds. In order to control winter grass weeds it was useful to bring forward the execution of the first intervention in December (3rd leaf) and to make the following ones in January and February.
Depending on the time of the intervention and on climate, weeds reacted in a different way to harrowing interventions. During post-emergence treatments, the weeding harrow has turned out to be more effective on dry fields in windy and sunny afternoons.
The technique developed for weed control in sunflower proved to be particularly easy in late sowings thanks to the competition of the great leaves of the plants (at harvest the seeds of Chenopodium a. were green again).
On the other hand the results obtained in weed control in soyabean April/May sowings were not satisfying, therefore in the present year we are developing some techniques of deep hoeing in order to improve the control of the perennial weeds (Echinochloa crus-galli and Polygonum convolvulus) in organic arable crops.
Acknowledgements
The programmes are implemented with the financial support of Regione Emilia-Romagna and of Provincia di Ravenna
References
D. C. CLOUTIER, R. MARCOTTE, M. L. LEBLANC. Impiego delle colture intercalari e da sovescio per il controllo delle infestanti. Bio agricultura n° 30: 19-21. 1995.
L. DAL RE, C. DONATI. Colture erbacee questioni di soglia. Supplemento a Il conto terzista n° 5: 7-18. 2000.
L. DAL RE. Criteri e macchine per gli interventi sulle colture erbacee. Supplemento a Terra e Vita n° 22: 11-17. 2001.
F. DIOMEDE. Il controllo delle erbe infestanti. Bio agricultura n° 69: 32-34. 2001. U. FRONDONI, P. BARBERI. Attrezzature per le colture erbacee. Supplemento a Il conto terzista
n° 5: 19-25. 2000. U. FRONDONI. Macchine per il diserbo. Bio agricultura n° 69: 35-38. 2001. U. FRONDONI. Le lavorazioni conservative del terreno. Supplemento a Terra e Vita n° 22: 5-8.
2001.A. PERUZZI, P. BARBERI, N. SILVESTRI. Strigliatura del terreno. Terra e Vita n° 43: 55-57.
1995.E. RASO, L. BASTANZIO, C. VAZZANA. Gestione delle infestanti del frumento tenero con
erpice strigliatore. L’Informatore Agrario n° 31: 27-31. 1997.

5th EWRS Workshop on Physical Weed Control 129Pisa, Italy, 11-13 March 2002
Physical methods for weed control in potatoes
J.A. Ivany Crops and Livestock Research Centre, Agriculture and Agri-Food Canada
440 University Avenue, Charlottetown, PEI Canada, C1A 4N6
Abstract
Increasing demand for potatoes (Solanum tuberosum L.) produced organically, increasing costs of production, and public interest in knowing how crops are produced has resulted in efforts being intensified to reduce the amount of herbicides applied in potato production. We evaluated the potential of using different non-chemical techniques and banded herbicide application to achieve weed control in potatoes. All experiments were conducted on a Charlottetown fine sandy loam soil from 1998 to 2000. Four replications of 4-row plots, 6 to 10 m long were planted to Russet Burbank cultivar in all years. Treatment effects on Elytrigia repens and broadleaved weeds were assessed using determination of weed biomass from 0.25 x 1.0 m quadrats. Yields were obtained at maturity by mechanically harvesting the two centre plot rows and grading into marketable and total tubers. A comparison of a between the row rototiller, over row flamer and full plot width finger weeder to achieve weed control in potatoes showed that the flamer gave greatest control of E.repens and broadleaved weeds and generally had highest potato marketable and total yield. There was no difference between flaming at potato emergence or when potatoes were 10 to 15 cm tall. Flaming twice (just before potato emergence + 2 weeks later) tended to reduce potato marketable and total yield. When the herbicides metribuzin (pre), linuron (pre), paraquat (just before potato emergence) or glyphosate were applied (just before potato emergence) in a 30 cm band, and followed with a between the row weed removal with a rototiller, weed control and potato yields were comparable with all treatments. Amount of herbicide applied, however, was reduced by 66 % using this method ([email protected]).
Introduction
Potatoes (Solanum tuberosum L.) are the fourth largest food crop throughout the world and each year in Canada 155,000 ha are produced for processing use, table use, and for seed. Herbicides have been used generally in combination with mechanical cultivation, to provide weed control in the production of potatoes. In recent years, production of potatoes by organic methods has increased and ongoing research efforts have been intensified to find ways to obtain weed control without the use of herbicides. Achieving weed control in small acreage, organic production is possible with several cultivation operations and / or by the use of propane flaming devices but results have varied depending on equipment used, time of cultivation, frequency of cultivation, weed population and weed species.
Belinder et al.(2000) examined weed control in potatoes using banded herbicides and different types of cultivation equipment. They found that pre-hilling weed densities were greater with cultivation equipment than with broadcast herbicide or banded herbicide + cultivation but potato yields were not reduced by this greater weed density. They noted that a combination of banded herbicide and well timed cultivation gave good weed control and crop yield. VanGressel and Renner (1990a) planted redroot pigweed or barnyard grass in the potato row after hilling and found that one weed per metre of row reduced total and marketable yield of ‘Atlantic’ cultivar. Rioux et

5th EWRS Workshop on Physical Weed Control 130Pisa, Italy, 11-13 March 2002
al. (1979) compared potato yield at different hilling times with herbicides and found that there was no difference among hilling times in weed control or yield when herbicides were used. In comparing different hilling times without herbicides, hilling at potato emergence gave best control and yield. VanGressel and Renner (1990b) found that hilling at potato emergence suppressed weeds more than hilling when potatoes were 30 cm tall in one year only of the two year study where Echinochloa crus-galli, Amaranthus retroflexus and Cheropodium album were the predominant weed species present. Eberlein, et al. (1997), found that cultivation was effective at low weed densities but at high weed densities control was less effective and yields and net returns were reduced below that for a standard herbicide treatment. Kilpatrick (1993), found that cultivating several times was as effective as a herbicide program in giving weed control and potato yields were comparable.
The use of thermal methods of weed control was discussed by Ascard (1988) with mention of flaming for potato haulm desiccation and flaming has been recently been included in a review (Bond and Grundy 2001) but no mention is made of use of flaming for weed control in potato crops. Flaming using a portable gasoil flamer controlled weeds better, produced higher potato yields and was the least costly method of weed control in Iran (Shimi, 2000).
The objective of the studies reported in this paper was to evaluate alternative methods of weed control that could provide effective control and reduce or eliminate the use of herbicides in potato production under Prince Edward Island conditions. Experiments were conducted comparing mechanical cultivation, herbicide banding and use of a propane flamer to provide control of weeds.
Materials and Methods
General All experiments were conducted on a Charlottetown fine sandy loam soil (Orthic Humo-Ferric Podzol), pH 5.6 to 6.0 from 1998 to 2000. Four replications, in a randomized complete block design, of 4-row plots, 6 to 10 m long with a guard row on each side were planted to “Russet Burbank” cultivar in all years at 38-cm spacing in the row with rows 0.9 m apart. Fertilizer was banded at planting at a rate of 130, 57 and 109 kg/ha of N, P, and K, respectively. With the exception of the herbicide and cultivation treatments, cultural practices were the same as those recommended for commercial production. Details of the operations during the course of the experiments are given in Table 1.
Table 1. Experiment planting, treatment, data collection, and harvest dates for 1998 and 2000.
Experiment Planted Treated Hilled Weed biomass Harvested
Physical methods 1998
1999
2000
May 21
May 18
May 23
-emergence June 15 -2 wks later June 30 -emergence June 17 -2 wks later June 26 -emergence June 15 -2 wks later June 28
July 14
July 15
July 12
July 10
June 28
July 11
October 6
October 10
October 11
Banded herbicide 1998
1999
May 21
May 18
- herbicides May 25 - rotovator June 30 - herbicides May 22 - rotovator May 28
July 14
July 15
July 10
July 8
October 6
October 10
Time of flaming 2000 May 23 - cotyledon June 12
- 1-2 leaf June 21 - 2-4 leaf June 27
July 10 June 28 October 11

5th EWRS Workshop on Physical Weed Control 131Pisa, Italy, 11-13 March 2002
Herbicides were applied with a tractor mounted, compressed air sprayer which delivered a spray volume of 200 L ha-1 and at a pressure of 214 kPa. Physical methods of weed control included a 4-row propane flamer, a flex tine, 4-row finger weeder (Lely), and a 2-row, multi-head rotovator. The propane flamer was adjusted to provide a 30 cm wide treatment band over the potato row in a single pass. The finger weeder was set to operate at a depth of 2 to 3 cm and was operated once in each direction through the plot. Each head on the rotovator tilled an area 60 cm wide between the two potato rows and weed control treatments within the potato row are describe within the individual experiments. All plots were hilled before row closure. Weed counts and dry weight of individual species was obtained by harvesting all weeds present in three quadrats measuring 25 cm x 100 cm from each plot, drying at 800 C for 48 hrs, and weighing. The quadrats were placed between the potato rows with the short side parallel to the row direction. At maturity, the two centre plot rows were harvested using a one-row mechanical harvester and tubers were mechanically graded to obtain marketable and total yield and tuber specific gravity was determined. In all experiments, data for weed weight and potato yield were subjected to ANOVA by year and combined across years using ANOVA techniques (Genstat 5 Committee, 1987), and as there were significant interactions between years, individual year data was presented.
Physical Methods An experiment was conducted in 1998 and 1999 to compare efficacy of weed control with a rotovator, flamer and finger weeder. Treatments were applied at potato emergence or two weeks after potato emergence when potatoes were 8 to 20 cm tall. Weeds were at the 1 to 4 leaf stage at potato emergence and were at the 3 to 10 leaf stage when treated two weeks after potato emergence.
An experiment was conducted in 2000 to compare using a single cultivation at potato emergence, a single cultivation two weeks after potato emergence, or a combination of at potato emergence and again two weeks after potato emergence for weed control efficacy. Treatments were applied at potato emergence or two weeks after potato emergence when potatoes were 8 to 15 cm tall. Weeds were at the 1 to 3 leaf stage when treated at potato emergence and at the 4 to 7 leaf stage when treated after potato emergence.
Banded Herbicides In 1998 and 1999 selected herbicides were applied in a 30 cm wide band over the potato row and the area between the row was cultivated using the rotovator. Rates of application of the herbicides were: metribuzin, 0.5 kg ai ha-1, linuron, 1.0 kg ai ha-1, paraquat, 0.5 kg ai ha-1, and glyphosate, 0.5 kg ai ha-1. The herbicides metribuzin and linuron were applied pre-emergence within 5 days after potato planting. Paraquat and glyphosate were applied just prior to crop emergence when weeds were at the 1 to 3 leaf stage. The rotovator was used between the rows when the first flush of weeds was in the 2 to 6 leaf stage.
Time of Flaming An experiment was conducted in 2000 to determine the effectiveness of flaming for weed control and effect on potato yield. Flaming was conducted at three stages of development corresponding to when weeds were in the cotyledon stage, at the 1 to 2, or at the 2 to 4 leaf stage. Additional treatments included flaming once at cotyledon and again at the 1 to 2 leaf stage or flaming at the 1 to 2 and again at the 2 to 4 leaf stage. Flaming was done as a 30 cm band centred over the top of the potato row. These treatments were compared to the standard broadcast herbicide treatment of metribuzin applied at 0.5 kg ai ha-1.

5th EWRS Workshop on Physical Weed Control 132Pisa, Italy, 11-13 March 2002
Results
Physical Methods Predominant weeds in the experiment areas in both 1998 and 1999 were Raphanus raphanistrum, Chenopodium album and Elytrigia repens with several other species in low numbers. Weed biomass was different between the two years with 1999 having much greater weed biomass than in 1998 (Table 2). There was no difference in weed control between time of treatment with any method used. The rotovator gave excellent control between the rows in both years at weed data collection but there was no control within the row. Weed biomass was collected between the row before row closure but a second flush of weeds occurred. The flamer and finger weeder controlled weeds over the whole plot but one treatment was not sufficient to give long term control. The low biomass of later emerging weeds in 1998 had no effect on potato marketable and total yield whereas, the greater weed biomass in 1999 reduced yield in the rotovator treatment applied at ground crack but not when applied post. Hilling after weed data collection helped control weeds in all plots but weeds were well established in the potato row of the rotovator plots.
Table 2. Effect of different physical methods of weed control in potatoes on weed biomass and tuber yield.
Yield (tha-1) Control method
Time applied Total weed biomass
g m-1 D.M. Marketable Total
1998 1999 1998 1999 1998 1999
Rotovator Emergence 6.7 2.3 33.7 18 37 22.6
Rotovator 2 wks after emergence
2.1 8.8 29.5 22.7 32.4 29.1
Flamer Emergence 7.2 120.6 33.6 25.9 36.7 37.6
Flamer 2 wks after emergence
14.9 115.4 32.8 26.8 36.5 38.6
Finger weeder
Emergence 17.7 107.5 30.9 25.8 34.4 35.9
Finger weeder
2 wks after emergence
29.9 99.9 29.1 25.3 31.8 34.8
SED (15 df) 4.9 15.3 2.4 1.9 7.6 2.9
Predominant weeds in the experiment area in 2000 were R. raphanistrum, C. album and Spergula arvensis with several other species in low numbers. As in the previous experiment the rotovator provided weed control between the rows but not in the row. The flamer gave the highest level of control followed by the finger weeder (Table 3). There was no difference between times of application either alone or when combined in any method used for weed control. Potato marketable and total yield was not different between methods of control but within methods of control there were differences in times of application. Yield was less with the flamer used after crop emergence suggesting effects on crop growth and recovery as weed control was complete. Yield was less with
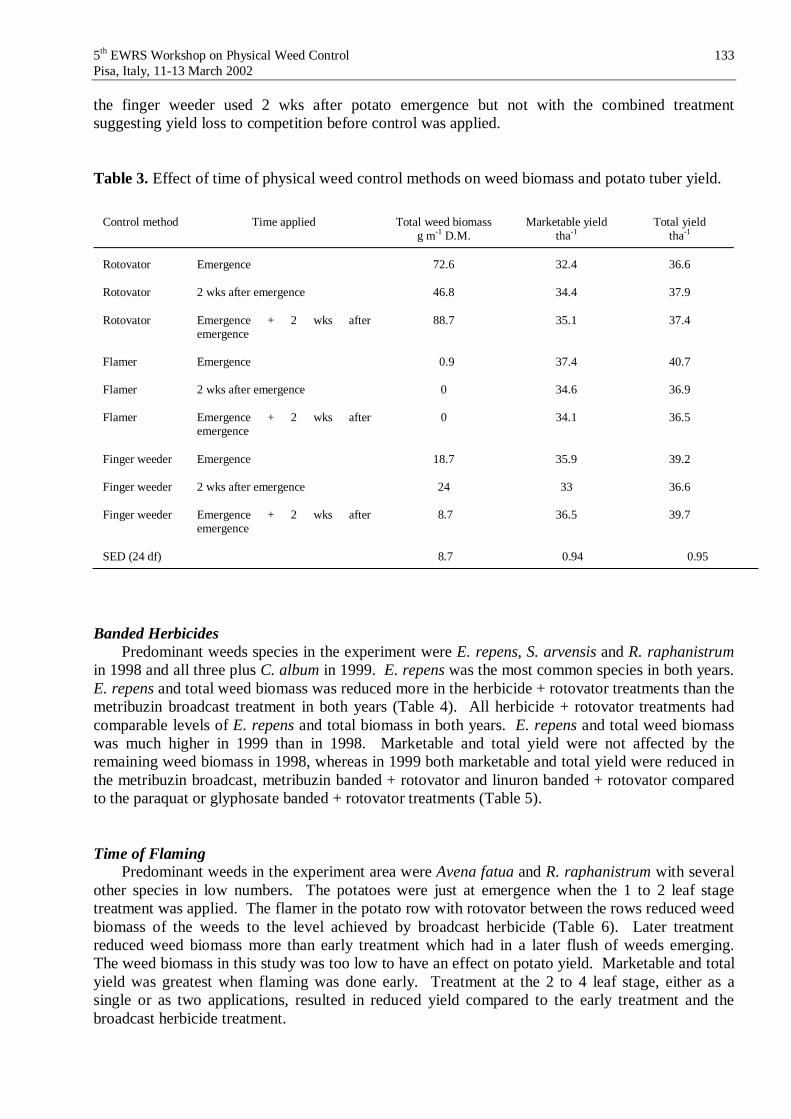
5th EWRS Workshop on Physical Weed Control 133Pisa, Italy, 11-13 March 2002
the finger weeder used 2 wks after potato emergence but not with the combined treatment suggesting yield loss to competition before control was applied.
Table 3. Effect of time of physical weed control methods on weed biomass and potato tuber yield.
Control method Time applied Total weed biomass g m-1 D.M.
Marketable yield tha-1
Total yield tha-1
Rotovator Emergence 72.6 32.4 36.6
Rotovator 2 wks after emergence 46.8 34.4 37.9
Rotovator Emergence + 2 wks after emergence
88.7 35.1 37.4
Flamer Emergence 0.9 37.4 40.7
Flamer 2 wks after emergence 0 34.6 36.9
Flamer Emergence + 2 wks after emergence
0 34.1 36.5
Finger weeder Emergence 18.7 35.9 39.2
Finger weeder 2 wks after emergence 24 33 36.6
Finger weeder Emergence + 2 wks after emergence
8.7 36.5 39.7
SED (24 df) 8.7 0.94 0.95
Banded Herbicides Predominant weeds species in the experiment were E. repens, S. arvensis and R. raphanistrumin 1998 and all three plus C. album in 1999. E. repens was the most common species in both years. E. repens and total weed biomass was reduced more in the herbicide + rotovator treatments than the metribuzin broadcast treatment in both years (Table 4). All herbicide + rotovator treatments had comparable levels of E. repens and total biomass in both years. E. repens and total weed biomass was much higher in 1999 than in 1998. Marketable and total yield were not affected by the remaining weed biomass in 1998, whereas in 1999 both marketable and total yield were reduced in the metribuzin broadcast, metribuzin banded + rotovator and linuron banded + rotovator compared to the paraquat or glyphosate banded + rotovator treatments (Table 5).
Time of Flaming Predominant weeds in the experiment area were Avena fatua and R. raphanistrum with several other species in low numbers. The potatoes were just at emergence when the 1 to 2 leaf stage treatment was applied. The flamer in the potato row with rotovator between the rows reduced weed biomass of the weeds to the level achieved by broadcast herbicide (Table 6). Later treatment reduced weed biomass more than early treatment which had in a later flush of weeds emerging. The weed biomass in this study was too low to have an effect on potato yield. Marketable and total yield was greatest when flaming was done early. Treatment at the 2 to 4 leaf stage, either as a single or as two applications, resulted in reduced yield compared to the early treatment and the broadcast herbicide treatment.

5th EWRS Workshop on Physical Weed Control 134Pisa, Italy, 11-13 March 2002
Table 4. Effect of herbicide in 30 cm band over row and rotovator between row on weed species biomass.
Control method Weed biomass - 1998 g m-1 D.M.
Weed biomass - 1999 g m-1 D.M.
Elytrigia repens
Total Elytrigia repens
Total
Metribuzin band + rotovator 0.68 2.44 3.55 14.8
Linuron band + rotovator 1.19 2.36 13.25 24.6
Paraquat band + rotovator 0.48 2.1 1.4 3.6
Glyphosate band + rotovator 0.63 2.34 2.95 10.1
Metribuzin broadcast 9.99 13.99 23.05 27
SED (12 df) 0.75 0.91 4.66 8.1
Table 5. Effect of banded herbicide with cultivation on potato yield.
Control method Marketable yield tha-1
Total yield tha-1
1998 1999 1998 1999
Metribuzin band + rotovator 29 24 33.1 32.7
Linuron band + rotovator 29.8 23.9 33.2 31.2
Paraquat band + rotovator 30.2 27.4 33.9 40.9
Glyphosate band + rotovator 33.1 27 36.8 37.7
Metribuzin broadcast 32.7 20.5 36.1 27.2
SED (12 df) 3.1 1.3 2.7 2.6

5th EWRS Workshop on Physical Weed Control 135Pisa, Italy, 11-13 March 2002
Table 6. Effect of time of physical weed control on weed biomass and potato tuber yield.
Control method Weeds stage at
time applied Total weed
biomass g m-1 D.M.
Marketable yield tha-1
Total yield tha-1
Flamer + cultivator
Cotyledon Cotyledon
1.55 39.5 44.2
Flamer + cultivator
1-2 leaf 1-2 leaf
0.8 37.5 40.8
Flamer +cultivator
2-4 leaf 2-4 leaf
0.4 35.2 37.7
Flamer + flamer + cultivator
Cotyledon Second flush cotyledon Second flush cotyledon
0.25 35.9 38.3
Flamer + Flamer + cultivator
1-2 leaf Second flush cotyledon Second flush cotyledon
0 35.7 38.4
Metribuzin broadcast
Pre-emergence 0.7 38.9 42.7
SED (15 df) 0.53 1.1 1.
Discussion
Control of weeds using physical methods was successful in these experiments especially by the use of flaming in the potato row followed by between the row tillage. Weed biomass was reduced by the treatments and was more effective when multiple treatments were applied. Degree of reduction in weed biomass was related to the level of weeds present in the test area and at higher levels of weeds more weed biomass remained. Potato marketable and total yield was not much affected at low levels of weed biomass but at high levels of biomass yield was reduced especially in treatments where weeds were not removed in the potato row. Application of selective herbicides or use of flaming in a band over the potato row and followed by cultivation gave effective weed control and crop yields. Flaming late or using multiple flaming operations after potato emergence caused more injury to the potato foliage and resulted in reduced marketable and total potato yield. These weed control techniques are generally slower than herbicide application which can cover many more rows at a time. Recently growers of large acreages of potatoes have moved away from the standard of cultivating several times and hilling before row closure. Most large acreage growers now use a single hilling operation at potato emergence which precludes the use of cultivation for weed control after the crop emerges. It is estimated that growers on PEI use this type of hilling operation on 65% of the 45,000 ha produced each year. The need for non-chemical methods of

5th EWRS Workshop on Physical Weed Control 136Pisa, Italy, 11-13 March 2002
weed control is especially acute for those growers who wish to produce potatoes on a large scale using large equipment but without the use of or with minimal use of herbicides. Acknowledgements
The assistance of Mr. David Main in the conduct of these experiments is gratefully acknowledged.
References
ASCARD J (1988) Thermal weed control in flame treatment - a useful method for row-cultivated crops and haulm-killing in potatoes. 29th Swedish Weed Control Conference, Uppsala, January 27-28, 1988. Vol. 1 reports, p194-207.
BELINDER RR, KIRKWYLAND JJ, WALLACE RW & COLQUHOUN JB (2000) Weed control and potato (Solanum tuberosum) yield with banded herbicides and cultivation. Weed Technology 14, 30-35.
BOND W & GRUNDY AC (2001) Non-chemical weed management in organic farming systems. Weed Research 41, 383-405.
EBERLEIN CV, PATTERSON PE, GUTIERI MJ & STARK JC (1997) Efficacy and economics of cultivation for weed control in potato (Solanum tuberosum). Weed Technology 11, 257-264.
GENSTAT 5 COMMITTEE (1987) Genstat 5 Reference Manual. Oxford University Press, New York, NY.
KILPATRICK JB (1993) A comparison of cultural and chemical methods for weed control in potatoes. In Proceedings Brighton Crop Protection Conference - Weeds, Brighton, 449-454.
NELSON DC & THORESON MC (1981) Competition between potatoes (Solanum tuberosum) and weeds. Weed Science 29, 672-677.
RIOUX R, COMEAU JE & GENEREUX H (1979) Effect of cultural practices and herbicides of weed population and competition in potatoes. Canadian Journal of Plant Science 59, 367-374.
SHIMI P (2000) Use of flamer as a herbicide replacement in potato fields. Turkish Journal of Field Crops 5, 41-44.
VANGRESSEL MJ & RENNER KA (1990a) Redroot pigweed (Amaranthus retroflexus) and barnyardgrass (Echinochloa crus-galli) interference in potatoes (Solanum tuberosum). Weed
Science 38, 338-343. VANGRESSEL MJ & RENNER KA (1990b) Effect of soil type, hilling time, and weed
interference on potato (Solanum tuberosum) development and yield. Weed Technology 4, 299-305.

5th EWRS Workshop on Physical Weed Control 137 Pisa, Italy, 11-13 March 2002
Different combinations of weed management methods in organic carrot
L. Radics, I. Gál, P. Pusztai Szent István University
Faculty of Horticultural Science Department of Ecological and Sustainable Production Systems
Budapest, Hungary
Abstract
We are comparing 14 combinations of mechanical and also physical weed management techniques for organic growing of carrot. Crop of our weed management research is carrot because of its difficulties in weed management (long growing period, poor weed tolerance) and because carrot needs to be important product of organic farming.
Untreated weedy and herbicide treated plots are the control ones - cultivator, weed brush, hoe, hand weeding are used for mechanical control and flame weeder for physical control.
Measurements are covering of weeds and carrot and dry mass of them. We show now the results of last two years from our long-term experiment. Results of the year 2000 showed that weed brush is the best in interrows for keeping clean but
in 2001 cultivator combined with hand weeding in rows seems to show the best results. As this example shows agriculture and weed management depends very much on the weather
of the year, but we try to evolve a method, which can be generally used for organic weed control of carrot.
Introduction
Because of environmental aspects and because of the increasing demand for vegetables come from ecological farms, more and more farmers convert their conventional farming systems into ecological farming, not at last because they want to disregard herbicides from production. (VEREIJKEN & KROPFF, 1996)
Most of the problems caused by weeds occur in the plant of vegetable crop rotation, which has weak competition ability. Plants, like carrot with slow initial development are very sensitive for weediness (TURNER, 2000). If the main tool of weed management is still herbicide, these weed-sensitive plants increase the amount of utilised herbicide of vegetable production in general.
We have chosen carrot as crop plant because of its wide spacing and its slow initial development, so it has high weed management risk (BILALIS D et al. 2001). Carrot is important basic material for healthy food so we need large amount of it from ecological production.
One of the most important questions of environmentally sound plant production is weed management (TU M et al. 2000). The other important thing is to examine not only the successfulness of weed management but also the yield of the crops, because our aim is – for keeping biodiversity (KRISTIANSEN P et al. 2001) - only to decrease weediness under the level of damage to production and yield and not to destroy them.
Moreover with spreading of environmentally sound farming, development of its production technology become more and more important (VEREIJKEN & KROPFF, 1996).
Farmers growing crops organically often expect to achieve good control by using only one mechanical weeder type. It is important therefore that the correct machine is selected. (PULLEN, 1999)

5th EWRS Workshop on Physical Weed Control 138 Pisa, Italy, 11-13 March 2002
Materials and Methods
This is a field experiment with 15 treatments and 4 repetitions. Soil cultivation was making fine seedbed for carrot. Herbicide utilisation was preemergent with mixture of DUAL 960 EC (20mL 100 m-2) and
Maloran 50 WP (20 g 100 m-2)Used carrot variety was Nanti with 75 cm row distance. Sowing depth was 3 cm. Times of sowing were 12. 07. 2000. (second sowing) and 04. 04. 2001.
Ecological circumstances Soil type is restrainedly deep chernozem-like sandy soil. Soil forming rock is calcareous sand.
Depth of humic layer is 30-40 cm. Soil is fast warmer, with good water permeability and good air capacity. The disadvantage of this soil type, it is inclined to quick cooling down and drying out. Weakly calciferous, faintly alkaline soil.
Climate: Precipitation of growing season in 2000 were significantly lower (223 mm) than in the average 1999 year (480 mm) in the same period. During this period the average monthly temperature was higher with about 10% and because of this dual effects a significant depression were detected in case of lack of irrigation.
After continuous drought of the year 2000, precipitation of 2001 was enough for emerging and growing of carrot but also increased weediness.
We did not use any irrigation.
TreatmentsIn rows:- weedy control,- hand weeding,- herbicide, - weed flaming
In interrows: - weedy control,- hoeing, herbicide,- weed flaming, - cultivator, - weed brush
Combinations of treatments:1. Control2. Herbicide on the whole surface 3. Herbicide in the rows + cultivator in the interrows 1x 4. Herbicide in the rows + weed brush in the interrows 1x 5. Herbicide in the rows + hoeing in the interrows 1x 6. Weeding in the rows 1x + cultivator in the interrows 1x 7. Weeding in the rows 1x + cultivator in the interrows 2x 8. Weed flaming on whole surface + cultivator in the interrows 1x 9. Weed flaming on whole surface + cultivator in the interrows 2x 10. Weeding in the rows 1x + weed brush in the interrows 1x 11. Weeding in the rows 1x + weed brush in the interrows 2x 12. Weed flaming on whole surface + weed brush in the interrows 1x 13. Weed flaming on whole surface + weed brush in the interrows 2x 14. Weeding in the rows according to need + weed brush in the interrows 2x 15. Weeding in the rows according to need + cultivator in the interrows 2x

5th EWRS Workshop on Physical Weed Control 139 Pisa, Italy, 11-13 March 2002
Sampling- weed surveys: right before and two weeks
after treatments - dry mass of weeds, of root and leaf of
carrot right before and two weeks after treatments, both in the rows and interrows in the case of weeds (weeds have taken for measuring from 0,25 m2 in the rows and from 0,5 m2 in interrows)
Research schedule:
In 2000:19. 07. - sampling 21. 07. - weed flaming in 8. 9. 12. 13. treatments herbicide in 2., 3., 4. 5. treatments 02. 08. - sampling 03. 08. - cultivator in 3., 6., 7., 8., 9., 15. treatments weed brush in 4., 10., 11., 12., 13., 14. treatments 16. 08. - sampling 28. 08. - cultivator in 7., 9., 15. treatments weed brush in 11., 13., 14. treatments hand weeding in 6., 7., 10., 11., 14., 15. treatments hoeing in 5. treatment 12. 09. - sampling 29. 09. - hand weeding in 14., 15. treatments 13. 10. - sampling
In 2001:19. 04. - sampling 19. 04. - weed flaming in 8. 9. 12. 13. treatments herbicide in 2., 3., 4. 5. treatments 02. 05. - sampling 09. 05. - sampling 14. 05. - cultivator in 3., 6., 7., 8., 9., 15. treatments weed brush in 4., 10., 11., 12., 13., 14. treatments hand weeding in 6., 7., 10., 11., 14., 15. treatments 30. 05. - sampling 15. 06. - sampling 25. 06. - cultivator in 7., 9., 15. treatments weed brush in 11., 13., 14. treatments hoeing in 5. treatment 09. 07. - sampling 09. 08. - sampling 10. 08. - hand weeding in 14., 15. treatments 23. 08. - sampling19. 09. - sampling
We used SPSS 9.0 program for analysing data and Tukey’s test for comparing means.
Results
In the year 2000 we did not find any significant differences between the weed cover of treatments at the first survey so we found that experiment area was homogenous in view of weediness.
We can make homogenous groups from dry mass of weeds in rows in herbicide treatments (treatments 2., 3., 4., 5.). Two weeks after the first treatments herbicide treatments made statistically homogenous group and caused significantly lower mass of weeds than flamed ones (Fig. 1.).

5th EWRS Workshop on Physical Weed Control 140 Pisa, Italy, 11-13 March 2002
Legend: 1. Control2. Herbicide3. Herbicide in rows + cultivator in interrows 1x 4. Herbicide in rows + weed brush in interrows 1x 5. Herbicide in rows + hoeing in interrows 1x 6. Weeding in rows 1x + cultivator in interrows 1x 7. Weeding in rows 1x + cultivator in interrows 2x 8. Weed flaming + cultivator in interrows 1x 9. Weed flaming + cultivator in interrows 2x
10. Weeding in rows 1x weed brush in interrows 1x 11. Weeding in rows 1x + weed brush in interrows 2x 12. Weed flaming + weed brush in interrows 1x 13. Weed flaming + weed brush in interrows 2x 14. Weeding in rows according to need + weed brush in interrows
2x15. Weeding in rows according to need + cultivator in interrows
2x
Figure 1. Dry mass of weeds in rows. Sample from 02. 08. 2000.
Legend: 1. Control2. Herbicide3. Herbicide in rows + cultivator in interrows 1x 4. Herbicide in rows + weed brush in interrows 1x 5. Herbicide in rows + hoeing in interrows 1x 6. Weeding in rows 1x + cultivator in interrows 1x 7. Weeding in rows 1x + cultivator in interrows 2x 8. Weed flaming + cultivator in interrows 1x
9. Weed flaming + cultivator in interrows 2x 10. Weeding in rows 1x weed brush in interrows 1x 11. Weeding in rows 1x + weed brush in interrows 2x 12. Weed flaming + weed brush in interrows 1x 13. Weed flaming + weed brush in interrows 2x 14. Weeding in rows according to need + weed brush in interrows 2x 15. Weeding in rows according to need + cultivator in interrows 2x
Figure 2. Dry mass of weeds in interrows. Sample from 16. 08. 2000.

5th EWRS Workshop on Physical Weed Control 141 Pisa, Italy, 11-13 March 2002
In interrows (Fig. 2.) weed brush treatments (treatments 4., 10., 11., 12., 13., 14.) made significantly lower dry mass of weeds and they made statistically homogenous group. Utilisation of cultivator in interrows (treatments 3., 6., 7., 8., 9., 15.) seemed to be less effective with its two outstanding values (treatments 6., 8.). Herbicide, utilised on the whole surface (treatment 2.) is still effective one month after its passing out.
At the end of the growing season every treatments decreased the dry mass of weeds in the rows compared to untreated control (Fig. 3.). Weeding in the rows according to need was the most effective from all treatments and these ones (treatments 14., 15.) made a homogenous group too.
Legend: 1. Control2. Herbicide3. Herbicide in rows + cultivator in interrows 1x 4. Herbicide in rows + weed brush in interrows 1x 5. Herbicide in rows + hoeing in interrows 1x 6. Weeding in rows 1x + cultivator in interrows 1x 7. Weeding in rows 1x + cultivator in interrows 2x 8. Weed flaming + cultivator in interrows 1x
9. Weed flaming + cultivator in interrows 2x 10. Weeding in rows 1x weed brush in interrows 1x 11. Weeding in rows 1x + weed brush in interrows 2x 12. Weed flaming + weed brush in interrows 1x 13. Weed flaming + weed brush in interrows 2x 14. Weeding in rows according to need + weed brush in interrows 2x 15. Weeding in rows according to need + cultivator in interrows 2x
Figure 3. Dry mass of weeds in rows. Sample from 13. 10. 2000.
At the end of the growing season herbicide, utilised on the whole surface (treatment 2.) lost all of its effect and we found higher mass of weeds in these interrows than in the interrows of untreated control (Fig. 4.).
Utilisation of weed brush gave better results for the end of the growing season than cultivator treatments except treatment 15.
Cultivator (treatments 7., 9., 15.) and also weed brush used twice (treatments 11., 13., 14.) showed better results in all cases than if we used them once (cultivator: treatments 3., 6., 8.) (weed brush: treatments 4., 10., 12.).
Higher mass of weeds were observable in all cases when utilisation of cultivator or weed brush was combined with weed flaming in interrows. Relying upon these findings utilisation of weed flaming is not seemed to be economic. Beside this we can find that weed flaming combined with two mechanical interrow treatments like cultivator and weed brush (treatments 9, 13) was more effective than we used them only on one occasion (treatments 8, 12).

5th EWRS Workshop on Physical Weed Control 142 Pisa, Italy, 11-13 March 2002
Legend: 1. Control2. Herbicide3. Herbicide in rows + cultivator in interrows 1x 4. Herbicide in rows + weed brush in interrows 1x 5. Herbicide in rows + hoeing in interrows 1x 6. Weeding in rows 1x + cultivator in interrows 1x 7. Weeding in rows 1x + cultivator in interrows 2x 8. Weed flaming + cultivator in interrows 1x
9. Weed flaming + cultivator in interrows 2x 10. Weeding in rows 1x weed brush in interrows 1x 11. Weeding in rows 1x + weed brush in interrows 2x 12. Weed flaming + weed brush in interrows 1x 13. Weed flaming + weed brush in interrows 2x 14. Weeding in rows according to need + weed brush in interrows 2x 15. Weeding in rows according to need + cultivator in interrows 2x
Figure 4. Dry mass of weeds in interrows. Sample from 13. 10. 2000.
It can give interesting results to examine weeds, which are arranged in groups by life forms:
T = therophyte T1 – plants, which are spearing in fall and ripening in springT2 – plants, which are spearing in fall and ripening in the beginning of summerT3 – plants, which are spearing in spring and ripening in the beginning of summerT4 – plants, which are spearing in spring and ripening in the end of summer
G = geophyte (plants, which are overwintering on the soil surface or under soil and has slanting or horizontal underground stem) G1 - plants, which have stole near to the soil surfaceG3 - plants, which have stole in deeper and many levels of the soil
Results of weed survey arranged to groups by life forms show that weeds of the examination are mainly members of the T life form group.
Herbicide treatment applied on the whole surface reduced the cover of weeds of T-life from. On the other hand this treatment had no effect on the weeds of G-life form and what is more, herbicide made better life circumstances for these weeds with driving back of T-life formed weeds and promoted their spread.
Under the influence of mechanical weed control occurred twice in interrows, cover of geophyte weeds increased, which is explainable with cutting up stoles and rhizomes. The same treatment had the opposite effect on T-life formed weeds: efficiently reduced their cover in all cases.
On perennial weeds there was no significant effect of any row treatments. With one-time hand weeding of rows we found no significantly better result not in any life
form groups, than in the case of any other treatments in the rows. Even repeated hand weeding caused significantly lower weed cover but only in the case of T4-life form group.

5th EWRS Workshop on Physical Weed Control 143 Pisa, Italy, 11-13 March 2002
In the year 2001 at the beginning of the growing season every treatments decreased the dry mass of weeds in the rows compared to untreated control.
If we examine the question of weed cover with life form groups than also weed flaming and herbicide utilisation caused significant reduction only on the weed species of T4-life form group in rows and interrows alike.
Cultivator-treated interrows make statistically homogeneous group (Fig. 5.) and are different from weed brush-treated ones, in which cover of T4-weeds were much higher two weeks after the treatment.
Legend: 1. Control2. Herbicide3. Herbicide in rows + cultivator in interrows 1x 4. Herbicide in rows + weed brush in interrows 1x 5. Herbicide in rows + hoeing in interrows 1x 6. Weeding in rows 1x + cultivator in interrows 1x 7. Weeding in rows 1x + cultivator in interrows 2x 8. Weed flaming + cultivator in interrows 1x
9. Weed flaming + cultivator in interrows 2x 10. Weeding in rows 1x weed brush in interrows 1x 11. Weeding in rows 1x + weed brush in interrows 2x 12. Weed flaming + weed brush in interrows 1x 13. Weed flaming + weed brush in interrows 2x 14. Weeding in rows according to need + weed brush in interrows 2x 15. Weeding in rows according to need + cultivator in interrows 2x
Figure 5. Cover of weeds in T4 life form group in interrows. Sample from 30. 05. 2001.
These differences are observable one month after the treatment, so cultivator can be called effective for a relative long term in interrows against annual weeds, which germinate from seed.
After the next interrow treatments hoeing and cultivator caused the lowest dry mass of weeds. Hoeing decreased better the mass of weeds, maybe because of greater preciseness of this method, but we have to take notice of the lack of manpower and its costs.
At the end of the growing season significantly lower weed cover was observable in rows in the following treatments: herbicide on the whole surface (treatment 2.), herbicide in the rows and hoeing in the interrows 1x (treatment 5.), weeding in the rows according to need and weed brush in the interrows 2x (treatment 14.), weeding in the rows according to need and cultivator in the interrows 2x (treatment 15.).
Among the above mentioned treatments the last one (treatment 15.) showed the best results in weed cover and in dry mass of weeds too (Fig. 6.).
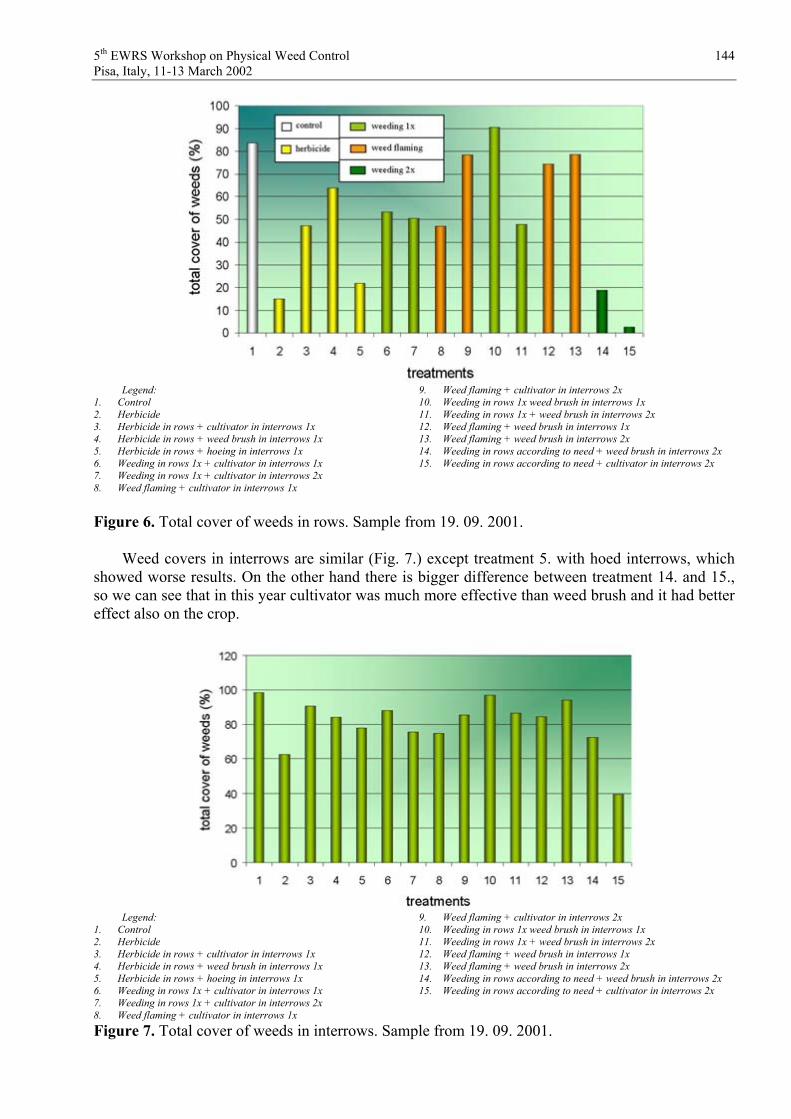
5th EWRS Workshop on Physical Weed Control 144 Pisa, Italy, 11-13 March 2002
Legend: 1. Control2. Herbicide3. Herbicide in rows + cultivator in interrows 1x 4. Herbicide in rows + weed brush in interrows 1x 5. Herbicide in rows + hoeing in interrows 1x 6. Weeding in rows 1x + cultivator in interrows 1x 7. Weeding in rows 1x + cultivator in interrows 2x 8. Weed flaming + cultivator in interrows 1x
9. Weed flaming + cultivator in interrows 2x 10. Weeding in rows 1x weed brush in interrows 1x 11. Weeding in rows 1x + weed brush in interrows 2x 12. Weed flaming + weed brush in interrows 1x 13. Weed flaming + weed brush in interrows 2x 14. Weeding in rows according to need + weed brush in interrows 2x 15. Weeding in rows according to need + cultivator in interrows 2x
Figure 6. Total cover of weeds in rows. Sample from 19. 09. 2001.
Weed covers in interrows are similar (Fig. 7.) except treatment 5. with hoed interrows, which showed worse results. On the other hand there is bigger difference between treatment 14. and 15., so we can see that in this year cultivator was much more effective than weed brush and it had better effect also on the crop.
Legend: 1. Control2. Herbicide3. Herbicide in rows + cultivator in interrows 1x 4. Herbicide in rows + weed brush in interrows 1x 5. Herbicide in rows + hoeing in interrows 1x 6. Weeding in rows 1x + cultivator in interrows 1x 7. Weeding in rows 1x + cultivator in interrows 2x 8. Weed flaming + cultivator in interrows 1x
9. Weed flaming + cultivator in interrows 2x 10. Weeding in rows 1x weed brush in interrows 1x 11. Weeding in rows 1x + weed brush in interrows 2x 12. Weed flaming + weed brush in interrows 1x 13. Weed flaming + weed brush in interrows 2x 14. Weeding in rows according to need + weed brush in interrows 2x 15. Weeding in rows according to need + cultivator in interrows 2x
Figure 7. Total cover of weeds in interrows. Sample from 19. 09. 2001.

5th EWRS Workshop on Physical Weed Control 145 Pisa, Italy, 11-13 March 2002
In ineffectiveness of weed brush had big role the dry weather at the time of occurrence, which reduced effectiveness of weed brush with higher rate than in the case of cultivator. Because of dry soil surface weed brush only rubbed off the leaves of weeds and was not able to penetrate into the topsoil where it could better destroy annual weeds, which germinate from seed.
This difference was observable until the end of growing season but at that time with much lower rate.
Legend: 1. Control2. Herbicide3. Herbicide in rows + cultivator in interrows 1x 4. Herbicide in rows + weed brush in interrows 1x 5. Herbicide in rows + hoeing in interrows 1x 6. Weeding in rows 1x + cultivator in interrows 1x 7. Weeding in rows 1x + cultivator in interrows 2x 8. Weed flaming + cultivator in interrows 1x
9. Weed flaming + cultivator in interrows 2x 10. Weeding in rows 1x weed brush in interrows 1x 11. Weeding in rows 1x + weed brush in interrows 2x 12. Weed flaming + weed brush in interrows 1x 13. Weed flaming + weed brush in interrows 2x 14. Weeding in rows according to need + weed brush in interrows 2x 15. Weeding in rows according to need + cultivator in interrows 2x
Figure 8. Dry mass of carrot roots. Sample from 19. 09. 2001.
Cultivator, and hoeing had better effect on the growing of carrot than weed brush had (Fig. 8.) so moving the soil in interrows serves not just for weed control but it is good also for the crop plant. Apart from the fact that weeds in interrows meant concurrence for carrot, moving of soil in a larger extent can also help growing of carrot – surely cultivator and hoeing cause larger soil moving than weed brush.
It is noticeable that we reached the lowest weed cover and dry weed mass and the highest yield of carrot in treatment with cultivator occurred twice in interrows and weeding in rows according to need (treatment 15.). The second best treatment was herbicide utilised on whole surface but the difference from the other treatments was not significant in this case.
Discussion
In 2000. under extremely dry and warm circumstances we took the following conclusions: - herbicide treatment was the most effective treatment - weed brush was more effective in weed management than cultivator - both equipment gave satisfactory results if we occurred them twice - mechanical weed control reduced cover of therophyte weeds but increase the cover of
geophyte weeds

5th EWRS Workshop on Physical Weed Control 146 Pisa, Italy, 11-13 March 2002
In 2001. under less dry circumstances: - the most effective treatment was weeding in rows according to need and cultivator in
interrows occurred twice - because the above mentioned treatment combination was more effective, than herbicide
utilisation and it had higher yield increasing effect too, we can say that herbicide utilisation can be taken out from ecological carrot production
- cultivator occurred twice and many times row weeding cause higher expenses which is common in ecological farming. But in the same time it give higher yield and also product of higher value
- weed brush showed very bad effectiveness even if we occurred it twice. To choose the time of its utilisation needs more attention than in the case of cultivator (PULLEN D. 1999)
- higher carrot cover was in the treatment with lower weed cover
Acknowledgements
OTKA T 030346 supported experiment.
References
BILALIS D, EFTHIMIADIS P, SIDIRAS N (2001) Effect of three tillage systems on weed flora in a 3-year rotation with four crops, Journal of Agronomy and Crop Science 186 (2), 135-141.
KRISTIANSEN P, SINDEL B, JESSOP R (2001) The importance of diversity in organic weed management
PULLEN D (1999) Field work, A look at the performance of different field weeders, Organicfarming 61, 18-19.
TU M, HURD C, RANDALL JM (2001) Weed Control Methods Handbook, The Nature Conservancy
TURNER B (2000) The heat is on – thermal weed control, Organic farming 65, 17-18. VEREIJKEN P & KROPFF MJ (1996) Prototyping ecological farming systems. In: Annual Report
of the DLO Research Institute for Agrobiology and Soil Fertility, Wageningen, the Netherlands

5th EWRS Workshop on Physical Weed Control 147 Pisa, Italy, 11-13 March 2002
Options for mechanical weed control in grain maize – effects on weeds
M. Raffaelli1, P. Bàrberi2, A. Peruzzi1 & M. Ginanni3
1D.A.G.A.E., Settore Meccanica Agraria, Università di Pisa, Italy; 2Scuola Superiore Sant’Anna, Pisa, Italy; 3Centro Interdipartimentale di Ricerche Agro-ambientali E. Avanzi, S. Piero a Grado,
Pisa, Italy
Abstract
Two field experiments were carried out in 2000 and 2001 on a loamy soil to test different options for mechanical weed control (harrowing or hoeing) in grain maize (Zea mays L.) sown in 50 cm-spaced rows. The first experiment tested different four tine adjustments of a 3 m-wide spring-tine harrow equipped with 6 mm-diameter tines. The second experiment compared four different hoeing techniques: (1) a PTO-powered rotary hoe, (2) a precision hoe with sweep and goose-foot shares, (3) a precision hoe (as before) + torsion weeder, (4) a precision hoe (as before) + torsion weeder with tines crossed. Each treatment was replicated three times. Both experiments also included a weedy check. In both experiments, weed density was sampled by species just before and two weeks after the treatment in one fixed quadrat (100 x 50 cm) per plot, used later also for the determination of weed biomass at maize harvest. Results of both experiments indicated that: (1) short-term weed density reduction, although often considerable in absolute values, did not seem related neither to weed biomass at harvest nor to maize yield; (2) maize yield was higher with hoeing than with harrowing but was likely influenced by factors other than weed control; (3) there is no clear advantage in using one adjustment of the spring-tine harrow or one hoeing implement over the others and, for this reason, further research is needed.
Introduction
Grain maize (Zea mays L.) is one of the major arable crops in Italy. Conventional maize production is often based on continuous cropping of the cereal, high input of nitrogen fertilisers and use of residual herbicides (e.g. triazines) that altogether pose a serious environmental threat. As such, sustainable maize production, amongst other things, relies on the development of effective alternatives to broadcast herbicide application. Integrated maize systems can include low-rate or banded herbicide spraying coupled with mechanical weeding (Pleasant et al., 1994; Buhler et al.,1995; Leblanc et al., 1995) and/or the use of cover crops to suppress weeds (Teasdale et al., 1991; Burgos & Talbert, 1996; Bàrberi & Mazzoncini, 2001). The optimisation of mechanical weed control is obviously particularly important in organic maize production, where to date mechanical implements represent the most widespread and economically viable option for direct weed control.
The aim of this study was to compare the effects on weeds of different harrowing and hoeing treatments used for direct weed control in grain maize. Results on work parameters of the different technical options and on crop yield are reported elsewhere (Raffaelli et al., 2002).
Materials & Methods
In 2000 and 2001, two field experiments were carried out on a loamy soil at the Centro Interdipartimentale di Ricerche Agro-ambientali E. Avanzi of the University of Pisa (43°40' lat. N,

5th EWRS Workshop on Physical Weed Control 148 Pisa, Italy, 11-13 March 2002
10°19' long. E) to evaluate different options (harrowing or hoeing) for mechanical weed control in grain maize. In both experiments, the soil, that in the previous year hosted a winter wheat (Triticum aestivum L.) crop, was mouldboard-ploughed at ca. 30 cm depth in winter. The false seedbed technique was used in 2001 only. The crop received pre-sowing mineral fertilisation with 80 kg ha-1
N, 120 kg ha-1 P2O5 and 120 kg ha-1 K2O. Further 160 kg ha-1 N were top-dressed at the 4th leaf stage. Maize cv. PR34B23 (FAO class 500) was sown on 6 May 2000 and 2 May 2001 in 50 cm-spaced rows at a seeding rate of 8.1 seeds m-2.
Harrowing experiment The harrowing experiment compared four tine adjustments of a 3 m-wide Malin spring-tine harrow equipped with 6 mm-diameter tines. Tine adjustments were: –30°, -15°, 0° and +15°, where values represent the angle between the upper part of the tine and the perpendicular to the soil surface (Fig. 1). The harrow was passed only once, on 19 June 2000 and 31 May 2001, when maize was at the 4th and 3rd leaf stages respectively.
Fig. 1. Shape and possible adjustments of the tines of the spring-tine harrow: = 135°, -45° +15°. The arrow indicates the driving direction.
Hoeing experiment The hoeing experiment compared four weed control implements: (1) a PTO-powered rotary hoe, (2) a precision hoe with sweep and goose-foot shares, (3) a precision hoe (as before) + torsion weeder (PH + TW), (4) a precision hoe (as before) + torsion weeder operated with the tines crossed (PW + TWC). Hoeing was performed only once, on the same dates of the harrowing treatments and at the same crop growth stages.
In both experiments, a weedy check was included and treatments were allocated in a randomised complete block design with three replicates. Size of the elementary plots was 25 m length by 3 m width in both experiments.
Data collection and analysis In both experiments, plant density (crop and weeds) was sampled by species just before weed control treatments (on 19 June 2000 and 29 May 2001) and ca. two weeks after the treatments (on 3 July 2000 and 15 June 2001) in one fixed quadrat (100 x 50 cm) per plot, divided into an outer and inner part to account separately for between-row and within-row weed control. The same quadrats were used for sampling weed biomass at maize harvest (on 13 October 2000 and 26 September 2001). The collected biomass was divided by species and placed in an oven at 80°C until constant weight. Data shown in this paper refer to the whole quadrat size.
+ -

5th EWRS Workshop on Physical Weed Control 149 Pisa, Italy, 11-13 March 2002
Plant density and biomass of the total weed community and of major species were subjected to statistical analysis. Crop and weed densities after mechanical weed control were expressed as percent reduction relative to initial plant density. Prior to ANOVA, data were arcsine-, square root- or log- transformed, as appropriate (Gomez & Gomez, 1984). Treatment means were separated by a LSD test at P 0.05. Data shown in tables are back-transformed means.
Results
Harrowing experiment Total weed density just before weed control treatments was much higher in 2000 (99.8 plants m-2) than in 2001 (12.4 plants m-2), a likely consequence of the application of the false seedbed technique in the second year. In both years, the weed community was dominated by Amaranthus retroflexus (69.8% and 40.9% of total density in 2000 and 2001 respectively), while initial presence of Solanum nigrum in 2000 (20.8%) and of Convolvulus arvensis in 2001 (12.9%) was also noteworthy.
Maize was not uprooted at all by harrowing in 2000, while in 2001 percent maize plant reduction was negligible (< 4%) and not influenced by tine adjustment.
In 2000, use of the more aggressive tine adjustment (+15°) increased total percent weed reduction as compared to the least aggressive one (-30°). In 2001, weed reduction was lower than in the previous year for any tine adjustments, ranging from 30.1 to 69.9% (Table 1). In the first year, A. retroflexus control was higher with +15° and 0° than with -15° and -30°, while control of S.nigrum did not change substantially among tine adjustments (Table 1).
Table 1. Harrowing experiment. Percent reduction in weed density observed in maize 14 DATa in 2000 and 17 DAT in 2001.
Amaranthusretroflexusb
Solanumnigrumb
Total weeds Tine adjustment
2000 2000 2000 2001 +15° 91.5 a 97.8 a 91.7 a 69.9 a 0° 93.2 a 95.8 a 83.3 ab 30.1 b -15° 78.4 b 96.5 a 74.8 ab 56.4 ab -30° 66.8 b 82.2 a 63.4 b 62.8 ab Weedy check 4.8 c 7.3 b 17.1 c 0.9 c aDays After Treatment. bIn 2001 density of these species was too low to perform a reliable statistical analysis. In each column, means followed by the same letter are not significantly different at P 0.05 (LSD test). Data shown are back-transformed means (following arcsine-transformation).
Total weed biomass at harvest differed significantly among treatments only in 2001, when it was higher in -15° (value not significantly different from that of the weedy check) and lower in 0° (Table 2). The former treatment also had a higher biomass of A. retroflexus in 2000 and of C. albumin 2001. Compared to the weedy check, biomass of C. arvensis in 2001 was significantly lower only in +15° (Table 2).
Hoeing experiment Like in the harrowing experiment, total initial weed density was much higher in 2000 than in 2001 (56.0 vs. 7.9 plants m-2). Initially, the weed community was dominated by Amaranthus

5th EWRS Workshop on Physical Weed Control 150 Pisa, Italy, 11-13 March 2002
retroflexus (78.1% and 32.2% of total density in 2000 and 2001 respectively) and, to a lower extent, by Solanum nigrum in 2000 (20%), and Chenopodium album (10.2%), Convolvulus arvensis(11.9%) and Datura stramonium (10.2%) in 2001.
Table 2. Harrowing experiment. Dry biomass (g m-2) of the major weed species and of total weeds observed at maize harvest in 2000 and 2001.
AmaranthusRetroflexusa
Chenopodiumalbuma
Convolvulusarvensisa
Total weeds Tine adjustment
2000 2001 2001 2000 2001 +15° 5.7 ab 3.3 ab 0.0 b 6.1 ns 15.6 bc 0° 2.4 b 0.0 b 2.6 ab 7.7 ns 2.6 c -15° 18.0 a 11.3 a 0.9 ab 18.1 ns 59.3 ab -30° 1.7 b 0.0 b 2.8 ab 7.2 ns 14.2 bc Weedy check 3.9 ab 19.7 a 12.5 a 5.4 ns 104.7 a aIn the year not shown in table, density of these species was too low to perform a reliable statistical analysis. In each column, means followed by the same letter are not significantly different at P0.05 (LSD test), ns = not significant. Data shown are back-transformed means (following log-transformation).
Hoeing treatments did not harm the crop (density reduction was 0% in 2000 and 2% in 2001). Percent reduction in weed density (Table 3) did not significantly differ among the hoeing treatments but, averaged over all the hoeing options, was higher in 2000 (76.9%) than in 2001 (48.3%). The same effect was observed on S. nigrum in 2000, while A. retroflexus density was reduced to a greater extent by the rotary hoe than by the precision hoe (Table 3).
Table 3. Hoeing experiment. Percent reduction in weed density observed in maize 14 DATa in 2000 and 17 DAT in 2001.
Amaranthusretroflexusb
Solanumnigrumb
Total weeds Treatment
2000 2000 2000 2001 Rotary hoe 94.9 a 75.0 a 96.0 a 32.9 a Precision hoe 48.3 b 75.0 a 50.4 ab 25.0 a PH + TW 73.1 ab 97.2 a 75.9 ab 79.7 a PH + TWC 85.4 ab 94.9 a 85.1 a 55.7 a Weedy check 4.8 c 7.3 b 17.1 b 0.9 b aDays After Treatment. bIn 2001 density of these species was too low to perform a reliable statistical analysis. PH + TW = precision hoe + torsion weeder, PH + TWC = precision hoe + torsion weeder with tines crossed. In each column, means followed by the same letter are not significantly different at P 0.05 (LSD test). Data shown are back-transformed means (following arcsine-transformation).
In 2000, total weed biomass at harvest was generally low but higher in PH + TW and the weedy check than in any other treatments, due to a higher biomass of A. retroflexus, the major weed (Table 4). In 2001, final biomass in the hoeing treatments was ca. one tenth of that measured in the weedy check, and lowest in PH + TWC. However, no significant differences among treatments were observed in the final biomass of the three species more abundant at maize harvest (C. album,C. arvensis and S. nigrum).

5th EWRS Workshop on Physical Weed Control 151 Pisa, Italy, 11-13 March 2002
Discussion
In the harrowing treatments, despite the usually high reduction in weed density observed 2 to 4 weeks after the pass and a much lower total weed biomass at harvest in 2001, grain yield was not significantly different to that of the weedy check (data not shown). This effect can only partly be explained by high between-plots variation. Summer drought (the crop was rainfed) may have levelled differences in maize grain yield (which ranged from 5.8 to 8.2 t ha-1) and thus masked treatment effects. Lack of significant correlation between short-term weed control by harrowing and crop and weed biomass at harvest confirms what has been previously observed in the same environment on durum wheat (Bàrberi et al., 2000).
Table 4. Hoeing experiment. Dry biomass (g m-2) of the major weed species and of total weeds observed at string bean final harvest in 2000 and 2001.
Amaranthusretroflexusa
Chenopodiumalbuma
Convolvulusarvensisa
Solanumnigruma
Total weeds
Treatment 2000 2001 2001 2001 2000 2001 Rotary hoe 0.7 c 1.6 ns 2.0 ns 0.6 ns 0.7 b 11.3 b Precision hoe 0.6 c 1.0 ns 6.1 ns 0.4 ns 0.9 b 17.9 ab PH + TW 2.0 ab 2.0 ns 3.8 ns 0.2 ns 3.3 a 10.1 b PH + TWC 1.0 bc 0.3 ns 0.5 ns 1.7 ns 1.0 b 4.4 b Weedy check 3.9 a 19.7 ns 12.5 ns 1.1 ns 5.4 a 104.7 a aIn the year not shown in table, density of these species was too low to perform a reliable statistical analysis. PH + TW = precision hoe + torsion weeder, PH + TWC = precision hoe + torsion weeder with tines crossed. In each column, means followed by the same letter are not significantly different at P 0.05 (LSD test), ns = not significant. Data shown are back-transformed means (following log-transformation).
Compared to the harrowing experiment, in the hoeing one maize yields were higher (up to 9.5 t ha-1) and use of precision hoeing, PH + TW and PH + TWC resulted in higher yield than use of the rotary hoe, although only in 2000. Again, this effect cannot be explained by weed density and biomass data. It can be hypothesised that rotary hoeing might have damaged maize roots to a greater extent than the other treatments, especially when considering that in 2000 mechanical weeding was performed 21 days later than in 2000, i.e. in a period when maize root growth and functioning was likely higher. Total weed biomass at harvest was unrelated to total initial weed density.
Data of this paper would suggest that hoeing may be preferable to harrowing for direct weed control in maize, but a global evaluation of the different options must also take into account work parameters as well as energy (and consequently economic) issues: these issues, that are discussed in Raffaelli et al. (2002), may change the relative advantage of treatments from year to year, e.g. depending on soil workability.

5th EWRS Workshop on Physical Weed Control 152 Pisa, Italy, 11-13 March 2002
Acknowledgements
The authors wish to thank all the staff of the Centro Interdipartimentale di Ricerche Agro-ambientali E. Avanzi, University of Pisa for their precious help in the conduction of the experiments and sample collection and processing.
References
BÀRBERI P & MAZZONCINI M (2001) Changes in weed community composition as influenced by cover crop and management system in continuous corn. Weed Science 49, 491-499.
BÀRBERI P, SILVESTRI N, PERUZZI A & RAFFAELLI M (2000) Finger harrowing of durum wheat under different tillage systems. Biological Agriculture and Horticulture 17, 285-303.
BUHLER DD, DOLL JD, PROOST RT & VISOCKY MR (1995) Integrating mechanical weeding with reduced herbicide use in conservation tillage corn production systems. Agronomy Journal87, 507-512.
BURGOS NR & TALBERT RE (1996) Weed control and sweet corn (Zea mays var. rugosa)response in a no-till system with cover crops. Weed Science 44, 355-361.
GOMEZ KA & GOMEZ AA (1984) Test for homogeneity of variance. In: Statistical procedures for agricultural research, 2nd edn, 467-471, J. Wiley & Sons, New York, USA.
LEBLANC ML, CLOUTIER DC & LEROUX GD (1995) Réduction de l'utilisation des herbicides dans le maïs-grain par une application d'herbicides en bandes combinée à des sarclages mécaniques. Weed Research 35, 511-522.
PLEASANT JMt, BURT RF & FRISCH JC (1994) Integrating mechanical and chemical weed management in corn (Zea mays). Weed Technology 8, 217-223.
RAFFAELLI M, BÀRBERI P, PERUZZI A & GINANNI M (2002) Options for mechanical weed control in maize – work parameters and crop yield. In: Proceedings 5th Workshop of the EWRS Working Group on Physical and Cultural Weed Control, Pisa, Italy, 11-13 March.
TEASDALE JR, BESTE CE & POTTS WE (1991) Response of weeds to tillage and cover crop residue. Weed Science 39, 195-199.

5th EWRS Workshop on Physical Weed Control 153 Pisa, Italy, 11-13 March 2002
Options for mechanical weed control in grain maize - work parameters and crop yield
M. Raffaelli1, A. Peruzzi1, P. Bàrberi2 & M. Ginanni3
1D.A.G.A.E., Settore Meccanica Agraria, University of Pisa, Italy; 2Scuola Superiore Sant’Anna, Pisa, Italy; 3Centro Interdipartimentale di Ricerche Agro-ambientali “E. Avanzi”,
S. Piero a Grado, Pisa, Italy
Introduction
Machines for physical weed control having completely different mechanical and operative characteristics are often used on the same crop and/or soil; this is not always logic and explicable, since it is like if a tractor, a city car or a Ferrari were used indifferently for driving. This behaviour is a consequence of lack of knowledge that is not simple to tackle, given the complexity of phenomena related to weed management that need to be taken into account (Bàrberi, 2002). Experiments are then required to allow in-depth analysis of the interactions between machine working tools and soil conditions, crop typology and management practices, as well as weed typology, density, developmental stage and competitiveness (Kouwenhoven & Terpstra, 1979;Bàrberi et al., 2000; Cloutier & Leblanc, 2000; Leblanc & Cloutier, 2000a and 2000b; Kurstjens & Bleeker, 2000; Kurstjens et al., 2000; Kurstjens & Kropff, 2001; Raffaelli et al., 2000).
The present study (that is part of a more complex study) aimed to investigate the performances of different machines for weed control having very different characteristics when operated on the same soil and the same crop.
Materials and methods
Trials were carried out on adjacent fields using a spring-tine harrow in one experiment, and a precision hoe equipped or not with torsion weeders and a PTO-powered rotary hoe in another experiment. All the implements are 3 m-wide.
The spring-tine harrow (Malin) is composed of two small modular frames each 1.5 m-wide. Each small frame is composed of 6 transverse rows of 8 tines; each tine is 36 cm long and has a 0.6 cm diameter. Tines, made of special-purpose steel, are J-shaped and composed of a 25 cm long vertical segment followed by a second shorter segment (11 cm) angled at 135˚ to the first segment in the working direction of the machine.
The precision hoe (with manual steerage) has sweep and goose-foot shares and can be equipped with torsion weeders.
The PTO-powered rotary hoe is a conventional machine with L-shaped tools.
A 30 kW 2WD tractor was always used to perform the experimental treatments.
Trials were conducted in 2000 and 2001 at the Centro Interdipartimentale di Ricerche Agro-ambientali “E. Avanzi” of the University of Pisa (43°40’ Long. N, 10°19’ Lat. E). Soil physical and mechanical characteristics are shown in Table 1. Details on the experimental layout are reported by Raffaelli et al. (2002a).

5th EWRS Workshop on Physical Weed Control 154 Pisa, Italy, 11-13 March 2002
Maize (Zea mais L. cv. PR34B23, FAO Class 500) was grown according to the standard agricultural practices in the study area (Raffaelli et al., 2002a) and sown at a density of 8.1 plants m-2 and an inter-row spacing of 50 cm.
Immediately prior to mechanical weeding, soil water content (percentage compared to fresh mass), dry bulk density and cone resistance were determined. The soil consistency index at the time of harrowing was calculated on the basis of Atterberg limits and soil water content measurements.
The harrowing experiment included any combinations between four tine adjustments (ranging from –30° up to +15°, where values represent the angle between the upper part of the tine and the perpendicular to the soil surface, see Fig. 1).
The hoeing experiment compared four different hoeing systems: a PTO-powered rotary hoe, a precision hoe with sweep and goose-foot shares, a precision hoe (as before) + torsion weeders, and a precision hoe (as before) + torsion weeders operated with the tines crossed.
Several harrowing or hoeing work parameters were measured and calculated for any treatments: these included working depth, speed and capacity; fuel consumption per hectare and hour, drawbar pull, useful power, direct input and tractor skidding.
Maize yield was determined by complete harvest of 2 m of crop row selected in the central part of each plot.
Table 1. Soil physical and mechanical characteristics. Characteristics Values 2000 2001 Texture (%) Ø > 2 mm Sand (%) 0.02 < Ø 2 mm Silt (%) 0.002 < Ø 0.02 mm Clay (%) Ø 0.002 mm Classification ISSS System
0583210
sandy-loamy Liquid limit (LL, %) Plastic limit (PL, %) Plasticity index (LL-PL)
24159
Soil water content (%) 11 11 Consistency index 1.4 1.4 Dry bulk density Kg dm
-3 1.3 1.4 Cone resistance (0-5 cm) MPa 0.2 0.7
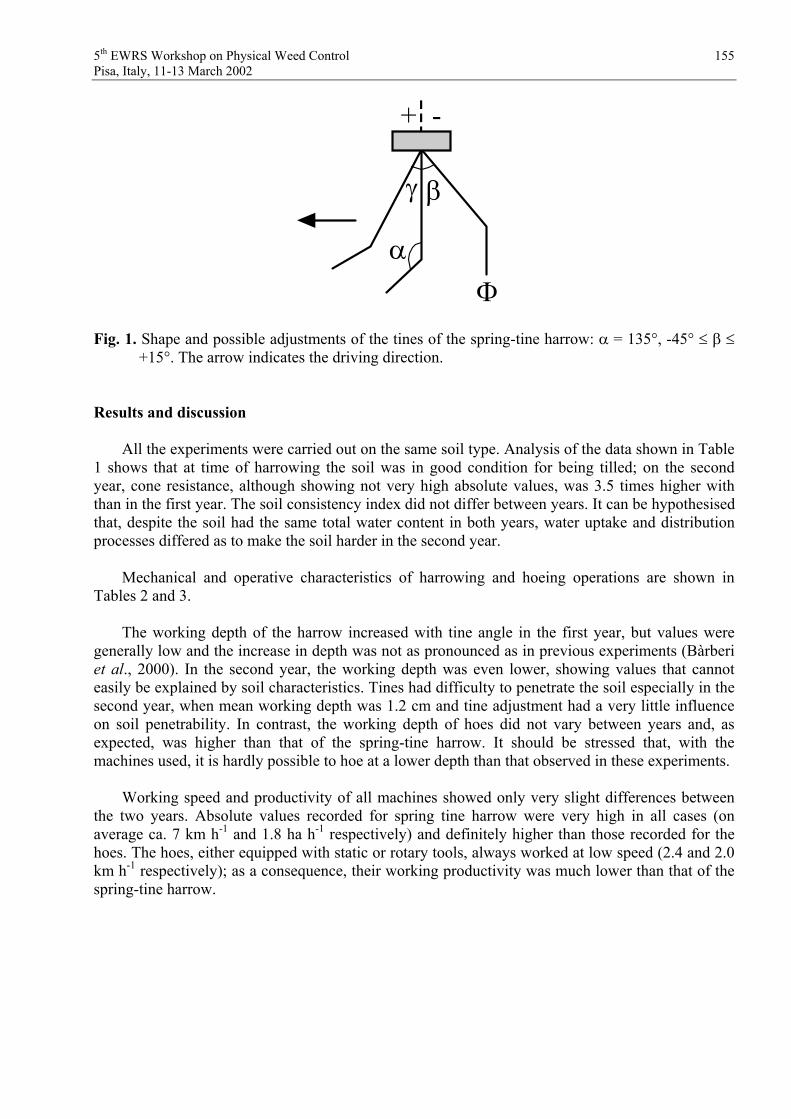
5th EWRS Workshop on Physical Weed Control 155 Pisa, Italy, 11-13 March 2002
Fig. 1. Shape and possible adjustments of the tines of the spring-tine harrow: = 135°, -45° +15°. The arrow indicates the driving direction.
Results and discussion
All the experiments were carried out on the same soil type. Analysis of the data shown in Table 1 shows that at time of harrowing the soil was in good condition for being tilled; on the second year, cone resistance, although showing not very high absolute values, was 3.5 times higher with than in the first year. The soil consistency index did not differ between years. It can be hypothesised that, despite the soil had the same total water content in both years, water uptake and distribution processes differed as to make the soil harder in the second year.
Mechanical and operative characteristics of harrowing and hoeing operations are shown in Tables 2 and 3.
The working depth of the harrow increased with tine angle in the first year, but values were generally low and the increase in depth was not as pronounced as in previous experiments (Bàrberi et al., 2000). In the second year, the working depth was even lower, showing values that cannot easily be explained by soil characteristics. Tines had difficulty to penetrate the soil especially in the second year, when mean working depth was 1.2 cm and tine adjustment had a very little influence on soil penetrability. In contrast, the working depth of hoes did not vary between years and, as expected, was higher than that of the spring-tine harrow. It should be stressed that, with the machines used, it is hardly possible to hoe at a lower depth than that observed in these experiments.
Working speed and productivity of all machines showed only very slight differences between the two years. Absolute values recorded for spring tine harrow were very high in all cases (on average ca. 7 km h-1 and 1.8 ha h-1 respectively) and definitely higher than those recorded for the hoes. The hoes, either equipped with static or rotary tools, always worked at low speed (2.4 and 2.0 km h-1 respectively); as a consequence, their working productivity was much lower than that of the spring-tine harrow.
+ -

5th EWRS Workshop on Physical Weed Control 156 Pisa, Italy, 11-13 March 2002
Table 2. Work parameters of spring-tine harrowing with different tine adjustments. Parameter 2000 2001 - 30° -15° 0° +15° mean - 30° -15° 0° +15° mean Working depth (cm) 1.5 1.8 2.0 2.2 1.9 1.0 1.2 1.2 1.5 1.2 Working speed (km h-1) 7.1 6.9 6.8 6.6 6.8 7.2 7.0 6.8 6.5 6.7 Working productivity (ha h-1) 1.8 1.8 1.7 1.7 1.8 1.9 1.8 1.7 1.7 1.8 Fuel cons. per hour (kg h-1) 0.8 0.9 1.2 1.3 1.0 0.5 0.6 0.8 0.8 0.7 Fuel cons. per hectare (kg ha-1) 0.4 0.5 0.7 0.8 0.6 0.3 0.3 0.5 0.5 0.4 Drawbar pull (N) 1100 1370 1780 1930 1545 750 910 1150 1250 1015 Useful power (kW) 2.2 2.6 3.4 3.5 2.9 1.5 1.8 2.2 2.3 1.9 Direct input (MJ ha-1) 17.6 22.0 30.8 35.2 26.4 13.2 13.2 22.0 22.0 17.6 Tractor skidding (%) 2 5 7 10 6 1 4 7 11 6
Table 3. Work parameters of the different hoeing options. Parameter 2000 2001 PH PH + TW Rotary hoe PH PH + TW Rotary hoe Working depth (cm) 5.0 5.0 6.1 5.0 5.0 6.0 Working speed (km h-1) 2.4 2.4 2.0 2.3 2.3 2.0 Working productivity (ha h-1) 0.6 0.6 0.5 0.6 0.6 0.5 Fuel cons. per hour (kg h-1) 1.1 1.5 4.9 1.1 1.6 5.6 Fuel cons. per hectare (kg ha-1) 1.8 2.5 9.8 1.8 2.7 11.2 Drawbar pull (N) 4500 6240 - 4650 6820 - Useful power (kW) 3.0 4.2 13.6 3.0 4.4 15.5 Direct input (MJ ha-1) 79.2 110.0 441.0 79.2 118.8 504.0 Tractor skidding (%) 7 7 -1 9 9 -1 PH = precision hoe, PH + TW = precision hoe + torsion weeder.
Fuel consumption was extremely low for spring-tine harrowing and did not show the considerable increase with tine angle observed in previous experiments (Peruzzi et al., 1997). Fuel consumption per hour of the precision hoe was low and constant over the years but, compared to harrowing, fuel consumption per hectare was higher due to lower working productivity. Compared to the precision hoe alone, precision hoeing + torsion weeding resulted on average in a 44% increase in fuel consumption per hectare. Values of the PTO-powered rotary hoe were much higher than those of the other hoes, especially for what concerns fuel consumption per hectare (as a consequence of the low working productivity), and were higher in the second year.
Drawbar pull required by the spring tine harrow increased little from the least to the most aggressive tine adjustment, and values were always extremely low. Values recorded for the precision hoe were higher than those obtained in a similar experience carried out on string bean in similar soil conditions (Raffaelli et al., 2002b). Averaged over the two years, precision hoeing + torsion weeding resulted in a 43% increase in drawbar pull compared to precision hoeing alone.
Results of the above-mentioned parameters obviously influenced useful power and direct input. On average, the useful power and direct input required by harrowing were respectively 2.9 kW and 26.4 MJ ha-1 in 2000 and 1.9 kW and 17.6 MJ ha-1 in 2001. It is evident that weak penetration of tines in the soil considerably influenced these parameters. The amount of power and energy required by the two hoes that were not equipped with elastic tools (especially the rotary hoe) was clearly influenced by soil conditions. It is evident that the soil was hard and thus required more energy to be tilled. The energy necessary for PTO-powered rotary hoeing was on average 4 to 5

5th EWRS Workshop on Physical Weed Control 157 Pisa, Italy, 11-13 March 2002
times higher than that required by hoeing with static tools and, on average, it was 17 and 28 times higher than that required by harrowing in the first and second year respectively.
It is now interesting to analyse how the working performance of these machines influenced crop yield. In Table 4 it is possible to observe that in 2000 each working hour of the spring tine harrow resulted in 2 and 3 times higher maize grain yield as compared to the precision and rotary hoe respectively. Results of 2001 showed a similar trend.
The energy required to produce 1 Mg of maize yield (dry matter) was 2.6 to 3.6 MJ for spring-tine harrowing, 8.7 to 9.8 MJ for precision (static) hoeing, 11.6 to 16.3 MJ for precision hoeing + torsion weeding, and 60.1 to 60.9 MJ for PTO-powered rotary hoeing (Table 4).
Table 4. Dry matter grain yield of maize per working hour of the spring-tine harrow and hoes, and direct energy input needed to produce 1 Mg of maize grain (all the other cultural practices were kept constant in the different treatments).
Treatments kg h-1 MJ Mg-1
2000 2001 2000 2001 Spring-tine harrowing: +15° 12432 9957 4.8 3.7 0° 12760 14014 4.1 2.7 -15° 13390 12178 2.9 1.9 -30° 12319 10760 2.6 2.2 mean 12725 11727 3.6 2.6
Hoeing:Precision hoe 5403 4863 8.7 9.8 Precision hoe + torsion weeder 5682 4359 11.6 16.3 Rotary hoe 3668 4132 60.1 60.9
This study confirmed that different machines usable for mechanical weed control in a given crop have well defined and very different characteristics, and their behaviour may change with different soil conditions, depending on machine characteristics. Machines performance as related to soil conditions experienced at treatment time should be taken into account more systematically in weed control studies. These findings would help guiding the choice of the best implement to use in any situations, especially when mechanical weed control is included in low-external input systems that, as such, aim to reduce energy input as much as possible. In this respect, new parameters that link mechanical and agronomic results may provide a better understanding of research outcome.
Acknowledgements
We are very grateful to R. Del Sarto, A. Pannocchia, M. Paracone, L. Pulga and S. Toniolo of the University of Pisa for their precious cooperation in running the experiment.
5th EWRS Workshop on Physical Weed Control 158 Pisa, Italy, 11-13 March 2002
References
BÀRBERI P. (2002) Weed management in organic agriculture: are we addressing the right issues? Weed Research, in press.
BÀRBERI P, SILVESTRI N, PERUZZI A & RAFFAELLI M (2000) Finger-harrowing of durum wheat under different tillage systems. Biological Agriculture and Horticulture 17, 285-303.
CLOUTIER D & LEBLANC ML (2000) Susceptibility of sweet maize (Zea mays L.) to the rotary hoe: preliminary results. In: Proceedings 4th EWRS Workshop on Physical and Cultural Weed Control, Elspeet, 20-22 March, 37.
KOUWENHOVEN JK & TERPSTRA R (1979) Sorting action of tines and tine-like tools in the field. Journal of Agricultural Engineering Research 24, 95-113.
KURSTJENS DAG & BLEEKER P (2000) Optimising torsion weeders and finger weeders. In: Proceedings 4th EWRS Workshop on Physical and Cultural Weed Control, Elspeet, 20-22 March, 30-32.
KURSTJENS DAG, PERDOK UD & GOENSE D (2000) Selective uprooting by weed harrowing on sandy soils. Weed Research 40, 431-447.
KURSTJENS DAG & KROPFF MJ (2001) The impact of uprooting and soil covering on the effectiveness of weed harrowing. Weed Research 41, 211-228.
LEBLANC ML & CLOUTIER D (2000a) Susceptibility of dry edible beans (Phaseolus vulgarisL.) to the rotary hoe. In: Proceedings 4th EWRS Workshop on Physical and Cultural Weed Control, Elspeet, 20-22 March, 38.
LEBLANC ML & CLOUTIER D (2000b) Susceptibility of row-planted soyabean to the rotary hoe. In: Proceedings 4th EWRS Workshop on Physical and Cultural Weed Control, Elspeet, The Netherlands, 20-22 March, 39.
PERUZZI A, BÀRBERI P, GINANNI M, RAFFAELLI M & SILVESTRI N (1997) Prove sperimentali di controllo meccanico delle infestanti del frumento mediante erpice strigliatore. In: Proceedings VI Convegno Nazionale di Ingegneria Agraria, Ancona, 11-12 September, 669-678.
RAFFAELLI M, BÀRBERI P, PERUZZI A & GINANNI M (2002a) Options for mechanical weed control in maize – effects on weeds. In: Proceedings 5th EWRS Workshop on Physical and Cultural Weed Control, Pisa, 11-13 March.
RAFFAELLI M, PERUZZI A & BÀRBERI P (2000) Spring-tine harrowing in sunflower and soyabean: results of two-year trials. In: Proceedings 4th EWRS Workshop on Physical and Cultural Weed Control, Elspeet, 20-22 March, 37-39.
RAFFAELLI M, PERUZZI A, BÀRBERI P & GINANNI M (2002b) Options for mechanical weed control in string bean – work parameters and crop yield. In: Proceedings 5th EWRS Workshop on Physical and Cultural Weed Control, Pisa, 11-13 March.
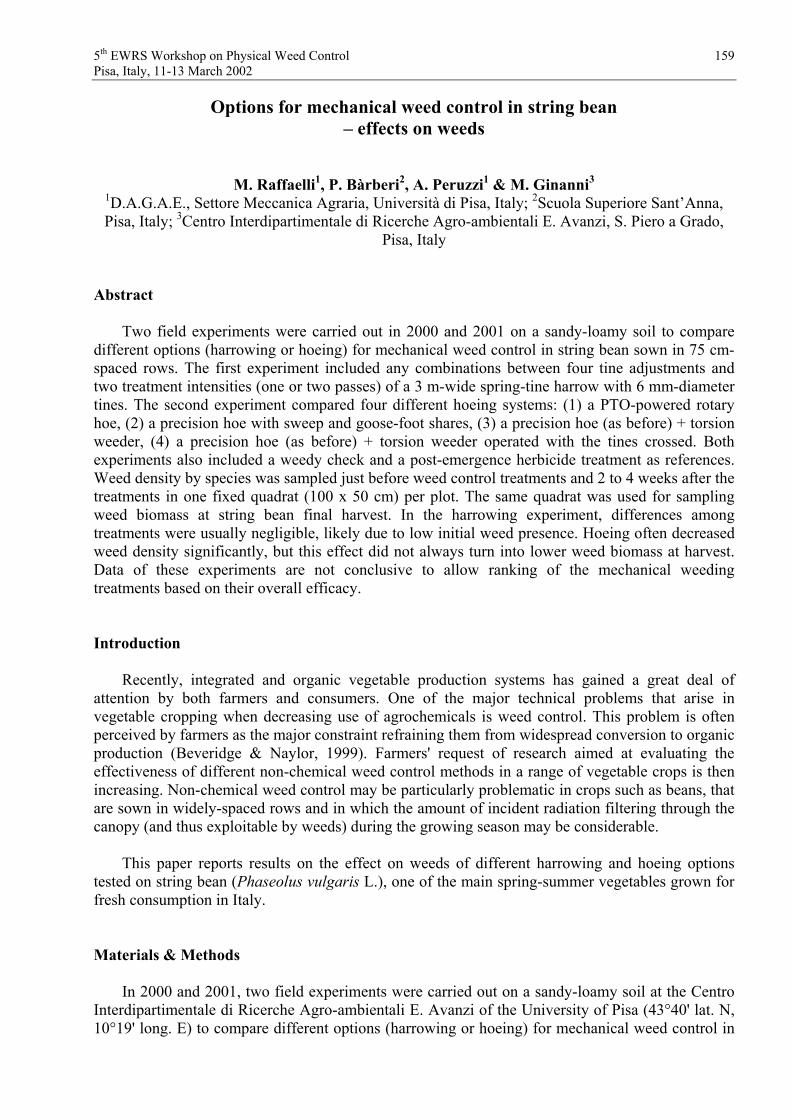
5th EWRS Workshop on Physical Weed Control 159 Pisa, Italy, 11-13 March 2002
Options for mechanical weed control in string bean – effects on weeds
M. Raffaelli1, P. Bàrberi2, A. Peruzzi1 & M. Ginanni3
1D.A.G.A.E., Settore Meccanica Agraria, Università di Pisa, Italy; 2Scuola Superiore Sant’Anna, Pisa, Italy; 3Centro Interdipartimentale di Ricerche Agro-ambientali E. Avanzi, S. Piero a Grado,
Pisa, Italy
Abstract
Two field experiments were carried out in 2000 and 2001 on a sandy-loamy soil to compare different options (harrowing or hoeing) for mechanical weed control in string bean sown in 75 cm-spaced rows. The first experiment included any combinations between four tine adjustments and two treatment intensities (one or two passes) of a 3 m-wide spring-tine harrow with 6 mm-diameter tines. The second experiment compared four different hoeing systems: (1) a PTO-powered rotary hoe, (2) a precision hoe with sweep and goose-foot shares, (3) a precision hoe (as before) + torsion weeder, (4) a precision hoe (as before) + torsion weeder operated with the tines crossed. Both experiments also included a weedy check and a post-emergence herbicide treatment as references. Weed density by species was sampled just before weed control treatments and 2 to 4 weeks after the treatments in one fixed quadrat (100 x 50 cm) per plot. The same quadrat was used for sampling weed biomass at string bean final harvest. In the harrowing experiment, differences among treatments were usually negligible, likely due to low initial weed presence. Hoeing often decreased weed density significantly, but this effect did not always turn into lower weed biomass at harvest. Data of these experiments are not conclusive to allow ranking of the mechanical weeding treatments based on their overall efficacy.
Introduction
Recently, integrated and organic vegetable production systems has gained a great deal of attention by both farmers and consumers. One of the major technical problems that arise in vegetable cropping when decreasing use of agrochemicals is weed control. This problem is often perceived by farmers as the major constraint refraining them from widespread conversion to organic production (Beveridge & Naylor, 1999). Farmers' request of research aimed at evaluating the effectiveness of different non-chemical weed control methods in a range of vegetable crops is then increasing. Non-chemical weed control may be particularly problematic in crops such as beans, that are sown in widely-spaced rows and in which the amount of incident radiation filtering through the canopy (and thus exploitable by weeds) during the growing season may be considerable.
This paper reports results on the effect on weeds of different harrowing and hoeing options tested on string bean (Phaseolus vulgaris L.), one of the main spring-summer vegetables grown for fresh consumption in Italy.
Materials & Methods
In 2000 and 2001, two field experiments were carried out on a sandy-loamy soil at the Centro Interdipartimentale di Ricerche Agro-ambientali E. Avanzi of the University of Pisa (43°40' lat. N, 10°19' long. E) to compare different options (harrowing or hoeing) for mechanical weed control in

5th EWRS Workshop on Physical Weed Control 160 Pisa, Italy, 11-13 March 2002
string bean. In both experiments, the soil, that hosted silage maize in 1999 and lupin in 2000 as preceding crops, was mouldboard-ploughed at ca. 30 cm depth in winter, and later subjected to the false seedbed technique. Mineral fertilisation was carried out pre-sowing with 120 kg ha-1 P2O5 and 120 kg ha-1 K2O. String bean cv. Delinel was sown on 7 July 2000 and 13 June 2001 at a seeding rate of 29.6 seeds m-2 in 75 cm-spaced rows.
Harrowing experiment The harrowing experiment included any combinations between four tine adjustments (ranging from –30° to +15°, where values represent the angle between the upper part of the tine and the perpendicular to the soil surface, see Fig. 1) and two treatment intensities (one or two passes) of a 3 m-wide Malin spring-tine harrow with 6 mm-diameter tines. The harrow was passed on 1 August 2000 and on 11 and 18 July 2001, when string bean was in the full vegetative stage. In 2000, excessive crop size suggested not to perform the second pass.
Fig. 1. Shape and possible adjustments of the tines of the spring-tine harrow: = 135°, -45° +15°, the arrow indicates the driving direction.
Hoeing experiment The hoeing experiment compared four weed control implements: (1) a PTO-powered rotary hoe, (2) a precision hoe with sweep and goose-foot shares, (3) a precision hoe (as before) + torsion weeder (PH + TW), (4) a precision hoe (as before) + torsion weeder operated with the tines crossed (PW + TWC). This last treatment was performed only in 2001. Hoeing was performed on 1 August 2000 and 11 July 2001.
As in the harrowing experiment, a weedy check and a post-emergence herbicide treatment (sethoxydim 1 L ha-1, 250 L ha-1 spraying volume plus bentazone + fomesafen 0.5 + 0.5 L ha-1, 250 L ha-1 spraying volume, rates refer to commercial products) were included. In the harrowing experiments, treatments were allocated in a split-plot design with number of passes in the main plots and tine adjustment in the sub-plots. The hoeing experiment was laid out in a randomised complete block design with three replicates. Size of the elementary plots was 20 m length by 3 m width in both experiments.
Data collection and analysis In both experiments, plant density (crop and weeds) was sampled by species just before weed control treatments (on the same dates) and 2 to 4 weeks after treatment (on 29 August 2000 and 27 July 2001) in one fixed quadrat (100 x 50 cm) per plot, divided into an outer and inner part to account separately for between-row and within-row weed control. The same quadrats were used for
+ -

5th EWRS Workshop on Physical Weed Control 161 Pisa, Italy, 11-13 March 2002
sampling weed biomass at final string bean harvest (on 25 September 2000 and 6 September 2001). The collected biomass was divided by species and placed in an oven at 80°C until constant weight. Data presented in this paper refer to the whole quadrat size. Results on working parameters of the different weed control treatments and on string bean yield are presented elsewhere (Raffaelli et al.,2002).
Plant density and biomass of the total weed community and of major species were subjected to statistical analysis. Crop and weed densities after mechanical weed control were expressed as percent reduction as compared to initial plant density. Prior to ANOVA, data were arcsine-, square root- or log- transformed, as appropriate (Gomez & Gomez, 1984). Treatment means were separated by a LSD test at P 0.05. Data shown in tables are back-transformed means. Since in 2000 it was not possible to pass the spring-tine harrow twice, the relevant data were subjected to a randomised complete block ANOVA by taking the average of any two plots per replicate that were subjected to the same tine adjustment as input.
Results
Harrowing experiment Percent reduction in string bean density after mechanical treatments was influenced neither by tine adjustment nor by number of passes, being on average 11% in 2000 and 7% in 2001.
Overall, the effect of weed control treatments (both chemical and non-chemical) on weed density and biomass was poor and nearly always non statistically significant. This lack of effect can partly be attributed to low initial (i.e. prior to treatment) weed density in both years (on average, 16 and 18 plants m-2 in 2000 and 2001 respectively). Averaged over all tine adjustments and passes, mean percent reduction in total weed density was 38% in 2000 and 28% in 2001.
Similarly, total weed biomass at harvest was not too high and did not significantly differ among the mechanical treatments, being on average equal to 11.6 g m-2 in 2000 and 62.0 g m-2 in 2001 (compared respectively to 6.0 and 64.7 g m-2 with herbicide use). Slight differences were only found in the biomass of Portulaca oleracea in 2000, which was significantly higher (P 0.05) in +15° (3.9 g m-2) than in any other treatments (on average 0.2 g m-2).
Hoeing experiment On average, initial (i.e. just before weed control treatments) total weed density was considerably higher in 2001 than in 2000 (103.9 vs. 17.8 plants m-2). In both years, the most abundant species were Chenopodium album (which accounted for 36% and 40% of total weed density in 2000 and 2001 respectively), Digitaria sanguinalis (36% and 17%) and Portulaca oleracea (11% and 17%).
Except for the herbicide treatment, percent reduction in total weed density following weed control treatments was higher in 2000 than in 2001 (Table 1). Changes in the relative ranking of hoeing treatments between the two years did not result in statistically significant differences, likely because of high between-plot heterogeneity. In 2000, density of C. album (the major weed) was reduced to a greater extent by precision hoeing, PH + TW and PW + TWC (89.4% on average) than by rotary hoeing (42.3%). However, other species (especially D. sanguinalis and P. oleracea) were not controlled to the same extent (data not shown), thus decreasing the value of total weed reduction obtained with the former three implements (ranging between 31.2% and 51.8%).
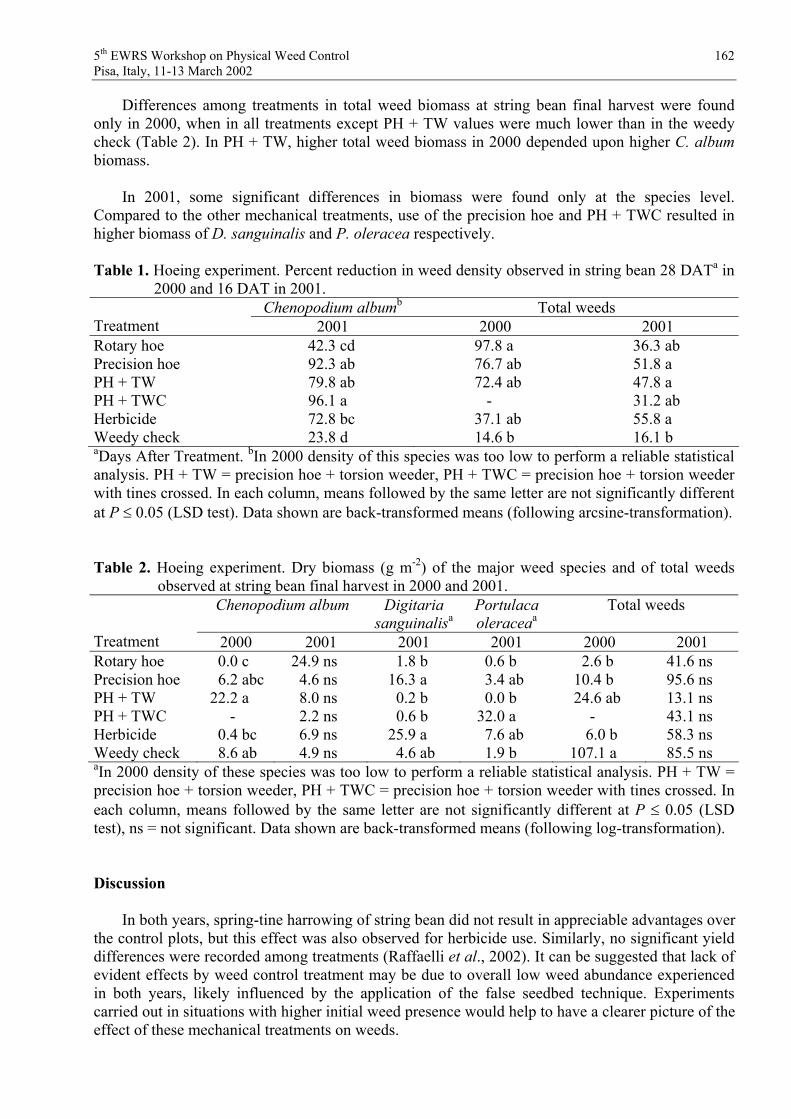
5th EWRS Workshop on Physical Weed Control 162 Pisa, Italy, 11-13 March 2002
Differences among treatments in total weed biomass at string bean final harvest were found only in 2000, when in all treatments except PH + TW values were much lower than in the weedy check (Table 2). In PH + TW, higher total weed biomass in 2000 depended upon higher C. albumbiomass.
In 2001, some significant differences in biomass were found only at the species level. Compared to the other mechanical treatments, use of the precision hoe and PH + TWC resulted in higher biomass of D. sanguinalis and P. oleracea respectively.
Table 1. Hoeing experiment. Percent reduction in weed density observed in string bean 28 DATa in 2000 and 16 DAT in 2001.
Chenopodium albumb Total weeds Treatment 2001 2000 2001 Rotary hoe 42.3 cd 97.8 a 36.3 ab Precision hoe 92.3 ab 76.7 ab 51.8 a PH + TW 79.8 ab 72.4 ab 47.8 a PH + TWC 96.1 a - 31.2 ab Herbicide 72.8 bc 37.1 ab 55.8 a Weedy check 23.8 d 14.6 b 16.1 b aDays After Treatment. bIn 2000 density of this species was too low to perform a reliable statistical analysis. PH + TW = precision hoe + torsion weeder, PH + TWC = precision hoe + torsion weeder with tines crossed. In each column, means followed by the same letter are not significantly different at P 0.05 (LSD test). Data shown are back-transformed means (following arcsine-transformation).
Table 2. Hoeing experiment. Dry biomass (g m-2) of the major weed species and of total weeds observed at string bean final harvest in 2000 and 2001.
Chenopodium album Digitariasanguinalisa
Portulacaoleraceaa
Total weeds
Treatment 2000 2001 2001 2001 2000 2001 Rotary hoe 0.0 c 24.9 ns 1.8 b 0.6 b 2.6 b 41.6 ns Precision hoe 6.2 abc 4.6 ns 16.3 a 3.4 ab 10.4 b 95.6 ns PH + TW 22.2 a 8.0 ns 0.2 b 0.0 b 24.6 ab 13.1 ns PH + TWC - 2.2 ns 0.6 b 32.0 a - 43.1 ns Herbicide 0.4 bc 6.9 ns 25.9 a 7.6 ab 6.0 b 58.3 ns Weedy check 8.6 ab 4.9 ns 4.6 ab 1.9 b 107.1 a 85.5 ns aIn 2000 density of these species was too low to perform a reliable statistical analysis. PH + TW = precision hoe + torsion weeder, PH + TWC = precision hoe + torsion weeder with tines crossed. In each column, means followed by the same letter are not significantly different at P 0.05 (LSD test), ns = not significant. Data shown are back-transformed means (following log-transformation).
Discussion
In both years, spring-tine harrowing of string bean did not result in appreciable advantages over the control plots, but this effect was also observed for herbicide use. Similarly, no significant yield differences were recorded among treatments (Raffaelli et al., 2002). It can be suggested that lack of evident effects by weed control treatment may be due to overall low weed abundance experienced in both years, likely influenced by the application of the false seedbed technique. Experiments carried out in situations with higher initial weed presence would help to have a clearer picture of the effect of these mechanical treatments on weeds.

5th EWRS Workshop on Physical Weed Control 163 Pisa, Italy, 11-13 March 2002
In contrast, hoeing was always beneficial in terms of weed control, although positive effects on crop total yield were observed only in 2000, when precision hoeing plus torsion weeding resulted in a 16% yield gain compared to the weedy check (data not shown), despite a higher total weed biomass at harvest. Short-term weed reduction generally appeared unrelated either to final weed biomass or string bean yield, as were these last two parameters, suggesting that, besides the observed selective treatment effect on different weed species, other factors (e.g. mobilisation of nutrients driven by soil disturbance) might have played a role.
Further studies are needed to understand if one or more of the hoeing options is superior over the others. It also remains to be seen if and to what extent a reduction in weed density such as that observed in the hoeing experiment, although not enough to turn into a yield advantage in one growing season, might turn into long-term beneficial effects in a crop rotation context.
Acknowledgements
The authors wish to thank all the staff of the Centro Interdipartimentale di Ricerche Agro-ambientali E. Avanzi, University of Pisa for their precious help in the conduction of the experiments and sample collection and processing.
References
BEVERIDGE LE & NAYLOR REL (1999) Options for organic weed control – what farmers do. In: Proceedings 1999 Brighton Conference – Weeds, Brighton, UK, 939-944.
GOMEZ KA & GOMEZ AA (1984) Test for homogeneity of variance. In: Statistical procedures for agricultural research, 2nd edn, 467-471, J. Wiley & Sons, New York, USA.
RAFFAELLI M, BÀRBERI P, PERUZZI A & GINANNI M (2002) Options for mechanical weed control in string bean – work parameters and crop yield. In: Proceedings 5th Workshop of the EWRS Working Group on Physical and Cultural Weed Control, Pisa, Italy, 11-13 March.

5th EWRS Workshop on Physical Weed Control 164 Pisa, Italy, 11-13 March 2002
Preliminary results on physical weed control in processing spinach
F. Tei1, F. Stagnari1, A. Granier2
1Dept. of Agro-environmental and Crop Sciences – University of Perugia, Italy 2 SAGIT – Unilever, Cisterna di Latina, Italy
Abstract
A field experiment was carried out in Central Italy (Tiber Valley, Perugia, 43oN, elev. 165 m) to evaluate applicability and efficacy of some physical weed control methods in processing spinach, sown at two different inter-row distances (0.125 and 0.25 m).
With rows 0.125 m apart, pre-sowing herbicide application (cycloate at 3635 g a.i. ha-1),harrowing and post-emergence flaming were applied, while with rows 0.25 m apart the treatments were pre-sowing herbicide application (same herbicide as above), finger-weeding, split-hoeing and post-emergence flaming; untreated plots were added as checks. Physical weed control was performed at the “4-6 true leaves” stage of the crop and at the “cotyledons” to “6 true leaves” stages of the weeds.
Pre-sowing chemical application caused a growth reduction and, as a consequence, a delay in harvest date in comparison with physical weed control. Flaming caused a temporary wilting of the crop which then fully recovered, although unmarketable deformed leaves at final harvest were about 12% of total yield (on mass basis) with rows 0.125 m apart and about 7% with rows 0.250 m apart. Finger-weeding and split-hoeing on rows 0.250 m apart, as well as harrowing on rows 0.125 m apart, did not injure the crop.
On fresh mass basis, the percentage of weed control with rows 0.250 m apart was 97% by pre-sowing herbicide application, 90% by flaming, 88% by split-hoeing and 64% by finger-weeding; with rows 0.125 m apart the weed control efficacy was 82% by pre-sowing herbicide application, 30% by flaming while harrowing showed no control.
Crop yield was not affected by row distance and only slightly by weed control method.
Introduction
Scientific and public concern about the use of chemicals in agriculture has led to an increasing interest in non-chemical weed management (Parish, 1990; Rasmussen & Ascard, 1995; Bond and Grundy, 2001). Several investigations (Baumann, 1992; Ascard, 1995; Rasmussen, 1996; Ascard & Bellinder, 1996; Melander, 1997, 1998; Fogelberg, 1998; Melander & Rasmussen, 2001) have clearly shown that direct physical weed control based on mechanical and thermal methods can be effective only if a sound cultural method is applied.
In processing spinach weed control is still mainly chemical because: 1) the mechanical harvest needs a crop with an erect leaf posture favoured by a narrow row width (0.10 – 0.15 m); this prevents the use of most post-emergence physical weed control methods; 2) the harvested spinach should not contain uncontrolled weeds, considered as “pollutant bodies” in industrial processes.
In order to apply post-emergence direct physical weed control methods a wider row distance seems to be necessary, even though negative influences on crop growth habit and competitive ability might be expected (Fischer & Miles, 1973; Schnieders, 1999).
The aim of the present study was to investigate the applicability and the efficacy of some physical weed control methods in processing spinach sown at two different distances between rows.
5th EWRS Workshop on Physical Weed Control 165 Pisa, Italy, 11-13 March 2002
Materials and methods
A field experiment on processing spinach (Spinacia oleracea L.) was carried out in central Italy (Tiber valley, Perugia, 43°N, elev. 165 m) on a silty-clay soil with 1.2% of organic matter.
Soft winter wheat was the preceding crop and the seed bed was prepared by ploughing 0.3 m deep, disc harrowing, rotary harrowing, spike-tooth harrowing and rolling.
The experimental design was a split block with four replicates and a plot size of about 80 m2.Two crop inter-row distances (0.125 and 0.250 m) and different physical weed control methods (Table 1) were compared; chemically treated and untreated plots were added as checks.
Table 1. Experimental treatments: weed control methods and inter-row distances.
Inter-row distance (m) Weed control methods 0.125 0.250
Chemical weed control x x Harrowing x Flaming x x Finger-weeding x Split-hoeing x Untreated check x x
Chemical weed control was performed in pre-sowing by applying cycloate (Ro-Neet, Siapa, 700 g L-1) at a rate of 3635 g a.i. ha-1.
Spinach cv. Tamura was sown on 12.9.2001, with a seed rate of 51 kg ha-1.Physical weed control treatments were applied on 4.10.2001 when crop was at “4-6 leaves”
stage, broadleaved weeds were at “cotyledons” to “4-6 leaves” stage and grass weeds at “3 leaves” to “tillering” stage.
Harrowing was carried out with a weed harrow (Pictures 1 and 2) at a working depth of 3 cm and a driving speed of about 3 km h-1.
Post-emergence flaming was performed with a PS6 (Officine Mingozzi, Ferrara, Italy) flamer consisting of 6 rows of gas-phase burners 0.25 m apart (Pictures 3-6). The propane consumption per burner was 12-14 kg h-1 at a gas pressure of 0.1 MPa and at a driving speed of 2.5 km h-1. With row width 0.25 m, burners flamed inter-row and very close to the row; with distance between rows of 0.125 alternate crop rows were fully hit by flames.
Finger-weeding close to the row was carried out with a small Kress (Tamm, Germany) finger-weeder (Pictures 7 and 8) at a driving speed of 3 km h-1.
Split-hoeing close to the row was performed with a Asperg Gartnereibedarf (Asperg, Germany) split-hoe (Pictures 9-12) leaving 10-cm untilled strip in the crop rows, at a working depth of 5 cm and a driving speed of 3 km h-1.
Crop was fertilised with 60 kg N ha-1, 60 kg P2O5 ha-1 and 85 kg K2O ha-1 applied at seed bed preparation and with 92 kg N ha-1 broadcast on 4.10.2001.
The following parameters were determined: weed density just before the physical treatments (4.10.2001) and at final harvest; weed fresh and oven dry mass (105°C for 48h) at final harvest; crop height at final harvest; total and marketable crop yield; weed mass in the harvested spinach.
The harvest was performed on 23.10.2001 for all the experimental treatments except for the plots chemically treated which were harvested on 2.11.2001 due to the delay of crop growth caused by herbicide application (see Results).
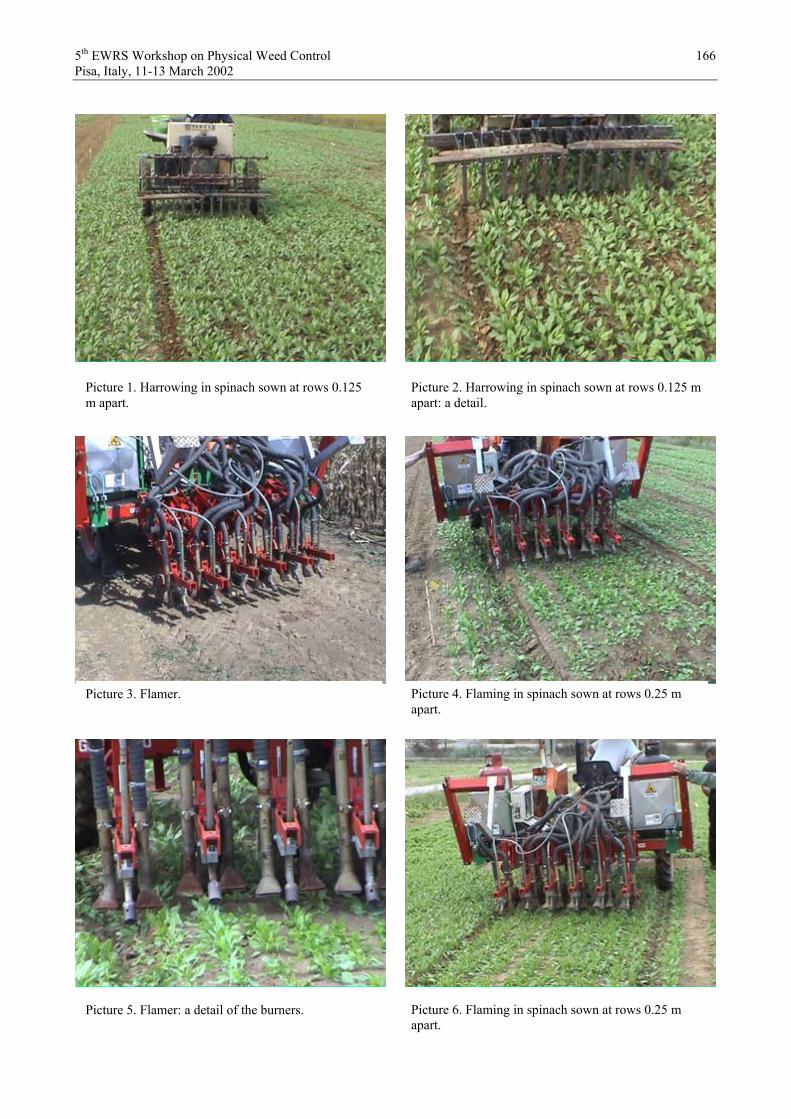
5th EWRS Workshop on Physical Weed Control 166 Pisa, Italy, 11-13 March 2002
Picture 1. Harrowing in spinach sown at rows 0.125 m apart.
Picture 2. Harrowing in spinach sown at rows 0.125 m apart: a detail.
Picture 3. Flamer. Picture 4. Flaming in spinach sown at rows 0.25 m apart.
Picture 5. Flamer: a detail of the burners. Picture 6. Flaming in spinach sown at rows 0.25 m apart.

5th EWRS Workshop on Physical Weed Control 167 Pisa, Italy, 11-13 March 2002
Picture 7. Finger-weeding in spinach sown at rows 0.25 m apart.
Picture 8. Finger-weeding in spinach sown at rows 0.25 m apart: a detail.
Picture 9. Split-hoeing in spinach sown at rows 0.25 m apart.
Picture 10. Split-hoe: a detail.
Picture 11. Split-hoeing in spinach sown at rows 0.25 m apart.
Picture 12. Split-hoeing in spinach sown at rows 0.25 m apart: a detail.

5th EWRS Workshop on Physical Weed Control 168 Pisa, Italy, 11-13 March 2002
Results
Weed flora was mainly composed by Portulaca oleracea L.(POROL), Amaranthus retroflexus L. (AMARE), Papaver rhoeas L. (PAPRH) among broadleaved weeds, and by Echinochloa crus-galli L. (Beauv.) (ECHCG) among grass weeds; other sporadic species were Veronica hederifoliaL. (VERHE), Chenopodium album L. (CHEAL) and Sonchus spp. Weed density, as observed just before physical treatments (4.10.2001), was not affected by inter-row distances (Table 2).
Data about weed control efficacy of the treatments as observed at final harvest (23.10.2001) are reported in Tables 3 and 4.
Table 2. Weed density just before physical treatments (means over inter-row distances). Standard errors are in parentheses.
Weed species Density (no. m-2)Portulaca oleracea 167 (33.3)Amaranthus retroflexus 17 (4.2)Papaver rhoeas 15 (3.6)Echinochloa crus-galli 5 (1.0)Other species 9 (1.9)Total 213 (33.0)
Table 3. Weed density ( no. plants m-2), weed fresh and dry mass (g m-2) at crop final harvest in relation to weed control methods in spinach sown at rows 0.125 m apart. Standard errors are in parentheses.
Weeds (no. m-2)
Weed control treatments
POR
OL
CH
EAL
PAPR
H
VER
HE
AM
AR
E
ECH
CG
Tota
l
Total weed fresh mass
(g m-2)
Total weed dry mass (g m-2)
Chemical treatment 5 (2.3) - 5 (2.1) 2 (1.5) 4 (2.9) - 16 (5.7) 2.0 (1.05) 0.3 (0.16)
Harrowing 50 (0.1) 2 (1.5) 4 (1.6) - 3 (1.5) 1 (0.5) 60 (22.5) 27.1 (14.70) 1.4 (0.60)
Flaming 26 (11.7) 1 (0.5) 2 (0.8) 2 (1.1) 2 (1.5) - 33 (11.4) 7.9 (3.83) 0.9 (0.60)
Untreated check 60 (23.4) 5 (3.6) 12 (4.8) 1 (0.5) 3 (1.1) - 81 (27.2) 11.2 (2.22) 1.6 (0.44)
Table 4. Weed density(no. plants m-2), weed fresh and dry mass (g m-2) at crop final harvest in relation to weed control methods in spinach sown at rows 0.25 m apart. Standard errors are in parentheses.
Weeds (no. m-2)
Weed control treatments
POR
OL
CH
EAL
PAPR
H
VER
HE
AM
AR
E
ECH
CG
TOTA
L
Total weed fresh mass
(g m-2)
Total weed dry mass (g m -2)
Chemical treatment 2 (2.0) - 2 (1.5) - - - 4 (2.3) 0.9 (0.74) 0.1 (0.04)
Finger-weeding 28 (5.7) 1 (0.5) 1 (0.7) - 11 (6.4) 2 (2.0) 43 (8.9) 9.1 (2.81) 2.2 (1.13)
Split-hoeing 21 (16.0) 1 (0.5) 1 (0.5) 1 (0.5) 3 (1.7) - 27 (15.5) 3.1 (1.54) 0.5 (0.27)
Flaming 32 (10.7) - 1 (0.7) - - - 33 (10.7) 5.5 (1.84) 0.8 (0.30)
Untreated check 112 (37.9) 2 (1.5) 10 (3.5) 1 (0.7) 6 (1.3) 2 (1.5) 133 (42.3) 25.4 (8.00) 2.8 (0.87)

5th EWRS Workshop on Physical Weed Control 169 Pisa, Italy, 11-13 March 2002
Spinach showed a high competitive ability that caused a weed density reduction during the crop growth cycle: comparing data recorded before post-emergence physical treatments (Table 2) and that recorded in the untreated check at final harvest (Table 3 and 4), it is apparent that weed mortality was much higher on plots with crop sown at inter-row distances of 0.125 m (62% of mortality) than on plots sown at inter-row distances of 0.25 m (38%).
Pre-sowing chemical control gave the best weed control in terms of both density and fresh mass and showed an efficacy of about 80% with inter-row distances of 0.125 m and 97% with inter-row distances of 0.250 m. This difference was probably due to the higher level of soil disturbance by the sowing machine in the case of narrower rows, which might have played a role in reducing the residual effect of the herbicide and in stimulating weed emergence.
Taking into consideration the fresh mass recorded on untreated plots, with inter-row distance of 0.125 m (Table 3) flaming gave 30% weed control and harrowing no control; with inter-row distance of 0.250 m, split-hoeing gave 88% weed control, flaming 78% and finger-weeding 64%.
Chemical treatment caused a reduction in spinach growth: in comparison with the physical treatments, crop height recorded on 23.10.2002 was about 5 cm lower (data not shown) and the harvest was delayed of about 10 days (Table 5).
Flaming caused a temporary wilting of the crop that fully recovered in few days (about 1 week), although unmarketable deformed leaves at harvest were 12% with inter-row distance of 0.125 m and 7% with inter-row distance of 0.25 m (Table 5).
Crop yield (Table 5) was not affected by the crop inter-row distance and, only slightly by the weed control method. The physical methods gave different results in term of weed control but slightly influenced crop yield due to high crop competitiveness. A thorough seedbed preparation and a uniform emergence prevented the growth of the uncontrolled weeds which remained small and under the height of harvest cutting.
Table 5. Crop height (cm), total and marketable yield (t ha-1) at final harvest in relation to weed control methods and inter-row distance. Standards errors are in parentheses.
Inter-row distance 0.125 m Inter-row distance 0. 25 m Yield (t ha-1) Yield (t ha-1)Weed control
treatments Harvest
date Crop
height (cm) Total Marketable
Crop height (cm) Total Marketable
Chemical treatment 2 Nov. 24 (0.6) 13.2 (0.71) 13.2 (0.71) 25 (0.9) 12.7 (0.87) 12.7 (0.87)
Harrowing 23 Oct. 29 (0.8) 14.6 (1.78) 14.6 (1.78) - - -
Finger-weeding 23 Oct. - - - 28 (0.8) 16.5 (1.63) 16.5 (1.63)
Split-hoeing 23 Oct. - - - 26 (0.6) 13.5 (1.29) 13.5 (1.29)
Flaming 23 Oct. 24 (0.7) 15.0 (0.95) 13.0 (0.84) 27 (0.9) 12.5 (0.91) 11.6 (0.63)
Untreated check 23 Oct. 29 (0.8) 16.9 (1.51) 16.9 (1.51) 28 (0.8) 14.7 (2.00) 14.7 (2.00)
Discussion
The inter-row distance (i. e. 0.125 and 0.25 m apart) did not influence crop yield, but 0.125 m inter-row distance prevents from the use of some mechanical weed control methods, i. e. finger-weeder and split-hoe, allowing only the inter-row harrowing that showed a poor weed control efficacy.
With inter-row distance of 0.250 m, finger-weeding and split-hoeing showed a high potential in direct weed control, performing with efficacy very close to the row; the high crop plant density and competitiveness prevents intra-row weed emergences.

5th EWRS Workshop on Physical Weed Control 170 Pisa, Italy, 11-13 March 2002
In this study post-emergence flaming was applied for the first time as direct method for weed control in spinach and the results gave the evidence that it can be applied only when the crop is sown with rows spaced enough (0.25 m). However, flaming gave a good weed control (about 80%), causing just a temporary crop wilting and in some cases a permanent leaf deformity. Post-emergence flaming seems to be worthy of further investigations in order to obtain a better selectivity to the crop.
Physical methods gave a lower weed control than the herbicide treatment although yield was not different probably due to the high crop competitiveness. In our study characterised by a prompt and homogeneous emergence and a rapid initial growth of the crop, weeds did not determine consistent yield losses even at high densities. Moreover, the uncontrolled weeds remained under the height of cutting, not “polluting” the harvested product.
These preliminary results suggest that a successful weed management system in processing spinach (granted that other cultural measures maintained the weed population at a manageable level) should allow an initial competitive advantage for the crop in order to improve selectivity during subsequent physical weeding operation and to reduce weed growth. To reach this aim, a false seedbed preparation, pre-emergence flaming or very shallow harrowing, and quick and regular crop emergence have to be provided, as found in other vegetables (see for example, Ascard, 1995; Melander & Rasmussen, 2001; Bond & Grundy, 2001).
However, further investigations in order to verify current results, especially in presence of a more competitive weed flora, are needed.
References
ASCARD J (1995) Thermal weed control by flaming: biological and technical aspect. PhD thesis, Swedish University of Agricultural Sciences, Alnarp, Sweden.
ASCARD J & BELLINDER RM (1996) Mechanical in-row cultivation in row crop. In: Proceedings Second International Weed Control Congress, Copenhagen, Denmark, 1121-1126.
BAUMANN DT (1992) Mechanical weed control with spring tine harrows (weed harrows) in row crops. In: Proceedings 9th International Symposium on the Biology of Weeds, Dijon, France, 123-128.
BOND W & GRUNDY A (2001) Non-chemical weed management in organic farming systems. Weed Research 41, 383-405.
FISCHER RA & MILES RE (1973) The role of spatial pattern in the competition between crop plants and weeds. A theorethical analysis. Mathematical Biosciences 18, 335-350.
FOGELBERG F (1998) Physical weed control – intra-row brush weeding and photocontrol in carrots (Daucus carota L.). PhD thesis, Swedish University of Agricultural Sciences, Alnarp, Sweden.
MELANDER B (1997) Optimization of the adjustment of a vertical axis rotary brush weeder for intra-row weed control in crops. Journal of Agricultural Engineering Research 68, 39-50.
MELANDER B (1998) Interaction between soil cultivation in darkness, flaming, and brush weeding when used for in-row weed control in vegetables. Biological Horticulture and Agriculture 16, 1-14.
MELANDER B. & RASMUSSEN G. (2001). Effects of cultural methods and physical weed control on intrarow weed numbers, manual weeding and marketable yield in direct-sown leek and bulb onion. Weed Research 41, 491- 508.
PARISH S (1990) A review of non-chemical weed control techniques. Biological Agriculture and Horticulture 7, 117-137.
RASMUSSEN J (1996) Mechanical weed management. In: Proceedings Second International Weed Control Congress, Copenhagen, Denmark, 943-948.

5th EWRS Workshop on Physical Weed Control 171 Pisa, Italy, 11-13 March 2002
RASMUSSEN J & ASCARD J (1995) Weed control in organic farming systems. In: Ecology and Integrated Farming Systems (eds DM Glen, MP Greaves & HM Anderson). John Wiley and Sons, Chichester, UK, 49-67..
SCHNIEDERS BJ (1999) A quantitative analysis of inter-specific competition in crops with a row structure. PhD thesis, Agricultural University Wageningen, The Netherlands.

5th EWRS Workshop on Physical Weed Control 172 Pisa, Italy, 11-13 March 2002
Cover crops, intercrops, mulches, manure
5th EWRS Workshop on Physical Weed Control 173Pisa, Italy, 11-13 March 2002
Impacts of composted swine manure on maize and three annual weed species
M. Liebman1, T. Richard2, D.N. Sundberg1, D.D. Buhler3, and F.D. Menalled1
1Department of Agronomy, Iowa State University, Ames, IA, 50011, USA 2Department of Agricultural and Biosystems Engineering, Iowa State University, Ames, IA, 50011,
USA 3Department of Crop and Soil Sciences, Michigan State University, East Lansing, MI, 48824, USA
Abstract
In recent years, water quality, odor, and cost concerns associated with conventional swine production practices have led a growing number of farmers in Iowa and elsewhere to adopt alternative production methods. These alternatives include the use of hoop structures that are bedded with a deep layer of maize stalks or grain straw. Mixtures of bedding and swine manure are easily composted and the resulting material can be spread on agricultural land as a soil amendment. Impacts of composted swine manure on crop and weed performance are poorly understood, however.
To address this information gap, we conducted a field experiment in which we measured the effects of composted swine manure on soil characteristics, maize growth and grain yield, and growth and competitive ability of three annual weed species. From 1999 through 2001, maize was grown alone (weed-free) or in mixture with Amaranthus rudis, Abutilon theophrasti, or Setaria faberi, in plots receiving conventional rates of synthetic fertilizer or lower rates of fertilizer supplemented with composted swine manure. Maize production in all treatments occurred within a 3-year rotation consisting of soybean winter wheat + red clover maize. Compost was applied at a rate of 8 Mg C/ha preceding maize and soybean phases of the rotation and was incorporated with a chisel plow. Weeds were sown by hand in maize rows and thinned to fixed densities.
Compost application consistently increased soil nitrate-N, K, and organic matter levels. Soil moisture and P levels were as high or higher in plots receiving compost than in those without compost. Compost also increased maize height, stem diameter, leaf K concentration, and stalk nitrate-N concentration. Under weed-free conditions, maize grain yield did not differ between the two soil amendment treatments. In contrast, compost significantly increased A. rudis height and biomass in all three years, and increased growth of A. theophrasti in 2001. For all three weed species, seed production was strongly correlated with biomass production. Weeds had no effect on maize yield in either 1999 or 2000, regardless of soil amendment treatment, probably because weed planting was delayed 8 days by wet weather in 1999, and weed emergence was slowed by dry conditions in 2000. In 2001, maize grain yield was reduced by each of the three weed species, and compost application exacerbated the competitive effect of A. theophrasti on maize yield. Tissue analyses indicated that compost application greatly increased P and K levels in weeds, and that these increases were proportionally greater than those observed for maize.
Results of this study indicate that weeds can be more responsive than maize to composted swine manure. Amaranthus rudis was more consistently responsive to compost than were A. theophrastiand S. faberi. Differential responses between maize and weeds to compost appear to have been related to changes in P and K dynamics. Use of compost as a means of maintaining or enhancing soil quality will require that effective weed management practices are in place.

5th EWRS Workshop on Physical Weed Control 174 Pisa, Italy, 11-13 March 2002
Cover crops and mulches for weed control in organically grown vegetables
Lars Olav Brandsæter Norwegian Crop Research Institute Plant Protection Centre 1432 Ås, Norway E-mail: [email protected]
Hugh Riley Norwegian Crop Research Institute Apelsvoll Research Centre division Kise 2350 Nes på Hedmark, Norway E-mail: [email protected]
Abstract
Cropping systems for organic vegetable production should function with respect to both crop protection and plant nutrition. The use of living cover crops, such as white clover in cabbage, has shown promising results in relation to both weed and pest control. However, competition for nutrients and water is a main obstacle in such systems. To avoid competition, we have focussed on three different approaches in our experiments: A) The synchronisation of a cover crop with the onset of maximum vegetative growth of the vegetable crop. B) The establishment of a winter annual or biennial legume, of erect growing habit, during the first year, followed by mowing the legume in spring before transplanting vegetables into the mulch. C) The use of chopped mulch material obtained from a green manure crop elsewhere in the rotation, in sown or transplanted crops. For the first approach, Sub-clover (Trifolium subterraneum L.) shows favourable growth characteristics. However, cultivars with sufficient winter survival ability for Norwegian conditions were not found in our experiments. For the second approach, screening experiments have shown that the winter annual legume Hairy Vetch (Vicia villosa Roth.) and the biennial legume Yellow Sweet Clover (Melilotus officinalis (L.) Pall.) are probably the most promising species. Preliminary results, from experiments in which cauliflower was transplanted into a mulch of mown Hairy Vetch, showed that the green manure effect of this species was better when incorporated into the soil than when used as a surface mulch. For the third approach, the use of clover/grass material as a surface mulch in carrots, red beet and white cabbage has given good control of annual weeds, but not of perennials. It is difficult to quantify the amount of clover material needed for sufficient weed control in different vegetables. However, our experiments have shown that the following amounts may be appropriate: 6, 9 and 12 tonnes DM ha-1 for white cabbage, red beet and carrots, respectively. From a holistic point of view; the use of clover material has also given promising control of pests, especially in carrots, as well as having substantial nutritional value when used as either green manure or mulch.

5th EWRS Workshop on Physical Weed Control 175aPisa, Italy, 11-13 March 2002
The role of cover cropping in renovating poor performing paddocks
F.C. HoyleDepartment of Agriculture, Centre for Cropping Systems, Western Australia
Key messages
• Cover crops (green manure crops) can be used as a tool in an IWM strategy, particularly where herbicide resistance is an issue
• Legume crops used in renovating paddocks (green manure, brown manure, green mulch) canimprove grain yield and protein significantly
• Benefits on heavy soils can be maintained in the medium term following renovation• Crop type significantly influences suitability for renovation cropping• Data indicates green mulching and brown manuring may be used as an alternative to green
manuring on soils prone to erosion, in no till farming systems or in maintaining soil structure
Introduction
The development of renovation cropping techniques in Western Australia is primarily aimed at rejuvenating poorer performing areas of the farming system, where the viability and continuingproduction of grain crops is at risk due to limitations imposed by physical, biological or chemicalconstraints. This system will be developed to use a variety of management tools, such as greenmanure crops to provide an integrated approach to improving the long term viability of farmingsystems.
The value of legumes in crop rotations is evident in Western Australian farming systems, where diversified rotational sequences incorporating these plants have resulted in higher contributions ofmineral nitrogen to the soil. High biomass legume and pulse crops act as a ‘break’ crop in diseaseand pest cycles, allow effective grass control and rotation of herbicide groups in the farmingsystem. Where the production of conventional legume crops is limited by soil type and growingconditions, other options such as the use of ‘phase’ pastures may provide an alternative solution toimproving chemical fertility. Pasture species such as French Serradella 'Cadiz' can provideattributes such as soft seededness, high biomass production in a single year and may be integratedwith sheep management where required.
One of the primary factors in adopting a green manure phase is to combat the risk ofdeveloping herbicide resistance or, as a tool in managing populations where resistance has alreadybeen identified. A green manure phase, if managed properly, should result in 100% seed set control of weeds. Combined with integrated management options such as delayed seeding of the wheatphase, application of an early knockdown, high seeding rates and seed catching in rotation with acanola crop, growers are able to approach the problem of resistance with a number of differentmechanical and herbicide options.

5th EWRS Workshop on Physical Weed Control 175bPisa, Italy, 11-13 March 2002
DefinitionsFor the purpose of this paper, cover cropping refers to the growing of a crop with the principle
aim of incorporating or returning it to the soil. This method has been used in the past by growers in Western Australia, and is experiencing renewed interest as a tool to increase organic matter;improve the physical, biological and chemical properties of soil and as an integrated weedmanagement tool.
Conventional 'green manuring' involves the incorporation of green plant residue into the soil,by either discing or ploughing. ‘Brown manuring’ refers to desiccation of the crop and is most often used on soils prone to erosion. Mowing or slashing of a crop is referred to as ‘Green mulching’,plant residue left on the soil surface to maintain soil moisture by reducing evaporation.
Aim
This research project aims to evaluate appropriate crop types and incorporation techniquessuited to a Mediterranean environment, and quantify their influence on grain yield and quality, soilhealth and weed populations.
Materials and Methods
A range of crops is being evaluated for potential as 'cover crops' under different environmentalconditions in the wheatbelt of Western Australia. Species include a number of grain legume crops(eg. field peas, Lathyrus spp.), cereals (eg. oats), brassica (eg. mustard and canola), pasture species(eg. Cadiz, Biserrulla) and mixes of species. Treatments consisted of green manuring (ploughing),green mulching (slashing) and brown manuring (chemical dessication), imposed at anthesis.
Grain yield and quality measured on wheat and canola grown in rotation with cover crops,provide an initial estimate of likely benefits or loss. Physical and chemical soil characteristics suchas water infiltration, available nitrogen and organic carbon are also taken on a limited subset oftreatments. Sites established to investigate integrated weed management options include baselinesurveys of weed populations and above ground population dynamics. Many of these sites aremaintained for a minimum of two cropping phases to assess economic viability and medium termbenefits.
Case Study: 00WH63 (Bindoon, loamy sand)This trial was established at Bindoon in Western Australia, on a loamy sand pH4.8 in CaCl2 to 10cm-1 and increasing at depth. The site chosen was established to be responsive to nitrogen and hadan organic carbon of 4.9 per cent at the surface.
A number of crop treatments (field peas, mustard, lupins, oats) were sown in a randomisedblock design with three replicates. Three spring manipulation treatments were imposed within each plot (green manure, brown manure, green mulch) approximately 20 m in length and 3 m in width,the exception being the control plots which were taken to harvest in 2000. Crops were sown at 100kg ha-1 for the peas and lupins, 150 kg ha-1 for the oats and 8 kg ha-1 for the mustard treatments on the 23rd June. Plots received 140 kg ha-1 DAP (18%N, 20%P, 1.7%S), 70 kg ha-1 of which wasbanded below the seed and 70 kg ha-1 of which was drilled with the seed.
A non-selective was applied on the same day as seeding, and a selective herbicide appliedapproximately 20 days later. The manure treatments were imposed on 11th October 2000, following rain.

5th EWRS Workshop on Physical Weed Control 175cPisa, Italy, 11-13 March 2002
Results
2000Oats and mustard had significantly lower tissue nitrogen than the legume crops tested, although
high biomass production contributed to a high nitrogen input overall in 2000 (Table 1). Thelegumes contributed similar amounts of nitrogen but produced a significantly lower biomass, which would have advantages in stubble handling for the following growing season.
Table 1. Plant attributes of four renovation crops grown in 2000 at Bindoon on a loamy sand
Ryegrass no. (plants/m2) Tissue N% Crop DM (t/ha)Field peas 195 2.2 6.3Mustard 224 1.4 16.3Oats 194 1.2 20.5Lupins 224 2.9 4.4LSD (P=0.05) NS * 2.5
2001It is apparent in Figure 1 that nitrogen uptake by the wheat crop is higher during early growth forthe manured treatments when compared to the harvested control (peas), potentially indicating agreater availability for treated plots.
Figure 1. Tissue N % in wheat tops sampled at Bindoon, Western Australia on a loamy sand afterrenovation techniques imposed in 2000. Data is the average of all treatments. LSD(P<0.001), date*crop=0.27, crop=0.1, date=0.16
Significant gains in wheat grain yield and protein have been observed in this trial (Fig 2).
0123456
8-Jun 28-Jul 16-Sep 5-Nov 25-Dec
Date sampled
Plan
t tiss
ue N
(%)
Oats
Peas
Peas (H)

5th EWRS Workshop on Physical Weed Control 175dPisa, Italy, 11-13 March 2002
Figure 2. The effect of renovation crop treatments imposed in 2000 on grain yield and quality of wheat cultivar ‘Carnamah’ in 2001, at Bindoon on a loamy sand. Data is the average of all treatments. LSD (P<0.01), grain protein=0.3, grain yield=0.14.
At this site, no significant differences in grain yield and protein (Fig 3) were observed for differentincorporation techniques such as green manuring, brown manuring and green mulching in this trial(single site, single season). All 'manured' field pea treatments were significantly higher in both grain yield and protein than harvested field peas (Fig 3).
Figure 3. The effect of field pea treatments imposed in 2000 on grain yield and quality of wheatcultivar ‘Carnamah’ in 2001, at Bindoon on a loamy sand. LSD (P<0.01), grainprotein=0.6, grain yield=0.21.
The influence of manure treatments on weed populations (radish and ryegrass) is consistent acrossall crops, with no significant difference between green manuring, brown manuring and greenmulching (data not presented). Field pea treatments presented in Figure 4, indicate significantcontrol of background ryegrass and radish populations is also achieved.
0.00.51.01.52.02.5
Harvest(Fieldpea)
Lupins Mustard Oats Field pea
2000 Treatment
Gra
in y
ield
(t/h
a)
99.51010.51111.5
Gra
in p
rote
in %
Protein %
0.0
0.5
1.0
1.5
2.0
2.5
Harvest Greenmanure
Brownmanure
Greenmulch
2000 treatment
Gra
in y
ield
(t/h
a)
9.5
10
10.5
11
11.5
Gra
in p
rote
in (%
)
Grain yield (t/ha)
Protein (%)

5th EWRS Workshop on Physical Weed Control 175ePisa, Italy, 11-13 March 2002
Figure 4. The effect of field pea treatments imposed in 2000 on radish and ryegrass numbers in2001, at Bindoon on a loamy sand. In 2000 average weed number was 206 plants/m2.
Discussion
These results should be viewed in the context of data presented from a single site in a singleseason. Seasonal and spatial variability will influence potential benefits and further economicanalysis is required.
The biomass and associated nitrogen content of a crop provides a key for growers indetermining which species will provide the greatest potential for yield improvements. Time shouldbe spent considering the primary limiting factors, as different crops may be chosen for building soil organic matter, weed competition, nitrogen or stubble handling during seeding.
Although these data show significant gains can be achieved, a lack of prolonged benefits inother trials on lighter textured soils (data not presented) indicates medium term productivity gainsmay largely be associated with heavier soil types (sandy loam, loam, clay loam). Therefore if a crop fails in the year after a manure phase, it is likely a significant proportion of the benefits may also be lost. A similar trial on a heavier soil at this site (data not presented) yielded approximately 15-20%higher when green manure treatments were compared to a control, and must therefore yield andquality benefits must be maintained for longer to be economically viable.
The cost of a green manure phase is largely associated with the loss of income required to grow and subsequently ‘sacrifice’ a crop in a Mediterranean type environment. There is a highly variablerisk often associated with the implementation of a green manure phase (Moerch and Bathgate,2000), the primary benefits likely to be associated with nitrogen recovery. Recovery of nitrogenfollowing a green manure crop is likely to vary due to soil type, environment, crop type ormanagement; quality and yield potential realised dependent on the percentage of residuedecomposed (Badaruddin and Meyer, 1990).
The adoption of green manure crops may be most profitable where a ‘tactical’ approach istaken, such as in response to a seasonal event or disease outbreak, where the costs involved areminimal and is likely to provide most benefit in Western Australia. Initial analysis suggests thismay occur in a low-income year (low yield potential) or where a crop fails (Moerch and Bathgate,2000). Strategic use of manure crops may be employed together with other management optionswhere problems exist that have resulted in a yield decline of 20% or more (Moerch and Bathgate,2000) and represent part of a long-term systems approach to resolving specific issues. These types
0
40
80
120
160
Rye
gras
snu
mbe
r(p
lant
s/m2)
Harvest Greenmanure
Brownmanure
Greenmulch
Treatment imposed in 2000 on field pea
LSD (P=0.05)

5th EWRS Workshop on Physical Weed Control 175fPisa, Italy, 11-13 March 2002
of strategies would be appropriate for sites where large weed populations are present, or herbicideresistance restricts the management of weeds through chemical application.
In paddocks with herbicide resistant populations, management may preclude the use ofselective herbicides. Delayed seeding, enabling the effective use of knockdown herbicides, provides an ideal start for a quick growing, high biomass crop (high vigour) crop able to compete effectively against further weed germinations. Combined with rotational management strategies, high seedrates, tillage practices and appropriate herbicide use, it is possible to realise significant reductions in weed numbers.
Virtually any crop or pasture can be utilised as a green manure, but to maximise gains to thefollowing cropping phase, they should be managed to produce a maximum amount of biomass andmanured at, or soon after flowering. Soil type must be considered when making decisions on themethod of renovation. Lighter soils at risk of erosion should be treated with care, and greenmulching or brown manuring may be preferable options in this situation.
Acknowledgements
I would like to acknowledge Judith Devenish and James Bee for the technical support provided to this project and the provision of a site by the Bindoon Catholic Agricultural College. This trialwas established and maintained by the Wongan Hills Research Support Unit, WADA. I would alsolike to acknowledge the funding base provided by the Department of Agriculture and the GrainsResearch and Development Corporation (GRDC).
References
BADRUDDIN, M. AND MEYER, D.W. (1990). Green-manure legume effects on soil nitrogen,grain yield and nitrogen nutrition of wheat. Crop Science, 30, 819-825.
MOERCH, R AND BATHGATE, A. (2000). An economic analysis of renovation cropping.Economic Series 99.10. Policy and Economics Group, Department of Agriculture WesternAustralia.

5th EWRS Workshop on Physical Weed Control 176 Pisa, Italy, 11-13 March 2002
Managing intercrops to minimise weeds
H.C. Lee & S. Lopez-Ridaura Imperial College, Department of Agricultural Sciences, Wye, Ashford, Kent TN25 5AH, UK
Abstract
A field experiment is described which investigates possible relationships between a wheat-field bean intercrop and associated weeds. Intercrop and sole crop canopy light interception was monitored and compared with both intercrop and weed biomass yields. The intercrop treatments were generally associated with reduced weed biomass. The tentative conclusion was that weeds were inhibited by the interaction of at least several factors: competition for light, soil moisture and perhaps other non-measured factors. The relevant literature is reviewed and it is concluded that further work is needed to try and understand the key factors leading to weed inhibition in intercrops and how these factors might interact.
Introduction
When two plants grow near to each other, it is known that they are likely to compete for environmental resources (Vandermeer, 1990) and that this competitive interaction is liable to be changed by factors such as nutrient status, water availability and degree of shading (Harper, 1977). The same competitive relationship is likely between individuals of different species, including crops and weeds, though this can also lead to facilitation (enhancement of conditions for an individual of one species by the activities of another) (Vandermeer, 1990).
When crop-weed interactions are therefore examined, it is no surprise that weed biomass tends to decrease as crop density increases (Lawson & Topham, 1985) and vice versa (Malik et al., 1993). Indeed, the choice of crop species and their rotation was a key method of weed management prior to the advent of herbicides (Walker & Buchanan, 1982) and continues to be so on organic farms (Lampkin, 1990). This competitive interaction has also been shown to be true between weeds and intercrops (Mohler & Liebman, 1987).
In general, many studies of intercrops report that they tend to be associated with reduced weed biomass compared to the respective sole crops (Akobundu & Okigbo, 1984; Fujita et al., 1992; Hosmani & Meti, 1993; Koster et al., 1997; Ghanbari-Bonjar & Lee, 2002a&b). This seems generally to be due to a greater utilisation efficiency of resources (especially light, water and nutrients) by intercrops (Willey & Osiru, 1972; Reddy & Willey, 1981; Abraham & Singh, 1984; Unamma et al., 1986; Fukai & Trenbath, 1993).
This paper presents data for one field experiment, which monitored the light environment in a wheat-field bean intercrop. Results from other researchers are also reviewed, to try and understand potential interactions of competitive factors and formulate general conclusions.

5th EWRS Workshop on Physical Weed Control 177 Pisa, Italy, 11-13 March 2002
Materials and Methods
One field experiment was carried out on the Prescott field of Imperial College farm at Wye, Kent, UK (51o 11´N, 0o 57´E, altitude 40-50 m above sea level). The field experiment was conducted during the spring and summer of 1997. The soil series was a well-drained calcareous silt loam of pH 8.0 and with 4.5% organic matter content. The average chemical concentrations of N, P, K Ca and Mg were 2.1, 40.2, 175.7, 3153.2, and 61.4 mg/kg, respectively. The experimental site had previously been used for a commercial crop of forage maize. No herbicides were applied during the experiment.
The treatments were compared in a split plot design with harvesting times as the main plot, and cropping system as the sub plot. For both experiments the densities of wheat and beans are expressed as percentages of their recommended drilling rates (RDR), sole crop densities being 480 (192 kg ha-1) and 48 (235 kg ha-1) seeds m-2, respectively. Inter-row spacing was 17 and 34 cm in the sole crops of wheat and bean, respectively. Alternate row intercrops of wheat and bean, were used with an inter-row spacing of 17 cm. Bean was planted first at a depth of 7 cm with a Pneumasem vacuum drill, and then wheat at 3 cm depth with a Hege plot drill. All plots were 12 m long by 2 m wide and were drilled longitudinally.
The spring wheat variety Chablis and bean variety Victor were used. There were three harvest dates as main plots when the sole wheat reached (H1) growth stage 67 (Zadok et al., 1974) and bean growth stage 72 (Stulpanagel, 1984) (15 June), (H2) wheat stage 75 and bean stage 78 (15 July) and (H3) wheat stage 87 and bean stage 85 (30 July). At H1, H2 and H3 crop and weed biomass were assessed. H1, H2 and H3 equated to sole wheat dry matter (DM) contents of 30, 45 and 60%, respectively. At each harvest date four treatments were nested, of which two were sole crops and two were intercrops. The two sole crops of beans (B) and wheat (W) were grown at 100% RDR. The two intercrop treatments were 100% RDR bean-50% RDR wheat (Bw) and 50% RDR bean-100% RDR wheat (bW). The experiment was drilled on 11 March 1997.
One-metre long, cylindrical thermocouple solarimeters (Szeicz et al., 1964) were assembled at Imperial College, Wye and calibrated using a commercial Kipp (Kipp and Zonen, Netherlands) as standard. Collection of light interception data in the field used a Delta ‘T’ Data-Logger, measuring every minute and condensing data as an average every hour. This was done on three dates in 1997: 31 May, 12 June and 24 June between 05.30h and 20.30h. Crop and weed biomass harvest dates did not coincide with those for light measurements due to a shortage of labour.
Results
The major weed species were Polygonium aviculare, Fumaria officinalis, Galium aparine,Ranunculus repens, Papaver rhoeas, Capsella bursa-pastoria and Rumex spp. for all treatments. Total monthly rainfall for the experimental period was: June = 135.4mm; July = 37.0mm. Light interception was greatest for Bw on 31 May, but that for B was largest for the latter two dates, though Bw was similar (Table 1). Both B and bW showed a relatively large weed biomass on 15 June but these decreased at later dates (Table 2). By comparison, W and Bw showed smaller biomasses of weeds throughout the experiment and Bw also gave the largest crop biomass yields of all treatments.

5th EWRS Workshop on Physical Weed Control 178 Pisa, Italy, 11-13 March 2002
Table 1. Percentage of light intercepted, averaged between 05.30h and 20.30h (no error values available).
Date B W Bw bW 31 May 62.5 59.6 73.8 70.012 June 79.3 56.2 77.8 67.324 June 86.7 60.2 85.0 74.6
treatment key: B = sole bean; W = sole wheat; Bw = 100% RDR bean, 50% RDR wheat; bW = 50% RDR bean, 100% RDR wheat.
Table 2. Crop and weed biomass yield (t ha-1).
B W Bw bW H115 June
Crop biomass 2.85 3.95 4.90 4.35 Weed biomass 1.62 0.16 0.24 2.00
H215 July
Crop biomass 7.65 7.35 9.80 9.65 Weed biomass 1.31 0.09 0.38 0.51
H330 July
Crop biomass 10.27 6.57 10.30 9.20 Weed biomass 1.25 0.10 0.38 0.20
SEDs: Crop biomass harvest dates = 0.23; Cropping treatments = 0.28 Weed biomass harvest dates = 0.14; Cropping treatments = 0.11
treatment key: B = sole bean; W = sole wheat; Bw = 100% RDR bean, 50% RDR wheat; bW = 50% RDR bean, 100% RDR wheat.
Discussion
So, what is the relationship between crop and weeds for the above data? Sole bean had the largest weed problem, but this declined during the experiment and bean yield improved in July despite the drier soil. All other treatments were associated with generally lower weed biomasses throughout. The only exception, bW in June, may have been anomalous and due to site variation. The rapidly drying soil in July may have led to competition for soil moisture between crops and weeds. It is therefore possible to hypothesise that light interception and shading of weeds may have interacted with that of competition for soil moisture. However interpretation is further complicated by the sole wheat treatment, which intercepted only about 60% of incoming light throughout the experiment. Later in the experiment, when soils were drier, this could be expected to be due to competition for soil moisture. However in June, when there was adequate soil moisture available, it does not seem likely that weeds suffered excessive competition with wheat for light or water. The relatively lower weed biomass in June in sole wheat might therefore have been due to some other inhibition not measured here. Thus, there seems to be evidence of the interaction of at least several factors affecting the incidence of weeds in this experiment: light, soil moisture and perhaps other factor(s) that have not been identified.
Light Some researchers refer to intercrops in terms of their ability to ‘smother’ weeds (Akobundu & Okigbo, 1984; Zuofa et al., 1992) whilst many others specifically refer to competition for light (Keating & Carberry, 1993; Carsky et al., 1994; Olasantan et al., 1994; Srivastava & Srivastava, 1996; Maina & Drennan, 1997; Maina, 1997; Rana & Mahendra Pal, 1999). For the data reported in this paper, competition for light might not have been the only factor, as discussed above. Below-
5th EWRS Workshop on Physical Weed Control 179 Pisa, Italy, 11-13 March 2002
ground competition of roots for moisture may have also been important. Root development and the ability to compete for water is well known to be important for sorghum/groundnut intercrops (Azam-Ali et al., 1990) and other cereal intercrops such as maize/pea competing against weeds, especially in drier conditions (Semere & Froud Williams, 1997). Morris and Garrity (1993a) review earlier work and conclude that many intercrops exhibit greater water use efficiency (WUE) than respective sole crops, though shading within intercrops can alter the vigour of some low-growing legumes and reduce this factor (Eriksen & Whitney, 1984).
Nutrients and water Competition for nutrients is also important between weeds and intercrops. For instance, weed biomass has been analysed for nutrient concentrations within sole maize crops (Morrish, 1995) and those intercropped with cowpea (Ayeni et al., 1984) and shown to contain close to twice that found in the maize crop. This ability of many weed species to take up proportionately greater amounts of nutrients from the soil may be due to comparatively finer root systems. This is shown when comparing crops: for example, the ability of barley to take up more phosphorus and potassium than field beans when intercropped (Martin & Snaydon, 1982). In that case, the lower biomass but finer root system of the barley appeared more efficient than that of the field bean. However, the growing seasons of these experiments (1977 and 1978) did not suffer from any prolonged drought, as shown by rainfall data in that paper. Thus it can be suggested that crops (or weeds) with smaller, finer root systems can benefit from more efficient nutrient uptake when soil moisture is favourable. However, any prolonged drought may lead to the dominance of the ability to take up soil moisture, which will favour crops (or weeds) with deeper rather than finer rooting systems. An additional factor might be that of facilitation, since root exudates from some plants are known to increase the availability of P in soils. Thus Morris & Garrity (1993b) report that white lupin led to increased P uptake by wheat and that pigeon pea similarly benefited sorghum.
Time of weed emergence and allelopathy In addition to the classic competition factors discussed above, there are several others, which are less reported but still potentially significant. Time of weed emergence is well known to be important. It is the main reason why organic autumn-drilled crops are usually planted later (October/November) than conventional (September/October), to avoid the known flush of weed emergence in September (Lampkin, 1990). Some research with intercrops has shown that component species may show an alteration in their critical period for potential weed interference. For example, research has suggested that yam intercropped with maize is much more sensitive to early competition with weeds (from three weeks after planting) than corresponding sole yam (Orkwor et al., 1994). Thus, some intercrops may actually increase the susceptibility of at least one intercrop component to weed interference. Another rather more controversial aspect of plant interaction is allelopathy. Some agronomists argue that allelopathy can be important (Walker & Buchanan, 1982), whilst others argue the opposite: for a good review, see Inderjit & Keating (1999). Mohler & Liebman (1987) who worked on barley-field pea, suggested that the relative dominance of barley might have been partly due to its allelopathic inhibition of the field pea, similarly supported by other work (Overland, 1966). Caamal-Maldonado et al.,(2001) have studied several legume crops (velvet bean, jumbie bean and jack bean) as cover crops with potential allelopathic effects against weeds. Is allelopathy therefore a relatively widespread factor in crop weed interactions? Further research at Wye will be investigating the possibility during 2002 and thereafter.
5th EWRS Workshop on Physical Weed Control 180 Pisa, Italy, 11-13 March 2002
Interaction of factors The final point to consider is a holistic one: intercrops may compete with weeds due to the interaction of several or even all of the above factors considered, with the relative importance of each factor depending upon stage of growth, soil conditions, weather and also crop genetic (cultivar) characteristics. Some work considers the potential interaction of factors, such as light and water for cotton-velvetleaf intercrops (Salisbury & Chandler, 1993) and interactions of light and nitrogen for pea-barley intercrops (Jensen, 1996). However there is very little other similar work in the literature. As a conclusion, it is suggested that more needs to be done to investigate the relative importance of competition factors between intercrops and weeds. We need to understand if some factors are more important than others and how choice of genotype and variations in environment (especially weather and soil conditions) might affect intercrop-weed competition. Work so far clearly indicates the potential for intercrops to reduce the incidence of weeds within farming systems without resort to herbicides and this useful attribute should be explored further. However, this is easy to state here but may prove technically challenging to undertake in the field. At Wye this will be a priority for our research on intercrops over the next years.
References
ABRAHAM C.T. & SINGH S.P. (1984) Weed management in sorghum-legume intercropping systems. Journal of Agricultural Science, Cambridge, 103, 103-115.
AKOBUNDU I.O. & OKIGBO B.N. (1984) Preliminary evaluation of ground covers for use as live mulch in maize production. Field Crops Research, 8, 177-186.
AYENI A.O., AKOBUNDU I.O. & DUKE W.B. (1984) Weed interference in maize, cowpea and maize/cowpea intercrop in a subhumid tropical environment. II. Early growth and nutrient content or crops and weeds. Weed Research, 24, 281-290.
AZAM-ALI S.N., MATTHEWS R.B., WILLIAMS J.H. & PEACOCK J.M. (1990) Light use, water uptake and performance of individual components of a sorghum/groundnut intercrop. Experimental Agriculture, 26, 413-427.
CAAMAL-MALDONADO J.A., JIMENEZ-OSORNIO J.J., TORRES-BARRAGAN A. & ANAYA A.L. (2001) The use of allelopathic legume cover and mulch species for weed control in cropping systems. Agronomy Journal, 93, 27-36.
CARSKY R.J., SINGH L. & NDIKAWA R. (1994) Suppression of Striga hermonthica on sorghum using a cowpea intercrop. Experimental Agriculture, 30, 349-358.
ERIKSEN F.I. & WHITNEY A.S. (1984) Effects of solar radiation regime on growth and N2fixation of soybean, cowpea and bushbean. Agronomy Journal, 76, 529-535.
FUJITA K., OFOSU-BUDU K.G. & OGATA S. (1992) Biological nitrogen fixation in mixed legume-cereal cropping systems. Plant and Soil, 141, 155-175.
FUKAI S. & TRENBATH B.R. (1993) Processes determining intercrop productivity and yields of component crops. Field Crops Research, 34, 247-271.
GHANBARI-BONJAR A. & LEE H.C. (2002a) Intercropped wheat (Triticum aestivum L.) and bean (Vicia faba L. ) as a whole-crop forage: effect of harvest time on forage yield and quality. Grass and Forage Science, (in press).
GHANBARI-BONJAR A. & LEE H.C. (2002b) Intercropped field beans (Vicia faba) and wheat (Triticum aestivum) for whole crop forage: effect of nitrogen on forage yield and quality, Journal of Agricultural Science, Cambridge, (in press).
HARPER J.L. (1977) Population Biology of Plants. Academic Press, London. HOSMANI M.M. & METI S.S. (1993) Non-chemical means of weed management in crop
production. Integrated weed management for sustainable agriculture, Volume 1, pp. 299-305. Proceedings of a conference held at the Department of Agronomy, CCS Haryana Agricultural Universtiy, Hisar, Haryana, India, 18-20 November 1993.

5th EWRS Workshop on Physical Weed Control 181 Pisa, Italy, 11-13 March 2002
INDERJIT & KEATING K.I. (1999) Allelopathy: Principles, Procedures, Processes, and Promises for Biological Control. Advances in Agronomy, 67, 141-232.
JENSEN E.S. (1996) Grain yield, symbiotic N2 fixation and interspecific competition for inorganic N in pea-barley intercrops. Plant and Soil, 182, 25-38.
KEATING B.A. & CARBERRY P.S. (1993) Resource capture and use in intercropping: solar radiation. Field Crops Research, 34, 273-301.
KOSTER A.Th.J., VAN DER MEER K.Y., VAN HAASTER A.J.M., KOK B.J. & VAN AANHOLT J.T.M. (1997) Strategies for effective weed control in the future. ActaHorticulturae, 430, 669-675.
LAMPKIN N. (1990) Organic Farming. Farming Press, Ipswich. LAWSON H.M. & TOPHAM P.B. (1985) Competition between annual weeds and vining peas
grown at a range of population densities: effects on the weeds. Weed Research, 25, 221-229.MAINA J.M. (1997) The effects of intercropping on weeds and weed management in maize
growing. PhD thesis, University of Reading, UK. 190 pp.MAINA J.M. & DRENNAN D.S.H. (1997) Suppression of weeds in maize intercrops in Kenya.
The 1997 Brighton Crop Protection Conference – Weeds, pp. 655-656. MALIK V.S., SWANTON C.J. & MICHAELS T.E. (1993) Interaction of white bean (Phaseolus
vulgaris L.) cultivars, row spacing and seeding density with annual weeds. Weed Science, 41,62-68.
MARTIN M.P.L.D. & SNAYDON R.W. (1982) Root and shoot interactions between barley and field beans when intercropped. Journal of Appplied Ecology, 19, 263-272.
MOHLER C.L. & LIEBMAN M (1987) Weed productivity and composition in sole crops and intercrops of barley and field pea. Journal of Applied Ecology, 24, 685-699.
MORRIS R.A. & GARRITY D.P. (1993a) Resource capture and utilization in intercropping: water. Field Crops Research, 34, 303-317.
MORRIS R.A. & GARRITY D.P. (1993b) Resource capture and utilization in intercropping: non-nitrogen nutrients. Field Crops Research, 34, 319-334.
MORRISH C.H. (1995) Aspects of mechanical and non-chemical weed control in forage maize (Zea mays L.). PhD thesis, Wye College, University of London, UK. 356 pp.
MURPHY S.D., YAKUBU Y., WEISE S.F. & SWANTON C.J. (1996) Effect of planting patterns and inter-row cultivation on competition between corn (Zea mays) and late emerging weeds. Weed Science, 44, 856-870.
OLASANTAN F.O., LUCAS E.O. & EZUMAH H.C. (1994) Effects of intercropping and fertilizer application on weed control and performance of cassava and maize. Field Crops Research, 39, 63-69.
ORKWOR G.C., OKEREKE O.U., EZEDINMA F.O.C., HAHN S.K., EZUMAH H.C. & AKOBUNDU I.O. (1994) The response of yam (Dioscorea rotundata Poir.) to various periods of weed interference in an intercropping with maize (Zea mays L.), Okra (Abelmoschusesculentus L. Moench), and sweet potato (Ipomoea batatus L. Lam). Acta Horticulturae, 380, 349-354.
OVERLAND L. (1966) The role of allelopathic substances in the ‘smother crop’ barley. AmericanJournal of Botany, 53, 423-432.
RANA K.S. & MAHENDRA PAL (1999) Effect of intercropping systems and weed control on crop-weed competition and grain yield of pigeonpea. Crop Research (India), 17, 179-182.
REDDY M.S. & WILLEY R.W. (1981) Growth and resource use studies in an intercrop of pearl millet/groundnut. Field Crops Research, 4, 13-24.
SALISBURY C.D. & CHANDLER J.M. (1993) Interaction of cotton (Gossypium hirsutum) and velvetleaf (Abutilon theophrasti) plants for water is affected by their interaction for light. WeedScience, 41, 69-74.

5th EWRS Workshop on Physical Weed Control 182 Pisa, Italy, 11-13 March 2002
SEMERE T & FROUD-WILLIAMS R.J. (1997) The effects of maize cultivars and planting patterns of maize/pea intercrops on weed suppression. The 1997 Brighton Crop Protection Conference – Weeds, pp. 1009-1014.
SRIVASTAVA G.P. & SRIVASTAVA V.C. (1996) Effect of crop-weed competition on seed yield of pigeonpea + urdbean intercropping system. Journal of Research (BAU), 8, 139-141.
STULPANAGEL R. (1984) Proposal of growth stages for Vicia faba. Vicia faba: agronomy,physiology and breeding. (eds. Hebblethwaite P.D., Dawkines T.C.K., Heath M.C. and Lockwood G.), Martinus Nijhof, The Hague. pp. 9-14.
SZEICZ G., MONTEITH J.L. & DOS SANTOS J.M. (1964) Tube solarimeters to measure radiation among plants. Journal of Applied Ecology, 1, 169-174.
UNAMMA R.P.A., ENE L.S.O., ODURUKWE S.O. & ENYINNIA T. (1986) Integrated weed management for cassava intercropped with maize. Weed Research, 26, 9-17.
VANDERMEER J.H. (1990) Intercropping. Agroecology. (Eds. Carroll C.R., Vandermeer J.H. & Rosset P.M.), pp. 481-516. McGraw-Hill, New York.
WALKER R.H. & BUCHANAN G.A. (1982) Crop manipulation in integrated weed management systems. Weed Science, 30 (supplement), 17-24.
WILLEY R.W. & OSIRU D.S.O. (1972) Studies on mixtures of maize and beans (Phaseolus vulgaris) with particular reference to plant population. Journal of Agricultural Science, Cambridge, 79, 517-529.
ZADOK J.C., CHANG T.T. & KONZAK C.F. (1974) A decimal code for the growth stages of cereals. Weed Research, 14, 415-421.
ZUOFA K., TARIAH N.M. & ISIRIMAH N.O. (1992) Effects of groundnut, cowpea and melon on weed control and yields of intercropped cassava and maize. Field Crops Research, 28, 309-314.

5th EWRS Workshop on Physical Weed Control 183 Pisa, Italy, 11-13 March 2002
Impact of composted swine manure on crop and weed establishment and growth
Fabián D. Menalled, Matt Liebman, and Douglas D. Buhler 308 National Soil Tilth Laboratory, 2150 Pammel Drive, Ames, IA 50011-4420
E-mail: [email protected]
Abstract
Composted swine manure represents a promising approach to recycle waste products and improve soil fertility. However, little is known about how this and other soil amendments affect soil-crop-weed interactions. We conducted a series of experiments to evaluate the influence of compost on crop and weed germination, seedling emergence, growth, and competitive ability.
Laboratory Bioassay Experiments. Three crop species (corn -Zea mays-, soybean -Glycine max-,and wheat -Triticum aestivum-) and three weed species (giant foxtail -Setaria faberi-, velvetleaf -Abutilon theophrasti-, and common waterhemp -Amaranthus rudis-) were chosen to assess the effects of compost on germination and early growth. For each species, seeds were placed in moistened germination paper with 100 g of soil containing the equivalent of no compost (0g C/cm2), low compost (0.485g C/cm2), medium compost (0.97g C/cm2), or high compost (1.455g C/cm2). After 4 days of incubation, number of germinated seeds and root length were measured. Compost reduced germination and root length of all species. Three patterns were detected when relative values [(control–compost amended)/control] were regressed against ln(seed weight). First, compost did not affect root length, but reduced germination. Second, the inhibitory effect on germination increased with compost concentration. Finally, compost's inhibitory effect declined with seed size.
Greenhouse Study. To understand the impact of organic soil amendments on establishment and growth we used the species and compost concentrations described above. Species were sown in pots and emergence was determined every 3-5 days. The first 4 emerging plants were marked and allowed to grow. At 18 and 39 days after planting we measured basal diameter, height, leaf area, and biomass. Compost did not affect emergence of any of the three crops, but reduced total emergence in two of the three weed species: velvetleaf and common waterhemp. In the no-compost treatment, relative growth rate (RGR) and leaf area expansion rate (LAER) were similar among the 6 species. However, weeds had significantly larger RGR and LAER than crops in the medium and high compost treatments.
Field Experiment. This study assessed the impact of compost and tillage on crop-weed interactions. We selected 8 no-tillage and moderate-tillage soybean plots (7.6 m by 13 m) with compost added at a rate of 8 103 kg C/ha, or without compost. In each plot, 5 experimental units were assigned to the following treatments: 1) common waterhemp sown at soybean planting, 2) common waterhemp sown at soybean emergence, 3) common waterhemp sown at soybean second-node stage, 4) common waterhemp sown at soybean sixth-node stage, and 5) weed-free soybean. Plant diameter and height were measured periodically and biomass at the end of the growing season. In all studied situations, common waterhemp sown at planting reduced soybean stem diameter. In tilled plots where common waterhemp was excluded until the second-node stage, compost increased soybean diameter. These results, together with those from the laboratory and greenhouse studies, indicate that compost reduces weed emergence, but increases weed competitive ability. Therefore, compost applications should be done within the context of an effective integrated weed management program.

5th EWRS Workshop on Physical Weed Control 184 Pisa, Italy, 11-13 March 2002
A system-oriented approach to the study of weed suppression by cover crops and their residues
A.C. Moonen & P. Bàrberi Scuola Superiore Sant’Anna, Pisa, Italy
Abstract
This paper aims to propose and discuss a system approach to study weed suppression by cover crops and their residues, including research in allelopathy, in order to predict long-term effects of these interactions that could eventually be turned into practical management advice. Three possible cover crop-weed interaction mechanisms have been identified: (1) the suppression effect of autumn-sown cover crops on weed populations establishing in the cover crop, (2) the weed suppression effect of cover crop residues on the weed population developing in the cash crop following the cover crops and (3) the residual effect on weed seedbank size and composition present in the next winter cash crop. All three mechanisms will be studied by observations in a field trial and by ‘nature-simulating’ laboratory and glasshouse experiments.
Introduction
Biochemical interactions among plants have been described for natural (Souto et al., 2000) as well as agricultural ecosystems. In agricultural systems, allelopathic substances released by residues of certain crop species can help suppress weed species. To improve this effect, several studies have been carried out on the use of cover crops to maximise weed suppression by allelopathic interaction (Masiunas et al., 1995; Lehman & Blum, 1997). Living cover crops exert a weed suppression capacity mainly through resource competition, while the mulch layer left on the soil surface or the residue incorporated in the soil after cover crop destruction result in changed soil physical conditions (Teasdale & Mohler, 1993). Besides a physical effect, the decaying residue may release allelopathic substances. Both factors influence weed seed germination and seedling early growth. However, the relative contribution of alteration of the physical environment and allelopathy to cover crop residue – weed interactions still has to be clarified. The natural substances that can cause allelopathy are secondary compounds released by microorganisms during plant decomposition or leached by roots or leaves. The most frequently found compounds belong to the group of phenolic acids and include benzoic and cinnamic acids, coumarins, tannins, flavonoids, terpenoids, alkaloids, steroids and quinones. Allelopathic inhibition is caused by combined action of these compounds rather than by one single compound (Einhellig & Leather, 1988). Whether or not allelopathic inhibition will take place depends, besides the presence of the compounds in the soil, on soil factors like temperature, pH, humidity and nutrient status (Stowe & Osborn, 1980; Mwaja et al., 1995) and on weed species sensitivity (Weston et al., 1989; Burgos & Talbert, 2000).
Research on allelopathy is often criticised because proof of its existence in nature is considered insufficient. The six criteria, established by Willis (1985), that have to be confirmed in order to be able to conclude that allelopathy is actively present in the field have never been fully implemented. However, many researchers have attempted to give circumstantial evidence of the existence of allelopathy in the field by using Koch’s postulates, developing model systems and applying the concept of density-depended phytotoxicity in order to distinguish resource competition from allelopathic interactions in controlled laboratory and greenhouse experiments. Although evidence of allelopathic interactions coming from laboratory bioassays can only suggest the possibility of its

5th EWRS Workshop on Physical Weed Control 185 Pisa, Italy, 11-13 March 2002
existence in the field and cannot supply full prove of it, they can be very useful to increase the understanding of the mechanisms involved (Blum, 1999). Bioassays should be combined with field experiments because the information on phytotoxic compound concentration present in the plant tissue, debris or extracts is only useful in combination with knowledge about the characteristics of the environment, including the rhizosphere (Blum et al., 1999).
The aim of this paper is to propose and discuss a system approach to study weed suppression by cover crops and their residues, including research in allelopathy in order to predict long-term effects of these interactions that could eventually be turned into practical management advice. Such an approach is based on field observations in combination with controlled glasshouse and laboratory experiments under ‘natural’ conditions in order to determine the mechanisms responsible for the interactions between cover crops and weeds. Three possible cover crop-weed interaction mechanisms have been identified (Fig. 1): (1) the direct suppression effect (mainly exerted through resource competition) of autumn-sown cover crops on weed populations establishing in the cover crop, (2) the weed suppression effect (by changing the physical characteristics of the soil or through allelopathic interactions) of cover crop residues on the weed population developing in the cash crop following the cover crops (grain maize) and (3) a residual effect on weed seedbank size and composition present in the next winter cash crop (durum wheat). Therefore weed population sampling in the field will be carried out in the winter cover crop, in the following maize crop and in the winter durum wheat crop. To try to explain the weed population patterns observed in the field, glasshouse and laboratory experiments will be set up to identify if allelopathic interactions can be present in the field, if nitrogen fertilisation level can influence this effect and what can be the potential effect in the long run on the weed community composition.
Fig. 1. Potential cover crop-weed interaction mechanisms
Materials and Methods
The study will be carried out in a long-term field experiment that has been set up in 1993 at the Centro Interdipartimentale di Ricerche Agro-Ambientale ‘E. Avanzi’ of the University of Pisa (Lat. 43°40’ N; Long. 10°19’ E). From 1993 till 1998 the experiment consisted in a grain maize (Zea
Mechanism 1 Weed suppression by living cover crop: resource competition.
Mechanism 2 Weed suppression in the following crop by cover crop residue:change of soil physical characteristics and allelopathy.
Mechanism 3 A long-term weed suppression effect in crops with the same growing-season as the cover crop: seedbank depletion.
POTENTIAL WEED SUPPRESSION MECHANISMS OF COVER CROPS

5th EWRS Workshop on Physical Weed Control 186 Pisa, Italy, 11-13 March 2002
mays L.) continuous crop. In 1998 the experiment has been transformed into a two-year crop rotation between maize and durum wheat (Triticum durum Desf.), with only one main crop present each year. Cover crops ((rye (Secale cereale L.), subterranean clover (Trifolium subterraneum L.) and crimson clover (Trifolium incarnatum L.)) are sown in the autumn after wheat harvest and are killed with glyphosate in the spring, just before sowing of maize. The experiment has been set up as a split-split-plot design with two crop management systems (conventional and low-external input) in the main plots, four nitrogen fertilisation levels (0, 100, 200, 300 kg ha-1 mineral N for maize and 0, 60, 120, 180 kg ha-1 mineral N for wheat) in the sub-plots, and four cover types (stubble of the previous crop, subterraneum clover, crimson clover and rye) in the sub-sub-plots. The conventional system consists in ploughing (at ca. 30 cm depth), application of post-emergence herbicides and underploughing of the cover crops, while the low-external input system is based upon no-tillage, application of pre-sowing glyphosate + post-emergence herbicides and surface mulching of the cover crops. Every treatment is replicated four times in sub-sub-plots of 21 x 11 m, with a total of 128 sub-sub-plots. The highest fertilisation level will be excluded from these studies; this means that a total of 96 sub-sub-plots will be studied.
The four weed species selected for bioassays in glasshouse and in the laboratory are among the most noxious weeds of maize in the study area and are characterised by different seed size: Amaranthus retroflexus L. (1 mm), Chenopodium album L. (1 mm), Digitaria sanguinalis L. (1.5 mm) and Echinochloa crus-galli (L.) Beauv. (2 mm). All four species are present in the weed seedbank of the low-input system (Moonen & Bàrberi, unpublished data).
Mechanism 1:The aim of this study is to determine the combined effect of four soil cover types (three living
cover crops plus wheat stubble), three fertilisation levels and two crop management systems (conventional vs. low-external input system) on the weed population emerging in the field during the winter season.
Weeds will be sampled systematically. Weed presence will be monitored during the cover crop growing period and just before cover crop destruction. The parameter measured will be adapted to the field situation. During the first sampling period weeds will still be small and thus individuated and counted individually. At harvest, the biomass of cover crops and weeds will be collected and oven dried to constant weight.
Mechanism 2:The aim of this study is to determine: (1) the weed suppression capacity of cover crop residues
in the maize crop following the winter cover crops, (2) the relative contribution of physical and allelopathic effects of cover crop residues to the weed suppression capacity of several cover crop mulches, (3) the influence of different soil nutrient levels, due to previous different mineral nitrogen fertilisation of the main (cash) crops, on the allelopathic capacity of cover crop residues, (4) the influence of mineral nitrogen fertilisation applied at emergence time of maize and selected weed species on emergence and growth inhibition of these species by cover crop residues, (5) the influence of seed size on the susceptibility of weed and crop species to allelochemical interference and (6) the relation between allelopathic and chemical property dynamics in the cover crop residues and in the soil.
(a) Field weed population The aim of this study is (1) to evaluate differences in size and composition of field weed
populations due to the different effect of crop management system, nitrogen level and type of cover crop residue and (2) to find out if the differences in field weed populations persist during the whole maize cycle.

5th EWRS Workshop on Physical Weed Control 187 Pisa, Italy, 11-13 March 2002
The field weed population will be sampled at different moments: before and after post-emergence herbicide treatment and at maize harvest. Weeds will be sampled systematically. Sampling method will be adapted to the field situation. At the first sampling weed density will be counted. For the second sampling, the Braun-Blanquet method (Braun-Blanquet, 1964) will be applied to monitor weed abundance. At harvest the biomass of maize and will be collected and determined as described above. In every sampling period, also the thickness of the cover crop residue layer will be measured and its percent soil cover will be estimated visually.
(b) Emergence and growth of maize and four weed species in a glasshouse experiment The aim of the glasshouse experiment is (1) to determine the relative contribution of changes in
soil physical characteristics and allelopathic interactions exerted by cover crop residues on emergence and growth of maize and four weed species and (2) to establish any possible interaction between nitrogen fertilisation and the effectiveness of allelopathic substances in suppressing weeds.
Soil for the germination experiment in the glasshouse will be collected near the field experiment location and sterilised to eliminate the active seedbank. A fixed number of seeds will be distributed in each tub and the amount of cover crop residue to cover them will be the same for each tub, to avoid any possible effects related to mulch thickness. Tubs with inert poplar (Populus spp.) mulch will be used as control to test the physical effect of mulches on weed germination and successive development (Barnes & Putnam, 1983). Irrigation water will be added on top of the residue to mimic the rainfall pattern that will actually occur in the field in order to wash nutrients and allelochemicals out of the residue into the soil.
The cover crops are grown in plots that receive different nitrogen fertilisation treatments during cash crop growth. This can possibly influence the quantity of allelochemicals and nutrients released by the cover crop residues. Furthermore, the different fertilisation levels applied to maize are likely to influence the effectiveness of the allelopathic effect exerted by the cover crop residues on weeds. In order to determine if such an effect exists, every case will be tested with and without additional nitrogen fertilisation. The parameters that will be measured are emergence percentage, plant height, number of unfolded leaves and plant biomass at harvest.
(c) Determination of the content of nitrate and allelochemicals in the soil and in aqueous extracts of cover residues collected at different times after cover crop destruction and germination and early growth rate of maize and four weed species incubated with addition of aqueous residue extracts
The aim of this study is to determine: (1) if the allelochemicals reported to be found in rye and clovers are actually present in the soil and in the aqueous extracts of the cover crop residues and in what concentration, (2) if the mulches originating from plots subjected to various N fertilisation levels during cash crop growth release different nitrogen and allelochemical quantities, (3) if these differences are reflected in the soil nitrogen level, (4) the dynamics of allelochemical and nitrate release after cover crop destruction, and (5) if the aqueous extracts of the cover crop residues have an effect on germination and early growth of maize and four weed species.
For this experiment soil and debris will be collected in the low-external input system based on no tillage. The plots with wheat residue will be used as control plots with natural vegetation cover, since these plots have not been touched after wheat harvest in July 2001. Cover residue and soil will be collected and analysed at two-weekly intervals starting at cover destruction.
Six random soil cores will be taken in each plot, mixed and frozen with dry ice to stop microbial activity. At the same six points, residue samples will be taken, put in a paper bag and stored in a dry and dark place.

5th EWRS Workshop on Physical Weed Control 188 Pisa, Italy, 11-13 March 2002
Parameters to be determined in the soil are: temperature, nitrate, total N content, C/N, organic carbon content, pH, phosphorus, potassium, microbial biomass, soil respiration, water content and phenolic acid concentration. Parameters to be determined in the residue samples are: C/N, total N content, dry weight biomass and phenolic acid content. Aqueous extracts will be made of the residue and soil samples, and of the inert poplar mulch.
Of each residue and soil solution, part will be used for a High Performance Liquid Chromatography (HPLC) to determine which phenolic acids are present (Barnes & Putnam, 1987; Barnes et al., 1987; Copaja et al., 1999; Kato-Noguchi, 1999), and another part will be used for analysis of the chemical properties. For the aqueous residue extracts, the remaining solution will be used to test its effect on germination and early growth of maize and four weed species. For each sample, seeds will be placed in a Petri-dish treated with the extracts (Weidenhamer et al., 1987) and incubated at optimal temperatures for each species. Germination percentage and hypocotyle and radicle length will be measured. Various concentrations of the residue extract will be tested in order to establish a dose-response curve (Inderjit & Weston, 2000).
Mechanism 3The aim of this experiment is to determine if cover crops have an effect on the size and
composition of the weed seedbank and on the weed population emerging in the durum wheat crop following maize and if this effect depends on crop management system and nitrogen fertilisation level.
Straight after durum wheat sowing, soil cores will be taken for seedbank analysis, carried out with the seedling emergence method. This experiment will be set up according to the protocol used for a similar analysis carried out in the same plots in 2000 (Moonen & Bàrberi, 2002) and data will be confronted with the results of this previous seedbank analysis.
The weed population developing in durum wheat will be sampled at different moments: before the post-emergence herbicide treatment, two weeks after the herbicide treatment and at wheat harvest. The weed parameters to be assessed will vary according to the sampling period, as described above.
Discussion
Although it is not possible to prove allelopathy in the field, we think that this system approach, combining field observations with ‘nature-simulating’ glasshouse and laboratory experiments, is able to give valid indications about the relative importance of the various mechanisms by which cover crops can influence the weed community in the field and about how cover crops can best be managed to optimise their weed suppression capacity.
The mechanisms responsible for the differences observed in field weed population between the four cover types grown under various management systems and fertilisation levels should hopefully be explained by the results of the experiments performed in the glasshouse and in the laboratory. Therefore it is important that these experiments will be carried out under conditions as similar as possible to the field situation. This means that:
1. The species used for the bioassays have to be present in the field (Inderjit & Weston, 2000). 2. The soil samples have to be frozen in the field to stop microbial activity since the
microorganisms are able to use phenolic acids as a carbon source (Blum et al., 2000) and

5th EWRS Workshop on Physical Weed Control 189 Pisa, Italy, 11-13 March 2002
we are interested in the phenolic acid concentration of the soil at the moment the sample was taken.
3. Since soil physical and chemical characteristics influence allelopathic interactions, the soil used for the germination experiment in the glasshouse has to be similar to the soil in the field and will therefore be collected near the field experiment (Inderjit & Weston, 2000).
4. Since allelopathic effects are found to be density-dependent (Weidenhamer et al., 1989) each tub should contain the same seed number. This means that the soil will have to be sterilised to eliminate the active seedbank.
5. For the same density-dependent effect, the quantity of mulch collected in the field has to be distributed equally over the tubs with fixed number of seeds.
6. Irrigation of the tubs in the glasshouse will happen by simulating the actual rainfall pattern occurring in the field.
7. The residue and soil extracts used to determine phenolic acid concentration have to be aqueous extracts at pH similar to soil pH, to determine phenolic acids that can be released into the soil under natural circumstances (Inderjit & Weston, 2000).
8. The cover residue will be extracted as found in the field without further grinding before extraction, to prevent the likely alteration of nutrient and allelochemicals release patterns.
To distinguish between the allelopathic and physical effects on weeds exerted by the mulch layer, an inert poplar much control will be added. Poplar mulch was found to have a similar physical effect as rye residue but no release of allelochemical substances was found (Barnes & Putnam, 1983).
Since soil chemical characteristics, especially pH, organic matter and nutrient status, have been found to influence the content of phenolic acids present in the soil and therefore allelopathic interactions, tests are proposed to determine these soil characteristics at the moment of cover crop destruction and at four different times after cover crop destruction. Also, residue chemical characteristics will be determined to try to establish a correlation between residue decomposition and changes in soil chemical characteristics. This, combined with seed germination in Petri-dishes, will help to establish whether there exists a correlation between residue decomposition and allelopathic properties of the residue extracts.
In the bioassays, the allelopathic effect of the cover residues will be tested on five different species in order to establish to what extent species characteristics like seed size or taxonomic group (monocot vs. dicot) influence their vulnerability to allelochemicals released from the residues. This will allow us to predict the long-term effect of cover crop management on the weed community dynamics, e.g. a possible shift in composition towards increased abundance of more resistant species.
Even though the soil for the germination test in the glasshouse will be sterilised, microorganisms that mainly originate from the residue material put on top of the soil and from the irrigation water will probably infest the tubs. Little is know about the effect of microorganisms on phenolic acids in the soil but it has been reported that in absence of other carbon sources microorganisms might attack phenolic acids as a carbon source, reducing the effect of allelopathic interactions in the soil (Barnes & Putnam, 1986; Blum et al., 2000).

5th EWRS Workshop on Physical Weed Control 190 Pisa, Italy, 11-13 March 2002
References
BARNES JP & PUTNAM AR (1983) Rye residues contribute weed suppression in no-tillage cropping systems. Journal of Chemical Ecology 9, 1045-1057.
BARNES JP & PUTNAM AR (1986) Evidence for allelopathy by residues and aqueous extracts of rye (Secale cereale). Weed Science 34, 384-390.
BARNES JP & PUTNAM AR (1987) Role of benzoxazinones in allelopathy by rye (Secale cerealeL.). Journal of Chemical Ecology 13, 889-906.
BARNES JP, PUTNAM AR, BURKE BA & AASEN AJ (1987) Isolation and characterisation of allelochemicals in rye herbage. Phytochemistry 26, 1385-1390.
BLUM U (1999) Designing laboratory plant debris-soil bioassays: some reflections. In: Principlesand Practices in Plant Ecology. (eds Inderjit, KMM Dakshini & CL Foy), 17-23. CRC Press, Boca Raton, Florida.
BLUM U, SHAFER SR & LEHMAN ME (1999) Evidence for inhibitory allelopathic interactions involving phenolic acids in field soils: concepts vs. an experimental model. Critical Reviews in Plant Sciences 18, 673-693.
BLUM U, STAMAN KL, FLINT LJ & SHAFER SR (2000) Induction and/or selection of phenolic acid-utilizing bulk-soil and rhizosphere bacteria and their influence on phenolic acid phytotoxicity. Journal of Chemical Ecology 26, 2059-2078.
BRAUN-BLANQUET J (1964) Pflanzensoziologie, Gründzuge Der Vegetationskunde. Springer, Vienna.
BURGOS NR & TALBERT RE (2000) Differential activity of allelochemicals from Secale cerealein seedling bioassays. Weed Science 48, 302-310.
COPAJA SV, NICOL D & WRATTEN SD (1999) Accumulation of hydroxamic acids during wheat germination. Phytochemistry 50, 17-24.
EINHELLIG FA & LEATHER GR (1988) Potentials for exploiting allelopathy to enhance crop production. Journal of Chemical Ecology 14, 1829-1844.
INDERJIT & WESTON LA (2000) Are laboratory bioassays for allelopathy suitable for prediction of field responses? Journal of Chemical Ecology 26, 2111-2118.
KATO-NOGUCHI H (1999) Effect of light-irradiation on allelopathic potential of germinating maize. Phytochemistry 52, 1023-1027.
LEHMAN ME & BLUM U (1997) Cover crop debris effects on weed emergence as modified by environmental factors. Allelopathy Journal 4, 69-88.
MASIUNAS JB, WESTON LA & WELLER SC (1995) The impact of rye cover crops on weed populations in a tomato cropping system. Weed Science 43, 318-323.
MOONEN AC & BÀRBERI P (2002) The effect of seven-year old cover-crop maize systems managed at various input levels on the size and composition of the weed seedbank. In: Proceedings of the 12th EWRS Symposium, Papendal, The Netherlands, submitted.
MWAJA VN, MASIUNAS JB & WESTON LA (1995) Effects of fertility on biomass, phytotoxicity, and allelochemical content of cereal rye. Journal of Chemical Ecology 21, 81-96.
SOUTO XC, CHIAPUSIO G & PELLISSIER F (2000) Relationships between phenolics and soil microorganisms in spruce forests: significance for natural regeneration. Journal of Chemical Ecology 26, 2025-2034.
STOWE LG & OSBORN A (1980) The influence of nitrogen and phosphorus levels on the phytotoxicity of phenolic compounds. Canadian Journal of Botany 58, 1149-1153.
TEASDALE JR & MOHLER CL (1993) Light transmittance, soil temperature and soil moisture under residue of hairy vetch and rye. Agronomy Journal 85, 673-680.
WEIDENHAMER JD, MORTON TC & ROMEO JT (1987) Solution volume and seed number: often overlooked factors in allelopathic bioassays. Journal of Chemical Ecology 13, 1481-1491.

5th EWRS Workshop on Physical Weed Control 191 Pisa, Italy, 11-13 March 2002
WEIDENHAMER JD, HARTNETT DC & ROMEO JT (1989) Density-dependent phytotoxicity: distinguishing resource competition and allelopathic interference in plants. Journal of Applied Ecology 26, 613-624.
WESTON LA, HARMON R & MUELLER S (1989) Allelopathic potential of Sorghum-sudangrass hybrid (Sudex). Journal of Chemical Ecology 15, 1855-1865.
WILLIS RJ (1985) The historical bases of the concept of allelopathy. Journal of the History of Biology 18, 71-102.
5th EWRS Workshop on Physical Weed Control 192 Pisa, Italy, 11-13 March 2002
Comparison of different mulching methods for weed control in organic green bean and tomato
L. Radics & E. Székelyné Bognár Szent István University
Faculty of Horticultural Science Department of Ecological and Sustainable Production Systems
Hungary, Budapest
Absract
Partly because of environment protection and partly because of ecological farming there is more and more attention on herbicide free weed control in Hungary. One of the main questions of ecological vegetable production is weed management and possible answer is mulching, which besides its weed control role reduces evaporation too. During our examinations we compared weed control effect and yield increasing effect of 8 different types of mulch in green bean and tomato. We used weedy, hoed and herbicide treated plots as control. Years of the experiment were 2000 and 2001, two years with significantly different weather conditions, so our results from these years are very important from this aspect, because of climate change effects, which increase the numbers of extremely dry, warm and humid years and we have to fit our farming habits to these effects. In extremely arid year 2000 plastic sheet, paper mulch and straw mulch showed the best results in weed control in tomato. These treatments had the higher yield too, and these were significantly different from the yield of herbicide treated and hoed control plots. In humid year 2001 plastic sheet, paper mulch and grass clippings caused the lowest weed cover and we got the highest yield in paper mulched plots in this year. In green bean in 2000 also the plastic sheet, paper mulch and straw mulch showed the best results in weed control, but there were no significant difference from control treatments. At the end of growing season in 2001 high weed cover was observable in every treatment except paper mulched and hoed plots. We found no significant difference between green bean yields of different plots in both of the years After experiences of the two years under above-mentioned circumstances compost and legume clipping were unsuitable for mulching. Mowed weeds showed negative results too. In these treatments high weed cover and low yield were noticeable in both years. Keywords: weed control, mulch, tomato, green bean
Introduction
As we notice the distribution of precipitation in Hungary we can see that amount of rainfall decreased significantly compared with the term between 1901 and 1950 and annual average temperature increased slightly. This phenomenon radically modifies sustainability and successfulness of farming habits, which were accommodated to climatic conditions through many years. One possible solution is decreasing evaporation with soil covering, which is also a weed management method. Partly because of environment protection and partly because of ecological farming there is more and more attention on herbicide free weed control in Hungary. Mechanical and physical weed management methods that are widespread in ecological farming have significant expenses, so we need to examine other methods under local circumstances to save expenses. We can use living plants, plant residues (straw, compost, mowed grass, processing by-products) and industry-origin materials (black polyethylene foil, paper, felt, different kinds of textile) as mulch.
5th EWRS Workshop on Physical Weed Control 193 Pisa, Italy, 11-13 March 2002
Each mulching material has different weed control effect. Black foils is one of the most standby methods for weed control but as its disadvantage we have to mention that we have to remove if it is a non-degradable foil. Environmentally friendly, degradable mulch is paper. It is pervious and after turning under at the end of growing season it is biodegradable. In West Europe organic mulch is prevalent. Grass, leafage, straw and mowed weeds are used for interrow covering. Besides its shading effect it can provide nutrients to the soil. One of the most former mulches is straw, by-product of plant production. In an Indian experiment straw mulch increased yield of crop and water keeping capacity of the soil (Moitra et al, 1996). According to Tu et al. (2001.) mulch is not serviceable for controlling of perennial weeds, because these plants accumulate much nutrient and break through the covered surface easily. Otherwise in the case of cirsium (Cirsium arvense) thick straw mulch decreased the number of flowering plants. According to Agele et al (1999, 2000) grass clipping mulch improve yield of tomato and water keeping capacity of the soil according to uncovered control. It increased the amount of water in the top 5 cm of the soil and decreased soil temperature in the top 5 cm. In the case of late planted tomato they reached faster growing and higher yield with mulching before drought came. By using the results of this experiment we will be able to set up a system, which is suitable for weed control, helps to protect soil structure and water content and encourages soil life. This production system could mean alternative solution for production under arid circumstances, and could avoid watering and its disadvantages.
Material and method
Ecological circumstances Years of the experiment were 2000 and 2001, two years with significantly different weather conditions, so our results from these years are very important from this aspect, because of climate change effects, which increase the numbers of extremely dry, warm and humid years and we have to fit our farming habits to these effects.
Soil type is restrainedly deep chernozem-like sandy soil. Soil forming rock is calcareous sand. Depth of humic layer is 30-40 cm. Soil is fast warmer, with good water permeability and good air capacity. The disadvantage of this soil type, it is inclined to quick cooling down and drying out. Weakly calciferous, faintly alkaline soil.
Green beans were sown in first decade of May. Each treatment were established on 10 m2
parcels, beans were sown by 40*25 cm with 3 seeds per each pit. The test plant was dwarf beans, the variety was: Cherokee. Tomato was planted in second decade of May. Each treatment were established on 10 m2 parcels, tomatoes were planted by 70*60 cm. The test variety was: Dual (half determinate). All the 11 treatments were carried out in 4 repetitions.
Treatments: 1) weedy control 2) herbicide control:
solved into 4 l water into the all 4 repetitions: 9 ml Olitref (before sowing) and 8 ml Dual 960 EC (after sowing) in tomato: Dual 960 EC (before planting)
3) hoeing control 4) rye straw mulching with 10 cm depth 5) rye straw mulching + Phylazonit M bacteria fertiliser. Phylazonit were applied and ploughed
under immediately before the straw mulching. 6) black plastic covering (fixed on the edges) 7) paper covering (fixed on the edges)

5th EWRS Workshop on Physical Weed Control 194 Pisa, Italy, 11-13 March 2002
8) grass clippings mulch with 10 cm depth 9) alfalfa clippings mulch with 10 cm depth 10) compost mulching with 5 cm depth 11) mowed weeds. Permanent mowing, clipping were left on the surface
Measurements, monitoring weed survey (in each month) dry mass of weeds Crop weight measuring
All the weed surveys were carried out 2 weeks after the treatments (hoeing, mowing). Test plots were the whole 10 m2 parcels. Surveys were made in: June, July, August 3rd decade. Weed and tomato/bean cover percentage were registered. All the data were analysed with statistical tests (Tukey-test).
Results
Tomato 2000 All the registered data of tomato (similar to bean) were analysed in each month. Weed covering data can be found on the next figure from each treatments.
It is observable that the weed cover percentage was reduced in most treatment because of the extremely dry August weather studying the monthly surveys.
Weed reducing effect of straw, plastic cover, paper cover and grass clipping mulch (4, 5, 6, 7, 8) treatments were permanent during the whole season. The total weed cover percentage in herbicide and hoeing control (2,3) treatments was bellow 20%. There were significant difference between 2, 3, 4, 5, 6, 7, 8 treatments and mowed weed (11) treatment in June, July; alfalfa clipping (9) treatment in August and compost mulching (10) treatment during the whole season (SD5%). Test plants could not utilise the nutrients of compost, because it has dried on soil surface quickly. Weeds could utilise this nutrient source better, therefore the weed cover percentage has grown in this treatment. The weed cover percentage in mowed weeds treatment was almost the same as the weed control treatment, because the dominant weed species was Portulaca oleracea, which can not be controlled by permanent mowing.

5th EWRS Workshop on Physical Weed Control 195 Pisa, Italy, 11-13 March 2002
Figure 1. Weed cover in 2000 in tomato
We have analysed data according to life forms too.
T = Therophyta T1 – plants, which are spearing in fall and ripening in springT2 – plants, which are spearing in fall and ripening in the beginning of summerT3 – plants, which are spearing in spring and ripening in the beginning of summerT4 – plants, which are spearing in spring and ripening in the end of summer
G = Geophyta (plants, which are overwintering on the soil surface or under soil and has slanting or horizontal underground stem) G1 - plants, which have stoles near to the soil surfaceG3 - plants, which have stoles in deeper and many levels of the soil
Weeds of T4-life form were dominant in every treatment. Significant difference was observable in the case of treatments 9., 10. and 11 (SD5%).There was no statistically certifiable difference between treatments in the case of G3 and G1(perennial) weeds. Species of G3-life form (Cirsium arvense, Convulvulus arvensis) reached their highest covering in herbicide treated plots in June.

5th EWRS Workshop on Physical Weed Control 196 Pisa, Italy, 11-13 March 2002
Figure 2. Cover of weeds in G3-life form in June 2000.
Measurements of dry mass of weeds showed the same results as weed surveys. Straw, plastic foil and paper mulch had the best weed suppress effect. We found higher dry mass of weeds under compost mulch than on untreated weedy control plots in July and in August as well. So we can see from this that compost made better circumstances for weeds too.
Figure 3. Dry mass of weeds in tomato (2000)
There are significant differences between yields of treatments. Both straw mulches, foil and paper mulch made statistically homogenous group. In these four treatments we measured significantly

5th EWRS Workshop on Physical Weed Control 197 Pisa, Italy, 11-13 March 2002
higher yield than in treatments 9, 10, 11 and in hoed and herbicide treated control (SD5%). In treatments 9, 10, 11 high weed cover caused the low yield. Differences between yields of hoed plots and plots of 4, 5, 6, 7 treatments originated in crop showed its gratitude for mulching in that arid year.
Figure 4. Yield of tomato in 2000.
Tomato 2001 After extremely dry 2000 year in 2001 there was significant amount of precipitation so we could test covering materials under different circumstances. In this year compost mulch gave negative result, this treatment showed high weed cover during the whole growing season. Treatment 10. differed significantly (SD5%) from 3, 6, 7, 8 treatments during the whole growing season. Legume clipping (9) seems to be unsuitable for mulching in this year too. Treatment 9 differed significantly (SD5%) from 3, 5, 6, 7, 8 treatments in July and August. In 2001 straw, foil, paper and grass clipping mulches (5, 6, 7, 8) showed the best results. In June every four and in July foil and grass clipping mulches differed significantly (SD5%) from herbicide treated plots. Straw (4) and straw with Phylazonit M bacteria fertiliser (5) showed different weed cover, but this difference was not statistically certifiable. The reason for this could be the higher cover of tomato in treatment 5. Probably in this humid year bacteria fertiliser could prevail and N fixing and P mobilising bacteria increased nutriment in the soil. This could increase cover of tomato. Weeds of T4-life form were dominant in every treatment, these species gave the differences, which were observed in the case of total weed cover.There was no statistically certifiable difference between treatments in the case of G3 and G1 (perennial) weeds.

5th EWRS Workshop on Physical Weed Control 198 Pisa, Italy, 11-13 March 2002
Figure 5. Weed cover in tomato in 2001.
Because of sufficient amount of precipitation and the high weed cover at the end of growing season there are not as big differences between the yields as in 2000. We have measured the highest yield in paper mulched plots (7) and the fewest in mowed weeds (11) (SD5%). At SD10% paper mulch was significantly better also than herbicide treated control. If we compare this with Fig. 5. the highest weed cover was not in treatment 11 (cover of 9, 10 was higher) but the lowest yield was observable here. This could have two reasons, on the one hand in treatment 9, 10 legume clippings started to decompose and gave nutrient for the crop. On the other hand mowed weeds meant probably high concurrence for the crop.
Figure 6. Dry mass of weeds in tomato (2001)
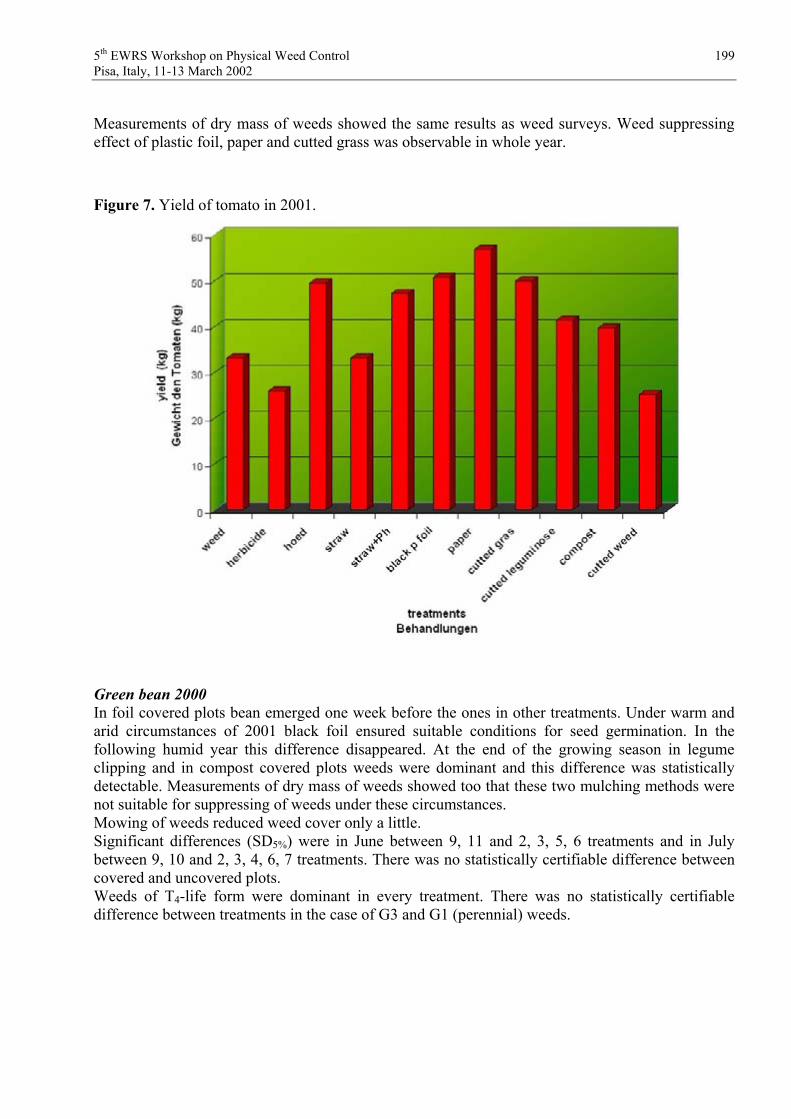
5th EWRS Workshop on Physical Weed Control 199 Pisa, Italy, 11-13 March 2002
Measurements of dry mass of weeds showed the same results as weed surveys. Weed suppressing effect of plastic foil, paper and cutted grass was observable in whole year.
Figure 7. Yield of tomato in 2001.
Green bean 2000 In foil covered plots bean emerged one week before the ones in other treatments. Under warm and arid circumstances of 2001 black foil ensured suitable conditions for seed germination. In the following humid year this difference disappeared. At the end of the growing season in legume clipping and in compost covered plots weeds were dominant and this difference was statistically detectable. Measurements of dry mass of weeds showed too that these two mulching methods were not suitable for suppressing of weeds under these circumstances. Mowing of weeds reduced weed cover only a little.Significant differences (SD5%) were in June between 9, 11 and 2, 3, 5, 6 treatments and in July between 9, 10 and 2, 3, 4, 6, 7 treatments. There was no statistically certifiable difference between covered and uncovered plots.Weeds of T4-life form were dominant in every treatment. There was no statistically certifiable difference between treatments in the case of G3 and G1 (perennial) weeds.

5th EWRS Workshop on Physical Weed Control 200 Pisa, Italy, 11-13 March 2002
Figure 8. Weed cover in green bean in 2000.
There was no significant difference observable between yields of green bean. We measured the highest amounts in plastic and paper covered plots. In treatments 9, 10, 11 showed the lowest yields so in these plots weed cover beyond the critical level which manifested in yields. If we compare these yields with the yields of tomato, we can conclude that tomato showed better reactions to covered soil surface.
Figure 9. Yield of green bean in 2000.

5th EWRS Workshop on Physical Weed Control 201 Pisa, Italy, 11-13 March 2002
Green bean 2001 In 2001 at the end of the growing season there was high weed cover in every treatments except plastic and paper mulched ones. In June weed cover only of treatment 11 differed significantly (SD5%) from the other treatments. The reason was probably that in this treatment rate of Amaranthus blitoides weed species was high. This species do not grow high but cover a relative big area. In July compost was significantly (SD5%) different from paper and plastic. Straw (4) and straw with Phylazonit M bacteria fertiliser (5) showed different weed cover, but this difference was not statistically certifiable. The reason for this could be the higher cover of green bean in treatment 5. Probably in this humid year bacteria fertiliser could prevail and bacteria increased nutriment in the soil, which could increase cover of tomato.
Figure 10. Weed cover in green bean in 2001.
Figure 11. Cover of weeds in G3-life form in June 2001.
Weeds of T4-life form were dominant in every treatment. There was no statistically certifiable difference between treatments in the case of G3 and G1 (perennial) weeds.

5th EWRS Workshop on Physical Weed Control 202 Pisa, Italy, 11-13 March 2002
Figure 12. Dry mass of weeds in green bean (2000, 2001)
Weed control effect of plastic and paper was not observable in the yields of green bean. As it is noticeable in Fig. 13. in humid year 2001 there was no significant difference between yields of the treatments.
Figure 13. Yields of green bean in 2001.
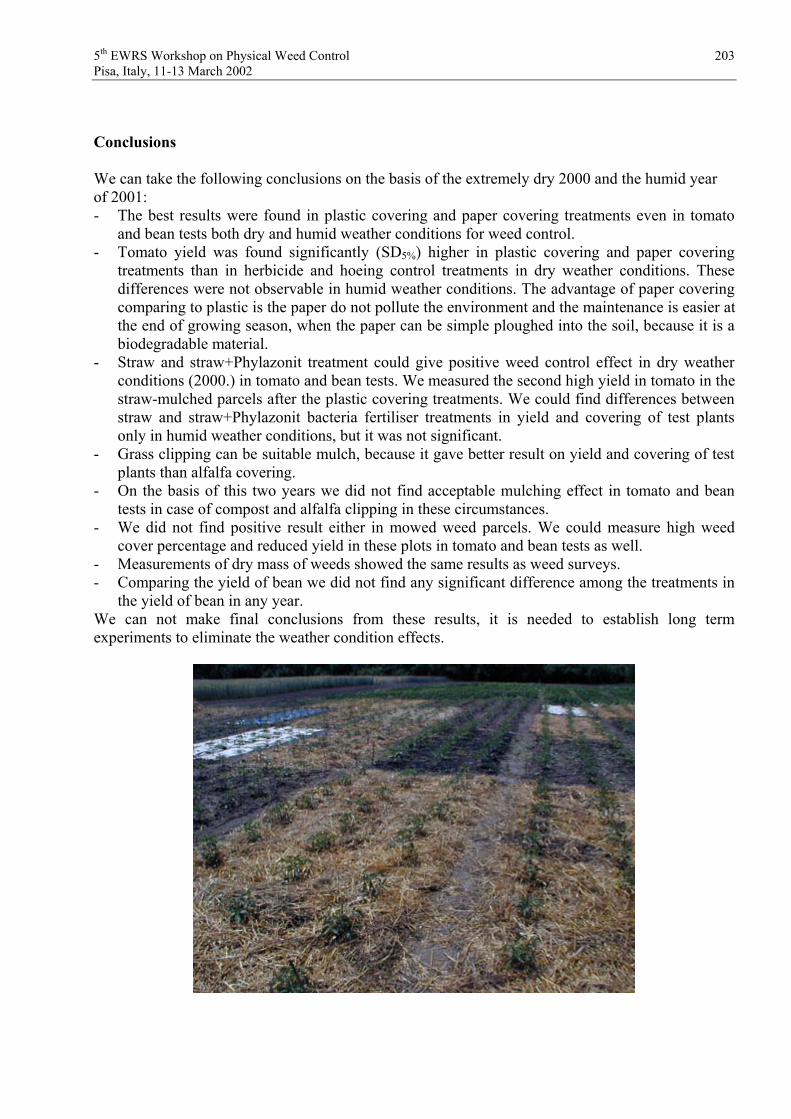
5th EWRS Workshop on Physical Weed Control 203 Pisa, Italy, 11-13 March 2002
Conclusions
We can take the following conclusions on the basis of the extremely dry 2000 and the humid year of 2001: - The best results were found in plastic covering and paper covering treatments even in tomato
and bean tests both dry and humid weather conditions for weed control. - Tomato yield was found significantly (SD5%) higher in plastic covering and paper covering
treatments than in herbicide and hoeing control treatments in dry weather conditions. These differences were not observable in humid weather conditions. The advantage of paper covering comparing to plastic is the paper do not pollute the environment and the maintenance is easier at the end of growing season, when the paper can be simple ploughed into the soil, because it is a biodegradable material.
- Straw and straw+Phylazonit treatment could give positive weed control effect in dry weather conditions (2000.) in tomato and bean tests. We measured the second high yield in tomato in the straw-mulched parcels after the plastic covering treatments. We could find differences between straw and straw+Phylazonit bacteria fertiliser treatments in yield and covering of test plants only in humid weather conditions, but it was not significant.
- Grass clipping can be suitable mulch, because it gave better result on yield and covering of test plants than alfalfa covering.
- On the basis of this two years we did not find acceptable mulching effect in tomato and bean tests in case of compost and alfalfa clipping in these circumstances.
- We did not find positive result either in mowed weed parcels. We could measure high weed cover percentage and reduced yield in these plots in tomato and bean tests as well.
- Measurements of dry mass of weeds showed the same results as weed surveys. - Comparing the yield of bean we did not find any significant difference among the treatments in
the yield of bean in any year. We can not make final conclusions from these results, it is needed to establish long term experiments to eliminate the weather condition effects.

5th EWRS Workshop on Physical Weed Control 204 Pisa, Italy, 11-13 March 2002
Acknowledgements
Research was supported by the Ministry of Agriculture and Rural Development.
Literature
AGELE S, IREMIREN G, OJENIYI S (1999) Effects of plant density and mulching on the performance of late-season tomato (Lycopersicon esculentum) in southern. Journal of Agricultural Science 133: 4, 397-402, Nigeria
AGELE S, IREMIREN G, OJENIYI S (2000) Effects of tillage and mulching on the growth, development and yield of late-season tomato (Lycopersicon esculentum) in the humid south of Nigeria. Journal of Agricultural Science 134: 1, 55-59 Nigeria
MOITRA R, GHOSH D,C, SARKAR S, (1996) Water use pattern and productivity of rainfed yellow sarson (Brassica rapa L. var glauca) in relation to tillage and mulching. Soil and Tillage Research, vol. 38, no. 1, 153-160 (8), Depertment of Soil Sciece and Agricultural Chemistry, Varnasi, India
SMITH A, E, (1995) Handbook of Weed Management Systems. 557-558. New York, USA TU, M., HURD, C., & RANDALL J, M, (2001) Weed Control Methods Handbook, The Nature
Conservancy, http://tncweeds.ucdavis.edu, Version: April 2001.

5th EWRS Workshop on Physical Weed Control 205 Pisa, Italy, 11-13 March 2002
No-tillage of arable crops into living mulches in Switzerland
Bernhard Streit, Juerg Hiltbrunner, Lucia Bloch and David Dubois Swiss Federal Research Station for Agroecology and Agriculture, Reckenholzstrasse 191,
CH-8046 Zurich, Switzerland, E-mail: [email protected]
Abstract
In the last decade, cropping systems with reduced tillage intensity and, in particular, no-tillage without any soil disturbance has been introduced in Switzerland to prevent mainly soil erosion but also leaching of pesticides and plant nutrients to the groundwater. In the same time, the organically cropped acreage has increased substantially. The success of both, no-tillage and organic farming, have depended strongly on the efficiency of weed control. In no-tillage, weeds have been controlled so far by applying herbicides. In consequence, the use of no-tillage techniques on organic farms has not been possible. On the other hand, tillage is the main tool to control weeds on organic farms. As the organic production is forecasted to increase, environmental problems related with tillage will become more and more important. Therefore, the development of cropping systems with no-tillage as the most extreme form of reduced tillage will help to improve the quality and the productivity of the soils on organic farms.
Sowing crops into stands of living mulch without disturbing the soil seems to be a promising way to develop no-till systems where no herbicides are used. Results from a field trial in Switzerland with directly sown winter wheat (Triticum aestivum L.) into stands of white clover (Trifolium repens L.) and black medic (Medicago lupulina L.) showed the potential of permanent ground cover to suppress weeds. However, the concurrence between the living mulch and the crops was very pronounced, in particular during the formation of side shoots and after flowering of winter wheat. The legumes used as ground cover were usually grown as forage crops and, therefore, were too competitive. In order to develop a cropping system with no-tillage on organic farms, a research project has been initiated. The aim of the study will be to evaluate the impact of different living mulch plants, most of them not suitable for forage production under the cool and humid conditions of central Europe, different row spacing, and fertilisation with manure on the development of directly sown winter wheat.

5th EWRS Workshop on Physical Weed Control 206 Pisa, Italy, 11-13 March 2002
Water and steam for weed control

5th EWRS Workshop on Physical Weed Control 207 Pisa, Italy, 11-13 March 2002
Preliminary studies in the comparison of hot water and hot foam for weed control.
R. M. Collins1, A. Bertram2, J-A. Roche1, & M. E. Scott3 . 1 Department of Agriculture, Northam, Western Australia. 2 University of Applied Sciences, Osnabrueck, Germany.
3 Aqua-Therme Pty Ltd, Perth, Western Australia.
Abstract.
Data is presented of trials undertaken late 2001 in Western Australia of thermocouple temperature recordings of hot water, hot water plus air (with and without foaming agent) and the resulting kill of 3-4 leaf canola plants grown in pots to simulate broadleaf weeds. Discussion is presented of ways of inter-relating the physical and biological information in attempt to explain the differences in the technology. This research is yet incomplete.
Introduction
Aqua-Therme, a Perth-based thermal weed control contractor and equipment manufacturer, has developed a hot foam variant of their hot water weed control machine. Trials have taken place in spring and summer 2001-2 at the Department of Agriculture’s Centre for Cropping Systems at Northam, WA, and at Aqua-Therme’s headquarters in Perth. The claimed improved performance is based on the addition of compressed air and a ‘biologically-friendly’ foaming agent (accepted by the international organic certifying body, IFOAM). The realisation of the improvement is through either an increase in area covered for the same quantity of water, or improved insulation of the ground and weeds, resulting in a longer time for the heat to act on the weeds, or both. The trials undertaken were to help understand the processes involved in the improvement, and with this knowledge we would then possibly be able to suggest further improvements.
Materials and methods.First experiment, 11th & 13 September, 2001.
Canola plants (variety ‘Rainbow’) were grown in a glasshouse in trays 39 cm long, 28 cm wide and 12 cm deep (all internal dimensions), spaced to give five rows of five plants, spaced 5 cm by 5 cm. Two seeds were placed at each position, but as germination was patchy, additional plants were not removed. The soil used was loamy sand, but some trays were filled with a peat-based potting mix to investigate the effect of soil types. The plants were at the 2-3 leaf growth stage when treated.
The hot water weeder used was a truck-based unit normally used for contract street and pavement weed control in Perth. Hot water delivery is via an insulted hose to a hand-held wand, with a suitable nozzle to spread the water in a fan (a Spraying Systems HB1/2-5595150 stainless steel fan nozzle, with 95o spraying angle, was used). The hand lance was set up on a horizontal bar mounted on the front of a small tractor to give a vertical downward delivery of hot water. Prior to the experiment, the tractor was speed calibrated to 0.5, 1.0, 1.5, and 2.0 k/hr, the speeds that from

5th EWRS Workshop on Physical Weed Control 208 Pisa, Italy, 11-13 March 2002
experience had shown as covering the operating range. This set-up was then able to transport the operating lance over the trays with plants. This was done outside, in largely still air conditions.
A ‘dataTaker DT800’ 12 channel data logger was used with 0.3 mm type ‘K’ thermocouples to record temperatures. Some runs were tried with 12 thermocouples, which resulted in two or three records each thermocouple per second. Runs where plants were treated utilised fivethermocouples, giving seven or eight recordings per thermocouple per second. Each run treated one tray, there being three runs for each treatment (4 speeds x 2 heat delivery methods x 3 replications).Treated trays were placed back in the glasshouse for several days before counting plants as dead, severely damaged but recovering, or largely undamaged.
Second Experiment, 6th, 7th, & 11th December, 2001 The experimental procedure was modified in the second experiment after processing and reviewing the data of the first experiment.
The canola variety was changed to the more vigorous variety ‘Mystic’, more care was taken with seed placement (seeding depth, seed covering), watering, and the layout was changed to 3 rows of 3 plants, all 40 mm apart, in smaller, more easily managed pots. Plants were transplanted early to fill spaces where none had germinated, and surplus plants were cut off, so that every pot had 9 plants. Pots were graded for plant size, and samples of top growth were taken to give green and dried weight for an assessment of the amounts of plant material heated. Some pots of 3 size ranges (plants varied in height from 5 to 10 cm, predominantly 6 – 8 cm, 3-4 leaf) were used in each run. A pot numbering system was used that enabled linkage of ‘run’, direction of travel, and plant size, for later observations.
Five thermocouples were used for the dynamic tests, and were set up in a row between the first and second plant in each row (three thermocouples), and in the gap between the rows (two thermocouples). Five readings were taken from each thermocouple per second. Temperatures were taken of the nozzle output before each run. The nozzle was mounted 75 mm above the pot soil level, pointing downward.
A patternator, with collection channels 20 mm apart, was used to collect hot water or foam for weighing. This was to give a more accurate measure of the heat input and where it went. Temperatures were taken in each patternator channel, but the temperature data was very variable and lower than expected. The exposed end fine wire thermocouples reacted too quickly to temperature variations in and around the hot fluid stream. An alternative encased probe thermocouple was used for these measurements, giving higher values, nearer to the peaks achieved from the dynamic tests. The experiments were done inside a building to reduce any affect from wind (not present in the first experiment). Infiltration measurements were taken of the two soils.
Third experiment, February 2002 As this is being written, a third experiment is being set up, with results to be discussed at the Workshop in March, 2002, at Pisa. Aqua-Therme are finding that their use of compressed air with hot water is producing results equivalent to that achieved with the addition of the foaming agent, so

5th EWRS Workshop on Physical Weed Control 209 Pisa, Italy, 11-13 March 2002
this third experiment was to further improve technique and get more data. It had been found that in the second experiment, complete drenching of plants in the outside rows was not occurring. Many plants were observed to lose lower leaves, with unaffected upper leaves. As a result, plant spacing was reduced from 4 cm to 3 cm. Only the loamy sand soil was used this time.
ResultsVariation across the spray swath
Figure 1. Temperature across hot water, hot water plus air, and hot foam sprays, with spray nozzle 12.5 cm above thermocouples (static test).
Figure 2. Relative weight of fluid collected across the spray swath.
30
40
50
60
70
80
90
100
TK 1 TK 2 TK 3 TK 4 TK 5 TK 6 TK 7 TK 8 TK 9 TK 10 TK 11 TK 12
Thermocouple reading, 3 cm apart
C
Hot waterHW + airFoam
0
5
10
15
20
25
30
1 2 3 4 5 6 7 8 9 10 11 12 13 14 15
Patternator Position, 2 cm spaces
Perc
enta
ge fl
uid
wei
ght
in e
ach
posi
tion
Hot WaterHot Water +AirHot Foam

5th EWRS Workshop on Physical Weed Control 210 Pisa, Italy, 11-13 March 2002
Figure 1 illustrates the temperature recordings achieved in the first experiment, where the spray was directly over thermocouples mounted through 3 cm spaced holes in a piece of wood. Temperatures reduced away from the centre of the spray ‘swath’, due to the reduced quantity of the fluids distributed to the outside of the spray swath from the fan nozzle (Fig. 2), and the greater exposure to the cooling effect of air. The plant kill achieved reflected the same variation across the swath (Fig. 3)
Figure 3. Plant survival across spray swath, mean of 0.5, 1.0, 1.5, & 2.0 k/hr data, first trial.
Temperature and time.The data logger record can be represented graphically. Runs were done statically (Fig 1.) and at the four speeds and three fluids, with most records taken 5-10 mm above ground but also with
Figure 4. Temperature versus time, with 12 thermocouples placed at 3 cm intervals across spray swath (0.5 km/hr).
0
20
40
60
80
100
120
10 5 0 5 10
Cm from swath centre
Plan
t Sur
viva
l, %
WaterFoam
01 02 03 04 05 06 07 08 09 0
13:51
:55
13:51
:55
13:51
:56
13:51
:57
13:51
:58
13:51
:59
13:52
:00
13:52
:00
13:52
:01
13:52
:02
13:52
:03
13:52
:04
T im e (h o u r s , m in u te s , s e c o n d s )
C
T K 1T K 2T K 3T K 4T K 5T K 6T K 7T K 8T K 9T K 1 0T K 1 1T K 1 2

5th EWRS Workshop on Physical Weed Control 211 Pisa, Italy, 11-13 March 2002
some thermocouples poked into the soil (5-10 mm depth) for some runs. The ‘spaghetti’ effect from the lines of Fig. 4 can maybe seen more clearly as a surface, as in Fig. 5 (same data).
Figure 5. ‘Surface’ representation of thermocouple dataFigures 4 and 5 illustrate the first difficulty: effectively measuring temperature. The 0.3 mm thermocouple wire diameter was chosen as the nearest readily available size to that used by Ascard (1995), and after experience with a 3 mm diameter wire thermocouple with joint protection that had a very slow response time. The disadvantage is that even small air movements affect temperature values and it was difficult to obtain ‘average’ data.
Plant kill data.
Figure 6. Average canola plant survival after one treatment.
13:5
1:55
13:5
1:55
13:5
1:55
13:5
1:56
13:5
1:56
13:5
1:57
13:5
1:57
13:5
1:57
13:5
1:58
13:5
1:58
13:5
1:59
13:5
1:59
13:5
2:00
13:5
2:00
13:5
2:00
13:5
2:01
13:5
2:01
13:5
2:02
13:5
2:02
13:5
2:03
13:5
2:03
13:5
2:03
13:5
2:04
13:5
2:04
TK 1
TK 2
TK 3
TK 4
TK 5
TK 6
TK 7
TK 8
TK 9
TK 10
TK 11
TK 12
C
Time
Run 3 (13/09/01), 0.5 km/hr, water, nozzle 12.5 cm above thermocouples 3 cm apart
80-9070-8060-7050-6040-5030-4020-3010-200-10
0
10
20
30
40
50
60
70
80
90
0.5 1 1.5 2
Speed, km/hr
Surv
ival
, %
Water Foam

5th EWRS Workshop on Physical Weed Control 212 Pisa, Italy, 11-13 March 2002
Figure 7. Plant survival after hot water treatment, 6th December, 2001.Figures 3 and 6 summarise the results from the first experiment, and Figs. 7 and 8 present the results of the second trial. The second two graphs show assessments made seven days and 11 days after treatment, indicating that there may differences caused by different soils and an interaction with the weed control method. The better kill achieved compared to the first experiment is largely due to proportionally more of the plants being central to the swath.
Figure 8. Plant survival after hot foam treatment, 6th December, 2001.Plant weight and size
Table 1. Plant weight, g. Plant height, cm Wet weight Dry weight
4 0.368 0.042 5 0.457 0.047 6 0.584 0.064 7 0.715 0.081 8 0.838 0.099 9 0.865 0.099
0
10
20
30
40
50
60
70
80
0.5 1 1.5 2Speed, kph
Plan
t Sur
viva
l (%
)
Potting Mix 13/12/2001Potting Mix 17/12/2001Soil 13/12/2001Soil 17/12/2001
0
10
20
30
40
50
60
70
80
90
0.5 1 1.5 2
Speed, kph
Plan
t Sur
viva
l (%
)
Potting Mix 13/12/2001Potting Mix 17/12/2001Soil 13/12/2001Soil 17/12/2001
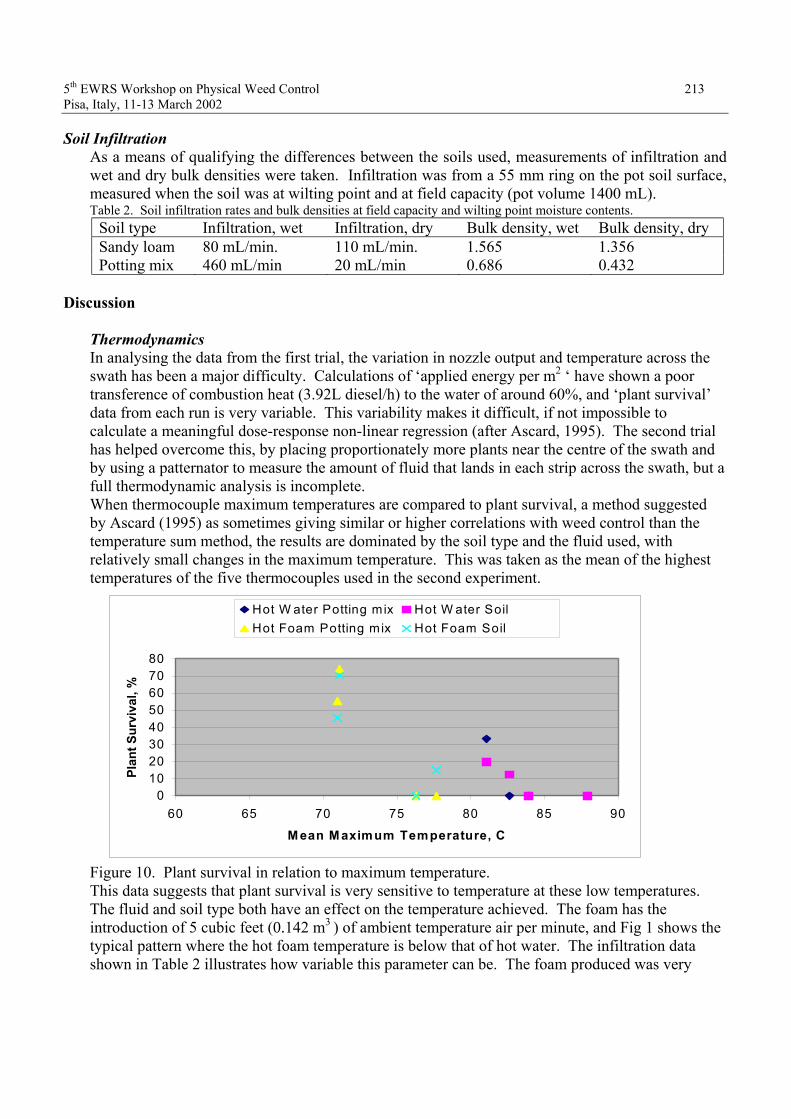
5th EWRS Workshop on Physical Weed Control 213 Pisa, Italy, 11-13 March 2002
Soil Infiltration As a means of qualifying the differences between the soils used, measurements of infiltration and wet and dry bulk densities were taken. Infiltration was from a 55 mm ring on the pot soil surface, measured when the soil was at wilting point and at field capacity (pot volume 1400 mL). Table 2. Soil infiltration rates and bulk densities at field capacity and wilting point moisture contents.
Soil type Infiltration, wet Infiltration, dry Bulk density, wet Bulk density, dry Sandy loam 80 mL/min. 110 mL/min. 1.565 1.356 Potting mix 460 mL/min 20 mL/min 0.686 0.432
Discussion
ThermodynamicsIn analysing the data from the first trial, the variation in nozzle output and temperature across the swath has been a major difficulty. Calculations of ‘applied energy per m2 ‘ have shown a poor transference of combustion heat (3.92L diesel/h) to the water of around 60%, and ‘plant survival’ data from each run is very variable. This variability makes it difficult, if not impossible to calculate a meaningful dose-response non-linear regression (after Ascard, 1995). The second trial has helped overcome this, by placing proportionately more plants near the centre of the swath and by using a patternator to measure the amount of fluid that lands in each strip across the swath, but a full thermodynamic analysis is incomplete. When thermocouple maximum temperatures are compared to plant survival, a method suggested by Ascard (1995) as sometimes giving similar or higher correlations with weed control than the temperature sum method, the results are dominated by the soil type and the fluid used, with relatively small changes in the maximum temperature. This was taken as the mean of the highest temperatures of the five thermocouples used in the second experiment.
Figure 10. Plant survival in relation to maximum temperature. This data suggests that plant survival is very sensitive to temperature at these low temperatures. The fluid and soil type both have an effect on the temperature achieved. The foam has the introduction of 5 cubic feet (0.142 m3 ) of ambient temperature air per minute, and Fig 1 shows the typical pattern where the hot foam temperature is below that of hot water. The infiltration data shown in Table 2 illustrates how variable this parameter can be. The foam produced was very
01020304050607080
60 65 70 75 80 85 90
M ean M aximum Temperature, C
Plan
t Sur
viva
l, %
Hot W ater Potting mix Hot W ater SoilHot Foam Potting mix Hot Foam Soil
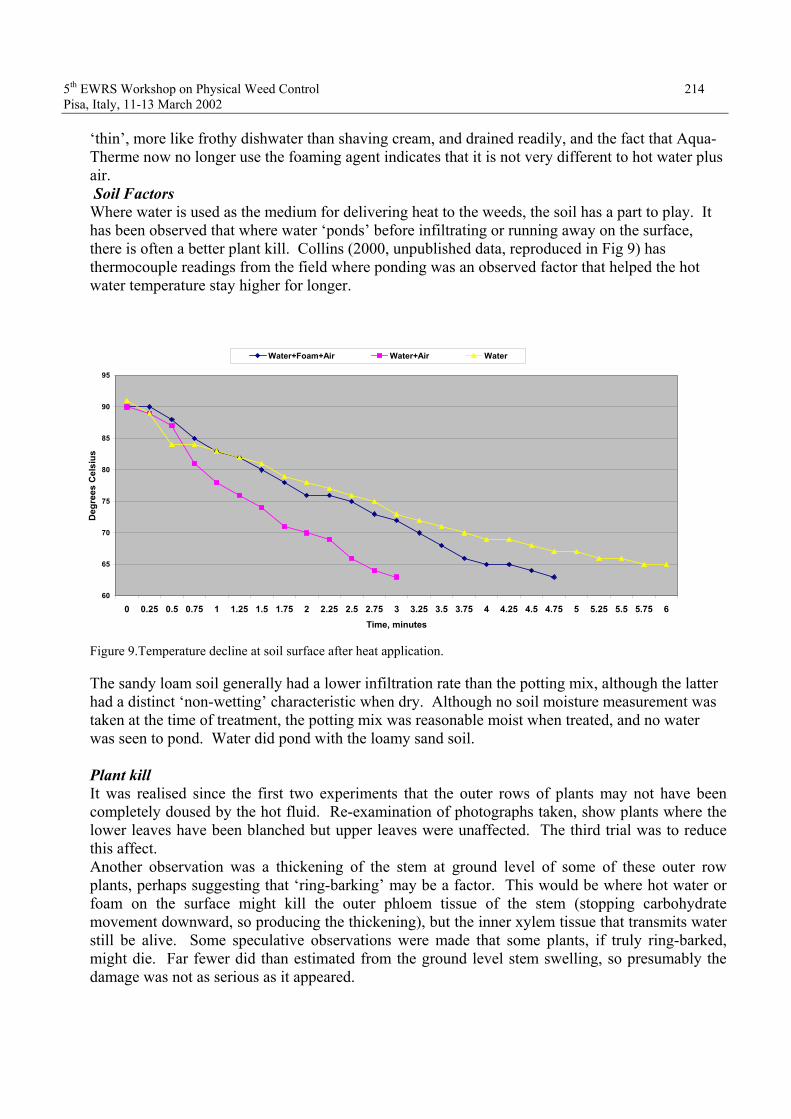
5th EWRS Workshop on Physical Weed Control 214 Pisa, Italy, 11-13 March 2002
‘thin’, more like frothy dishwater than shaving cream, and drained readily, and the fact that Aqua-Therme now no longer use the foaming agent indicates that it is not very different to hot water plus air. Soil FactorsWhere water is used as the medium for delivering heat to the weeds, the soil has a part to play. It has been observed that where water ‘ponds’ before infiltrating or running away on the surface, there is often a better plant kill. Collins (2000, unpublished data, reproduced in Fig 9) has thermocouple readings from the field where ponding was an observed factor that helped the hot water temperature stay higher for longer.
Figure 9.Temperature decline at soil surface after heat application.
The sandy loam soil generally had a lower infiltration rate than the potting mix, although the latter had a distinct ‘non-wetting’ characteristic when dry. Although no soil moisture measurement was taken at the time of treatment, the potting mix was reasonable moist when treated, and no water was seen to pond. Water did pond with the loamy sand soil.
Plant kill It was realised since the first two experiments that the outer rows of plants may not have been completely doused by the hot fluid. Re-examination of photographs taken, show plants where the lower leaves have been blanched but upper leaves were unaffected. The third trial was to reduce this affect. Another observation was a thickening of the stem at ground level of some of these outer row plants, perhaps suggesting that ‘ring-barking’ may be a factor. This would be where hot water or foam on the surface might kill the outer phloem tissue of the stem (stopping carbohydrate movement downward, so producing the thickening), but the inner xylem tissue that transmits water still be alive. Some speculative observations were made that some plants, if truly ring-barked, might die. Far fewer did than estimated from the ground level stem swelling, so presumably the damage was not as serious as it appeared.
60
65
70
75
80
85
90
95
0 0.25 0.5 0.75 1 1.25 1.5 1.75 2 2.25 2.5 2.75 3 3.25 3.5 3.75 4 4.25 4.5 4.75 5 5.25 5.5 5.75 6Time, minutes
Deg
rees
Cel
sius
Water+Foam+Air Water+Air Water
5th EWRS Workshop on Physical Weed Control 215 Pisa, Italy, 11-13 March 2002
ConclusionsExperimental method has been inadequate to show why Aqua-Therme is finding that air added to hot water gives greater economy in weed control over hot water alone. The research is continuing, with modifications to experimental procedure in order to find a way to clearly demonstrate the difference. In the process, the effect of soil type and its moisture content has been identified as having some bearing on the results. These forms of thermal weed control are operating at relatively low temperature levels and a difference of a few degrees in temperature achieved is often all there is between good and poor results. There is still considerable interest in thermal weed control in Australia and New Zealand, with several companies currently working on improved water-based (including steam) models.
Acknowledgments
David Bowran, Grain Production Manager, Department of Agriculture, Western Australia, for his continued support of alternative weed control research in the Western Australian wheatbelt; The Grains Research and Development Corporation of Australia for funding of the principal author to the EWRS 5th Physical and Cultural Weed Control Workshop, Pisa, 11-13th March, 2001.
References
ASCARD J (1995) Thermal weed control by flaming: biological and technical aspects. PhD dissertation, Swedish University of Agricultural Sciences, Alnarp, Sweden. ISSN 0283-0086

5th EWRS Workshop on Physical Weed Control 216 Pisa, Italy, 11-13 March 2002
Band-steaming for intra-row weed control
B. Melander, T. Heisel & M. H. Jørgensen*
Danish Institute of Agricultural Sciences, Department of Crop Protection, Research Centre Flakkebjerg, DK-4200 Slagelse, Denmark, [email protected] *Danish Institute of Agricultural Sciences, Department of Agricultural Engineering,
Research Centre Bygholm, DK-8700 Horsens, Denmark
Abstract
Steaming the soil prior to crop sowing has the potential of eliminating weed seedling emergence completely. Thus, steaming might be a perspective technique for intra-row weed control in non-herbicidal row crops of high value, where manual weeding can be very laborious. This paper presents some preliminary results with the effects of steaming on weed seedling emergence. The work is part of a joint project involving both biological and technical aspects of steaming. The overall objective is to develop an applicable technique for applying steam in bands corresponding to the intra-row area of a row crop. Band-steaming is expected to use much less energy as compared to current steaming techniques for arable usage.
Introduction
Steaming the soil prior to crop sowing has demonstrated the potential to kill all viable weed seeds in the heated soil volume. Former investigations with steaming the soil have shown that a very effective and prolonged weed control can be obtained. Weed species, such as Senecio vulgaris,Stellaria media and Poa annua, can be controlled almost completely, and the effect may persist for several months. To achieve that, the temperature must be raised to more than 70oC down to 2,5 cm soil depth, and this temperature must be maintained for 6-9 minutes (Bødker & Noyé, 1994). The lethal effect of heating on weed seeds is also known from composting and mulching. Most viable weed seeds loose their germination capacity when temperatures reach approx. 60oC under mulches and in composts and persist for a longer duration (Davies et al., 1993; Grundy et al., 1998).
Thus, soil steaming appears to be a perspective method for eliminating hand-weeding in non-herbicidal row cropping, particularly in slow germinating and developing vegetable crops, such as direct-sown onion, leek and carrots, where manual weeding can be very laborious (Melander & Rasmussen, 2001). Current steaming techniques for field use are extremely energy consuming, which in the present work has lead to the idea of applying steam in bands only, corresponding to the intra-row area of a row crop. Thereby a lot of energy can be saved as compared to steaming the entire surface and down to 10-15 cm soil depth. However, more technical and biological research is needed to develop a band-steaming technique that can be applicable for practical usage. This presentation contains some preliminary biological results from a joint project involving both technical and biological aspects of band-steaming. The results are from studies aiming at describing the relationship between weed seedling emergence and maximum soil temperature achieved by steaming the soil at a range of times. The relationship is essential for determining the amount of steaming necessary to eliminate weed seedling emergence effectively.

5th EWRS Workshop on Physical Weed Control 217 Pisa, Italy, 11-13 March 2002
Materials and methods
Two investigations were conducted in the laboratory, where soil steaming took place in a 7 x 8 cm circular groove made in a wooden wheel with insulation in the bottom and at the sides (Fig. 1). Soil was steamed by a timed flow of steam through rubber tubes, each connected to a tine with two 1.5 mm holes. Four steam generators with a total effect of 8 kW produced steam. A total of eight tines were placed so that the soil volume in the groove was steamed evenly. The soil temperature was continuously measured by eighth thermocouples placed evenly in the soil while steaming and in a short period after steaming had been stooped. The soil was collected from a sandy loam expected to contain many natural weed seeds of different species. Samples were collected in October 2000 for the first experiment and March 2001 for the second one. In the second experiment, seeds of oil seed rape (Brassica napus) and ryegrass (Lolium perenne) were added to the samples prior to steaming. Steaming took place a few days after soil samples had been collected from the field. After steaming, half of the soil fractions were chilled at 5ºC for 30 days in order to break seed dormancy. Both chilled and non-chilled soil fractions were germinated for 6 weeks in watered trays in the glass house, and weed seedling emergence was registered regularly on species level in the germination period. Each treatment was replicated three times.
Figure 1. A circular groove for band-steaming in the laboratory
Results and discussion
Steaming time was slightly curvilinearly related to the achieved maximum temperature in the soil samples (Fig. 2a). For example, it took approximately 90 sec. to reach a maximum soil temperature of 75oC, and the temperature only dropped slowly, approximately 1oC per 60 sec., after steaming had been stopped.
The relationship between weed seedling emergence and maximum soil temperature was adequately described by an S-shaped dose-response curve for both the chilled and non-chilled seedsFig. 2b). The curve in Fig. 2b was fitted to the total number of emerged seedlings (weeds plus rape and ryegrass) from the soil collected in the spring 2001, but data from the autumn 2000 sampling showed the same relationship. Individual weed species including the crop seeds all showed this S- shaped relationship, but the maximum temperature at which no seedlings emerged any longer was

5th EWRS Workshop on Physical Weed Control 218 Pisa, Italy, 11-13 March 2002
Figure 2. a): measured (x) and modelled (—) relationship between achieved maximum soil temperature and steaming time with 8 kW effect and the same theoretical relationship with 200 kW effect (---). b): relationships between number of emerged seedlings (weed plus crop seeds) and maximum soil temperature with (---) or without (—) chilling.
different: Capsella bursa-pastoris 70oC; Chenopodium album 65oC; Tripleurospermum inodorum,Polygonum spp. and grass weeds 60oC; ryegrass and rape 75oC. Chilling generally lowered seedling emergence of all the weed and crop species in the untreated trays and in those where the maximum temperature did not exceed 40 oC, probably because chilling caused non-dormant seeds to become dormant. However, the opposite was true for Polygonum spp. in the soil collected in the autumn 2000, where chilling had broken dormancy of the majority of the seeds, and thus more seedlings emerged in the chilled fractions. The lethal effect of steaming on dormant Polygonum spp. seeds was, however, similar to that found for the non-dormant weed species.
Figure 3. A prototype band-steamer with a 200kW steam generator. Thirteen steaming tines are placed along a 7-cm wide line on the towed frame that is mounted to the 3-point linkage of the tractor.
0
20
40
60
80
100
0 20 40 60 80 100 1200
10
20
30
40
50
60
0 20 40 60 80 100
no chillingchilling
Steaming time (sec.) Max. soil temperature (oC)
See
dlin
gs (n
o. p
er tr
ay)
Max
. soi
l tem
pera
ture
(o C)
a) 8kW 200kW b)

5th EWRS Workshop on Physical Weed Control 219 Pisa, Italy, 11-13 March 2002
The determination of the relationship between weed seedling emergence and maximum soil temperature constitutes a valuable fundamental model for further studies on the effects of steaming. The next experiments will focus on the lower part of the curve, where weed seedling emergence is reduced by more than 70%. It is planned to investigate the influence of factors, such as soil type, soil moisture content, texture of the seedbed (fine versus coarse), and characteristics of the weed seeds in terms of thickness and hardness of the seed coat. In the technical part of the project, it is planned to develop a prototype band-steamer for field use, and the first version has already been build (Fig. 3). A band-steamer would have to work at a reasonable driving speed to become relevant for practical use, otherwise the working capacity would be to low. Increasing the effect of the steam generator will affect strongly the time required to achieve a certain maximum temperature as illustrated in Fig. 2a for a 200kW steam generator under ideal conditions. Another aspect of interest is the perspective of sowing crop seeds in the heated soil shortly after steaming, so that steaming and sowing can be done in the same pass. The current prototype uses a 200kW-steam generator, and it is planned to rear-mount sowing equipment.
References
BØDKER L. & NOYÉ G. (1994). Effekten af varmebehandling af overfladejord i nåletræssåbede over for ukrudt og rodpatogene svampe. (Effect of heat treatment of surface-soil in raised seedbeds with conifers against weeds and root pathogens. With English summary). In: Proceedings 11th Danish Plant Protection Conference / Pests and Diseases, 239-248.
DAVIES D.H.K., STOCKDALE E.A., REES R.M., MCCREATH M., DRYSDALE A., MCKINLAY R.G. & DENT B. (1993). The use of black polyethylene as a pre-planting mulch in vegetables: Its effect on weeds, crop and soil. Proceedings of the Brighton Crop Protection Conference – Weeds, 467-472
GRUNDY A.C., GREEN J.M., & LENNARTSSON M. (1998). The effect of temperature on the viability of weed seeds in compost. Compost Science and Utilization, 6(3), 26-33
MELANDER B. & RASMUSSEN G. (2001). Effects of cultural methods and physical weed control on intrarow weed numbers, manual weeding and marketable yield in direct-sown leek and bulb onion. Weed Research 41, 491-508.

5th EWRS Workshop on Physical Weed Control 220Pisa, Italy, 11-13 March 2002
Development of innovative machines for soil disinfectionby means of steam and substances in exothermic reaction
A. Peruzzi1, M. Raffaelli1, M. Ginanni2, M. Mainardi2
1D.A.G.A.E., Settore Meccanica Agraria, University of Pisa, Italy; 2Centro Interdipartimentale di Ricerche Agro-Ambientali "E. Avanzi", S. Piero a Grado, Pisa, Italy
Abstract
Several prototypes of a machine (drawn, mounted and self-propelled) for soil disinfection bymeans of steam injection at different depth after the incorporation in the soil of varying amounts of compounds (KOH, CaO, etc.) that cause an exothermic reaction were developed by the Celli firm in co-operation with the researchers of the Settore Meccanica Agraria e Meccanizzazione Agricola ofthe DAGA of the University of Pisa.
In the three years period 1998-2001, research was carried out taking into account themechanical, operative, economical, agronomic and phytopathological aspects of soil disinfectionperformed with the prototypes. Working times of the machine were rather long and fuelconsumption rather high. Nevertheless, its performances and operating costs are wholly acceptabletaking into account that any interventions of soil disinfection are usually very costly.
The tested system showed a promising potential as it was able to perform a remarkable soilheating and to control soil pathogens and potential weed flora.
The experiments carried out at the Centro Interdipartimentale di Ricerche Agro-Ambientali “E. Avanzi” of the University of Pisa, during 1999-2001 obtained very promising and encouragingresults, highlighting among other things the ever greater need to optimize the system through thedevelopment and maintenance of efficient machinery, better understanding of action mechanismsand a rigorous definition of operational factors (tillage depth, advancement speed, type and dosagefor substance in exothermic reaction) in relation to various substrates, plant diseases and crops.
Introduction
One of the gravest phytopathological problems connected with the cultivation of specializedhorto-floricultural crops, whether in the open field or greenhouse, are “diseases” provoked bytelluric pathogens that must almost always be removed from the soil by disinfection. This isaccomplished in most cases through the application of methyl bromide usually giving very positivephytoiatric and productive results (Martino, 1997). Environmental, hygienic-sanitary andtoxicological considerations constrain the inclusion of this disinfectant in the Montreal Protocolwhich totally prohibits its use from 2005 on (Ferrari et al., 1998; Gullino, 1998; Gullino et al.,1999; Katan, 1999). The disappearance within a few years of the only active principle able toguarantee good phytoiatric results under all conditions makes it particularly urgent to develop newdefense strategies. In this respect, an “alternative” method that has shown promise of significantresults is “solarization”. Though it is ever more widely diffuse in use, it is apparently penalizedhowever because it is strongly dependent on climatic and seasonal factors and the need for a longinterruption in the cultivation cycle (Katan, 1987; Katan et al., 1976; Materazzi et al., 1987; Trioloet al., 1991).
The only alternative system to both chemical disinfectants application and soil solarization isrepresented by steaming the soil. This technique is well known and was widely used in the past, but the high cost of production and distribution of steam in comparison with methyl bromideapplication reduced relevantly its use (Nederpel, 1979).
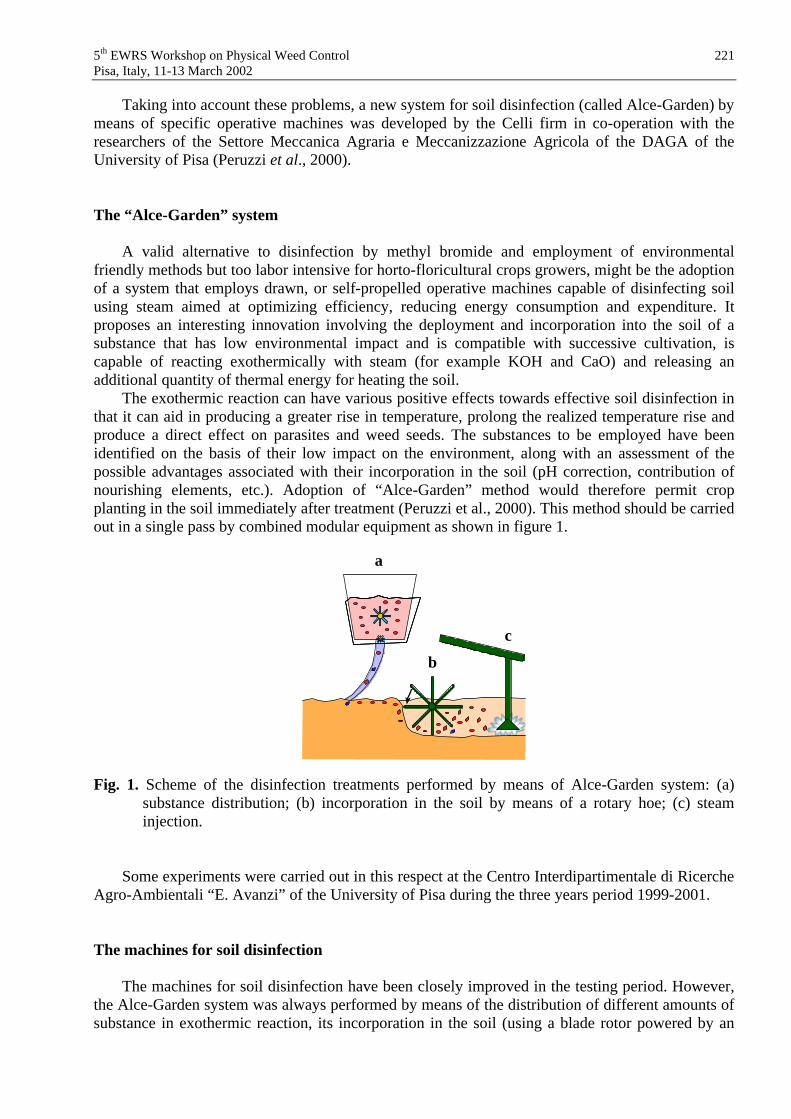
5th EWRS Workshop on Physical Weed Control 221Pisa, Italy, 11-13 March 2002
Taking into account these problems, a new system for soil disinfection (called Alce-Garden) by means of specific operative machines was developed by the Celli firm in co-operation with theresearchers of the Settore Meccanica Agraria e Meccanizzazione Agricola of the DAGA of theUniversity of Pisa (Peruzzi et al., 2000).
The “Alce-Garden” system
A valid alternative to disinfection by methyl bromide and employment of environmentalfriendly methods but too labor intensive for horto-floricultural crops growers, might be the adoption of a system that employs drawn, or self-propelled operative machines capable of disinfecting soilusing steam aimed at optimizing efficiency, reducing energy consumption and expenditure. Itproposes an interesting innovation involving the deployment and incorporation into the soil of asubstance that has low environmental impact and is compatible with successive cultivation, iscapable of reacting exothermically with steam (for example KOH and CaO) and releasing anadditional quantity of thermal energy for heating the soil.
The exothermic reaction can have various positive effects towards effective soil disinfection inthat it can aid in producing a greater rise in temperature, prolong the realized temperature rise andproduce a direct effect on parasites and weed seeds. The substances to be employed have beenidentified on the basis of their low impact on the environment, along with an assessment of thepossible advantages associated with their incorporation in the soil (pH correction, contribution ofnourishing elements, etc.). Adoption of “Alce-Garden” method would therefore permit cropplanting in the soil immediately after treatment (Peruzzi et al., 2000). This method should be carried out in a single pass by combined modular equipment as shown in figure 1.
a
bc
Fig. 1. Scheme of the disinfection treatments performed by means of Alce-Garden system: (a)substance distribution; (b) incorporation in the soil by means of a rotary hoe; (c) steaminjection.
Some experiments were carried out in this respect at the Centro Interdipartimentale di Ricerche Agro-Ambientali “E. Avanzi” of the University of Pisa during the three years period 1999-2001.
The machines for soil disinfection
The machines for soil disinfection have been closely improved in the testing period. However,the Alce-Garden system was always performed by means of the distribution of different amounts of substance in exothermic reaction, its incorporation in the soil (using a blade rotor powered by an

5th EWRS Workshop on Physical Weed Control 222Pisa, Italy, 11-13 March 2002
hydraulic engine) and the pass of a holed bar that injects steam at a adjusted depth, followed by aridging-mulching machine able to ridge - and eventually cover with plastic film - the treated soil.
The scheme shown in figure 2 represents the last and innovative system realized and set up toperform the disinfection of the soil according to the Alce-Garden method.
The operative machines for soil disinfection realised and set up in the testing period are bothdrawn/mounted (thus coupled to a tractor) and self-propelled (4WD and track versions).
2
1
3 10
9
10
6 5 7 3
4
8
Fig. 2. Scheme of the improved system to perform soil disinfection treatments: (1) frame; (2)hopper of the exothermic reaction product; (3) mechanic drive to the dispenser; (4)exothermic reaction product; (5) incorporation in the soil by means of a blade rotor; (6)hydraulic engine; (7) steam injection; (8) roller; (9) ridging-mulching machine; (10)adjustment of working depth.
The drawn and the mounted implements (Fig. 3) were projected and realised to perform openground treatments, while the self-propelled machines (particularly the track version) (Fig. 4) wereprojected and realised to work in greenhouse and tunnel (but obviously they can be used also inopen ground).
1
4 5
2
3
6
8
7
Fig. 3. Scheme of the mounted machine for soil disinfection able to perform open groundtreatments: (1) water tank (2) steam boiler; (3) hopper of the exothermic reaction product;(4) blade rotor; (5) steam dispenser; (6) plastic mulch spool; (7) roller; (8) ridging-mulching machine.

5th EWRS Workshop on Physical Weed Control 223Pisa, Italy, 11-13 March 2002
All the implements are equipped with a water tank, a steam boiler, a hopper for the substancesin exothermic reaction equipped with an appropriate system for their distribution, a blade rotor(operating at a speed of 70-80 rpm) powered by an hydraulic engine, a steam dispenser bar and aridging-mulching machine.
4
1
2
6
4 3 5
8
7
Fig. 4. Scheme of the self-propelled machine for soil disinfection able to perform greenhousetreatments: (1) machine with steam boiler, control board and generator; (2) hopper of theexothermic reaction product; (3) blade rotor; (4) system for the adjustment of rotor working depth; (5) steam dispenser; (6) plastic mulch spool; (7) roller (8) ridging-mulchingmachine.
The main characteristics of the last version of drawn and track self-propelled machines forsoil disinfection are shown in Table 1.
The amount of substances in exothermic reaction (KOH or CaO) can easily be changed (from a minimum of 50 kg ha-1 up to a maximum of 15.000 kg ha-1) by means of a system that allows toadjust the surface of the holes placed on the bottom of the hopper. The function of the blade rotor is only to incorporate the substance in the soil layer that must be treated. Thus the soil must be already tilled and seedbed must be already properly prepared because the machines performed soildisinfection and not soil tillage.

5th EWRS Workshop on Physical Weed Control 224Pisa, Italy, 11-13 March 2002
Table 1. Main characteristics of the last versions of machines for soil disinfection.Characteristics Machines for soil disinfection
Track self-propelled DrawnLength (m) 3.80 4.70Width (m) 1.60 2.00Height (m) 1.50 2.50Mass (kg) 3000 3000Working width (m) 1.60 2.00Hopper capacity (m3) 0.23 0.31Tanks capacity (m3) 0.60 1.60Steam boiler• Flow• Power• Max. fuel consumption• Pressure
(kg h-1)(MJ h-1)(kg h-1)(MPa)
0.601507 42
1.15
1.303265 90
1.15
Engine• Power• Max. fuel consumption
(kW)(kg h-1)
44 11
--
Transmission Hydrostatic -Speed range (m h-1) 60 - 2500 -
The water contained in the tanks must be of “good quality”. However, a specific farm cart with a softener operated by an electric engine powered by tractor PTO was built to improve water quality in the field.
Evaluation of soil heating
Test methodologyMachine effectiveness was assessed in terms of efficiency in heat transfer and persistence in the
soil. PT100 sensors 4 cm long that send a voltage signal to data loggers from which data areacquired and recorded on a personal computer using specially designed software were set atdifferent depths and used for these trials. These surveys were carried out on plastic “chests” (withparallelepiped shape, square base with side of 30 cm and height equal to 50 cm) and in the openfield at different depths.
Different treatments (carried out at different driving speed with steam + different amounts ofthe two exothermic substances and only steam on covered with plastic mulch and not covered soil)were compared during the three years of tests, using different experimental designs. However, onlythe effect of machine speed and the main effects of a single dose of the two exothermic substances(4000 kg/ha of KOH and CaO) and of soil covering are presented in this paper.
The temperatures were measured for six hours and after divided in four “classes” (T<40°C;40 T<60°C; 60 T<80°C; T 80°C). The time of persistence in the soil of each class and thehighest and the final (after six hours) values of temperature were taken into account in order tocompare the effects of the different treatments.
Results and discussionThe influence of machines driving speed on soil heating (in the soil treated with steam + 4000
kg ha-1 of KOH) is shown in figure 5. The temperature decreased as the speed increased and forspeeds higher than 1 km h-1 there was not any appreciable heating of the soil. There is an easyexplanation of this trend. As a matter of fact, steam flow is constant and if speed increases the soilis treated with lower and lower amounts of steam. This result was achieved during the first

5th EWRS Workshop on Physical Weed Control 225Pisa, Italy, 11-13 March 2002
experimental tests. Consequently the following tests were carried out using only one very lowdriving speed (150 m h-1), able to allow a remarkable heating of soil according to the need ofperforming soil disinfection.
20
30
40
50
60
70
80
90
100
0 20 40 60 80 100 120
Time (min)
150 m/h 300 m/h 500 m/h Control
Fig. 5. Trend of the temperatures registered in a soil layer of 20 cm treated with the machine for soil disinfection with three different speeds with a dose of 4000 kg ha-1 of KOH and untreated(control).
The effect of the use of the two exothermic substances on soil heating (0-15 cm layer) is shown in Table 2 (time of persistence of the four different classes of temperature in the soil) and Table 3(highest and final values of temperature).
The use of steam + 4000 kg ha-1 of KOH and CaO allowed to obtain a higher and longerheating of the treated soil in comparison with the adoption of steam. The differences between theeffect determined by the two exothermic substances, do not seem to be so relevant, although CaOallowed to reach a highest value of temperature and to maintain soil temperature over 80°C for alonger time with respect to KOH.
Table 2. Time of persistence of the four different classes of temperature measured for six hours in the soil (0-15 cm layer) treated with steam and steam + 4000 kg ha-1 of CaO and KOH. Different letters mean significant differences for P 0.05 (Duncan test). The values must be compared only on the rows.
Temperature (°C) Time of persistence in the soil (mins)Steam KOH 4000 CaO 4000
T<40° 104 a 63 b 59 b40° T<60° 147 b 167 a 163 a60° T<80° 71 b 78 a 78 aT 80° 38 c 52 b 60 a

5th EWRS Workshop on Physical Weed Control 226Pisa, Italy, 11-13 March 2002
Table 3. Highest and final values of temperature measured in six hours in the soil (0-15 cm layer) treated with steam and steam + 4000 kg ha-1 of CaO and KOH. Different letters mean significant differences for P 0.05 (Duncan test). The values must be compared only on the rows.
Values Temperature (°C)Steam KOH 4000 CaO 4000
Highest T 92 c 96 b 99 aFinal T 34 b 37 a 37 a
The effect of the use of plastic mulch on soil heating (0-15 cm layer) is shown in Table 4 (time of persistence of the four different classes of temperature in the soil) and Table 5 (highest and final values of temperature).
Table 4. Time of persistence of the four different classes of temperature measured for six hours in the soil (0-15 cm layer) covered and not covered with plastic mulch. Different letters mean significant differences for P 0.05 (Duncan test). The values must be compared only on the rows.
Temperature (°C) Time of persistence in the soil (min)Covered with mulch Not covered with mulch
T<40° 40 b 98 a40° T<60° 179 a 146 b60° T<80° 84 a 69 bT 80° 57 a 47 b
Table 5. Highest and final values of temperature measured in six hours in the soil (0-15 cm layer) covered and not covered with plastic mulch. Different letters mean significant differences for P 0.05 (Duncan test). The values must be compared only on the rows.
Values Temperature (°C)Covered with mulch Not covered with mulch
Highest T 96 a 96 aFinal T 38 a 34 b
The effect of plastic mulching on soil heating was relevant, although the highest value oftemperature was not significantly different with respect to that obtained without covering.
Mechanical, and operational aspects of the machines
Test methodologyThe mechanical fitness of the different typologies of machines for soil disinfection was
assessed and the principal operational characteristics were determined by means of open-field trials.The machines were always tested on tilled land and hence already predisposed for sowing or
transplanting. It was planned to operate the machinery on sandy well-watered soils (90% sand, 5%

5th EWRS Workshop on Physical Weed Control 227Pisa, Italy, 11-13 March 2002
silt, 5% clay) that are typically intended for vegetable crops and to employ two exothermicsubstances: “potassium hydroxide” and powdery calcium oxide.
The mechanical trials were carried out in order to determine the correct operation of the various parts of the machinery under varied working conditions and allowed to document all problems,proposed solutions and improving modifications to be incorporated.
Operational characteristics inherent to the work environment were also assessed during all field trials by means of the determination of work times (effective, accessory and operational), fuelconsumption (hourly and unitary, in reference to both the machine and the boiler for producingsteam), operating capacity, power consumption, etc. The data gathered from the trials were thenprocessed by a specific software developed at the Settore Meccanica Agraria e MeccanizzazioneAgricola del Dipartimento di Agronomia e Gestione dell’Agro-Ecosistema of the University of Pisa and standardized to an idealized one-hectare field (Di Ciolo & Peruzzi, 1988).
An analysis of the running costs of the machines and the treatments of soil disinfection wasalso performed. The standard methodology for the calculation of machinery running cost was used,considering for the implements a useful life of 10 years and an annual use of 1500 hours year-1
(Cera, 1976; Ribaudo, 1996; Sartori, 1998). Two doses (1000 and 4000 kg/ha) of KOH and CaO(corresponding to those used in the biological experiments) were taken into account in order tocalculate the costs of the treatment.
Results and discussionThe operational performances of the machines for soil disinfection are shown in Table 6. Both
the implements always worked at the same driving speed of 0.15 km h-1. According to the different working width and water tank capacity, the drawn machine was characterized by a lower workingtime (-22%) and a higher work productivity (+28%) with respect to the self-propelled machine. Thetotal fuel consumption per hectare was on the contrary higher (+63%) for the drawn implement incomparison with the self-propelled machine, according to the higher power (and consumption) ofboth the steam boiler and the 100 kW 4WD tractor coupled to the drawn machine.
Table 6. Operational performances of the two machines for soil disinfection.OPERATIONAL CHARACTERISTICS Unit of
measureTrack self-propelled
machineDrawn machine
Driving speed m h-1 150 150Working depth m 0.2 0.2Working width m 1.6 2.0Effective time h ha-1 41.6 33.4Accessory time h ha-1 10.9 7.8Operative time h ha-1 52.5 41.2Work chain efficiency % 79 81Working productivity m2 h-1 190 243Machine/tractor fuel consumption kg ha-1 450 576Steam boiler fuel consumption kg ha-1 1838 3146Total fuel consumption kg ha-1 2288 3722
An analysis of the running costs of the machines and the disinfection treatments performedwith different doses of the two exothermic substances is finally shown in Table 7.

5th EWRS Workshop on Physical Weed Control 228Pisa, Italy, 11-13 March 2002
Table 7. Analysis of the costs of the two machines and the treatment of soil disinfection performed with different doses of KOH and CaO.
COSTS Unit of measure
Track self-propelledmachine
Drawn machine
Purchase price € 123967 72314Useful life years 10 10Annual use h 1500 1500Cost per hour € h-1 70 81*Cost per hectare € ha-1 3661 3347*Cost of the disinfection treatments:Steam + 1000 kg ha-1 of KOH € ha-1 4177 3863
Steam + 1000 kg ha-1 of CaO € ha-1 3919 3605
Steam + 4000 kg ha-1 of KOH € ha-1 5725 5411
Steam + 4000 kg ha-1 of CaO € ha-1 4693 4379
* including the cost of the 100 kW 4WD tractor coupled to the drawn machine.
These values must be considered only indicative because the purchase price of both machinesand exothermic substances might be changed in the next future. The running costs of the twomachines are not so different, although the drawn implement is characterized by a higher value ofcost per hour (+16%) and a lower value of cost per hectare (-9%) with respect to the self-propelledmachine. The cost of the treatments is closely influenced by the type and amount of exothermicsubstance. However, the average cost of this treatment (calculated averaging the values obtained for the different machines, substances and doses) is about 4472 € ha-1 and it is of the same order (evenlower of some 4%) of the cost of a chemical treatment performed with methyl bromide (4650 € ha-1
on average).
Conclusions
The Alce-Garden System showed remarkable potential: it successfully induced substantial soilheating, thereby controlling the development of animal and cryptogamic pathogens as well as weed seed germination.
Machine working time and fuel consumption were elevated in absolute terms, but wereconsidered acceptable given that effective soil disinfection was achieved. Moreover, the cost perhectare of the steam treatment was competitive when compared to methyl-bromide fumigation.
Results obtained in control of plant diseases were highly encouraging. The machine was testedon heavily nematode-infested soil, where it succeeded in substantially lowering the number ofnematodes and improving the root development of courgettes planted soon after treatment. Inaddition, interesting positive results in control of lettuce rot (Sclerotinia minor) were obtainedduring the three year-period. The disease was successfully contained by Alce-Garden system, andfavourable effects on lettuce yields and weed control were also observed.
Results of post-treatment soil analysis were likewise good, confirming rapid return to pre-treatment soil fertility and microbial activity. Moreover, treatment was not followed byunfavourable conditions for crop growing, indicating that normal sowing and planting can beresumed immediately after disinfection with no risk of crop failure. A further positive aspect wasthe trend towards higher “activity” observed in soil treated with the Alce-Garden system, in contrast to the total “sterilisation” resulting from methyl-bromide. This suggests that the proposed systemcan offer significant long-run agronomic and environmental advantages.

5th EWRS Workshop on Physical Weed Control 229Pisa, Italy, 11-13 March 2002
In conclusion, the tests showed that the soil steam machinery manufactured by Celli canguarantee very good results in terms of “biological” control of soil infested by various pathogens;moreover both working capacity and costs are fully acceptable. However, there is also a clear needto conduct further experimental research in order to optimise the system through a betterunderstanding of its mechanisms of action and a rigorous definition of the operative parameters inrelation to different soil typologies, plant diseases and crops.
Acknowledgements
The authors are very grateful to A. Celli and A. Magni (Celli firm), R. Del Sarto, A.Pannocchia, M. Paracone, L. Pulga and S. Toniolo (University of Pisa) for their precious help andco-operation.
References
CERA M (1976) Meccanizzazione Agricola. Ed. Patron, Padova.DI CIOLO S & PERUZZI A (1988) Proposal for data processing standardization for tillage field
test. Agricoltura Mediterranea 3, 231-236.FERRARI M, MARCON E & MENTA A (1998) Fitopatologia, Entomologia Agraria e Biologia
Applicata, 3rd edn., Edagricole, Bologna.GULLINO M (1998) Anno 2005: addio al bromuro di metile. Terra e Vita 7, 22-23.GULLINO M, MINUTO A & GASPARRINI G (1999) Bromuro di metile - la parola agli
agricoltori. Colture Protette 7, 39-42.KATAN J (1987) Soil solarization. In:. Innovative approaches to plant disease control, I Chet ed.,
John Wiley & Sons, New York.KATAN J (1999) The methyl bromide issue: problems and potential solution. Journal of Plant
Pathology 81, 153-159.KATAN J, GREENBERGER A, ALON H & GRINSTEIN A (1976) Solar heating by polyethylene
mulching for the control of disease caused by soil-borne pathogen. Phytopathology 66, 683-688.
MARTINO B (1997) Il bromuro di metile in agricoltura. La Difesa delle Piante 20, 111-116.MATERAZZI A, IANDOLO R, TRIOLO E & VANNACCI G (1987) La solarizzazione del
terreno. Un mezzo di lotta contro il “marciume del colletto” della lattuga. L’InformatoreAgrario 43, 97-99.
PERUZZI A, RAFFAELLI M, DI CIOLO S, MAZZONCINI M, GINANNI M, MAINARDI M,RISALITI R, TRIOLO E, STRINGARI S & CELLI A (2000) Messa punto di un prototipo disterilizzatore del terreno per mezzo di vapore e di sostanze a reazione esotermica. Rivista diIngegneria Agraria 31, 226-242.
NEDERPEL L (1979) Soil sterilization and pasteurization In: Soil disinfestation, D Mulder ed.,Elsevier Scientific Publishing Company, Amsterdam.
RIBAUDO F (1996) Costo di esercizio delle macchine agricole. Macchine & Motori Agricoli 3, I-XI.
SARTORI L (1998) Capitolo V: calcolo del costo di esercizio delle macchine. In: Dispense diMeccanizzazione Agricola, Ed. Università degli Studi di Padova.
TRIOLO E, MATERAZZI A & VANNACCI G (1991) Risulati di un decennio di ricerche in Italia. La solarizzazione: un terzo metodo di sterilizzazione parziale del terreno. Terra e Sole 46, 22-28.

5th EWRS Workshop on Physical Weed Control 230 Pisa, Italy, 11-13 March 2002
Soil steaming with an innovative machine – effects on the weed seedbank
A.C. Moonen1, P. Bàrberi1, M. Raffaelli2, M. Mainardi3, A. Peruzzi2 & M. Mazzoncini2
1Scuola Superiore Sant’Anna, Pisa, Italy, 2D.A.G.A.E., University of Pisa, Italy, 3CentroInterdipartimentale di Ricerche Agro-ambientali E. Avanzi, S. Piero a Grado, Pisa, Italy
Abstract
As an alternative to chemical soil sterilisation and to soil solarization, the Italian company Celli, in collaboration with the Department of Agronomy of the University of Pisa, has developed a machine that is capable of sterilising the soil with hot vapour and the concurrent use of compounds of low environmental impact that, by means of an exothermic reaction, increase the amount of heat generated in the soil. In this study, the machine’s effect on the emergence of autumn-germinating weeds was tested by studying the size and composition of the weed seedbank in two soil layers (0-10 cm and 10-20 cm) after different treatments. Soil samples were kept in a non-heated glasshouse for 6 months and weed seedling emergence was monitored periodically. The field experiment consisted in a factorial combination between two soil cover treatments (bare soil vs black polyethylene film cover), two activating compounds (CaO vs KOH) and five rates of these compounds (0, 1000, 2000, 3000 and 4000 kg ha-1). Analysis of variance was used to determine the effect of treatments on seedling density and linear regression analysis to determine any correlations between seedling density and compound application rate. Redundancy Analysis (RDA) was used to detemine the effects of the various treatments on weed flora composition. In both soil layers, KOH use resulted in a higher reduction in total weed seedling density than CaO use. In particular, a significant reduction in density was observed for Capsella bursa-pastoris with increasing compound application rate. The soil steaming treatments did not substantially influence weed flora composition.
Introduction
Soil solarization was developed as an alternative method for soil sterilisation in order to reduce the use of pesticides for pathogen control. Different sorts of plastic films can be used to increase the heating effect of solar radiation. Besides pathogen control, increase in soil temperature by solarization appeared to have a positive side-effect on insect and weed control and several studies have been carried out to determine the best type of plastic sheet for optimising the weed control effect (Habeeburrahman & Hosmani, 1996; Chase et al., 1999; Mudalagiriyappa et al., 1999). However, soil solarization can only be used in summer in areas with enough radiation intensity to produce a significant control effect.
A negative aspect of soil solarization is the long duration of the period in which the field remains uncultivated, up to three months (Ricci et al., 1999). An alternative to the use of pesticides and solarization techniques for soil sterilisation is the use of hot water vapour (steam). This technique is used in horticulture, especially in glasshouses, but has never been considered as a possible technique to be used under field conditions. The Italian company Celli, in collaboration with the Agricultural Engineering Sector of the Department of Agriculture of the University of Pisa, has developed a machine that is capable of sterilising the soil with hot water vapour in combination with exothermic compounds of low environmental impact able to increase the heat produced in the soil (Peruzzi et al., 2002). After treatment, the soil is immediately covered with a black plastic film to increase the duration of the heating. The exothermic substances used are potassium hydroxide (KOH) and calcium oxide (CaO). During initial assessment of the impact of potassium hydroxide
5th EWRS Workshop on Physical Weed Control 231 Pisa, Italy, 11-13 March 2002
on the soil, a significant increase in soil exchangeable potassium and pH was registered; besides the exothermic reaction, a caustic effect of KOH was also observed (Peruzzi et al., 2000). The present study discusses the first results of an experiment set up with the objective to test this machine’s effect on the germination capacity of autumn-germinating weeds by studying the size and composition of the weed seedbank after different kinds of treatments. Preliminary data on treatment effects on the actual weed flora are reported by Bàrberi et al. (2002).
Materials and Methods
A field experiment was laid out at the Centro Interdipartimentale di Ricerche Agro-ambientali ‘E. Avanzi’ at S. Piero a Grado, near Pisa (Lat. 43°40’ N; Long. 10°19’ E) on a sandy soil (sand >91%) with a pH of 7.5 (for other soil characteristics see (Bàrberi et al., 2002)).
The field experiment consisted in a factorial combination between two soil cover treatments (bare soil vs black polyethylene film cover, laid down by the machine right after soil steaming), two activating compounds (CaO vs KOH) and five rates of these compounds (0, 1000, 2000, 3000 and 4000 kg ha-1). Two control treatments, with or without soil cover, were also included, giving a total of 20 treatments, each replicated six times. Plot size was 5 x 1.2 m. Just before the steaming treatment, the seedbed was carefully prepared to ensure maximum smoothness of the soil surface and thus maximum theorical effect of steaming. Soil steaming was performed on 23 October 2000. Soil temperature was monitored in selected plots at 15 cm depth for 180 minutes after vapour treatment. Maximum soil temperature that was reached under the different treatments varied between 75 and 85°C. On the day after the treatment, the soil was sampled for seedbank analysis to test whether soil steaming might have induced a significant reduction in weed seedling recruitment from buried seed reserves. Three soil cores of 20 cm depth were taken in each plot by means of a 3.5 cm diameter manual steel probe and immediately sub-divided in 0-10 and 10-20 cm sub-samples for the assessment of steaming effect on seeds located at different soil depths. The weed seedbank was analysed with the seedling emergence technique (Bàrberi & Lo Cascio, 2001). The samples were allocated in plastic tubs over a 2 cm-thick layer of sterilized coarse sand and kept in a non-heated glasshouse for six months under optimum moisture conditions. Drought periods were periodically applied to stimulate seed dormancy breakage. Emerged weed seedlings were periodically identified, counted and then removed.
For statistical analysis, total number of seedlings emerged in the three samples of each plot were considered as a replicate. Weed seedling density was square-root-transformed before ANOVA. Differences between means were calculated using LSD at the 5% significance level. Redundancy Analysis (RDA) with forward selection of the environmental variables (ter Braak & Smilauer, 1998) was used to analyse the treatment effects on the weed community composition based on arcsine-transformed species relative abundance data. Treatments were inserted as environmental variables during indirect gradient analysis and the six replicates were considered as covariables. A Monte-Carlo permutation test was performed to calculate which of the treatments contributed significantly to the explanation of the variation in the data set.
Results
Soil temperature Table 1 shows that for the vapour treatment without any exothermic compound the soil temperature never reached 80°C and after 180 min it was cooled down below 40°C. The use of an exothermic substance, also at low concentrations, had a positive effect on the maximum soil temperature. The use of higher concentrations of exothermic substances in the soil prolonged the

5th EWRS Workshop on Physical Weed Control 232 Pisa, Italy, 11-13 March 2002
duration of higher soil temperatures. Differences between the exothermic effect of CaO and KOH were very small and likely to be circumstantial.
Table 1. Maximum temperature registered, temperature reached after 180 min and average duration of soil temperature above certain values in the first 180 min after soil steaming (15 cm depth) for the vapour alone treatment and vapour + two exothermic compounds applied at 1000 and 4000 kg ha-1.
Temperature Treatment
Vapour KOH 1000 KOH 4000 CaO 1000 CaO 4000
Tmax (° C) 74.9 80.5 80.8 80.3 85.5 T after 180 min (°C) 36.6 41.0 40.0 38.8 41.6 T > 35°C (min) >180 >180 >180 >180 >180 T > 40°C (min) 122 >180 >180 161 >180 T > 45°C (min) 72 104 101 83 120 T > 50°C (min) 47 59 65 53 72 T > 55°C (min) 29 35 41 35 46 T > 60°C (min) 19 21 29 24 32 T > 70°C (min) 7 8 14 11 17 T > 80°C (min) 0 4 5 5 7
0-10 cm layer Analysis of variance of the cumulative number of seedlings m-2 emerged in the 0-10 cm layer
showed no effect of soil cover treatment and a significant (P 0.01) interaction between the exothermic compound used and application rate. Fig. 1 shows a significant negative relationship between KOH and CaO application rate and total seedling emergence (r2 = 0.98 and 0.89 respectively). The use of vapour without any exothermic compound resulted in emergence of over 3800 seedlings m-2. With increasing rates of KOH, this number decreased significantly till less than 1000 seedlings m-2 (76% reduction), while the highest rate of CaO still resulted in emergence of more than 3000 seedlings m-2 (20% reduction). Regression equations show that for any additional 100 kg ha-1 of exothermic compound used, KOH resulted in a reduction of 58 seedlings m-2 more than CaO. A t-test performed between the average number of seedlings m-2 emerged in the control plots without vapour (4417 seedlings m-2), and in the plots treated with vapour only (3840 seedlings m-2) showed that the use of vapour without addition of exothermic compounds did not reduce seedling emergence significantly.
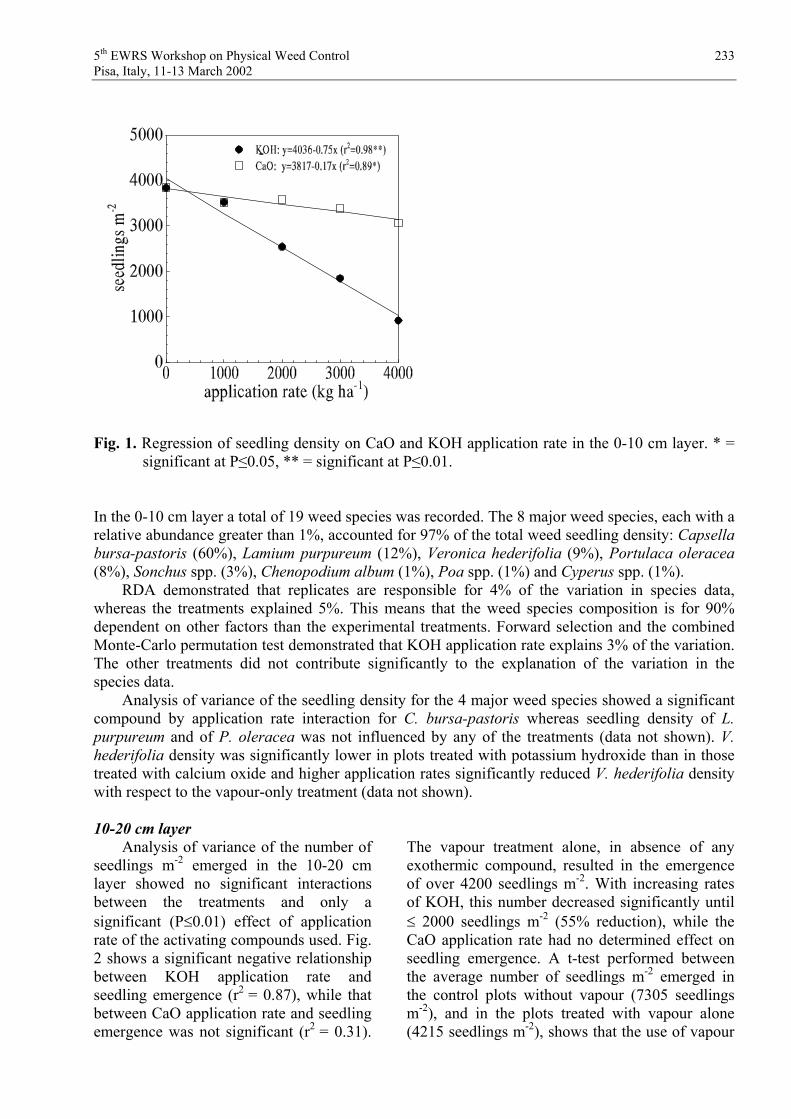
5th EWRS Workshop on Physical Weed Control 233 Pisa, Italy, 11-13 March 2002
Fig. 1. Regression of seedling density on CaO and KOH application rate in the 0-10 cm layer. * = significant at P 0.05, ** = significant at P 0.01.
In the 0-10 cm layer a total of 19 weed species was recorded. The 8 major weed species, each with a relative abundance greater than 1%, accounted for 97% of the total weed seedling density: Capsellabursa-pastoris (60%), Lamium purpureum (12%), Veronica hederifolia (9%), Portulaca oleracea(8%), Sonchus spp. (3%), Chenopodium album (1%), Poa spp. (1%) and Cyperus spp. (1%).
RDA demonstrated that replicates are responsible for 4% of the variation in species data, whereas the treatments explained 5%. This means that the weed species composition is for 90% dependent on other factors than the experimental treatments. Forward selection and the combined Monte-Carlo permutation test demonstrated that KOH application rate explains 3% of the variation. The other treatments did not contribute significantly to the explanation of the variation in the species data.
Analysis of variance of the seedling density for the 4 major weed species showed a significant compound by application rate interaction for C. bursa-pastoris whereas seedling density of L. purpureum and of P. oleracea was not influenced by any of the treatments (data not shown). V.hederifolia density was significantly lower in plots treated with potassium hydroxide than in those treated with calcium oxide and higher application rates significantly reduced V. hederifolia density with respect to the vapour-only treatment (data not shown).
10-20 cm layerAnalysis of variance of the number of
seedlings m-2 emerged in the 10-20 cm layer showed no significant interactions between the treatments and only a significant (P 0.01) effect of application rate of the activating compounds used. Fig. 2 shows a significant negative relationship between KOH application rate and seedling emergence (r2 = 0.87), while that between CaO application rate and seedling emergence was not significant (r2 = 0.31).
The vapour treatment alone, in absence of any exothermic compound, resulted in the emergence of over 4200 seedlings m-2. With increasing rates of KOH, this number decreased significantly until
2000 seedlings m-2 (55% reduction), while the CaO application rate had no determined effect on seedling emergence. A t-test performed between the average number of seedlings m-2 emerged in the control plots without vapour (7305 seedlings m-2), and in the plots treated with vapour alone (4215 seedlings m-2), shows that the use of vapour

5th EWRS Workshop on Physical Weed Control 234 Pisa, Italy, 11-13 March 2002
without addition of exothermic compounds did significantly reduce seedling emergence.
Fig. 2. Regression of seedling density on application rate of KOH and CaO in the 10-20 cm layer. * = significant at P 0.05,ns = not significant.
In the 10-20 cm layer a total of 15 species was recorded. The 8 major weed species, each with a relative abundance greater than 1%, accounted for 98% of the total weed seedling density: Capsellabursa-pastoris (59%), Lamium purpureum (14%), Veronica hederifolia (11%), Portulaca oleracea(8%), Poa spp. (2%), Chenopodium album (1%), Sonchus spp. (1%) and Tribulus terrestris (1%).
RDA demonstrated that replicates as well as treatments are responsible for 5% of the variation in species data. Forward selection and the combined Monte-Carlo permutation test demonstrated that none of the treatments contributed significantly to the explanation of the variation in the species data.
Analysis of variance of the seedling density for the four most abundant weed species, C. bursa-pastoris, L. purpureum, P. oleracea and V. hederifolia, showed that their seedling density was significantly lower in plots where an exothermic compound was used than in the vapour-only plots, independent of the type of compound used (data not shown).
Discussion
In both the upper and lower soil layers the presence of a black polyethylene film cover did not have any effect on weed seedling emergence. The effect of soil steaming on seedling emergence was stronger in combination with potassium hydroxide than with calcium oxide. The former resulted in a significant reduction in seedling emergence in both the upper (0-10 cm) and lower (10-20 cm) soil layers with increasing application rate, while the latter reduced seedling emergence only in the upper soil layer (Figs 1 and 2).
At higher application rates of calcium oxide and potassium hydroxide, soil temperature remained above 40°C for more than three hours after vapour treatment. At the lowest calcium oxide application rate temperature went below 40°C within three hours and in the vapour treatment without addition of exothermic compounds within two hours. In bibliography there is little reference to the soil temperature above which most weed species show increased seed mortality. In a study on the effect of composting on weed seed germination (Nishida et al., 1998), germination of 15 weed species was reduced after composting for 7 to 25 days at temperatures above 46°C. At temperatures above 57°C no seeds germinated. In a solarization study, soil temperatures of 45 to 65°C for 8-10 h per day during a 2 to 5 week period were considered effective to significantly reduce weed seedling emergence (Horowitz et al., 1983). In other studies, daily temperature
5th EWRS Workshop on Physical Weed Control 235 Pisa, Italy, 11-13 March 2002
fluctuation from 15 to 60°C in a dry environment for five months resulted in increased seed germination (Baskin & Baskin, 1998). It seems that high temperatures in a dry substrate have less effect on seed viability than in a humid substrate and that duration of high soil temperatures need to persist for a relatively long time period in order to decrease seed viability. In this study soil steaming was performed on a humid soil to enhance homogeneous heat distribution in the soil. However, the maximum duration of temperatures above 45°C never exceeded two hours (Table 1). This could have been due to easy heat dissipation in such an extremely sandy soil. It is not clear to what extent this might have contributed to loss in seed viability. Despite the highest maximum temperatures and longest persistence in the soil, the CaO treatment at 4000 kg ha-1 had a weaker effect on seedling emergence than the KOH treatment at the same rate. The vapour alone treatment reached slightly lower temperatures than the treatments with an exothermic compound, but it had no significant effect on seedling emergence. This indicates that besides temperature another factor was responsible for the higher decrease in seedling emergence with KOH use. This factor is thought to be the direct caustic effect of this compound (Peruzzi et al., 2000).
In both soil layers, soil steaming in combination with use of potassium hydroxide significantly reduced C. bursa-pastoris, while seedling emergence of C. bursa-pastoris, V. hederifolia and P. oleracea was significantly lower at the highest application rates of the activating compounds than after the vapour alone treatment.
In some soil solarization studies it has been suggested that annual weeds are more sensitive than perennials (Horowitz et al., 1983; Chase et al., 1998). In the present study, no conclusions can be drawn on the difference in sensibility to soil steaming of annual and perennial species because the four major weed species were all annuals or biennials. Furthermore, seed size does not seem to play a role because the seeds of V. hederifolia are the biggest ones (2-3 mm) and they responded well to the soil steaming treatment. It seems that soil steaming has a general effect on all four major, autumn-germinating, weed species in this study. Similar results were found for the major weed species in soil solarization studies (Stapleton & De Vay, 1986; Vizantinopoulos & Katranis, 1993; Temperini et al., 1998). In general, soil steaming with exothermic compounds has a very small effect on the weed species composition in the upper 20 cm of the soil.
Acknowledgements
This study was funded by Celli. We wish to thank M. Ginanni and the staff of the Centro Interdipartimentale di Ricerche Agro-ambientali E. Avanzi of the University of Pisa for their precious assistance in running the experiment and sampling.
References
BÀRBERI P & LO CASCIO B (2001) Long-term tillage and crop rotation effects on weed seedbank size and composition. Weed Research 41, 325-340.
BÀRBERI P, MOONEN AC, RAFFAELLI M, PERUZZI A, BELLONI P & MAINARDI M (2002) Soil steaming with an innovative machine - effects on actual weed flora. In: Proceedings 5th Workshop of the EWRS Working Group on Physical and Cultural Weed Control, Pisa.
BASKIN CC & BASKIN JM (1998) Seeds: Ecology, Biogeography and Evolution of Dormancy and Germination. Academic Press, San Diego, California.
CHASE CA, SINCLAIR TR, SHILLING DG, GILREATH JP & LOCASCIO SJ (1998) Light effects on rhizome morphogenesis in nutsedges (Cyperus spp): implications for control by soil solarization. Weed Science 46, 575-580.
5th EWRS Workshop on Physical Weed Control 236 Pisa, Italy, 11-13 March 2002
CHASE CA, SINCLAIR TR & LOCASCIO SJ (1999) Effects of soil temperature and tuber depth on Cyperus spp. control. Weed Science 47, 467-472.
HABEEBURRAHMAN PV & HOSMANI MM (1996) Effect of soil solarization in summer on weed growth and yield of succeeding rainy-season Sorghum (Sorghum bicolor). Indian Journal of Agronomy 41, 54-57.
HOROWITZ M, REGEV Y & HERZLINGER G (1983) Solarization for weed control. WeedScience 31, 170-179.
MUDALAGIRIYAPPA, NANJAPPA HV & RAMACHANDRAPPA BK (1999) Effect of soil solarization on weed growth and yield of kharif groundnut (Arachis hypogaea). Indian Journal of Agronomy 44, 396-399.
NISHIDA T, SHIMIZU N, ISHIDA M, ONOUE T & HARISHIMA N (1998) Effect of cattle digestion and of composting heat on weed seeds. Japan Agricultural Research Quarterly 32,55-60.
PERUZZI A, RAFFAELLI M, DI CIOLO S et al. (2000) Messa a punto e valutazione preliminari di un prototipo per la disinfezione del terreno per mezzo di vapore e di sostanze a reazione esotermica. Rivista di Ingeneria Agraria 4, 226-242.
PERUZZI A, RAFFAELLI M, GINANNI M & MAINARDI M (2002) Development of innovative machines for soil disinfection by means of steam and substances in exothermic reaction. In: Proceedings 5th Workshop of the EWRS Working Group on Physical and Cultural Weed Control, Pisa.
RICCI MSF, DE ALMEIDA DL, RIBEIRO RDD et al. (1999) Cyperus rotundus control by solarization. Biological Agriculture and Horticulture 17, 151-157.
STAPLETON JJ & DE VAY JE (1986) Soil Solarization: A non chemical approach for management of plant pathogens and pests. Crop Protection 5, 190-198.
TEMPERINI O, BÀRBERI P, PAOLINI R, CAMPIGLIA E, MARUCCI A & SACCARDO F (1998) Solarizzazione del terreno in serra-tunnel: effetto sulle infestanti in coltivazione sequenziale di lattuga, ravanello, rucola e pomodoro. In: Proceedings XI Convegno Biennale della Società Italiana per la Ricerca sulla Flora Infestante: "Il Controllo della Flora Infestante nelle Colture Orticole", Bari, 213-228.
TER BRAAK CJF & SMILAUER P (1998) Canoco Reference Manual and User's Guide to Canoco for Windows: Software for Canonical Community Ordination (Version 4). Microcomputer Power, Ithaca, NY, USA.
VIZANTINOPOULOS S & KATRANIS N (1993) Soil solarization in Greece. Weed Research 33,225-230.
5th EWRS Workshop on Physical Weed Control 237 Pisa, Italy, 11-13 March 2002
Water-jet cutting for weed control
F. Fogelberg1 & A. Blom2
Swedish University of Agricultural Sciences, 1Dept. Crop Science, POB 44, SE-230 53 Alnarp
2Dept. Agricultural Engineering, POB 66, SE-230 53 Alnarp mailto: [email protected]
An introductory study of new techniques for weed control on hard surface areas was conducted during summer 2001. We investigated three methods: UV-light, laser and water-jet cutting. Two of these methods have already been studied by the Danish scientists, Heisel and Andreasen. The third one, water-jet cutting, is a well known method for cutting of e.g. plastics, metal and paper in industry.
Water-jet cutting is a precise and environmental friendly technique with low treatment costs. The equipment is however expensive due to the need of a powerful water pump. Use of water is low, typically 1-3 litres per minut.
Cutting with pressurized water could be used to control weeds on hard surface areas such as railway embankments and roadsides, or to cut potato haulm or sugarbeets and carrots at harvest. The high water pressure can easily cut through all kind of materials – even stainless steel of 0.1 m thickness - if sand is added to the water to enhance the cutting effect.
We investigated three treatment speeds (1, 3 and 5 m s-1) and three water pressures (1000, 2000 and 3000 bar) using small plants of oilseed rape. No statistical analyses were cariied out. At 3000 bar pressure the highest speed resulted in more cut plants. At all tested speeds the medium water pressure (2000 bar) appeared to be better, i.e. resulted in increased number of cut plants, than the other two pressures. The small-scale experiment was not designed to evaluate interactions between pressure and treatment speed.
The results indicate that water-jet cutting can be a new method for physical weed control on hard-surface areas such as railway embankments or along roadsides. However, we need to perform experiments investigating the effect of speed and pressure on various organic materials. Costs and design of a mobile machine are also important issues to study.
References
FOGELBERG, F. & BLOM, A. 2001. Laser, UV-ljus och skärande vattenstråle som framtida metoder för ogräsbekämpning [Laser, UV-light and water jet cutting as future weed control methods]. Report 2001: 03, Swedish University of Agricultural Sciences, Dept Agricultural Engineering, Alnarp, Sweden.

5th EWRS Workshop on Physical Weed Control 238 Pisa, Italy, 11-13 March 2002
Soil steaming with an innovative machine – effects on actual weed flora
P. Bàrberi1, A.C. Moonen1, M. Raffaelli2, A. Peruzzi2, P. Belloni3 & M. Mainardi3
1Scuola Superiore Sant’Anna, Pisa, Italy, 2D.A.G.A.E., Settore Mecanica Agraria, University of Pisa, Italy, 3Centro Interdipartimentale di Ricerche Agro-ambientali E. Avanzi, S. Piero a Grado,
Pisa, Italy,
Abstract
A prototype of a self-propelled machine for soil disinfection by means of steam injection was tested for weed control in the field against autumn-germinating weeds. The field experiment consisted in a factorial combination between two soil cover treatments (bare soil vs. black polyethylene film cover, laid down by the machine right after soil steaming), two activating compounds (CaO vs. KOH), aimed to increase soil temperature by producing an exothermic reaction, and five rates of these compounds (0, 1000, 2000, 3000 and 4000 kg ha-1). Two control treatments, with or without soil cover, were also included, giving a total of 20 treatments, each replicated six times. Soil steaming was performed on 23 October 2000. Soil temperature and moisture were monitored in selected plots. Weed density was sampled by species in two fixed 25 x 30 cm quadrats per plot at six different times. Soil temperature increased with the addition of CaO and KOH. Averaged over all treatments, the maximum weed control effect was reached 30 days after soil steaming. At that time, the reduction in total weed density, compared to the uncovered control, ranged between 25% (vapour alone without cover) and 56% (soil steaming without cover + 1000 kg ha-1 of CaO). Averaged over all sampling periods, weed control seemed favoured by the addition of the activating compounds, but there was not a clear relationship between compound rate and percent weed density reduction.
Introduction
High soil temperature has been proven to reduce problems linked to pests, diseases, and weeds. Actually, increase in soil temperature above a certain threshold is the aim of soil solarization, a well-known method of soil disinfection used in warm-temperate areas aimed to reduce reliance on pesticide use (Sauerborn et al., 1989; Kumar et al., 1993). However, soil solarization has some drawbacks, e.g. it can only be used in summer and where radiation intensity is high, and implies temporary subtraction of land to agricultural production (Temperini et al., 1998). These drawbacks can be overcome by the use of hot water vapour (steam), a technique common in glasshouse horticulture, but that has not yet been proposed for use under field conditions.
Although potential use of soil steaming is theoretically spanned over a longer seasonal period compared to soil solarization, this advantage may be counteracted by lower soil temperatures, especially when steaming is not performed in summer. For this reason, any technical solution that can increase soil heating and duration of high soil temperature should result in increased steaming effectiveness. In this context, one possibility is to apply activating compounds (e.g. fertilisers or amendments) that, by reacting with the vapour produced by the steaming machine, can considerably increase soil temperature.
This paper reports preliminary results of a study aimed to evaluate the on-field weed control potential of a steaming machine developed jointly by the Italian company Celli and the Agricultural Engineering Sector of the Department of Agriculture at the University of Pisa (Peruzzi et al., 2002).

5th EWRS Workshop on Physical Weed Control 239 Pisa, Italy, 11-13 March 2002
This study, that was targeted to control of autumn-germinating weeds and includes several rates of two activating compounds, is part of a larger study which also takes into account soil steaming effects on pests, diseases, soil nutrient dynamics, and microbial activity (Peruzzi et al., 2000). Results on treatment effects on weed seedbank size and composition are reported elsewhere (Moonen et al., 2002).
Materials and Methods
A field experiment was conducted on a sandy soil at the Centro Interdipartimentale di Ricerche Agro-ambientali E. Avanzi of the University of Pisa, located at S. Piero a Grado (Lat. 43°40’ N, Long. 10°19’ E). Average soil characteristics were: clay 4.6%, silt 4.0%, sand 91.4% (USDA classification), pH 7.5, total N (Kjeldahl) 0.086%, organic matter (Walkley-Black) 0.94%, assimilatable P (Olsen) 10.6 ppm.
The experiment consisted in a factorial combination between two soil cover treatments (no cover vs. black polyethylene film cover, which was laid down by the machine immediately after soil steaming), two activating compounds (CaO vs. KOH) and five rates of these compounds (0, 1000, 2000, 3000 and 4000 kg ha-1). Two control treatments (with or without soil cover), were also included, giving a total of 20 treatments, each replicated six times in 5 x 1.2 m plots. Prior to steaming (carried out on 23 October 2000), the seedbed was carefully prepared to ensure maximum smoothness of the soil surface and thus maximum theorical treatment effect. Soil temperature and moisture were monitored in selected plots at 15 cm depth for 180 minutes after vapour treatment.
Weed density was sampled by species in two fixed 25 x 30 cm quadrats per plot at six different times after soil steaming (10 and 23 November 2000, 8 December 2000, 5 January 2001, 8 February 2001, and 15 March 2001), and then referred to unit area.
Here, average data on percent reduction in total weed density (as compared to the "true" control, i.e. that without soil cover) are reported, to allow a quick glance on the weed control potential of steaming.
Results
Maximum soil temperature that was reached under the different treatments varied between 75 and 85°C (Moonen et al., 2002). Compared to vapour alone, application of the activating compounds increased temperature duration above 45°C, an effect threshold proposed by Horowitz et al. (1983) for soil solarization.
Mean initial total weed density in the control plots was 127.3 plants m-2. Averaged over all treatments, the maximum weed control effect was reached 30 days after soil steaming (data not shown). At that time, the reduction in total weed density, compared to the untreated control without cover, ranged between 25% (soil steaming without cover and additional compounds) and 56% (soil steaming without cover and with addition of 1000 kg ha-1 CaO).
Averaged over all sampling dates, weed control seemed favoured by the addition of both CaO and KOH. However, total weed control seemed unrelated to rate of the activating compounds applied (Fig. 1).

5th EWRS Workshop on Physical Weed Control 240 Pisa, Italy, 11-13 March 2002
Discussion
Percent reduction in total weed density as compared to the uncovered control was not very high, and decidedly lower than that observed in the soil seedbank (Moonen et al., 2002). This difference between the effect on actual and potential weed flora may be partly due to serious soil disturbance posed by the unusual heavy rainfall occurred during the experimental period (858.2 mm between October 2000 and March 2001).
Compared to the initial weed density, percent weed reduction following steaming indicates that, at the very best, still 78 plants m-2 survived the treatment, a quantity likely to require supplemental weed control. However, just because of the unusual seasonal pattern, additional tests in more standard weather conditions are needed before attempting to draw conclusions on the on-field effect of steaming.
Weed seedbank data, obviously unbiased by adverse weather conditions, reflect in a much clearer way the promising weed control potential of steaming (Moonen et al., 2002).
Fig. 1. Percent reduction (as compared to the uncovered control) in total weed density observed in the different steaming treatments. Compound rates are in kg ha-1. Data have been averaged over six sampling dates and, for the different rates and for vapour, over two soil cover treatments (covered and uncovered).
Acknowledgements
Financial support for this study was provided by Celli. We wish to thank M. Ginanni and the staff of the Centro Interdipartimentale di Ricerche Agro-ambientali E. Avanzi of the University of Pisa for their precious help in running the experiment and data sampling.
19.6
38.9
33.3
28.3
22.3
28.5
23.8
18.2
36.4
10.5
Vapour
CaO 1000
CaO 2000
CaO 3000
CaO 4000
KOH 1000
KOH 2000
KOH 3000
KOH 4000
Covered check
Trea
tmen
ts
% reduction

5th EWRS Workshop on Physical Weed Control 241 Pisa, Italy, 11-13 March 2002
References
HOROWITZ M, REGEV Y, HERZLINGER G (1983) Solarization for weed control. WeedScience 31, 170-179.
KUMAR B, YADURAJU NT, AHUJA KN, PRASAD D (1993) Effect of soil solarization on weeds and nematodes under tropical Indian conditions. Weed Research 32, 423-429.
MOONEN AC, BÀRBERI P, RAFFAELLI M, MAINARDI M, PERUZZI A & MAZZONCINI M (2002) Soil steaming with an innovative machine – effects on the weed seedbank. In: Proceedings 5th Workshop of the EWRS Working Group on Physical and Cultural Weed Control, Pisa, 11-13 March.
PERUZZI A, RAFFAELLI M, DI CIOLO S, MAZZONCINI M, GINANNI M, MAINARDI M, RISALITI R, TRIOLO E, STRINGARI S & CELLI A (2000) Messa a punto e valutazioni preliminari di un prototipo per la disinfezione del terreno per mezzo di vapore e di sostanze a reazione esotermica. Rivista di Ingegneria Agraria 31, 226-242.
PERUZZI A, RAFFAELLI M, GINANNI M & MAINARDI M (2002) Development of innovative machines for soil disinfection by means of steam and substances in exothermic reaction. In: Proceedings 5th Workshop of the EWRS Working Group on Physical and Cultural Weed Control, Pisa, 11-13 March.
SAUERBORN J, LINKE KH, SAXENA MC, KOCH W (1989) Solarization: a physical control method for weeds and parasitic plants (Orobanche spp.) in Mediterranean agriculture. Weed Research 29, 391-397.
TEMPERINI O, BÀRBERI P, PAOLINI R, CAMPIGLIA E, MARUCCI A & SACCARDO F (1998). Solarizzazione del terreno in serra-tunnel: effetto sulle infestanti in coltivazione sequenziale di lattuga, ravanello, rucola e pomodoro. In: Proceedings XI Convegno Biennale della Società Italiana per la Ricerca sulla Flora Infestante: “Il controllo della flora infestante nelle colture orticole", Bari, 12-13 November, 213-228.

5th EWRS Workshop on Physical Weed Control 242 Pisa, Italy, 11-13 March 2002
Hot water for weed control on urban hard surface areas
D. Hansson Swedish University of Agricultural Science,
Department of Agricultural Engineering, P.O. Box 66, SE–230 53 Alnarp, Sweden
Introduction
Thermal weed control methods on hard surface areas based on hot water or flames are interesting alternatives to herbicides and mechanical methods. They cause less wear on the treated surface compared with mechanical methods like rotating wire brushes. However, flame weeding is not possible to use in some areas i.e. on railroads, close to houses and parked cars, partly due to the risk of fire. Hot water treatment eliminates the fire hazards associated with flame weeding. Hot water equipment for weed control called Aqua Heat has been introduced in USA (Berling, 1992). In New Zealand another hot water equipment for landscape and roadside vegetation management called Waipuna System has been introduced. Preliminary studies showed that hot water killed most annual and young perennial weeds, but older perennial weeds required repeated treatments (Daar, 1994). Kurfess et al. (1999) and Kurfess & Kleisinger (2000) showed that the hot water method has a great potential to be developed to control weeds in orchards.
Hot water weed control has been studied at the Swedish University of Agricultural Science. The overall aim of these studies was to develop the hot water weed control method on hard surface areas and study different kinds of parameters that have an influence on the weed control effect and dose. For that reason experiments were carried out in laboratory, on arable fields and on hard surface areas. The experiments were made on the test weed Sinapis alba L. (White mustard) in laboratory and on arable fields, and on naturally developed weeds in the experiments on hard surface areas.
Dose-response relationships were described in order estimate the effective energy use and effective travel speed of hot water treatment at different development stages and infestation levels. Moreover, the influence of time of assessment of weed control effect (one or two weeks after treatment), and the number of treatments needed during a season was studied (Hansson & Ascard, manuscript).
The influence of weather conditions was studied in experiments with treatment at different air-temperatures, and after rain and after drought.
Some application technique parameters were studied to investigate the effects of water temperature and drop size on hot water weed control (Hansson & Mattsson, Manuscript). The aim in another experiment was to study if it is possible to decrease the required effective energy dose if the time of exposure of the hot water is prolonged.
Results and discussions
The effect of hot water can be described by dose-response curves similar to those of flame weeding and herbicides. The energy dose for a 90% reduction in plant weight was on Sinapis albaL. in the 2-leaf stage one third of the energy required for the same reduction in the 6-leaf stage. Treatment at an early stage saves energy, increases the driving speed and lowers the costs. A longer lasting effect requires a higher energy dose. A 50% higher energy dose was needed to obtain a 90%

5th EWRS Workshop on Physical Weed Control 243 Pisa, Italy, 11-13 March 2002
reduction in weed cover that lasted for 15 days instead of 7 days. Furthermore it was found that the required number of treatments on hard surface areas was similar to that of flame weeding. Six hot water treatments were needed during a vegetation season to obtain good weed control on an area similar to gravel embankments with a well-established natural weed flora (Hansson & Ascard, manuscript).
Preliminary results show that the weed control effect was not significantly different at different air-temperatures (7 °C and 18 °C). This indicates that it is possible to compare results from studies at air temperatures from 7 °C to 18 °C if other factors are constant. Rain before treatment increased the required energy dose and drought decreased it.
In the study with different water temperatures it was shown that, at the same energy dose level, the effect was generally higher at high temperature (Hansson & Mattsson, manuscript). The explanation is probably that it is only the energy in the water above approximately 60 °C that is effective in killing plants. Most plants die if they are exposed to temperatures above approximately 60 °C during a shorter period of time (Levitt, 1980). The higher the temperature in the water applied, the higher is the proportion of the total energy in the water that can kill or damage weeds. In another experiment there was a significant decrease in fresh weight per plant when the drop size was increased (Hansson & Mattsson, manuscript). This probably depends on the fact that big droplets do not cool down as fast as fine droplets. Prolonged time of exposure by an insulating sheet mounted after the shield with nozzles increased the weed control effect, by probably decreasing the plants cooling down rate.
References
BERLING J (1992) Getting weeds in hot water. A new hot-water weed sprayer and soy-based oil help cut herbicide use. Farm Industry News 26, 44.
DAAR S (1994). New technology harnesses hot water to kill weeds. IPM Practitioner 16, 1-5. HANSSON D & ASCARD J (manuscript). Influence of developmental stage and time of assessment on
hot water weed control. Submitted. HANSSON D & MATTSON J E (manuscript) Effect of drop size, water flow, wetting agent and water
temperature on hot water weed control. Submitted. KURFESS W, GUTBERLETT B & KLEISINGER S (1999). Hot water on weeds. Landtechnik 54, 148-
149.KURFESS W & KLEISINGER S (2000). Effect of hot water on weeds. (in German with English
summary). Proceedings 20th German conference on weed biology and weed control. Stuttgart, Hohenheim, Germany, 14 -16 March, 2000, Zeitschrift für Pflanzenkrankheiten, Pflanzenschutz17, 473-477.
LEVITT J (1980) Responses to Environmental Stresses. Vol. 1. Chilling, Freezing and High Temperature Stresses. 2nd ed. Physiological Ecology. Academic Press. (USA).

5th EWRS Workshop on Physical Weed Control 244 Pisa, Italy, 11-13 March 2002
Thermal control of Vicia hirsuta and Vicia tetrasperma in winter cereals
P. Juroszek, M. Berg, P. Lukashyk, U. Köpke Institute of Organic Agriculture, University of Bonn, Germany
Abstract
Vicia hirsuta and Vicia tetrasperma are troublesome weeds in organic winter cereal production in Germany. Field experiments were conducted in western Germany, near Bonn, to evaluate the optimal ground speed and application timing of an infrared (IR) weeder to control Vicia hirsuta and Vicia tetrasperma efficiently, without significant reduction of crop yield. Heat application was post-emergence of the crop. Two trials were conducted, in winter rye and winter wheat respectively. Each trial consisted of three sections where thermal weed control was applied at three different growth stages (winter wheat EC 22, EC 25, EC 31; winter rye EC 29, EC 30, EC 32). Each section was arranged as a one-factorial block design with three replications. The tractor mounted IR weeder was tested at 3 ground speeds (control plots without heat application, 1.5 km h-1, 1.0 km h-1, 0.5 km h-1). The natural weed flora during tillering-phase of winter cereals comprised different annual species (e.g. Veronica hederifolia) including a mixture of Vicia hirsuta and Vicia tetrasperma between one-leaf and four-shoot growth stage. As expected, IR radiation after growth stage EC 29 of winter cereals was not effective in reducing the number and fitness of Vicia species due to shading effect of the taller crop plants, preventing that effective amounts of heat reached the smaller weed plants under the crop canopy. Moreover, heat application at EC 31 and EC 32 resulted in severe grain yield loss of both winter rye and winter wheat. On the other hand IR radiation at 0.5 km h-1 ground speed efficiently controlled number and seed production of Vicia species when undertaken at tillering stages of winter cereals, without reducing grain yield significantly. Moreover, winter wheat yield after IR radiation at EC 25 was increased, possibly due to higher harvest index of the crop compared to the untreated control. Results suggest that Vicia hirsuta and Vicia tetrasperma can be controlled between one-leaf and four-shoot stage successfully in winter cereals, when heat is applied at EC 29 in winter rye and at EC 22 and EC 25 in winter wheat respectively. Economic aspects of using thermal control methods in winter cereal production are not discussed in this paper. However, due to high labour input and energy consumption, application of IR radiation should be restricted to patches of Vicia species within a field rather than overall.
Introduction
Vicia hirsuta and Vicia tetrasperma are troublesome annual weed species in cereals in organic farming (Herrmann & Plakolm, 1991), but not under conventional farming conditions. Vicia species are climbing legumes with a high competitive ability under low-nitrogen input conditions. Under low-nitrogen input conditions crop plant densities are usually lower compared to conventional farming conditions, resulting in more PAR reaching Vicia hirsuta leaves, increasing the competitive ability of these species.
According to a survey by Eisele (1996) about 20 % of all organic farms in the German Bundesland North-Rhine-Westphalia do have problems with Vicia hirsuta. Problems increase with duration of organic production. If growing conditions are favourable they can completely cover the crop, resulting in severe grain yield quantity and quality losses. An experiment by Roberts & Bodrell (1985) shows that 11 % of seeds of Vicia hirsuta survived 5 years of burial time in soil without loosing their viability. Seed accumulation of Vicia species in soils can create big problems for future cereal production and should be avoided, at least be minimised. Particularly in winter cereals, Vicia species do have optimal conditions for emergence and development because of autumn sowing, where germination can occur

5th EWRS Workshop on Physical Weed Control 245 Pisa, Italy, 11-13 March 2002
after soil tillage and sowing. Moreover, if soil moisture is adequate, Vicia species are able to emerge throughout the whole winter and early spring independent of soil disturbance (Juroszek, 2001 unpublished), possibly because of the large seed size that increase vigour (Milberg et al., 2000). This observation is in agreement with Roberts & Bodrell (1985), who found Vicia hirsuta emerging from October to May but scarcely at all in summer.
All factors that favour crop performance (e.g. high seeding density, narrow row width, high shading ability of cultivar, nitrogen fertilisation) are adequate to decrease competitive ability of Vicia species (Rademacher, 1937; Eisele, 1998). However, there are studies suggesting that Vicia hirsuta can not be controlled efficiently by indirect measures alone (Drews et al., 2002). Even repeated mechanical control with a harrow or a hoe is sometimes not effective (Eisele, 1998). According to a recent literature survey there are no data available on control of Vicia species in winter cereal crops by using thermal weed control methods. The efficacy of thermal weed control methods is attributed to a direct effect of the heat on the cell membranes and to the indirect effect of subsequent desiccation (Vester, 1987). In 2001, a study was initiated to investigate whether an infrared (IR) weeder can be used to control Vicia species seedlings efficiently, without decreasing winter rye and winter wheat grain yield significantly. The main objectives of this study were to evaluate the ground speed of the IR weeder required for effective control of Vicia species and to find the optimal timing of IR radiation for weed control and crop tolerance.
Material and methods
Two field trials were undertaken, one in winter rye and winter wheat, respectively. Field trials were located at Research Farm Wiesengut (eastern longitude 7 17‘, northern latitude 50 48‘, 65 m above sea level) near Bonn, Germany. Average annual temperature is about 9.5 °C, average annual precipitation 700-750 mm. The soil type of field trials was silty loam. Winter rye was grown after spring wheat, and winter wheat after potatoe. Each trial consisted of three sections, where thermal control was applied at three different growth stages of the crop (winter rye EC 29, EC 30, EC 32; winter wheat EC 22, EC 25, EC 31). Row width of winter rye was 12 cm, row width of winter wheat was 24 cm. The duration of heat application was varied using different ground speeds of a tractor mounted IR weeder (control plots without heat application, 1.5 km h-1, 1.0 km h-1, 0.5 km h-1). IR radiation was applied with a single pass (Tab. 1). Each section was arranged as a one-factorial block design with three replications. Plot size was 5 m long and 2.5 m wide. There was a 5 m border between plots to allow adjustment of the ground speed of the IR weeder.
Table 1. Dates of IR radiation treatment, average weed density of Vicia species, minimum and maximum air temperature, dates of assessments of different parameters in winter rye and winter wheat
Weed density Temperature Parameters Heat application Vicia species
Plants m-2Min./max. °C
Crop and weed injury
Ground cover Crop harvest and Viciaplant collection
Winter rye EC 29 (15th Feb.) 45.3 -1/7 5th Mar. 28th June 23rd July (by hand) EC 30 (28th Mar. ) Not assessed 1/7 4th Apr. 28th June 23rd July (by hand) EC 32 (2nd May) Not assessed 11/20 5th May 28th June 23rd July (combine) Winter wheat EC 22 (15th Feb.) 13.1 -1/7 23rd Feb. 22nd June 23rd July (by hand) EC 25 (28th Mar.) 21.1 1/7 12th Apr. 22nd June 23rd July (combine) EC 31 (2nd May) Not assessed 11/20 5th May 22nd June 23rd July (combine)
An IR weeder (company Görgens, Cologne, Germany, produced in year 1987) was used with gas-phase burners directed backwards in front of a shielded grid. The working width of the IR weeder is

5th EWRS Workshop on Physical Weed Control 246 Pisa, Italy, 11-13 March 2002
2.4 m, and the length of the IR weeder is 1.5 m. The energy source of the burners is liquid propane. Liquid propane is delivered to a vaporiser before entering the burners. Heat produced by the burners is transported to a grid made of manganese radiating the heat towards the soil surface. Maximum temperature at the surface of the grid is about 900 °C. Gas pressure is 1.5 bar (0.15 MPa). Maximum gas consumption is about 48 kg h-1 giving 616 KW. According to Ascard (1998) these kind of weeders are flame weeders rather than IR weeders because they use burners with a open flame. The original IR weeders do have non-catalytic atmospheric burners. However, in this paper the name IR weeder is used, referring to the company Görgens, selling the thermal weeder used in this study.
The natural weed flora during the tillering-phase of the cereals consisted of different annual species typical of winter cereal production (e.g. Galium aparine, Matricaria recutita, Apera spica-venti, Veronica hederifolia, Stellaria media) including a mixture of Vicia hirsuta and Vicia tetraspermabetween one-leaf and four-shoot growth stage. Plant height of Vicia species was about 5 cm. Weed density and weed growth stage during elongation-phase of winter cereals was not assessed because it was obvious before performing the heat treatment that the crop would shade the smaller weed plants. The study focussed on evaluating the heat tolerance of crops rather than on weed control. Crop plants were always taller than weed plants. The IR weeder was mounted slightly above the top leaves of the crop plants. However, at EC 31 and EC 32 the crop plants were taller than the maximum height of the tractor mounted IR weeder. The canopies of weeds and crops were dry at the time of IR radiation.
At the time of IR treatment, soil moisture and air temperature were recorded (Tab. 1). After performing thermal weed control in winter rye at EC 29 and winter wheat at EC 22, there was frost during the night, perhaps influencing the injury of crop and weed plants. Several days after conducting IR weeding, the degree of injury to individual plants of Vicia species was estimated in three randomized subplots (each 0.1 m2 area) per plot (Tab. 1). These subplots were used in all subsequent assessments. Growth stage of individual plants was assessed for each Vicia species separately (effect of growth stage of Vicia species on efficacy of IR weeding not shown). The degree of injury to crops was estimated at the same time and position as Vicia species plant injury, but an overall estimate of damage to all cereal plants within the frame was made rather than individual plant assessments. Percent ground cover estimation of Vicia species was carried out on whole plot area. At crop harvest, ten Vicia hirsutaplants were collected randomly in each plot to measure production of pods per plant. Harvest was either carried out cutting the crop by hand from two randomised subsamples per plot, or a combine was used (working width 1.5 m), harvesting the centre of each plot (Tab. 1).
Analysis of results was performed using the SAS statistical package (version 8.2). Subsamples were pooled to obtain a block treatment average for each treatment, which was used in all subsequent analysis (HURLBERT 1984). Results of % ground cover estimation, pod production of Vicia hirsuta and yield parameters were statistically evaluated using analysis of variance ( = 0.05) based on a one-factorial block design model. Comparison of means was evaluated with Tukey’s test ( = 0.05).
Results
Effect of IR radiation on Vicia species applied during the elongation-phase of winter cereals
IR radiation applied after growth stage EC 29 of winter cereals did not reduce the number and fitness of Vicia species at any ground speed. Possibly taller crop plants prevented effective doses of heat reaching the smaller weed plants, which were located under the crop canopy. Particularly after heat treatment at EC 31 and EC 32, winter cereal plants were seriously injured and the development of weeds including Vicia species was enhanced due to the light that penetrated through gaps of destroyed crop canopy.

5th EWRS Workshop on Physical Weed Control 247 Pisa, Italy, 11-13 March 2002
Effect of IR radiation on winter rye and winter wheat applied during the elongation-phase
Heat application in winter rye at EC 30 resulted in moderate yield losses (up to 5.1 dt ha-1), whereas in winter rye at EC 32 and in winter wheat at EC 31, severe losses of grain yield were recorded (winter rye up to 17.1 dt ha-1 and winter wheat up to 18.7 dt ha-1). The later and the longer heat treatment was applied, the bigger was the grain yield depression (Tab. 2). IR radiation at EC 32 reduced the number of ears m-2 in winter rye by 75 ears m-2 compared to the control plots and in winter wheat at EC 31 by up to 61 ears m-2. Thousand seed weight of grain was reduced in winter rye at EC 32 by up to 6.4 g, and in winter wheat at EC 31 by up to 3.4 g, compared to the control. Ripening of cereal straw and grains was retarded by one to two weeks.
Table 2. Grain yield (86% DM) after IR radiation applied at different crop growth stages during the elongation-phase
Winter rye (EC 30) Winter rye (EC 32) Winter wheat (EC 31) Ground speed (km h-1) Grain yield (dt ha-1) Grain yield (dt ha-1) Grain yield (dt ha-1)0 (Control) 37.2 34.9 a 51.8 1.5 35.8 13.6 b 40.3 1.0 34.2 11.4 b 36.8 0.5 32.1 10.0 b 34.7
(Results with different letters are significant, results without letters behind are not significant, Tukey’s test, = 0.05)
The results of this study strongly suggest that winter rye and winter wheat were not able to recover from injuries due to heat treatment when applied during their elongation-phase.
Effect of IR radiation on Vicia species applied during the tillering-phase of winter cereals
In contrast to the elongation-phase, IR radiation controlled density and seed production of Vicia species efficiently when undertaken during the tillering-phase of winter cereals.
0
20
40
60
80
100
Contro
l
1.5 km
h-1
1.0 km
h-1
0.5 km
h-1
Contro
l
1.5 km
h-1
1.0 km
h-1
0.5 km
h-1
Contro
l
1.5 km
h-1
1.0 km
h-1
0.5 km
h-1
Plan
ts (%
)
100(lethal)
Winter rye (EC 29) Winter wheat (EC 22) Winter wheat (EC 25)
Losses of leaf area (%)
75 - 99 50 - 75 25 - 50 1 - 25 0
Growth stage of the cereals at treatment
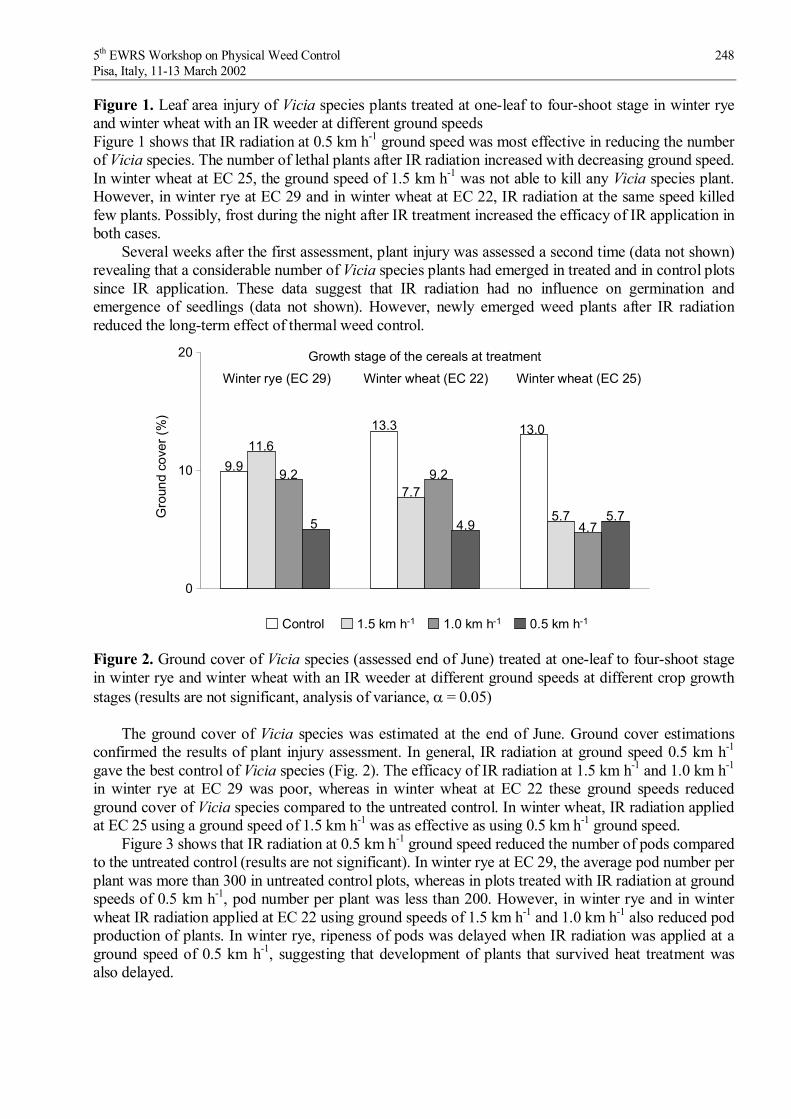
5th EWRS Workshop on Physical Weed Control 248 Pisa, Italy, 11-13 March 2002
Figure 1. Leaf area injury of Vicia species plants treated at one-leaf to four-shoot stage in winter rye and winter wheat with an IR weeder at different ground speeds Figure 1 shows that IR radiation at 0.5 km h-1 ground speed was most effective in reducing the number of Vicia species. The number of lethal plants after IR radiation increased with decreasing ground speed. In winter wheat at EC 25, the ground speed of 1.5 km h-1 was not able to kill any Vicia species plant. However, in winter rye at EC 29 and in winter wheat at EC 22, IR radiation at the same speed killed few plants. Possibly, frost during the night after IR treatment increased the efficacy of IR application in both cases.
Several weeks after the first assessment, plant injury was assessed a second time (data not shown) revealing that a considerable number of Vicia species plants had emerged in treated and in control plots since IR application. These data suggest that IR radiation had no influence on germination and emergence of seedlings (data not shown). However, newly emerged weed plants after IR radiation reduced the long-term effect of thermal weed control.
Figure 2. Ground cover of Vicia species (assessed end of June) treated at one-leaf to four-shoot stage in winter rye and winter wheat with an IR weeder at different ground speeds at different crop growth stages (results are not significant, analysis of variance, = 0.05)
The ground cover of Vicia species was estimated at the end of June. Ground cover estimations confirmed the results of plant injury assessment. In general, IR radiation at ground speed 0.5 km h-1
gave the best control of Vicia species (Fig. 2). The efficacy of IR radiation at 1.5 km h-1 and 1.0 km h-1
in winter rye at EC 29 was poor, whereas in winter wheat at EC 22 these ground speeds reduced ground cover of Vicia species compared to the untreated control. In winter wheat, IR radiation applied at EC 25 using a ground speed of 1.5 km h-1 was as effective as using 0.5 km h-1 ground speed.
Figure 3 shows that IR radiation at 0.5 km h-1 ground speed reduced the number of pods compared to the untreated control (results are not significant). In winter rye at EC 29, the average pod number per plant was more than 300 in untreated control plots, whereas in plots treated with IR radiation at ground speeds of 0.5 km h-1, pod number per plant was less than 200. However, in winter rye and in winter wheat IR radiation applied at EC 22 using ground speeds of 1.5 km h-1 and 1.0 km h-1 also reduced pod production of plants. In winter rye, ripeness of pods was delayed when IR radiation was applied at a ground speed of 0.5 km h-1, suggesting that development of plants that survived heat treatment was also delayed.
9.9
13.011.6
7.7
5.7
9.2 9.2
4.75 4.95.7
13.3
0
10
20
Winter rye (EC 29) Winter wheat (EC 22) Winter wheat (EC 25)
Gro
und
cove
r (%
)
Control 1.5 km h-1 1.0 km h-1 0.5 km h-1
Growth stage of the cereals at treatment
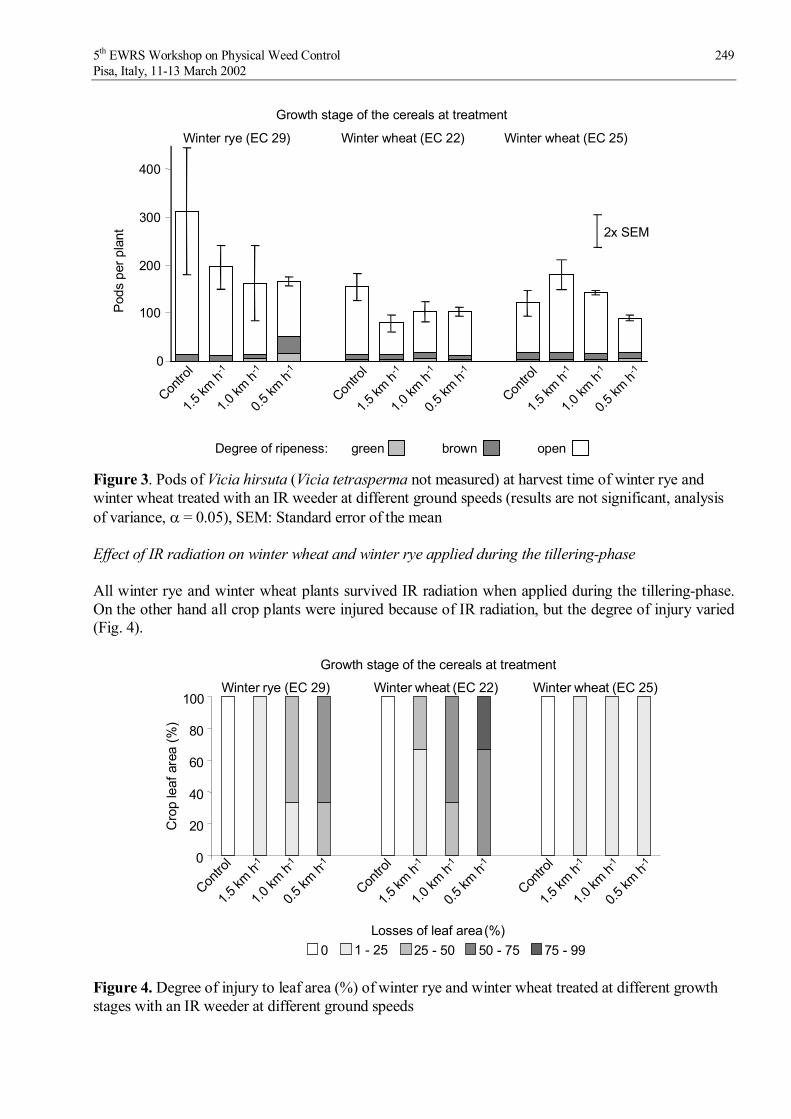
5th EWRS Workshop on Physical Weed Control 249 Pisa, Italy, 11-13 March 2002
Figure 3. Pods of Vicia hirsuta (Vicia tetrasperma not measured) at harvest time of winter rye and winter wheat treated with an IR weeder at different ground speeds (results are not significant, analysis of variance, = 0.05), SEM: Standard error of the mean
Effect of IR radiation on winter wheat and winter rye applied during the tillering-phase
All winter rye and winter wheat plants survived IR radiation when applied during the tillering-phase. On the other hand all crop plants were injured because of IR radiation, but the degree of injury varied (Fig. 4).
0
20
40
60
80
100
Cro
p le
af a
rea
(%)
0 1 - 25 25 - 50 50 - 75 75 - 99
Winter rye (EC 29) Winter wheat (EC 22) Winter wheat (EC 25)
Growth stage of the cereals at treatment
Contro
l
1.5 km
h-1
1.0 km
h-1
0.5 km
h-1
Contro
l
1.5 km
h-1
1.0 km
h-1
0.5 km
h-1
Contro
l
1.5 km
h-1
1.0 km
h-1
0.5 km
h-1
Losses of leaf area (%)
Figure 4. Degree of injury to leaf area (%) of winter rye and winter wheat treated at different growth stages with an IR weeder at different ground speeds
0
100
200
300
400
Pods
per
pla
ntWinter rye (EC 29) Winter wheat (EC 22) Winter wheat (EC 25)
2x SEM
green brown openDegree of ripeness:
Contro
l
1.5 km
h-1
1.0 km
h-1
0.5 km
h-1
Contro
l
1.5 km
h-1
1.0 km
h-1
0.5 km
h-1
Contro
l
1.5 km
h-1
1.0 km
h-1
0.5 km
h-1
Growth stage of the cereals at treatment
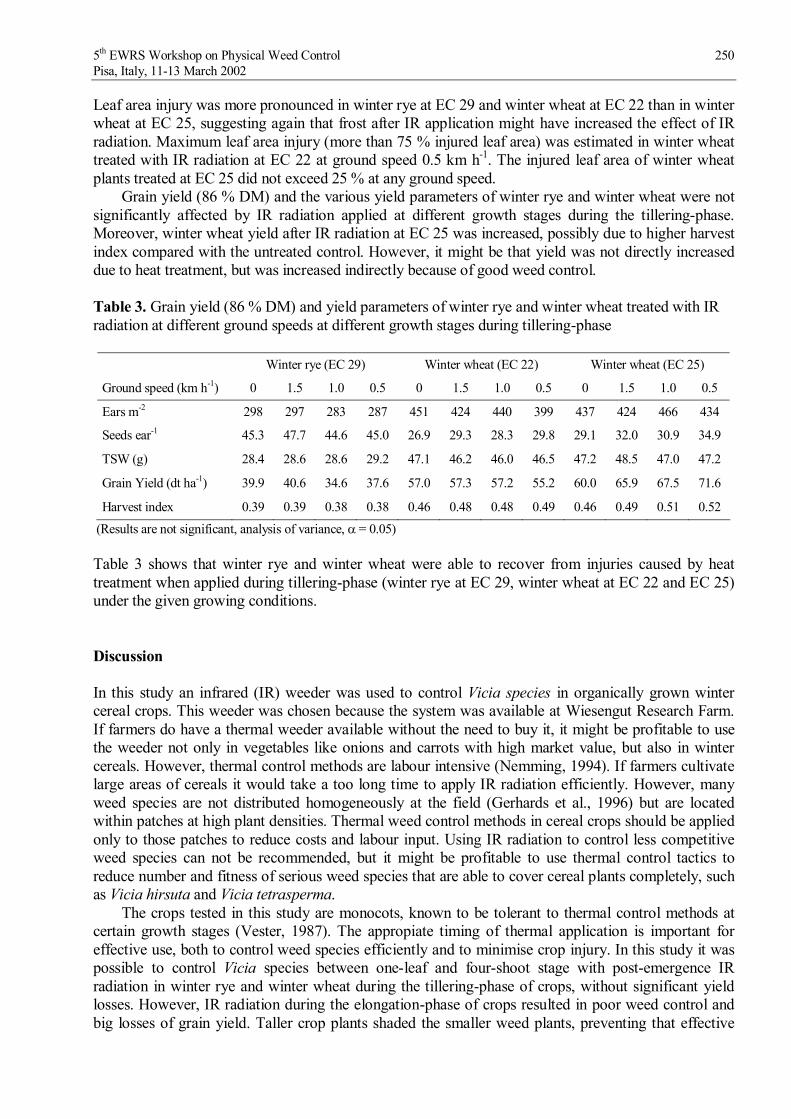
5th EWRS Workshop on Physical Weed Control 250 Pisa, Italy, 11-13 March 2002
Leaf area injury was more pronounced in winter rye at EC 29 and winter wheat at EC 22 than in winter wheat at EC 25, suggesting again that frost after IR application might have increased the effect of IR radiation. Maximum leaf area injury (more than 75 % injured leaf area) was estimated in winter wheat treated with IR radiation at EC 22 at ground speed 0.5 km h-1. The injured leaf area of winter wheat plants treated at EC 25 did not exceed 25 % at any ground speed.
Grain yield (86 % DM) and the various yield parameters of winter rye and winter wheat were not significantly affected by IR radiation applied at different growth stages during the tillering-phase. Moreover, winter wheat yield after IR radiation at EC 25 was increased, possibly due to higher harvest index compared with the untreated control. However, it might be that yield was not directly increased due to heat treatment, but was increased indirectly because of good weed control.
Table 3. Grain yield (86 % DM) and yield parameters of winter rye and winter wheat treated with IR radiation at different ground speeds at different growth stages during tillering-phase
Winter rye (EC 29) Winter wheat (EC 22) Winter wheat (EC 25)
Ground speed (km h-1) 0 1.5 1.0 0.5 0 1.5 1.0 0.5 0 1.5 1.0 0.5
Ears m-2 298 297 283 287 451 424 440 399 437 424 466 434
Seeds ear-1 45.3 47.7 44.6 45.0 26.9 29.3 28.3 29.8 29.1 32.0 30.9 34.9
TSW (g) 28.4 28.6 28.6 29.2 47.1 46.2 46.0 46.5 47.2 48.5 47.0 47.2
Grain Yield (dt ha-1) 39.9 40.6 34.6 37.6 57.0 57.3 57.2 55.2 60.0 65.9 67.5 71.6
Harvest index 0.39 0.39 0.38 0.38 0.46 0.48 0.48 0.49 0.46 0.49 0.51 0.52
(Results are not significant, analysis of variance, = 0.05)
Table 3 shows that winter rye and winter wheat were able to recover from injuries caused by heat treatment when applied during tillering-phase (winter rye at EC 29, winter wheat at EC 22 and EC 25) under the given growing conditions.
Discussion
In this study an infrared (IR) weeder was used to control Vicia species in organically grown winter cereal crops. This weeder was chosen because the system was available at Wiesengut Research Farm. If farmers do have a thermal weeder available without the need to buy it, it might be profitable to use the weeder not only in vegetables like onions and carrots with high market value, but also in winter cereals. However, thermal control methods are labour intensive (Nemming, 1994). If farmers cultivate large areas of cereals it would take a too long time to apply IR radiation efficiently. However, many weed species are not distributed homogeneously at the field (Gerhards et al., 1996) but are located within patches at high plant densities. Thermal weed control methods in cereal crops should be applied only to those patches to reduce costs and labour input. Using IR radiation to control less competitive weed species can not be recommended, but it might be profitable to use thermal control tactics to reduce number and fitness of serious weed species that are able to cover cereal plants completely, such as Vicia hirsuta and Vicia tetrasperma. The crops tested in this study are monocots, known to be tolerant to thermal control methods at certain growth stages (Vester, 1987). The appropiate timing of thermal application is important for effective use, both to control weed species efficiently and to minimise crop injury. In this study it was possible to control Vicia species between one-leaf and four-shoot stage with post-emergence IR radiation in winter rye and winter wheat during the tillering-phase of crops, without significant yield losses. However, IR radiation during the elongation-phase of crops resulted in poor weed control and big losses of grain yield. Taller crop plants shaded the smaller weed plants, preventing that effective

5th EWRS Workshop on Physical Weed Control 251 Pisa, Italy, 11-13 March 2002
doses of heat reaching Vicia species. In particular IR weeders are less effective than flame weeders in dense vegetation, where shading occurs (Ascard, 1998).
Thermal weed control in this study was only applied once. After IR application several seedlings of Vicia species emerged, reducing the long-term effect of this control method. Late emerging weeds are the main reason for repeated heat treatments (Vester, 1987). The long-term effect of flaming depends largely on the extent of weed emergence after treatment (Parish, 1990, Ascard, 1992). Sequential treatments might be a solution to overcome the problem of late emerging weeds (Ascard, 1995). However, split treatments are labour intensive and can not be recommended for use in winter cereal production. Therefore, thermal weed control should be applied later in order to contact as many weed plants as possible, although not all weed plants will be at their most susceptible stage (Ascard, 1995).
It was expected that in general thermal weed control would reduce grain yield of winter cereals. However, winter wheat treated at all ground speeds with IR radiation at growth stage EC 25 resulted in higher grain yields than the untreated control. A likely explanation is that at this growth phase winter wheat was tolerant to injuries caused by heat treatment. The harvest index of winter wheat suggested that thermal weed control reduced the vegetative growth of winter wheat, whereas grain production was enhanced. However, an adequate explanation why grain production was enhanced is not possible, because results of yield parameter assessments are contradictory. In one case (IR treatment at ground speed 1.0 km h-1) the number of ears m-2 was enhanced, in another case (IR treatment at ground speed 0.5 km h-1) the number of seeds ear-1 was enhanced (Tab. 3). However, it might be that yield was not directly increased due to heat treatment, but was increased indirectly because of good weed control. Further field trials will prove if the developmental stage EC 25 is the most heat tolerant stage and most suitable to apply thermal control methods in winter cereals. Other questions arised in this study: Winter wheat plants treated at EC 25 were only moderately injured, whereas plant injuries of winter rye treated at EC 29 and winter wheat plants treated at EC 22 were much more injured. One possible explanation is that frost after heat treatment did increase the degree of crop injuries. If so, heat treatments should not be applied, if frost is forecasted. On the other hand frost would increase the efficacy of heat treatment, because injured plants would be killed due to low temperatures, otherwise they would survive the heat treatment. Water status of plant cells can influence results of heat treatments (Ascard, 1995). However, dry matter of crop plants at the time of heat treatment was not assessed in this study. In future studies this parameter should be measured in detail. The effect of IR radiation on Vicia hirsuta and Vicia tetrasperma plants was highly variable, too. For example, IR radiation treated at 0.5 km h-1 ground speed killed plants, injured plants severely, but injured other plants only slightly. It might be that different developmental stages of Vicia species plants influenced efficacy of heat treatment. Observations suggest, that shading effects of crop plants and soil structure might influence efficacy of IR radiation. Vicia species plants were small at the time of heat treatment and were shaded by taller crop plants. Particularly, if weed plants are located in the row of the crops they could be easily shaded by crop canopy, preventing that effective doses of heat could reach them. It might be that flame weeders would overcome this problem, because they are more effective than IR weeders, when shading effects occur (Ascard, 1998). Further field trials will test the efficacy of flame weeders to control Vicia species plants in winter cereals. Moreover, soil structure can influence the extent to which heat penetrates to weed plants (Parish, 1990). Soil structure was rough after sowing, both in winter rye and winter wheat, creating slots in the soil, where Vicia plants were located. It might be that IR radiation was less effective in reaching weed plants in those slots.
Vicia hirsuta and Vicia tetrasperma plants were able to regrow from basal based buds, in spite of severe stem and leaf area injuries. The capacity of regrowth largely depends on environmental conditions like soil moisture after heat treatment (Vester, 1987). The soil after heat treatment in this study was moist for a long time, perhaps contributing to a high regrowth capacity of Vicia hirsuta and Vicia tetrasperma.

5th EWRS Workshop on Physical Weed Control 252 Pisa, Italy, 11-13 March 2002
It can be concluded that optimal application of thermal control methods should take into account growth stage of target weeds, growth stage of the crop, emerging time of weed species, regrowth capacity of target weed species and environmental conditions before, during and after heat treatment.
Acknowledgements
We thank Dr. D H K Davies from the Scottish Agricultural College for valuable comments on the manuscript. The research is part of the project ’Problemunkräuter im Organischen Landbau: Entwicklung von Strategien zur nachhaltigen Kontrolle von Ackerkratzdistel Cirsium arvense und Rauhhaariger Wicke Vicia hirsuta’ funded by the Ministry of Environment, Agriculture and Consumer protection of Province North-Rhine-Westphalia. Technical support by Johannes Siebigteroth, Henning Riebeling and Frank Täufer is greatfully acknowledged. We are indebted to the many students assisting our research team.
References
ASCARD J (1995) Effects of flame weeding on weed species at different developmental stages. Weed Research 35, 397-411.
ASCARD J (1998) Comparison of flaming and infrared radiation techniques for thermal weed control. Weed Research 28, 69-76.
DREWS S, NEUHOFF D, JUROSZEK P & KÖPKE U (2002) Einfluss von Sortenwahl, Reihenweite und Drillrichtung auf die Konkurrenzkraft von Winterweizen im Organischen Landbau. Zeitschrift für Pflanzenkrankheiten und Pflanzenschutz, Sonderheft XVIII, 527-532.
EISELE J-A (1996) Vicia hirsuta (L.) S.F. Gray – Problemunkraut des Organischen Landbaus. Zeitschrift für Pflanzenkranheiten und Pflanzenschutz, Sonderheft XV, 225-231.
EISELE J-A (1998) Strategies for the control of Vicia hirsuta (l.) s.F. Gray in Organic Farming. Med. Fac. Landbouww. Uni. Gent 63 (3a), 705-711.
GERHARDS R, WYSE-PESTER DY & MORTENSEN DA (1996) Characterising spatial stability of weed populations using interpolated maps. Weed Science 45, 108-119.
HERRMANN G &, PLAKOLM G (1991) Ökologischer Landbau. Österreich. Agrarverlag, Wien. HURLBERT SH (1984) Pseudoreplication and the design of ecological field experiments. Ecology and
Monograph 2, 187-211. JUROSZEK P (2001) Institute of Organic Agriculture, University of Bonn, Germany, unpublished. MILBERG P, ANDERSSON L & THOMSON K (2000): Large-seeded species are less dependent on light for
germination than small-seeded ones. Seed Science Research 10, 99-104. NEMMING A (1994) Costs of flame cultivation. Acta Horticulturae 372, Engineering for Reducing
Pesticide Consumption & Operator Hazards, 205-212. PARISH S (1990) The flame treatment of weed seedlings under controlled conditions. Crop Protection
in Organic and Low Input Agriculture, BCPC Monograph No. 45. Farnham: British Crop Protection Council, 193-196.
RADEMACHER B (1937) Gedanken zur Fortentwicklung der Unkrautbekämpfung im Getreide. Pflanzenbau 14, 1937/38, 449-465.
ROBERTS A & BODDRELL JE (1985) Seed survival and seasonal pattern of seedling emergence in some Leguminosae. Annals of Applied Biology 106, 125-132.
VESTER J (1987) Biologische Effekte des Abflammens in landwirtschaftlichen und gartenbaulichen Produkten in Dänemark. In: Geier B & Hoffmann M, eds. Beikrautregulierung statt Unkrautbekämpfung – Methoden der mechanischen und thermischen Regulierung. Alternative Konzepte 58. Karlsruhe, C.F. Müller Verlag, 153-166.

5th EWRS Workshop on Physical Weed Control 253 Pisa, Italy, 11-13 March 2002
Thermal weed control by water steam
A. Sirvydas1, P. Lazauskas , R. Vasinauskien , P. Kerpauskas
Summary
The article presents original research on thermal weed control by water steam. Steam has a high energy density and also a high heat transferring capability. Heat intensity increases 1000-2000 times in comparison to flaming by gas technology. Wet steam surrounding immediately increases temperature of plant surface tissues; the influence is destructive. The biggest yield of barley grain is received after steaming in phase of 2-3 leaves. The thermal weed control technology is based on the plant thermoenergy exchange at high temperatures. This technology uses the thermomethod for disturbing or pulling off the vital functions of the over-ground part of a plant. The energy exchange between a plant and its environment is a continuous process. The energy balance allows determining the individual members of the balance, which have a different influence on the plant surface temperature in a high - temperature environment.
Introduction
The thermal weed control technology by high temperature water steam is a new and very promising one. The essence of the matter is that water steam thermodynamics quality in plant media may change and is accompanied by change of convection heat exchange intensification from 1000 to 2000 times. This unusually big change is decisive for weed control by water steam efficiency and economy.
Continuous energetic changes go on between plant and environment, where radiation, heat, electromagnetic and ionization radiation take place. Trying to determine the influence of high temperature environment on a plant energy balance of a plant (organ) should be analyzed. It depends upon a lot of factors and mainly upon physical and thermo dynamical properties of plant environment, physiological functions of plant organ, geometrical form of an organ, plant adaptation to conditions of the examined environment. Plant energy balance in specially created high temperature environment helps to determine the research direction creating effective means of thermal weed control. On the other hand, it is important to identify the influence of basic factors to be strengthened or weakened for the purpose of thermal plant destroying. A theoretical foundation of high temperature environment creation possibilities for using weed control equipment that is effective in ecological agriculture is necessary.
Aim of the work
The work aims to analyze the influence of high temperature media on a plant; to form usual energy balance of a plant; to analyze plant organ energy balance; to determine energy balance of plant organ in high temperature environment; to elucidate the basic factors, which determine energy balance of a plant; to analyze energetic possibilities of a plant to adapt to unfavorably high
Correspondence: 1Sirvydas A., department of Heat and Biotechnology Engineering, Lithuanian University of Agriculture. 4324 Kaunas-Akademija, Lithuania. Tel. (+370)-7- 397517, email: [email protected] P., Department of Soil Management, Lithuanian University of Agriculture. 4324 Kaunas-Akademija, Lithuania. . tel. (+370)-7-397129,
email: [email protected]

5th EWRS Workshop on Physical Weed Control 254 Pisa, Italy, 11-13 March 2002
temperature environment; to investigate theoretical possibilities of effective weed control technology creation in ecological agriculture and to present its theoretical foundations.
Materials and Methods
Estimation of the thermal processes in the plant
At present thermal weed control based on gas burning is used. The economical efficiency of this process is very low and reaches only 1-2 . The other heat goes to technological loss or loss to the environment. Which kind of high temperature media (moist air, hot water or water steam) is most widely applied for thermal weed control, depends upon future technological studies, scientifical substantiation and most important, the economy of the machinery (CESNA J, at all (2000)).
The process of heat restitution of high temperature media depends upon the thermokinetical features of the media. Analyzis of this process shows that the temperature in heat media surrounding a plant is constant tp const. At the initial moment the surface temperature of a plant stem also is constant ts1
const, until it is not affected by steam of a plant temperature media. At the initial moment of high temperature media influence, approaching to the surface of a plant
organ, there is a consecutive temperature fall to the temperature of a plant ts surface as shown in the scheme A (fig. 1). At this moment the expenditure of heat is the greatest because of the difference of the temperatures (tg-ts) between high temperature media and the surface of plant tissues. The amount of the given back heat g(w) to the tissues of a plant surface F (m2) is found:
q aF(tf-ts) (1)Everything that is not clear and difficult to defer to in this process is hidden in the coefficient of
given back heat W/(m2.K). This constant is particularly compound and depends upon many variable factors. The characteristic feature is that this constant depends upon physical – thermodinamical parameters and defines the intensity of process of this given back heat. Orientative weaning is presented in table 1.
Table 1. Orientative meanings of the coefficient W/(m2.K) of given back heat (INCROPERA F.P., DEWITT D.P. (1981), DROBAVICIUS A. at all (1974)).
High temperature media heat affects a plant W/(m2.K)Air, burning gas, overheat steam Water Damp eater steam in the process of condensation
5-50200-3000
5000-100000
At using flaming by gas in thermal weed control the temperature difference (tg-ts) is greater and it reaches 400-900 0C. At the same moment the temperature of the water and damp water steam used for weed control (tg-ts) is only about 90 0C. In spite of high temperature the used method of flaming by gas, the transfused steam q to the tissues of the plant remain 200 times less than condensation water steam and about 5 times less than hot water (the transpiration of a plant is not estimated) (Sirvydas A. Cesna J. (2000)).
When heat is provided to a plant the temperature of its surface rises and reaches ts2. The difference between the temperatures of the media and the surface of the plant (tf-ts2) decreases completely. The change (alteration) of the temperature ts1 ts2 on the surface of the plant in the heating process is shown in the scheme B (fig. 1). When the temperature on the surface of the plant in ts2, the effectiveness of the process of thermal weed control depends upon the speed at which the temperature
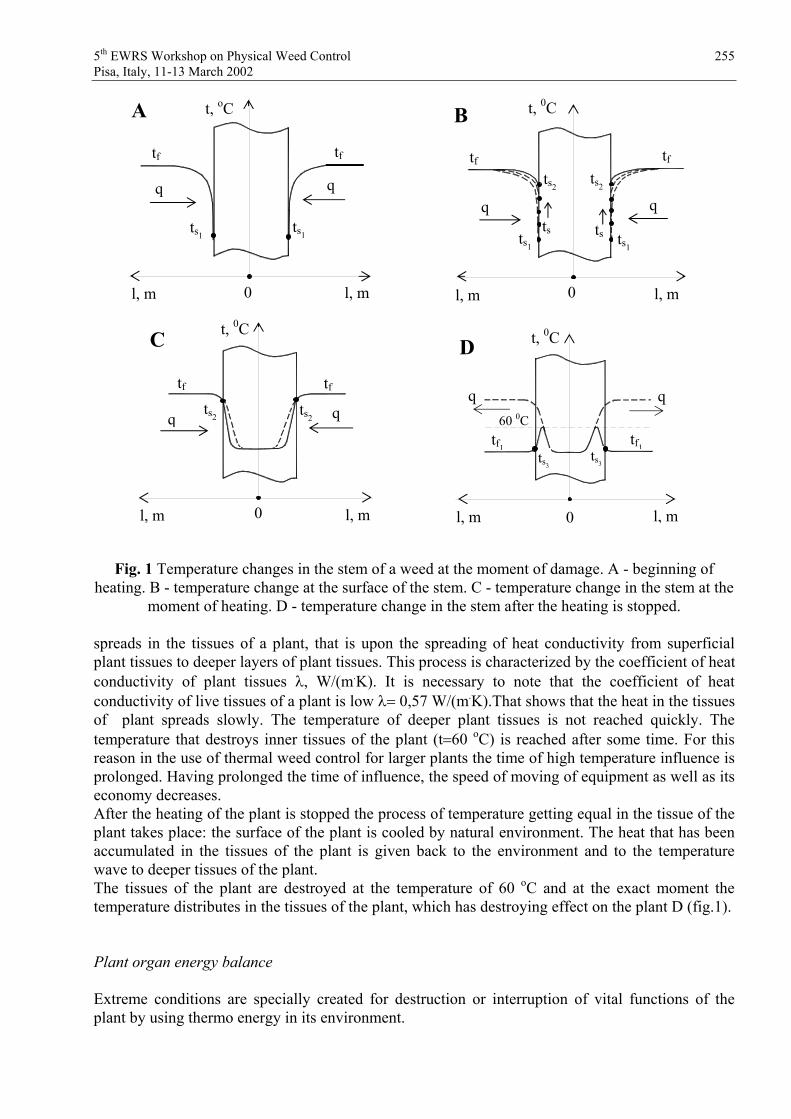
5th EWRS Workshop on Physical Weed Control 255 Pisa, Italy, 11-13 March 2002
Fig. 1 Temperature changes in the stem of a weed at the moment of damage. A - beginning of heating. B - temperature change at the surface of the stem. C - temperature change in the stem at the
moment of heating. D - temperature change in the stem after the heating is stopped.
spreads in the tissues of a plant, that is upon the spreading of heat conductivity from superficial plant tissues to deeper layers of plant tissues. This process is characterized by the coefficient of heat conductivity of plant tissues , W/(m.K). It is necessary to note that the coefficient of heat conductivity of live tissues of a plant is low 0,57 W/(m.K).That shows that the heat in the tissues of plant spreads slowly. The temperature of deeper plant tissues is not reached quickly. The temperature that destroys inner tissues of the plant (t 60 oC) is reached after some time. For this reason in the use of thermal weed control for larger plants the time of high temperature influence is prolonged. Having prolonged the time of influence, the speed of moving of equipment as well as its economy decreases. After the heating of the plant is stopped the process of temperature getting equal in the tissue of the plant takes place: the surface of the plant is cooled by natural environment. The heat that has been accumulated in the tissues of the plant is given back to the environment and to the temperature wave to deeper tissues of the plant. The tissues of the plant are destroyed at the temperature of 60 oC and at the exact moment the temperature distributes in the tissues of the plant, which has destroying effect on the plant D (fig.1).
Plant organ energy balance
Extreme conditions are specially created for destruction or interruption of vital functions of the plant by using thermo energy in its environment.
ts1
tf tf
t, oC
l, m l, m
ts1
A
0
q q
ts1
ts
ts2
l, m l, m
ts1
tf tf
t, 0C
B
ts2
ts
0
C
ts2
t, 0C
l, m l, m
tftf
ts2
0
60 0C
q
ts3
l, m
t, 0C
l, m
tf1tf1ts3
D
0
q

5th EWRS Workshop on Physical Weed Control 256 Pisa, Italy, 11-13 March 2002
For examination of these high temperature conditions energy balance of organ or part of the plant has been created. Plant organ energy balance equation can be written in the following way:
.0vptaflaidtršaplaplfatspsp QQQQQQaQaQQQ (2)
This equation shows that the organ or part of the plant receives energy that comes from radiating source (Qsp) and is reflected (Qatsp) from other bodies. The plant receives energy as infrared radiation from environment and atmosphere (Qapl). This energy is partially absorbed. Parts of absorbed physiological and long wave energy are pointed by af and aapl coefficients respectively. The plant receives or gives back its energy for convectional heat exchanges with environment (Qs),and uses the energy for transpiration (Qta), passes the heat to distant tissues by conduction (Qlaid),uses it for photo chemical reactions and other endothermic processes (Qf). Thermo accumulation (Qta) goes on in the plant tissues.
Plant energy balance in hot gas media
All members of the energetic balance of the plant have specific influence. According to the available information on energetic balance of the plant in hot gas surroundings the following equation can be written:
.0vptršs QQQQQ (3)
Having extended the equation (3):
.0105100100 1
441 wrwttTTCQ a
aot (4)
Here t the supposed degree of blackness of the investigated bodies (a plant or a weed destruction equipment) system (DROBAVICIUS A. et all (1974)); T1, t1 the temperature for weed killing equipment, K 0C; Ta , ta surface temperature of the plant organ K, 0C, w – the intensity of transpiration kg/(m2s).The equation (4) shows that surface of the plant gets the heat through radiation and convection. Considering the convection as the main heat exchange element, total specific heat flow for a plant (MILENSKIS N. et all (1968)) is as follows:
aspKSš ttQQ 1)( , (5) Here sp heat return through radiation coefficient, K heat return through convection coefficient.
If K+ sp= 1 (here 1 general heat return coefficient), then, (5) equation gets the following expression:
10511 rwtt a . (6)
A water evaporation heat in the investigated conditions is r = 2256 kJ/kg (DROBAVICIUS A. et all (1974)). So, (r+105) 2361 kJ/kg. Then plant heat balance equations for high temperature air or burning products surroundings take the following final expression:
.236111 wtt a (7)
The plant adapts itself to the environmental conditions. The »resistance« to unfavourable positive energy balance is manifested by growing transpiration intensity. As grass flour production experiments show, in high temperature drying chamber the temperature of grass mass, having

5th EWRS Workshop on Physical Weed Control 257 Pisa, Italy, 11-13 March 2002
heated it or 15-25 min., increases only up to 50-64°C. This shows that having increased transpiration, the plant uses surplus heat from environment, and, therefore, the tissues temperature decreases. A weed experiences analogical conditions, when hot air or burning product high temperature environment is used to kill it.
Plant tissue energy balance in humid water steam environment
Equation (8) describes all possible energy exchange in the plant. In case of plant tissue energy balance in extreme condition, under the influence by condensating 100°C temperature humid steam, some members of the balance can be rejected, as they have too little or no influence. Having this analysis in consideration, plant energy balance in humid water steam environment can be expressed by the following equations:
,taš QQQ (8)
.11 apaga ttMcttF . (9)
They equations show, that under humid water steam influence (normal conditions =100°?), the plant has no possibilities of physiological resistance to thermal influence of the steam. As it is shown in (9) equation there are no physiological possibilities to reduce plant heat surplus, which forms from condensating steam on plant organs surface. 100°C steam should influence surface tissues of plant surface in a moment and kill them. This statement is corroborated by (9) equation, which shows, that all heat received by the plant from environment (steam) goes to the increase of plant tissues temperature.
Generalisation of findings
Plant energy balance in hot gas surrounding equation (3) and plant organ energy balance in humid water steam environment equation (9) are used in modelling temperature field spreading in plants tissues. Having solved differential equations temperature change in plant tissues under different possible weed killing conditions is calculated. Calculation data shows the temperature change in plant surface layer when heating with steam 50000 W/(m2 K) (continuous line) and with water (dotted line), when w 0 30 W/(m2 K) (Fig. 2). Theoretical calculation of unstable thermal process (Fig. 2; curves 7, 8) says, that in high temperature gas surrounding is not good for weed killing, however, it is researched and applied all over the world (BERTRAM A. (1996), HEGEH. (1990), HOFFMANN M. (1989), ASCARD J. (1995). Temperature change in the weed stem (diameter 3,1 mm) centre (Fig. 3; curve 2) is presented. During the time of the experiment hot air stream temperature was about 350oC (3 Fig. 3 curve), environment temperature - 10,6oC. Curves in Fig. 3 show little increase of plant stem temperature in centre (1,55 mm deep from surface) during 10 seconds. Sudden, in comparison with the experimental curve (Fig.3; curve 2), increase of temperature in 1,5 mm depth from the surface, which is theoretically calculated (Fig. 2; curve 7), can be explained by failing to take in to account the transpiration influence, as w=0. This has been done to simplify the calculation. Naturally, it has influenced the calculation results, - in Fig. 2 curves 7 and 8 (dotted) are significantly lower and are slightly different from the curve of 20oCenvironment air temperature.
Having heated with air (350oC, 10 s) slight changes on plant surface only from the stream flow side are observed. Theoretical data shows (SIRVYDAS A. P. 1993) that high temperature gas stream does not create effective thermal weed control equipment for organic agriculture.
Temperature change in the surface layer of a plant
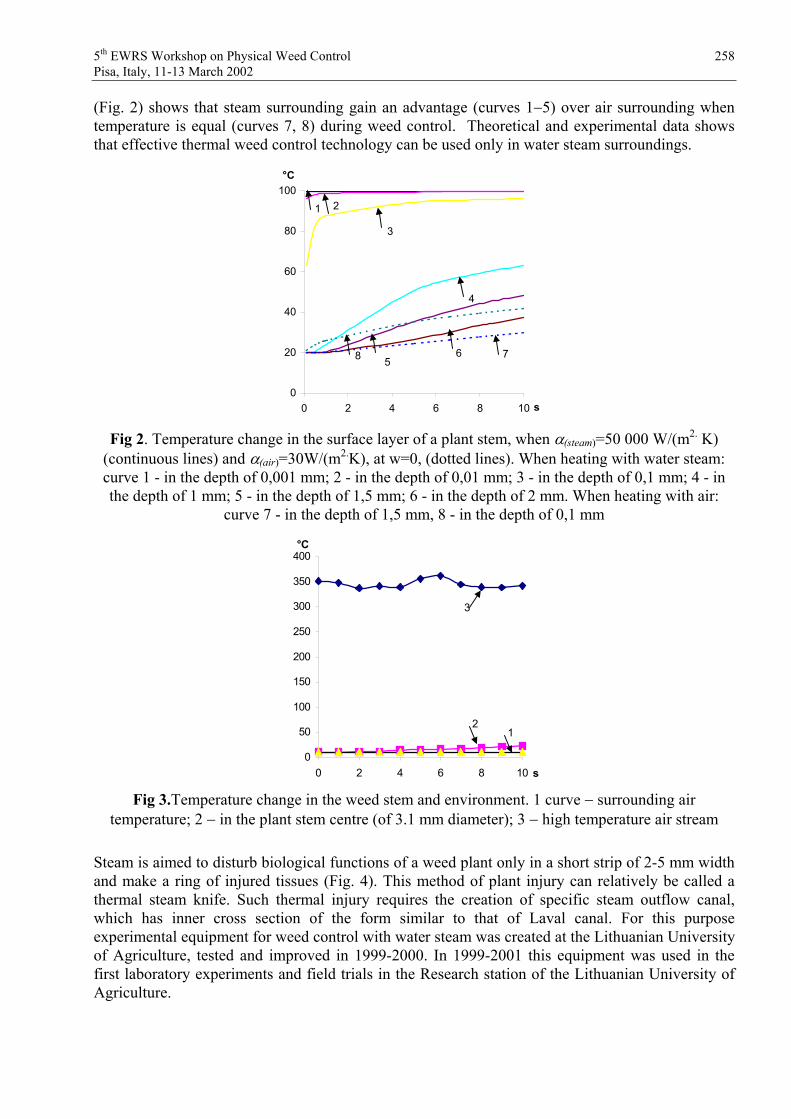
5th EWRS Workshop on Physical Weed Control 258 Pisa, Italy, 11-13 March 2002
(Fig. 2) shows that steam surrounding gain an advantage (curves 1 5) over air surrounding when temperature is equal (curves 7, 8) during weed control. Theoretical and experimental data shows that effective thermal weed control technology can be used only in water steam surroundings.
0
20
40
60
80
100
0 2 4 6 8 10
1 2
3
4
56 78
s
°C
Fig 2. Temperature change in the surface layer of a plant stem, when (steam)=50 000 W/(m2. K) (continuous lines) and (air)=30W/(m2.K), at w=0, (dotted lines). When heating with water steam: curve 1 - in the depth of 0,001 mm; 2 - in the depth of 0,01 mm; 3 - in the depth of 0,1 mm; 4 - in the depth of 1 mm; 5 - in the depth of 1,5 mm; 6 - in the depth of 2 mm. When heating with air:
curve 7 - in the depth of 1,5 mm, 8 - in the depth of 0,1 mm
0
50
100
150
200
250
300
350
400
0 2 4 6 8 10
12
3
°C
s
Fig 3.Temperature change in the weed stem and environment. 1 curve surrounding air temperature; 2 in the plant stem centre (of 3.1 mm diameter); 3 high temperature air stream
Steam is aimed to disturb biological functions of a weed plant only in a short strip of 2-5 mm width and make a ring of injured tissues (Fig. 4). This method of plant injury can relatively be called a thermal steam knife. Such thermal injury requires the creation of specific steam outflow canal, which has inner cross section of the form similar to that of Laval canal. For this purpose experimental equipment for weed control with water steam was created at the Lithuanian University of Agriculture, tested and improved in 1999-2000. In 1999-2001 this equipment was used in the first laboratory experiments and field trials in the Research station of the Lithuanian University of Agriculture.

5th EWRS Workshop on Physical Weed Control 259 Pisa, Italy, 11-13 March 2002
Fig. 4. Theoretical model and practical results of a plant injury ring by water steam
The boilers of 2,5-15 kW power working on electricity and gas were used in the production of humid water steam. Steam of 100 0C temperature was directed to the plant zone. Localized thermal injury of plant stem was used for weed killing.
In laboratory experiments barley and weeds were grown in pots filled with soil, and their sensitivity at different age periods to steam was analyzed. One pot-variant width was 40x50 cm, six repetitions. In field trial the experiment on weed control with water steam in barley crop was carried out in the plots of 4,05 m2 in six repetitions. Weed samples were taken from 10 sites of 20x30 cm plots of every field. After drying the weeds were analyzed by species composition, number and mass. Data was processed using ANOVA.
Results
Before the installation of field trials on weed control with water steam, barley sprouts sensitivity to water steam was investigated under laboratory conditions. In the laboratory conditions barley was sown every two days in seven terms. In one pot-replication one line of barley (variant) was sown in randomized order on every second day. Thus, at the time of steaming every pot-replication had barley sprouts of different size and seven sowing terms. In laboratory experiment steam for barley sprouts steaming was used when the barley of the latest sowing (7th variant) started germinating and their first leave was about to appear (Phase 9 according to ZADOKS (1974) scale). At that time in the first variant the barley plants that had been sown 12 days earlier had two leaves (11th phase) and were of 10-12 cm height, in the second variant – 8-10 cm height (11th phase), in the third – 6-8 cm (11th phase), in the fourth – 3-6 cm (10th phase), etc. Having treated all barley sprouts in the experiment with water steam of 100 0C temperature for 1,5 seconds no sudden or significant changes were observed. However, some higher stems of sprouts leaned or even dropped in several minutes. After 24 hours after steaming the injures became more significant, some leaves and even plants dried off. The barley sprouts that had been sown earlier – the first, second and third variants – were the most strongly influenced. In these variants the entire over-ground part of a plant was injured. In later sown variants – fourth – sixth – barley plants were partially injured, only some of them leaned down. In the seventh variant where the germination of barley was just starting no significant injures caused by steam were observed.
After twelve days period after steaming the influence of steam on barley was established again by calculating the percentage of barley that had survived steaming. The biggest number of barley sprouts (91,0 %) survived in the seventh variant, where at the time of steaming barley was about to germinate. In the sixth variant 87,1% survived, in the fifth one – 83,9%, in the fourth – 64,7%, in the third – 40,2%, in the second – 20,0%, in the first – 3,53%. After the experiment the barley sprouts were dried and weighed. Weight data was used in the calculation of barley dry mass

5th EWRS Workshop on Physical Weed Control 260 Pisa, Italy, 11-13 March 2002
dependency on the age of barley sprouts, at the time of steaming (Fig. 5). The data showed the barley sprouts to be sensitive to steaming, the bigger sprouts the more sensitive they were to water steam of 100 0C temperature. Therefore, the equipment for weed control with water steam in barley crop can be used for steaming of the entire crop only before barley germination. After barley germination weeds in the spaces between rows can be steamed only having ensured barley plants protection against negative influence of steam. This was done in the field trial.
Barley Sprouts mass (mg / treatment)
Age of barley sprouts in days0 2 4 6 8 10 12 14
0
100
200
300
400
500
600
y = 467,203·x-0,52419; R2 = 0,9234 t = 15,17
Fig. 5. Dependency of barley sprouts sensitivity to water steam on their age
Discussion
In field trial where the possibilities of steam use in weed control in barley crop were investigated the barley was sown at bigger distances of (20 cm), which made the use of steaming equipment possible. Special tin plates protecting barley plants against steam were added to the manual equipment of steaming. In this trial the control variant was without steaming and 5 variants differed in the time of steam application. (Fig. 6) The most efficient weed mass reduction was observed after steaming in the phase of 2-3 leaves – in the third variant, when barley was protected against steam. In this variant the weed mass was reduced by 44 %. Two factors were active here: the steam effectively killed young weed sprouts while the protected barley grew and smothered them. In this variant the barley yield was the biggest one, by 6,67dt/ha higher than that in the control. In the other three variants barley was not protected against negative influence of steam used in weed steaming, therefore, some of them were injured by steam and thinned. Therefore, barley grain yield in those variants was significantly lower (LAZAUSKAS P. (1993)).

5th EWRS Workshop on Physical Weed Control 261 Pisa, Italy, 11-13 March 2002
The fact that in this experiment steam had stronger influence on perennial weeds than on annual ones should be taken into consideration in the evaluation of steam influence on barley crop weediness structure.
Control without steaming
Clustering phase,barley protected
2-3leavesphase,barley protected
2-3 leaves phase,only spacesbetweenrowssteamed, barley not protected
2-3 leaves phase,entire area steamed, barley not protected
Clustering phase,barley-not protected
Fig. 6. Influence of different time of weed steaming on protected and not protected barley grain yield, (dt/ha)– dark squares (LSD05=6.67) and on weed mass (g/m2 )
Conclusions
1. The analysis of thermal processes in a plant energy balance in specially created high temperature environment with the purpose to destroy the plant thermally brings to the following statements:
Energy balance members have different influence on plant organ surface temperature. The plant organ surface temperature is mainly determined by convective heat exchange and plant transpiration.
When plant uses surplus heat that is received from high temperature gas surrounding, transpiration increases, therefore, there is no sudden surface tissues temperature increase.
Water steam surrounding immediately increases the temperature of plant surface tissues, it has a destructive influence.
2. Field, laboratory and theoretical studies bring to the statement that in efficient thermal weed control technology heat can be used only in water steam surrounding.
0
1 0
2 0
3 0
4 0
5 0
0 0 . 1 0 . 2 0 . 3p l a n t d r y m a s s ( g )
num
ber
of p
lant
s
n o n - u p r o o t e du p r o o t e d

5th EWRS Workshop on Physical Weed Control 262 Pisa, Italy, 11-13 March 2002
List of literature
ASCARD J. (1995) Thermal Weed control by Flaming //Dissertation Swedish University of Agricultural Sciences, Department of Agricultural Engineering. Report 200.
BERTRAM A. (1996) Geräte und verfahrenstechnische Optimierung der thermischen Unkrautbe-kämfung. Weihenstephau, S. 196.
CESNA J., SIRVYDAS A., KERPAUSKAS P., VASINAUSKIENE R. (2000) Investigation of thermal weed control in high-temperature media. Environmental Engineering-. VIII, Nr 1, 28-35.
DROBAVICIUS A. at all (1974) Bendroji šilumin technika Vilnius: Mintis, 470 p.HEGE H. (1990) Thermische Unkrautbekämpfung // Gemüse, Nr 7. S. 344 346.HOFFMANN M. (1989) Abflammtechnik // KTBL, Schrift 331, S. 243.INCROPERA F.P., DEWITT D.P. (1981) Fundamentals of heat transfer, New York, Chichester,
Brisbane, Toronto, Singapore, 819. LAZAUSKAS P. (1993) The law of crops performance as a basis of weed control, -8 th. EWRS
Symposium, "Quanttitative approaches in weed and herbicide research and their application",-Braunschweig,71-77.
MILENSKIS N. at all (1968) Bendroji šilumin technika. Kaunas, p. 106.SIRVYDAS A. P. (1993) Termoenerginiai procesai augaluose ir j aplinkoje. Kaunas: Akademija.
318 p. SIRVYDAS A. P., CESNA, J (2000) Energy processes modeling in weed tissues and weed control.
Agricultural engineering, Research papers 32, Raudondvaris, P 53-72.SIRVYDAS, A.P. (1993) Termoenergetiniai procesai augaluose ir j aplinkoje. Kaunas-LZUA, 320. ZADOKS J.C., CHANG T.T., KONZAK, C.F (1974) A decimal code for the growth stages of cereals.
Weed Research, Volume 14, Nr. 6., 415 – 421.

5th EWRS Workshop on Physical Weed Control 263 Pisa, Italy, 11-13 March 2002
Methodology and research in physical and cultural weed control

5th EWRS Workshop on Physical Weed Control 264 Pisa, Italy, 11-13 March 2002
Effect of plant dry mass on uprooting by intra-row weeders
D.A.G. Kurstjens1, G.D. Vermeulen2 & P.O. Bleeker3
1 Wageningen University, Soil Technology Group, P.O. Box 43, 6700 AA Wageningen, The Netherlands. [email protected]
2 Institute of Agricultural and Environmental Engineering (IMAG), P.O. Box 43, 6700 AA Wageningen, The Netherlands. [email protected]
3 Applied Plant Research (PPO), P.O. Box 430, 8200 AK, Lelystad, The Netherlands. [email protected]
Introduction
The effectiveness of intra-row mechanical weed control depends on crop and weed growth stages, machine adjustments and soil conditions. We aim to develop a set of field assessments to quantify the performance of selective mechanical weeders such as weed harrows, torsion weeders and finger weeders. This measurement protocol should allow analysis of plant, soil, weather and machine effects and allow for better comparisons between sites and times. The method to quantify the percentage uprooted plants as related to plant dry mass presented in this paper is a component of this envisioned protocol.
Materials and Methods
Immediately after mechanical weeding, uprooted and non-uprooted plants were separately collected from 5-cm wide intra-row zones. The total length of the excavated zone per plot ranged from 2-10 m, depending on weed density. In the laboratory, collected plants were washed, separated per species, dried for 24 hours at 105°C and then weighed individually. Based on sorted lists of plant dry weight and uprooting status per species and implement, the relationships between plant dry weight and %uprooting were plotted, with each point representing 9-31 plants.
Data were gathered from field experiments with torsion weeders, finger weeders and a spring tine harrow on sandy and clay soil, at two subsequent treatment dates.
Results
The first mechanical weeding was generally more effective than a second pass 9-10 days later (Fig. 1). This was partially related to the increased median dry weight of all weeds (sand 9/16: 0.003 g; sand 19/6: 0.017 g; clay 24/5: 0.025 g; clay 2/6: 0.070 g). In most situations, the variation in plant dry mass within species was so large (variation coefficients ranging from 1.2 to 2.1) that uprooting effects at different sites and times can only be compared sensibly using plants of approximately the same size (Fig. 2).
When taking plant mass into account, torsion weeders were more effective than the weed harrow or finger weeders, except on clay soil (Fig. 3). On sandy soil, the first torsion weeding was more effective than the second with Poa annua (Fig. 3A, B), whereas points of Solanum nigrum and Stellaria media were approximately on the same curve (Fig. 3C, E).
Linear relationships between logit-transformed uprooting percentages and plant dry mass were fitted to individual plant data, using IRREML in Genstat 5. Maximum weed uprooting percentages (at zero plant weight) below 100% may indicate a less intense or an irregular disturbance of the intra-row topsoil. The plant mass at which a certain percentage is uprooted could be used to

5th EWRS Workshop on Physical Weed Control 265 Pisa, Italy, 11-13 March 2002
compare effects of site characteristics or implement adjustments. The slope of the curve may be related to the selective uprooting ability of the weeders.
Discussion
As the sensitivity of weeds to uprooting varied considerably within populations present in the field, it is sensible to take account of this variation when comparing mechanical weed control effectiveness between sites and times. If soil conditions and machine adjustments are adequately recorded as well, regression models that include individual plant dry mass may be used to analyse these effects.
��������������������������������������������������������������������������������
����������������������������������������
����������������������������������������
��������������������������������������������������������������������������������
����������������������������������������������������������������������������������������������������
������������������������������������������������������������������������������������������
����������������������������������������������������������������������0
20
40
60
80
100
torsion weeder finger weeder weed harrow
% u
proo
ted
wee
dssand 9-6
�����sand 19-6�����
clay 24-5�����
clay 2-6
Figure 1. The uprooting effect of mechanical weeders on different soil types and treatment dates. Means of all species together with mean standard errors.
0
10
20
30
40
50
0 0.1 0.2 0.3plant dry mass (g)
num
ber
of p
lant
s
non-uprooteduprooted
Figure 2. Example frequency distribution of Solanum nigrum plant dry mass collected directly after finger weeding and weed harrowing on sandy soil at 19/6. The corresponding relationship between plant dry mass and uprooting is depicted in Fig. 3D.
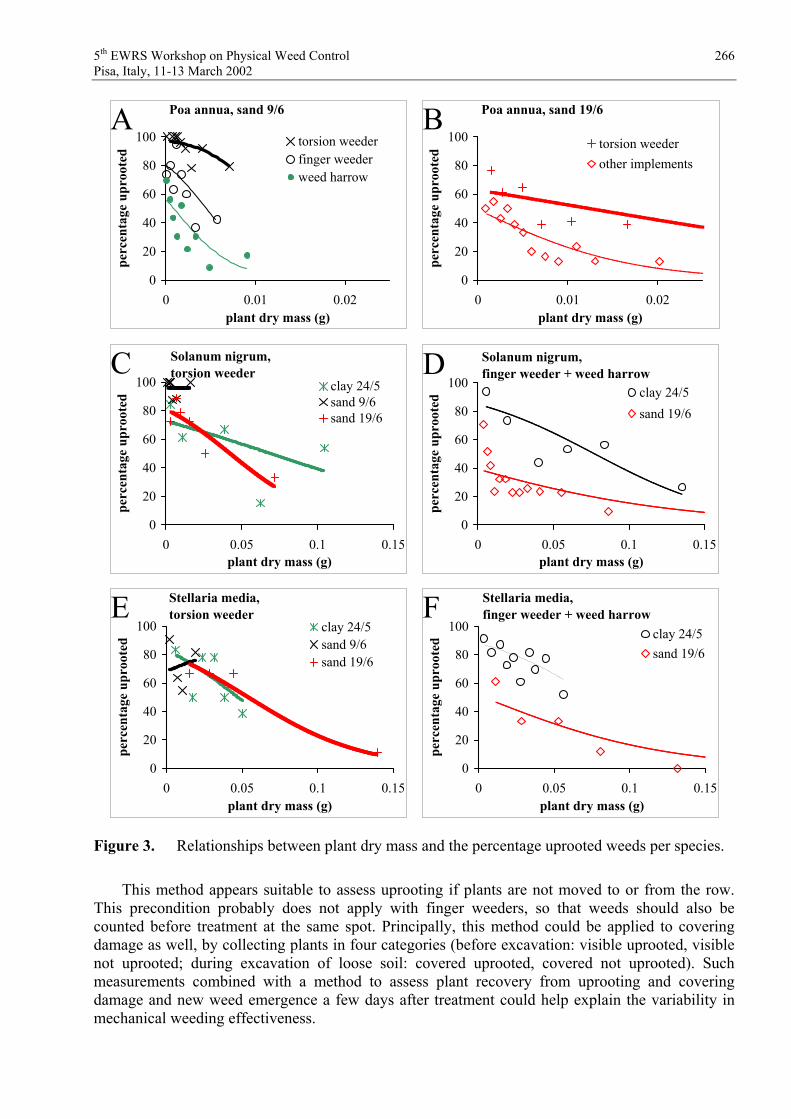
5th EWRS Workshop on Physical Weed Control 266 Pisa, Italy, 11-13 March 2002
This method appears suitable to assess uprooting if plants are not moved to or from the row. This precondition probably does not apply with finger weeders, so that weeds should also be counted before treatment at the same spot. Principally, this method could be applied to covering damage as well, by collecting plants in four categories (before excavation: visible uprooted, visible not uprooted; during excavation of loose soil: covered uprooted, covered not uprooted). Such measurements combined with a method to assess plant recovery from uprooting and covering damage and new weed emergence a few days after treatment could help explain the variability in mechanical weeding effectiveness.
0
20
40
60
80
100
0 0.01 0.02plant dry mass (g)
perc
enta
ge u
proo
ted
torsion weederfinger weederweed harrow
Poa annua, sand 9/6A
0
20
40
60
80
100
0 0.05 0.1 0.15plant dry mass (g)
perc
enta
ge u
proo
ted
clay 24/5sand 9/6sand 19/6
Solanum nigrum,torsion weederC
0
20
40
60
80
100
0 0.05 0.1 0.15plant dry mass (g)
perc
enta
ge u
proo
ted
clay 24/5sand 9/6sand 19/6
Stellaria media,torsion weederE
0
20
40
60
80
100
0 0.01 0.02plant dry mass (g)
perc
enta
ge u
proo
ted torsion weeder
other implements
Poa annua, sand 19/6B
0
20
40
60
80
100
0 0.05 0.1 0.15plant dry mass (g)
perc
enta
ge u
proo
ted clay 24/5
sand 19/6
Solanum nigrum,finger weeder + weed harrowD
0
20
40
60
80
100
0 0.05 0.1 0.15plant dry mass (g)
perc
enta
ge u
proo
ted clay 24/5
sand 19/6
Stellaria media,finger weeder + weed harrowF
Figure 3. Relationships between plant dry mass and the percentage uprooted weeds per species.
5th EWRS Workshop on Physical Weed Control 267 Pisa, Italy, 11-13 March 2002
Evaluation of Physical Weeders
J. Meyer 1), N. Laun2), B. Lenski2)
1) Technische Universität München,Department für Biogene Rohstoffe und Technologie der Landnutzung,
Fachgebiet Technik im Gartenbau, Am Staudengarten 2, 85354 Freising-Weihenstephan e-mail: [email protected]
2) Lehr – und Versuchsbetrieb, Queckbrunnerhof, Dannstadterstraße 91, 67105 Schifferstadt;e-mail: [email protected] e-mail: [email protected]
Abstract
Weed control is one of the most labour consuming tasks in organic farming. Therefore, farmers have a tremendous interest in an effective mechanisation of weed control.
The “Weihenstephaner Trennhacke (Split hoe)” is a modified mechanical hoe. Results demonstrated that the Split hoe improved weed control compared to a common mechanical hoe, especially under all conditions that favour a renewed growth of the weeds (wet / crusted soil, big weeds).
The improved weed burner “Weihenstephaner Streifenabflammgerät (strip flamer)“ is characterised by a slim cover on each single row which keeps the hot air close to the ground. This allows a higher working speed and reduces the gas consumption.
In contrast to other vegetables, onions can be flamed past emergence. The available time for flaming could be influenced by a deeper seed placement and the choice of a later ripening variety. Plant damages were mainly due to the growth stage. Onion plants compensated even the complete loss of the cotyledon leaf. In the first true leaf stage crop losses were observed which increased with energy input.
Materials and methods
Two innovative implements (Split hoe, Strip flamer) for weed control in organic grown vegetables were tested in a two years period under field conditions in a region (Southwest of Germany) which is characterised by sandy loamy soils (organic matter 2%, pH 7.5), an annual precipitation of about 600 mm. A detailed description of the machinery is given by A. Bertram (1996). Trials about weeding effects were carried out in spring sown onions in randomised complete block design arrangements with 4 repeats per treatment and minimum plot sizes of 12 x 1.88 m. Plant density was about 30 to 40 plants per m of row with 4 rows per bed.

5th EWRS Workshop on Physical Weed Control 268 Pisa, Italy, 11-13 March 2002
Fig. 1: Weihenstephaner Trennhacke (Split hoe)
The “Strip flamer“ was characterised by temperature measurements conducted with the complete implement as used in the field. For most accurate results these tests were run on a paved ground to exclude any side effects, e.g. differences in soil moisture and in the ground surface.
The tests were aimed on the comparison of three burners to obtain their specific temperature features, mainly the maximum temperatures, and to specify the influence of soil particles on these temperatures. Measurements were made with four thermocouples type k. Sensors were connected to a PC and data were logged by using QuickLog PC provided by Strawberry Tree Inc. The system was adjusted to store five temperature measurements per second.
Results and Discussion
Strip flamer
Temperatures under the covers varied strongly between single burners of the same implement, which may result in varying quality of weed control. Although the burners were bought from a well known dealer, it seems to be necessary to carry out some tests about the energy output of each single burner. For technical improvements the big differences between burners should be reduced (Tab. 1).

5th EWRS Workshop on Physical Weed Control 269 Pisa, Italy, 11-13 March 2002
Tab. 1: Maximum temperatures of single burners (3 km/h) burner 2 burner 3 burner 4
Temperature (°C) 72 55 60 Standard deviation 2.9 4.0 3.7 Min. / max. (°C) 69 / 76 51 / 61 57 / 66
The influence of the driving velocity on the temperatures is shown in Tab. 2.
Tab. 2: Influence of the driving velocity on maximum temperature 2 km/h 4 km/h 6 km/h
mean Temperature (°C) 65 49 47 Standard deviation 13.9 7.8 4 Min. / max. (°C) 43 / 77 34 / 56 42 / 49
At higher driving velocities the uniformity of the temperature under the cover seems to improve. Nevertheless the temperatures were higher in the middle of the tunnel then on the sides (49°C and 42°C). Therefore the burners should be placed exactly over the middle of the row to achieve good results.
Effect of flaming on the crop
Most vegetables, except onions, can only be flamed before emergence, which limits the flaming period strongly. It could be demonstrated that culture practices can extend the available time for flaming in onions. Emergence could be delayed for 4 to 6 days by the depth of sowing (3 cm compared to 1 cm) and 3 to 4 days depending on the cultivar. Early ripeness of cultivars was linked with early emergence. When flamed post emerging, the damage of onions depended on the growth stage and the driving speed during flaming. Even the complete loss of the cotyledon leaf could be compensated in the further development of the plants. However, when the first true leaf was affected, plant losses were observed.
Fig. 2: Effect of flaming date on plant losses in onions(left: flaming 11.04.00 in the hook stage with the first true leaf visible (in parts) , right: flaming 6.04.00 early hook stage)
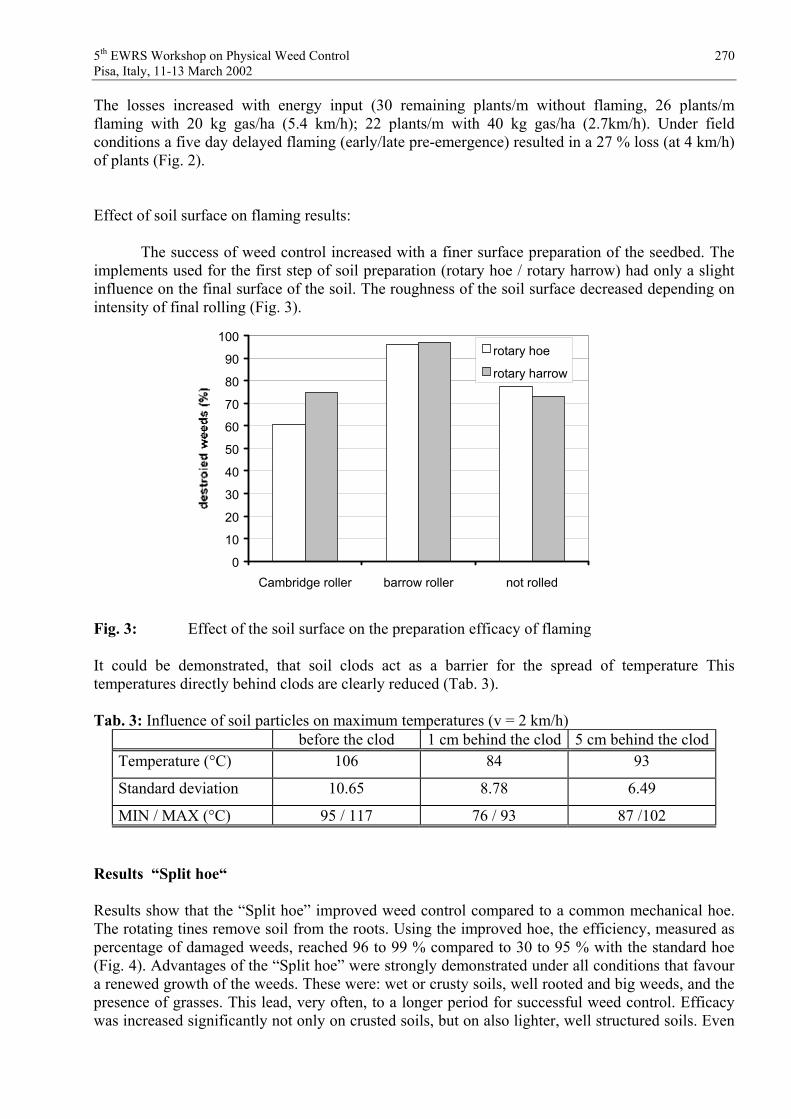
5th EWRS Workshop on Physical Weed Control 270 Pisa, Italy, 11-13 March 2002
The losses increased with energy input (30 remaining plants/m without flaming, 26 plants/m flaming with 20 kg gas/ha (5.4 km/h); 22 plants/m with 40 kg gas/ha (2.7km/h). Under field conditions a five day delayed flaming (early/late pre-emergence) resulted in a 27 % loss (at 4 km/h) of plants (Fig. 2).
Effect of soil surface on flaming results:
The success of weed control increased with a finer surface preparation of the seedbed. The implements used for the first step of soil preparation (rotary hoe / rotary harrow) had only a slight influence on the final surface of the soil. The roughness of the soil surface decreased depending on intensity of final rolling (Fig. 3).
0
10
20
30
40
50
60
70
80
90
100
Cambridge roller barrow roller not rolled
rotary hoe
rotary harrow
Fig. 3: Effect of the soil surface on the preparation efficacy of flaming
It could be demonstrated, that soil clods act as a barrier for the spread of temperature This temperatures directly behind clods are clearly reduced (Tab. 3).
Tab. 3: Influence of soil particles on maximum temperatures (v = 2 km/h) before the clod 1 cm behind the clod 5 cm behind the clod
Temperature (°C) 106 84 93
Standard deviation 10.65 8.78 6.49
MIN / MAX (°C) 95 / 117 76 / 93 87 /102
Results “Split hoe“
Results show that the “Split hoe” improved weed control compared to a common mechanical hoe. The rotating tines remove soil from the roots. Using the improved hoe, the efficiency, measured as percentage of damaged weeds, reached 96 to 99 % compared to 30 to 95 % with the standard hoe (Fig. 4). Advantages of the “Split hoe” were strongly demonstrated under all conditions that favour a renewed growth of the weeds. These were: wet or crusty soils, well rooted and big weeds, and the presence of grasses. This lead, very often, to a longer period for successful weed control. Efficacy was increased significantly not only on crusted soils, but on also lighter, well structured soils. Even
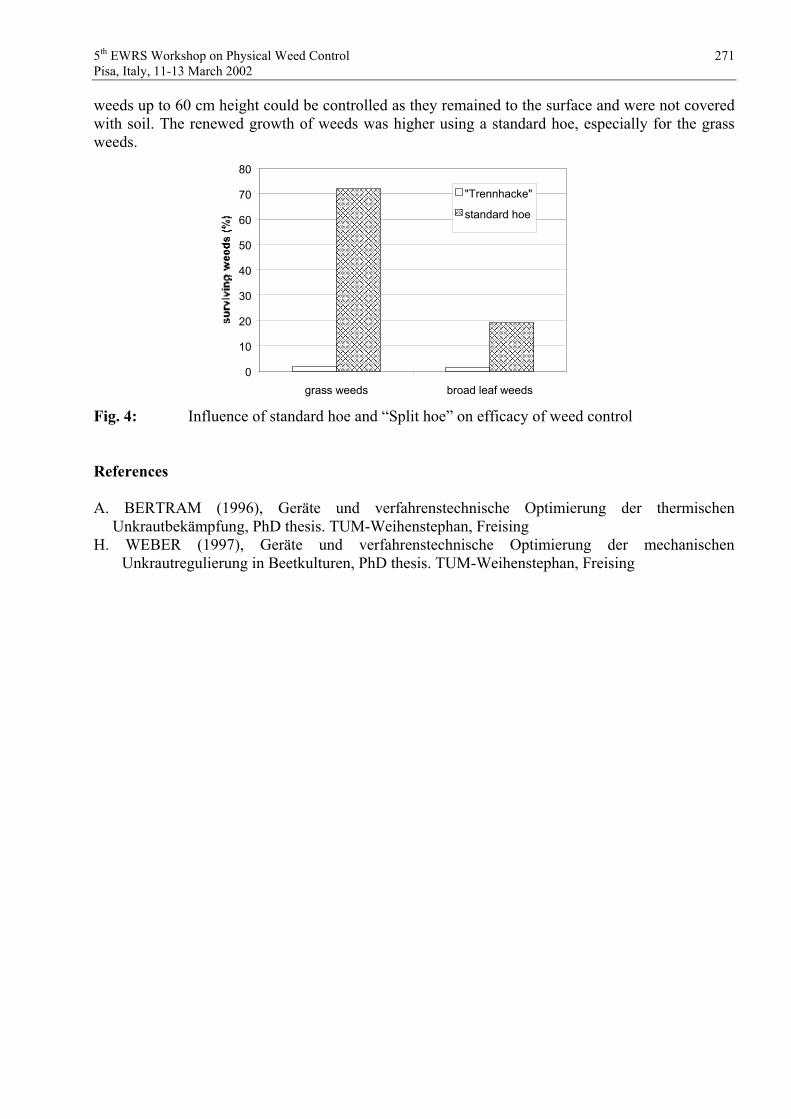
5th EWRS Workshop on Physical Weed Control 271 Pisa, Italy, 11-13 March 2002
weeds up to 60 cm height could be controlled as they remained to the surface and were not covered with soil. The renewed growth of weeds was higher using a standard hoe, especially for the grass weeds.
������������������������������������������������������������������������������������������������������������������������������������������������������������������������������������������������������������������������������������������
������������������������������������������������������������������������������������������0
10
20
30
40
50
60
70
80
grass weeds broad leaf weeds
"Trennhacke" ��������standard hoe
Fig. 4: Influence of standard hoe and “Split hoe” on efficacy of weed control
References
A. BERTRAM (1996), Geräte und verfahrenstechnische Optimierung der thermischen Unkrautbekämpfung, PhD thesis. TUM-Weihenstephan, Freising
H. WEBER (1997), Geräte und verfahrenstechnische Optimierung der mechanischen Unkrautregulierung in Beetkulturen, PhD thesis. TUM-Weihenstephan, Freising
5th EWRS Workshop on Physical Weed Control 272Pisa, Italy, 11-13 March 2002
Effect of cutting height on weed regrowth
S. Baerveldt1 and J. Ascard2
1. Swedish University of Agricultural Sciences, Department of Agricultural Engineering, P.O. Box 66, S-230 53 Alnarp, Sweden
2. Swedish University of Agricultural Sciences, Department of Crop Science, P.O. Box 44, S-230 53 Alnarp, Sweden)
Abstract
Matricaria inodora L., Chenopodium album L. and Poa annua L., grown under controlled conditions, were cut below or above the lowest growing point at various stages of development. No plants survived when they were cut under the lowest growing point, i.e. just below the cotyledons for M. inodora and C. album and just below the soil surface for P. annua. When the plants were cut off above the lowest growing point, most survived but there was significant reduction in fresh weight for all species and development stages. Thus, the cutting height required for effective weed control depends on the position of the cotyledons and growing point. The regrowth of M. inodora was slower the older the plants were at cutting. For P. annua the situation was the opposite with faster regrowth from older plants.
Introduction
There is renewed interest in mechanical weed control as an alternative or complement to chemical methods. The traditional techniques for mechanical weed control need to be improved to make them more efficient. More basic knowledge is needed about how much and in what way a plant must be damaged in order to be killed. This knowledge may become useful for developing more efficient technical equipment for mechanical weed control.
Most of the mechanical methods used today for example harrowing, hoeing and brushing cultivate the soil and control weeds by a combination of pulling and soil covering (Habel 1954, Kees 1962, Koch 1964, Rasmussen 1990, Rydberg 1993). Another way of controlling annual weeds is to cut them off. The soil does not then have to be cultivated and this can give some advantages; it can decrease soil erosion on easily eroded soils and soil moisture has less influence on the time of treatment (Estler & Nawroth 1995).
When weeds are cut, they lose a major part of their photosyntetically active biomass which gives the crop plants a competitive advantage. The distance between the soil surface and the cutting site is important. Jones et al. (1995) found that cutting at the soil surface was more effective than cutting 1 cm above or 1 cm below the soil surface for Stellaria media (L.) Vill., Papaver rhoeas L., Poa annua L. and Poa trivialis L.. When the upright growing Chenopodium album L. was cut 2 cm above the soil surface almost all plants were killed, but if the plants were cut off 5 cm above the soil surface, the regrowth was high (Estler & Nawroth 1995).
Weed sensitivity to cutting depends also on the species. Plants of P. rhoeas, which is rosette forming, were more sensitive to cutting at the soil surface than plants of S. media, which has prostrate growth, at the same stage of development (Jones et al. 1995). Estler & Nawroth (1996) found that the regrowth of the dicotyledonus C. album after cutting was less than the regrowth of the monocotyledonus Echinochlos crus-galli (L.) cut at the same distance from the soil surface.

5th EWRS Workshop on Physical Weed Control 273Pisa, Italy, 11-13 March 2002
These earlier investigations on weed control by cutting mainly studied the effect of cutting at a specified height above ground level. There was no evaluation of the position of the cut in relation to cotyledons and vegetative growth points.
The aim of this study was to investigate the regrowth of three weed species of different growth habits, after cutting the plants above or below the lowest growing point at various stages of development, and the implications for weed control.
Materials and methods
Experiments Three species of weed with different growth habits were chosen ; P. annua has prostrate growth, C. album is upright growing and Matricaria inodora (L.) is rosette forming. The plants were grown in 13 cm x 18 cm pots filled with limed and lightly fertilized peat soil. C. album and M. inodora were sown on moist filter paper, and six germinated seedlings were then transplanted into each pot. P. annua was sown directly into the pots and the number of seedlings was thinned to 6 plants per pot before treatment.
The plants were grown in a climate chamber, where the climate was adjusted to resemble the average climatic conditions of the 15th of May in Southern Sweden. This time of the year was chosen as it is a normal time for early weed control. The day length was 16 hours, with the maximum
light intensity of 550 mol m-2 s-1 for 10 hours. Relative humidity was 80% during the night and 56 % in the middle of the day. Minimum and maximum temperatures were 7.5 °C and 14.5 °C, respectively. All climatic factors were changed linearly over time. In order to regulate water supply, the pots were placed on a fibre cloth and sub-irrigated, the soil was kept moist throughout the experimental period.
The three species they were cut in relation to their lowest growing point, therefore they were cut at different heights above the soil surface. P. annua has the growing point just at the soil surface and were cut just below the soil surface when they had 2 leaves or just above soil surface when they had 1, 2 or 5 leaves. C. album and M. inodora have the lowest growing point at the cotyledons and these plants were cut just under the cotyledons when they had 2 true leaves or just above the cotyledons when they had 2, 4 or 6 true leaves. Control plants, grown at the same conditions as the cut plants, were included in each experiment.
The experimental layout was a completely randomized design with four replicates, each consisting of a single pot with 6 plants. About two weeks after treatment, the above-ground fresh weight was recorded.
An additional experiment was carried out with M. inodora. In order to study the regrowth more carefully, the fresh weight was measured just after cutting and 1, 2 and 3 weeks after cutting. The plants were cut just above the cotyledons when they had 2, 4 or 6 true leaves. There were 12 pots with 6 plants per pot for each developmental stage, and the fresh weight was recorded for the plants in 4 pots at each assessment time. Experimental conditions were otherwise similar to the first experiment.
Statistical analysisThe fresh weight data were analyzed by One Way Analysis of Variance. No transformation was needed according to Bartlett's Test for homogeneity in variance. A two sample test was used to compare cut plants with control plants.
To describe the regrowth of M. inodora during three weeks after cutting a growth model was used. The chosen model was the following three-parameter logistic model (Ratkowsky, 1990; Streibig et al., 1993):

5th EWRS Workshop on Physical Weed Control 274Pisa, Italy, 11-13 March 2002
YD k
a xkb( / )1
(1)
Parameter D describes the upper asymptote, b describes the slope of the curve around a.Parameter a is the number of days after sowing that gives the response (D-k)/2. The constant k was set to the mean of the fresh weight of the plants just after cutting. X is days after seeding and Y is g/plant.
Curve fitting was performed by non-linear regression using the Least Squares method (Anonymous, 1991). To stabilize the variance, a power transformation (ln y) was used. The transformed data were analyzed by the Transform-Both-Sides technique (Snee, 1986; Streibig et al.,1993).
Results
All plants died in all experiments when they were cut just under the lowest growing point, i.e. just below the soil surface for P. annua and between the soil surface and the cotyledons for C. album and M. inodora. When the plants were cut above the lowest growing point, most plants survived but there was a significant (P<0.05) reduction in fresh weight compared to the untreated control.
Poa annuaWhen plants of P. annua were cut just above the soil surface, 41% of the 1-leaf plants, 21% of the 2 leaf plants and 18% of the 6 leaf plants were killed. In other words, more plants were killed when they were cut at earlier stages. The plant weights at assessment were significantly (P<0.05) lower when plants were cut at a younger rather than an older stage (Fig. 1). The relative reduction in fresh weight compared with an untreated control was similar and significant for all stages of development.
1 3 50,0
0,1
0,2
0,3
0,0
0,1
0,2
0,3
521
(94%)(91%)(93%)
Number of leaves at treatment
Cut plantsControl
Figure 1. Effect of cutting on Poa annua plants two weeks after cutting just above the lowest growing point. The numbers in parenthesis shows the relative reduction in fresh weight of cut plants compared with control plants. Vertical bars indicate standard error of the mean.
Fre
sh w
eigh
t per
pla
nt (
g)

5th EWRS Workshop on Physical Weed Control 275Pisa, Italy, 11-13 March 2002
Chenopodium album All plants survived when they were cut between the cotyledons and the first true leaves. The fresh weight of the plants cut at the 2 leaf stage was significantly lower (P<0.05) than the fresh weight of plants cut at the 6 leaf stage (Fig. 2). The relative fresh weight reduction was slightly higher when the plants were cut at later growth stages.
2 4 60,0
0,4
0,8
1,2
1,6
0,0
0,4
0,8
1,2
1,6
(87%)(83%)(79%)
Number of true leaves at treatment
Cut plantsControl
Figure 2. Effect of cutting on Chenopodium album plants two weeks after cutting just above the lowest growing point. The numbers in parenthesis shows the relative reduction in fresh weight of cut plants compared with control plants. Vertical bars indicate standard error of the mean.
Matricaria inodora All plants survived when they were cut between the cotyledons and the first true leaves. The fresh weight of the plants two weeks after cutting was not significantly different for any of the three stages of development at which cutting back occurred (Fig. 3). However, the relative reduction in fresh weight was considerably higher when the plants were cut at a more advanced stage of growth.
Fre
sh w
eigh
t per
pla
nt (
g)
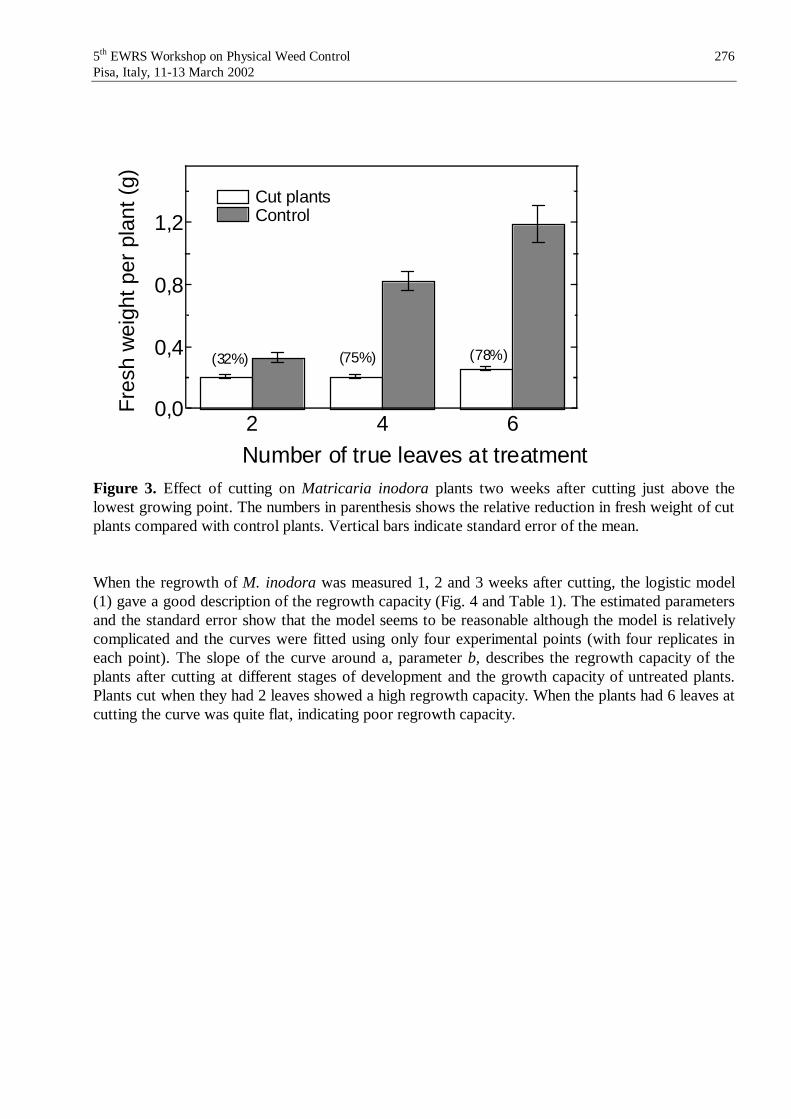
5th EWRS Workshop on Physical Weed Control 276Pisa, Italy, 11-13 March 2002
2 4 60,0
0,4
0,8
1,2
0,0
0,4
0,8
1,2
(78%)(75%)(32%)
Number of true leaves at treatment
Cut plantsControl
Figure 3. Effect of cutting on Matricaria inodora plants two weeks after cutting just above the lowest growing point. The numbers in parenthesis shows the relative reduction in fresh weight of cut plants compared with control plants. Vertical bars indicate standard error of the mean.
When the regrowth of M. inodora was measured 1, 2 and 3 weeks after cutting, the logistic model (1) gave a good description of the regrowth capacity (Fig. 4 and Table 1). The estimated parameters and the standard error show that the model seems to be reasonable although the model is relatively complicated and the curves were fitted using only four experimental points (with four replicates in each point). The slope of the curve around a, parameter b, describes the regrowth capacity of the plants after cutting at different stages of development and the growth capacity of untreated plants. Plants cut when they had 2 leaves showed a high regrowth capacity. When the plants had 6 leaves at cutting the curve was quite flat, indicating poor regrowth capacity.
Fre
sh w
eigh
t per
pla
nt (
g)

5th EWRS Workshop on Physical Weed Control 277Pisa, Italy, 11-13 March 2002
10 20 30 40 50
0,0
0,4
0,8
1,2
10 20 30 40 50
0,0
0,4
0,8
1,2ControlCut at 2-leaf stageCut at 4-leaf stageCut at 6 leaf stage
Days after seeding
Figure 4. Effect of cutting just above the lowest growing point on Matricaria inodora at different stages of development. At the 2- 4- and 6-leaf stage, plants were cut 13, 20 and 27 days respectively after seeding.
Table 1. Parameter estimates of regression (model 1) for plant fresh weight, data after cutting plants of Matricaria inodora at different stage of development. Standard errors (SE) are given in parentheses.
Treatment No. of leaves at treatment
Upper limit D (SE) g/plant
Slope b (SE)
a (SE) days after seeding
Control cut cut cut
-246
1.42 (0.16) 1.21 (0.33) 0.34 (0.02) 0.34 (0.04)
5.6 (0.59) 6.41 (0.57) 8.08 (0.61) 11.8 (2.94)
33.1(1.77) 34.6 (3.62) 32.4 (1.07) 39.9 (2.11)
Discussion As long as the plants are cut below the lowest growing point, they will be killed by the treatment. P. annua and M. inodora have their lowest growing point near the soil surface while C. album has its lowest growing point about 1-2 cm above the soil surface. Therefore, P. annua needed to be cut off just under and M. inodora just above the soil surface to kill all the plants, while C. album could be cut off 1-2 cm above the soil surface. Earlier investigations only described at what height above the soil surface at which plants were cut (Estler & Nawroth 1995, Jones et al. 1995), but the results largely agree with these studies.
Fre
sh w
eigh
t per
pla
nt (
g)

5th EWRS Workshop on Physical Weed Control 278Pisa, Italy, 11-13 March 2002
When the plants were cut just above the lowest growing point the only thing left of the plants of C. album or M. inodora were the cotyledons and a stem. Two weeks after cutting there was only a small difference in regrowth between plants of either C. album or M. inodora treated at different leaf stages. However the relative reduction in fresh weight compared with the untreated control was higher for older plants, which is probably because more biomass was cut off at the later stages. La Hovary et al. (1995) also found that the reduction in biomass was greater when plants of several dicotyledonous species were cut at the 6-leaf stage than when they were cut at the 3 leaf stage.
When the regrowth of M. inodora was studied during three weeks after cutting it was obvious that the regrowth capacity was lower when the plants were cut at older stages of development. One reason for this might be that the cotyledons had regenerated more on the older plants and, as the only green part left after cutting was the cotyledons, the assimilation capacity of the older plants was low.
When plants of P. annua was cut above the lowest growing point the only part left was about 1 mm high stems. In contrast to C. album and M. inodora, plants of P. annua had significantly higher fresh weight at assessment when cut at later growth stages. The older plants of P. annua seemed to have a higher regrowth capacity than the younger. This is probably due to the fact that grasses are continually forming new tillers at the soil surface, which enhances regrowth. Some plants of P. annua were killed although cut above the growing point, probably because the growing point of these plants was damaged, or because too large a portion of the biomass was removed.
Conclusions The results indicate that cutting may become a useful method for control of dicotyledonous upright-growing weed species such as C. album. Grass weeds and rosette-forming weed species, however, are probably more easily controlled by shallow tillage than by cutting, since these plants have to be cut at or below the soil surface. The technique of weed cutting may become especially useful in the production of root crops such as carrots with a slow initial growth. In early spring, many weeds commonly grow taller than the carrot seedlings, which makes it possible to cut upright growing weeds close to the ground while saving the carrots. In fact, this method is practised today by some organic carrot growers, who are able to reduce the need for hand weeding by early weed cutting when the crop plants are small. Further research is needed to develop the method further in different crops.
AcknowledgementsThe research was supported by Swedish Farmers Foundation for Agricultural Research. We are grateful for valuable comments on the manuscript from Jan Eric Englund, Ann-Marie Dock-Gustavsson and Bengt Lundegårdh.

5th EWRS Workshop on Physical Weed Control 279Pisa, Italy, 11-13 March 2002
References
ANONYMOUS (1991) Statgraphics statistical graphics system. Reference manual. STSC, inc., Rockville, Maryland, USA.
ESTLER, M. & NAWROTH, P. (1995). Mechanische Unkrautregulierung ohne Eingriff in das Bodengefuge. Landtechnik, 3, 142-143.
ESTLER, M. & NAWROTH, P. (1996). Mechanische Unkrautregulierung ohne Eingriff in das Bodengefüge - Gerätetechnik, Prüfstandsversuche, Ergebnisse - Zeitschrift fürPflanzenkrankheiten und Pflantzenschutz, Special Issue XV, 423-430.
HABEL, W. (1954). Über die Wirkungsweise der Eggen gegen Samenunkräuter sowie die Empfindlichkeit der Unkrautarten und ihrer Alterstadien gegen den Eggenvorgang. PhD thesis, Landwirtschaftlichen Hochschule Hohenheim.
JONES, P.A., BLAIR, A. M. & ORSON, J. H. (1995). The effect of different types of physical damage to four weed species. In Proceedings Brighton Crop Protection Conference - Weeds, 653-658. Brighton.
KEES, H. (1962). Untersuchungen zur Unkrautbekämpfung durch Netzegge und Stoppelbearbeitungsmassnahmen unter besonder Berücksichtigung des leichten Bodens. PhD thesis, Landwirtschaftlichen Hochschule Hohenheim.
KOCH, W. (1964) Unkrautbekämpfung durch Eggen, Hacken und Meisseln in Getreide. 1. Wirkungsweise und Einsatzzeitpunkt von Egge, Hacke und Bodenmeissel. Zeitschrift für Acker- und Pflanzenbau, 120, 369-382.
LA HOVARY, C., LEROUX, G.D. & LAGUE, C. (1995). Determination of optimum method and timing for mechanical weed control in corn. Weed Science Society of America, Abstracts, 35, 139.
RATKOWSKY, D.A. (1990). Handbook of Nonlinear Regression Models. Marcel Dekker; New York - Basel.
RASMUSSEN, J. (1990). Selectivity. An important parameter on establishing the optimum harrowing technique for weed control in growing cereals. In. Proceedings of the EWRS Symposium 1990. Integrated Weed Management in Cereals, 197-204.
RYDBERG, T. (1993). Weed harrowing - Driving speed at different stages of development. Swedish Journal of Agricultural Science, 23, 107-113.
SNEE, R.D. (1986). An alternative approach to fitting models when re-expression of the response is useful. Journal of Quality Technology, 18, 211-225.
STREIBIG, J.C., RUDEMO, M. & JENSEN, J.E. (1993). Dose-response curves and statistical models. In: Herbicide Bioassay (J.C. Streibig & P. Kudsk eds), pp. 29-55. CRC Press; Boca Raton, Florida.

5th EWRS Workshop on Physical Weed Control 280 Pisa, Italy, 11-13 March 2002
Yield effect of distance between plants and cutting of weeds
T. Heisel, C. Andreasen1 & S. Christensen2
Department of Crop Protection, Danish Institute of Agricultural Sciences, DK-4200 Slagelse, Denmark, [email protected], 1Department of Agricultural Sciences, The Royal Veterinary and Agricultural University, Højbakkegaard Allé 17, DK-2630 Taastrup, Denmark and 2Department of Agricultural
Engineering, Danish Institute of Agricultural Sciences, DK-8700 Horsens, Denmark.
Abstract
A sugar beet field experiment was conducted in 1999 and 2000 to measure beet yield when Sinapisarvensis L. or Lolium perenne L were growing 2, 4 or 8 cm from the beet. The weed was cut once in the growing season (late May, mid June or early July) and the number of neighbour beets to every single beet were registered. Increasing distance from 2 to 8 cm between beet and weed increased the beet yield significantly in average with 20%, regardless of weed species. The beet yield increased significantly when cutting of the weed was postponed to mid June and the total weed biomass increased significantly when cutting was postponed to the period between mid June and early July. The number of neighbours described an approximate linear yield decline of the single beet.
Introduction
Hoeing uproots or covers the weeds by soil and thereby delays or impedes weed growth. A disadvantage of hoeing is that the disturbance of the soil often initiates new weed seed germination and emergence. Cutting a weed at ground level can be an alternative method where soil disturbance is reduced (Jones & Blair, 1996). Dicotyledons can be killed, whereas monocotyledons can be reduced in size and their growth may be delayed. Different mechanical devices to cut weeds (Nawroth & Estler, 1996) and a new and potentially energy-efficient and precise CO2 laser method have been presented (Heisel et al., 2001). Hoeing is usually done several times during the growing season in organic sugar beets starting as early as possible to optimise the weed control. The optimal time for controlling the weed by cutting might be later in the season, because the plants may be easier to find and cut, when they have a certain size and because the critical period for weed control might be affected. Hence, there is a need for investigating how the beet yield is affected if weeds are cut later in the season.
The yield suppressing ability of the weed is highly dependent on the distance between a crop plant and a weed (Weiner, 1982; Frank, 1990; Pike et al., 1990). Usually the competition between plants increases when the distance decreases. However, the ability to cut a weed without damaging the crop decreases with decreasing distance. Interactions between a cut weed and the distance between weed and beet should be enlightened because the beet might be able to compete better with a cut weed close to itself than to a cut weed further away.
Our objective was to investigate yield response of sugar beet to transplanted Lolium perenne L. or Sinapis arvensis L. with respect to the distance between beet and weed and an aboveground weed cutting at various growth stages.

5th EWRS Workshop on Physical Weed Control 281 Pisa, Italy, 11-13 March 2002
Materials and Methods
Establishment and treatment dates for the complete trial are summarised in Table 1. One weed plant per beet plant was used and the planting distance between weed and sugar beet plants was chosen beforehand to be 2, 4, or 8 cm. Two competitive weed species, the monocotyledonous Lolium perenne L. and the dicotyledonous Sinapis arvensis L., were chosen (Sarpe & Torge, 1980). The species were transplanted in a growing sugar beet crop in order to obtain the chosen distances. The growth and transplantation of the weed plants were synchronised to the crop establishment in order to obtain crop weed competition similar to natural weed seedlings. The weeds were cut 2 cm aboveground twice in 1999 and three times in 2000.
Table 1. Establishment/treatment dates and number of data points (n) of the various types. 1999 2000 Action S. arvensis L. perenne S. arvensis L. perenne Seeding in trays 27 April 21 April 17 April 14 April B. vulgaris sowing 21 April 17 April
19 May 10 May Weedtransplantation (n = 142) (n = 142) (n = 319) (n = 319) CUTTIME 0 No cutting CUTTIME 1 6 June ~ 515 degree days 29 May ~ 538 degree days CUTTIME 2 21 June ~ 725 degree days 14 June ~ 744 degree days CUTTIME 3 - 3 July ~ 1027 degree days Weed harvesting 6 August 20 October 25 September Single beet harvest 26 – 29 October 13 – 15 November (n = 284) (n = 638)
Growing conditions and general design
S. arvensis and L. perenne were seeded in speedling trays and grown on watered cloth in an outdoor voliere. The plant density in the trays was continuously thinned to one plant per tray hole. One hectare was sown with sugar beets (cv. Marathon). The row distance was 50 cm and the seed distance 18 cm. The experiment was a completely randomised block design with 56 plots of 2.5 m x 10 m in 1999 and with 80 plots of 2.5 m x 5 m in 2000. The plots were laid out in a northeast – southwest direction in 1999, and in the north – south direction in 2000. Each plot consisted of one combination of the factors DISTANCE from beet to weed (2, 4, or 8 cm), two and three weed cuttings in 1999 and 2000 (CUTTIME) and the two weed species (SPECIES). The combinationswere replicated three times (REPL) in the block design.
Weeds were transplanted in the field with one weed plant per third beet plant (the competing beet plant) in two rows. The second and fourth rows were chosen out of five. Weeds were transplanted on the same side of the sugar beet in all plots (southwest in 1999, south in 2000). The number of competing beet plants were 284 in 1999 and 638 in 2000. Naturally occurring weeds were removed by hoeing, flaming, brush weeding or hand hoeing in 1999 and by pre-transplantation spraying, hoeing, flaming or hand hoeing in 2000.
After approximately 520, 730 or 1030 daily degree days (CUTTIME) (corresponding to late May, mid June or early July) weeds were cut with a pair of scissors approximately 2 cm from the soil surface enabling both weed species to be able to re-grow. All non-controlled plants and re-grown plants were harvested 2 cm from the soil surface when the growth stopped (see Table 1) and the final weed dry weights (WEEDDW) were measured after 24 hours drying at 90°C. The competing beet plants were harvested individually and the fresh weight (BEETFW) was measured after cleaning. Neighbour beets were defined as the beets encircling the competing beet. The

5th EWRS Workshop on Physical Weed Control 282 Pisa, Italy, 11-13 March 2002
number of neighbour beets (NEIGHB) in a 36 cm * 100 cm rectangle with the competing beet in the centre was measured to enable an analysis of the effect of missing beets plants.
Statistical analyses
We wanted to test which factors had a significant effect on the beet fresh weight (BEETFW). A general linear model with mixed effects and maximum likelihood estimation (Henderson, 1982; Weisberg, 1985) was used to describe the variation in fresh weight of the single beet (BEETFW).The plot number (PLOTNO) was included as random effect whereas the rest were included as fixed effects. A square root transformation was used to stabilise the variance. The full model for the complete data set (n = 922) were in a simplified form:
BEETFW = YEAR + REPL + PLOTNO + DISTANCE + SPECIES + (1) CUTTIME + NEIGHB + error
The errors and the effects of PLOTNO were expected to be normally distributed with a mean value of zero and variation 2. YEAR, REPL, SPECIES and CUTTIME were analysed as class variables whereas the rest were analysed as continuos variables. The model was analysed with all two-way interactions included and hereafter reduced by eliminating non-significant (P < 0.05) factor interactions and factors one at a time. Simultaneously the new reduced model was tested against the parent model using twice the difference between the calculated values for the logarithm to the likelihood (–2LogL) for the two models. The calculated difference is approximately Chi2-distributed with the difference in degrees of freedom between the two models as degrees of freedom.
Statistical analyses were performed in the software package SAS™ 8 (SAS, 2000). Regression in Fig. 4 was performed with Microsoft® Excel™ weighted by numbers of samples.
Results and discussion
The growing conditions were different in the two years. In 1999 the spring was cooler and the summer warmer than in 2000. Furthermore, the autumn was extremely dry in 1999, all together resulting in smaller beets (BEETFW) in 1999.
After successive reducing model 1 until it only consisted of significant factors we ended up with model 2:
BEETFW = YEAR + DISTANCE + CUTTIME + NEIGHB + error (2)
F-test for significance, estimate and standard error of estimate for each factor is shown in Table 2. There was a significant difference in the beet yield between the years mainly due to site and climatic conditions.
The effect of weed species decreased linearly within the distance 2 to 8 cm from the sugar beets in both years (Fig. 1 - note that Figs. 1, 2 and 4 were transformed back in scale). The sugar beet yield with weeds at 2 cm distance was approximately 20% lower compared to weeds at 8 cm distance from the beet plants. Similar results were presented with different distances between Datura stramonium L and Xanthium strumarium L. on Glycine max L. (Pike et al., 1990). A linear approximation showed a high correlation coefficient of G. max yield and increasing distance to the

5th EWRS Workshop on Physical Weed Control 283 Pisa, Italy, 11-13 March 2002
two weed species. Similarly, the distance factor was found significant in describing annual plant growth rate of Pinus rigida L. and intra-specific competition from neighbour trees (Weiner, 1984).
Table 2. Final model (2) on the total data set with 908 degrees of freedom for error after successive reductions of model 1 with F-test for significance, estimate, estimate unit and standard error of estimate (SE).
Effect F-test† Estimate Unit SE
YEAR 1999 1.48 kg 0.027 2000
11***
1.58 kg 0.027
DISTANCE 8** 0.013 kg/cm 0.0045 CUTTIME 520 ºC 0.061 0.029
730 ºC 0.081 0.030 1030 ºC 0.061 0.036
No cutting
3*
0
kg difference compared toNo cutting
-NEIGHB 153*** -0.11 kg/NEIGHB 0.0088 † *, **, *** - Significant at P<0.05, P<0.01 or P<0.001.
A linear model with varying distances to neighbour trees provided the best fit. All together studies on inter- and intra-specific competition shows that competition between plants decreases with increasing distance, i.e. the need for control is largest for the weed closest to the beet. This conclusion extends the challenge to control weeds in the sugar beet row by cutting.
Figure 1. Mean beet fresh weight and standard deviation with weeds at 2, 4 or 8 cm distance or no weeds in 1999 (solid) or 2000 (hollow/dotted). Each point is the mean values of approximately 100 (1999) or 200 (2000) samples.
There was a significant effect of postponing the cutting of the weeds to mid June (Table 2). In 1999 the fresh weight of beets were largest when the weeds were cut during mid June. This effect was not significant in 2000 (Fig. 2).
Farahbakhsh & Murphy (1986) made a glass house pot experiment to study competition between sugar beet and the weed species Avena fatua L., Alopecurus myosuroides L. and Stellariamedia L. The different time of emergence of the species and plant density were important factors of
0.9
1.2
1.5
1.8
2.1
0 4 8 12DISTANCE (cm)
FRES
HW
EIG
HT
BEET
(kg)
No weed

5th EWRS Workshop on Physical Weed Control 284 Pisa, Italy, 11-13 March 2002
the severity of crop yield loss. There was no competition effect from the weeds on crop yield if the weeds were removed just before the true six-leaf stage. Similar to those findings we found a significant higher yield when the cutting of the weeds was postponed until mid June (approximately 2 months after emergence) (Figs. 2 and 3). Our results suggest that the optimal period of weed cutting is a period between the final flush of weed emerge and the mutual overlapping of the leaves and roots of the species. Mid June was also a period were the weed species were susceptible to cutting. A higher weed level competition, e.g. higher weed density may change this conclusion.
Figure 2. Mean beet fresh weight and standard deviation when weeds were cut at 520, 730 or 1030 ºC daily degree days, no cutting or no weeds as control in 1999 (solid) or 2000 (hollow/dotted). Each point is the mean values of approximately 80 (1999) or 160 (2000) samples.
There were no significant interactions between date of cutting and the other factors i.e. sugar beets did not gain from increasing the asymmetric competition between the species.
Figure 3. Mean weed biomass (WEEDDW) and standard deviation when weeds were cut at 520,730 or 1030 ºC daily degree days or no cutting as control in 1999 (solid) or 2000 (hollow/dotted). Each point is the mean values of approximately 80 (1999) or 160 (2000) samples.
1.00
1.25
1.50
1.75
2.00
200 400 600 800 1000 1200CUTTIME (ºC)
FRES
H W
EIG
HT
BEET
(kg)
No cutNo weed
0
5
10
15
20
25
400 600 800 1000 1200CUTTIME (ºC)
WEE
DD
W (g
)
No cut
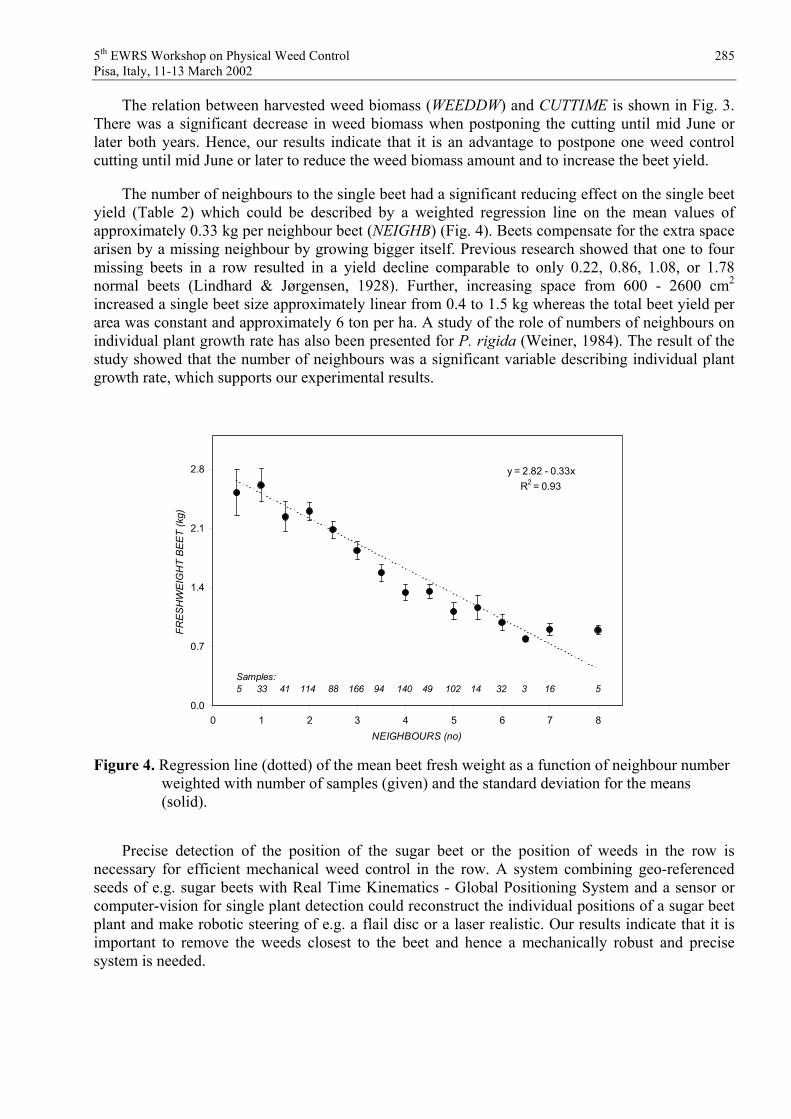
5th EWRS Workshop on Physical Weed Control 285 Pisa, Italy, 11-13 March 2002
The relation between harvested weed biomass (WEEDDW) and CUTTIME is shown in Fig. 3. There was a significant decrease in weed biomass when postponing the cutting until mid June or later both years. Hence, our results indicate that it is an advantage to postpone one weed control cutting until mid June or later to reduce the weed biomass amount and to increase the beet yield.
The number of neighbours to the single beet had a significant reducing effect on the single beet yield (Table 2) which could be described by a weighted regression line on the mean values of approximately 0.33 kg per neighbour beet (NEIGHB) (Fig. 4). Beets compensate for the extra space arisen by a missing neighbour by growing bigger itself. Previous research showed that one to four missing beets in a row resulted in a yield decline comparable to only 0.22, 0.86, 1.08, or 1.78 normal beets (Lindhard & Jørgensen, 1928). Further, increasing space from 600 - 2600 cm2
increased a single beet size approximately linear from 0.4 to 1.5 kg whereas the total beet yield per area was constant and approximately 6 ton per ha. A study of the role of numbers of neighbours on individual plant growth rate has also been presented for P. rigida (Weiner, 1984). The result of the study showed that the number of neighbours was a significant variable describing individual plant growth rate, which supports our experimental results.
Figure 4. Regression line (dotted) of the mean beet fresh weight as a function of neighbour number weighted with number of samples (given) and the standard deviation for the means (solid).
Precise detection of the position of the sugar beet or the position of weeds in the row is necessary for efficient mechanical weed control in the row. A system combining geo-referenced seeds of e.g. sugar beets with Real Time Kinematics - Global Positioning System and a sensor or computer-vision for single plant detection could reconstruct the individual positions of a sugar beet plant and make robotic steering of e.g. a flail disc or a laser realistic. Our results indicate that it is important to remove the weeds closest to the beet and hence a mechanically robust and precise system is needed.
0.0
0.7
1.4
2.1
2.8
0 1 2 3 4 5 6 7 8NEIGHBOURS (no)
FRES
HW
EIG
HT
BEET
(kg)
y = 2.82 - 0.33xR2 = 0.93
Samples: 5 33 41 114 88 166 94 140 49 102 14 32 3 16 5

5th EWRS Workshop on Physical Weed Control 286 Pisa, Italy, 11-13 March 2002
References
FARAHBAKHSH A & MURPHY KJ (1986) Comparative studies of weed competition in sugar beet. Aspects of Applied Biology 13, 11 – 16.
HEISEL T, SCHOU J, CHRISTENSEN S & ANDREASEN C (2001) Cutting weeds with a CO2 laser. Weed Research 41, 19-30.
HENDERSON CR (1982) Analysis of Covariance in the Mixed Model: Higher-Level, Nonhomogeneous, and Random Regression. Biometrics 38, 623-640.
JONES PA, & BLAIR AM (1996) Mechanical damage to kill weeds. In: Proceedings Second International Weed Control Congress, Copenhagen, Denmark, 949-954.
LINDHARD E & JØRGENSEN M (1928) Om betydningen af spring i roemarkens plantebestand og om udbyttets afhængighed af plantebestandens tæthed. Tidskrift for Planteavl 34, 565-595.
NAWROTH P & ESTLER M (1996) Mechanische Unkrautregulierung ohne Eingriff in das Bodengefüge – Gerätetechnik, Prüfstandsversuche, Ergebnisse. Zeitschrift für Pflanzenkrankheiten und Pflanzenschutz. Sonderheft XV 1996. 423–430.
PIKE DR, STOLLER EW & WAX LM (1990) Modelling soybean growth and canopy apportionment in weed-soybean (Glycine max). Weed Science 38, 522-527.
SARPE N & TORGE C (1980) Der Einfluss einiger Unkrautgesellschaften mit dominanten Arten der Gattungen Sinapis, Setaria, Erigeron, Amaranthus, Cirsium und convolvulus auf die Wurzelproduktion der Zuckerrübe. Tagungsbericht der Landwirtschaftliche Wissenschaft,DDR, Berlin, 182, 105-112.
WEINER J (1982) A neighbourhood model of annual plant interference. Ecology 63, 1237 – 1241. WEINER J (1984) Neighbourhood interference amongst Pinus rigida individuals. Journal of Ecology
72, 183 – 195. WEISBERG S (1985) Applied Linear Regression. Wiley series in probability and mathematical
statistics. John Wiley & Sons. New York. 324 pp.

5th EWRS Workshop on Physical Weed Control 287 Pisa, Italy, 11-13 March 2002
Semi-automatic machine guidance system
J. Meyer Technische Universität München
Wissenschaftszentrum Weihenstephan für Ernährung, Landnutzung und Umwelt Department für Biogene Rohstoffe und Technologie der Landnutzung
Fachgebiet Technik im Gartenbau, Am Staudengarten 2 85354 Freising-Weihenstephan
Tel: +49 8161 713448, Fax: +49 8161 713895 Mail: [email protected]
AbstractThe development of automated machine guidance systems is a necessary prerequisite for an increased use of physical methods for weed control. Because of very different crops (size and morphology) in horticulture, remote sensors (e.g. infrared or ultrasonic sensors, vision systems) should generally be preferred (HEMMING 2000). The occurrence of measurement mistakes, missing plants in row, hazardous reflections and so on imposes the use of closed loop control systems, which can compensate automatically these problems (MEYER, HARTMANN 1999). On the other hand the human eye is a very powerful (rapid and precise) sensor which can easily overcome most measurement problems. Therefore a guidance system was put together, which consists of a colour video system on the weeder, a monitor for the tractor driver and an active (electrical) lateral guidance system for the weeder. The tractor driver has to fulfil three tasks - steering the tractor and monitoring and steering the weeder. In the experiments the guidance quality was monitored at different driving velocities .
Introduction The preciseness of guidance along a row of plants is directly influenced by the driving velocity and the quality of the sensor and the mechanical steering system. For rear mounted machinery a second worker normally is doing the steering which is cost intensive and to some extent limiting the driving velocity as well. To solve these problems vision systems are being tested. But these are unfortunately subjected to lots of measurement problems and are not working fast enough at bad measurement conditions. As it can be expected, that the reliability of vision systems will improve rapidly, in a first step a half automatic mechanical solution was carried out.
Material and MethodsThe variation of the plant location along a plant row is depending on two factors:
the variation between subsequent plants due to the planting or seeding process and the variation of the row itself, depending of the quality of the tractor or machine movement.
Whereas in the first case the variation normally should be overcome by a security distance between e. g. weeder and crop row, in the second case the guidance system has to deal with the problem. To demonstrate the situation and define the necessary movements, various measurements about the variation of plant locations in a row have been carried out (HARTMANN 1999) with a geodimeter measurement device (Figure 1). The absolute row position could be determined by measuring distance from the measurement device and angle to a known subject, in this case a church tower (Figure 1). The relative accuracy was determined by measuring the distance of the plant from a defined center line.

5th EWRS Workshop on Physical Weed Control 288 Pisa, Italy, 11-13 March 2002
Geodimeter 4000
plant row
Figure 1: Measurement of the absolute location of a plant row (Römer 2001)
As the main problem for the row guidance is the ad hoc variation, the driving/guidance experiments were carried out with several defined “artificial” crop rows, one of which is shown in figure 2. The artificial rows were defined in that way, that common problems like uneven rows, ad hoc jumps of the seeder or inaccurate driving of the tractor were simulated.
Figure 2: Artificial crop row for testing purposes

5th EWRS Workshop on Physical Weed Control 289 Pisa, Italy, 11-13 March 2002
ResultsThe investigations on a closed control loop automatic guidance system in a test frame (HARTMANN1999) have clearly shown the necessity of disconnecting driving velocity and lateral machine guidance as far as possible. Moreover the hydraulic systems of (especially old or lightweight) tractors often are not suitable to guaranty an undisturbed direct control of the rear mounted machinery. Because of that problems an electric motor has been chosen to carry out the lateral movement of the guidance system.
The video-based lateral guidance system consists of three main parts: a colour video camera (dust and water protected) aiming at the plant row a colour video monitor in the view of the tractor driver (Figure 3) an electric linear motor on the weeder (Figure 4) being controlled by manual switches from the tractor driver (Figure 3).
The tractor driver thus has three tasks Driving the tractor along the crop row (or in the furrow of the crop bed) watching the weeder on the video monitor steering the weeder along the crop row.
In the experiments the function of the electric lateral guidance system should be tested in respect of the mechanical reliability, the necessary displacement width, the displacement speed and the possible driving speed with the complete system (tractor, weeder and driver).
Figure 3: The video monitor and the switches in front of the tractor driver

5th EWRS Workshop on Physical Weed Control 290 Pisa, Italy, 11-13 March 2002
Figure 4: The electric lateral guidance system
The variation of the plant positions in a crop row is depending directly of the planting or seeding quality. As a matter of fact in principle this variation is so small, that in most cases a security distance between the weeding tool (or any other tool) or the width of protecting tunnels is large enough to avoid damage on the crop. In the case of seeded crops the minimal width could be around 6 cm, which is a well known practical value. Thus the ad hoc movement of the tractor and/or the seeding or planting machinery is the main problem for the row accuracy (Figure 5).
Figure 5: Relative Variation of the plant location of a planted or seeded crop As a result of this, a maximum displacement of 15 cm of the electric system was chosen; that means a displacement of 7,5 cm to both sides.

5th EWRS Workshop on Physical Weed Control 291 Pisa, Italy, 11-13 March 2002
Every crop row was examined with 10 test drives, so that the increasing ability and experience of a driver could be incorporated into the results. A typical result was, that up to a speed of 6 km/h it was possible to drive and guide successfully the tractor and the weeder along a crop row.
ConclusionsIn agriculture a general trend towards reduction of production costs is registered. One possibility is to use improved lateral side guidance systems for agricultural machinery. The visual information combined with the possibility to shift the agricultural machinery laterally from the tractor cab using a control desk, provides an accurate adjustment following the plant rows. Thus a rear mounting is possible, offering flexible handling and universal usability. The test results prove, that the lateral guidance system allows a precise adjustment and a driving speed up to about 5-6 km/h which corresponds with the average working speed for most weeders.
References
HARTMANN, P. 2000: Berührungslose Höhen- und Seitenführung von Traktoranbaugeräten in Beetkulturen. Forschungsbericht Agrartechnik des Arbeitskreises Forschung und Lehre der Max-Eyth-Gesellschaft Agrartechnik im VDI (VDI-MEG) 352. Dissertation, 175 p.
HEMMING, J. 2000: Computer vision for identifying weeds in crops, Gartenbautechnische Informationen, Heft 50, Institut für Technik in Gartenbau und Landwirtschaft, Universität Hannover.
MEYER, J. und HARTMANN, P. 1999: Automatische Führung von Hackgeräten, Landtechnik 3/99, 146-147.
RÖMER, H.-P. 2001: Einzelpflanzenorientierte Prozessführung im Freilandgemüsebau, Dissertation, Freising-Weihenstephan, http://tumb1.biblio.tu-muenchen.de/publ/diss/ww/2001/roemer.html

5th EWRS Workshop on Physical Weed Control 292 Pisa, Italy, 11-13 March 2002
Experimental assessment of the elements for the design of a microwave prototype for weed control
C. De Zanche, F. Amistà, and S. BeriaDept.Land and Agro-Forestry Systems, University of Padua,
Via Romea, 16 Agripolis, 35020 Legnaro, Padova e-mail: [email protected]
Abstract
The study of the alternatives to the chemical weed control was oriented to verify the potential of the electromagnetic waves, in particular microwave.
Several laboratory experiments, simulating the field conditions, was made in order to obtain enough information useful to design a preliminary prototype to be verified in the next cycle of field tests.
The tests showed that the ground can absorb up to the 62% of the total amount of emitted energy, thus indicating the necessity of a shield to increase the efficiency of the microwave generator.
However, considering the variability of the results, the experimentation showed that the microwave irradiation can control the weed growth; in laboratory conditions an emission of 3 kJ, is required to control 90% of the weed, but field simulation tests raise this threshold to 10 kJ.

5th EWRS Workshop on Physical Weed Control 293 Pisa, Italy, 11-13 March 2002
Video assessment techniques to monitor physical weed management
N. M. Bromet and J.N.Tullberg University of Queensland – Gatton
Queensland, Australia
Abstract
Current field techniques for weed monitoring using weed counts and ground cover generate excessive data, and can often result in errors in multiple-plot experiments due to the excessive time requirement of thorough assessment. This paper describes a video technique which allowed data collection from multiple plots within a short timeframe. Initial trials demonstrated comparable results to those from in-field observation and counting, and additional benefits including data on weed size, cover and species identification.
Introduction
Weeds are a major pest in all cropping systems, reducing yields and product quality, and increasing production costs. Soil degradation is often associated with mechanical weed control, and environmental health concerns with herbicide control. In the national survey, financial returns of winter cropping systems were reduced by a total of $1.2 billion in the 1998-99 season (Medd et al.,2001).
Weed mapping on a field scale gives the ability to monitor the effectiveness of past or current weed management and there is considerable interest in new, satellite-image technology to assist this process. Current systems do not offer the spatial resolution and mission flexibility required for practical weed patch identification and mapping on a field scale (Lamb and Brown, 2001), because the best available images have a single-pixel resolution of only 1m2.
A system with higher resolution is needed for this task, and a simple hand-held video camera can provide this, although spatial coverage is limited. Current developments in video and PC -- based image processing technology allow the development of a high-accuracy system of crop/weed data collection and analysis.
This paper describes a simple video-assisted monitoring system, and its testing in comparison to direct observation and counting in a preliminary trial of methodology available to investigate high precision guidance in physical weed control.
Methodology
The preliminary trial was established using 48 plots of 7m x 1.25m to provide 12 treatments with 4 replicates in a randomised complete block design. Treatments represented varying mechanical management techniques, and guidance for this preliminary trial was achieved using a taught steel cable between pairs of steel posts for physical guidance of planters and weed management equipment. Black barley was sown at 150kg/ha in 25cm rows throughout this area.

5th EWRS Workshop on Physical Weed Control 294 Pisa, Italy, 11-13 March 2002
Arrangement of the 12 treatments in four replicate blocks (A-D) is illustrated in (Fig.1). Mechanical weed control treatments were applied at a speed of approximately 1 m s-1 and 2 cm depth at 2-week intervals, except as indicated:
1. Weedy (no weed control) 2. Weed-free (hand weeded) 3. Sweep weeding treatment 4. Sweep at 4-week intervals 5. Rake weeding treatment 6. Rake at 4-week intervals
7. Sweep at 4 cm depth 8. Rake at 4 cm depth 9. Sweep at 2 m s-1
10. Rake at 2 m s-1
11. Sweep touching plants 12. Rake touching plants
A B C D 12 5 1 10 8 4 6 3 2 6 9 5 2 6 12 9 9 3 2 12 12 10 8 11 11 7 4 11 5 7 1 10 4 1 8 3 9 3 7 4 10 8 6 7 11 1 2 3
Figure 1. Layout of trial plots (numbers indicate treatments, letters indicate blocks).
Weed assessments by direct observation and video methods were performed a few days after each set of physical weed control treatments, and final weed and crop dry matter assessments taken at crop maturity. The comparison reported here was made three weeks after planting, and four days after the first set of weed control treatments were applied, using data from block A.
Direct observation and counting was performed in block A, within sections of one row width (25cm) by 1m, and other manual techniques (line, quadrat and line/quadrat) used in other blocks. Weed numbers from this field procedure were processed (using Microsoft® Excel®) and a surface area graph constructed.
A hand-held digital video camera (Panasonic® DS88a) was used in the vertical plane at 2m elevation to capture a 1m swath over all blocks. Movement of the camera was controlled using inbuilt image stabilisation , and verbal messages used to identify treatments. Images from the video camera were first transferred to the computer using Leadtek® Capview TV® and saved in mpeg format. This video material was then scrolled through to provide screenshots at set intervals.
Images for one run were assembled using a ruler to ensure accurate scaling. These images were imported into Ulead® Photoimpact® where filters were applied and counts performed, so the values could be entered into Excel® and a corresponding surface area graph prepared.
Results
The digital video provided excellent image quality. Pixel resolution was high allowing easy identification of small weeds and differentiation between weed seedlings when they would otherwise appear as one weed or an indistinguishable mass.
N
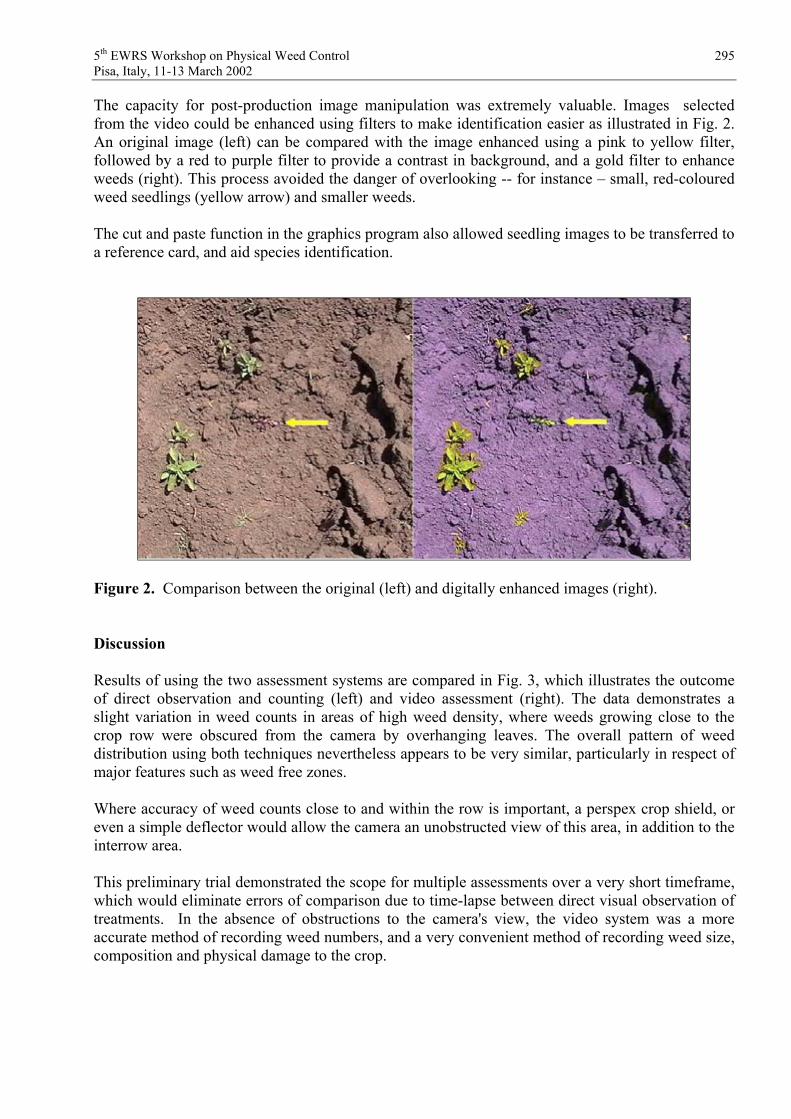
5th EWRS Workshop on Physical Weed Control 295 Pisa, Italy, 11-13 March 2002
The capacity for post-production image manipulation was extremely valuable. Images selected from the video could be enhanced using filters to make identification easier as illustrated in Fig. 2. An original image (left) can be compared with the image enhanced using a pink to yellow filter, followed by a red to purple filter to provide a contrast in background, and a gold filter to enhance weeds (right). This process avoided the danger of overlooking -- for instance – small, red-coloured weed seedlings (yellow arrow) and smaller weeds.
The cut and paste function in the graphics program also allowed seedling images to be transferred to a reference card, and aid species identification.
Figure 2. Comparison between the original (left) and digitally enhanced images (right).
Discussion
Results of using the two assessment systems are compared in Fig. 3, which illustrates the outcome of direct observation and counting (left) and video assessment (right). The data demonstrates a slight variation in weed counts in areas of high weed density, where weeds growing close to the crop row were obscured from the camera by overhanging leaves. The overall pattern of weed distribution using both techniques nevertheless appears to be very similar, particularly in respect of major features such as weed free zones.
Where accuracy of weed counts close to and within the row is important, a perspex crop shield, or even a simple deflector would allow the camera an unobstructed view of this area, in addition to the interrow area.
This preliminary trial demonstrated the scope for multiple assessments over a very short timeframe, which would eliminate errors of comparison due to time-lapse between direct visual observation of treatments. In the absence of obstructions to the camera's view, the video system was a more accurate method of recording weed numbers, and a very convenient method of recording weed size, composition and physical damage to the crop.

5th EWRS Workshop on Physical Weed Control 296 Pisa, Italy, 11-13 March 2002
Figure 3 Comparison of weed counts, in-field (left) and video technique (right).
The video procedure was estimated to have reduced the overall field and laboratory time required to assess weed management treatments from approximately 4 h per block for visual field observation and counting to 2.25 h per block. The less precise quadrat and line methods took longer than this. In the high-intensity sunlight conditions of subtropical Queensland, this large reduction in field work time with the video procedure was also appreciated by the operator.
This technique could equally well be applied by conventional photography and scanning, but the digital video process was more convenient, and less costly.
The outcome of the preliminary trial confirmed that a simple video procedure for assessing weed management treatments was substantially faster, and provided weed count data of equal or greater accuracy than that achieved by visual observation and counting in the field. The video system also yielded a richer data set, which included information on cover, species and crop damage, while making the whole process more comfortable for the operator.

5th EWRS Workshop on Physical Weed Control 297 Pisa, Italy, 11-13 March 2002
Acknowledgments
This work was supported by the Australian Centre for International Agricultural Research, under Project 96/143 -- Sustainable Dryland Grain Production.
References
AUERNHAMMER H (2001). Precision Farming – The Environmental Challenge. Computers and Electronics in Agriculture 30, 31-43.
LASS LW , CARSON HW AND CALLIHAN RH (1996). Detection of Yellow Starthistle (Centaurea solstitialis) and Common St. Johnswort (Hypericum perforatum) with Multispectral Digital Imagery. Weed Technology 10;3, 466-474.
LAMB DW AND BROWN RB (2001). Remote-Sensing and Mapping of Weeds in Crops. Journalof Agricultural Engineering Research 78;2, 117-125.
MEDD R, REW L AND JONES R (2001). Cost of weeds in cropping systems. In: Proceedings2001 Technology Developments in Weed Management, Dalby Agricultural College, 6-8.