europos }em s jkio fondas kaimo pl trai: europa...
TRANSCRIPT


ALEKSANDRAS STULGINSKIS UNIVERSITY
THE SIXTH INTERNATIONAL SCIENTIFIC CONFERENCE
RURAL DEVELOPMENT 2013
PROCEEDINGS
Volume 6, Book 3
28–29 November, 2013
Akademija

Rural Development 2013 ISSN 2345-0916
2
RURAL DEVELOPMENT 2013
THE SIXTH INTERNATIONAL SCIENTIFIC CONFERENCE PROCEEDINGS
Volume 6, Book 3
Aleksandras Stulginskis University
Akademija, Kaunas district, Lithuania
ISSN 2345-0916
© Aleksandras Stulginskis University, 2013
Proceedings of the International Scientific conference "Rural Development‘2013: Innovations and
Sustainability" are indexed and abstracted in the international databases: Thomson Reuters ISI
Web of Science (Conference Proceedings Citation Index), Academic Search Complete (EBSCO).
All papers published in the Proceedings of the International Scientific conference "Rural
Development 2013: Innovations and Sustainability" have been peer reviewed by two experts in the
field.
Conference website: http://www.asu.lt/rural__development/en
Published by ASU Publishing Center
Studentų 11, LT - 53361 Akademija, Kauno r. Lithuania

Rural Development 2013 ISSN 2345-0916
151
CFD Analysis of Broiler House Ventilation Patterns with Respect
to the Poultry Welfare
Milan Zajicek1, Pavel Kic
2
1 Institute of Information Theory and Automation, The Academy of Science of The Czech Republic
2 Czech University of Life Sciences Prague, Faculty of Engineering
Abstract
This paper is focused to the broiler house ventilation in summer and winter periods with respects to main welfare needs of poultry during the
fattening period. Limits of ventilation configurations are given with the minimum air exchange during the beginning of fattening in winter on the one side and the maximum air exchange during the end of fattening in summer on the other side. Basic parameters of analyzed cases are set up with
respect to the technical standards. Several 2D CFD (computer fluid dynamics) models for every configuration are solved using the Ansys Fluent
software and discussed from different points of view with focus to the welfare of animals. The main part of work is focused onto finding the most usable configuration of inlets and outlets. Appropriate effects of longitudinal and transversal ventilation are used in different flow regimes. It is also
mentioned, that mainly during the winter period, when the flow rate of the air through the interior is reduced to minimum, the concentration of
pollutants and also the humidity becomes the main criterion for the ventilation system control.
Introduction
There is a great number of factors, which have an influence onto the forming an internal conditions inside a broiler
houses. The need of an exact control of internal conditions inside the broiler house is forced by two main factors. It is the
cost of sources and energy which are needed to satisfy welfare of animals (Weeks and Butterworth, 2004) and on the
other side, there is a need of production process intensification. There is an interesting comparison of broilers growth
characteristics in history (Lesson and Summers, 2000), Table 1 illustrates such this principle for the US farms.
Table 1. Growth characteristics of mixed-sex broilers grown to typical “market weights”
Time period Age
[days]
Live weight
[kg]
Live weight gain
[g.day-1]
Feed gain
[-]
Mortality
[%]
1920’s 120 1,0 8 5,0 20
2000’s 50 2.7 54 1.9 4
Figure 1. Comparison of measured values and 3D CFD simulation done for existing broiler house and used for tuning 2D
models presented bellow
It is clear, that the fulfillment of welfare conditions and their combination with effective energy and space management should leads to an optimum production quality with long term efficiency. Intensification of fattening process brings the higher demands for the ventilation and heating systems of facilities and precision of their adjustment. The aim of this paper is to use computer fluid dynamics system (CFD) to compare a set of ventilation variants with respect to summer and winter conditions in a very simple shaped broiler house as a part of the welfare making where its needs and energetically demands are in a strict opposition.
Rural Development 2013 ISSN 2345-0916
152
The main motivation for this work was the result of earlier research (Zajicek and Kic, 2012). Fig.1 shows the comparison between the numerical simulation and existing broiler house as an example result which were used for the tuning the CFD model.
Materials and methods
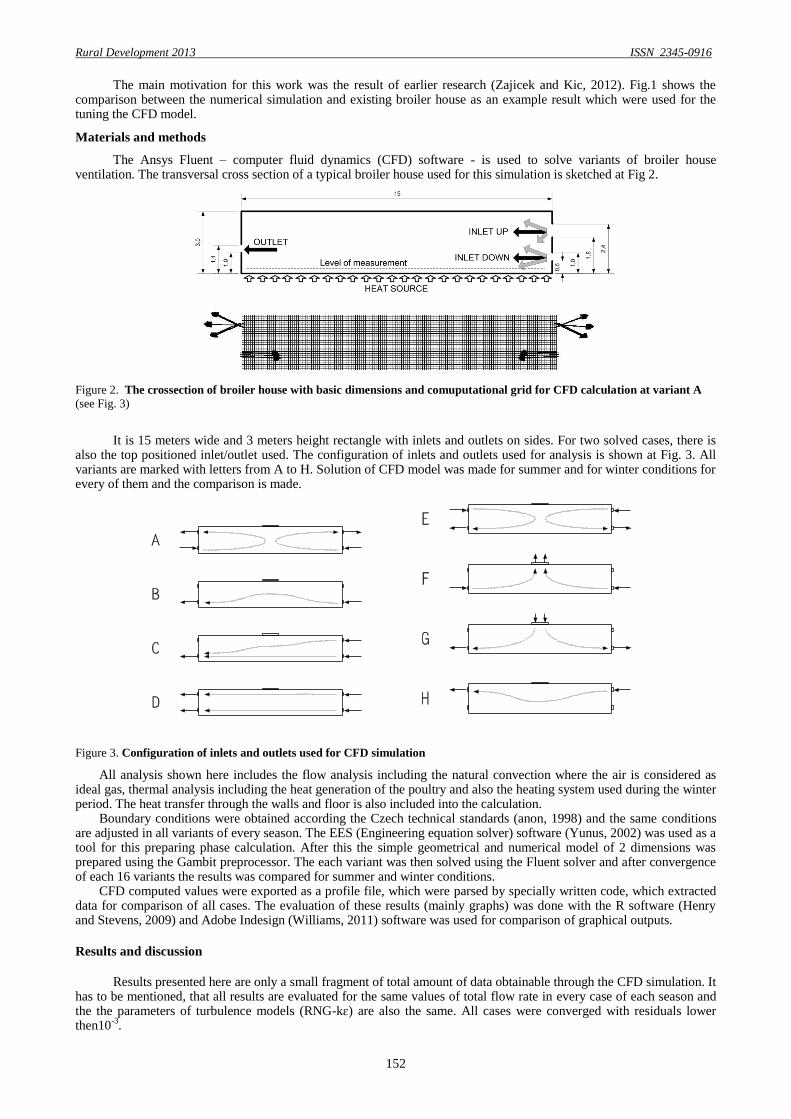
The Ansys Fluent – computer fluid dynamics (CFD) software - is used to solve variants of broiler house ventilation. The transversal cross section of a typical broiler house used for this simulation is sketched at Fig 2.
Figure 2. The crossection of broiler house with basic dimensions and comuputational grid for CFD calculation at variant A
(see Fig. 3)
It is 15 meters wide and 3 meters height rectangle with inlets and outlets on sides. For two solved cases, there is
also the top positioned inlet/outlet used. The configuration of inlets and outlets used for analysis is shown at Fig. 3. All variants are marked with letters from A to H. Solution of CFD model was made for summer and for winter conditions for every of them and the comparison is made.
Figure 3. Configuration of inlets and outlets used for CFD simulation
All analysis shown here includes the flow analysis including the natural convection where the air is considered as ideal gas, thermal analysis including the heat generation of the poultry and also the heating system used during the winter period. The heat transfer through the walls and floor is also included into the calculation.
Boundary conditions were obtained according the Czech technical standards (anon, 1998) and the same conditions are adjusted in all variants of every season. The EES (Engineering equation solver) software (Yunus, 2002) was used as a tool for this preparing phase calculation. After this the simple geometrical and numerical model of 2 dimensions was prepared using the Gambit preprocessor. The each variant was then solved using the Fluent solver and after convergence of each 16 variants the results was compared for summer and winter conditions.
CFD computed values were exported as a profile file, which were parsed by specially written code, which extracted data for comparison of all cases. The evaluation of these results (mainly graphs) was done with the R software (Henry and Stevens, 2009) and Adobe Indesign (Williams, 2011) software was used for comparison of graphical outputs.
Results and discussion
Results presented here are only a small fragment of total amount of data obtainable through the CFD simulation. It has to be mentioned, that all results are evaluated for the same values of total flow rate in every case of each season and the the parameters of turbulence models (RNG-kɛ) are also the same. All cases were converged with residuals lower then10
-3.

Rural Development 2013 ISSN 2345-0916
153
Results for summer variants: Fig. 4 and Fig. 5 show the Temperature and velocity profiles as a graphs representing values of quantities on transversal line at the height of 0,3 m above floor. This position was used because this is responds to the height of broilers and also because this is a good position for making a measurements in a real broiler houses. Fig. 6 shows contours of temperature and velocity magnitude.
It can be seen, that for summer conditions the variants B, C and D can be marked as useful cases, as for the relatively small velocities in the zone of animals as for relatively low temperatures in this place. Cases A and E has a characteristically shaped flow field, which leads to bad ventilation inside the central part of the space and high temperatures in this area, therefore that can be marked as a worst variants for summer .
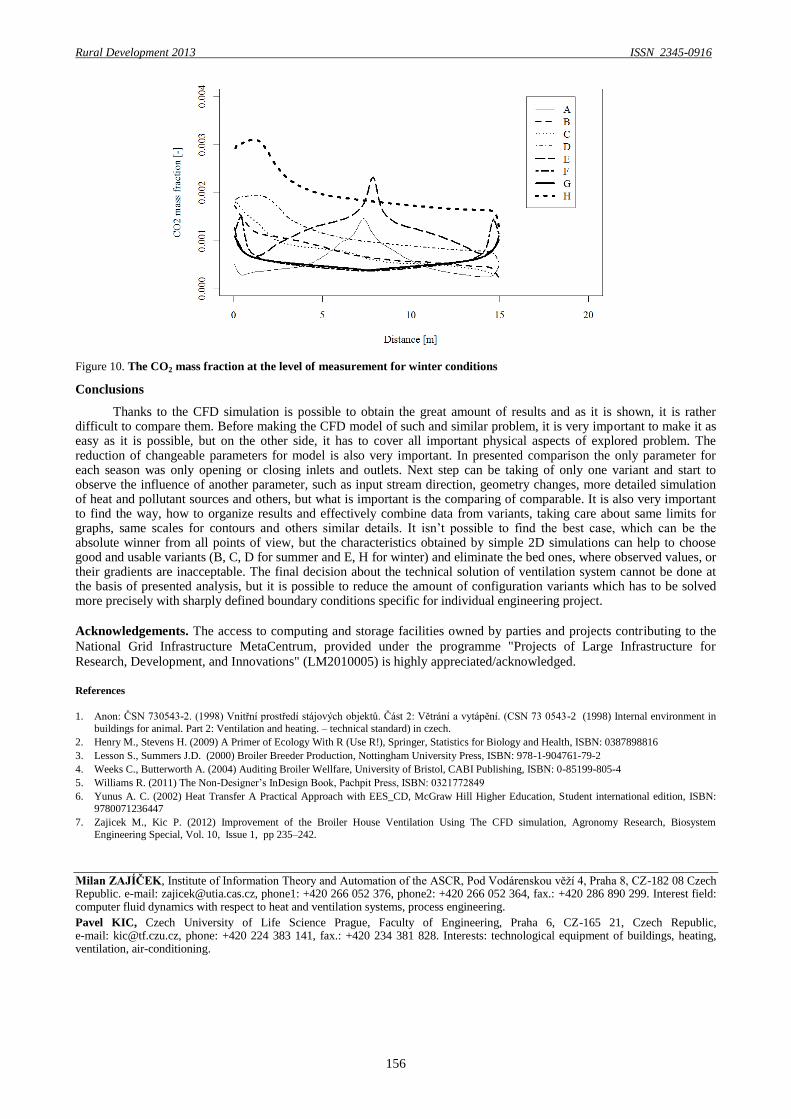
Results for winter variants: Fig. 7 and Fig. 8 show the Temperature and velocity profiles as a graphs representing values of quantities on transversal line at the height of 0,3 m above floor. Fig. 9 shows contours of temperature and velocity magnitude. The overall temperature level is given by volumetric heat source which represents the heating system. The variant E is the favorite of the comparison, because of relatively higher temperature level in the zone of animals according to other cases, but the great care has to be taken onto the ventilation effect, which is relatively small in central part of the building. This ventilation effect corresponds with comparison of CO2 concentration profile, which is also shown for winter - Fig. 10, because in this period it is the main factor which is used to determining the amount of fresh air which has to income into the ventilated area. The shape of NH3 mass fraction profiles obtained from this simple model is the same one, only the values on y axe are in the range from 0 to 2,3.10
-6 [kg.kg
-1], because of using the mixture
template model with generation of species inside the same fluid zone only with different intensity of production. It has to be mentioned, that the convergence of the solution for winter conditions is very slow and it is not easy to obtain good solution, mainly because of low velocities in a great areas of the space and greater influence of natural convection (in winter there are greater temperature gradients between the incoming cold fresh air and heated air inside the building), which leads to fragile stability of solution.
The variant H also can be important for winter conditions. Its benefit is mainly the highest and most homogeneous temperature value inside the animals zone, which is paid by greater concentration of pollutants, but, if the ventilation for this configuration will be intensive enough, the well-being of animals can be seen as the best.
Variants F and G aren’t useful for this shape of broiler house cross-section. It is mainly because of great velocities, which can be observed nearby the floor, where such intensive air stream can leads to welfare problems of animals and can leads to their thermal discomfort.
It is interesting to mention also the problems which arise in case of comparison of the relatively large amount of solved problems where the most important fact is to compare the comparable. The comparable results presented needs to use exactly the identical geometrical models (no grid adaptation and shape manipulation). The variants are distinguished only by different types and values of the boundary conditions and, as already mentioned, all results presented here correspond to the same total air flow. The equivalent file and directory structure of results was produced for each solved case, and therefore the extracting of needed profiles and graphical representations of flow field can be done automatically by the own written program which produced the same color scales for all tasks and extracting the data profiles used for x-y plots of values.
It is also relatively hard to make graphical output from Fluent with exactly the same positioning and size. This problem was solved by creating the journal file originated from the usage of graphic driven menu. This journal is rather complicated and was rewrited for a universal usage on each solved case. This programming work was a little bit time consuming, but after finishing it is possible to make exactly the same set of contours (velocities, temperatures …) with the same color scheme (Color, BW, with black or white background) and exactly the same size and resolution. Such graphical outputs can be processed using the graphical batch conversion tools. After cropping, rotating and sorting it is possible to make the comparison figures as they are presented in this paper.
The R (http://www.r-project.org/ ) software, which is an integrated suite of software facilities for data manipulation, calculation and graphical display, was used very effectively as a tool for making required graphs and authors are very satisfied with its possibilities. For example it is practically impossible to create graph at Fig. 1 using MS-Excel, because of combining the large number of computed values with only a few experimentally obtained values. With R it is possible very easily.

Rural Development 2013 ISSN 2345-0916
154
Figure 4. Temperature profiles at the level of measurement for summer conditions
Figure 5. Velocity profiles at the level of measurement for summer conditions
Figure 6. Contours of temperature and velocity magnitude for summer conditions

Rural Development 2013 ISSN 2345-0916
155
Figure 7. Temperature profiles at the level of measurement for winter conditions
Figure 8. Velocity profiles at the level of measurement for winter conditions
Figure 9. Contours of temperature and velocity magnitude for winter conditions
Rural Development 2013 ISSN 2345-0916
156
Figure 10. The CO2 mass fraction at the level of measurement for winter conditions
Conclusions
Thanks to the CFD simulation is possible to obtain the great amount of results and as it is shown, it is rather difficult to compare them. Before making the CFD model of such and similar problem, it is very important to make it as easy as it is possible, but on the other side, it has to cover all important physical aspects of explored problem. The reduction of changeable parameters for model is also very important. In presented comparison the only parameter for each season was only opening or closing inlets and outlets. Next step can be taking of only one variant and start to observe the influence of another parameter, such as input stream direction, geometry changes, more detailed simulation of heat and pollutant sources and others, but what is important is the comparing of comparable. It is also very important to find the way, how to organize results and effectively combine data from variants, taking care about same limits for graphs, same scales for contours and others similar details. It isn’t possible to find the best case, which can be the absolute winner from all points of view, but the characteristics obtained by simple 2D simulations can help to choose good and usable variants (B, C, D for summer and E, H for winter) and eliminate the bed ones, where observed values, or their gradients are inacceptable. The final decision about the technical solution of ventilation system cannot be done at the basis of presented analysis, but it is possible to reduce the amount of configuration variants which has to be solved more precisely with sharply defined boundary conditions specific for individual engineering project.
Acknowledgements. The access to computing and storage facilities owned by parties and projects contributing to the
National Grid Infrastructure MetaCentrum, provided under the programme "Projects of Large Infrastructure for
Research, Development, and Innovations" (LM2010005) is highly appreciated/acknowledged.
References
1. Anon: ČSN 730543-2. (1998) Vnitřní prostředí stájových objektů. Část 2: Větrání a vytápění. (CSN 73 0543-2 (1998) Internal environment in
buildings for animal. Part 2: Ventilation and heating. – technical standard) in czech.
2. Henry M., Stevens H. (2009) A Primer of Ecology With R (Use R!), Springer, Statistics for Biology and Health, ISBN: 0387898816
3. Lesson S., Summers J.D. (2000) Broiler Breeder Production, Nottingham University Press, ISBN: 978-1-904761-79-2
4. Weeks C., Butterworth A. (2004) Auditing Broiler Wellfare, University of Bristol, CABI Publishing, ISBN: 0-85199-805-4
5. Williams R. (2011) The Non-Designer’s InDesign Book, Pachpit Press, ISBN: 0321772849
6. Yunus A. C. (2002) Heat Transfer A Practical Approach with EES_CD, McGraw Hill Higher Education, Student international edition, ISBN:
9780071236447
7. Zajicek M., Kic P. (2012) Improvement of the Broiler House Ventilation Using The CFD simulation, Agronomy Research, Biosystem
Engineering Special, Vol. 10, Issue 1, pp 235–242.
Milan ZAJÍČEK, Institute of Information Theory and Automation of the ASCR, Pod Vodárenskou věží 4, Praha 8, CZ-182 08 Czech Republic. e-mail: [email protected], phone1: +420 266 052 376, phone2: +420 266 052 364, fax.: +420 286 890 299. Interest field: computer fluid dynamics with respect to heat and ventilation systems, process engineering.
Pavel KIC, Czech University of Life Science Prague, Faculty of Engineering, Praha 6, CZ-165 21, Czech Republic, e-mail: [email protected], phone: +420 224 383 141, fax.: +420 234 381 828. Interests: technological equipment of buildings, heating, ventilation, air-conditioning.

Rural Development 2013 ISSN 1822-3230
RURAL DEVELOPMENT 2013
PROCEEDINGS
Volume 6, Book 3
Kaunas, Akademija, 2013
Editor-in-chief and responsible compiler of the proceedings:
Prof. dr. Vilma Atkočiūnienė
Redactors:
Prof. dr. Audrius Aleknavičius
Assoc. prof. dr. Jonas Čėsna
Assoc. prof. dr. Vida Čiulevičienė
Prof. dr. Sigitas Daukilas
Assoc. prof. dr. Antanas Dumbrauskas
Assoc. prof. dr. Sonata Kazlauskaitė
Lect. Rasa Rukuiženė
Assoc. prof. dr. Valerija Vinciūnienė
Assoc. prof. dr. Remigijus Žalkauskas
Asist. Rasa Pakeltienė
Lect. dr. Lina Šarlauskienė
Layout designers: Aldona Bagdonienė, Danguolė Raudonienė
