eval 6970: meta-analysis fixed-effect and random- effects models dr. chris l. s. coryn spring 2011
Post on 19-Dec-2015
223 views
TRANSCRIPT

EVAL 6970: Meta-AnalysisFixed-Effect and Random-Effects Models
Dr. Chris L. S. CorynSpring 2011

Agenda
• Fixed-effect models for meta-analysis• Random-effects models for meta-
analysis• Review questions• In-class activity

Fixed-Effect Models
• Under the fixed-effect model it is assumed that all studies share a common (true) effect size
• All factors that could influence the effect size are the same across all studies (the true effect is the same, thus fixed)
• The true (unknown) effect size is

Fixed-Effect Models
Fixed-effect model: True effect

Fixed-Effect Models
• Given that all studies share the same true effect, the observed effect size varies from study to study only because of random (sampling) error
• Although error is random, the sampling distribution of the errors can be estimated

Fixed-Effect Models
𝑌 𝑖=𝜃+𝜀𝑖Fixed-effect model: True effects and sampling error

Fixed-Effect Models
• To obtain an estimate of the population effect (to minimize variance) a weighted mean is computed using the inverse of each study’s variance as the study’s weight in computing the mean effect

Fixed-Effect Models
• The weighted mean () is computed as
𝑀=∑𝑖=1
𝑘
𝑊 𝑖𝑌 𝑖
∑𝑖=1
𝑘
𝑊 𝑖

Fixed-Effect Models
• Where the weight assigned to each study is
• Where is the within-study variance for study
𝑊 𝑖=1𝑉 𝑌 𝑖

Fixed-Effect Models
• With
• And
• And
𝑉𝑀=1
∑𝑖=1
𝑘
𝑊 𝑖
𝑆𝐸𝑀=√𝑉𝑀
𝐿𝐿𝑀=𝑀−1.96×𝑆𝐸𝑀
𝑈𝐿𝑀=𝑀+1.96×𝑆𝐸𝑀
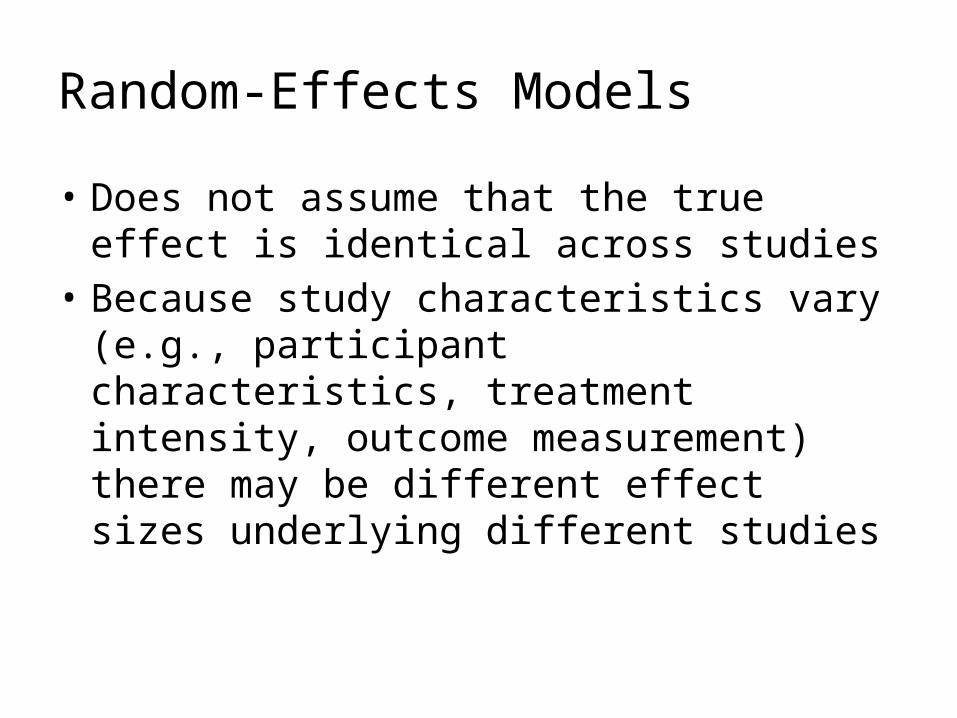
Random-Effects Models
• Does not assume that the true effect is identical across studies
• Because study characteristics vary (e.g., participant characteristics, treatment intensity, outcome measurement) there may be different effect sizes underlying different studies

Random-Effects Models
Random-effects model: True effects

Random-Effects Models
• If the true effect size for a study is then the observed effect will be less than or greater than due to sampling error
• The distance between the summary mean and the observed effect consists of true variation in effect sizes () and sampling error ()

Random-Effects Models
𝑌 𝑖=𝜇+𝜁 𝑖+𝜀𝑖Random-effects model: True effect and observed effect
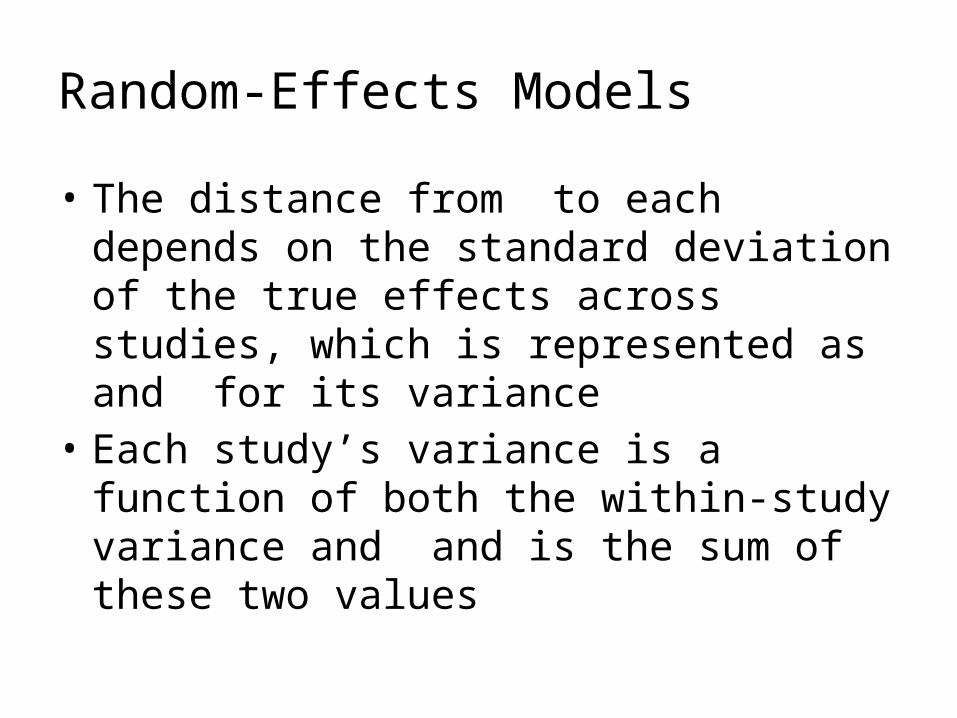
Random-Effects Models
• The distance from to each depends on the standard deviation of the true effects across studies, which is represented as and for its variance
• Each study’s variance is a function of both the within-study variance and and is the sum of these two values

Random-Effects Models
• is estimated as
• Where
𝑇 2=𝑄−𝑑𝑓𝐶
𝑄=∑𝑖=1
𝑘
𝑊 𝑖𝑌 𝑖2−
(∑𝑖=1
𝑘
𝑊 𝑖𝑌 𝑖)2
∑𝑖=1
𝑘
𝑊 𝑖

Random-Effects Models
• With
• Where is the number of studies
• And
𝑑𝑓=𝑘−1
𝐶=∑𝑊 𝑖−∑𝑊 𝑖
2
∑𝑊 𝑖

Random-Effects Model
• Under the random-effects model the weight assigned to each study is
• Where is the within-study variance for study plus the between study variance
𝑊 𝑖∗=
1
𝑉 𝑌 𝑖
∗

Random-Effects Models
• Where
• With the weighted mean computed as
𝑉 𝑌 𝑖
∗ =𝑉 𝑌 𝑖+𝑇 2
𝑀∗=∑𝑖=1
𝑘
𝑊 𝑖∗𝑌 𝑖
∑𝑖=1
𝑘
𝑊 𝑖∗

Random-Effects Models
• With
• And
• And
𝑉𝑀 ∗=1
∑𝑖=1
𝑘
𝑊 𝑖∗
𝑆𝐸𝑀 ∗=√𝑉 𝑀∗
𝐿𝐿𝑀∗=𝑀∗−1.96×𝑆𝐸𝑀 ∗
𝑈𝐿𝑀∗=𝑀∗+1.96×𝑆𝐸𝑀 ∗

Review Questions
1. When is it appropriate to use a fixed-effect model?
2. When is it appropriate to use a random-effects model?
3. How do the study weights differ for fixed-effect and random-effects models?

Today’s In-Class Activity
• Individually, or in your working groups, download “Data Sets 1-6 XLSX” from the course Website– Calculate the fixed-effect and random-effects
model weighted means for Data Sets 1, 2, 3, 4, 5, and 6
– Calculate the 95% confidence intervals (i.e., LL and UL) for the weighted means from Data Sets 1, 2, 3, 4, 5, and 6
– Use “Meta-Analysis with Means, Binary Data, and Correlations XLSX” to assist with the calculations