evaluate h2ri wicking fabric for pavement …
TRANSCRIPT

EVALUATE H2RI WICKING FABRIC FOR PAVEMENT
APPLICATION – YEAR 2 FINAL PROJECT REPORT
by
Xiong Zhang, Ph.D., P.E., Associate Professor
Department of Civil and Environmental Engineering University of Alaska Fairbanks
Billy Connor, P.E.
Department of Civil and Environmental Engineering University of Alaska Fairbanks
Sponsorship
Pacific Northwest Transportation Consortium
for
Pacific Northwest Transportation Consortium (PacTrans)
USDOT University Transportation Center for Federal Region 10
University of Washington
More Hall 112, Box 352700
Seattle, WA 98195-2700
In cooperation with US Department of Transportation-Research and Innovative Technology
Administration (RITA)

Disclaimer
The contents of this report reflect the views of the authors, who are responsible for the
facts and the accuracy of the information presented herein. This document is disseminated
under the sponsorship of the U.S. Department of Transportation’s University
Transportation Centers Program, in the interest of information exchange. The Pacific
Northwest Transportation Consortium, the U.S. Government and matching sponsor
assume no liability for the contents or use thereof.
Technical Report Documentation Page
1. Report No.
2013-S-UAF-0026 2. Government Accession No.
01497959 3. Recipient’s Catalog No.
4. Title and Subtitle
Evaluate H2RI Wicking Fabric for Pavement Applications
5. Report Date
10/31/2015
6. Performing Organization Code
INE/PacTrans 15.12
Xiong Zhang, and Billy Connor 8. Performing Organization Report No. INE/PacTrans 15.12
9. Performing Organization Name and Address
PacTrans
Pacific Northwest Transportation Consortium
University Transportation Center for Region 10
University of Washington More Hall 112 Seattle, WA 98195-2700
Alaska University Transportation Center
P.O. Box 755900 Fairbanks, AK 99775-5900
10. Work Unit No. (TRAIS)
11. Contract or Grant No.
G00008085
12. Sponsoring Organization Name and Address
United States of America
Department of Transportation
Research and Innovative Technology Administration
Alaska Department of Transportation & Public Facilities
Research, Development, and Technology Transfer
2301 Peger Road
Fairbanks, AK 99709-5399
13. Type of Report and Period Covered Research: July 1, 2013 to October 31, 2015
14. Sponsoring Agency Code
15. Supplementary Notes
Report uploaded at www.pacTrans.org
16. Abstract
17. Key Words Geotextiles (Rbmdxcet), Geosynthetics (Rbmdxce),
Woven fabrics (Rbmdxcxf)
18. Distribution Statement
No restrictions.
19. Security Classification (of this
report)
Unclassified.
20. Security Classification (of this
page)
Unclassified.
21. No. of Pages
56
22. Price
NA
Form DOT F 1700.7 (8-72) Reproduction of completed page authorized

i
Table of Contents
CHAPTER 1 INTRODUCTION .................................................................................................... 1
CHAPTER 2 LITERATURE REVIEW ......................................................................................... 1
2.1 Adverse Effects of Subsurface Water in Pavement Design .................................................. 1
2.2 Types and Sources of Subsurface Water ............................................................................... 5
2.3 Conventional Drainage Design Methods .............................................................................. 5
2.4 Comparisons of Conventional and New Drainage Design Concept ................................... 12
2.5 Geosynthetic Application in New Drainage Design ........................................................... 14
2.6 Geotextile with Wicking Ability ......................................................................................... 15
2.7 Case Studies of Geotextile with Wicking Ability ............................................................... 20
2.8 Potential Issues .................................................................................................................... 27
2.9 Reference ............................................................................................................................. 31
CHAPTER 3 TESTING FLUME SETUP .................................................................................... 33
CHAPTER 4 TEST RESULTS AND DISCUSSIONS ................................................................ 37
Case 1: Wicking Test for Sand .................................................................................................. 37
Case 2: Wetting Test for Sand ................................................................................................... 39
Case 3: Rewicking Test for Sand .............................................................................................. 41
Case 4: Wicking Test for Silt .................................................................................................... 43
Case 5: Rewicking Test for Silt ................................................................................................. 45
CHAPTER 5 SUMMARY AND CONCLUSIONS ..................................................................... 48
ii
List of Figures
Figure 2.1 Adverse Effects of Water on Asphalt Concrete (AC) Pavement ................................................... 3
Figure 2.2 Adverse Effects of Water on Portland Cement Concrete (PCC) Pavement .................................. 3
Figure 2.3 Ice Lenses Formation ................................................................................................................... 5
Figure 2.4 1Hour/ 1 Year Precipitation Rate ................................................................................................. 8
Figure 2.5 Flow Rate in Horizontal Drainage Blanket .................................................................................. 10
Figure 2.6 Conventional Drainage Design Concept ..................................................................................... 12
Figure 2.7 New Drainage Design Concept ................................................................................................... 14
Figure 2.8 Geosynthetic Category ............................................................................................................... 15
Figure 2.9 Innovative Geotextile with Wikcing Fabric ................................................................................ 16
Figure 2.10 Wetting Front Movement Tests ............................................................................................... 18
Figure 2.11 Schematic Plots of Rainfall Infiltration Test ............................................................................. 19
Figure 2.12 Rainfall Infiltration Test Results ............................................................................................... 19
Figure 2.13 Schematic Plot of Test Section ................................................................................................. 21
Figure 2.14 Moisture Contours in Test Section ........................................................................................... 22
Figure 2.15 Test Section Comparison .......................................................................................................... 23
Figure 2.16 Preliminary Field Observation at Coldfoot, AK ......................................................................... 24
Figure 2.17 Field Observation at St. Louis County, MO ............................................................................... 24
Figure 2.18 Schematic Plot of Test Section at Texas County, TX ................................................................. 25
Figure 2.19 Field Construction at Corona, CA ............................................................................................. 26
Figure 2.20 Field Construction at Jefferson County, WI .............................................................................. 27
Figure 2.21 Clogging Effect SEM Images ..................................................................................................... 28
Figure 2.22 Mechanical Failure SEM Images ............................................................................................... 29
Figure 2.23 SEM Images of Punctuation Failure ......................................................................................... 30
Figure 3.1 Schematic Plot of Testing Flume and Sensor Location ............................................................... 35
Figure 3.2 Testing Flume Construction ....................................................................................................... 36
Figure 3.3 Data Acquisition System ............................................................................................................. 37
Figure 4.1 Moisture Contour for Wicking Test (Sand) ................................................................................. 39
Figure 4.2 Moisture Contour for Wetting Test (Sand) ................................................................................ 41
Figure 4.3 Moisture Contour for Rewicking Test (Sand) ............................................................................. 43
Figure 4.4 Moisture Contour for Wicking Test (Silt) ................................................................................... 45
Figure 4.5 Moisture Contour for Rewicking Test (Silt) ................................................................................ 47
Figure 4.6 Photo of organic silt and blinding of the fabric at the bottom .................................................. 48
Figure 5.1 1500x photo-micrograph of wicking fiber bundle blinded by organic silt ................................. 49

iii
List of Tables
Table 2.1 Geotextile Specification ................................................................................................ 16
1
CHAPTER 1 INTRODUCTION
H2Ri wicking fabric is gaining popularity for removing moisture from roadway embankments.
Alaska’s first experience was at Beaver Slide, Mile 110.5 on the Dalton Highway. Beaver slide
had been problematic since its construction in 1975. The site is situated on a side hill cut with a
roadway grade exceeding 6%. The soil at Beaver Slide is a sand with about 6 % passing the
#200 sieve. This combination caused water to move across and along the roadway causing wet
soft spots in the roadway. Freeze-thaw caused exacerbated the problem. The installation of H2Ri
eliminated the problem. After 5 years, the roadway has been free of soft spots.
The Alaska Department of Transportation and Public Facilities (DOT&PF) use H2Ri on another
Dalton Highway project at MP 119. To date that roadway has also worked well. However,
DOT&PF has asked two questions:
1. What are the limitations of soil types that H2Ri can be expected to work?
2. Will the product continue to work when the length requirements exceed the width of the
wicking fabric?
This study is designed to answer those two questions. Two materials were used to represent the
extremes for which H2Ri might be used. The first is clean uniform sand that is free draining. This
will provide an understanding of how well the material works in a permeable soil.
The second material was organic silt obtained from the Permafrost Tunnel near Fox Alaska,
just north of Fairbanks. This soil is essentially impermeable providing an understanding of the
performance of the material under these conditions.
CHAPTER 2 LITERATURE REVIEW
2.1 Adverse Effects of Subsurface Water in Pavement Design
Excessive water in a pavement structure is recognized as one of the major adverse factors that
influence its overall performance. It can cause a variety of engineering problems, for instance,
2
causing soil expansion and collapsing, reducing the soil strength and stiffness, increasing excess
pore water pressure and developing seepage forces, stripping asphalt pavement and generating
cracks (Han and Zhang, 2014). Figure 2.1 shows the mechanism of water-induced Asphalt
Concrete (AC) pavement distress (Taylor and Khosla, 1984). Both dynamic traffic load and
thermal shrinkage induce cracks within the asphalt pavement layer. The cracks partially or
completely filled with water through infiltration. This will result in base and subgrade materials
saturation with time. Higher pore water pressure is induced by large dynamic loading of heavy
duty vehicles. In consequence, free water within the base and subgrade together with fines will
be squeezed out of the pavement structure and this phenomenon is called pumping. Free water
wedges are produced beneath the asphalt pavement. Wet softened area due to loss of fines in the
base and subgrade layers causes potholes or depressions of the pavement structure. Similar
pumping phenomena also occurs in Portland Cement Concrete (PCC) pavements (Mallela et al.,
2000), as shown in Figure 2.2. Upward curls of pavement slabs (resulting from uneven
temperatures above and beneath cement pavement slab) tend to create small pores. Free water
can easily penetrates and saturates base and subgrade layers via joints through precipitation and
infiltration. The upcoming wheel load first causes the backward slab edge deflecting downward
and generates large pore water pressure. When the wheel passes the joint, the forward slab
deflects downward and previous backward slab rebounds upward. The cyclic downward
deflecting- upward rebounding process pumps water out of the pavement structure together with
fines. The materials beneath the joints of slabs erode with time, and fault or crack near joint will
further accelerate the deteriorating process.

3
Figure 2.1 Adverse Effects of Water on Asphalt Concrete (AC) Pavement
Figure 2.2 Adverse Effects of Water on Portland Cement Concrete (PCC) Pavement
Another adverse effect of water on pavement structure is called “frost boiling”, which causes
extensive damage in northern regions or cold climates. The mechanism of “frost boiling”
phenomena is related to frost heave and thaw weakening processes (Chamberlain, 1987), as
4
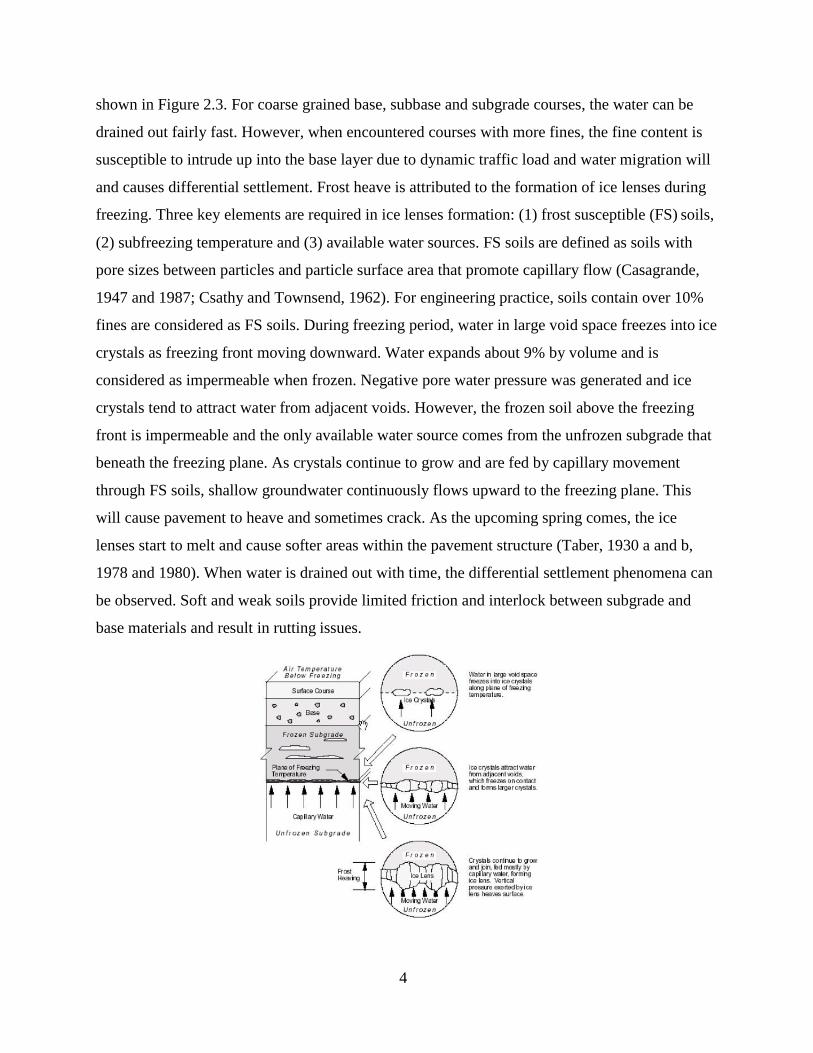
shown in Figure 2.3. For coarse grained base, subbase and subgrade courses, the water can be
drained out fairly fast. However, when encountered courses with more fines, the fine content is
susceptible to intrude up into the base layer due to dynamic traffic load and water migration will
and causes differential settlement. Frost heave is attributed to the formation of ice lenses during
freezing. Three key elements are required in ice lenses formation: (1) frost susceptible (FS) soils,
(2) subfreezing temperature and (3) available water sources. FS soils are defined as soils with
pore sizes between particles and particle surface area that promote capillary flow (Casagrande,
1947 and 1987; Csathy and Townsend, 1962). For engineering practice, soils contain over 10%
fines are considered as FS soils. During freezing period, water in large void space freezes into ice
crystals as freezing front moving downward. Water expands about 9% by volume and is
considered as impermeable when frozen. Negative pore water pressure was generated and ice
crystals tend to attract water from adjacent voids. However, the frozen soil above the freezing
front is impermeable and the only available water source comes from the unfrozen subgrade that
beneath the freezing plane. As crystals continue to grow and are fed by capillary movement
through FS soils, shallow groundwater continuously flows upward to the freezing plane. This
will cause pavement to heave and sometimes crack. As the upcoming spring comes, the ice
lenses start to melt and cause softer areas within the pavement structure (Taber, 1930 a and b,
1978 and 1980). When water is drained out with time, the differential settlement phenomena can
be observed. Soft and weak soils provide limited friction and interlock between subgrade and
base materials and result in rutting issues.

5
Figure 2.3 Ice Lenses Formation
2.2 Types and Sources of Subsurface Water
The subsurface water exists in 4 forms: water vapor, bounded water, capillary water and free (or
gravitational water) (Kochina and Ya, 1952; Aravin and Numerov, 1953 and Muskat, 1946). The
water vapor in most cases stores inside soil pores where above the saturation zone. In the
existing subdrainage design methods, water vapor transmission is negligible. For bounded water,
it is relatively hard to move from the soil particles and can be considered as part of the soil
particles. This part of the water phase in soil also cannot move under gravity force and therefore
is not considered in most subdrainage design methods. Capillary water also exists in the soil
pores where above the saturation zone. However, different from water vapor, it can flow under
the action of surface tension. The height of capillary rise is a function of the soil particle
distribution, which relates to soil particle size distribution and density (Lane and Washburn,
1946; Barber and Sawyer, 1952). Since capillary water cannot be drained out by gravity, the
most common way to control capillary water is to lower the water table or use capillary barrier,
which blocks the upward capillary flow. Last but the most common type of water, namely free
water, is the water in liquid form that flows under the force of gravity and obeys Darcy’s law.
Control free water becomes the major concern in the existing subdrainage design methods.
The subsurface water comes from a variety of sources and mainly falls into two categories:
groundwater and infiltration (Brown et al., 2001). Groundwater refers to the water exists in the
saturation zone below the water table. The major source of groundwater is precipitation.
Infiltration water is defined as the water seeps into the pavement structure through pavement
surface, shoulders or median. Precipitation is also the major source for infiltration water. For
bituminous pavements, the primary infiltration water source is longitudinal joints at shoulders
and construction joints between strips of paving. As for concrete slabs, infiltration water takes
place through cracks, joints and shoulders (Cedergren, 1974 and Cedergren et al., 1973).
2.3 Conventional Drainage Design Methods
6
In order to obtain sufficient pavement drainage, the major design considerations involve:
preventing the amount of water entering the pavement structure and quickly removing water that
enters the pavement system, using materials that are insensitive to the effect of moisture, and
incorporating design methods to minimize water damage (MEPDG, 2004; FHWA, 1980 and
AASHTO 1993). One design method to minimize surface infiltration is to provide adequate
longitudinal and cross slopes. The less time the water detained on the road surface, the less
amount of water can infiltrate into pavements through joints and cracks. Another common
method is to seal joins, cracks and all other discontinuities that allow water to infiltrate into the
pavement structure. Except for those two methods, moisture insensitive materials, such as ATB
(Asphalt Treated Base), CTB (Cement Treated Base) and granular materials with less fines, are
also popular in controlling the water content in pavement structures.
A subsurface drainage system can be categorized into the following 4 types: (1) longitudinal
drains, (2) transverse and horizontal drains, (3) drainage blankets and (4) well systems. A
longitudinal drain involves either a trench of substantial depth or a collector pipe (or protective
filter) that parallel to the roadway centerline. Transverse drains run laterally beneath the roadway
that are designed to drain both groundwater and infiltration water in base and subbase courses.
Drainage blanket refers to a very permeable layer that can be used beneath or as an integral part
of the pavement structure to remove infiltration or groundwater from both gravity and artesian
sources. Although base and subbase courses are relatively permeable, they are not considered as
drainage blanket layer unless they are specially designed with high coefficient of permeability, a
positive outlet for water collection and with protective filter layer. System of vertical wells often
been used to lower groundwater level and relieve pore water pressure. Sand filled vertical wells
are commonly used to accelerate drainage of soft and compressible foundation materials
(Rutledge and Johnson, 1958; Rechart, 1957).
In recognition of impact moisture can have on pavement performance, the AASHTO Design
Guide incorporated an empirical drainage coefficient into design equations. Four approaches
commonly employed to control or reduce moisture problems are listed below:

7
1. Prevent moisture from entering the pavement system. Provide adequate cross slopes and
longitudinal slopes. In general, the less time the water is allowed to stay on the pavement
slopes is based on the pavement surface, the less moisture can infiltrate through joints
and cracks. (Anderson et al., 1998). Joint and crack sealing are required throughout the
pavement service life.
2. Use materials that are insensitive to the effects of moisture, such as lean concrete base,
cement treated base, asphalt treated base and gravel base with limited fines. Open-graded
material allows easier movement of moisture through material.
3. Removal of free water through subsurface drainage. Consider providing three types of
drainage systems: surface drainage, groundwater drainage and subsurface drainage
(subdrainage). These three are only effective for free water. Water held by capillary
forces in soils and in fine aggregates cannot be drained. The effects for this bound
moisture are considered in the EICM through adjustments to pavement materials
properties.
Mechanistic-Empirical Design Guide (FHWA, 2004) is the most commonly used pavement
design guidebook. Within the Appendix SS, a comprehensive description of the drainage design
method is introduced. Basically, it compares the inflow and drainage capacity to determine if the
drainage design is sufficient drainage both groundwater and infiltration water quickly enough.
Estimation of Inflow
Water inflow sources include surface infiltration, ground water infiltration and meltwater (from
ice lenses). Surface infiltration is the most important and should be always considered in
subdrainage design. Groundwater shall be lowered by deep longitudinal drains and shall not be
allowed to seep into the pavement structure. If it is not feasible, the amount of seepage entering
the drainage layer shall be estimated. The meltwater from ice-lenses only need to be considered
in northern climates with frost heave. Because fine grained soils are very impermeable, it is
unlikely that flow from both groundwater and meltwater will occur at the same time. Therefore,
only the larger of the inflows needs be considered.
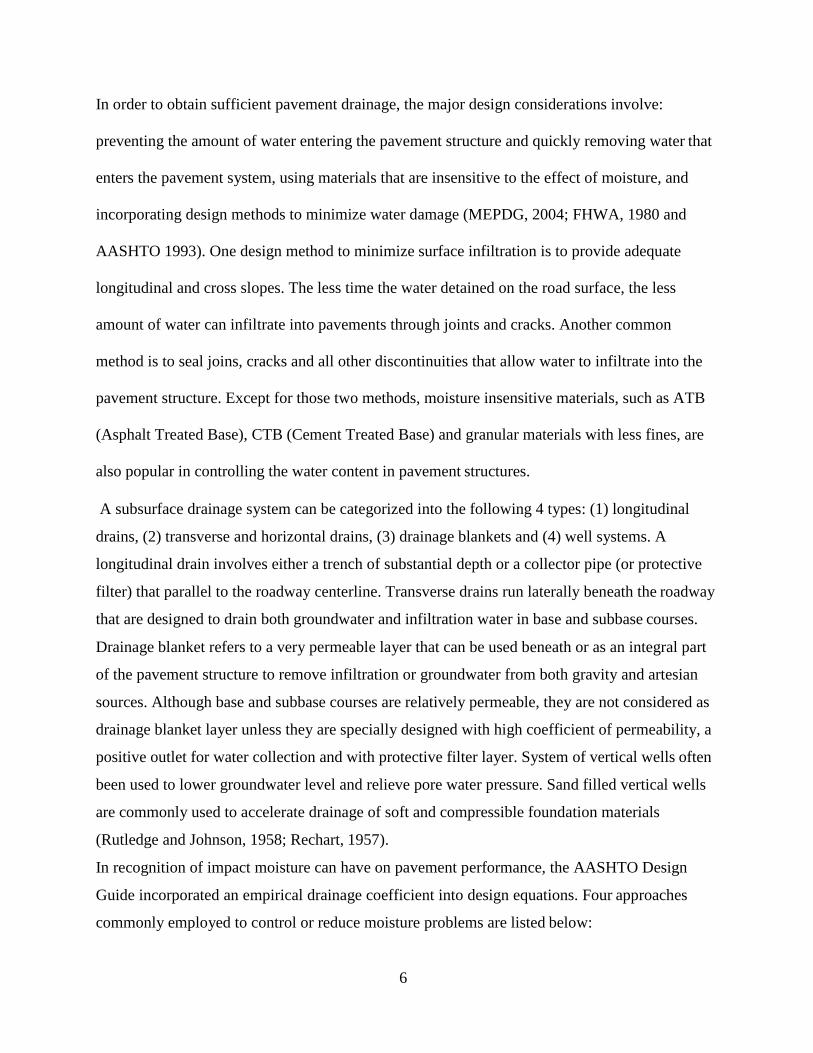
The amount of infiltration is related directly to cracking. For evaluating the amount of water via
infiltration, the duration of rainfall is a more critical factor than the intensity. Equation 1 is
adopted to determine the infiltration rate and Figure 1 shows the isotropic precipitation rate
contour.
8
𝑖 �
�
𝐶
Figure 2.4 1Hour/ 1 Year Precipitation Rate
𝑞 = � (
𝑊
+ 𝑊𝑐 ) + 𝑘 (1) 𝑊 𝐶
𝑝
Where, 𝑝 𝑠
qi = infiltration rate per unit area, ft3/hr/ft2;
Ic = cracking infiltration rate, 2.4 ft3/day/ft;
Nc = number of longitudinal cracks;
Wp = width of pavement subjected to infiltration;
Wc = length of transverse cracks or joints;
Cs = spacing of transverse cracks or joints;
kp = rate of infiltration through uncracked pavement surface, which is usually equal to the
coefficient of permeability of HMA or PCC.
By assuming that Nc = N + 1, (N is number of traffic lanes), Wc = Wp, kp = 0, infiltration rate is
0.1 ft3/day/ft of crack, the inflow rate can be written as:
𝑊𝑝
𝑞 = 𝑞𝑖𝑊� = 0.1 (𝑁 + 1 + 𝑠 ) (2)
As for groundwater seepage, assuming the pavement bottom is an impermeable layer, the inflow
is divided into two parts: inflow above the bottom of the drainage layer, q1, and inflow below the
drainage layer, q2. The drainage layer is used to lower the water table, in addition to providing
drainage for surface infiltration.
(𝐻−𝐻0)2
𝑞1 = 2𝐿𝑖
(3)

9
Where,
q1 = volume of flow per unit time per unit length of the longitudinal drain, ft3/day/ft;
k = permeability of the subgrade soil;
H = initial height of the groundwater table above the impervious layer;
H0 = vertical distance between the bottom of drainage layer and the impervious layer;
Li = distance of influence, Li = 3.8 (H-H0);
After q1 has been determined, use the chart in Figure 5 to determine q2, the lateral or horizontal
flow is:
𝑞𝐿 = 𝑞1 + 𝑞2 (4)
The groundwater inflow to the drainage layer per unit area is: 2�2
𝑞� = (5) 𝑊
Where,
W = width of the roadway.
However, if the pavement is sloped to one side and the collector pipes are installed only on one
side, the lateral flow per unit length of pipe is:
𝑞𝐿 = 2(𝑞1 + 𝑞2) (6) �1+2�2
𝑞� = (7) 𝑊

10
Figure 2.5 Flow Rate in Horizontal Drainage Blanket
The design inflow is the sum of inflows from all sources minus the outflow through the subgrade
soil. When the subgrade is not affected by any water table, a simple and conservative method is
to assume the hydraulic gradient to be 1, so the outflow rate is equal to the permeability of the
soil. The outflow through subgrade depends on the permeability of the soil and on the water table
at the boundary and can be determined by the use of flownet or other simplified design chart. If
the outflow through the subgrade is neglected, the design inflow can be determined by one of the
following combinations:
1. If there is no frost action, the design inflow, qd, is the sum of surface infiltration qi and
groundwater flow qg:
𝑞� = 𝑞𝑖 + 𝑞� (8)

11
2. If there is frost action, qd is the sum of surface infiltration qi and inflow from meltwater qm:
𝑞� = 𝑞𝑖 + 𝑞� (9)
Estimate Drainage Capacity
There are two design requirements for a drainage layer: (1) the steady-state capacity must be
greater than the inflow rate, and (2) the unsteady-state capacity must be such that the water can
be drained quickly after each precipitation event. The discharge is composed of two parts:
discharge through area, H, caused by the hydraulic gradient, S; or through area H/2 caused by the
hydraulic gradient H/L. When S = 0, q = 0.5kH2/L, which is a direct application of Darcy’s law,
assuming the surface is at the top of drainage layer on one end at the bottom of the layer on the
other end, which is an average flow area of H/2.
For steady-state flow:
𝑞 = 𝑘�(� + 𝐻
) (10) 2𝐿
Where,
q = discharge capacity of the drainage layer;
k = permeability of the drainage layer;
S = slope of the drainage layer;
H = thickness of the drainage layer;
L = length of the drainage layer.
For unsteady-state flow:
Unsteady-state flow capacity is defined by the degree of drainage, which is a ratio between the
volume of water drained since the rain stops and the total storage capacity of the drainage layer.
The time for a 50% degree of drainage can be computed as:
�𝑒𝐿2 𝑡50 =
2𝑘(𝐻+𝑆𝐿) (11)
Where,
t50 = time for 50% drainage;
ne = effective porosity, which is the porosity occupied by drainage water.
For excellent drainage, AASHTO (AASHTO, 1993) requires that the water be removed within 2
hours. For the design of drainage layer, the requirement that the time for complete or 95%
drainage be less than 1h, appears to be more appropriate. The degree of drainage, U, depends on
a time facto,r Tf, and a slope factor, Sf, respectively defined as:
12
�
� 2 � =
𝑘𝐻𝑡 (12)
�𝑒𝐿
� = 𝐿𝑆
(13) 𝐻
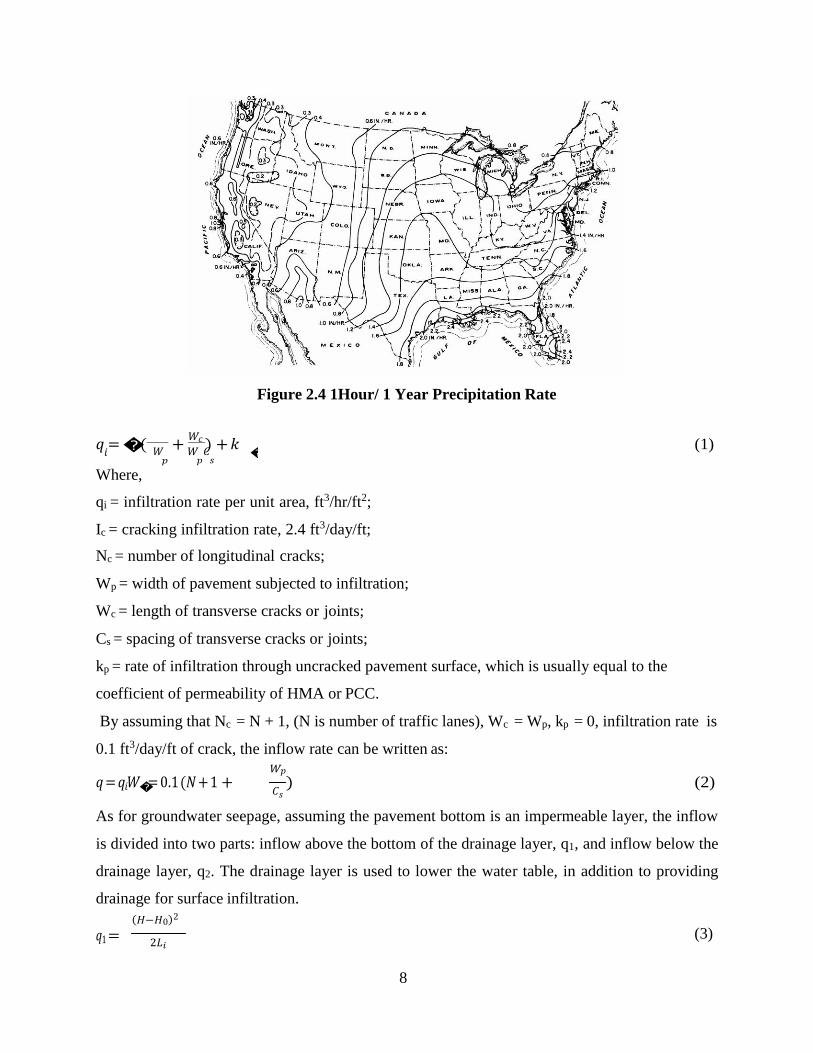
2.4 Comparisons of Conventional and New Drainage Design Concept
By investigating the existing pavement drainage design methods and criteria (MEPDG, AI,
Shell, and ASSHTO), they only deal with “free water” or gravitational water flow, and water
detained by capillary force or in fine soils (in unsaturated conditions) cannot be drained. When a
pavement structure is built, it is often built with soils at their optimum moisture contents to
achieve the best performance. After construction, the surface soils are exposed to the
surrounding atmospheric environment and dried quickly since the relative humidity in the air is
often less than 90%. Such a relative humidity corresponds to a suction value of 140 MPa
(Fredlund et al, 1993). All soils become air-dried under such high suction. Air enters the voids in
the soils and the surface soils form a dried crust which has very low permeability (nearly
impermeable) to transport water from inside to outside. In the meantime, the soils inside the
pavement structure tend to reach equilibrium with surroundings (normally the ground water
table) through capillary rise as shown in Figure 2.6.
Figure 2.6 Conventional Drainage Design Concept
When surface soils are air-dry and have cracks, they have high permeability for water
infiltration. The infiltrated water can be ponded in the upper part of the pavement under
unsaturated conditions and leads to very low suction. Other factors such the water vapor
condensation below the pavement surface during the temperature decrease in the night can also
lead to water content increase in the base and sub-base materials. The pore water pressure in the
soils is negative when the soils are unsaturated. Hence, the water cannot be drained by a
13
conventional drainage system which is typically made of granular material with large voids that
relies on gravity as a driving force for drainage. Instead, air can easily enter to the large voids
and block the outward liquid water flow. Although sometimes the granular materials are used as
a capillary barrier for liquid water flow to mitigate the frost heave and thaw-weakening problem,
they cannot prevent the water flow in the vapor form inside the embankment. Over the time, the
moisture content for soils in the pavement embankment will increase even if there is a granular
drainage layer. Another common way is to use geosynthetics as capillary barriers to prevent
capillary flow. Geotextiles can act as capillary barriers because the suction in fine grained soils
prevents water flow to larger geotextile pores. However suction decreases with increment in
water content. When the suction decreases to the air entry value it ceases the geotextile as a
capillary barrier. Meanwhile, the water accumulated in the overlying soils beyond levels
weakens the granular base or subbase layers due to the additional moisture having stored. This
could cause a problem with geotextile, geonet and geocomposite in unsaturated conditions.
In contrast, Figure 2.7 shows the new conceptual design. A layer of the wicking fabric is
proposed to be installed in the base layer parallel to the pavement surface. At the two shoulders
of the embankment, the wicking fabric is exposed to the atmosphere with a length of 2-3meters.
Due to its hydrophilic and hygroscopic nature, the wicking fibers can absorb water from the
surrounding soils inside the embankment. As discussed previously, there is big difference in the
relative humidity or suctions between the soils inside the embankment and the atmosphere. This
difference in relative humidity provides the driving force for the wicking fabric to suck the water
out of the pavement structure to the embankment shoulder, and finally the water will be
vaporized into the air to reach an equilibrium condition. Different from the conventional granular
or geotextile drainage system, the wicking fibers have many micro-channels inside which can
maintain being saturated under low relative humidity (or high suction value). Consequently, the
wicking fabric builds up a liquid connection between the inside and outside of the pavement
structure for continuous water removal. Compared with the amount of water needed to saturate
the Earth’s atmosphere, the amount of water in the embankment is very small. Therefore, the
wicking process will continue until air enters into the micro-channels of the wicking fibers.

14
Wicking
Suction > 140 MPa
(RH < 90%)
Asphalt Concrete Suction > 140 MPa
(RH < 90%)
Wicking Fabric Fabric
Relatively Dry
Air-Dry Surface
(Impermeable)
Figure 2.7 New Drainage Design Concept
2.5 Geosynthetic Application in New Drainage Design
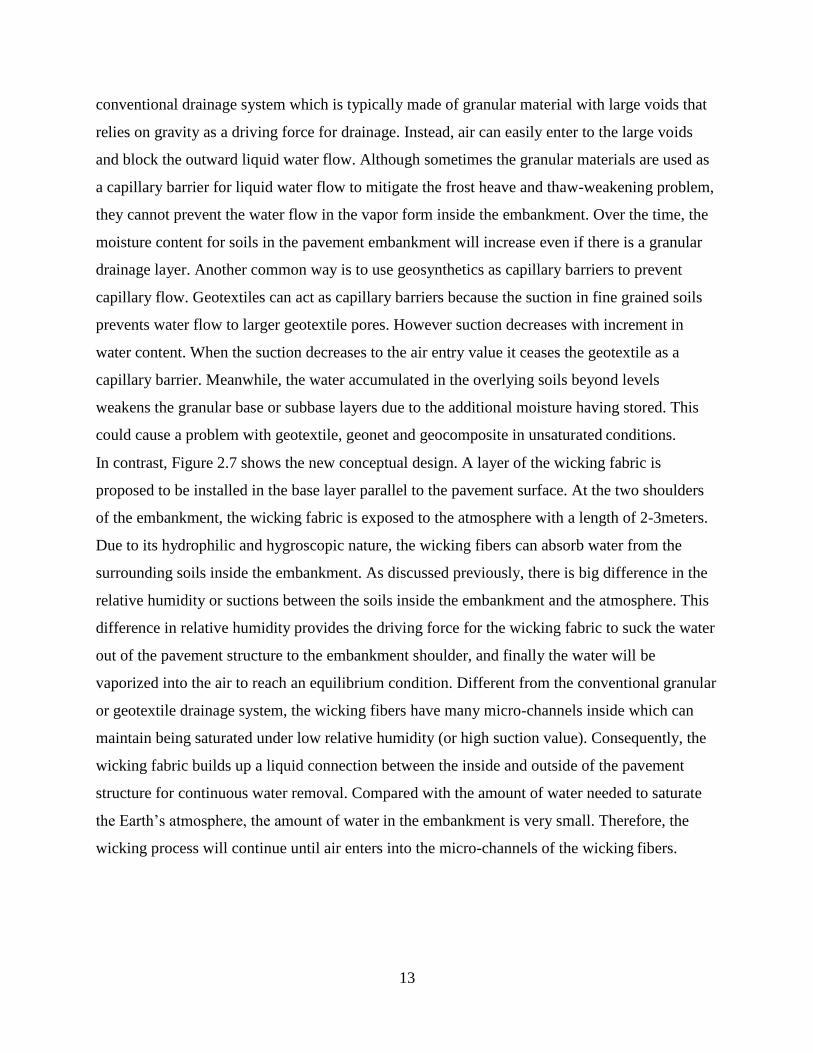
Geosynthetics are synthetic and polymeric materials used in civil engineering. There are 8 major
product categories including: geotextile, geogrid, geocell, geomembrane, geofiber, geofoam,
geosynthetic clay liner and geocomposite, as shown in Figure 2.8. Geosynthetics have wide
range of applications in geotechnical engineering, such as road, airfield, embankment, retaining
structure and reservoir.
Geotextile and geogrid are two types of geosynthetics that most commonly used in geotechnical
engineering field. The major geosynthetic functions for roadway stabilization and reinforcement
are separation, confinement, soil reinforcement, filtration and drainage. Geotextile and geogrid
can be used as a separation material, which is placed between two dissimilar materials and
maintain the integrity of both materials. For confinement function, geotextile and geogrid can be
used to prevent aggregate lateral movement, which will compromise the roadway and pavement
structure performance. Geotextile takes advantage of the friction while geogrid uses interlock to
mitigate the relative movement. For reinforcement function, both geotextile and geogrid works
effectively to spread the load and prevent excess load on different components that make up the
road.
Even though geotextile and geogrid provide separation, confinement and reinforcement
functions, when it comes to filtration and drainage function. Geotextile definitely shows more
advantages compared with geogrid. Geotextile allows free water to flow across the geotextile
plane while controls soil particle retention. As water and small particles drain through confined
layers of aggregates and subgrade, smaller particles eventually traps between bigger ones, which
results in a larger grading and providing more stable layer. It is impossible to grade aggregates
by using geogrid which has much larger openings.
15
Figure 2.8 Geosynthetic Category
2.6 Geotextile with Wicking Ability
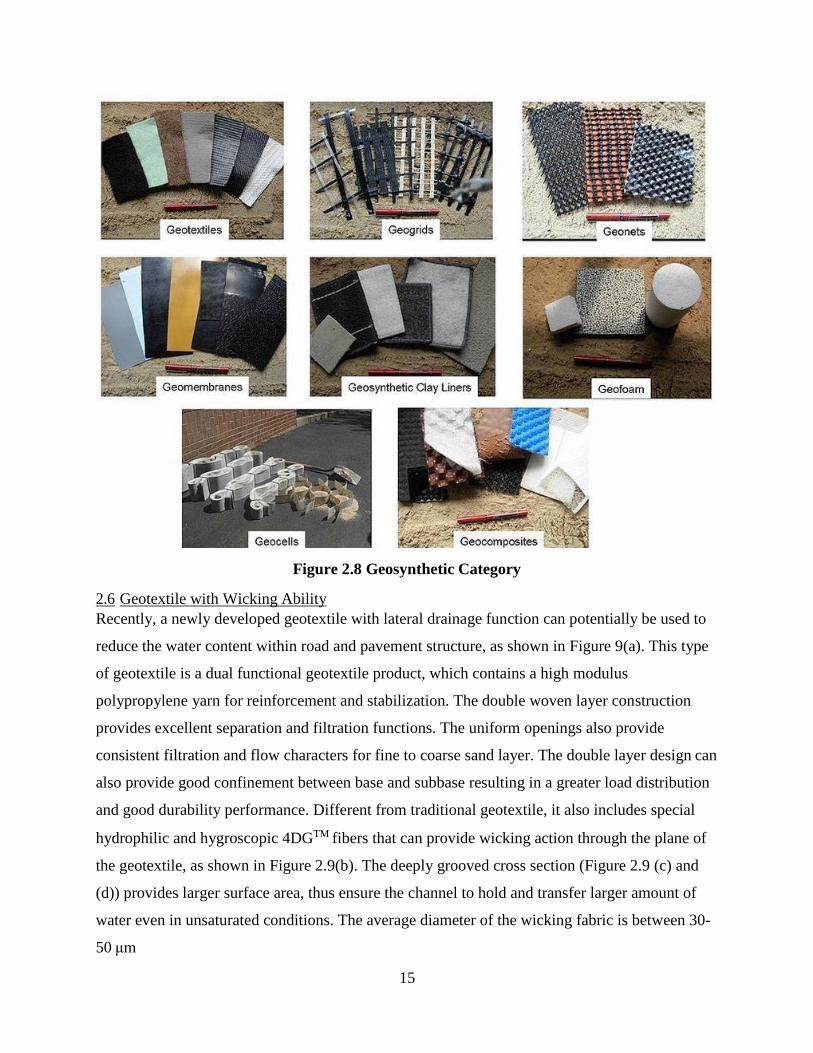
Recently, a newly developed geotextile with lateral drainage function can potentially be used to
reduce the water content within road and pavement structure, as shown in Figure 9(a). This type
of geotextile is a dual functional geotextile product, which contains a high modulus
polypropylene yarn for reinforcement and stabilization. The double woven layer construction
provides excellent separation and filtration functions. The uniform openings also provide
consistent filtration and flow characters for fine to coarse sand layer. The double layer design can
also provide good confinement between base and subbase resulting in a greater load distribution
and good durability performance. Different from traditional geotextile, it also includes special
hydrophilic and hygroscopic 4DGTM fibers that can provide wicking action through the plane of
the geotextile, as shown in Figure 2.9(b). The deeply grooved cross section (Figure 2.9 (c) and
(d)) provides larger surface area, thus ensure the channel to hold and transfer larger amount of
water even in unsaturated conditions. The average diameter of the wicking fabric is between 30-
50 μm
16
and the average groove spacing is between 5-12 μm. Detailed information for the geotextile
hydraulic and mechanical specification can be found in Table 2.1. When properly designed, it
has the potential to dehydrate the subgrade and base course under unsaturated conditions and
consequently improve the performance of pavements.
(a) (b)
(c) (d)
Figure 2.9 Innovative Geotextile with Wikcing Fabric
Table 2.1 Geotextile Specification
Mechanical Properties Test Method Unit Average Roll Value
Tensile Modulus @ 2% Strain (CD) ASTM D4595 kN/m 657
Permittivity ASTM D4491 Sec-1 0.24
Flow Rate ASTM D4491 l/min/m2 611

17
Pore Size (050) ASTM D6767 Microns 85
Pore Size (095) ASTM D6767 microns 195
Apparent Opening Size (AOS) ASTM D4751 mm 0.43 Tested Value
Wet Front Movement (24 minutes)
ASTM C1559 inches 6.0 Vertical Direction
Wet Front Movement (983 minutes) Zero Gradient
ASTM C1559 inches 73.3 Horizontal Direction
There are several papers regarding the lab tests about the innovative geotextile. First, TENCATE
GEOSYNTHETICS performed preliminary test and the test results are shown in Table 2.1. The
innovative geotextile could transport water to a distance of 72 inches (within 16.5 hours) with
zero gradient in drainage test (as shown in Figure 2.10(a)) and wick water to a height of 10
inches (within 2 hours) during capillary rise test (Figure 2.10(b)). The horizontal and vertical
wicking tests were conducted under room temperature with relative humidity smaller than 40%,
which indicates that the geotextile successfully transport water under unsaturated conditions.
Horizontal wicking test proved that the geotextile can transport water without hydraulic gradient
and vertical wicking test further validated that capillary force was greater than gravity and could
suck water to a depth of 10 inches. Both of the tests didn’t count for the amount of water
evaporated and it is expected the actual wicking distance or height should be longer and higher
than the tested results.
(a) Horizontal Wicking Length Test

18
(b) Vertical Wicking Height Test
Figure 2.10 Wetting Front Movement Tests
Researches at University of Alaska Fairbanks (Zhang and Presler, 2012) also conducted a series
of tests, including drainage test, capillary rise test, rainfall infiltration test and frost heave test, to
evaluate the effectiveness of this geotextile in controlling frost heave issue. For the drainage test,
similar results were found that vertical wicking height was 12 inches, which was slightly
different from TENCATE’s results. The variation might come from several sources such as
temperature, relative humidity, testing geotextile width. As for rainfall infiltration test, the test
apparatus is shown in Figure 2.11. Four different types of geotextiles were adopted in the
rainfall infiltration test, including a wicking fabric, a high performance (HP) reinforcement
geosynthetic, a geotextile water filter, and a drainage composite. The tested soil was first
saturated and compacted within a plastic mold. Then the mold was put upside down on a layer of
geotextile with an impermeable membrane beneath it. The water was allowed to flow for 3 days.
Test results indicated that conventional geosynthetics ceased to transport water within 1 day.
This phenomenon could be explained the relatively low geosynthetics’ air entry values. Due to
larger pore geosynthetic pore size, air could easily block the voids under small suction value. Air
bubbles were considered similar as soil solids, which were impermeable for water to flow.
However, the atmospheric suction value could be as large as 140 MPa and the geosynthetics
could be dried very fast under room temperature and relative humidity. Therefore, within limited
time period, the geosynthetics ceased to transport water and the tested soils would have larger
final water content. In contrast, the geotextile with wicking fabric had large surface area and
large air entry value, which enabled the geotextile to wick water out of the soil under higher

19
suction value and resulted in a lower final water content, as shown in Figure 2.12. Test results of
the four different types of geotextile further confirm the fact that the geotextile has advantages to
wick water out of soil under unsaturated conditions.
Figure 2.11 Schematic Plots of Rainfall Infiltration Test
Figure 2.12 Rainfall Infiltration Test Results
Moreover, Wang (Wang et al., 2015) also evaluated the effectiveness of geotextile wicking
ability under unsaturated and rainfall conditions. In order to simulate field condition, a layer of
the innovative geotextile was sandwiched by a 152 mm thick AB3 subgrade and a 381 mm thick
subgrade that mixed with Kansas River sand and Kaolinite. The geotextile extended out of the
20
closed system to the dehumidifier section so that water could be wicked out. A total amount of
11.3 kg water was poured into the system in order to simulate a 38.1 mm/hour rainfall and the
water contents with depths were monitored. Test results indicated that the geotextile effectively
wicked water out of soils compacted at optimum moisture content and the water wicked out by
the geotextile was 1.65 times greater than that by gravity. Therefore, lab test results provide
confident evidence that this type of geotextile has the potential to wick water out of soils under
unsaturated conditions and is competitive compared with other types of geotextiles.
2.7 Case Studies of Geotextile with Wicking Ability
Although both laboratory test results indicated that the H2Ri is a very promising drainage
material to wick water out of pavement structure, there was no direct evidence to prove any good
geotextile field performance. In addition, there were some concerns if the innovative geotextile
would be blocked by smaller soil particles and any mechanical punctuation would cause
malfunction. Besides the lab level tests, several reports and papers were found regarding the
wicking performance of the innovative geotextile as discussed below.
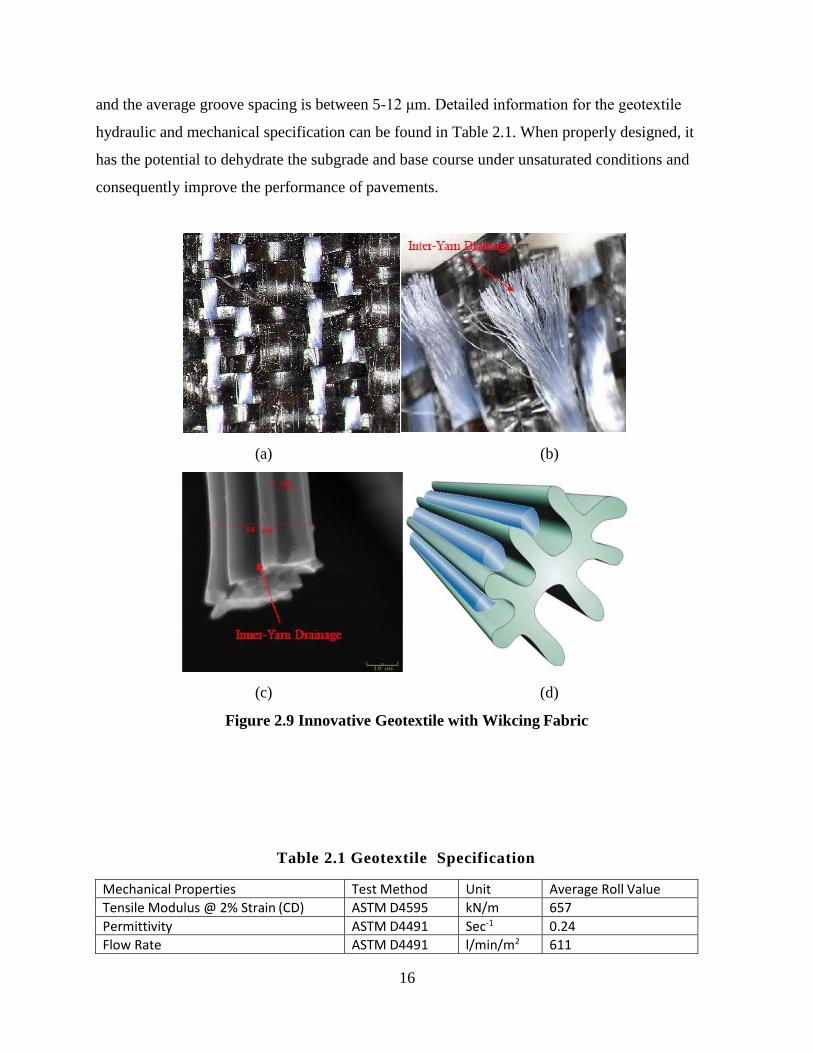
Case 1: Beaver Slide, AK
Zhang (Zhang et al., 2014) reported successful application for the innovative geotextile to
prevent frost boils in Alaska pavements. This project located at a section of Dalton Highway,
named as “Beaver Slide”, which was unpaved and suffered significant heavy truck traffic. Frost
heave and thaw weakening caused extensive damages to the pavement structures. Previous
rehabilitation with geocomposite has been proved unsuccessful. In total 22 TDR sensors were
used to monitor the temperature and water content change of a 60 ft. long road section the most
soft spot, as shown in Figure 2.13. Sieve analysis results indicated that some soils had fine
content larger than 6%, which considered as Frost Susceptible (FS) soils. Two layers of
innovative geotextile were installed 45 cm apart with the bottom geotextile. Besides temperature
and water content sensors inside the test section, other useful data such as air temperature and
relative humidity was also recorded for over 2 years.

21
Figure 2.13 Schematic Plot of Test Section
Performances of the geotextile were monitored under different climate conditions, such as
rainfall event, freezing process and thawing process. During a rainfall event (Figure 2.14(a)), the
water penetrated to a depth of 3 ft below the road surface. The drying process proceeded from
east to west, which was exactly the geotextile drainage direction. A drier zone between the two
geotextile layers also indicated that the geotextile had larger permeability than the surrounding
unsaturated soils and enabled faster drainage process. For freezing process (Figure 2.14(b)), the
freezing front penetrated to a depth of 6.5 ft. at the beginning of Nov. 2010 and then continued
to move downward to the bottom of the roadway. The unfrozen water content was smaller than
10% after the roadway was completely frozen. As for the thawing process (Figure 2.14(c)), even
though it was expected the water content would increase, the soil did not reach saturation and the
thawing process didn’t started until early spring. It is worthwhile to draw the conclusion that
thaw weakening is caused by the thawing of in situ water in the soil.
(a) Rainfall Event

22
(b) Freezing Process
(c) Thawing Process
Figure 2.14 Moisture Contours in Test Section
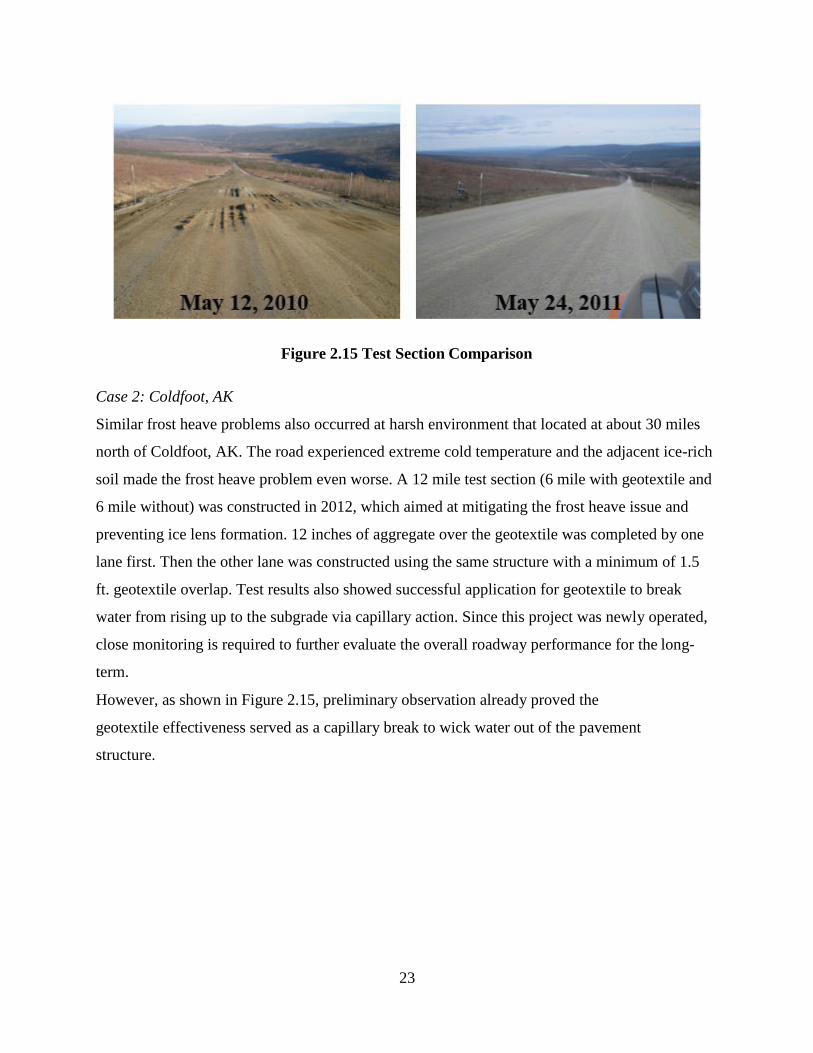
In a summary, over 2 years of monitoring shows good overall performance for the testing
section. Field observation showed a clear road surface difference for sections with and without
geotextile, as shown in Figure 2.15. No soft spot was observed during early springs and soil at
shoulder was damp, which indicated that water flowed along the direction of the geotextile
wicking fabric. The geotextile successfully eliminated the frost and thaw weakening to a depth of
3.5 ft. This could be considered as the effective depth or functional range of the geotextile
wickability. Even though soil 4.5 ft. beneath the surface and lower showed the existence of
excess water, it was beyond the frost heave and thaw weakening affecting depth and had limited
effect on roadway performance.
23
Figure 2.15 Test Section Comparison
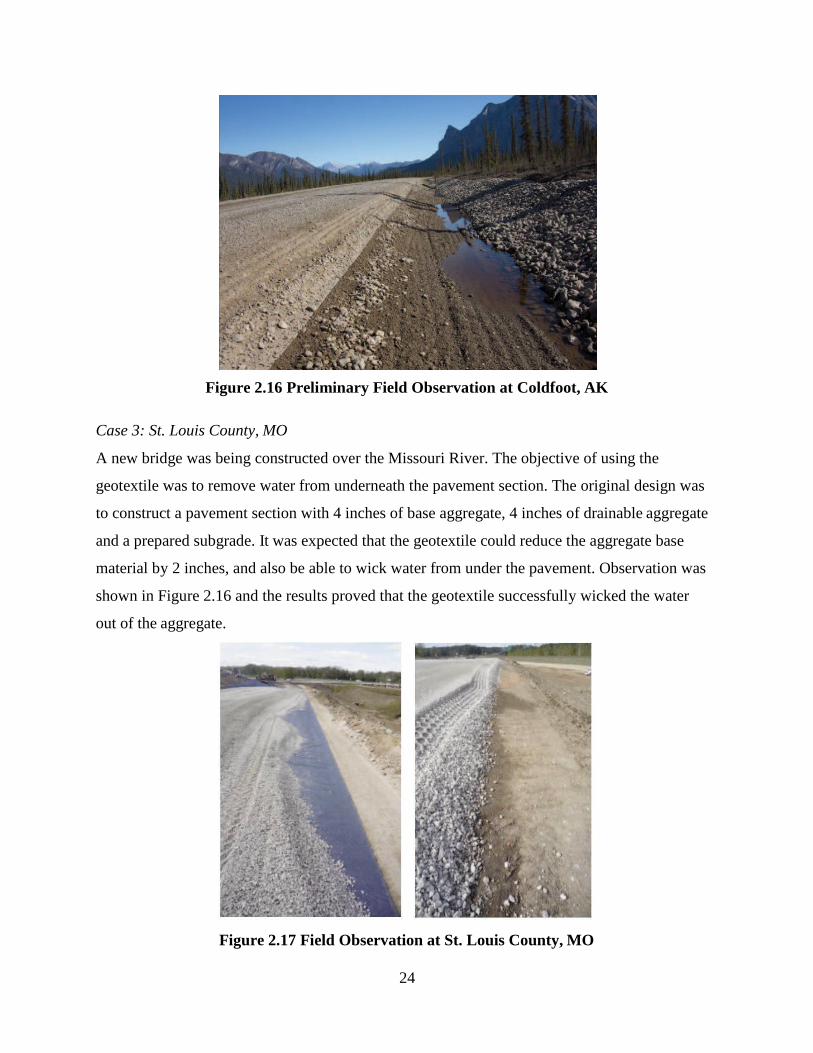
Case 2: Coldfoot, AK
Similar frost heave problems also occurred at harsh environment that located at about 30 miles
north of Coldfoot, AK. The road experienced extreme cold temperature and the adjacent ice-rich
soil made the frost heave problem even worse. A 12 mile test section (6 mile with geotextile and
6 mile without) was constructed in 2012, which aimed at mitigating the frost heave issue and
preventing ice lens formation. 12 inches of aggregate over the geotextile was completed by one
lane first. Then the other lane was constructed using the same structure with a minimum of 1.5
ft. geotextile overlap. Test results also showed successful application for geotextile to break
water from rising up to the subgrade via capillary action. Since this project was newly operated,
close monitoring is required to further evaluate the overall roadway performance for the long-
term.
However, as shown in Figure 2.15, preliminary observation already proved the
geotextile effectiveness served as a capillary break to wick water out of the pavement
structure.
24
Figure 2.16 Preliminary Field Observation at Coldfoot, AK
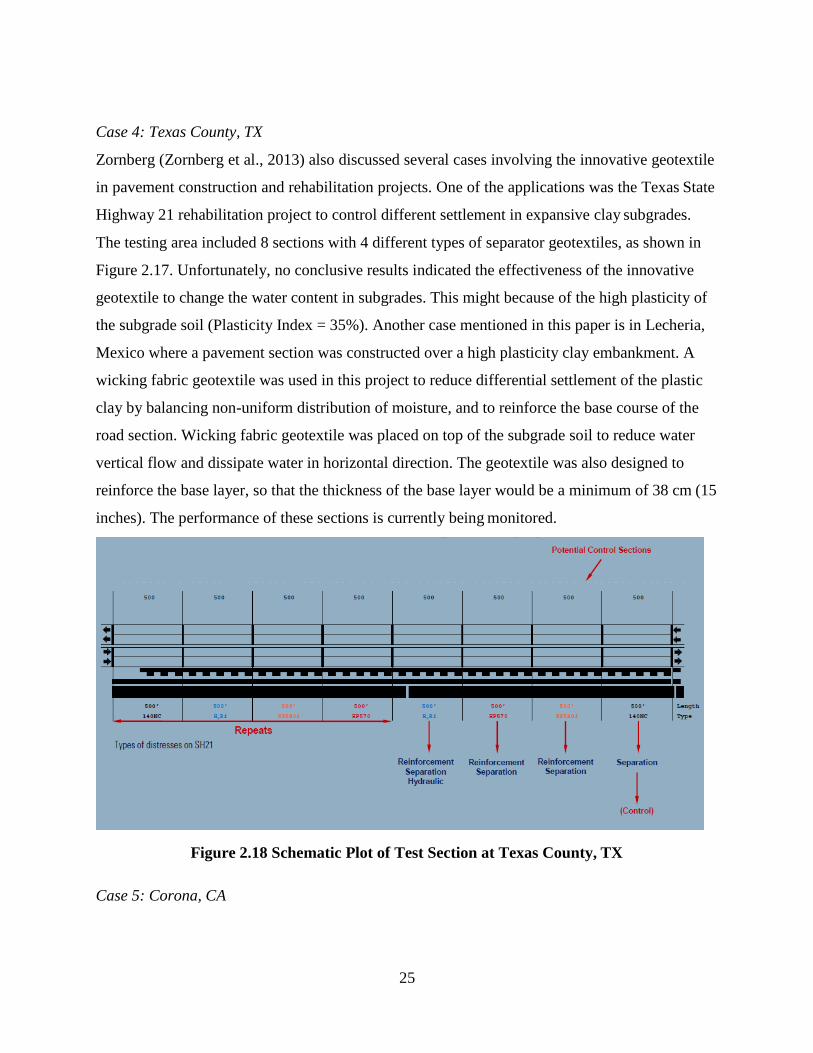
Case 3: St. Louis County, MO
A new bridge was being constructed over the Missouri River. The objective of using the
geotextile was to remove water from underneath the pavement section. The original design was
to construct a pavement section with 4 inches of base aggregate, 4 inches of drainable aggregate
and a prepared subgrade. It was expected that the geotextile could reduce the aggregate base
material by 2 inches, and also be able to wick water from under the pavement. Observation was
shown in Figure 2.16 and the results proved that the geotextile successfully wicked the water
out of the aggregate.
Figure 2.17 Field Observation at St. Louis County, MO
25
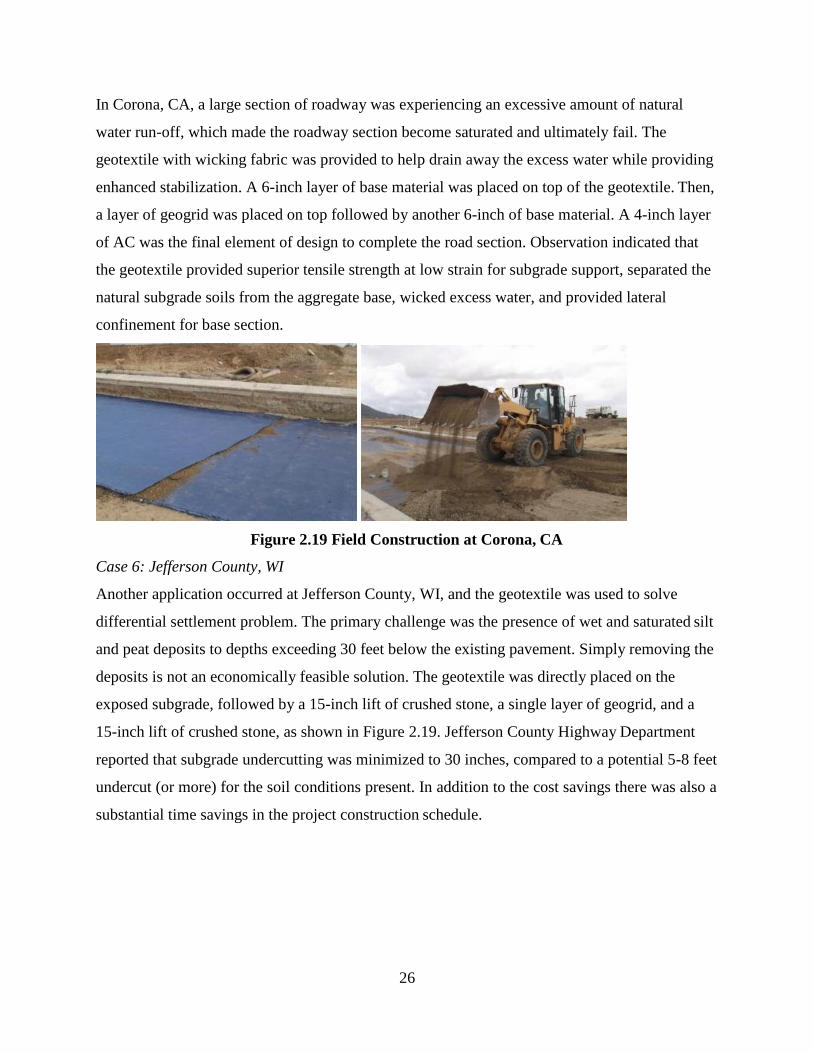
Case 4: Texas County, TX
Zornberg (Zornberg et al., 2013) also discussed several cases involving the innovative geotextile
in pavement construction and rehabilitation projects. One of the applications was the Texas State
Highway 21 rehabilitation project to control different settlement in expansive clay subgrades.
The testing area included 8 sections with 4 different types of separator geotextiles, as shown in
Figure 2.17. Unfortunately, no conclusive results indicated the effectiveness of the innovative
geotextile to change the water content in subgrades. This might because of the high plasticity of
the subgrade soil (Plasticity Index = 35%). Another case mentioned in this paper is in Lecheria,
Mexico where a pavement section was constructed over a high plasticity clay embankment. A
wicking fabric geotextile was used in this project to reduce differential settlement of the plastic
clay by balancing non-uniform distribution of moisture, and to reinforce the base course of the
road section. Wicking fabric geotextile was placed on top of the subgrade soil to reduce water
vertical flow and dissipate water in horizontal direction. The geotextile was also designed to
reinforce the base layer, so that the thickness of the base layer would be a minimum of 38 cm (15
inches). The performance of these sections is currently being monitored.
Figure 2.18 Schematic Plot of Test Section at Texas County, TX
Case 5: Corona, CA
26
In Corona, CA, a large section of roadway was experiencing an excessive amount of natural
water run-off, which made the roadway section become saturated and ultimately fail. The
geotextile with wicking fabric was provided to help drain away the excess water while providing
enhanced stabilization. A 6-inch layer of base material was placed on top of the geotextile. Then,
a layer of geogrid was placed on top followed by another 6-inch of base material. A 4-inch layer
of AC was the final element of design to complete the road section. Observation indicated that
the geotextile provided superior tensile strength at low strain for subgrade support, separated the
natural subgrade soils from the aggregate base, wicked excess water, and provided lateral
confinement for base section.
Figure 2.19 Field Construction at Corona, CA
Case 6: Jefferson County, WI
Another application occurred at Jefferson County, WI, and the geotextile was used to solve
differential settlement problem. The primary challenge was the presence of wet and saturated silt
and peat deposits to depths exceeding 30 feet below the existing pavement. Simply removing the
deposits is not an economically feasible solution. The geotextile was directly placed on the
exposed subgrade, followed by a 15-inch lift of crushed stone, a single layer of geogrid, and a
15-inch lift of crushed stone, as shown in Figure 2.19. Jefferson County Highway Department
reported that subgrade undercutting was minimized to 30 inches, compared to a potential 5-8 feet
undercut (or more) for the soil conditions present. In addition to the cost savings there was also a
substantial time savings in the project construction schedule.

27
Figure 2.20 Field Construction at Jefferson County, WI
2.8 Potential Issues
Although laboratory and field test results indicated the application of the wicking fabric wass
very promising, there are still some concerns regarding use of the wicking fabric for more
general conditions. After all, the overall performance of geosynthetic-reinforced pavement
structure is dependent upon not only the geosynthetic, but also the soil and soil – geotextile
interaction. Before extensive engineering applications of this type of geotextile, there are several
issues need to be answered. For example, can this application be extended to other types of soils?
To what extent can the pavement structure water content be reduced? By implementing this type
of wicking fabric, how much improvement can be obtained for the pavement structure in terms
of resilient modulus, permanent deformation, and shear strength along the soil-wicking
geosynthetic interface? Most importantly, the wicking fabric will stop working? If yes, at what
condition.
Besides the discussions above, there are some other concerns regarding the geotextile
applications. Figure 2.20 shows the Scanning Electron Microscope (SEM) images of the
samples that collected from the field. Left figure shows the SEM image of the wicking fabric at
the surface of the woven geotextile. The “clogging effect” was defined as the phenomena that
(1) magnitude of confining pressure in soil on drainage path, (2) physical disturbance on
drainage path, (3) air bubbles stuck into drainage path, and (4) permeability influenced by the
intrusion of fine particles (Palmeria and Gardoni, 2000). Observed results indicate that all the
surface edges of the wicking fabric were suffered from clogging effect. Since the soil above the
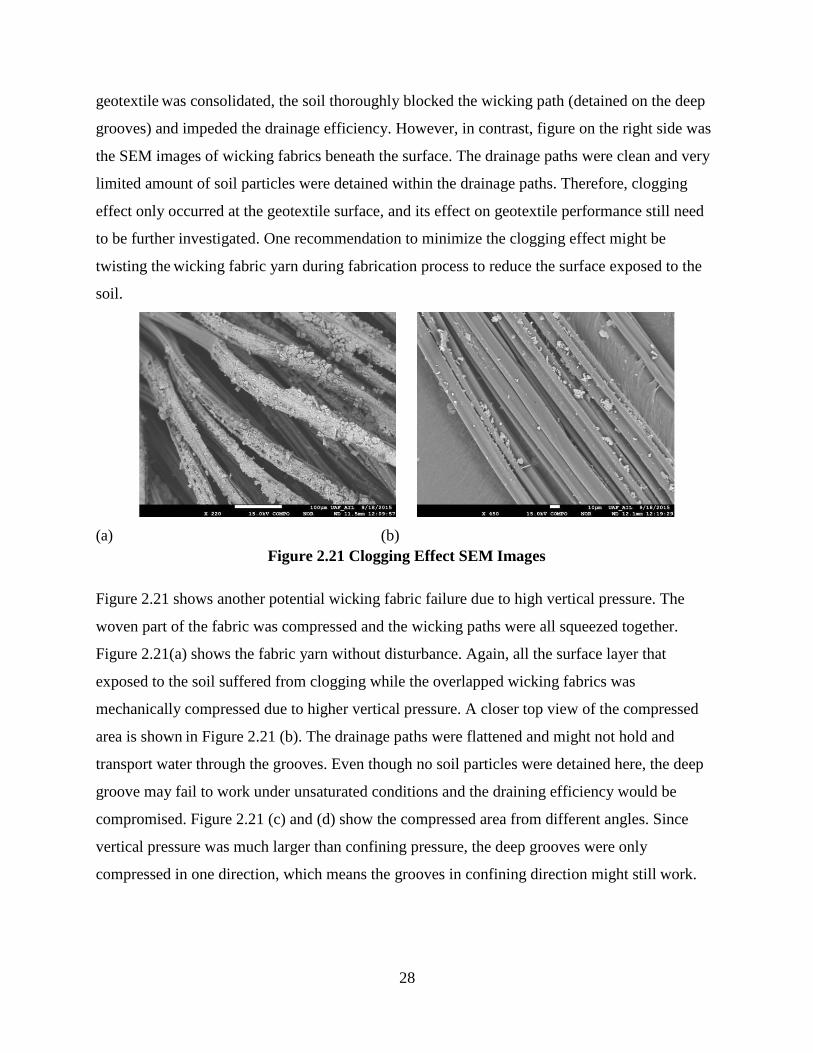
28
geotextile was consolidated, the soil thoroughly blocked the wicking path (detained on the deep
grooves) and impeded the drainage efficiency. However, in contrast, figure on the right side was
the SEM images of wicking fabrics beneath the surface. The drainage paths were clean and very
limited amount of soil particles were detained within the drainage paths. Therefore, clogging
effect only occurred at the geotextile surface, and its effect on geotextile performance still need
to be further investigated. One recommendation to minimize the clogging effect might be
twisting the wicking fabric yarn during fabrication process to reduce the surface exposed to the
soil.
(a) (b)
Figure 2.21 Clogging Effect SEM Images
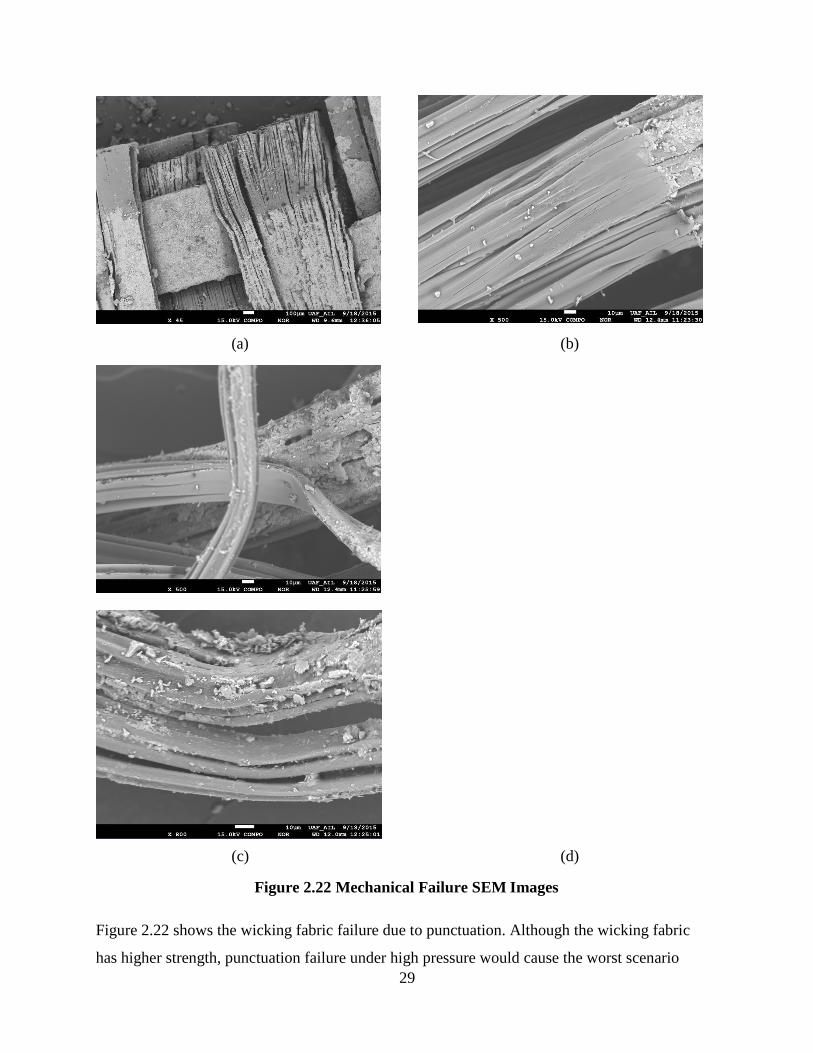
Figure 2.21 shows another potential wicking fabric failure due to high vertical pressure. The
woven part of the fabric was compressed and the wicking paths were all squeezed together.
Figure 2.21(a) shows the fabric yarn without disturbance. Again, all the surface layer that
exposed to the soil suffered from clogging while the overlapped wicking fabrics was
mechanically compressed due to higher vertical pressure. A closer top view of the compressed
area is shown in Figure 2.21 (b). The drainage paths were flattened and might not hold and
transport water through the grooves. Even though no soil particles were detained here, the deep
groove may fail to work under unsaturated conditions and the draining efficiency would be
compromised. Figure 2.21 (c) and (d) show the compressed area from different angles. Since
vertical pressure was much larger than confining pressure, the deep grooves were only
compressed in one direction, which means the grooves in confining direction might still work.
29
(a) (b)
(c) (d)
Figure 2.22 Mechanical Failure SEM Images
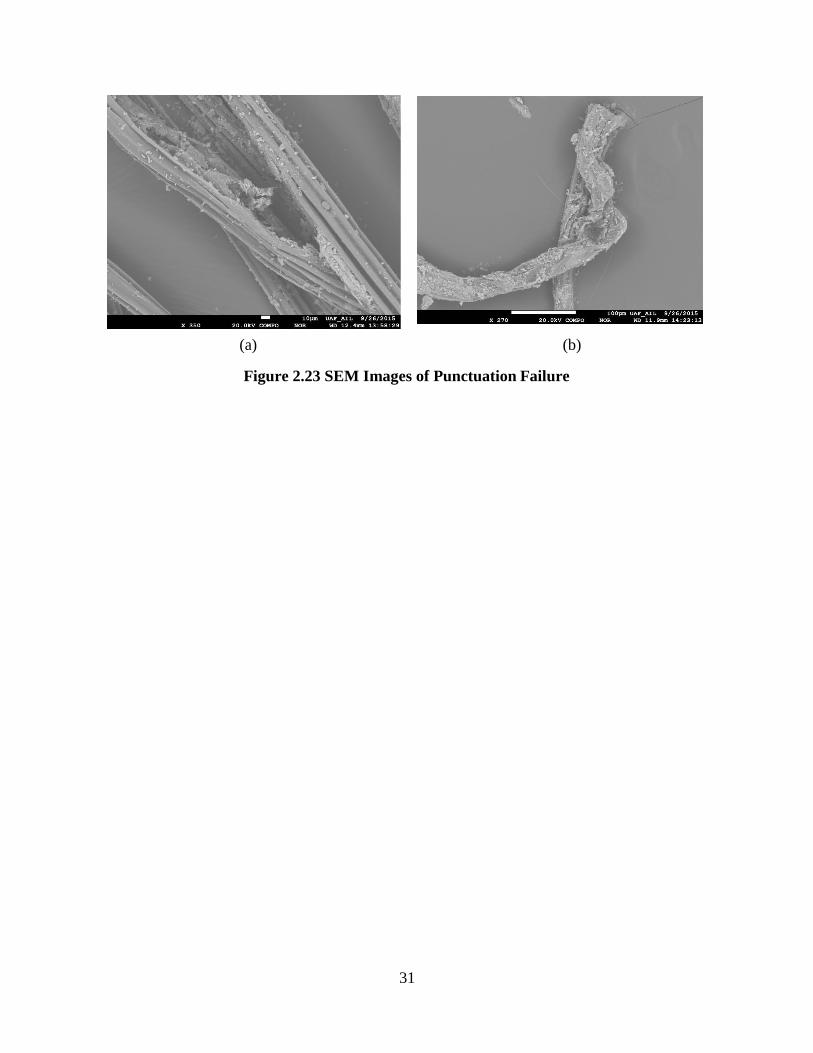
Figure 2.22 shows the wicking fabric failure due to punctuation. Although the wicking fabric
has higher strength, punctuation failure under high pressure would cause the worst scenario

30
since the deep grooves were entirely broken off and the drainage paths were thoroughly
discontinued.
31
(a) (b)
Figure 2.23 SEM Images of Punctuation Failure
32
2.9 Reference
Han, J. and Zhang, X. (2014). “Recent Advances in the Use of Geosynthetics to Enhance
Sustainability of Roadways.” 20th International Conference on Advances in Civil Engineering for
Sustainable Development, Suranaree University of Technology, Nakhon Ratchasima, Thailand, pp.
29-39.
Taylor, M. A. and Khosla, N. P. (1983). “Stripping of Asphalt Pavement-State of the Art.” In
Transportation Research Record 911, TRB National Research Council, Washington, D.C., pp. 150-
158.
Mallela, J. L., TiTus-Glover and Darter, M. I. (2000). “Considerations for Providing Subsurface
Drainage in Jionted Concrete Pavements.” In Transportation Research Record 1709, TRB National
Research Council, Washington, D.C., pp. 1-10.
Chamberlain, E. J. (1987). “A Freeze-Thaw Test to Determine the Frost Susceptibility of Soils.”
U. S. Army Corps of Engineers, Cold Regions Research and Engineering Laboratory (CRREL),
Special Report: 87-1.
Casagrande, A. (1931). “Discussion of Frost Heaving,” Highway Research Board, Proceedings,
Vol. 11, pp. 163-172.
Csathy, T. I. and Townsend, D. L. (1962). “Pore Size and Field Frost Performance of Soils”
Highway Research Board Bulletin, No.331, pp. 67-80.
Casagrande, A. (1947). “Classification and Identification of Soils.” Proceedings, American
Society of Civil Engineers, Vol. 73(6), pp. 283.
Taber, S. (1930a). “The Mechanics of Frost Heaving.” Journal of Geology, Vol. 38, pp. 303-317.
Taber, S. (1930b). “Freezing and Thawing of Soils as Factors in the Destruction of Road
Pavements.” Public Roads, Vol. 11(6), pp. 113-132.
Takagi, S. (1978). “Segregation Freezing as the Cause of Suction Force in Ice Lens Formation.”
Cold Regions Research and Engineering Laboratory (CRREL), Report No. 78-6, pp, 12.
Takagi, S. (1980). “The Adsorption Force Theory of Frost Heaving.” Cold Regions Science and
Technology, Vol. 3, pp. 57-81.
Polubarinova-Kochina, and Ya, P. (1952). “Theory of the Motion of Ground Water.” Gostekhizdat,
Moscow, USSR.
Aravin, V. I. and Numerov, S. N. (1953). “Theory of Fluid Flow in Undeformable Porous Media.”
Gostekhizdat, Moscow, USSR.
33
Muskat, M. (1946). “The Flow of Homogeneous Fluids Through Porous Media.” J. W. Edwards,
Publisher, Ann Arbor, Michigan.
Lane, K. S. and Washburn, D. E. (1946). “Capillary Tests by Capillarimeter and by Soil Filled
Tubes.” Proceedings, Highway Research Board.
Barber, E. S. and Sawyer, C. L. (1952). “Highway Subdrainage.” Public Roads, Vol. 26(12).
Brown, S. A., Stein, S. M., and Warner, J. C. (2001). “Urban Drainage Design Manual, Hydraulic
Engineering Circular 22, Second Edition.” Federal Highway Administration, Publication No.
FHWA-NHI-01-021.
Cedergren, H. R. (1974). “Drainage of Highway and Airfield Pavements.” John Wiley and Sons,
New York.
Cedergren, H. R., Arman, J. A., and O'Brien, K. H. (1973). “Development of Guidelines for the
Design of Subsurface Drainage Systems for Highway Pavement Structural Sections, Final Report.”
Federal Highway Administration, Washington, D, C., February, 1973.
MEPDG (2004). “National Cooperative Highway Research program, Transportation Research
Board and National Research Council. Mechanistic-Empirical Design of New and Rehabilitated
Pavement Structures.” National Cooperative Highway Research Program, NCHRP Project 1-37A
Report, National Research Council. Washington, DC.
FHWA (1980). “Highway Subdrainage Design. Publication.” Federal Highway Administration
(FHWA), FHWA-TS-80-224, U.S. Department of Transportation.
AASHTO (1993). “AASHTO Guide for Design of Pavement Structures.” American Association
of State Highway and Transportation Officials (AASHTO), Washington D. C., USA.
Rutledge, P. C. and Johnson, S. J. (1958). “Review of Uses of Vertical Sand Drains.” Bulletin 173,
Highway Research Board, Wahsington, D. C..
Rechart, F. E. (1957). “Review of the Theories for Sand Drains.” Transactions, American Society
of Civil Engineers, Vol. 124.
Anderson, D. A., Huebner, R. S., Reed, J. R., Warner, J. C., and Henry, J. J. (1998). “Improved
Surface Drainage of Pavements.” National Cooperative Highway Research Program (NCHRP),
Project No. 1-29.
Fredlund, D. G. and Rahardjo, H. (1993). “Soil Mechanics for Unsaturated Soils.” John Wiley &
Sons.
34
Zhang, X. and Presler, W. (2012). “Use of H2Ri Wicking Fabric to Prevent Frost Boils in the
Dalton Highway Beaver Slide Area, Alaska.” Alaska University Transportation Center (AUTC)
Project Report, No. RR10.02 & 510020, August, 2012.
Wang, F., Han, J., Zhang, X., and Guo, J. (2015). “Laboratory Test to Evaluate Effectiveness of
Wicking Fabric in Soil Moisture Reduction.” Journal of Geotechnical and Geoenvironmental
Engineering, ASCE. (Under Review)
Zhang, X., Presler, W., Li, L., Jones, D. and Odgers, B. (2014). “Use of Wicking Fabric to Help
Prevent Frost Boils in Alaskan Pavements.” Journal of Materials in Civil Engineering, ASCE, pp
739.
Zornberg, J. G., Odgers, B., Roodi, G. H., and Azevedo, M. M. (2013). “Advantages and
Applications of Enhanced Lateral Drainage in Pavement Systems.” Proceedings of the 2nd African
Regional Conference on Geosynthetics, GeoAfrica 2013, 18-20 November, Accra, Ghana, pp. 539-
548.
Palmeria, E. M. and Gardoni, M. G. (2000). “Influence of Partial Clogging and Pressure on the
Behavior of Geotextiles in Drainage System.” Geosynthetics International, Vol. 7, pp. 403-431.
CHAPTER 3 TESTING FLUME SETUP
Two test flumes were constructed to evaluate the wicking effect of the fabric. One flume was
filled with sand, and the other one was filled with Fairbanks silt (contains about 5% organic
material). The schematic plot of the testing flume is shown in Figure 3.1. The dimensions for
the testing flumes were 252 in. × 16 in. ×12 in. (Length × Width × Height). Three layers of
sensors located at depths of 1 in., 5 in. and 9 in. from the bottom to the top. The wicking fabric
was located at 1 in. from the bottom of the testing flume. The left side of the fabric was
exposed to the open air. A 3 ft. long overlap wicking fabric started at 5 ft. from the left side of
the testing flume. For the testing flume with sand, two types of sensors were used: MPS-2
water potential sensor to measure the soil suction and EC-5 moisture sensor to measure the
moisture content.
The moisture content sensors were marked numerically and the water potential sensors were
marked alphabetically. Yet, since the water potential sensors did not work effectively, only the
moisture sensors were used for testing flumes for silt.

35
The construction process started by filling the flume with 1 in. of saturated sand, as shown in
Figure 3.2(a). The testing flume was first covered with a layer of plastic wrap to prevent water
from flowing outside the system. Both sides of the flume walls were marked at the anticipated
heights and the sand was then flattened with a trowel to the marker. After that, the wicking fabric
was put into the testing flume as shown in Figure 3.2(b). Since the fabric roll was not long
enough, a 3 ft. overlap was placed at a distance of 5 ft. from the left side of the testing flume.
Then, the first layer of sensor was place on top of the fabric as shown in Figure 3.2(c). One set
of sensors was put at each location and in total 8 sets of sensors in one layer. The fabric was then
saturated with water before another layer of soil was put into the testing flume. Figure 3.2(d)
shows the testing flume filled with 12 in. of saturated sand. The walls of the testing flume was
fastened with wood plates to prevent the walls from expanding. After all the sensors were put
into the testing flume, the testing system was covered with plastic wrap as shown in Figure
3.2(e).
Furthermore, at the left side of the testing flume, the wicking fabric was exposed to the open air
so that the water inside the testing system could be wicked out.

36
MPS-2 Water Potential Sensor EC-5 Moisture Sensor Sensor Location H2Ri Wicking
16 in
12 in
21 ft
Schematic Plot of Sensor Location (3D)
3 in Q (3) R (6) S (9) T (12) U (15) V (18) W (21) X (24)
4 in I (2) J (5) K (8) L (11) M (14) N (17) O (20) P (23)
4 in A (1) B (4) C (7) D (10) E (13) F (16) G (19) H (22)
1 in
Front View
1 ft 2.5 ft
8 in
8 in
Fabric
Plan View
Figure 3.1 Schematic Plot of Testing Flume and Sensor Location
(a) (b)

37
(c) (d)
(e) (f)
Figure 3.2 Testing Flume Construction
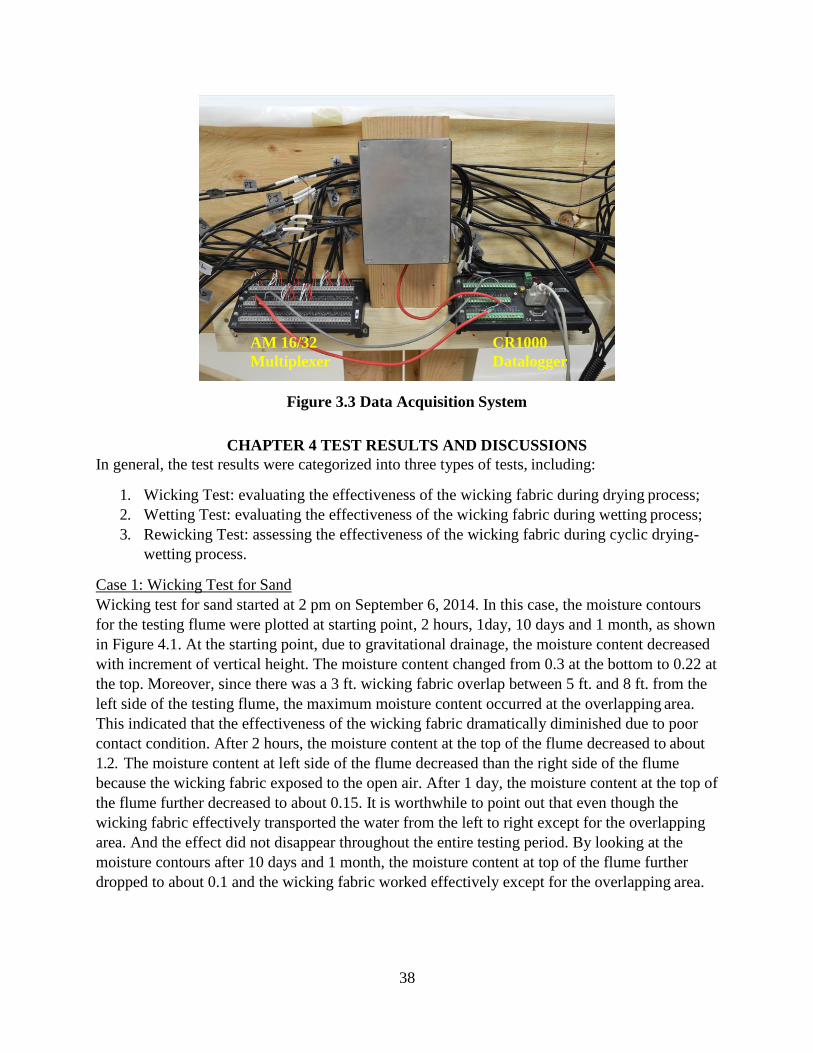
Figure 3.3 shows the data acquisition system. The system was composed of 1 CR1000
datalogger and 1 AM 16/32 multiplexer. The CR1000 was used to store the monitored data at a
time interval of 1 hour. The AM 16/32 multiplexer provided the pots to connect in total 48
sensors (24 water potential sensors and 24 moisture content sensors).
38
Figure 3.3 Data Acquisition System
CHAPTER 4 TEST RESULTS AND DISCUSSIONS
In general, the test results were categorized into three types of tests, including:
1. Wicking Test: evaluating the effectiveness of the wicking fabric during drying process;
2. Wetting Test: evaluating the effectiveness of the wicking fabric during wetting process;
3. Rewicking Test: assessing the effectiveness of the wicking fabric during cyclic drying-
wetting process.
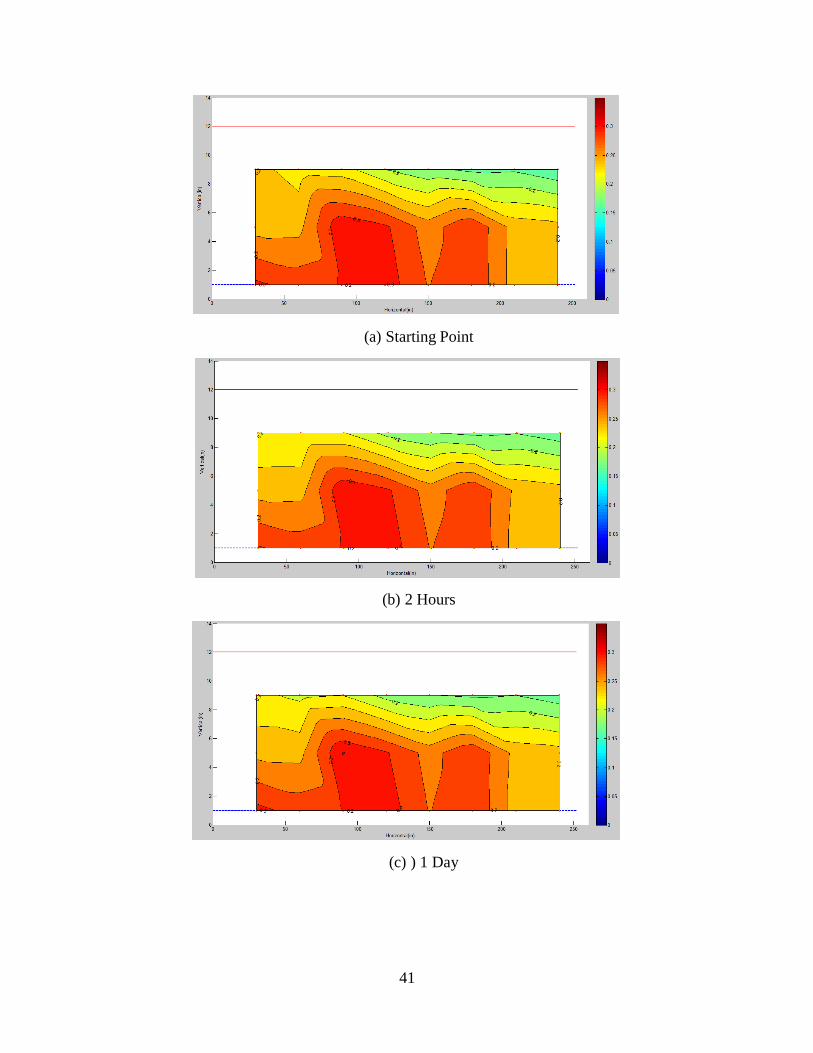
Case 1: Wicking Test for Sand
Wicking test for sand started at 2 pm on September 6, 2014. In this case, the moisture contours
for the testing flume were plotted at starting point, 2 hours, 1day, 10 days and 1 month, as shown
in Figure 4.1. At the starting point, due to gravitational drainage, the moisture content decreased
with increment of vertical height. The moisture content changed from 0.3 at the bottom to 0.22 at
the top. Moreover, since there was a 3 ft. wicking fabric overlap between 5 ft. and 8 ft. from the
left side of the testing flume, the maximum moisture content occurred at the overlapping area.
This indicated that the effectiveness of the wicking fabric dramatically diminished due to poor
contact condition. After 2 hours, the moisture content at the top of the flume decreased to about
1.2. The moisture content at left side of the flume decreased than the right side of the flume
because the wicking fabric exposed to the open air. After 1 day, the moisture content at the top of
the flume further decreased to about 0.15. It is worthwhile to point out that even though the
wicking fabric effectively transported the water from the left to right except for the overlapping
area. And the effect did not disappear throughout the entire testing period. By looking at the
moisture contours after 10 days and 1 month, the moisture content at top of the flume further
dropped to about 0.1 and the wicking fabric worked effectively except for the overlapping area.
AM 16/32
Multiplexer
CR1000
Datalogger

39
(a) Starting Point
(b) 2 Hours
(c) ) 1 Day

40
(d) 10 Days
(e) ) 1 Month
Figure 4.1 Moisture Contour for Wicking Test (Sand)
Case 2: Wetting Test for Sand
Wetting test for sand started at 5 pm on November 2, 2014. The left side of the fabric was dipped
into water rather than exposed to open air. Figure 4.2 shows the moisture contour for the testing
flume at starting point, 2 hours, 1 day, 10 days and 1 month. This time, the water flowed from
left to right. At the starting point, the moisture content at the left side of the flume increased
instantaneously due to the wetting of the fabric. Due to the poor connection at the overlapping
area, the water could not transport further to the right side of the flume within 1 day. After 10
days, the accumulated water at the overlapping area transported further to 180 in. The wicking
fabric continued to transport water to the right side of the flume and resulted in a slight
increment in moisture content by 5% after 1 month. In general, the overlapping of the wicking
fabric significantly decreased its wickability to transport the water to the right side of the testing
flume.
41
(a) Starting Point
(b) 2 Hours
(c) ) 1 Day
42
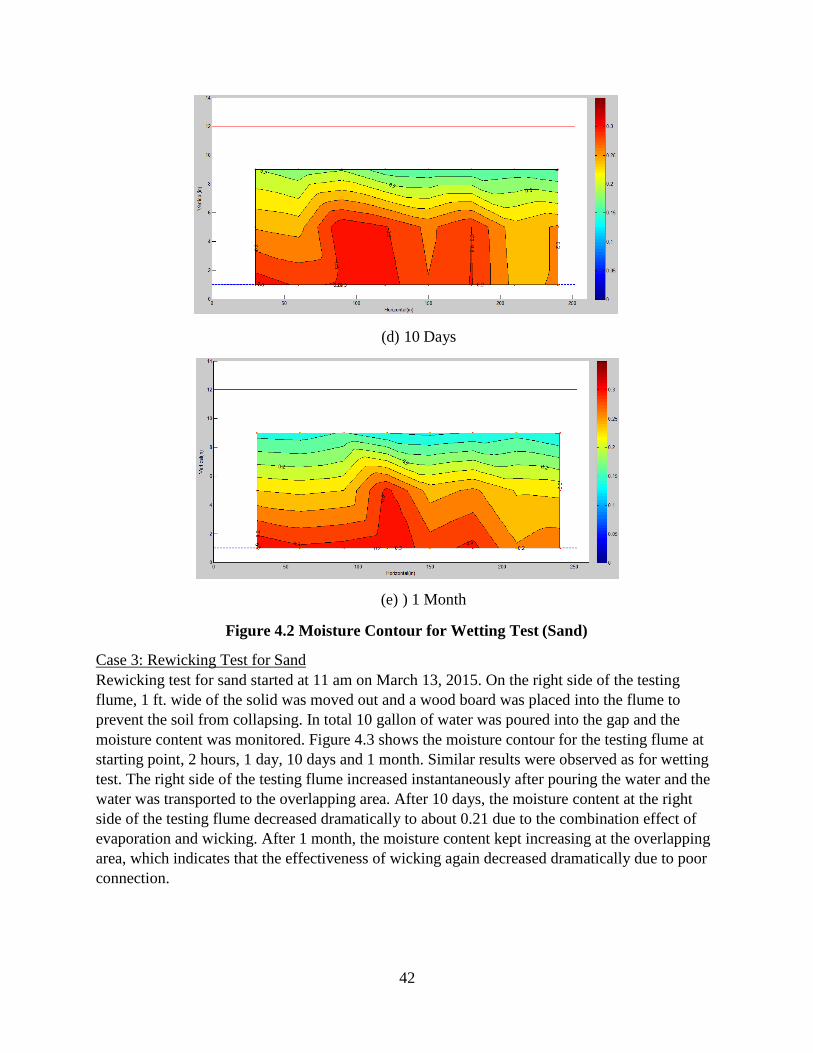
(d) 10 Days
(e) ) 1 Month
Figure 4.2 Moisture Contour for Wetting Test (Sand)
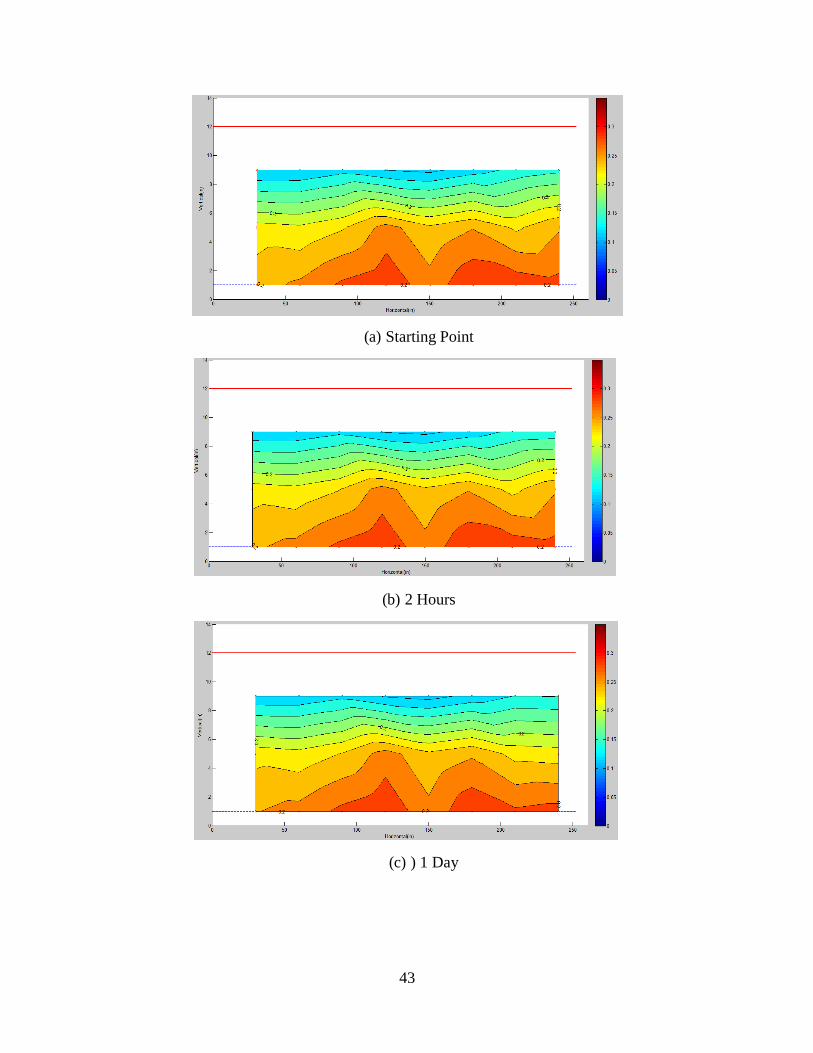
Case 3: Rewicking Test for Sand
Rewicking test for sand started at 11 am on March 13, 2015. On the right side of the testing
flume, 1 ft. wide of the solid was moved out and a wood board was placed into the flume to
prevent the soil from collapsing. In total 10 gallon of water was poured into the gap and the
moisture content was monitored. Figure 4.3 shows the moisture contour for the testing flume at
starting point, 2 hours, 1 day, 10 days and 1 month. Similar results were observed as for wetting
test. The right side of the testing flume increased instantaneously after pouring the water and the
water was transported to the overlapping area. After 10 days, the moisture content at the right
side of the testing flume decreased dramatically to about 0.21 due to the combination effect of
evaporation and wicking. After 1 month, the moisture content kept increasing at the overlapping
area, which indicates that the effectiveness of wicking again decreased dramatically due to poor
connection.
43
(a) Starting Point
(b) 2 Hours
(c) ) 1 Day

44
(d) 10 Days
(e) ) 1 Month
Figure 4.3 Moisture Contour for Rewicking Test (Sand)
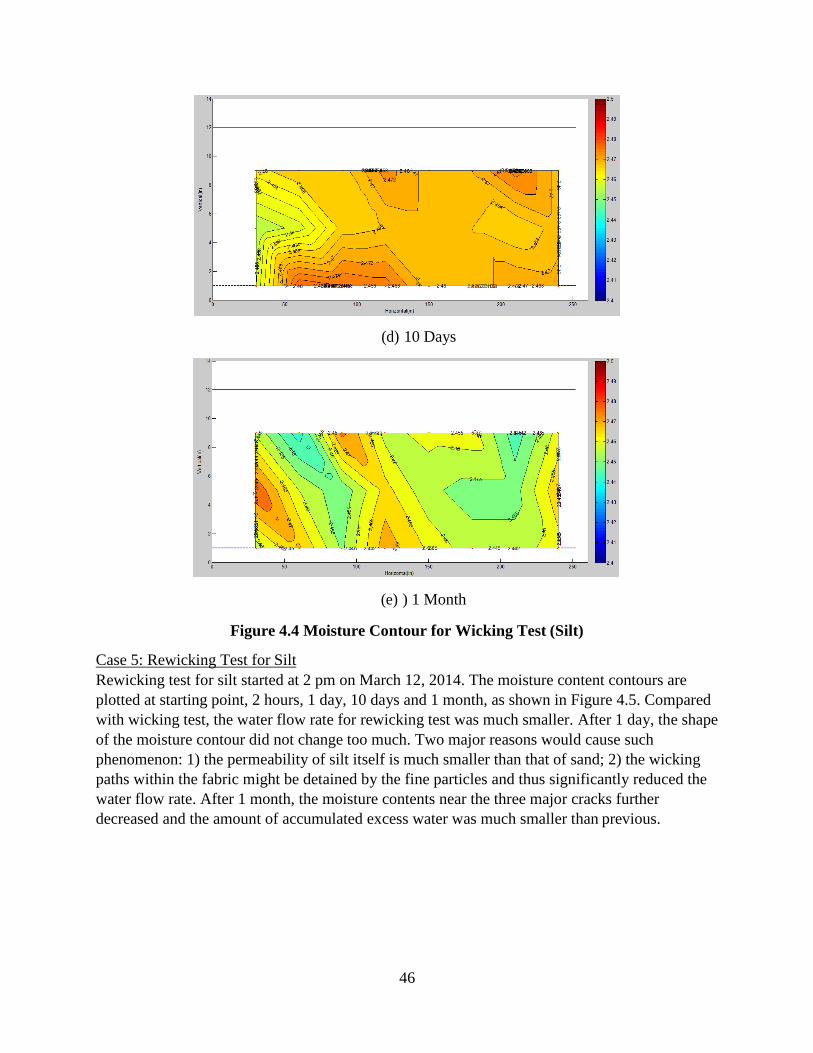
Case 4: Wicking Test for Silt
Wicking test for silt started at 4 pm on December 23, 2014. The moisture content contours are
plotted at starting point, 2 hours, 1 day, 10 days and 1 month, as shown in Figure 4.4. At the
starting point, the moisture content at the left side of the flume first started to decrease because of
the wicking effect. Also, similar to sand, the overlapping area experienced a smaller moisture
content decrease due to the poor connection and drainage condition. After 2 hours, the water
flowed from right to left and accumulated at the overlapping area resulted in an even larger
moisture content at the overlapping area. After 1 day, the blue areas indicated the moisture
contents were much smaller than the surrounding area. Several major cracks were observed
during the consolidation process and the air could penetrate into the soil through the cracks.
Since air circulating would increase the evaporation process, the moisture content decreased
faster than those areas without cracks. Thus Figure 4.4(c) is reasonable in explaining the drying
procedure described above. After 10 days, the excess water at the overlapping area was gradually
wicked out and moisture content decreased to about 2.40. Then after 1 month, the effect of
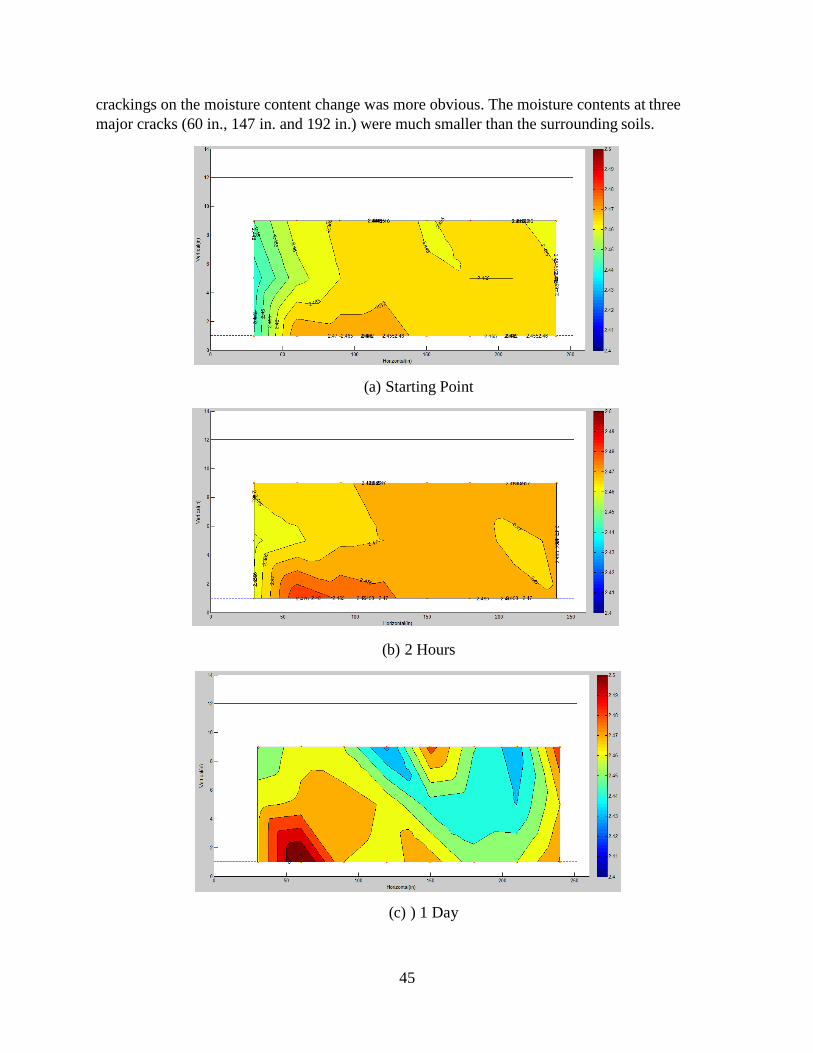
45
crackings on the moisture content change was more obvious. The moisture contents at three
major cracks (60 in., 147 in. and 192 in.) were much smaller than the surrounding soils.
(a) Starting Point
(b) 2 Hours
(c) ) 1 Day
46
(d) 10 Days
(e) ) 1 Month
Figure 4.4 Moisture Contour for Wicking Test (Silt)
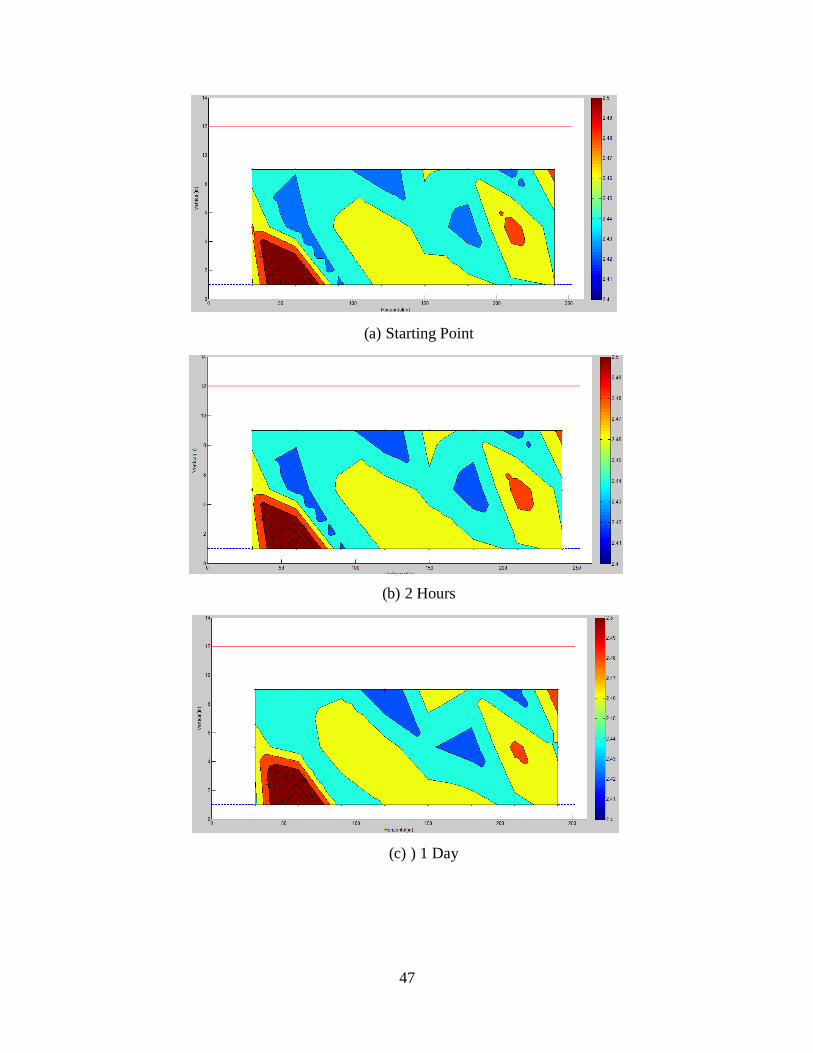
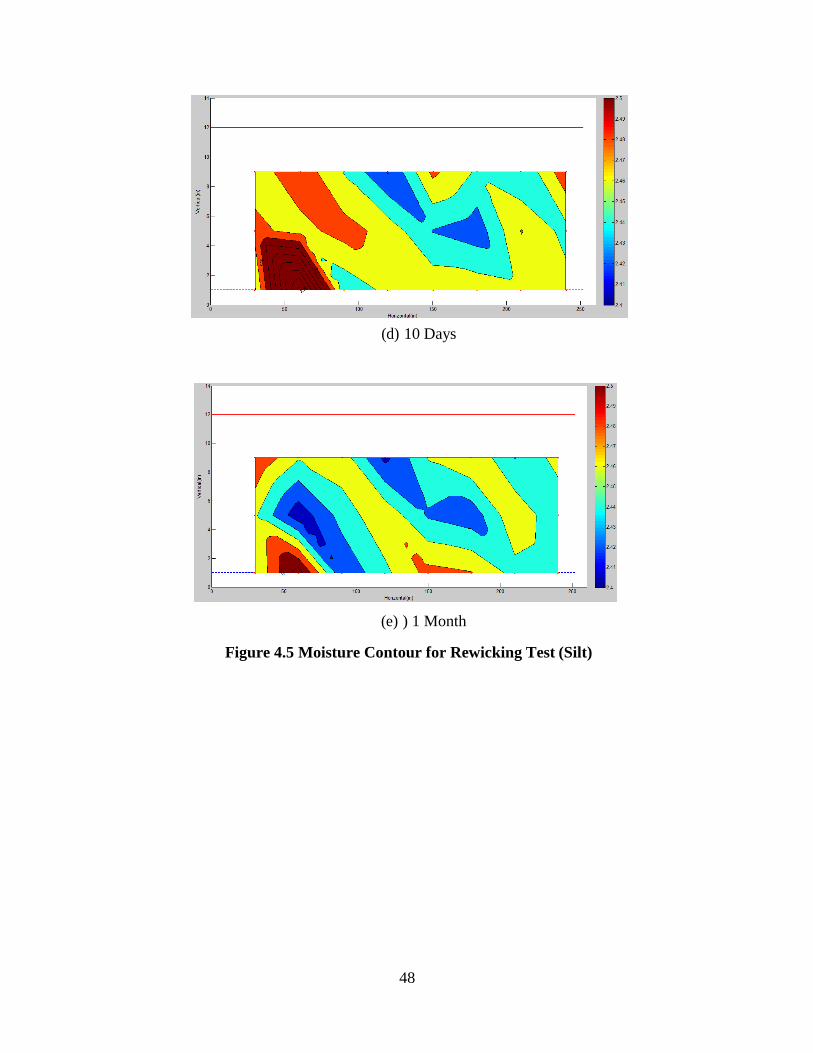
Case 5: Rewicking Test for Silt
Rewicking test for silt started at 2 pm on March 12, 2014. The moisture content contours are
plotted at starting point, 2 hours, 1 day, 10 days and 1 month, as shown in Figure 4.5. Compared
with wicking test, the water flow rate for rewicking test was much smaller. After 1 day, the shape
of the moisture contour did not change too much. Two major reasons would cause such
phenomenon: 1) the permeability of silt itself is much smaller than that of sand; 2) the wicking
paths within the fabric might be detained by the fine particles and thus significantly reduced the
water flow rate. After 1 month, the moisture contents near the three major cracks further
decreased and the amount of accumulated excess water was much smaller than previous.
47
(a) Starting Point
(b) 2 Hours
(c) ) 1 Day
48
(d) 10 Days
(e) ) 1 Month
Figure 4.5 Moisture Contour for Rewicking Test (Silt)
49
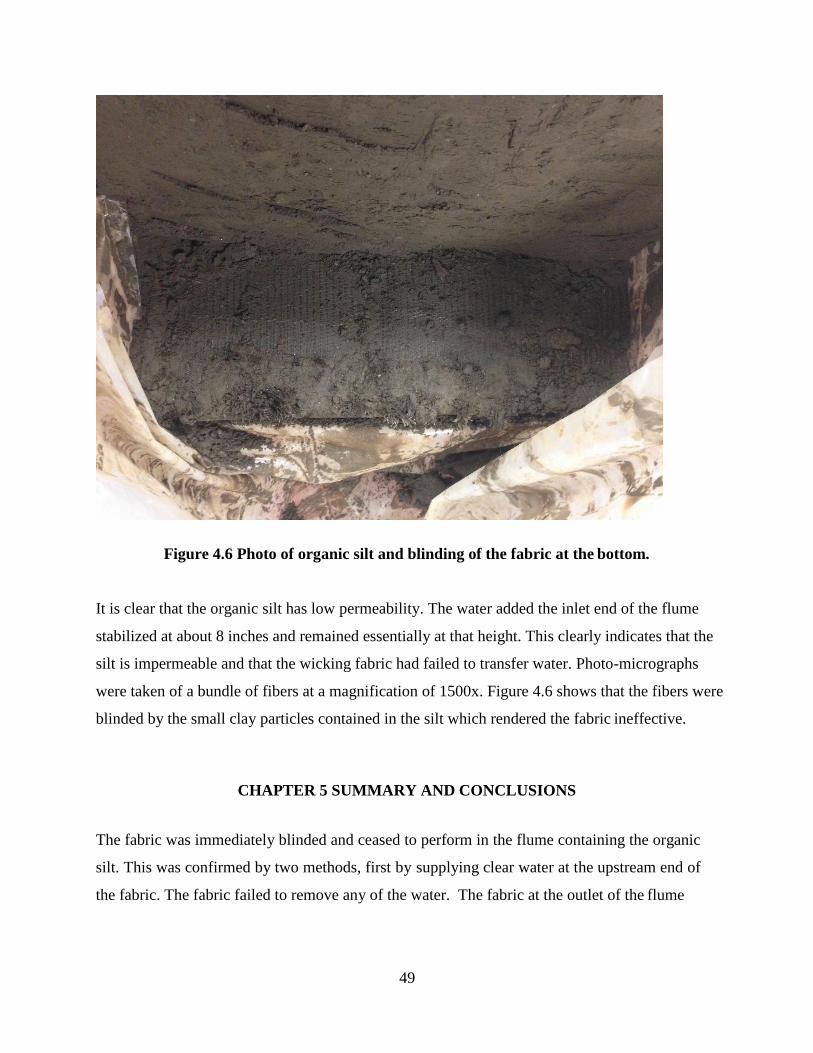
Figure 4.6 Photo of organic silt and blinding of the fabric at the bottom.
It is clear that the organic silt has low permeability. The water added the inlet end of the flume
stabilized at about 8 inches and remained essentially at that height. This clearly indicates that the
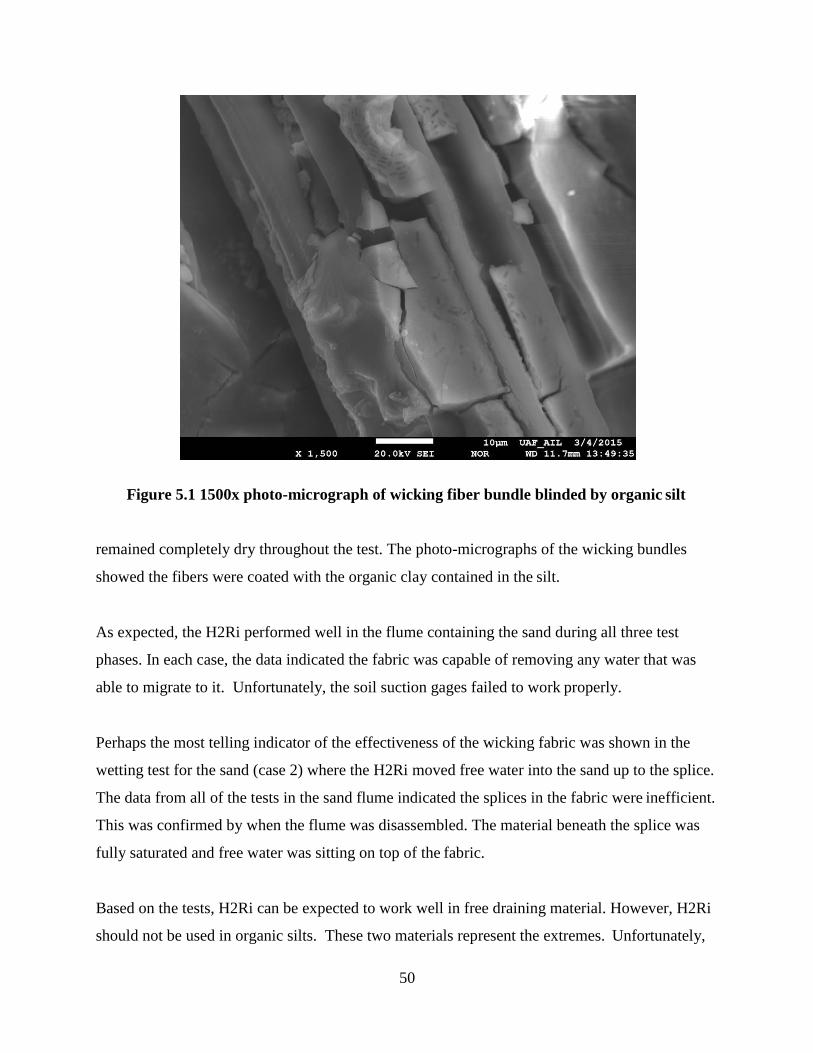
silt is impermeable and that the wicking fabric had failed to transfer water. Photo-micrographs
were taken of a bundle of fibers at a magnification of 1500x. Figure 4.6 shows that the fibers were
blinded by the small clay particles contained in the silt which rendered the fabric ineffective.
CHAPTER 5 SUMMARY AND CONCLUSIONS
The fabric was immediately blinded and ceased to perform in the flume containing the organic
silt. This was confirmed by two methods, first by supplying clear water at the upstream end of
the fabric. The fabric failed to remove any of the water. The fabric at the outlet of the flume
50
Figure 5.1 1500x photo-micrograph of wicking fiber bundle blinded by organic silt
remained completely dry throughout the test. The photo-micrographs of the wicking bundles
showed the fibers were coated with the organic clay contained in the silt.
As expected, the H2Ri performed well in the flume containing the sand during all three test
phases. In each case, the data indicated the fabric was capable of removing any water that was
able to migrate to it. Unfortunately, the soil suction gages failed to work properly.
Perhaps the most telling indicator of the effectiveness of the wicking fabric was shown in the
wetting test for the sand (case 2) where the H2Ri moved free water into the sand up to the splice.
The data from all of the tests in the sand flume indicated the splices in the fabric were inefficient.
This was confirmed by when the flume was disassembled. The material beneath the splice was
fully saturated and free water was sitting on top of the fabric.
Based on the tests, H2Ri can be expected to work well in free draining material. However, H2Ri
should not be used in organic silts. These two materials represent the extremes. Unfortunately,
51
no firm conclusions about clays or materials containing clay can be conclusively drawn for this
data since organic clays have properties which are not necessarily indicative of other clays.
However, it is likely that H2Ri will not be effective in impermeable soils since water cannot
readily get to the fabric.
Splices are a concern due to the inefficiencies observed. There are two basic alternatives to
resolve these issues. First, consider weaving the wicking fibers in the longitudinal direction of
the fabric rather than the transverse direction. This would eliminate the need for a splice.
The second option is to develop an effective splice. The 3 foot simple overlap used in this
experiment was not effective. It is doubtful that a sewn joint would be better.