evaluate potential limitations with current foodborne illness source attribution estimates obtained...
TRANSCRIPT
Evaluate potential limitations with current foodborne illness source
attribution estimates obtained from outbreak reports.
Neal Golden, Ph.D. January 31st, 2012
1

Overview
2
Definitions Purpose Background Project Description Illustrative Examples Summary Timeline
Definitions Outbreak
Cases of illness that share a common cause - any two or more cases of illness that are connected to a known common cause FDOSS - Foodborne Disease Outbreak Surveillance System
Sporadic illness An isolated case of illness - when someone becomes ill and
there is no known connection to another person’s illness FoodNet - Foodborne Diseases Active Surveillance Network LEDS - Laboratory-based Enteric Disease Surveillance
system (replaced PHLIS)
3
Purpose
4
The purpose of this project is to: Assess degree of confidence in the use of outbreak
data to estimate foodborne illness source attribution
Assist in developing criteria that prioritizes pathogens for which outbreak data may be sufficient
Contribute to an analysis of uncertainty The purpose is not to estimate foodborne illness
source attribution
Background
5
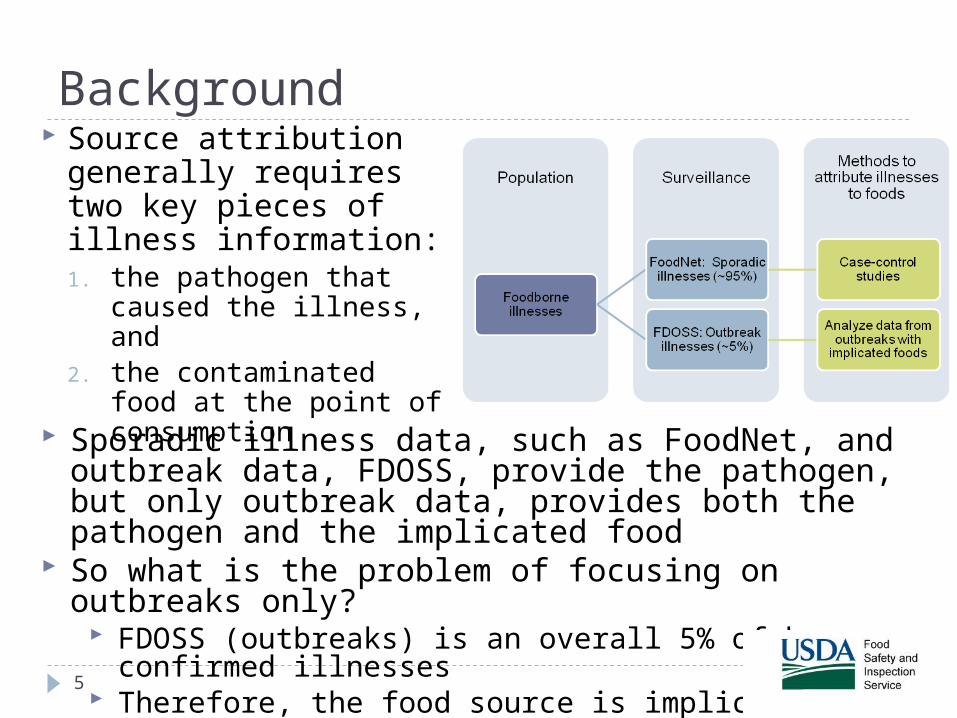
Source attribution generally requires two key pieces of illness information: 1. the pathogen that caused
the illness, and 2. the contaminated food at
the point of consumption Sporadic illness data, such as FoodNet, and outbreak data,
FDOSS, provide the pathogen, but only outbreak data, provides both the pathogen and the implicated food
So what is the problem of focusing on outbreaks only? FDOSS (outbreaks) is an overall 5% of known confirmed illnesses Therefore, the food source is implicated for only a small fraction
of known illnesses
Outbreaks represent a fraction of total illnesses
6
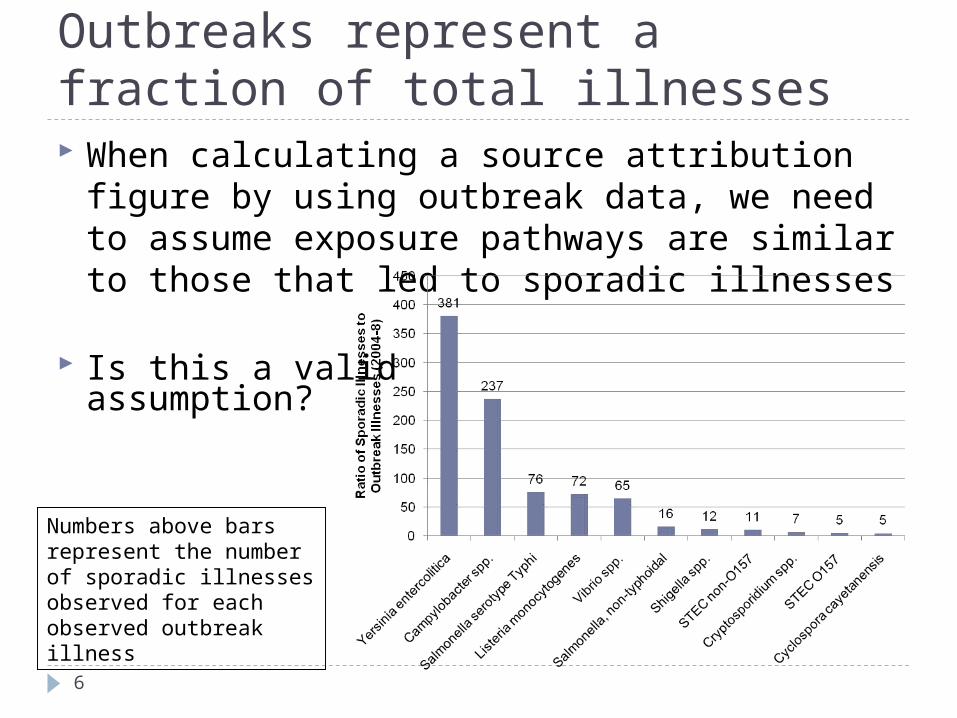
When calculating a source attribution figure by using outbreak data, we need to assume exposure pathways are similar to those that led to sporadic illnesses
Is this a valid assumption?
Numbers above bars represent the number of sporadic illnesses observed for each observed outbreak illness

Is foodborne illness source attribution derived from outbreaks representative of sporadic illnesses?
7
Very difficult to answer the above question! Ideally we would have a representative set of cases of sporadic
illness that we know were caused by exposure to specific contaminated foods
However, this is not the case
Therefore, a major source of uncertainty is The validity of the assumption that the distribution of
pathogens and their implicated food vehicles in outbreak reports reflects the relevant foodborne pathways of exposure in the general population
Project Description - General Evaluate similarities in the distributions of outbreak data vs.
sporadic illnesses data for the following four pathogens: Salmonella spp., E. coli O157:H7, Campylobacter spp., and Listeria monocytogenes
If outbreak cases look like sporadic cases across an array of epidemiologically factors, the suggests that the causal exposure pathways are similar in identity and degree of incidence
The workgroup is considering the following comparisons:
8
Project Description - Limitations
9
Data limited by the FDOSS database given fewer outbreak cases identified compared with lab-based surveillance (sporadic illnesses)
Lack of variables for few direct comparisons National (FDOSS) vs. Regional (FoodNet)
FDOSS outbreaks are national however, FoodNet is composed of 10 states representing about 15% of the U.S. population
LEDS is nationally representative, but passive lab-based surveillance

Illustrative Examples
10
Illustrative Examples – Temporal
11
Databases compared Outbreak illnesses
FDOSS Sporadic illnesses
FoodNet (active lab-based surveillance) Etiology
Salmonella Data years
1998 to 2009

Comparison of Salmonella outbreak (FDOSS) and sporadic (FoodNet) illnesses by month
12
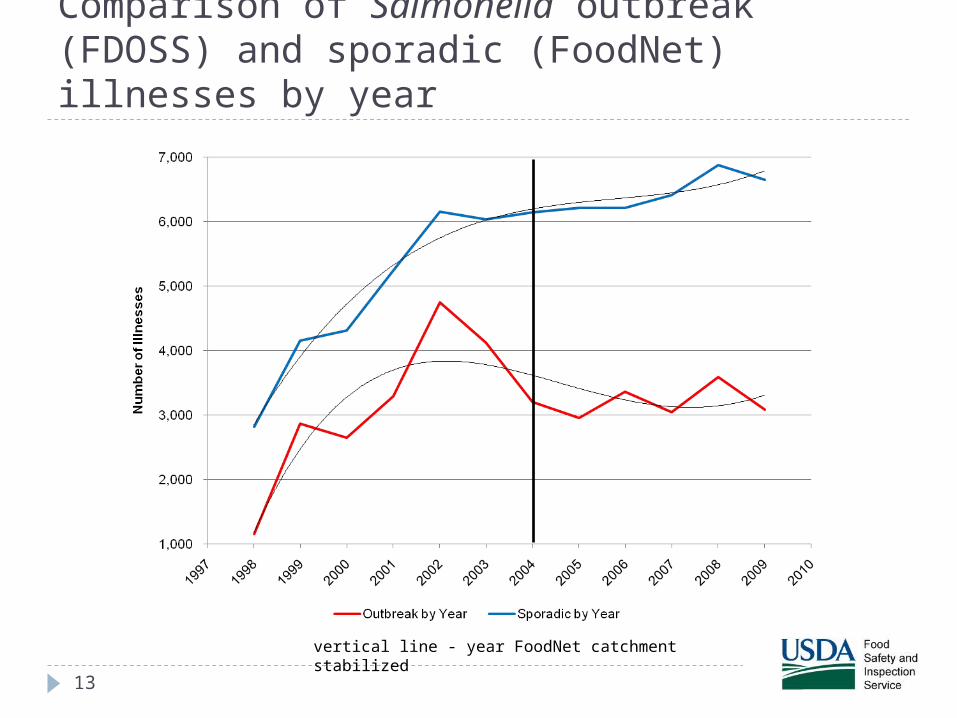
Comparison of Salmonella outbreak (FDOSS) and sporadic (FoodNet) illnesses by year
13
vertical line - year FoodNet catchment stabilized
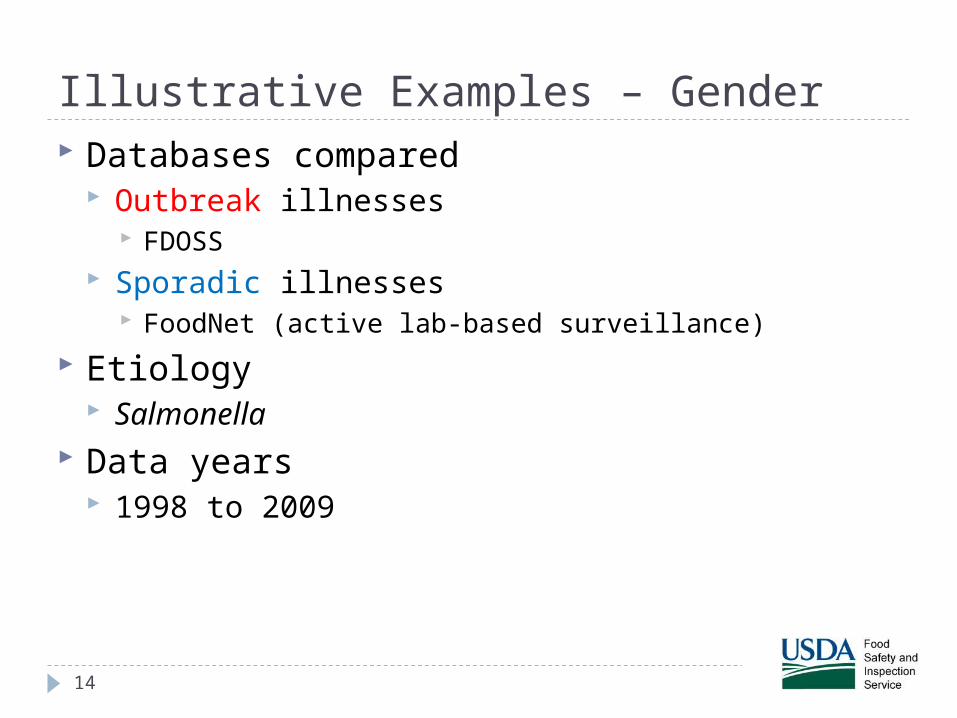
Illustrative Examples – Gender
14
Databases compared Outbreak illnesses
FDOSS Sporadic illnesses
FoodNet (active lab-based surveillance) Etiology
Salmonella Data years
1998 to 2009
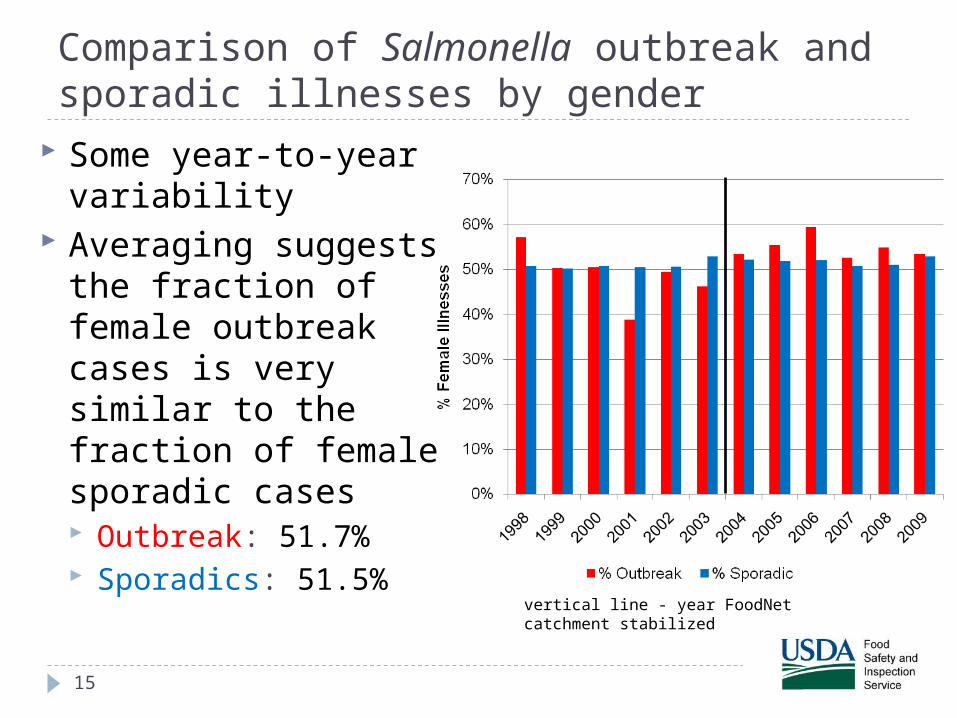
Comparison of Salmonella outbreak and sporadic illnesses by gender
15
Some year-to-year variability
Averaging suggests the fraction of female outbreak cases is very similar to the fraction of female sporadic cases Outbreak: 51.7% Sporadics: 51.5%
vertical line - year FoodNet catchment stabilized
Evaluate potential limitations with current foodborne illness source attribution Timeline
Project plan approved in Fall 2011 Databases have been acquired Following comparisons of the six epidemiologic
factors for the four pathogens, determine if additional analyses are required, Winter 2012
Project completion in Spring 2012
16