evaluating dust palliative performance and longevity using ...€¦ · evaluating dust palliative...
TRANSCRIPT

EVALUATING DUST PALLIATIVE PERFORMANCE AND LONGEVITY
USING THE UAF-DUSTM
A
THESIS
Presented to the Faculty
of University of Alaska Fairbanks
in Partial Fulfillment of the Requirements
for the Degree of
MASTER OF SCIENCE
By
Travis Warren Eckhoff
Fairbanks, Alaska
December 2012
TPD121205

iii
Abstract
Fugitive dust emissions from gravel surfaces such as unpaved roads and airport
runways are a major source of particulate matter pollution in the environment. Fugitive
dust emissions impact community health, decrease visibility and contribute to surface
degradation.. Chemical additives, also known as dust palliatives, are often used to reduce
these dust emissions. Although these products have been widely used, little is known
about their effectiveness and longevity. There is currently no standard test method to
quantify the reduction in fugitive dust emissions provided by dust palliatives. The UAF-
DUSTM was developed to provide a consistent test method for determining the
effectiveness and longevity of dust palliative applications. Dust palliatives applications
throughout Alaska were monitored for several years. The results show that dust
palliatives can significantly reduce particulate matter emissions and be effective for
several years.
TPD121205

iv
Table of Contents
Page
Signature Page .................................................................................................................... i
Title Page ........................................................................................................................... ii
Abstract .............................................................................................................................. iii
Table of Contents ............................................................................................................... iv
List of Figures .................................................................................................................... vi
List of Tables ..................................................................................................................... ix
1. Introduction ..................................................................................................................... 1
1.1 Objective ................................................................................................................... 2
2. Background ..................................................................................................................... 4
2.1 Formation of Fugitive Dust ....................................................................................... 4
2.2 Managing Fugitive Dust Emissions .......................................................................... 7
2.3 Quantifying Fugitive Dust Emission from Gravel Surfaces ................................... 12
3. UAF-DUSTM ............................................................................................................... 16
3.1 Equipment ............................................................................................................... 17
3.1.1 TSI DustTrak Aerosol Monitor ........................................................................ 17
3.1.2 Intake ................................................................................................................ 18
3.1.3 All Terrain Vehicles (ATV) ............................................................................. 21
TPD121205

v
3.1.4 Meteorological Station ..................................................................................... 22
3.2 Test Procedure ......................................................................................................... 22
3.3 Data Analysis .......................................................................................................... 23
3.4 Factors Affecting Measurements ............................................................................ 37
4. Dust Palliative Effectiveness and Longevity ................................................................ 46
4.1 Eagle, Alaska ........................................................................................................... 46
4.2 North Pole, Alaska .................................................................................................. 53
4.3 Tetlin, Alaska .......................................................................................................... 61
5. Conclusions ................................................................................................................... 68
References ......................................................................................................................... 71
TPD121205

vi
List of Figures
Page
Figure 1 - The UAF-DUSTM. The instrument consists of a DustTrak Model II aerosol monitor and intake.
The DustTrak is housed in a protective case, which is attached to the ATV. A plastic tube connects
the intake to the DustTrak..................................................................................................................... 16
Figure 2 - TSI DustTrak Model II Aerosol Monitor flow schematic (TSI, 2012). ........................................ 18
Figure 3 – The original UAF-DUSTM intake design. ................................................................................... 20
Figure 4 - The current UAF-DUSTM intake design. .................................................................................... 20
Figure 5 - PM10 Concentration vs. Time for the original intake and current intake designs. ........................ 21
Figure 6 - Results from two UAF-DUSTM tests performed on Moosewalk Road in North Pole, Alaska,
analyzed using the S-Curve Method. .................................................................................................... 26
Figure 7 - Log PM10 Concentration vs. Percent of Total Sample for two UAF-DUSTM tests performed on
Moosewalk Road in North Pole, Alaska. .............................................................................................. 27
Figure 8 - Histogram of PM10 concentrations measured on Sharon Road, North Pole, Alaska. 8/12/2010 .. 30
Figure 9 - Histogram of Normalized PM10 Concentrations for Sharon Road, North Pole, Alaska, on
8/12/2010. ............................................................................................................................................. 31
Figure 10 - Histogram of Normalized PM10 Concentrations for Sharon Road, North Pole, Alaska, on
9/20/2010. ............................................................................................................................................. 32
Figure 11 - Histogram of Normalized PM10 Concentrations for Sharon Road, North Pole, Alaska, on
6/1/2011. ............................................................................................................................................... 33
Figure 12 - Log PM10 Concentration vs. Percent of Total Sample for three UAF-DUSTM tests performed
on Sharon Road in North Pole, AK. UAF-DUSTM tests were conducted on 8/12/2010, 9/20/2010, and
6/1/2011. ............................................................................................................................................... 34
TPD121205

vii
Figure 13 - Box plot of PM10 concentrations measured during four separate UAF-DUSTM tests on
Moosewalk Road in North Pole, Alaska. .............................................................................................. 36
Figure 14 - Box plot of PM10 concentrations measured during separate UAF-DUSTM tests between
8/12/2010 and 6/1/2011 on Moosewalk Road in North Pole, Alaska. .................................................. 36
Figure 15 - Wind data in miles per hour recorded during a UAF-DUSTM test on the runway located in
Tetlin, Alaska, in August 2010. The box overlaid on the plot represents the position of the runway
relative to the wind data. This figure shows that there was a predominant head/tail wind during
testing. .................................................................................................................................................. 38
Figure 16 – PM10 concentrations recorded during UAF-DUSTM test performed on the runways in Tetlin,
Alaska, in 2010. The concentrations recorded while travelling into the wind are greater than the
concentrations recorded while travelling with a tail wind. ................................................................... 38
Figure 17 - Wind data in miles per hour recorded during a UAF-DUSTM test performed on Tweedy Road
in Casa Grande, Arizona in January 2011. Tweedy Road travels in the north/south direction. The box
overlaid on the plot represents the position of the road relative to the wind data. This figure shows that
there was a predominant crosswind during testing. .............................................................................. 39
Figure 18 – PM10 concentrations recorded during a UAF-DUSTM test performed on Tweedy Road in Casa
Grande, Arizona. The concentrations recorded when travelling in the north bound direction are
signifigantly greater than the concentrations recorded when travelling in the south bound direction. . 40
Figure 19 - Median PM10 Concentrations vs. Relative Humidity for the dust palliative treated sections used
during UAF-DUSTM testing in Eagle, North Pole, and Tetlin, Alaska. .............................................. 42
Figure 20 - ANOCOVA Prediction Plot for Median PM10 Concentrations vs. Relative Humidity .............. 43
Figure 21- Median PM10 Concentrations vs. Relative Humidity for the control sections used during UAF-
DUSTM testing in Eagle, North Pole, and Tetlin, Alaska, as well as Phoenix, Arizona. .................... 45
Figure 22 - Box plot of PM10 concentrations measured on the control section used in Eagle, Alaska. ......... 49
TPD121205

viii
Figure 23 - Box plot of PM10 concentrations measured on Amundsen Street in Eagle, Alaska. ................... 50
Figure 24 - Box plot of PM10 concentrations measured on Mission Road in Eagle, Alaska. ........................ 51
Figure 25 - Box plot of PM10 concentrations measured on Third Avenue in Eagle, Alaska. ........................ 52
Figure 26 - Box plot of PM10 concentrations measured on Dawson Road in North Pole, Alaska. ................ 55
Figure 27 - Box plot of PM10 concentrations measured during 2010 on Moosewalk Road in North Pole,
Alaska. .................................................................................................................................................. 57
Figure 28 - Box plot of PM10 concentrations measured during 2010 and 2011 on Moosewalk Road in North
Pole, Alaska. ......................................................................................................................................... 58
Figure 29 - Box plot of PM10 concentrations measured on Sharon Road in North Pole, Alaska. ................. 59
Figure 30 - Box plot of PM10 concentrations measured on Plack Road in North Pole, Alaska. .................... 61
Figure 31 - Box plot of PM10 concentrations measured on the untreated control section of the runway in
Tetlin, Alaska. ...................................................................................................................................... 63
Figure 32 - Box plot of PM10 concentrations measured on the dust palliative treated section of the runway
in Tetlin, Alaska. .................................................................................................................................. 64
Figure 33 - Wind data in miles per hour recorded during UAF-DUSTM testing on the runway located in
Tetlin, Alaska, on 8/10/2010. The box overlaid plot represents the orientation of the runway relative
to the wind data..................................................................................................................................... 65
Figure 34 - Wind data in miles per hour recorded during UAF-DUSTM testing on the runway located in
Tetlin, Alaska, on 6/05/2011. The box overlaid plot represents the orientation of the runway relative
to the wind data..................................................................................................................................... 65
Figure 35 - Wind data in miles per hour recorded during UAF-DUSTM testing on the runway located in
Tetlin, Alaska, on 6/22/2012. The box overlaid plot represents the orientation of the runway relative
to the wind data..................................................................................................................................... 66
TPD121205

ix
List of Tables
Page
Table 1 - Palliative selection chart developed by Bolander and Yamada. (1999). .......................................... 9
Table 2 - Summary of dust palliative characteristics (FCM, 2005) ............................................................... 10
Table 3 - Results of UAF-DUSTM tests conducted on several roads in Eagle, Alaska. ............................... 41
Table 4 – Estimated coefficients for the linear models used during ANOCOVA. ........................................ 43
Table 5 - Latitude and longitude coordinates for the beginning and end of each test section in Eagle,
Alaska. .................................................................................................................................................. 48
Table 6 - Summary of PM10 concentrations measured on the control section in Eagle, Alaska. ................... 49
Table 7 - Summary of PM10 concentration measured on Amundsen Road in Eagle, Alaska. ....................... 50
Table 8 - Summary of PM10 concentration measured on Mission Road in Eagle, Alaska. ........................... 51
Table 9 - Summary of PM10 concentrations measured on Third Avenue in Eagle, Alaska. .......................... 52
Table 10 - Summary of the dust palliatives application for the test site in North Pole, Alaska. ................... 54
Table 11 - Summary of PM10 concentration measured on Dawson Road in North Pole, Alaska. ................. 56
Table 12 - Summary of PM10 concentrations measured on Moosewalk Road in North Pole, Alaska. .......... 58
Table 13 - Summary of PM10 concentrations measured on Sharon Road in North Pole, Alaska. ................. 60
Table 14 - Summary of PM10 concentration measured on Plack Road in North Pole, Alaska. ..................... 61
Table 15- Summary of PM10 concentration measured on the untreated control section of the runway in
Tetlin, Alaska. ...................................................................................................................................... 63
Table 16 - Summary of PM10 concentration measured on the dust palliative treated section of the runway in
Tetlin, Alaska. ...................................................................................................................................... 64
Table 17 - Median PM10 concentrations and relative humidity data recorded during UAF-DUSTM tests in
Tetlin, Alaska. ...................................................................................................................................... 66
TPD121205

1
1. Introduction
Fugitive dust emissions from gravel surfaces such as roads or airport runways
impact public health, decrease visibility, and contribute to surface degradation. Fugitive
dust emissions are quantified as particulate matter with an aerodynamic diameter of 10
microns or less (PM10). The United States Environmental Protection Agency (USEPA)
limits the allowable ambient PM10 concentration to 150 μg/m3 per 24-hour period. This
limit is part of the National Ambient Air Quality Standards (NAAQS) established by the
Clean Air Act (71 FR 61144). Areas exceeding this limit are classified as non-attainment
areas and must implement various control strategies to reduce concentrations to
attainment levels. PM10 typically accounts for 52.3% of the total suspended particles from
roads. Unpaved road dust emissions account for 41.3% of the total PM10 emissions in the
United States. This is greater than any other source, including industrial, agricultural, and
natural windblown emissions (Watson et al., 2000).
Communities throughout Alaska experience the problems associated with fugitive
dust emissions (Withycombe and Dulla, 2006). There is an extensive system of unpaved
gravel transportation infrastructure throughout the state of Alaska. According to the 2010
Certified Public Road Mileage Report published by the Alaska Department of
Transportation and Public Facilities (AKDOT&PF) there are 4,511 miles of unpaved
public roads within Alaska. Unpaved roads represent 53% of the total 11,006 miles of
public roads in Alaska. The AKDOT&PF also owns and maintains 252 rural airports,
most of which are unpaved. Calcium chloride and magnesium chloride have been used
throughout Alaska by AKDOT&PF to reduce fugitive dust emissions from unpaved
TPD121205

2
roads. However, these traditional dust palliatives cannot be used on unpaved runways due
to their potential corrosive nature. The AKDOT&PF has started to use nontraditional
chemical dust palliatives throughout the state on rural unpaved runways. However, there
is little knowledge of how these dust palliatives will work and how long they will be
effective in the unique climates of Alaska.
Besides publications produced by dust palliative manufacturers, there are few
guidance documents available to aid engineers in the selection, application, and
maintenance of palliatives. There is no standard method to test the effectiveness of dust
palliatives. From a construction standpoint it is difficult to hold a contractor to a
performance specification when there is no means to determine the success of the
application. Also, from an industry standpoint it is difficult to prove quantitatively the
effectiveness of different dust palliatives. There is little known about the longevity of
these palliatives once they have been applied. From an engineering standpoint, it is
critical to know how well a dust palliative will work for a given site and how long the
palliative application will be effective.
1.1 Objective
The objective of this study was to quantitatively measure dust palliative
performance and monitor the longevity of dust palliative applications throughout Alaska.
To accomplish this objective a new instrument, the UAF-DUSTM, was developed to
quantitatively measure dust palliative performance. A corollary objective in this thesis
was to develop the methodology for the UAF-DUSTM. Dust palliative performance was
TPD121205

3
monitored from 2009 to 2012 at several sites. The results of this research will aid
engineers in the selection of proper dust management strategies.
TPD121205

4
2. Background
2.1 Formation of Fugitive Dust
Unpaved roads are an unlimited reservoir of potential dust emissions. Two major
mechanisms cause dust emissions from gravel roads: resuspension by vehicle induced
turbulence and resuspension by tire shear. Wind erosion is another cause of road dust
emissions, but does not contribute significantly compared to the mechanisms related to
vehicle traffic. There is a large body of literature related to the resuspension of particles
from surfaces by turbulence because of the various industrial applications. Small particles
are adhered to a surface by electromagnetic forces including covalent bonds, charge
interaction, van der Waals forces, and repulsive forces. In order for a particle to be
resuspended by a turbulent fluid these forces must be overcome (Ziskind et al., 1995).
Particles may also be adhered by capillary forces in the presence of a fluid. Fluids form
liquid bridges that agglomerate particles to each other, thus increasing the particles size
and resistance to resuspension.
Mollinger et al. (1993) investigated how vehicle shape, velocity, and distance
from the ground affect particle resuspension by turbulent forces. All three factors were
investigated using a pendulum passing over a fixed aggregate sample. Three models of
different shapes were placed on the bottom of the pendulum. The profile of each model
was different to create different turbulent forces. The height of the model above the
ground surface was adjusted as well as the speed at which the model travelled over the
fixed sample. The samples were weighed before and after each test to determine the
amount of material resuspended. The study concluded that the most particles were
TPD121205
5
resuspended when the model was close to the sample, the sample consisted of larger
particles, the surface was smooth, and the aerodynamic shape of the model was poor. The
larger particles, greater than 100 μm, experience less cohesive forces and are easier to
detach from the surface. On a rough surface larger particles shield the smaller particles
from the turbulent forces thus reducing emissions. A smooth surface increases the
particle’s exposure to turbulent forces. The poor aerodynamic shape creates greater
turbulence behind the model.
There is limited literature on the resuspension caused by tire shear. Nicholson
and Branson (1990) investigated the mechanisms of particle resuspension by vehicle
traffic. This study used fluorescently dyed particles of four nominal sizes between 5 and
20 μm diameter applied to a road surface. An ultraviolet lamp illuminated the particles
after they were resuspended and a photomultiplier measured their fluorescence. Tests
were conducted to determine the influence of vehicle induced turbulence and tire shear
on resuspension. A midsized car traveled across the deposited particles at 64 km hr-1. The
vehicle drove alongside the deposited particles to determine the influence of turbulence
on resuspension. The vehicle drove directly over the deposited particles to determine the
influence of tire shear on resuspension.
Based on the results, Nicholson and Branson concluded that the resuspension of
9.5 μm diameter particles and larger by tire shear and vehicle induced turbulence
followed similar trends. The percent of fluorescent particles lofted after one vehicle pass
was approximately 50% for the tire shear and vehicle induced turbulence experiments.
Tire shear lofted 60% of fluorescent particles after three passes. Vehicle induced
TPD121205

6
turbulence lofted 55% of particles after three passes. After ten passes both methods of
resuspension failed to loft more fluorescent particles. Resuspension of particles smaller
than 9.5 μm in diameter was more influenced by tire shear. The direct abrasion of large
gravel particles caused by tire shear also replenishes material lost due to emissions
(Watson et al., 2000).
Gillies et al. (2005) investigated how particulate emission from unpaved roads are
effected by vehicle characteristics and weight. Nine vehicles traveling between 15 mph
and 80 mph were used to generate particulate emissions from a gravel road. Vehicle
weights ranged from 1.3 tons for a small sedan to 19.5 tons for a military off road cargo
vehicle. The plumes of PM10 generated by the vehicles were sampled by three stationary
towers downwind of the roadway. The experiments demonstrated that there was a linear
relationship between vehicle speed and PM10 emissions. A linear relationship between
vehicle weight and PM10 emissions was also found. Previous studies suggested that both
relationships followed a power function.
The USEPA has published emissions factors for modeling particulate emissions
from unpaved roadways in AP-42 (USEPA, 2011). The calculated emissions factor, in
pounds per vehicle mile travelled, depends on the moisture content of the surface, mean
vehicle speed, mean vehicle weight, and surface material silt content. There are separate
formulas for calculating particulate emissions from industrial and public access roads.
Emissions from industrial roads were found to depend more on the vehicle weight, while
emissions from public access roads were found to depend more on the moisture content
TPD121205

7
of the road surface. Empirical constants are used to correct for the size range of the
particle. Emissions can be calculated as Total Suspended Particles, PM10, or PM2.5.
2.2 Managing Fugitive Dust Emissions
There are several ways to reduce the fugitive dust emissions from unpaved
surfaces. Proper road design and construction are essential in reducing dust emissions.
Institutional controls, such as reducing speed limits and restricting vehicle weights, are
the cheapest methods of dust control, however they are difficult to enforce. Watering also
provides dust control, but requires frequent application due to evaporation from the
surface. Chemical additives, or dust palliatives, can be applied to or incorporated into the
unpaved surface. Dust palliatives fall into several categories depending on their chemical
components and the soil properties they change to reduce emissions. There is a
significant cost associated with dust palliatives compared to other control measures.
However, dust palliatives may offer a long term solution to dust problems when applied
correctly.
Proper design and construction of unpaved roads and runways can help reduce
fugitive dust emissions. The gradation of the material used for construction affects the
potential dust emissions. The cohesive force between the fine particles and the internal
friction between the coarser particles binds the material together (FCM, 2005). Poorly
graded materials will not bind together and are easily resuspended by tire shear and
turbulence. Well graded materials will form a solid matrix that resists deformation and
resuspension of fine particles. Proper drainage is also necessary to avoid a reduction of
TPD121205

8
fines due to washing, decreases in bearing capacity, and leaching of soluble dust
palliatives (Foley et al., 1996).
As defined by AP-42 fugitive dust emissions are a function of vehicle speed,
vehicle weight, and traffic type. Adjusting these parameters using institutional controls
can reduce dust emissions. For example, by reducing speeds from 40 MPH to 20 MPH
fugitive dust emissions can be reduced by 65% (Succarieh, 1992). Restricting vehicle
access to certain unpaved roads within a road network based on vehicle weight or type
may also reduce dust emissions. For example, restricting road access in industrial areas
to only necessary equipment will reduce traffic volumes and total dust emissions
(Countess Environmental, 2006). Institutional controls may be the most cost effective
option but cannot be guaranteed to reduce dust emissions. Community cooperation or law
enforcement is required for these management strategies to be effective.
If the unpaved surface has been properly constructed and institutional controls are
not viable or effective, dust palliatives can be used to reduce dust emissions. Dust
palliatives can be divided into several categories based on the soil properties they alter or
their chemical constituents. Bolander and Yamada (1999) divide dust palliatives into
seven categories: water, water absorbing products, petroleum based products, organic
nonpetroleum based products, electrochemical products, polymer products, and clay
additive products. Selection of the proper dust palliative depends on several site specific
factors including soil gradation, traffic volume, traffic type, local climate, and the level of
dust emission reduction desired.
TPD121205
9
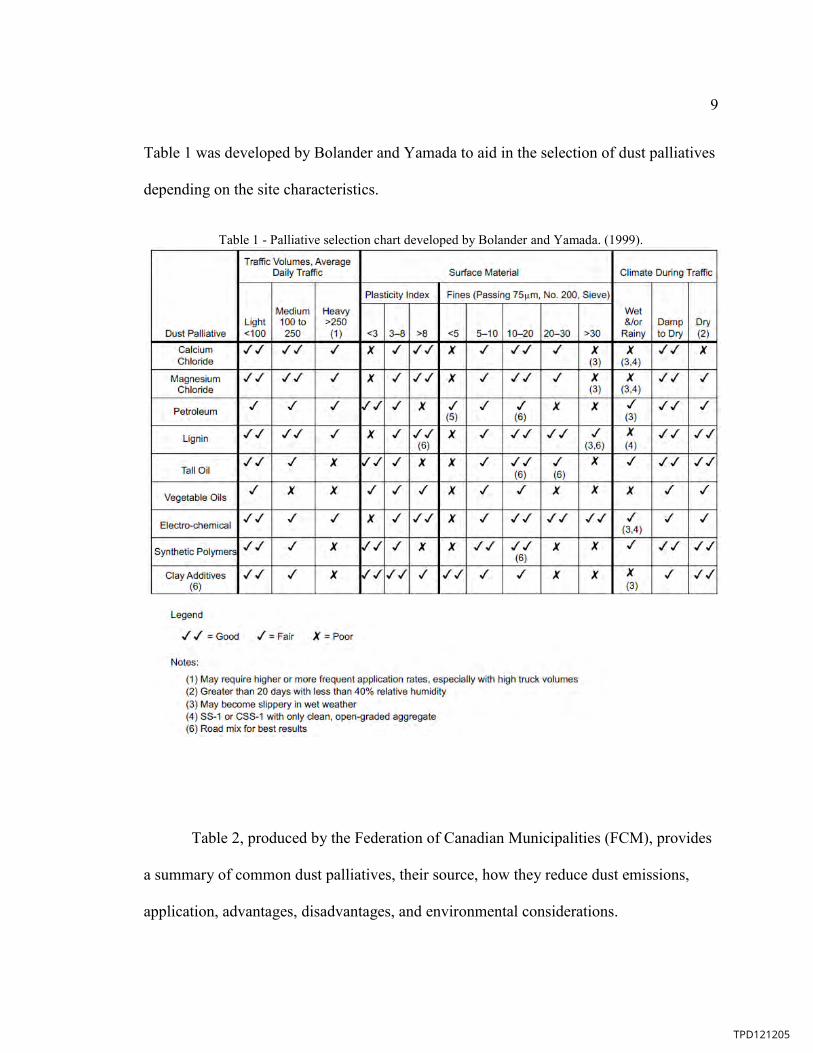
Table 1 was developed by Bolander and Yamada to aid in the selection of dust palliatives
depending on the site characteristics.
Table 1 - Palliative selection chart developed by Bolander and Yamada. (1999).
Table 2, produced by the Federation of Canadian Municipalities (FCM), provides
a summary of common dust palliatives, their source, how they reduce dust emissions,
application, advantages, disadvantages, and environmental considerations.
TPD121205

10
Table 2 - Summary of dust palliative characteristics (FCM, 2005)
Table 2 Continued - Summary of dust palliative characteristics (FCM, 2005)
TPD121205

11
TPD121205

12
2.3 Quantifying Fugitive Dust Emission from Gravel Surfaces
The USEPA has approved standard and equivalent methods for measuring
ambient PM10 concentrations to determine compliance with the NAAQS. The standard
method uses high volume samplers (Hi-Vols) to deposit particulate matter on a filter
cartridge for 24 hours. After the sample period the filters are weighed and the average
concentration is calculated based on the volume of air sampled (Center for Environmental
Research Information, 1999a). The equivalent methods continuously measure
atmospheric PM10 concentrations based on two principles. The first equivalent method
monitors the attenuation of beta radiation through a paper filter. Particulate matter is
deposited on the surface of the paper filter which increases the attenuation of the beta
particles. The second equivalent method monitors the changes in resonance of an
oscillating tapered element. The resonance changes as particulate matter is deposited on
the element (Center for Environmental Research Information, 1999b). These instrumental
methods measure total ambient PM10 concentrations and cannot be used to directly
measure the emissions from a gravel surfaces.
Several stationary and mobile techniques have been developed to measure
fugitive dust emissions from unpaved surfaces, but a standard method has not been
established. Cowherd et al. (1974) conducted a study to establish the first fugitive dust
emission factors for the USEPA. This report includes a review of the earliest fugitive dust
measurement techniques prior to 1974. Cowherd et al. measured the concentration of
total particulate matter 30μm in diameter or less (PM30) in dust plumes generated by
passenger cars and trucks adjacent to an unpaved road surface. Hi-Vol samplers were
TPD121205

13
used as well as exposure profilers developed by the Midwest Research Institute (MRI).
The MRI exposure profilers were designed to avoid the particle size bias associated with
Hi-Vol samplers. Based on the results, Cowherd et al. concluded that the dust emissions
were directly proportional to average traffic speed and the silt content. However, the
emissions factors presented did not account for moisture content, vehicle weight, or
traffic type (i.e. industrial vs. public).
In a report prepared for the California Regional Particulate Air Quality Study,
Watson et al. (1996) demonstrated the effectiveness of fugitive dust control methods for
unpaved roads and shoulders. This report includes a review of 16 previous dust
demonstrations which were used to develop the testing strategy. Between July 1995 and
August 1996, three different dust palliatives were monitored to determine their efficiency
in reducing PM10 emissions in the San Joaquin Valley. For unpaved roads, samples were
collected upwind, downwind, and directly overhead of the source to provide a complete
characterization of the dust plume using Minivol portable PM10 samplers produced by
AirMetrics. Meteorological conditions were monitored using a tower equipped with cup
anemometers, wind vanes, temperature sensors, and humidity sensors. Surface properties
of the test sections were characterized including: silt loadings, particle size distributions,
moisture content, and surface strength determined using a penetrometer. The palliative
efficiency was calculated as the percent reduction in emissions between an untreated
control and the palliative treated sections. Gillies et al. (1999) used similar sampling
techniques to study the effectiveness of four dust palliatives on public unpaved roads.
TPD121205

14
Sanders et al. (1997) developed a mobile measuring technique to study dust
palliative effectiveness in Colorado. Their instrument, the Colorado State University
Dustometer, consists of a high volume pump and filter cartridge attached to a pickup
truck. The filter cartridge is placed three feet behind the left rear tire and one foot above
the ground surface. As the truck travels across a test section the high volume pump is
turned on and dust generated by the vehicle is deposited onto the filter. Filters are
collected after each test and weighed in the laboratory. The mass of dust collected from a
palliative treated section is compared to an untreated section to infer the dust emission
reduction provided by the palliative. Rushing et al. (2005) used a similar mobile
technique relying on gravimetric analysis of filters exposed to fugitive dust emissions
behind a pickup truck.
Another mobile measuring technique, Testing Re-entrained Aerosol Kinetic
Emissions from Roads (TRAKER), was developed by Kuhns et al. (2001) to provide
real-time measurement of the PM10 emission potential based on the opacity of a sampled
airstream for paved and unpaved roadways. The original TRAKER system used two TSI
DustTrak Aerosol Monitors and a Grimm Particle Sizer mounted to a midsized vehicle.
One DustTrak was attached to the hood of the vehicle. The other DustTrak was attached
to an intake positioned behind the right front passenger tire. The PM10 emission potential
of the road surface is calculated based on the difference between the dust concentrations
measured behind the tire and the dust concentrations measured on the hood. The Grimm
Particle Sizer was used to determine a mass distribution of the particles generated by the
vehicle tire. Etyemzian et al. (2003) improved on the original TRAKER design. For the
TPD121205

15
new TRAKER design samples were collected from in front of the vehicle bumper and
behind both the right and left front tires. The sampled air passed through a plenum
designed to distribute the sample between five instruments, however only two DustTrak
instruments were used. Material losses within the sampling equipment were found to be
insignificant. The TRAKER measurements were correlated to stationary monitors similar
to those used by Gillies et al. and Watson et al. A similar mobile technique was
developed by Edvardsson et al. (2009).
TPD121205

16
3. UAF-DUSTM
The UAF-DUSTM, shown in Figure 1, was developed with the goal of
quantitatively measuring fugitive dust emissions from unpaved surfaces to determine dust
palliative performance. The design of the UAF-DUSTM was driven by the need for a
portable, user-friendly instrument that could easily be deployed in remote locations. The
UAF-DUSTM uses a TSI DustTrak Aerosol Monitor to measure the mass concentration
of PM10, reported as mg/m3, in the fugitive dust plume generated behind an all terrain
vehicle (ATV). Concentration measurements are taken every second and recorded to the
DustTrak’s internal memory. Dust palliative performance may be determined based on its
effectiveness at reducing PM10 emissions and the longevity of the application.
Figure 1 - The UAF-DUSTM. The instrument consists of a DustTrak Model II aerosol monitor and intake. The DustTrak is housed in a protective case, which is attached to the ATV. A plastic tube connects the
intake to the DustTrak.
TPD121205

17
3.1 Equipment
3.1.1 TSI DustTrak Aerosol Monitor
PM10 concentrations are measured and recording using a DustTrak Aerosol
Monitor produced by TSI, Inc. The first generation UAF-DUSTM used DustTrak Model
8520. The current setup uses a DustTrak II Model 8530. The theory of operation is the
same for both devices. The mass concentration of particulates in a sampled airstream is
determined based on opacity. As the sample enters the instrument it is split into two parts.
One half of the sample is passed through a HEPA filter to remove particulates and used
for sheath flow. The sheath flow keeps particulate contained in a steady stream and
reduces contamination of the optics.
The other half of the original sample passes through an optics chamber. As shown
in Figure 2, the optics chamber consists of a laser diode, gold plated mirror, and photo
detector. The light from the laser diode pass through two lenses to create a sheet of light.
The sheet of light then passes through the sample airstream. A fraction of that light is
diverted by the particles in the sample and reflected off the gold plated mirror to the
photo detector. The voltage across the photo detector is multiplied by a calibration
constant to determine the mass concentration of the sample. The instrument is calibrated
by TSI, Inc. using known concentrations of Arizona Test Dust. When the sample passes
through the optics chamber it enters a gravimetric filter which can be used for further
analysis of the sample (TSI, 2012). The DustTrak is returned to TSI, Inc. annually for
calibration and any necessary repairs. The DustTrak can be equipped with PM1, PM2.5,
TPD121205

18
PM4, and PM10 size selective inlets. The PM10 selective inlet is used for all UAF-DUSTM
measurements.
Figure 2 - TSI DustTrak Model II Aerosol Monitor flow schematic (TSI, 2012).
3.1.2 Intake
The original intake design is shown in Figure 3. This intake was designed to
allow for simultaneous concentration measurements based on opacity and gravimetric
analysis. Flexible tubing connected a DustTrak to the outlet on the top of the intake. The
bottom of the intake structure contained a 37mm-filter cassette that was attached to a
vacuum pump. It was initially assumed that the airflow into the intake was equal to the
airflow out of the intake and that the concentration measurements were representative of
TPD121205

19
the dust plume generated behind the tire. Tests revealed dust accumulated in the intake,
which caused a continuous increase in concentrations and poor measurement resolution.
Figure 4 shows the current intake design. The plastic tube that connects to the
DustTrak is centered on a 2-3/4 inch diameter flat aluminum plate. This intake provides
higher measurement resolution and greater accuracy. Rather than capturing dust in a
controlled volume, the intake allows for instantaneous sampling of the vehicle generated
dust plume. Figure 5 shows a plot of PM10 concentration versus time for the original
intake and the current intake designs over the same test section. The data for the current
intake design shows more variation in concentrations, which indicates a higher resolution
of measurement. The intake is installed on the opposite side of the ATV exhaust to avoid
the exhaust influencing the measurements. The intake is connected to the UAF-DUSTM
frame with three rigid aluminum pipes to avoid horizontal and vertical displacement
during operation.
TPD121205

20
Figure 3 – The original UAF-DUSTM intake design.
Figure 4 - The current UAF-DUSTM intake design.
TPD121205

21
Figure 5 - PM10 Concentration vs. Time for the original intake and current intake designs.
3.1.3 All Terrain Vehicles (ATV)
The UAF-DUSTM was designed to mount onto any type of ATV. For test sites
that are accessible by road a 2010 Polaris Sportsman 300 is used. The Sportsman 300 has
an automatic transmission, digital speedometer, and can be driven in either 2-wheel or 4-
wheel drive. During UAF-DUSTM testing 2-wheel drive is used. The stock front tire
dimensions are 22x7-12 in the rear tire dimensions are 22x10-12. The Sportsman 300 has
a dry weight of 500 pounds (Polaris, 2009).
The ATV must be rented in locations without road access. A variety of ATV’s
have been used at sites that do not have road access. The make, model, transmission type,
position of the exhaust, and tire dimensions are recorded when using a rented ATV.
Typically these ATV’s do not have speedometers. If the ATV does not have a
20 30 40 50 60 70 80 90 100 110 1200
20
40
60
80
100
120
Time (seconds)
PM
10 C
on
cen
trati
on
(m
g/m
3)
Original Intake
Current Intake
TPD121205

22
speedometer a handheld Garmin Oregon 550t GPS device is used to measure the speed of
the ATV during tests.
3.1.4 Meteorological Station
A Kestrel 4500 Pocket Weather Tracker, manufactured by Nielson-Kellerman
Company, is used to record meteorological data during testing. The Kestrel 4500 is
mounted on a compact tripod with a wind vane mount. The weather station is placed
adjacent to the testing area, away from any structures or vegetation that may influence
measurements. The Kestrel 4500 is used to record: wind direction, wind speed,
temperature, wind chill, relative humidity, heat index, dew point, and the wet bulb
temperature.
3.2 Test Procedure
Test sections are selected to provide a representative sample of the dust
palliative’s performance. On airport runway applications, tests are performed along the
centerline between the runway thresholds. The gravel surface outside of the runway lights
is typically used for the control section. For roads, tests are performed within each travel
lane. The length of road test sections depends on the length of the palliative treatment. A
minimum length of 1000 feet provides a statistically sound sample size of at least 30 data
points per test run. The beginning and end of the test section are clearly marked for
reference. Adequate distance is required before and after each test section to allow safe
acceleration and braking.
TPD121205

23
To begin testing, the ATV is positioned so the operator can accelerate to 20 mph
before crossing the start of the test section. The DustTrak and stopwatch are started
simultaneously. Synchronization is ensured by quickly comparing the stopwatch to the
time displayed on the DustTrak. The operator gradually accelerates to 20 mph. The
stopwatch’s lap function is used to record the time between starting the DustTrak and
reaching the beginning of the test section (T1). A constant 20 mph is maintained with no
rapid steering adjustments. At the end of the test section the lap function is used to record
the length of time required for the test (T2). Upon crossing the end of the test section the
operator gently brakes. After the ATV has come to a complete stop the operator stops the
DustTrak and stopwatch simultaneously and records the time (T3). The test number,
DustTrak log number, the average PM10 concentration, T1,T2, and T3 are recorded in the
waterproof log book.
At this point a single UAF-DUSTM test has been completed. The operator
repositions the ATV and repeats the process, travelling in the opposite direction. A
minimum of six tests, three in each direction, are conducted on both the palliative treated
sections and the control sections. Between each test the equipment is visually inspected
and repairs are made as necessary.
3.3 Data Analysis
After field tests are complete the data is downloaded from the DustTrak and
analyzed. The data recorded during T1 and T3 are removed, as they are not representative
of the dust palliatives performance. Only concentration data recorded during T2 is used to
determine dust palliative effectiveness and longevity. Several methods have been
TPD121205

24
proposed to determine dust palliative effectiveness. This section provides a description of
the proposed methods and a discussion of their limitations.
The first method calculated the PM10 emission reduction (%R) as follows:
Where, is the average concentration measured on the dust palliative treated section,
and is the average PM10 concentration measured on the untreated control section. This
method assumed the data collected came from a population fitting the normal
distribution, and thus the average concentration values were valid descriptors of the data
sets. Goodness of fit testing using the Kolmogorov-Smirnov Test (Massey, 1951) showed
that the concentration data does not fit a standard normal distribution. Analyzing the
concentration data using the Lilliefors Test (Conover, 1971) confirmed that the data does
not fit any distribution in the normal family. Since the concentrations do not fit a normal
distribution this analysis method was rejected.
The second proposed analysis method, called the S-Curve Method, was based on
nonparametric order statistics. A complete series analysis was conducted on the
concentration data collected from the treated section. The reduction of PM10 emissions
for each descending ordered data point was calculated as follows:
Where is the ith concentration measured on the dust palliative treated section, and is
the median concentration measured on the untreated control section. The points were
TPD121205

25
then plotted against the cumulative percent surface area (%), which is calculated as
follows:
Where is equal to the total number of datum points, and is equal to the ith data point.
Figure 6 is example of the plots developed using this analysis technique for data
collected from Moosewalk Road in North Pole, Alaska, on two different dates. Dust
palliative effectiveness is interpreted from the plot based on the percent reduction for a
selected percent surface area. For example, on August 17th, 2010, 85% of the dust
palliative treated surface area was reducing PM10 emissions by 95% or greater. However,
on September 12th, 2010 the dust palliative was providing zero reduction in PM10
emissions over 85% of the surface area. Based on these results it would appear that the
dust palliative’s effectiveness had significantly decreased in less than a month.
TPD121205

26
Figure 6 - Results from two UAF-DUSTM tests performed on Moosewalk Road in North Pole, Alaska, analyzed using the S-Curve Method.
Such a rapid decline in dust palliative effectiveness was not anticipated. Upon
further analysis of the data it became clear that the concentrations measured on the dust
palliative treated section were actually similar for both days. For example, the actual
PM10 concentration corresponding to 85% of the surface area on August 17th, 2010 was
2.74 mg/m3. The PM10 concentration corresponding to 85% of the surface area on
September 12th, 2010 was 2.97 mg/m3, which is only 8% greater than the concentration
measured on August 17th. Figure 7 is a plot of the PM10 concentrations, in log scale,
measured on the palliative treated section for both dates. Based on the figure,
approximately 70% of the concentrations measured on August 17th, 2010 were greater
than those measured on September 12th, 2010. This indicates that the dust palliative was
0 10 20 30 40 50 60 70 80 90 1000
10
20
30
40
50
60
70
80
90
100
Surface Area (%)
PM
10 R
ed
ucti
on
(%
)
August 17th, 2010
September 12th, 2010
TPD121205

27
still reducing PM10 emissions, even though the results of the S-Curve Method analysis
suggest otherwise.
Figure 7 - Log PM10 Concentration vs. Percent of Total Sample for two UAF-DUSTM tests performed on Moosewalk Road in North Pole, Alaska.
This error was caused by the use of the median control concentration to calculate
the dust palliative effectiveness. On 8/17/2010 the median control concentration 35.1
mg/m3. On 9/12/2010 the median control concentration was 2.97 mg/m3. The difference
in median control concentrations between the two tests is due to an increase in moisture
content caused by precipitation. The increased moisture content significantly reduced the
PM10 emission from the control section on 9/12/2010. However, the increase in moisture
content did not affect the PM10 emissions from the dust palliative treated section.
The discrepancy between how moisture content affects the palliative treated
section and the untreated control section is most likely related to how dust palliatives
0 10 20 30 40 50 60 70 80 90 10010
-2
10-1
100
101
102
Percent of Total Sample (%)
Lo
g P
M10 C
on
cen
trati
on
(m
g/m
3)
August 17th, 2010
September 12th, 2010
TPD121205

28
behave in the soil matrix. Typically the soil matrix contains two fluids: air and water. In
this case, water acts as the wetting fluid, spreading across the surface of the individual
soil particles. In the presence of a solid surface a liquid will coat, or wet, the surface due
to viscous forces and surface tension. The extent to which the liquid wets the solid
surface depends on the interfacial tension between the solid-vapor phase (γsv), the solid-
liquid phase (γsl), and the liquid-vapor phase (γlv). When (γsv - γsl) is greater than γlv the
liquid will completely coat the solid surface. When (γsv - γsl) is less than γlv the liquid will
not wet the surface (Kumar and Prabhu, 2007).
Capillary pressure is developed within the pore space due to the internal pressure
difference between the two fluids. The magnitude of the capillary pressure depends on
the curvature of the interface between the two fluids, which is a function of the interfacial
tension (Bear, 1972). Capillary pressure, , is defined as:
Where, is the pressure in the nonwetting phase and is the pressure in the wetting
phase. Capillary pressure causes the wetting fluid to advance through the pore space and
displace the nonwetting fluid. The interfacial tension between the soil particles and the
wetting fluid, and the cohesive force of the fluid, holds the soil particles together.
Synthetic dust palliatives act as a third immiscible fluid when applied to an
unsaturated soil. Again, the interfacial tension between the three fluids determines which
fluid will be wetting with respect to the soil particles. It is still unclear whether the dust
palliative acts as a wetting fluid or as an intermediate fluid between the water and air.
However, it is clear that the introduction of a third immiscible fluid to the system will
TPD121205

29
have an effect on the capillary pressure within the pore space based on the fundamentals
discussed. The influence of the dust palliative on capillary pressure may explain why
precipitation has a greater affect on the emissions from the control section rather than the
palliative treated section, as indicated by these results. Further investigation of how
synthetic dust palliatives behave within the soil matrix on a microscopic level is required
but beyond the scope of this project. The S-Curve Method was rejected due to the
possibility of incorrectly judging dust palliative effectiveness due to variations in
moisture content.
The third proposed analysis method used the variance associated with each
dataset to infer dust palliative performance and longevity. After the initial application of a
dust palliative it was observed that there is little variation in PM10 concentrations
measured from the surface if the palliative was applied properly. Figure 8 is a histogram
of the PM10 concentrations measured on Sharon Road in North Pole, Alaska, two weeks
after the initial palliative application. The dust palliative used was an immiscible fluid
applied directly to the road surface. The PM10 concentrations are closely grouped with
little variation, and a large peak in the data can be observed. It was proposed that as the
dust palliative aged the variation in PM10 concentrations would increase.
TPD121205

30
Figure 8 - Histogram of PM10 concentrations measured on Sharon Road, North Pole, Alaska. 8/12/2010
The median absolute deviation (MAD) was used to quantify the variance of the
dataset. The MAD is accepted as a robust measure of variance, reducing the bias caused
by extreme outliers on the calculation of variance (Hoaglin et al., 1982). Extreme outliers
in the dataset are typically residuals of the concentrations measured during the
acceleration and deceleration periods and are not representative of the dust palliatives
performance as discussed previously. The MAD is calculated as:
Where is the ith concentration of the dataset C and is the median concentration. To
compare the MAD from each dataset the concentrations are normalized using the median
concentration from the dataset as follows:
0 0.05 0.1 0.15 0.2 .25 .3 .35 .4 .45 More0
50
100
150
200
250
PM10 Concentration (mg/m3)
Fre
qu
en
cy
TPD121205

31
Where C is the normalized concentration, Ci is the ith data point, and is the median. The
concentrations are normalized so each dataset is on a similar scale and to reduce the
influence of factors such as wind and weather. Figure 9 is a histogram of the normalized
PM10 concentrations measured on Sharon Road in North Pole, Alaska, two weeks after
the initial palliative application. The MAD for the normalized PM10 concentrations
measured on 8/12/2010 is 0.2069.
Figure 9 - Histogram of Normalized PM10 Concentrations for Sharon Road, North Pole, Alaska, on 8/12/2010.
Figure 10 is a histogram of the normalized PM10 concentrations measured on
Sharon Road on 9/20/2010. Comparing Figure 9 and Figure 10 there appears to be an
increase in the variability of the normalized PM10 concentrations. There is less
peakedness in Figure 10than Figure 9, and the normalized PM10 concentrations are more
dispersed. The MAD for the normalized PM10 concentrations measured on 9/20/2010 is
0 1 2 3 4 5 6 7 8 9 More0
10
20
30
40
50
60
70
80
90
Normalized PM10 Concentration
Fre
qu
en
cy
TPD121205

32
0.4524. This supports the assumption that variance is a good indication of decreasing
dust palliative effectiveness.
Figure 10 - Histogram of Normalized PM10 Concentrations for Sharon Road, North Pole, Alaska, on 9/20/2010.
Figure 11 is a histogram of the normalized PM10 concentrations measured on
Sharon Road on 6/1/2011; nearly a year after the initial application was completed.
Comparing Figure 10 and Figure 11 there appears to be a decrease in the variability of
normalized PM10 concentrations. There is more peakedness in Figure 11 than Figure 10,
and the normalized PM10 concentrations are less dispersed. The MAD for the normalized
PM10 concentrations measured on 6/1/2011 is 0.3373. This is a decrease from the MAD
for the normalized PM10 concentrations measured on 9/20/2010, contradicting the
assumption that variability is a good indication of the change in dust palliative
performance.
0 1 2 3 4 5 6 7 8 9 More0
10
20
30
40
50
60
70
80
90
Normalized PM10 Concentration
Fre
qu
en
cy
TPD121205

33
Figure 11 - Histogram of Normalized PM10 Concentrations for Sharon Road, North Pole, Alaska, on 6/1/2011.
Figure 12 is a plot of the PM10 concentrations, in log scale, measured on Sharon
Road on 8/12/2010, 9/20/2010, and 6/1/2011. Despite the decrease in variance between
the data collected on 9/20/2010 and the data collected on 6/1/2011, the figure indicates
that the PM10 concentrations increased with time. Therefore, it was concluded that this
method of calculating variation to describe how dust palliative performance changes with
time is not a valid approach.
0 1 2 3 4 5 6 7 8 9 More0
10
20
30
40
50
60
70
80
90
Normalized PM10 Concentrations
Fre
qu
en
cy
TPD121205

34
Figure 12 - Log PM10 Concentration vs. Percent of Total Sample for three UAF-DUSTM tests performed on Sharon Road in North Pole, AK. UAF-DUSTM tests were conducted on 8/12/2010, 9/20/2010, and
6/1/2011.
At this point there is no consistent method for quantifying the effectiveness of a
dust palliative application using a single statistic. Calculating the dust palliative’s
effectiveness using a control section has proven to be inconsistent due to the difference in
soil matrix behavior once a dust palliative has been introduced. Further investigation into
how the introduction of a dust palliative influences the soil matrix is required, but is
beyond the scope of this project. This fact makes it difficult to compare the performance
of a dust palliative between sites in absolute terms. Also, a single statistic that
consistently indicates dust performance and palliative longevity has not been found.
Rather than seeking a single variable to indicate dust palliative performance and
longevity, the entire dataset of concentrations may be considered. As illustrated in Figure
0 10 20 30 40 50 60 70 80 90 10010
-3
10-2
10-1
100
101
102
Percent of Total Sample (%)
Lo
g P
M10 C
on
cen
trati
on
(m
g/m
3)
August 12th, 2010
September 20th, 2010
June 1st, 2011
TPD121205

35
7 and Figure 12, plots of the entire dataset of concentrations can be used to judge the
difference in PM10 concentrations and infer dust palliative longevity.
Box plots are another useful tool for comparing concentrations between
successive dates. Figure 13 is a box plot of the PM10 concentrations measured on
Moosewalk Road in North Pole, Alaska, over a six week period. The box plot indicates
the 25th percentile, 50th percentile or median and 75th percentile of the data. These values
illustrate the variability in the dataset without normalizing the data. The whiskers
extending from the box plot indicate the smallest and largest values that are not outliers.
Based on this figure, a trend of increasing PM10 concentrations is evident. While the
PM10 concentrations decrease between 8/17/2010 and 9/12/2010, also indicated by Figure
7, they significantly increase on 9/17/2010. Figure 14 contains a box plot of the PM10
concentrations measured on Moosewalk Road on 6/1/2011, nearly a year after initial
application. This figure clearly indicates that the effectiveness of the dust palliative
decreased between 9/17/2010 and 6/1/2011, confirming the trend indicated by Figure 13.
Note that for these boxplots outliers are omitted for clarity.
TPD121205

36
Figure 13 - Box plot of PM10 concentrations measured during four separate UAF-DUSTM tests on Moosewalk Road in North Pole, Alaska.
Figure 14 - Box plot of PM10 concentrations measured during separate UAF-DUSTM tests between 8/12/2010 and 6/1/2011 on Moosewalk Road in North Pole, Alaska.
0
2
4
6
8
10
12
8/12/10 8/17/10 9/12/10 9/17/10
Date of Test (mm/dd/yy)
PM
10
Co
nc
en
tra
tio
n (
mg
/m3)
0
10
20
30
40
50
60
70
8/12/10 8/17/10 9/12/10 9/17/10 6/1/11
Date of Test (mm/dd/yy)
PM
10
Co
nc
en
tra
tio
n (
mg
/m3)
TPD121205

37
3.4 Factors Affecting Measurements
During development of the UAF-DUSTM testing methodology several factors that
influence test results were identified. Wind can significantly affect the dispersion of the
dust plume behind the ATV. Concentrations tend to be higher when travelling into a
headwind, and lower when travelling with a tailwind. This is due to the influence of the
wind on the dispersion of the dust plume relative to the moving intake structure. When
travelling into a headwind the ATV shields the dust plume generated by the tire from
being dispersed. When travelling into a tailwind, the dust plume is not shielded by the
ATV and can be dispersed by the wind.
Figure 15 is a plot of wind data recorded during a UAF-DUSTM test conducted
on the runway in Tetlin, AK. The orientation of the runway is overlaid on the plot for
reference. During this test there was a predominant headwind for all tests conducted
travelling due east. Figure 16 is a plot of the PM10 concentrations recorded during this
test which illustrate the affects of head and tail winds From the figure it can be seen that
concentrations recorded while travelling into the headwind are higher than those recorded
while travelling with a tailwind.
TPD121205

38
Figure 15 - Wind data in miles per hour recorded during a UAF-DUSTM test on the runway located in Tetlin, Alaska, in August 2010. The box overlaid on the plot represents the position of the runway relative
to the wind data. This figure shows that there was a predominant head/tail wind during testing.
Figure 16 – PM10 concentrations recorded during UAF-DUSTM test performed on the runways in Tetlin, Alaska, in 2010. The concentrations recorded while travelling into the wind are greater than the
concentrations recorded while travelling with a tail wind.
15%
30%
45%
WEST EAST
SOUTH
NORTH
0 - 2
2 - 4
4 - 6
6 - 8
8 - 10
10 - 12
12 - 14
15%
30%
45%
WEST EAST
SOUTH
NORTH
0 - 2
2 - 4
4 - 6
6 - 8
8 - 10
10 - 12
12 - 14
0 10 20 30 40 50 60 70 80 90 10010
-2
10-1
100
101
Percent of Total Sample (%)
Lo
g P
M1
0 C
on
ce
ntr
ati
on
(m
g/m
3)
With Headwind
With Tailwind
TPD121205

39
Cross winds also affect the PM10 concentrations recorded during testing. Figure
17 is a plot of wind data recorded during a UAF-DUSTM test performed in Casa Grande,
AZ. The road being tested was aligned directly north and south. There was a predominant
cross wind during these tests. Figure 18 shows the PM10 concentrations recorded during
these tests. There is a significant difference in the North and South bound concentrations.
The intake was positioned behind the right rear tire during testing. The dust plume
generated by the tires was dispersed away from the intake when driving in the south
bound direction. The wind dispersed the dust plume generated from the left tire towards
the intake when travelling in the north bound direction the. The larger concentration
readings were caused by the combination of the dust plumes from the right and left tire.
Figure 17 - Wind data in miles per hour recorded during a UAF-DUSTM test performed on Tweedy Road in Casa Grande, Arizona in January 2011. Tweedy Road travels in the north/south direction. The box overlaid on the plot represents the position of the road relative to the wind data. This figure shows that
there was a predominant crosswind during testing.
10%
20%
30%
WEST EAST
SOUTH
NORTH
0 - 1
1 - 2
2 - 3
3 - 4
4 - 5
5 - 6
6 - 7
TPD121205

40
Figure 18 – PM10 concentrations recorded during a UAF-DUSTM test performed on Tweedy Road in Casa Grande, Arizona. The concentrations recorded when travelling in the north bound direction are
signifigantly greater than the concentrations recorded when travelling in the south bound direction.
The moisture content of the soil affects PM10 emissions from gravel surfaces.
There is an inverse relationship between soil moisture content and PM10 emissions. As
soil moisture content increases the concentration of PM10 emissions decreases. Relative
humidity can be used as an indication of soil moisture content. Relative humidity controls
the rate of evaporation of moisture from the soil. If there is a high relative humidity the
evaporation rate will be slow. If there is a low relative humidity the soil moisture can
evaporate rapidly.
As relative humidity increases the concentration of PM10 measured with the UAF-
DUSTM has a tendency to decrease. For example, UAF-DUSTM tests conducted on dust
palliative treated roads in Eagle, Alaska, on 6/3/2011 and 6/4/2011 indicate a decrease in
0 10 20 30 40 50 60 70 80 90 10010
0
101
102
103
Percent of Total Sample (%)
Lo
g P
M1
0 C
on
ce
ntr
ati
on
(m
g/m
3)
North Bound
South Bound
TPD121205

41
median concentration with an increase in relative humidity. Table 3 includes the median
PM10 concentration from each UAF-DUSTM test and the relative humidity recorded
during testing. The data suggests that there is an inverse relationship between PM10
concentrations and relative humidity, similar to the relationship between soil moisture
content and PM10 concentrations.
Figure 19 is a scatter plot of median PM10 concentration versus relative humidity
for the palliative treated sections used during UAF-DUSTM tests conducted in Eagle,
Tetlin, and North Pole, Alaska. A power-series provides the best model of the data. It is
expected that the data would follow a power series due to how the capillary forces
develop in the soil. As the relative humidity decreases the soil moisture likely decreases.
At low soil moisture contents there is not enough liquid in the void space to completely
coat the particles and develop strong capillary forces. The coefficient of determination
(R2) for the model is equal to 0.1466 This is a low R2 value, suggesting that the relative
humidity does not have a significant effect on median PM10 concentration readings for
dust palliative treated sections.
Table 3 - Results of UAF-DUSTM tests conducted on several roads in Eagle, Alaska.
Date Test Section Median PM10 Concentration
(mg/m3)
Relative Humidity (%)
6/3/2011
Amundsen 10.3 23.2 Mission 5.66 27.7 Third 2.73 22.0 Control 28.4 21.6
6/4/2011
Amundsen 7.84 48.6 Mission 3.96 48.9 Third 1.67 44.7 Control 21.3 50.4
TPD121205

42
Figure 19 - Median PM10 Concentrations vs. Relative Humidity for the dust palliative treated sections used during UAF-DUSTM testing in Eagle, North Pole, and Tetlin, Alaska.
Further investigation of this dataset indicates the affect of relative humidity on
median PM10 concentration is insignificant compared to the affect of ageing. An analysis
of covariance (ANOCOVA) can be completed on the dataset by grouping median PM10
concentration versus relative humidity data based on the dust palliative’s age when the
test was conducted. Figure 20 is the ANOCOVA Prediction Plot for this data, showing
the relationship between median PM10 concentration and relative humidity for each year.
Note there was only one fourth year data point for median PM10 concentration versus
relative humidity available and it is ignored in this analysis.
A linear model is fit to the entire dataset and each grouping of data. The
coefficient estimates for each model are provided in Table 4. The models appear to be
20 25 30 35 40 45 50 55 600
2
4
6
8
10
12
14
16
18
Relative Humidity (%)
PM
10
Co
nc
en
tra
tio
n (
mg
/m3)
fitted curve
R2 = 0.1466
TPD121205

43
significantly different. Based on the grouping of the data, it appears that the median PM10
concentration increases each year, regardless of the relative humidity during testing.
Figure 20 - ANOCOVA Prediction Plot for Median PM10 Concentrations vs. Relative Humidity
Table 4 – Estimated coefficients for the linear models used during ANOCOVA.
Term Estimate Standard
Error T Prob > |T|
Intercept All Data 6.303 4.2701 1.48 0.1707 First Year 1.908 4.9703 -0.88 0.3976 Second Year 9.0577 4.8098 0.57 0.5795 Third Year 14.085 12.223 0.64 0.5386 Slope All Data -0.0132 0.1887 -0.07 0.9454 First Year -0.0226 0.1954 -0.12 0.910 Second Year -0.1027 0.194 -0.53 0.6082 Third Year 0.0125 0.3712 0.34 0.7427
Figure 21 is a scatter plot of median PM10 concentration values versus the relative
humidity during testing for the control sections in Eagle, North Pole, and Tetlin, Alaska,
25 30 35 40 45 50 550
5
10
15
20
25
Relative Humidity (%)
Med
ian
PM
10 C
on
cen
trati
on
(m
g/m
3)
First Year
Second Year
Third Year
First Year Fit
Second Year Fit
Third Year Fit
TPD121205

44
as well as Casa Grande, Arizona. Using a power series provides the best fit of the data,
with a coefficient of determination (R2) equal to 0.4842. There is a better correlation
between median PM10 concentrations versus relative humidity for the untreated control
sections compared to the dust palliative treated sections. PM10 concentrations are closely
grouped when there is a higher relative humidity. In dry conditions the PM10
concentrations are more dispersed, suggesting that the influence of other environmental
factors is greater.
There is a significant difference in how relative humidity effects a dust palliative
treated section versus an untreated section. Again, this illustrates how the soil matrix
behaves differently once a dust palliative is introduced to the system. These results also
suggests that dust palliative performance cannot be determined by comparing results
from a treated section to an untreated section as discussed previously.
TPD121205

45
Figure 21- Median PM10 Concentrations vs. Relative Humidity for the control sections used during UAF-DUSTM testing in Eagle, North Pole, and Tetlin, Alaska, as well as Phoenix, Arizona.
Relative humidity may also influence the dispersion and transport of the dust
plume generated by the ATV. Dispersion will be greater in arid conditions with low
relative humidity. The air is less dense in these conditions and particles will have more
freedom to disperse from the sources. When there is a high relative humidity the particles
are more confined in the plume. Therefore it is expected that higher concentrations could
be measured when the relative humidity is high. However, this effect has not be observed
during testing. The impact of soil moisture content, inferred in terms of relative humidity,
has a much greater affect and makes the influence of relative humidity on the dispersion
of the dust plume insignificant.
20 25 30 35 40 45 50 55 600
5
10
15
20
25
30
35
Relative Humidity (%)
PM
10
Co
nc
en
tra
tio
n (
mg
/m3)
fitted curve
R2 = 0.4842
TPD121205

46
4. Dust Palliative Effectiveness and Longevity
The following section provides an analysis of dust palliative effectiveness and
longevity for three locations in Alaska: Eagle, Tetlin, and North Pole. The section is used
to provide an example of how UAF-DUSTM results should be interpreted. Dust
palliatives were applied to gravel roads in Eagle, AK and North Pole, AK during the
summer of 2010. A dust palliative was applied to the runway in Tetlin, AK during the
summer of 2009. These three sites provide the most complete datasets for evaluating
dust palliative performance and longevity and provide examples of the strengths and
limitations of the UAF-DUSTM as discussed in the previous section. Box plots are used
to present the results of each UAF-DUSTM test. Tables are provided that contain a
summary of the descriptive statistics used in creating the figures in this section including:
the first quartile, the median, the third quartile.
4.1 Eagle, Alaska
A dust palliative was applied to several gravel roads in Eagle, Alaska, during
June 2010 by the AKDOT&PF. The dust palliative, EnviroKleen®, is manufactured by
Midwest Industrial Supply, Inc. The dust palliative was applied at a rate of 1 gallon per
40 square feet, as recommended by the manufacturer. UAF-DUSTM tests were
conducted on 8/4/2010, 6/3/2011, 6/4/2011, and 6/22/12.
Amundsen Street, Mission Road, and Third Avenue were selected as
representative test sections to evaluate the effectiveness and longevity of the dust
palliative application. This decision was based on the varying surface condition of each
road and the anticipated traffic volume. Amundsen and Mission are defined as rural
TPD121205

47
major collectors by the AKDOT&PF Functional Classification Update (AKDOT&PF,
2010b). Amundsen Road begins at the end of the Taylor Highway and continues north
through town to the Yukon River. Mission Road connects the town of Eagle to Eagle
Village and residential housing outside of the town limits. Mission Road begins at the
Bureau of Land Management (BLM) Visitor Center on the west edge of Eagle and
continues east, following the Yukon River. Mission Road is also known as First Avenue
and Front Street. Amundsen Road and Mission Road are bordered by residential and
commercial areas. Third Avenue is an arterial road that connects Amundsen Road and
Mission Road. The local school is located on Third Avenue as well as residential
housing. A section of Eagle Road was used for the untreated control section. Table 5
provides the latitude and longitude of the beginning and end of each test section.
TPD121205

48
Table 5 - Latitude and longitude coordinates for the beginning and end of each test section in Eagle, Alaska.
Test Section: Location: North: West:
Amundsen Street
Beginning of Test Section 64°47.274’ 141°12.177’
End of Test Section 64°47.666’ 141°13.905’
Mission Road
Beginning of Test Section 64°46.853’ 141°09.700’
End of Test Section 64°47.280’ 141°12.120’
3rd
Avenue
Beginning of Test Section 64°47.102’ 141°11.852’
End of Test Section 64°47.234’ 141°12.375’
Control
Beginning of Test Section 64°46.241’ 141°06.287’
End of Test Section 64°46.245’ 141°04.210’
Figure 22 provides the box plots of PM10 concentrations measured on the control
section, Eagle Road. The results are summarized in Table 6. During the summer of 2010
Eagle experienced heavy rains, which may explain the increase of PM10 concentrations
on the control section in 2011 and 2012. The difference in PM10 concentrations between
6/03 and 6/04/2011 can be explained by the timing of each test. The tests on 6/03/2011
were conducted in the afternoon; after any dew that had penetrated the road surface
during the evening and night had been evaporated. The tests on 6/04/2011 were
conducted during the morning hours. This trend is consistent for each test section. The
UAF-DUSTM tests conducted on 6/22/2012 represent the greatest PM10 emission
potential, and will be used to evaluate the effectiveness and longevity of the dust
palliative applications.
TPD121205

49
Figure 22 - Box plot of PM10 concentrations measured on the control section used in Eagle, Alaska.
Table 6 - Summary of PM10 concentrations measured on the control section in Eagle, Alaska.
Date
First Quartile
(mg/m3)
Median
(mg/m3)
Third Quartile
(mg/m3)
8/4/2010 6.52 9.05 12.60 6/3/2011 22.80 28.50 35.70 6/4/2011 16.60 21.30 26.80 6/22/2012 28.15 34.30 41.20
Figure 23 provides the box plot of PM10 concentrations measured on Amundsen
Street. The results are summarized in Table 7. Based on the results from 8/04/2010, the
dust palliative initially provided a reduction of PM10 emissions compared to the control
section. There is a large increase in PM10 concentrations between 2010 and 2011. PM10
concentrations continue to increase in 2012; however the majority of PM10
concentrations are less than those measured on the control section in 2012. The third
8/04/2010 6/03/2011 6/04/2011 6/22/20120
5
10
15
20
25
30
35
40
45
50
55
60
65
Date of Test
PM
10
Co
nc
en
tra
tio
n (
mg
/m3)
TPD121205

50
quartile of PM10 concentrations measured on Amundsen Road in 2012 was 25.60 mg/m3.
The first quartile of PM10 concentrations measured on the control section in 2012 was
28.15 mg/m3. This suggests that the dust palliative is still providing a reduction in PM10
emissions.
Figure 23 - Box plot of PM10 concentrations measured on Amundsen Street in Eagle, Alaska.
Table 7 - Summary of PM10 concentration measured on Amundsen Road in Eagle, Alaska.
Date
First Quartile
(mg/m3)
Median
(mg/m3)
Third Quartile
(mg/m3)
8/4/2010 0.64 1.14 4.97 6/3/2011 6.49 10.60 16.80 6/4/2011 4.71 7.84 12.10 6/22/2012 10.90 17.25 25.60
Figure 24 provides the box plots of PM10 concentrations measured on Mission
Road. The results are summarized in Table 8. Based on the results from 8/04/2010, the
8/04/2010 6/03/2011 6/04/2011 6/22/20120
5
10
15
20
25
30
35
40
45
50
Date of Test
PM
10
Co
nc
en
tra
tio
n (
mg
/m3)
TPD121205

51
dust palliative initially provided a reduction of PM10 emissions compared to the control
section. The PM10 concentrations increase in 2011 and again in 2012. Similar to
Amundsen Street, the PM10 concentrations measured on Mission Road in 2012 are less
than those measured on the control section in 2012. This suggests that the dust palliative
is still providing a reduction in PM10 emissions.
Figure 24 - Box plot of PM10 concentrations measured on Mission Road in Eagle, Alaska.
Table 8 - Summary of PM10 concentration measured on Mission Road in Eagle, Alaska.
Date
First Quartile
(mg/m3)
Median
(mg/m3)
Third Quartile
(mg/m3)
8/4/2010 0.50 1.54 3.67 6/3/2011 3.14 5.66 11.00 6/4/2011 2.29 3.69 6.88 6/22/2012 13.00 17.80 25.60
8/04/2010 6/03/2011 6/04/2011 6/22/20120
5
10
15
20
25
30
35
40
45
50
Date of Test
PM
10
Co
nc
en
tra
tio
ns
(m
g/m
3)
TPD121205
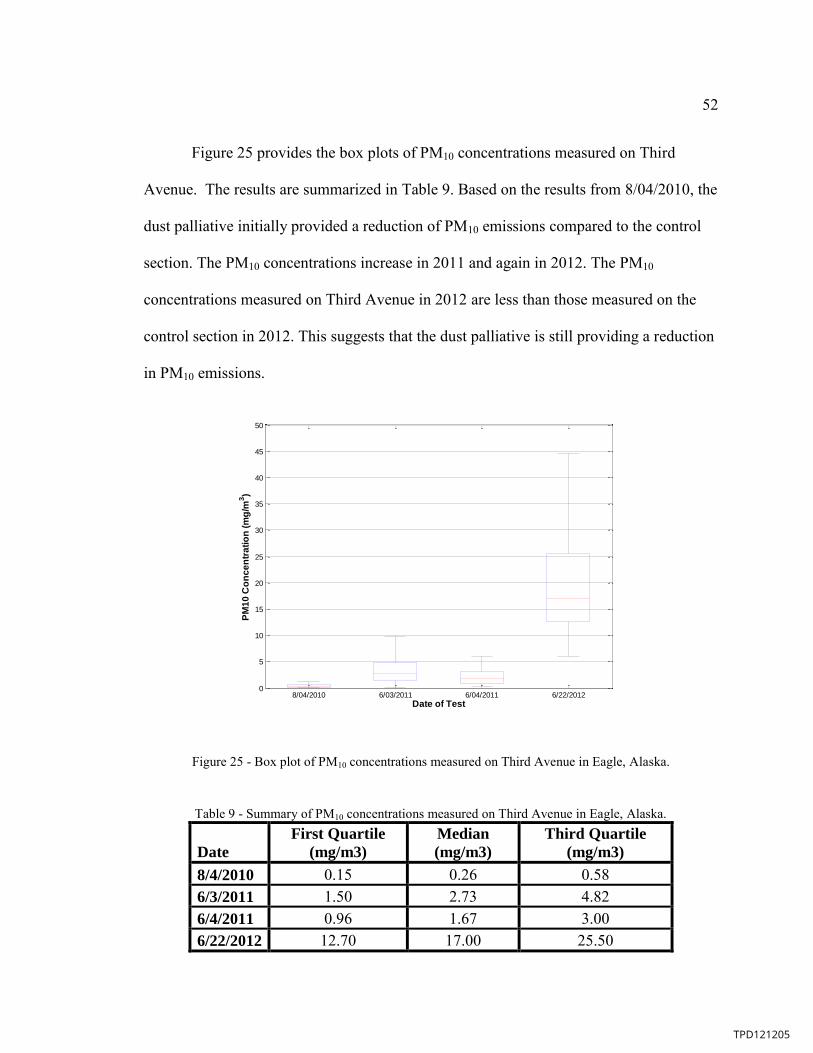
52
Figure 25 provides the box plots of PM10 concentrations measured on Third
Avenue. The results are summarized in Table 9. Based on the results from 8/04/2010, the
dust palliative initially provided a reduction of PM10 emissions compared to the control
section. The PM10 concentrations increase in 2011 and again in 2012. The PM10
concentrations measured on Third Avenue in 2012 are less than those measured on the
control section in 2012. This suggests that the dust palliative is still providing a reduction
in PM10 emissions.
Figure 25 - Box plot of PM10 concentrations measured on Third Avenue in Eagle, Alaska.
Table 9 - Summary of PM10 concentrations measured on Third Avenue in Eagle, Alaska.
Date
First Quartile
(mg/m3)
Median
(mg/m3)
Third Quartile
(mg/m3)
8/4/2010 0.15 0.26 0.58 6/3/2011 1.50 2.73 4.82 6/4/2011 0.96 1.67 3.00 6/22/2012 12.70 17.00 25.50
8/04/2010 6/03/2011 6/04/2011 6/22/20120
5
10
15
20
25
30
35
40
45
50
Date of Test
PM
10
Co
nc
en
tra
tio
n (
mg
/m3)
TPD121205

53
From the results of the UAF-DUSTM tests conducted in 2012 it appears that the
dust palliative application is still providing a reduction in PM10 emissions compared to
the untreated control section. The first and third quartile PM10 concentrations are similar
for each dust palliative treated sections. This suggests that the dust palliative
effectiveness is decreasing uniformly regardless of the location of the test section within
Eagle and differences in traffic volume.
4.2 North Pole, Alaska
Several gravel roads in North Pole, Alaska, were treated with dust palliatives
between 7/28/2010 and 8/03/2010. The roads, located in the Moose Meadows road
service area of the Fairbanks North Star Borough, included: Sharon Road, Moosewalk
Road, Plack Road, Blackstone Road, and Plato Avenue. The roads were not prepped
before application besides the annual grading and repairs completed at the beginning of
summer. This was done to mimic the conditions found in rural villages in Alaska, where
heavy equipment is not often available. It was immediately clear that the dust palliative
application on Blackstone Road was a failure. Plato Way was regraded after application
due to a miscommunication with the road service area manager, destroying the dust
palliative application. Table 10 summarizes the dust palliative applications for the
remaining roads.
TerraLock, from GeoCHEM, Inc. was applied to Sharon Road using
a ten foot spray bar with nozzles spaced every foot. Freedom-Binder 400,
manufactured by Freedom Industries Inc. was applied using a 6,000 gallon water truck.
Dustaway®, another product GeoCHEM, Inc. was also applied using
the 6,000
TPD121205

54
gallon water truck. Dawson Road was selected as the untreated control section used for
determining dust palliative performance. The first UAF-DUSTM tests were conducted on
8/12/2010. The last UAF-DUSTM tests were conducted on 6/01/2011.
Table 10 - Summary of the dust palliatives application for the test site in North Pole, Alaska.
Test Site Product Treated
Length (feet)
Application
Rate (ft2/gal)
Application
Date
Sharon TerraLock 2475 30 7/28/10 Moosewalk Freedom-Binder 400 1980 7.2 8/2/10 Plack Dustaway 2165 9 8/3/2010
Figure 26 provides the boxplots of PM10 concentration measured from the
untreated control section on Dawson Road. The results are summarized in Table 11. The
largest PM10 concentrations were measured on 8/17/2010. There was a significant
decrease in PM10 concentrations between 8/17/2010 and 9/12/2010. This decrease is
likely due to precipitation. Between 8/17 and 9/12/2010 a total of 1.53 inches of rain
were measured at the National Oceanic and Atmospheric Administration (NOAA)
weather station located in North Pole. There was no rain between 9/12/2010 and the test
on 9/20/10 (NCDC, 2012). The observed increase in PM10 concentrations is likely due to
the evaporation of soil-water added by the rain event
On 9/12, 9/13/ and 9/17/2012, UAF-DUSTM tests were conducted during the
morning and afternoon. The difference in PM10 concentrations between the morning and
afternoon tests on these dates are likely caused by the drying of moisture from the gravel
surface throughout the day. This trend is also seen on the dust palliative treated sections.
The PM10 concentrations measured on 6/01/2011 were similar to those measured on 8/12
and 8/17/2010. These three dates represent the worst potential for PM10 emissions. The
TPD121205

55
effectiveness and longevity of the dust palliative applications may be inferred by
comparing to these dates.
Figure 26 - Box plot of PM10 concentrations measured on Dawson Road in North Pole, Alaska.
1 2 3 4 5 6 7 8 9 10 110
5
10
15
20
25
30
35
40
45
50
55
60
65
70
75
Date of Test
PM
10
Co
nc
en
tra
tio
n (
mg
/m3)
1 = 8/12/2010
2 = 8/17/2010
3 = 9/12/2010
4 = 9/12/2010 (2)
5 = 9/13/2010
6 = 9/13/2010 (2)
7 = 9/17/2010
8 = 9/17/2010 (2)
9 = 9/19/2010
10 = 9/20/2010
11 = 6/01/2011
TPD121205
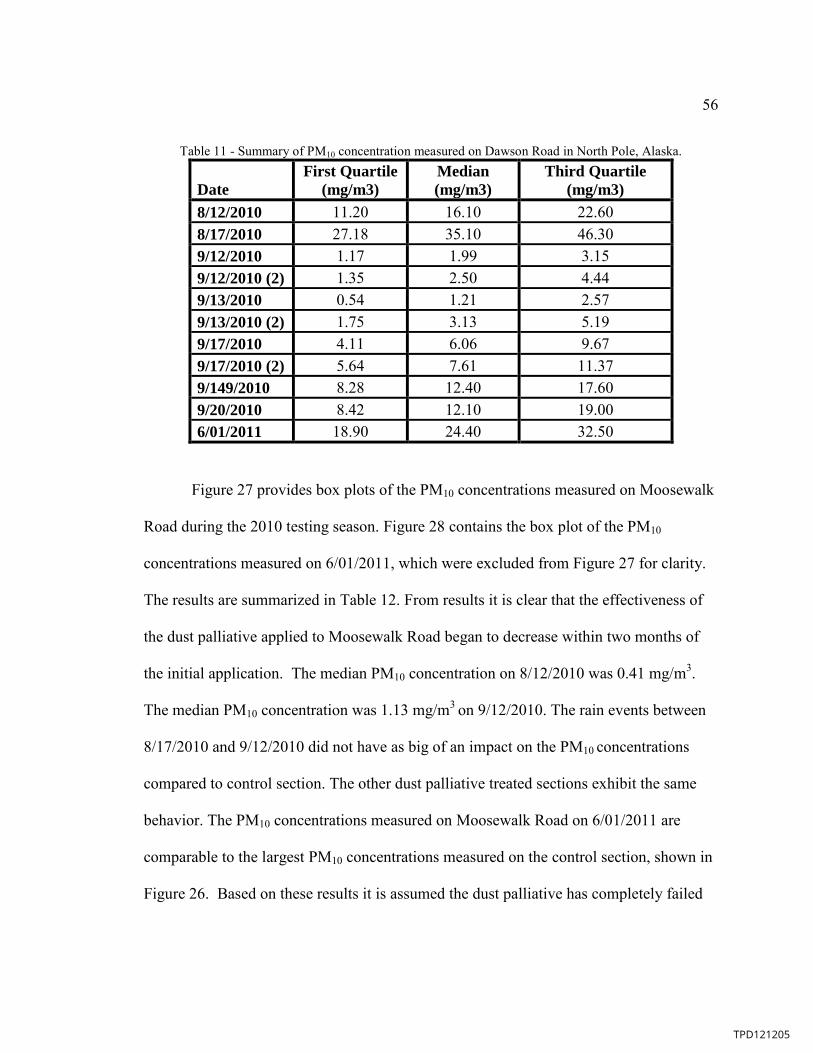
56
Table 11 - Summary of PM10 concentration measured on Dawson Road in North Pole, Alaska.
Date
First Quartile
(mg/m3)
Median
(mg/m3)
Third Quartile
(mg/m3)
8/12/2010 11.20 16.10 22.60 8/17/2010 27.18 35.10 46.30 9/12/2010 1.17 1.99 3.15 9/12/2010 (2) 1.35 2.50 4.44 9/13/2010 0.54 1.21 2.57 9/13/2010 (2) 1.75 3.13 5.19 9/17/2010 4.11 6.06 9.67 9/17/2010 (2) 5.64 7.61 11.37 9/149/2010 8.28 12.40 17.60 9/20/2010 8.42 12.10 19.00 6/01/2011 18.90 24.40 32.50
Figure 27 provides box plots of the PM10 concentrations measured on Moosewalk
Road during the 2010 testing season. Figure 28 contains the box plot of the PM10
concentrations measured on 6/01/2011, which were excluded from Figure 27 for clarity.
The results are summarized in Table 12. From results it is clear that the effectiveness of
the dust palliative applied to Moosewalk Road began to decrease within two months of
the initial application. The median PM10 concentration on 8/12/2010 was 0.41 mg/m3.
The median PM10 concentration was 1.13 mg/m3 on 9/12/2010. The rain events between
8/17/2010 and 9/12/2010 did not have as big of an impact on the PM10 concentrations
compared to control section. The other dust palliative treated sections exhibit the same
behavior. The PM10 concentrations measured on Moosewalk Road on 6/01/2011 are
comparable to the largest PM10 concentrations measured on the control section, shown in
Figure 26. Based on these results it is assumed the dust palliative has completely failed
TPD121205

57
and is no longer providing a reduction in PM10 emissions. The longevity of the dust
palliative is less than one year.
Figure 27 - Box plot of PM10 concentrations measured during 2010 on Moosewalk Road in North Pole, Alaska.
8/12/2010 8/17/2010 9/12/2010 9/12/2010 (2) 9/17/2010 9/17/2010 (2)0
1
2
3
4
5
6
7
8
9
10
Date of Test
PM
10
Co
nc
en
tra
tio
n (
mg
/m3)
TPD121205

58
Figure 28 - Box plot of PM10 concentrations measured during 2010 and 2011 on Moosewalk Road in North Pole, Alaska.
Table 12 - Summary of PM10 concentrations measured on Moosewalk Road in North Pole, Alaska.
Date
First Quartile
(mg/m3)
Median
(mg/m3)
Third Quartile
(mg/m3)
8/12/2010 0.29 0.41 0.59 8/17/2010 0.87 1.35 2.03 9/12/2010 0.62 1.13 1.84 9/12/2010 (2) 0.73 1.14 2.08 9/17/2010 1.29 2.09 3.57 9/17/2010 (2) 1.78 2.95 5.05 6/01/2011 22.85 29.95 39.15
Figure 29 contains the boxplots of PM10 concentrations measured on Sharon Road
between 8/12/2010 and 6/01/2011. The results are summarized in Table 13. There is a
significant difference between the PM10 concentrations measured on Sharon Road and the
PM10 concentrations measured on the control section. The dust palliative applied to
8/12/2010 8/17/2010 9/12/2010 9/12/2010 (2) 9/17/2010 9/17/2010 (2) 6/01/20110
5
10
15
20
25
30
35
40
45
50
55
60
65
70
Date of Test
PM
10
Co
nc
en
tra
tio
n (
mg
/m3)
TPD121205

59
Sharon Road was very effective in reducing PM10 emissions. While there was an
increase in PM10 concentrations after the winter months, the PM10 concentrations are still
significantly less than those measured on the untreated control section. This confirms that
the dust palliative’s longevity is at least one year. However, while the dust palliative
continued to perform well, the surface conditions of the road declined. The road had to be
regraded to provide a better driving surface, preventing measurements beyond the first
year. This illustrates the importance of proper road design and construction when
developing dust management strategies. In order to be cost effective the dust palliative
has to provide dust control for several years. If the road fails the dust palliative’s full
potential in terms of longevity cannot be reached.
Figure 29 - Box plot of PM10 concentrations measured on Sharon Road in North Pole, Alaska.
8/12/2010 9/12/2010 9/13/2010 9/13/2010 (2) 9/20/2010 6/01/20110
0.05
0.1
0.15
0.2
0.25
0.3
0.35
0.4
0.45
0.5
Date of Test
PM
10
Co
nc
en
tra
tio
n (
mg
/m3)
TPD121205

60
Table 13 - Summary of PM10 concentrations measured on Sharon Road in North Pole, Alaska.
Date
First Quartile
(mg/m3)
Median
(mg/m3)
Third Quartile
(mg/m3)
8/12/2010 0.024 0.029 0.037 9/12/2010 0.034 0.049 0.068 9/13/2010 0.024 0.035 0.053 9/13/2010 (2) 0.028 0.044 0.071 9/20/2010 0.029 0.042 0.072 6/01/2011 0.123 0.169 0.253
Figure 30 provides the box plots of PM10 concentrations measured on Plack Road.
The results are summarized in Table 14. Based on the figure it is clear that the dust
palliatives effectiveness began to decrease within two months of the initial application.
The PM10 concentrations measured on 6/01/2011 are comparable to the largest PM10
concentrations measured on the control section. Based on these results it is assumed the
dust palliative has completely failed and is no longer providing a reduction in PM10
emissions. The longevity of the dust palliative is less than one year.
TPD121205
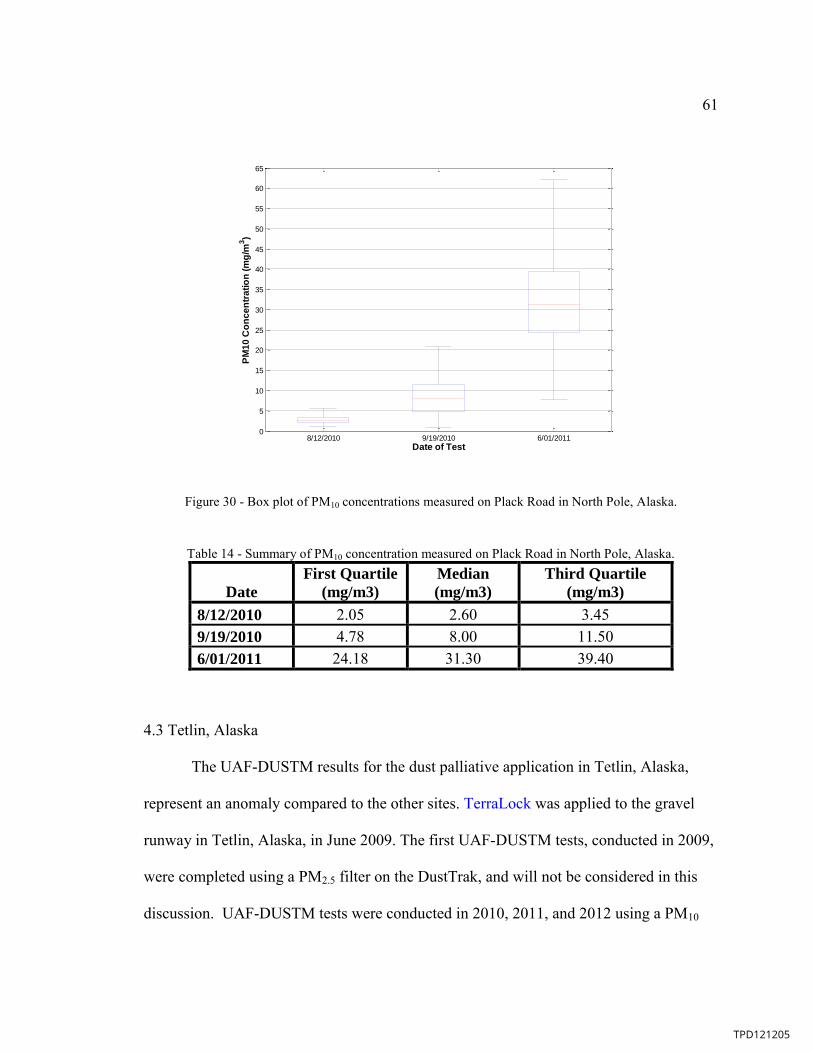
61
Figure 30 - Box plot of PM10 concentrations measured on Plack Road in North Pole, Alaska.
Table 14 - Summary of PM10 concentration measured on Plack Road in North Pole, Alaska.
Date
First Quartile
(mg/m3)
Median
(mg/m3)
Third Quartile
(mg/m3)
8/12/2010 2.05 2.60 3.45 9/19/2010 4.78 8.00 11.50 6/01/2011 24.18 31.30 39.40
4.3 Tetlin, Alaska
The UAF-DUSTM results for the dust palliative application in Tetlin, Alaska,
represent an anomaly compared to the other sites. TerraLock was applied to the gravel
runway in Tetlin, Alaska, in June 2009. The first UAF-DUSTM tests, conducted in 2009,
were completed using a PM2.5 filter on the DustTrak, and will not be considered in this
discussion. UAF-DUSTM tests were conducted in 2010, 2011, and 2012 using a PM10
8/12/2010 9/19/2010 6/01/20110
5
10
15
20
25
30
35
40
45
50
55
60
65
Date of Test
PM
10
Co
nc
en
tra
tio
n (
mg
/m3)
TPD121205

62
filter on the DustTrak. The runway thresholds were used as the beginning and end of each
test for the treated and untreated sections. The control section is located on the shoulder
of the runway, outside of the runway lights.
Figure 31 provides the box plots of PM10 concentrations measured on the control
section used in Tetlin. The results are summarized in Table 15. The PM10 concentrations
vary significantly between tests. Figure 32 provides the box plot of PM10 concentrations
measured on the dust palliative treated section in Tetlin. The results are summarized in
The PM10 concentrations measured on the dust palliative treated section are less than
those measured on the control section. Again, the PM10 concentrations vary significantly
between tests. The PM10 concentrations do not follow the trend of increasing PM10
concentrations observed at other sites. However, the PM10 concentrations measured on
the untreated and treated sections do follow a similar trend. This suggests that the
measurements were consistently influenced by some environmental parameter.
Figure 33, Figure 34, and Figure 35 are wind roses of the data recorded during
UAF-DUSTM tests on 8/10/2010, 6/05/2011 and 6/21/2012 respectively. Weather data
for 8/11/2010 is not available. For each day of testing the wind was predominately from
the West. This represents a headwind when the UAF-DUSTM tests were travelling west
bound and a tail wind when the UAF-DUSTM tests were travelling east bound. The
magnitudes of the wind speeds are similar for each day. Based on these results it is
assumed that the difference between the PM10 concentrations for each test is not due to
the influence of wind.
TPD121205

63
Figure 31 - Box plot of PM10 concentrations measured on the untreated control section of the runway in Tetlin, Alaska.
Table 15- Summary of PM10 concentration measured on the untreated control section of the runway in Tetlin, Alaska.
Date
First Quartile
(mg/m3)
Median
(mg/m3)
Third Quartile
(mg/m3)
8/10/2010 2.44 3.64 5.46 9/11/2010 4.81 8.02 13.05 6/05/2011 4.64 6.76 9.70 6/21/2012 0.18 0.26 0.42
8/10/2010 8/11/2010 6/05/2011 6/21/20120
5
10
15
20
25
30
Date of Test
PM
10
Co
nc
en
tra
tio
n (
mg
/m3)
TPD121205

64
Figure 32 - Box plot of PM10 concentrations measured on the dust palliative treated section of the runway in Tetlin, Alaska.
Table 16 - Summary of PM10 concentration measured on the dust palliative treated section of the runway in Tetlin, Alaska.
Date
First Quartile
(mg/m3)
Median
(mg/m3)
Third Quartile
(mg/m3)
8/10/2010 0.093 0.153 0.242 9/11/2010 0.185 0.397 1.04 6/05/2011 0.190 0.263 0.419 6/21/2012 0.107 0.158 0.274
8/10/2010 8/11/2010 6/05/2011 6/21/20120
0.5
1
1.5
2
2.5
Date of Test
PM
10
Co
nc
en
tra
tio
n (
mg
/m3)
TPD121205

65
Figure 33 - Wind data in miles per hour recorded during UAF-DUSTM testing on the runway located in Tetlin, Alaska, on 8/10/2010. The box overlaid plot represents the orientation of the runway relative to the
wind data.
Figure 34 - Wind data in miles per hour recorded during UAF-DUSTM testing on the runway located in Tetlin, Alaska, on 6/05/2011. The box overlaid plot represents the orientation of the runway relative to the
wind data.
15%
30%
45%
WEST EAST
SOUTH
NORTH
0 - 2
2 - 4
4 - 6
6 - 8
8 - 10
10 - 12
12 - 14
15%
30%
45%
WEST EAST
SOUTH
NORTH
0 - 2
2 - 4
4 - 6
6 - 8
8 - 10
10 - 12
12 - 14
30%
60%
90%
WEST EAST
SOUTH
NORTH
0 - 2
2 - 4
4 - 6
6 - 8
8 - 10
10 - 12
12 - 14
TPD121205

66
Figure 35 - Wind data in miles per hour recorded during UAF-DUSTM testing on the runway located in Tetlin, Alaska, on 6/22/2012. The box overlaid plot represents the orientation of the runway relative to the
wind data.
Table 17 contains the median PM10 concentrations and average relative humidity
measured during the UAF-DUSTM tests on the control section in Tetlin. The lowest
median PM10 concentration corresponds with the lowest relative humidity measurement.
This does not agree with the expected inverse relationship discussed previously. Based
on these results it is assumed that the difference between the PM10 concentrations for
each test is not due to the influence of relative humidity.
Table 17 - Median PM10 concentrations and relative humidity data recorded during UAF-DUSTM tests in Tetlin, Alaska.
20%
40%
60%
WEST EAST
SOUTH
NORTH
0 - 1
1 - 2
2 - 3
3 - 4
4 - 5
5 - 6
6 - 7
7 - 8
8 - 9
9 - 10
10 - 11
20%
40%
60%
WEST EAST
SOUTH
NORTH
0 - 1
1 - 2
2 - 3
3 - 4
4 - 5
5 - 6
6 - 7
7 - 8
8 - 9
9 - 10
10 - 11
TPD121205

67
Date
Median
Concentration
(mg/m3)
Average
Relative
Humidity (%)
8/10/2010 3.64 51.0 6/05/2011 6.76 43.8 6/12/2012 0.258 37.9
The difference in PM10 concentrations may be due to the moisture content of the
gravel surface during testing. Moisture content samples were not collected during testing.
Precipitation data recorded prior to testing may be used to infer soil moisture content, but
there are no weather stations within a 100 mile radius of Tetlin with precipitation data
during this period. The construction and soil characteristics of the runway may also have
affected measurements. Tetlin is a relatively new runway compared to the other sites
investigated during this study. It is a road accessible site which means it can be properly
maintained by skilled operators using ideal construction equipment. There is little
airplane traffic in Tetlin due to its road accessibility, which reduces the wear on the dust
palliative application. The soils in the area typically have higher clay contents then other
parts of the state. High clay contents will reduced PM10 emissions and may affect how the
dust palliatives behave chemically in the soil Additional testing and investigation is
required in Tetlin before the effectiveness and longevity of the dust palliative can be
evaluated.
TPD121205

68
5. Conclusions
During the development of the UAF-DUSTM several limitations were identified.
Currently the UAF-DUSTM cannot be used to determine dust palliative effectiveness in
terms of an absolute reduction in PM10 emissions. Instead a holistic approach must be
used to analyze the PM10 concentrations measured on a dust palliative treated section to
infer dust palliative effectiveness and longevity. While this may limit the use of the UAF-
DUSTM it remains a useful tool in developing dust management strategies. It can be used
to monitor dust palliative applications as they age, helping engineers and road managers
develop an understanding of how specific palliatives behave in their area.
The results of this research have shown that dust palliatives can successfully be
used to manage fugitive dust emissions from gravel surfaces. However, there are several
factors which may cause dust palliative to fail prematurely. During the course of this
study several dust palliative failures were observed that were likely caused by an
improper application. The success of a dust palliative application depends on several
factors including: the environmental conditions during application; the gradation,
moisture content, and level of compaction of the soil during application; and the
equipment used to apply the dust palliative.
Environmental conditions such as freezing temperatures and precipitation events
during application will negatively impact the dust palliative and should be avoided. This
makes it difficult to schedule dust palliative applications in Alaska. Often the dust
palliative application is the last work item to be completed in a contract and occurs
during the early to late fall. This time of year is typically characterized by low
TPD121205
69
temperatures and rain or snow. Scheduling dust palliative applications for the following
summer after construction is completed will ensure that the dust palliative can be applied
during optimal conditions.
The soil characteristics during application also influence the success of the dust
palliative application. Some dust palliatives require that the soil be moist so the dust
palliative can break the surface tension and penetrate further into the surface. Others
require the soil to be as dry as possible so the dust palliative can spread across the soil
particle surface. Dust palliatives should not be applied unless the soil is at the proper
moisture content. If the surface is too compact the dust palliative will not be able to
penetrate into the soil matrix and coat particles. Developing laboratory based tests will
ensure that the proper dust palliative is selected and the application occurs when soils are
at the optimal condition.
There are several different techniques and types of equipment available for
applying dust palliatives. The equipment should provide as much control over the
application as possible. A distribution system consisting of a spray bar with evenly
spaced nozzles is ideal, as it provide a uniform application across the surface. If a
controlled distribution system is not available field tests using water should be conducted
first . Factors such as the number of passes required, the number of gallons for each pass,
and the time between each pass should be determined before the dust palliative
application begins.
Dust palliatives will continue to be used to control fugitive dust emissions.
Further investigation into how these dust palliatives behave in the soil matrix is required
TPD121205

70
to develop a better understanding of how they reduce fugitive dust emissions.
Understanding these fundamentals will aid engineers in selecting the proper dust
palliative. A standard testing method for determining dust palliative effectiveness, both
field based and laboratory based, is essential to ensure successful applications are
achieved.
TPD121205

71
References
Alaska Department of Transportation and Public Facilities (2010a). 2010 Certified Public Road Miles (CPRM) Report. Retrieved from http://www.dot.alaska.gov/stwdplng/transdata/public-road-data.shtml Alaska Department of Transportation and Public Facilities (2010b). Alaska Functional Classification Update: Final Report. Retrieved from http://www.dot.alaska.gov/stwdplng/fclass/mapsdocs.shtml Bear, J. (1972). Dynamics of Fluids in Porous Media. New York, NY: American Elsevier Publishing Company, Inc. Bolander, P. & Yamada, A. (1999) Dust Palliative Selection and Application Guide. United States Department of Agriculture. Center for Environmental Research Information (1999a). Sampling of Ambient Air For Total Suspended Particulate Matter (SPM) and PM10 Using High Volume (HV) Sampler. United States Environmental Protection Agency. Center for Environmental Research Information (1999b). Continuous Measurement of PM10 Suspended Particulate Matter (SPM) in Ambient Air. United States Environmental Protection Agency. Conover, W.J. (1971). Practical Nonparametric Statistics. New York: John Wiley & Sons Inc. Countess Environmental (2006). WRAP Fugitive Dust Handbook. Western Regional Air Partnership. Cowherd, C., Axetell, K., Guenther, C., & Juetze, G. (1974). Development of Emission Factors for Fugitive Dust Sources. Midwest Research Institute. Edvardsson, K. & Magnusson, R. (2009). Monitoring of Dust Emission on Gravel Roads: Development of a Mobile Methodology and Examination of Horizontal Diffusion. Atmospheric Environment, 43(4), 889-896. Etyemezian, V., H. Kuhns, Gillies, J., Green, M., Pitchford, M., and Watson, J. (2003). Vehicle-based Road Dust Emission Measurement: I- methods and calibrations. Atmospheric Environment, 37(32), 4559-4571. Federation of Canadian Municipalities (FCM) (2005). Dust Control for Unpaved Roads. Canadian Public Works Association.
TPD121205

72
Foley, G., Cropley, S., & Giummarra, G. (1996). Road Dust Control Techniques. AARB Transport Research Ltd. Gillies, J.A., Watson, J., Rogers, C., Dubois, D., Chow, J., Langston, R., & Sweet, J. (1999). Long-Term Efficiencies of Dust Suppressants to Reduce PM10 Emissions from Unpaved Roads. Journal of the Air and Waste Management Association, 49(1), 3-16. Gillies, J.A. , Etyemezian, V., Kuhns, H., Nikolic, D., & Gillette, D.A., (2005). Effect of vehicle characteristics on unpaved road dust emissions. Atmospheric Environment, 39(13), 2341-2347. Hoaglin, D.C., Mosteller, F., & Tukey, J.W. (1983). Understanding Robust and ExploratoryData Analysis. New York, NY: John Wiley & Sons, Inc. Kuhns, H., Etyemezian, V., Landwehr, D., MacDougall, C., Pitchford, M., & Green M. (2001). Testing Re-entrained Aerosol Kinetic Emissions from Roads (TRAKER): A New Approach to Infer Silt Loading on Roadways. Atmospheric Environment, 35(17), 2815- 2825. Kumar, G. & Narayan Prabhu, K. (2007). Review of Non-Reactive and Reactive Wetting of Liquids on Surfaces. Advances in Colloid and Interface Science, 133(2), 61-89. Massey, Frank J (1951). The Kolmogorov-Smirnov Test for Goodness of Fit. Journal of the American Statistical Association, 46(253): 68-78. Mollinger, A., Nieuwstadt, F., & Scarlett, B. (1993). Model Experiments of the Resuspension Caused by Road Traffic. Aerosol Science and Technology, 19(3), 330-338. “National Ambient Air Quality Standards for Particulate Matter,” 71 Federal Register 61144- 61233 (October 2006) National Climatic Data Center (2012). Global Historical Climatology Network Daily – North Pole, Alaska. Retrieved from http://gis.ncdc.noaa.gov/map/cdo/ Nicholson, K., & Branson, J. (1990). Factors Affecting Resuspension by Road Traffic. The Science of the Total Environment, 93, 349-358. Polaris (2009). 2010 Sportsman 300 Owner’s Manual for Maintenance and Safety. Polaris Sales Inc.
TPD121205

73
Rushing, J., Moore, V., Tingle, J., Mason, Q., & McCaffrey, T. (2005). Dust Abatement Methods for Lines-Of-Communication and Base Camps in Temperate Climates. U.S. Army Engineer Research and Development Center. Sanders, T., Addo, J., Ariniello, A., and Heiden, W. (1997). Relative Effectiveness of Road Dust Suppressants. Journal of Transportation Engineering, 123(5), 393- 397. Succarieh, M. (1992). Control of Dust Emissions from Unpaved Roads. Institute of Northern Engineering Transportation Research Center. TSI, Inc. (2012). DustTrak II Aerosol Monitor Theory of Operation. Retrieved from http://www.tsi.com/uploadedFiles/_Site_Root/Products/Literature/Application_N otes/EXPMN-001_DustTrakII_Theory_of_Operation.pdf United States Environmental Protection Agency (2011). AP-42, Fifth Edition, Volume I, Chapter 13: Miscellaneous Sources. Retrieved from www.epa.gov/ttn/chief/ap42/ch13/index.html Watson, J., Rogers, C., Chow, J., Dubois, D., Gillies, G., Derby, J., & Moosmüller. H. (1996). Effectiveness Demonstration of Fugitive Dust Control Methods for Public Unpaved Roads and Unpaved Shoulders on Paved Road. Desert Research Institute. Watson, J., Chow, J., & Pace., T. (2000). Fugitive Dust Emissions. In W. Y. Davis (Ed.), Air Pollution Engineering Manual (pp. 117-135). New York, NY: John Wiley & Sons, Inc. Withycombe, E., & Dulla., R. (2006). Alaska Rural Dust Control Alternatives. Sierra Research Inc. Ziskind, G., Fichman, M., & Gutfinger, C. (1995). Resuspension of Particulates from Surfaces to Turbulent Flows – Review and Analysis. Journal of Aerosol Science, 26(4), 613-644.
TPD121205