evaluating feed components for … feed components for formulation of pre-starter diets for broiler...
TRANSCRIPT

EVALUATING FEED COMPONENTS FOR FORMULATION OF PRE-STARTER DIETS
FOR BROILER CHICKENS
by
ARTURO RICARDO GARCIA
(Under the direction of Nicholas M. Dale)
ABSTRACT
Broiler chicks during the first week posthatch possess limited digestive capabilities that
increase as they age. A series of experiments was conducted to evaluate the main components of
the feed in order to formulate pre-starter diets for broiler chicks. To evaluate the carbohydrate
fraction, some studies were conducted in which corn, sorghum or pearl millet-based diets were
fed to young broilers for the first 14 days posthatch. Pearl millet proved to be an excellent
ingredient for inclusion in pre-starter diets.
To evaluate the quality of protein sources, amino acid (AA) digestibility was determined
in grains and protein concentrates used in poultry feeding by two different methods (chick ileal
digestibility vs cecectomized rooster) and at two different ages (7 vs 21 days of age). Chicks at 7
d of age had the lowest AA digestibilities, whereas the greatest AA digestibility coefficients
were obtained from adult roosters.
Due to their limited digestive capabilities, young chicks might have different AA
requirements than adult birds. To address this, a series of studies was conducted to determine
whether the digestible lysine and sulfur AA requirements change from the first 7 to 21 days of

age. There was no indication of drastic changes in the digestible lysine and sulfur AA
requirements during this period.
Phosphorus (P) is a major nutrient in chicken diets, and inorganic phosphates are usually
added to the feed to fulfill the chick’s P requirement. First, foot ash was further refined as a
technique to quantify bone mineralization in chicks. Upon completion of these studies, foot ash
was used as a response to evaluate inorganic phosphates for their inclusion in pre-starter diets.
Defluorinated tricalcium phosphate (DFP) and dicalcium phosphate (DCP) are widely used as
inorganic P sources for broiler diets. However, P bioavailability of DFP is known to be lower
than that of DCP. To evaluate if such difference in bioavailability would be exaggerated during
the first week posthatch, two studies were conducted. The bioavailability of DTP was not
dramatically reduced during the first 7 days of age, thus indicating that DFP is a satisfactory P
source for pre-starter diets.
INDEX WORDS: Broilers, pre-starter diets, cereal grains, protein sources, foot ash, feed phosphates.

EVALUATING FEED COMPONENTS FOR FORMULATION OF PRE-STARTER DIETS
FOR BROILER CHICKENS
by
ARTURO RICARDO GARCIA
D. V. M., Universidad Nacional Autónoma de México, México, 2000
M. S., Universidad Nacional Autónoma de México, México, 2002
A Dissertation Submitted to the Graduate Faculty of The University of Georgia in Partial
Fulfillment of the Requirements for the Degree
DOCTOR OF PHILOSOPHY
ATHENS, GEORGIA
2006

© 2006
Arturo Ricardo Garcia
All Rights Reserved
EVALUATING FEED COMPONENTS FOR FORMULATION OF PRE-STARTER DIETS
FOR BROILER CHICKENS
by
Arturo Ricardo Garcia
Major Professor: Nicholas M. Dale
Committee: Amy B. Batal Adam J. Davis Michael Azain Pedro Villegas Electronic Version Approved: Maureen Grasso Dean of the Graduate School The University of Georgia May 2006

iv
DEDICATION En esta sección quisiera reconocer el trabajo intenso de mucha gente de la que he tenido
la fortuna de estar rodeado y que ha contribuido considerablemente en diferentes aspectos para
su culminación. Mis padres, definitivamente, a quienes nunca terminaré de agradecerles todas
sus enseñanzas, las oportunidades que me dieron, los sacrificios que hicieron por mi, y la
educación que me permitieron llegar a alcanzar.
Papilu, tu sabes el gran trabajo que has hecho en todos estos años, y que gran parte de
este pequeño logro se debe a tu apoyo y comprensión en todos los aspectos. Gracias por ser mi
compañera, por ayudarme a afrontar las situaciones adversas, y por compartir conmigo lo bueno
y malo de la vida.
Mis hijos, Arturo y Andrea, por darle un nuevo significado a mi vida. Ustedes me han
enseñado que la vida ofrece muchas mas satisfacciones que no se obtienen en la universidad o el
campo laboral.
Finalmente, quiero agradecer a todas aquellas personas, familiares y amigos, que siempre
confiaron en mí. Espero no haberlos defraudado.

v
ACKNOWLEDGEMENTS
To Dr. Nick Dale, I truly appreciate all your support during our stay in Athens. For
facilitating and understanding our lives as international students, for all your patience and
guidance in all kinds of matters, I cannot thank you enough.
To Dr. Amy Batal, thank you for making my learning experience worthwhile, for your
encouragement to become a better individual, for your patience and for giving me the
opportunity to work in your team.
To Dr. Adam Davis, thank you for dedicating your time to introduce me to a different
area of knowledge and for the opportunity to complement my research.
To Dr. Michael Azain, thank you for allowing me to work in your laboratory, it made a
great contribution to my research.
To Dr. Pedro Villegas, thank you for your advice, your time and your comments.
To Dr. Mike Lacy and all the faculty and staff members of the Poultry Science
Department, I thank everybody for allowing me to be a graduate student at this institution and
facilitating the completion of my studies.
To Brett Lumpkins, for helping me balance the academic and social aspects of graduate
school, for your friendship, understanding, help and support.
To David Perry and all the farm crew, all your work makes an invaluable contribution to
making everything easier for graduate students.
To all friends, neighbors, fellow graduate students and all people who made this
experience so enjoyable.

vi
TABLE OF CONTENTS
Page
AKNOWLEDGMENTS…………………………………………………………………………..v
INTRODUCTION………………………………………………………………………………...1
CHAPTER
1. LITERATURE REVIEW………………………………………………………………2
Development of the gastrointestinal tract .......……………………………………2
Formulation of pre-starter diets ..…………………………………………………6
Feed ingredients for pre-starter diets .......………………………………………...8
References……………………………………………………………. …………35
2. EVALUATION OF PEARL MILLET FOR PRE-STARTER AND STARTER
BROILER DIETS………………………………………………………………………..52
Summary…………………………………………………………………………53
Description of problem…………………………………………………………..54
Materials and Methods…………………………………………………………...55
Results……………………………………………………………………………58
Discussion………………………………………………………………………..60
Conclusions and applications…………………………………………………….62
References and notes....…………………………………………………………..63
3. CHANGES IN THE DIGESTIBLE LYSINE AND SULFUR AA NEEDS OF
BROILER CHICKS DURING THE FIRST THREE WEEKS POSTHATCHING.........76

vii
Abstract..................................................................................................................77
Introduction…………..……………………………………………………….....78
Materials and Methods……………………………………………………...…...80
Results and discussion…………………………………………………………...82
References…………..…………………………………………………………....85
4. A COMPARISON OF METHODS TO DETERMINE AMINO ACID
DIGESTIBILITY OF FEED INGREDIENTS FOR CHICKENS…….............................94
Summary…………………………………………………………………………95
Description of problem…………………………………………………………..96
Materials and Methods…………………………………………………………...98
Results and discussion………………................................…………………….100
Conclusions and applications…………………………………………..……....104
References and notes....………………………………………………..…….....105
5. FOOT ASH AS A MEANS OF QUANTIFYING BONE MINERALIZATION IN
CHICKS.......................................................................................................................... 117
Summary.............................................................................................................118
Description of problem.......................................................................................119
Materials and methods........................................................................................121
Results and discussion........................................................................................123
Conclusions and applications..............................................................................125
References and notes...........................................................................................126
6. BIOLOGICAL AVAILABILITY OF PHOSPHORUS SOURCES IN PRE-STARTER
AND STARTER DIETS FOR BROILER CHICKS.......................................................135

viii
Summary..............................................................................................................136
Description of problem........................................................................................137
Materials and methods.........................................................................................138
Results and discussion.........................................................................................140
Conclusions and applications..............................................................................143
References and notes...........................................................................................144
7. GENERAL CONCLUSIONS.....................................................................................155
APPENDICES................................................................................................................158
I. EFFECT OF DIETARY PROTEIN CONCENTRATION ON THE mRNA
EXPRESSION OF CHICKEN SREBP-1 ...........................................................158
II. FEEDING OF UNGROUND PEARL MILLET TO LAYING HENS .........160

1
INTRODUCTION
Progress in genetics and management has allowed the poultry industry to produce heavier
chickens in a more efficient manner. Consequently, the age to market in broiler chickens has
been gradually reduced. On the other hand, research work conducted during the past decade in
the area of the chick’s early development has shown that during the first week posthatch, the
digestive system is not fully developed. Because the first week posthatch currently represents a
more critical part of the broiler’s productive life, and the chick’s digestive capabilities are limited
at this age, special attention is being given to the nutritional needs of the chicken during this
period in order to maximize performance. One strategy to address this is the use of pre-starter
diets, with the goal of providing highly digestible ingredients that the young chick will be able to
utilize more efficiently. To date, in the US poultry industry, little research has been conducted to
evaluate new alternatives for feeding young chicks that are still applicable from a practical point
of view. Carbohydrates provided by cereal grains and protein supplements are the two main
components of broiler feed. Additionally, phosphorus is one of the most important nutrients for
animals, and feeds are generally supplemented with inorganic phosphates to meet the animal’s
needs. Thus, inorganic phosphates become a critical component of the feed. Evaluation of feed
ingredients that provide the most critical components of the feed is crucial to determine if any
one particular ingredient should be included in a pre-starter diet. Therefore, the purpose of the
present research is to evaluate such components of the feed to yield information that will
facilitate the formulation of pre-starter diets for broiler chickens.

2
CHAPTER 1. LITERATURE REVIEW
DEVELOPMENT OF THE GASTROINTESTINAL TRACT
Absorption of the yolk sac
Immediately after hatch, the gastrointestinal tract of the chick undergoes a process of
development and maturation that has been extensively studied. Toward the end of incubation,
residual yolk is internalized into the abdominal cavity. At hatch, the weight of a broiler chick
averages 45 g, and the yolk comprises 20 to 25 % of body weight (Noy et al., 2001). The yolk is
composed of approximately 35 to 40% lipids, mainly acylglycerides (Noy and Sklan, 2001), and
is considered a temporary energy source until the chick has access to feed. Two routes have been
described in yolk sac absorption. Transfer to the blood stream has been observed to occur up to
72 hours post-hatch, whereas intestinal absorption has been recorded up to 120 hours posthatch
(Noy and Sklan, 1998a). Transfer of nutrients from the yolk to the bloodstream occurs mainly
during embryonic development (Lambson, 1970). During the first four days posthatch, the
proportion of the yolk sac that is absorbed by each route is affected by the presence of feed.
Although the yolk is absorbed regardless of feed intake (Murakami et al., 1992), the presence of
feed favors absorption via the intestinal route (Noy and Sklan, 2001).
Physical development of the digestive tract
During the first week posthatch, the growth and development of the gastrointestinal tract
occurs at a very fast rate (Jin et al., 1998). Dror et al. (1977) reported that at three days posthatch,
the relative weight of the small intestine increased significantly, the duodenum being the
segment with the greatest relative increase. The relative weight of the intestines increases

3
gradually posthatch, reaching a maximum at 3 to 7 d (Murakami, et al., 1992). Relative weights
of proventriculus, small intestine, liver, and pancreas were found to increase more rapidly during
the first 9 days posthatch than body weight (Nitsan et al., 1991) particularly in meat-type birds.
Intestinal absorptive surface increases with age as well. Villus area, crypt depth, and enterocyte
migration increases linearly during the first seven days of age in conventional and germ-free
chicks (Cook et al., 1973). Villus height and perimeters in the duodenum, jejunum and ileum
increased from 25 to 100% between 4 and 10 days of age (Uni et al., 1995). The number of
crypts also increases rapidly in the same period of time, and reaches a plateau from 48 to 72
hours posthatch (Geyra et al., 2001).
Digestive enzymes
Hydrolysis of complex molecules in the small intestine is mainly accomplished by the
action of pancreatic enzymes. The most important group of pancreatic digestive enzymes from
the nutritional standpoint is constituted by amylase, lipase, and trypsin, which are responsible for
digestion of starch, triglycerides, and polypeptides, respectively. Their presence has been
detected in several stages of the chick embryonic development (Jin et al., 1998). Ikeno and Ikeno
(1991) reported amylase activity as early as 6 days of incubation. Acid protease activity in the
proventriculus has also been detected in chick embryos a few days before hatch with decreased
activity towards the end of incubation (Tarvid, 1995). A gradual increase in amylase activity
from day 17 of incubation to day 2 posthatch was reported by Marchaim and Kulka (1967).
Nitsan et al. (1991) reported a decrease in amylase activity from hatching to day 5 posthatch,
with an increase thereafter and a plateau at day 8 posthatch. Noy and Sklan (1995) reported a
gradual increase in pancreatic amylase, lipase and trypsin from 4 to 21 d posthatch. Sell et al.
(1991) reported a large increase in lipase activity in turkey poults between hatching and one day

4
of age, with insignificant further increase. In the work of Nitsan et al. (1991) the specific activity
of lipase in chicks decreased during the first six days posthatch, and steadily increased thereafter
up to 21 days of age. In egg-type birds, Uni et al. (1995) reported low concentrations of lipase at
day 4, with a peak in secretion at day 7 and decrease from day 10 to 14 posthatch. Specific
activity of trypsin decreased during the first 3 to 6 days posthatch, and increased towards day 14
posthatch (Nitsan et al, 1991). A similar pattern was reported for chymotrypsin activity by the
same authors.
Brush border enzymes complete the digestion of small molecules derived from the initial
breakdown of larger molecules. These enzymes are produced in the enterocyte, and located
inside the cell or in its outer membrane. Activity of such enzymes has been detected as early as
15 days of incubation in the chicken embryo. Disaccharidase activity was found to increase two
to four-fold at 2 days posthatch (Uni, 1999). Activity of gamma-glutamil transferase, which is an
enzyme involved in transamination, was shown to increase from zero to five days posthatch in
the jejunal mucosa of chickens (Uni, 1999). Tarvid (1995) reported that dipeptidase activity
decreased rapidly immediately after hatching in chicks when glycine-leucine and glycine-valine
were used as substrates. Sklan et al. (2003) detected expression of mRNA for sucrase-isomaltase
at 15 d of incubation, and for Na-glucose transporter (SGLT-1) at day 19. Both enzymes peaked
at 2 days posthatch.
Intestinal nutrient transport
Assimilation of nutrients is essential for growth. Thus, intestinal nutrient transporters
play a very important role in nutrient utilization, and in a similar manner, activity of enterocyte
nutrient transporters has been reported to be age-dependent. In a fast-growing chicken strain, the
activity of intestinal nutrient transporters, determined as uptake of glucose, fructose and proline
5
and expressed over the whole intestinal length, was generally greater during the first two weeks
of age (Obst and Diamond, 1992). In chicken embryos, mRNA expression of the Na+-K+ ATPase
and the sodium-glucose transporter SGLT-1 were detected upon the 15th day of incubation, with
a dramatic increase at day 19, and a further decrease at hatch (Uni et al., 2003). In vitro uptake of
L-threonine increased as total nutrient intake increased from 1 to 5 weeks of age in ducks (King
et al., 2000).
Role of early feeding
Several studies have shown the effect of delay in feed access to the baby chick. Providing
solid or semi-solid feed to the baby chick enhances growth as early as 4 days of age (Noy and
Sklan, 1998b). The physical presence of feed stimulates intestinal motility and favors yolk sac
absorption via intestinal route (Noy and Sklan, 1998a). After 4d posthatch, lymphoid cells
migrate to the vitelline diverticulum and occlude the yolk stalk. Thus, no further absorption of
yolk sac contents can occur. Access to nutrients initiates body and organ growth within 24 hours
after intake, and results in faster intestinal development (Noy and Sklan, 2001). Access to feed
has also been shown to affect intestinal morphometric measurements. The number of cells per
crypt increases at a fast rate within 48 hours posthatch in a chicken with early access to feed
(Sklan, 2001). Crypt depth and villus height are reduced when chicks have delayed access to
feed for 36 hours (Uni, 1999). Feed-deprivation early in the chick’s life also has deleterious
effects in the structure of the microvilli (Noy and Sklan, 1998; 1999). Early nutrient deprivation
has been shown to decrease skeletal muscle growth that is reflected in lower live weight than that
in birds with early access to feed (Veira and Moran, 1999). Feeding a hydrated nutritional
supplement (Oasis™) a few hours after hatch resulted in heavier bursa of Fabricius, earlier
appearance of biliary IgA, and improved resistance to coccidia challenge (Dibner et al., 1998).

6
Birds held for 72 hours in the hatchery trays showed reduced activity of lymphocytes in the gut
associated lymphoid tissue during the first two weeks of life. Additionally, those birds presented
delayed colonization of the bursa of Fabricius (Bar Shira et al., 2005). Feeding a regular diet to
chicks immediately after hatching was reflected by greater weight gains and breast meat yields at
market age (Noy and Sklan, 1999). Overall effects of early feeding include increased livability,
optimization of immune function, improvement in growth performance, and greater carcass
yields at the processing plant. Uni and Ferket (2004) have taken the applications of early feeding
to a further level by proposing the use of in ovo feeding. Injection of a liquid nutritive
supplement into the embryonic amnion at 18 days of incubation has shown enhanced benefits
with respect to those observed by allowing feed access to the baby chick immediately after
hatching. Optimization of this technology, however, is still subject of investigation.
FORMULATION OF PRE-STARTER DIETS
In the swine industry, the use of pre-starter diets has been a common practice for a
number of years. The goal of this practice is to provide highly digestible feed ingredients to the
weanling pig with a nutrient profile approximate to that of the sow’s milk that will facilitate the
utilization of nutrients. (Van Dijk et al., 2001). As reviewed in the previous section, it is clear
that the gastrointestinal tract of a chicken is not fully functional during the first seven days of
life. Therefore, the concept of a pre-starter diet should be applicable to chickens as well. Some of
the first published work regarding pre-starter diets originated in India. As early as 1974, poultry
nutritionists brought up the concept of a pre-starter diet for broiler chickens, with the goal of
boosting the growth rate of the chicken during the initial phase of its productive life. At that time
in India, broiler chickens were raised to 10 weeks of age, and conventionally fed in two feeding
phases: starter feed from 0 to 6 weeks, and finisher feed from 6 to 10 weeks. Sahoo and Rao

7
(1974) reported that feeding diets to broiler chickens with levels up to 28% crude protein (CP)
during the pre-starter period, defined from 0 to 2 weeks of age, followed by CP levels as high as
26% during the starter phase, defined from 2 to 4 weeks of age, improved body weight gain and
feed conversion at 4 weeks of age. Mathur et al. (1976) formulated pre-starter diets containing
from 24 to 26% crude protein (CP) and calorie: protein ratios of 120:1 and 110:1, respectively.
The chickens fed the pre-starter diets were significantly heavier than birds fed a conventional
starter diet at three weeks of age. However, the chickens were not able to maintain the initial
growth rate, and no differences were observed in performance at 10 weeks of age. The
conclusions of the authors were that the use of pre-starter diets was not beneficial. In a similar
study, Saxena and Singh (1976) fed broilers diets containing up to 26% CP during the pre-starter
phase, defined from 0 to 3 weeks of age. No differences were found at market age (10 weeks),
although it was noticed that feeding higher CP levels during a pre-starter period could be more
economical than feeding the conventional CP levels throughout the starter period. Due to genetic
selection, and a variety of improvements in husbandry, nutrition and health, the market age
broiler chickens has been gradually reduced in the last decades. Gyles (1989) compared the
growth performance of broiler chickens throughout four decades. In 1950 broilers reached 1.82
kg live weight at 12 wk, whereas in 1988, it took 6 weeks and 2 days to obtain the same weight.
Nitsan et al (1991) considered the first two weeks posthatch as a critical period for the broiler
chicken since it represented a more significant portion of the productive life. A few years later,
Lilburn (1998) emphasized the importance of the first week posthatch, as it represented 17% of
the growing period from an age standpoint of 40 days. Currently, the first week posthatch
represents 20% of the productive life of many broilers, and is the period when the greatest
relative growth occurs (Rocha et al., 2003). Growth performance during the first week is crucial

8
to determine overall performance at market age (Stringhini et al., 2003). Therefore, research
conducted on the nutritional needs of the baby chick has been intensified. For the modern meat-
type, fast-growing chickens, the use of a pre-starter diet may become one important strategy to
achieve flock uniformity, enhance growth performance during the first week, and improve
livability at the end of the productive cycle. Dietary modifications in terms of nutrient
concentrations or inclusion of highly digestible feed ingredients have been addressed by some
researchers. Rocha et al. (2003) reported that by feeding up to 26% CP during the first 7 days of
age, feed intake could be significantly reduced, although at this level the digestibility of dry
matter was reduced. The authors did not observe any significant effect on growth performance
when energy levels up to 3000 kcal/kg ME were used. Nascimento et al. (2004) evaluated
different dietary energy levels and calorie:protein ratios during the first seven days of age in
broiler chicks. A reduction in feed intake and feed conversion was observed when the chicks
received an energy level of 3150 kcal/kg ME and 25% CP. However, no significant effect was
observed on body weight gain.
FEED INGREDIENTS FOR PRE-STARTER DIETS
As previously discussed, the ongoing changes in the physiology of the chick’s
gastrointestinal tract during the first week of age may have an effect on nutrient utilization.
Therefore, it could be speculated that the nutritional value of the feedstuffs commonly included
in broiler diets may be lower for very young chicks. A second approach to increasing digestible
nutrient levels in pre-starter diets would be to either provide alternative feed ingredients with
greater nutrient digestibility, or adjust the nutrient levels present in common ingredients after
evaluation of their nutritional value for young chicks. Both will be presented in the following
section of this review.

9
Cereal grains and carbohydrate sources
In poultry diets, carbohydrates represent the major energy component. About 70% of the
bioavailable energy comes from the carbohydrates, starch being the most important fraction for
animal nutrition (Klein et al., 2001). The main sources of carbohydrates in practical poultry diets
are the cereal grains. In general, the majority of the tissue of a cereal grain is a central mass
described as starchy endosperm, which is where the starch is stored in an insoluble form (Evers
et al., 1999). More specifically, it is located in the cells of the endosperm. Between these cells
there is a complex wall made up of cellulose microfibrils and non-cellulosic polysaccharides.
The majority of the carbohydrate fraction in the cell walls is composed of beta-glucans and
arabinoxylans. Additionally, there are variable amounts of protein and phenolic acids which may
play a role in the stability of the cell wall (Classen, 1996). Starch is found in granules that range
from 5 to 100 μm within the endosperm cells. Two kinds of molecules are found in the starch
granules. Amylose, which is formed by polymers or α-D-glucose linked through α-(1-4) links,
and amylopectin, which in addition to the linear glucose polymers found in amylose, contains
glucose units linked with an α-(1-6) bond that creates branching in the molecule (Carré, 2002).
Starch granules are organized in different structures distinguished as type A, B and C, according
to their X-ray diffraction patterns. Type A is found in cereal grains. Type B is found in tuber
starch such as potato, and type C, which is a combination of types A and B, is present in legumes
(Englyst et al., 1992). The starch present in each cereal grain has a very characteristic form and a
particular combination of polymers which may also contribute to differences in digestibility
(Evers et al., 1999), which has been reported to differ depending on the type of ingredient
(Weurding et al, 2001; Carré, 2004)
10
Factors affecting starch digestibility
Dietary carbohydrates are digested principally by action of the pancreatic enzyme α-
amylase (Leeson and Summers, 2001), which hydrolyses the α (1-4) bonds found in the inner
polysaccharide chains found in starch. The activity of this enzyme has been detected as early as
18 days of incubation in the chicken embryo (Uni et al., 1995), and continues to increase in the
chick until it peaks at 4 d of age with no further increase (Noy and Sklan, 1995; Sklan, 2001).
Therefore, young chicks should be able to digest starch during the first week of age. However,
starch digestion does not only depend on enzymatic activity, as the structure of starch granules in
the grains can also play a role. According to Moran (1982), starch digestibility is a function of
granule surface area, starch structure and degree of crystallinity. Starch of type A, which is found
in grains, is the most accessible to enzymatic attack (Carré, 2004). However, differences in
starch digestibility are observed even in cereal grains, where the starch granules are not as
resistant to digestion as in legumes. It has been speculated that other factors such as the cell walls
of the cereal grain or the encapsulation of the starch granules by a protein matrix might also
affect its digestibility (Classen, 1996). However, the fact that starch digestibility in grains like
barley is low (<94%) after strong mechanical treatments such as grinding and pelleting that
potentially make the starch granules more accessible, contradicts that hypothesis (Carré, 2004).
Many aspects related to starch digestibility, especially for fibrous cereal grains, still remain to be
clarified.
Non-starch polysaccharides
A major group of carbohydrates present in feed ingredients is constituted by the non-
starch polysaccharides (NSP). This group of compounds include β-glucans, arabinoxylans, and
fructans (Iji, 1999), mainly found in the cell wall (Classen, 1996). Walls of cereal endosperm
11
consist predominantly of arabinoxylans and (1-3) or (1-4)-β-glucans, with smaller amounts of
cellulose, heteromannans, protein, and esterified phenolic acids (Evers et al., 1999). Fructans are
formed by linear chains of β-D-fructofuranose linked by (2-6) bonds (Carré, 2002).
Arabinoxylans consist of α-L-arabinofuranose residues attached as branched points to β-linked
D-xylopyranose backbone chains (Evers et al., 1999). β-glucans consist of linear unbranched
polysaccharides of linked β-(1-3) and β-(1-4)-D-glucopyranose units (Carré, 2002). From
reviewing their chemical structure, it becomes clear that a common characteristic of these
compounds is their resistance to the action of digestive enzymes, and particularly their tendency
to create a viscous environment in the small intestine which affects the digestive capability of
chickens (Iji, 1999). It is important at this point to differentiate the group of carbohydrates
known as dietary fiber, which are also considered NSP, although there are several characteristics
that identify these compounds. Most of the fermentable, non-digestible carbohydrates for non-
ruminant animals, and specifically chickens, are classified as dietary fiber. However, only those
fractions that are water soluble are responsible for the increased intestinal viscosity (Hetland et
al., 2004), whereas the water-insoluble fractions have been considered beneficial for intestinal
health in humans. The role of the insoluble fraction in poultry has not been well elucidated
(Józefiak et al., 2004) although there is some recent evidence of possible beneficial effects on
intestinal development (Hetland et al, 2004). The role of the water soluble NSP has been widely
studied and will be described next in this review.
Effect of Non-starch polysaccharides on intestinal viscosity
All grains contain NSP that may vary in structure and concentration from one type of
grain to another (Table 1.1). When first identified, the NSP were thought to have minor

12
nutritional contributions in non-ruminant animals in terms of hindgut fermentation (Annison and
Choct, 1991). In fact, due to the physicochemical characteristics of the NSP in plants, these
TABLE 1.1. Starch and non-starch polysaccharides in several cereal grains and soybean meal
(g/kg dry matter)1
Corn Wheat Rye Barley2 Oats2 Soybean meal
Starch 690 651 613 645 557 27
β-glucan 1 8 16 42 41 ---
Arabinose 3 7 12 3 3 9
Xylose 2 9 20 4 2 2
Raffinose 2 4 4 --- --- 10
Stachyose 1 2 3 --- --- 47
Cellulose 22 20 16 10 14 62
Total NSP3 97 119 152 124 116 217
SNCP4 9 25 42 50 54 63
INCP5 66 74 94 64 49 92
1Adapted from Bach (1997). 2Hulless. 3NSP = Non-starch polysaccharides. 4SNCP = Soluble non-cellulosic polysaccharides. 5INCP = Insoluble non-cellulosic polysaccharides.

13
components have been considered of importance in human nutrition in recent years. However,
considerable evidence has shown that the NSP are antinutritional. Barley, which contains 3-6% β
glucans, has been associated with growth depression, increased intestinal viscosity, and sticky
excreta when fed to broilers (Hesselman et al., 1982; White et al., 1983). Annison (1993) found a
negative correlation between AME and NSP in wheat, in addition to growth depression in
chickens fed NSP isolated from wheat. Rye, which contains approximately 10% arabinoxylans
(Annison and Choct, 1991), has also been reported to depress growth when incorporated in
chicken diets (Ward and Marquardt, 1987; Fengler and Marquardt, 1988). The most noticeable
effect of NSP in chickens is the increased intestinal viscosity, which causes growth depression
and reduces the ability to digest nutrients (Iji, 1999). These effects are related to the gel-
formation capacity of the NSP in the intestinal aqueous environment, although the mechanism is
still not well elucidated (Smulikowska et al., 2002). However, it has been speculated that in a
viscous environment, the contact between fats and digestive secretions is lower. The viscous
NSP may increase mucus secretion, thickening the water layer which consequently reduces the
lipid absorption (Smits and Annison, 1996). By reducing the flow of digesta in the small
intestine, the NSP increase the amount of undigested carbohydrates in the distal ileum, which
may favor the multiplication of undesirable bacterial populations (Choct et al, 1996). Relative
weights of small intestine and ceca of chickens were increased after receiving diets with high
viscosity-carboxy methyl cellulose from 21 to 35 days of age (Smits et al., 1997). In the same
study, alteration of nutrient absorption was evidenced by a reduction in plasma triglyceride
concentrations in the chickens fed the highly viscous carbohydrates. Rakowska et al. (1993)
reported damage to the intestinal villi and epithelium of the small intestine of broiler chicks
receiving diets with 80% rye. Feeding purified viscous NSP to chickens (guar gum, gum
14
xantham and gum arabic) was associated with increased crypt depth and villi height in the ileum,
and reduced cell populations in jejunum accompanied by larger cell size, measured as a
protein:DNA ratio (Iji et al., 2001). In the same study, a significant reduction in jejunal maltase
and alkaline phosphatase was observed in chicks fed viscous NSP at 7 days of age, although such
enzymes reached levels similar to those in the control treatment at 21 days of age. In vitro testing
has shown a reduction in glucose mobility in water solutions of xanthan, guar and locust bean
gums, which are commercial NSP utilized in certain industrialized products for human
consumption (Read, 1987). In vivo testing failed to show a definite trend in the effects of viscous
NSP on amino acid uptake (Iji et al., 2001). Smulikowska et al. (2002) reported reduced in vitro
contractility of jejunum in chickens fed a rye-based diet, suggesting that NSP could also reduce
intestinal motility in vivo.
Effect of NSP on intestinal bacterial populations
There is clear evidence that diet influences the gut microbial ecology (Lee, 1984).
Microbial enzymes present in the gut are capable of breaking down the NSP and producing
short-chain fatty acids (Iji, 1999). Microorganisms have been implicated in the detrimental
effects of the NSP since research has shown enhancement in performance when barley-based
diets were supplemented with antibiotics (Classen et al., 1985). Wagner and Thomas (1978)
reported increased anaerobic bacterial populations in the small intestine of chicks fed diets
containing citrus pectin or rye. Hofshagen and Kaldhusdal (1992) found an increased number of
Clostridia populations in the small intestine of chickens that received wheat, oats and barley-
based diets. Smits et al. (1998) reported increased populations of Clostridia, Lactobacillus, and
Bacteroides in the small intestine of chickens fed diets containing high-viscosity carboxymethyl
cellulose. Similar results were reported by Langhout et al. (1999), who found increased numbers

15
of Enterococci, Bacteroidaceae, Clostridia and E. coli in the ileum of chickens fed diets
containing 3% high-methylated citrus pectin for 21 days. These results coincided with high
viscosity in the small intestine digesta. Jamroz et al. (2002) demonstrated that total NSP from
barley were degraded in the ceca of chickens, ducks and geese when fed diets containing 40%
barley from day 1 to 42. However, the authors obtained negative coefficients of digestibility for
the water-soluble NSP, confirming that poultry are not capable of degrading such compounds.
Alternative carbohydrate sources for pre-starter diets
Cereal grains can be ranked according to their feeding value, determined primarily by
their metabolizable energy (ME) and starch digestibility. Cereal grains such as barley, oats, rye
and triticale have been recognized to have a lower value for poultry feeding (Classen, 1996) than
corn or sorghum. The inclusion of one type of grain is often a function of its availability in a
given geographical region, and its nutritional value. For pre-starter diets, it is desirable to include
cereal grains with high starch digestibility whenever possible. However, based on the premise
that very young chicks have some limitations in their digestive capabilities, other carbohydrate
sources that need no digestion in the gastrointestinal tract have been proposed for inclusion in
this type of special diet. Theoretically, readily absorbable carbohydrates might be better utilized
by young poultry than the conventional cereal grains. In an attempt to identify alternative
carbohydrate sources for early feeding of broiler chicks, Batal and Parsons (2004) formulated
diets based on dextrose, conventional cornstarch, dextrinized cornstarch, tapioca dextrin, corn-
syrup solids, high amylose starch, pregelatinized unmodified cornstarch, pregelatinized tapioca
starch, and polycose (glucose polymers prepared by controlled acid enzyme hydrolysis of
selected cornstarch), as the carbohydrate source and soybean meal as the only protein source.
The chicks fed the dextrose diet had the greatest weight gain of all at 7 d of age, suggesting that

16
highly digestible carbohydrate sources might be beneficial for very young chicks. However, the
weight gain of chickens fed dextrose-soybean meal diets was not better than that of chickens fed
a standard corn-soybean meal diet. Interestingly, the authors reported an increase in ME due to
age for the later diet, but no age effect on ME was observed in the dextrose-soybean meal diet
(Batal and Parsons, 2004), confirming that dextrose is indeed a readily absorbable carbohydrate
source as early as four days of age. In a study conducted by Longo et al. (2005a), the authors
compared the performance of chicks fed diets containing corn starch (17.13%), cassava starch
(15.18%), glucose (dextrose) (16.34%), and sucrose (15.89%), added at the expense of corn. The
ME of each carbohydrate supplement was determined in seven-day-old chicks prior to diet
formulation. Even though the authors found a very high coefficient of metabolizability for
cassava starch (97.9%), which was even greater than that for glucose (dextrose), the growth
performance at 7 days of age was not improved. Factors different from enzymatic activity in the
gastrointestinal tract, or accessibility to the starch granules in a specific grain, might be involved
in the utilization of carbohydrates from the diet, as it has been demonstrated that ME increases
with age in poultry (Sulistiyanto et al., 1999; Batal and Parsons, 2002; Batal and Parsons, 2004).
However, when formulating diets based on a ME value for young chicks, researchers have
reported no improvement in performance (Longo et al., 2005a).
Grain sources for pre-starter diets
To date, reports on improvement in growth performance observed when feeding
alternative carbohydrate sources are not consistent. Furthermore, their applicability might be
difficult from a practical point of view. Thus, cereal grains will continue to be included in
commercial diets until other strategies that facilitate the application of alternative carbohydrate
sources can be implemented under commercial settings. However, the nutritional value of grains

17
for baby chicks should be reevaluated in light of the chick’s reduced ability to utilize nutrients.
In order to compare utilization of cereal grains during the first days of life, Sulistiyanto et al.
(1999) determined the metabolizability of corn, sorghum and wheat during the first 10 days
posthatch, showing an increasing trend in metabolizable energy as the chickens aged. Corn was
the grain better utilized by chicks during this period, followed by sorghum, and finally wheat. A
comparison between utilization of conventional and waxy corn was reported by Batal and
Parsons (2004). This type corn is characterized by containing one hundred percent of
amylopectin as the polysaccharide found in the starch granules as opposed to sixty percent found
in regular corn. Amylopectin is a branched molecule that is more accessible to enzymatic
digestion. Therefore, digestibility of waxy corn in young chicks is expected to be higher than that
of regular corn. However, no significant differences were found in the ME of conventional and
waxy corn at 4 and 7 days of age. Those results coincided with no differences in growth
performance at day 7. However, the weight gain of the birds fed the waxy corn diet was greater
than that of birds fed conventional corn diets at 21 days of age.
Due to its nutrient profile, price and availability, corn is the most widely used grain in
animal feeding in the US. However, in some other countries where corn is not grown in
sufficient quantities or is destined for human consumption, a good alternative to corn is low-
tannin sorghum. This grain has been considered somewhat inferior to corn in terms of energy
content, but is higher in protein and AA concentrations but with slightly lower digestibility.
Nevertheless, genetically improved varieties of sorghum (Elkin et al., 2002) have been reported
to have greater AA digestibilities than corn, and are able to support growth comparable to that
obtained by feeding corn-based diets. In recent tables of nutrient composition (Dale and Batal,
2005), the analyses of sorghum reported a higher protein content than corn and very similar AA

18
and fiber concentrations between the two grains. Thus, low-tannin sorghum could potentially be
included in a chicken pre-starter diet. Another potential alternative is the use of pearl millet. This
is a grain extensively grown in tropical and subtropical areas of Asia and Africa, which yields
greater quantities than other cereal grains under conditions of limited soil fertility, heat and low
rainfall (Singh et al., 1987). Research conducted on pearl millet has proven satisfactory in terms
of growth performance in broilers (Sharma et al., 1979; Smith et al., 1989; Adeola and Rogler,
1994; Davis et al., 2003). The nutritional profile of this grain is slightly superior to that of yellow
corn in terms of energy density, in part from a higher oil content (Rooney, 1978), protein content
and AA profile (Ejeta et al., 1987; Aldeola and Rogler, 1994). Furthermore, digestibility of
lysine, threonine and cystine in genetically improved varieties of pearl millet grown in Australia
has been reported to be higher than in sorghum (Singh, 2004). Great potential exists for inclusion
of this grain in poultry diets. The only limitation, at least in the US industry, is that the volume of
pearl millet being harvested would not satisfy the demand (Davis et al, 2003), even for
commercial scale demonstrations. Pearl millet is currently being grown in some regions of the
southeastern United States. However, most of the grain is being purchased in premium markets
such as bobwhite quail farms for recreational hunting. Once this market becomes saturated, the
expectations are that pearl millet will have a competitive price for use in the poultry industry
(Wilson, 2005).
Protein sources
Soybean meal is the most widely used protein source for poultry diets, and in a broiler
starter diet it usually accounts for approximately 35% of the feed. However, the presence of
antinutritional factors such as oligosaccharides and non-starch polysaccharides (NSP) can
adversely affect performance (Kocher et al., 2002), particularly in young chicks. To date, a few

19
attempts have been made to evaluate alternative protein sources with potentially greater nutrient
availability for their inclusion in diets for very young chicks. Harmon et al. (2001) proposed the
inclusion of spray-dried eggs, a by-product of hatcheries after the candling of the eggs, in diets
for nursery pigs or young chicks. Albumen, which is the main protein found in the egg, is
considered a very high quality protein in terms of its AA profile (Leeson and Summers, 2001).
Spray-dried eggs contain 46% crude protein, 4700 kcal/kg ME, and 3.72% lysine (Harmon et al.,
2001). Junqueira et al. (2001) reported the inclusion of 0, 5, 10, 15 and 20% spray-dried eggs in
diets for chickens during the pre-starter (1 to 7 days of age) and starter periods (8 to 21 days of
age). Addition of 20% spray-dried eggs decreased weight gain during the first seven days of age,
and no significant benefits were observed at the other levels of inclusion. Longo et al. (2005)
evaluated the addition of spray-dried eggs (8%), blood plasma (5.6%), soy protein isolate
(5.35%), corn gluten meal (7.3%) and dried sugar cane yeast (13.65%), in substitution for
soybean meal, as protein sources for broiler pre-starter diets. No significant effects on weight
gain were observed. However, there was a significant improvement in feed conversion in the
chickens fed soy protein isolate and blood plasma. Soy protein isolate results from the selective
removal of the soluble carbohydrates from the soy protein flour, which is further processed to
remove cotyledons through an alkaline extraction and centrifugation, followed by an acid
precipitation (Johnson and Kikuchi, 1989). Batal and Parsons (2003) studied the utilization of
soy protein isolate by chicks during the first week posthatch. Their results indicated that growth
performance was significantly inferior to that of chickens fed a conventional corn-soybean meal
starter diet. The authors attributed the poor growth performance to an AA imbalance, since the
concentrations of sulfur AAs and threonine are low in soybean products (Batal and Parsons,
2003). However, the apparent digestibility of lysine in soy protein isolate was higher than that in

20
soybean meal during the first week of age.
Amino acid digestibility
Because modern feed formulation systems are based on AA requirements rather than
crude protein, more importance is given to the determination of AA concentrations in feedstuffs.
However, it has been demonstrated that not all the AA in feedstuffs can be utilized by the
animal. Thus, in order to fulfill the AA requirements of a given species, the digestibility or
bioavailability of the AA must be evaluated, particularly for ingredients to be included in pre-
starter diets.
Digestibility has been defined as the fraction of nutrient ingested that is absorbed by the
bird and not excreted in the feces. Digestibility is a term frequently interchangeable with
availability. However, they are not equivalent. Availability involves a more complete process of
digestion, absorption and metabolism or utilization, whereas digestibility only measures
digestion and absorption. Availability can only be measured by growth assays, which are time
consuming and expensive, and allow the determination of bioavailability of only one AA at a
time. Digestibility on the other hand, can be determined by measuring the dietary AA input and
excreta output (Parsons, 2002). For this reason, digestibility has been adopted as the preferred
methodology to estimate availability, since it is probably the most important determinant of
availability in the case of AA (Lemme et al., 2004). AA digestibility has been found to be a
sensitive indicator of AA availability in feedstuffs for poultry diets. Thus, determining a
digestibility coefficient for feed ingredients becomes crucial in order to more closely meet the
AA requirements of the chickens being fed. Feed formulation based on digestible rather than
total AA provides several advantages, including reducing nitrogen output and consequently
environmental contamination, and reduction in feed cost (Rostagno et al., 1995). Digestibility

21
can be determined by the faecal collection method or by ileal digesta collection. The faecal
collection method, as reported by Likuski and Dorrel (1978) and Sibbald (1979), consists of
fasting adult cockerels for a 24-48 hour period, followed by a crop intubation of 30-35 grams of
the test feedstuff, and excreta collection for 48 hours post intubation. In the original reports, the
importance of correcting for AA endogenous secretion, that may have a significant contribution
depending upon the feedstuff, is emphasized (Likuski and Dorrel, 1978). In order to do so, a
group of fasted roosters is maintained along with the crop-intubated birds and their excreta
collected for AA analysis. This assay is now referred as the “precision-fed cockerel assay”, and it
has the great advantage that it enables the analysis of several feedstuffs in a relatively short
amount of time. Furthermore, a small amount of the feed ingredient is needed, there is no need of
a feed marker, and palatability of the feed ingredient is not a major concern. This method,
however, has been criticized for several reasons. First, in actuality the assay is measuring
metabolizability of the AA, since the excreta contain urine that also provides some AA
contribution (Parsons, 2002). However, because some reports have indicated that urine AA
contribution is negligible (O’Dell et al., 1960; Sibbald, 1987), the results of the assay are still
reported as digestible AA. A second and more important drawback is the fact that in intact
cockerels there is some bacterial fermentation in the ceca that may overestimate AA digestibility
by degrading non-digested AA, and precluding their quantification in the excreta (Leeson and
Summers, 2001). The use of caecectomized cockerels can overcome the effect of cecal bacterial
fermentation (Parsons, 1986). Nevertheless, some researchers consider that caecectomy is not
strictly necessary for poultry because digestibility coefficients obtained by either method
(conventional vs caecectomized birds) are highly correlated even for feed ingredients of animal
origin (Parsons, 2002). Crop-intubating cockerels is not a normal feeding pattern, and feeding a
22
raw ingredient may exert a significant effect on the normal digestive process (Lemme et al.,
2004). Furthermore, testing feedstuffs in adult roosters may overestimate AA digestibility
coefficients for some ingredients, since digestibility is influenced by age even for highly
digestible ingredients like corn and SBM (Batal and Parsons, 2002). Therefore, nutritionists have
been seeking other methods for estimating AA digestibility. Payne et al. (1968) were the first to
report the ileal digestibility assay, which consists of feeding diets formulated with the test
ingredients as the sole source of protein and AA to chickens for 2 or 3 weeks. After euthanizing
the chickens (slaughter method), digesta is collected from the vitelline diverticulum to the ileo-
cecal junction, although the optimal site of collection is still in debate (Parsons, 2002). Test diets
contain a digesta marker such as Celite™ or chromic oxide, because it becomes troublesome to
quantify the amount of digesta collected. With this methodology, normal digestive processes are
allowed, and the effect of bacterial fermentation in the ceca is overcome. However, several
disadvantages have been pointed out, such as the time and expense required for maintaining the
birds. Because large amounts of digesta are required particularly if Celite™ (acid insoluble ash)
is used as a marker, samples must be pooled and a greater number of chickens need to be used.
Results obtained from this method are reported as apparent ileal digestibility (Ravindran and
Bryden, 1999).
Estimation of endogenous losses
It is clear that not all AA found in the excreta represent the non-absorbed portion of the
AA from the feed. Endogenous secretions of AA, predominantly from saliva, bile, pancreatic,
gastric and intestinal secretions, influence the concentration of the AA present in the digesta.
Hence, the main concern of the apparent ileal digestibility system is the influence of the level of
feed or AA intake on endogenous secretions. At low dietary protein or AA intakes, the
23
proportion of AA from endogenous secretions becomes greater. Therefore, a correction for
endogenous losses should be done (Parsons, 2002), in which case the results are reported as true
AA digestibility. According to the literature, true digestibility data can be compared even if the
test ingredients were assayed under different conditions (Ravindran and Bryden, 1999).
Currently, several methods exist for estimating endogenous losses. Fasting, as described by
Likuski and Dorrel (1978) and Sibbald (1979), consists of preventing feed access to cockerels for
24 to 48 hours and analyzing the AA in the excreta. The nitrogen-free method involves feeding a
diet devoid of protein, assuming that normal digestive processes occur, and collection of the
excreta. Some criticism has arisen in regard to these two methods, due to the negative nitrogen
balance that is physiologically abnormal (Ravindran and Bryden, 1999). Nevertheless, these two
methods are the most commonly employed because they are less laborious. Another approach is
the regression method, consisting of feeding diets with increasing levels of the test feed
ingredient. A regression line is fitted for AA absorption versus AA intake, where the slope of the
line represents the digestibility including endogenous secretions. Basal losses can be estimated
by extrapolating the regression line to the origin (zero level of AA intake) (Lemme et al., 2004).
However, there can be a wide estimation error, especially if there is a sizeable gap between the
lowest AA intake data point and zero. Since it is very complex to estimate even one digestibility
coefficient, this method has not gained acceptance. Furthermore, it is assumed that the flow of
endogenous AA secretion remains unchanged as protein or AA intake increases (Ravindran and
Bryden, 1999). A more complex method proposed by Moughan et al. (1990) is the peptide
alimentation ultrafiltration technique. A semi-synthetic diet containing hydrolyzed casein
(enzymically hydrolyzed casein) as the only protein source is fed to the animal. From the ileal
digesta, the nitrogenous fractions are separated by centrifugation and ultrafiltration in two

24
fractions: one with a high molecular weight, where the endogenous secretions are found, and a
second fraction with low molecular weight that contains unabsorbed dietary AA, small peptides,
non-protein nitrogen and low concentrations of free AA from endogenous origin. This method
has also been criticized since there might be some small molecules in the high molecular weight
fraction that do not correspond to endogenous secretions (Ravindran and Bryden, 1999).
Another technique to estimate endogenous AA secretions by using isotopes has been
proposed (de Lange et al., 1990). The method involves perfusion of 15N-labelled leucine into the
blood of pigs consuming the test diet. The labeled AA is incorporated into the endogenous
secretions, and by measuring the 15N in the digesta, the amount of endogenous nitrogen secreted
is estimated. In the assay, other isotopes have been incorporated (Simon et al., 1983; Zebrowska
et al., 1986). However, the main drawback of this method is the inability to measure the recovery
of all individual AA in ileal digesta, and the fact that the rate of incorporation of the labeled AA
into the endogenous secretions is difficult to measure (Ravindran and Bryden, 1999).
Finally, in the homoarginine technique, lysine residues in casein are transformed to
homoarginine by guanidination. Then, lysine and homoarginine levels are analyzed in the
digesta, and the endogenous lysine losses are calculated (Lemme et al., 2004). Some drawbacks
have been discussed for this method (Ravindran and Bryden, 1999) such as the need for a fasting
period prior to feeding the guanidinated casein, which again is not a normal physiological
process. Second, it is only applicable for ileal digestibility studies, because there is a great
urinary contribution of homoarginine to the excreta that drastically alters the concentration of
endogenous secretions (Ravindran and Bryden, 1999).
As can be appreciated, there is a great variability between the results obtained by each
method. The fasted and nitrogen-free methods give the lowest endogenous secretions values; the

25
regression method gives intermediate values, and the isotope, homoarginine and peptide
alimentation methods give the greatest values (Parsons, 2002). The enzymatically hydrolyzed
casein method has been recognized by some researchers as being the best way to measure
endogenous losses, due to the fact that most of the drawbacks from the other methods are
overcome with this procedure (Lemme et al., 2004). From reviewing the methodologies to
estimate endogenous losses, the term “standardized” digestibility has been developed, and is
considered less ambiguous as an alternative to “true” AA digestibility (Parsons, 2002). In the
“standardized” AA digestibility, the endogenous AA secretions obtained by different methods
that have been reported in the literature can be summarized and used as a correction factor
(Lemme et al., 2004) which is more advantageous since results from different laboratories
become comparable. To date, there is still controversy about whether or not apparent digestibility
values should be corrected for endogenous losses, because there is no perfect method to estimate
them. If a correction for endogenous losses is applied, which procedure to use is still a subject of
debate. Fasting has provided very consistent results when used along with cecectomized roosters
(Parsons, 2002). The enzymatically hydrolyzed casein method, on the other hand, is preferred
when the ileal AA digestibility is employed (Lemme et al., 2004).
Ileal and excreta AA digestibilities
There is a large body of work on reference AA digestibility values available for
consultation (Green, 1987; Parsons, 1991; Rhone-Poulenc, 1993, 1995; NRC, 1994; Heartland
Lysine, 1996). However, differences in the methodology employed for determination of the AA
digestibility coefficients must be recognized because variation in digestibility coefficients
depending upon the place of sampling has been observed for some AA. Ravindran et al. (1999)
compared the AA digestibility in ileal and excreta samples in chickens from 35 to 42 days of age.

26
The authors found variability in digestibility depending on the feed ingredient tested. For corn,
sorghum, and SBM, ileal and excreta digestibility were similar, but not for wheat. Lysine
digestibility in this grain was found to be 17% lower in excreta than in ileal digesta. For animal
protein ingredients, including feather meal, meat meal, and meat and bone meal, the excreta
analysis yielded from 4 to 16% greater digestibility coefficients. A study conducted by Kadim et
al. (2002), using 5-week-old chickens, showed that digestibility of individual AA tended to be
greater in excreta than in ileal digesta. For wheat and meat and bone meal, lysine digestibility
was greater in excreta, but not for sorghum, SBM, or fish meal.
AA digestibility as influenced by age
It is well recognized that the ability of chickens to digest proteins is affected by age
(Tarvid, 1995). Nitrogen utilization is lower during the first seven days of age (Noy and Sklan,
1995). Digestion of protein is not considered to be optimal until 21 days of age (Sklan, 2001).
Therefore, it is to be expected that AA digestibility is also affected by age. In a corn-soybean
meal diet, AA digestibility increased with age, and reached a plateau at 10 days of age (Batal and
Parsons, 2002). In several soy products, including soy protein concentrate and soy protein
isolate, the AA digestibility has also been reported to increase with age (Batal and Parsons,
2003). Huang et al. (2005) compared the AA digestibility of corn, sorghum, mill runs, soybean
meal, cotton seed meal, and meat and bone meal, and reported changes in ileal apparent AA
digestibility estimated in chickens from 14 to 28 and also to 42 days of age. Because it is clear
that AA digestibility is influenced by age, some differences in the AA digestibility coefficients
could be anticipated according to methodology employed, especially with birds of different ages
(broiler chicks vs roosters). Parsons (2002) compared the digestibility coefficients obtained by
the chick ileal apparent digestibility assay and the true digestibility in excreta of roosters, from

27
reports published in the literature. Lysine and methionine digestibilities in corn, sorghum and
soybean meal were very similar between both assays. However, variation between assays was
observed for meat meal. Digestibility of individual AA is also affected, since threonine
digestibility was found higher in the rooster assay, even in corn and soybean meal. Differences in
methodology (i. e. apparent vs true digestibility), age of the birds (chickens vs roosters) and even
different samples of the same ingredient could have accounted for the variation observed,
especially since data was obtained from different published reports.
AA requirements of baby chicks
The requirement of chickens for protein is, in fact, a requirement for the AA contained in
the crude protein (NRC, 1994; Leeson and Summers, 2001). Therefore, estimation of the AA
requirements for chickens of different ages has been intensively studied. From a practical
perspective, feeding programs for chickens include three phases: starter, grower and finisher
(NRC, 1994). For the starter period, from 0 to 21 days of age, studies addressing AA
requirements have been initiated at 7 days of age, when the yolk sac is no longer present.
However, over the last few years the market age of broilers has gradually been reduced. Hence,
the first seven days of age currently represent a more significant portion of the broiler’s
productive life. As previously discussed, chickens are not physiologically mature during the first
week of age. Little work has been conducted to estimate AA requirements of baby chicks. To
date, only the work of Sklan and Noy (2003) has taken this approach. These researchers
estimated that for a 7 d-old broiler chick, the lysine requirement was from 1.03 to 1.08%,
whereas for total sulfur AA the requirement was 0.91%, on a total basis. Both estimates were
very close to the NRC (1994) recommendation for 0 to 21 days. One would anticipate that AA
requirements could be higher, since nutrient uptake capacity is limited during the first week of

28
age. Whether or not the requirements for these AA change with age has not been further
investigated.
Phosphorus sources
Phosphorus is a widely distributed mineral in nature, usually found combined with
calcium and oxygen as calcium orthophosphate. This last compound is found on the earth surface
as part of igneous rock after solidification of molten rock. Historically, phosphorus was first
prepared in Germany as early as 1669, and recognized as an essential component of bones in
1769. Isolation of this mineral from a variety of tissues was accomplished in the following
decades, leading to very intense work on elucidation of its role in live organisms. Currently, the
importance of the roles played by this element under normal physiological conditions,
specifically bone formation, is very well recognized (Lesson and Summers, 2001). Nowadays it
is common knowledge that the available phosphorus present in plant feedstuffs is not sufficient
to meet the animal’s requirements. However, it was not until the early 1860’s when researchers
first recognized that animal rations were somewhat deficient in mineral elements. By 1890, it
was observed that dietary supplements were needed to prevent mineral deficiencies, specifically
bone meal. With the development of commercial feeds, accelerated after the discovery of
vitamin D in 1922, supplementation of diets with phosphorus sources became a more frequent
practice. By 1940, the addition of bone meal to commercial feeds was common practice,
although the supply was not sufficient to satisfy the demand (Smith, 1956). Therefore, more
attention was directed towards inorganic phosphorus sources. Addition of rock phosphate to
poultry diets was reported as early as 1903 (Wheeler, 1903) although its use yielded inconsistent
growth performance results, and the inclusion of bone meal was generally preferred. Further
investigations associated the poor performance of poultry fed rock phosphate with a high content

29
of fluorine, since heat treatment of rock phosphates was not employed at that time. Gradually,
other sources of inorganic phosphorus were incorporated to animal feeds. In the decade of the
1940’s, defluorinated phosphate was the next inorganic phosphate to be introduced on a
commercial scale and at an affordable price, which offered the advantage of a drastic reduction
in the level of fluorine as compared to raw rock phosphate. In following years, dicalcium
phosphate was obtained by chemical treatment of limestone and was made available as a feed
phosphate for poultry. As of 1970, Thompson (1970) classified the feed phosphates available for
animal use as follows:
1. Calcium phosphates
a. Unprocessed
i. Raw rock phosphate
ii. Bone meal
b. Chemically processed
i. Dicalcium phosphates
1. Dicalcium-monocalcium phosphates
ii. Defluorinated phosphates
2. Sodium phosphates
a. Monosodium phosphate
b. Disodium phosphate
c. Sodium tripolyphosphate
3. Ammonium phosphates
a. Monoammonium phosphate
b. Diammonium phosphate

30
c. Ammonium polyphosphate
4. Phosphoric acid
Currently, two of the most widely used feed phosphates for poultry diets are
defluorinated phosphate and dicalcium phosphate. Defluorinated phosphate is obtained by
treating raw rock phosphate with phosphoric acid and sodium carbonate. The mix is heated at
1250 C, which results in molten rock that is ground and screened to size (Thompson, 1970). By
heating the raw rock phosphate, tricalcium phosphate is obtained, phosphorus bioavailability is
increased, and the majority of fluorine, which may be toxic to chickens (Gerry et al., 1947), is
eliminated. As might be expected, the mineral composition of raw rock phosphate is not
constant. Also, because heat treatment of this type of phosphate is difficult to control, variations
in the biological availability of phosphorus in defluorinated phosphates are to be expected.
Dicalcium phosphate, on the other hand, is the result of the reaction between phosphoric acid and
calcium carbonate. Phosphoric acid can be produced from burning elemental phosphorus to
produce furnace phosphoric acid, or from the reaction of sulfuric acid and raw rock phosphate. It
is important to point out that the product known as feed grade dicalcium phosphate is actually a
mix of dicalcium and monocalcium phosphates. The ratio of one over the other can be modified
by controlling the amount of limestone (calcium carbonate) reacted with phosphoric acid.
Because production of dicalcium phosphate is easier to control, the end product is more uniform
than defluorinated phosphate in terms of phosphorus content and bioavailability (Thompson,
1970).
Evaluating bone mineralization
In evaluating the bone mineralization status in animals, several criteria have been used
over the years. As early as 1855, Fremy (1855) reported the use of bone ash to estimate bone

31
mineralization status in different species. In the following decades, bone ash was employed as a
means of quantifying skeletal abnormalities in children (Brubacher, 1890) and horses
(McCrudden, 1910). Interestingly, in some of the first published work regarding skeletal
deficiencies in chickens, the researchers based their observations on body weight and mortality
(Hart et al., 1923) even though bone ash as a parameter to quantify bone mineralization had been
documented over 60 years before. Bethke et al. (1923) recognized the need for a more
quantitative assay to evaluate bone mineralization. In their work with skeletal disorders in rats,
the authors collected the femur and tibia, removed any adhering tissue, performed a fat extraction
procedure, and ashed the bones. Their results were reported as a percent of bone ash, which
became adopted in bone mineralization studies in the following years (Heuser and Norris, 1926a,
b; 1928). The tibia bone ash assay was first recognized as an official method to evaluate vitamin
D activity of feed supplements for chickens by of the Association of Official Analytical
Chemists in 1932, and so has remained over the years including the latest edition (AOAC, 2000).
However, the tibia bone ash procedure is so time consuming and labor intensive that alternative
methods have been proposed. As early as 1942, Baird and Macmillan suggested the use of the
toe rather than tibia to evaluate bone mineralization. In the proposed assay, the middle toe was
excised, dried and ashed, without removal of any adhering tissue or extraction of fat. In the
following years, the assay was confirmed to be highly correlated with tibia bone ash, with
considerably less work needed to obtain results (Evans and Carver, 1944). Researchers have
employed this method in numerous studies (Fritz and Roberts, 1968; Yoshida and Hoshii, 1983;
Potter, 1988), finding satisfactory results. Toe ash is currently recognized as an alternative to the
official method for evaluation of vitamin D supplements in the AOAC manual (AOAC, 2000).
Despite the rapidity and simplicity of this assay, some drawbacks have been identified. Huff

32
(1980) reported that toe ash might not reflect bone mineralization status accurately in chickens
with a compromised fat metabolism, such as during aflatoxicosis. Furthermore, the research
conducted by Mendez and Dale (1998) indicated that with such low weight of the toe ash
fraction, greater variation was observed. Thus, these authors suggested the use of the entire foot,
severed at the tibio-metatarsal joint, as a parameter to evaluate bone mineralization. The foot ash
methodology has been recently compared to toe ash and tibia ash, with very high correlation
coefficients between tibia and foot ash assays (Yan et al., 2005). The relative simplicity of the
toe and foot ash assays, and their good correlation with the tibia bone ash, should enable
researchers to evaluate feed ingredients or additives affecting bone mineralization in the chicken
in an easier, more rapid and less labor intensive manner.
Other response criteria have been used over the years to evaluate bone mineralization.
Rao et al. (1993) assessed the use of bone density and bone mineral content as an alternative to
estimate bone mineralization status. They reported that a smaller sample size was required for a
minimum significant difference between dietary treatments when bone density was used
compared to tibia bone ash. Ravindran et al. (1995) found that tibia specific gravity, tibia shear
force, toe shear force, and metatarsal shear force had limited value in determining phosphorus
bioavailability. In their studies, they also observed that toe ash and body weight were more
sensitive parameters than tibia bone ash in evaluating phosphorus bioavailability. Onyango et al.
(2003) concluded that tibia bone ash could be very well predicted by examining bone density.
However, in most studies where phosphorus bioavailability is evaluated, tibia bone ash, and
sometimes toe ash, in addition to body weight, has been used as the preferred response criteria.

33
Evaluation of phosphorus biological availability
Evaluation of the biological availability of phosphorus in feed phosphates has been an
important subject of investigation over the years since there is a great variation between
phosphate sources, their origin, and production process. Biological availability is usually
estimated by feeding different diets to chickens that contain graded levels of phosphorus from
either a test feed phosphate or a standard source. Based on a response criteria, usually body
weight and/or bone ash, the two products are compared, and the relative bioavailability results
are reported as a percent (Borges et al., 1997). This is the term most frequently employed in the
literature, since measuring absolute biological availability is extremely complicated. Researchers
have employed the slope ratio assay as the most widely accepted methodology to estimate
relative bioavailability, provided the response criteria utilized in the assay are linear (De Groote
and Huyghebaert, 1997). Non-linear assays, in which a broader range of phosphorus levels can
be covered, have also been applied for relative bioavailability studies (Potter et al., 1995;
Ravindran et al., 1995). As can be expected, variations in results exist depending upon different
factors, including the type of bioassay, methodology to estimate relative bioavailability, and
levels of other nutrients like calcium (De Groote and Huyghebaert, 1997).
A large body of published work was generated in the 1940’s regarding evaluation of
inorganic phosphorus supplements for poultry diets (Carver and Evans, 1943; Bird and Caskey,
1943; Matterson et al., 1945; Gerry et al., 1947; Gillis et al. 1948). The supplements evaluated
included rock phosphate, superphosphate, and partly defluorinated phosphates. Special concerns
arose from the fluorine content in these inorganic phosphates (Gerry et al., 1947) that was
identified as a growth depressor. A great emphasis was placed on comparing the biological
availability of phosphorus in the inorganic phosphates available in the following decade, as

34
reported by different researchers (Miller and Joukovsky, 1953; Gillis et al., 1954; Motzok et al.,
1956; Creech et al., 1956). In these studies, it was generally concluded that a greater amount of
phosphorus from tricalcium phosphate was needed to attain the same bone ash percent than with
dicalcium phosphate. In the next decade, Nelson and Walker (1964) reported a 5% greater
bioavailability of phosphorus in dicalcium phosphate as compared to defluorinated phosphate.
Results obtained by Sullivan (1966) were similar for young turkeys. A review on the subject
published by Peeler (1972) indicated that phosphorus in monocalcium and dicalcium phosphates
was from 5 to 10% more biologically available than in defluorinated tricalcium phosphate. Work
with turkeys (Waibel et al., 1984; Potchanakorn and Potter, 1987), chickens (Nelson et al. 1990;
Sullivan et al., 1992) and laying hens (Rao et al., 1995), indicated similar results. The majority, if
not all of the work published in the literature, has been conducted in birds after two weeks of
age, with little emphasis on the first week of age.
35
REFERENCES
Adeola O., and J. C. Rogler. 1994. Pearl millet in diets of white Pekin ducks. Poult. Sci. 73:425-
435.
Annison, G., and M. Choct. 1991. Anti-nutritive activities of cereal non-starch polysaccharides
in broiler diets and strategies minimizing their effects. World’s Poult. Sci. J. 47:232-242.
Annison, G. 1993. The role of wheat non-starch polysaccharides in broiler nutrition. Aust. J.
Agr. Res. 44:405-422.
Association of Official Analytical Chemists. 2000. Pages 61-62 in: Official Methods of Analysis
of the Association of Official Analytical Chemists. 17th ed. Vol. 2. Washington, DC.
Bach K., K. E. 1997. Carbohydrate and lignin contents of plant materials used in animal feeding.
Anim. Feed Sci. and Technol. 67:319-338.
Baird, F. D., and M. J. MacMillan. 1942. Use of toes rather than tibiae in A.O.A.C. chick method
of vitamin D determination. J. Assoc. Off. Agric. Chem. 25:518-524.
Bar Shira, E., D. Sklan, and A. Friedman. 2005. Impaired immune responses in broiler hatchling
hingut following delayed access to feed. Vet. Immun. and Immunopathology. 105:33-45.
Batal A. B., and C.M. Parsons. 2002. Effects of age on nutrient digestibility in chicks fed
different diets. Poult. Sci. 81:400-407.
Batal, A. B., and C. M. Parsons. 2003. Utilization of different soy products as affected by age in
chicks. Poult. Sci. 82:454-462.
Batal, A. B., and C. M. Parsons. 2004. Utilization of various carbohydrate sources as affected by
age in the chick. Poult. Sci. 83:1140-1147.

36
Bethke, R. M., H. Steenbock, and M. T. Nelson. 1923. Fat-soluble vitamins. XV. Calcium and
phosphorus relations to growth and composition of blood and bone with varying vitamin
intake. J. Biol. Chem. 58:71-103.
Bird, H. R., and C. D. Caskey, Jr. 1943. Amorphus calcium metaphosphate as a phosphorus
supplement for chicks. Poult. Sci. 22:333-334.
Borges, F. M. O., M. A. O. Furtado, J. A. F. Veloso, and N. C. Baião. 1997. Disponibilidade do
fósforo de fontes inorgânicas para frangos de corte. Arq. Bras. Med. Vet. Zootec. 49:639-
647.
Brubacher, H. 1890. Ueber den Gelhalt an anorganishen Stoffen, besonders and Kalk, in den
Knochen und Organen normaler und rhachitisher kinder. Zeitschrift fur biologie. 27:517-
549.Z. Biol. Xxvii, 517.
Carré, B. 2002. Carbohydrate chemistry of the feedstuffs used for poultry. Pages 39-56 in
Poultry Feedstuffs: supply, composition, and nutritive value. J. M. McNab and K. N.
Boorman, eds. CABI, Oxon, UK.
Carré, B. 2004. Causes for variation in digestibility of starch among feedstuffs. World’s Poult.
Sci. J. 60:76-89.
Carver, J. S., and R. J. Evans. 1943. Phosphorus supplements in the chick starting mash. U. S.
Egg and Poult. Mag. 49:556-558, 564-565.
Choct, M., R. J. Hughes, J. Wang, M. R. Bedford, A. J. Morgan, and G. Annison. 1996.
Increased small intestinal fermentation is partly responsible for the antinutritive activity
of non-starch polysaccharides in chickens. Br. Poult. Sci. 37:609-621.
37
Classen, H. L., G. L. Campbell, B. G. Rossnagel, R. S. Bhatty, and R. D. Reichert. 1985. Studies
on the use of hulless barley in chick diets: deleterious effects and methods of alleviation.
Can. J. Anim. Sci. 65:725-733.
Classen, H. L.. 1996. Cereal grain starch and exogenous enzymes in poultry diets. Anim. Feed
Sci. Tech. 62:21-27.
Cook, R. H., and F. H. Bird. (1973). "Duodenal villus area and epithelial cellular migration in
conventional and germ-free chicks." Poult. Sci. 52: 2276-2280.
Creech, B. G., B. L. Reid, and J. R. Couch. 1956. Evaluation of a dicalcium phosphate
supplement as a source of phosphorus for chicks. Poult. Sci. 35:654-658.
Dale, N., and A. Batal. 2005. Ingredient analysis table. Feedstuffs. 75:16-17.
Davis A. J., N. M. Dale and F. J. Ferreira. 2003. Pearl millet as an alternative feed ingredient in
broiler diets. J. Appl. Poult. Res. 12:137-144.
De Groote, G., and G. Huyghebaert. 1997. The bioavailability of phosphorus from feed
phosphates for broilers as influenced by bio-assay method, dietary Ca-level and feed
form. Anim. Feed Sci. Technol. 69:329-340.
De Lange, C. F. M., W. B. Souffrant, and W. C. Sauer. 1990. Real ileal protein and amino acid
digestibilities in feedstuffs for growing pigs as determined with the 15N-isotope dilution
technique. J. Anim. Sci. 68:409-418.
Dibner, J. J., C. D. Knight, M. L. Kitchell, C. A. Atwell, A. C. Downs, and F. J. Ivey. Early
feeding and development of the immune system in neonatal poultry. J. Appl. Poult. Res.
7:425-436..
Dror, Y., I. Nir, and Z. Nitsan. 1977. The relative growth of internal organs in light and heavy
breeds. Br. Poult. Sci. 18:493-496.

38
Ejeta, G., M. M. Hassen, and E. T. Mertz. 1987. In vitro digestibility and AA composition of
pearl millet (Pennisetum typhoides) and other cereals. Proc. Natl. Acad. Sci. 84:6016-
6019.
Elkin, R. G., E. Arthur, B. R. Hamaker, J. D. Axtell, M. W. Douglas and C. M. Parsons. 2002.
Nutritional value of a highly digestible sorghum cultivar for meat-type chickens. J. Agric.
Food Chem. 50:4146-4150.
Englyst, H. N., S. M. Kingman, and J. H. Cummings. 1992. Classification and measurement of
nutritionally important starch fractions. European J. Clin. Nutr. 46:S33-S50 (Suppl. 2).
Evans, R. J. and J. S. Carver. 1944. The toe ash as a measure of calcification in chicks. Poult.
Sci. 23:351-352.
Evers, A. D., A. B. Blakeney, and L. O’Brien. 1999. Cereal structure and composition. Aust. J.
Agric. Res. 50:629-650.
Fengler, A. I., and R. R. Marquardt. 1988. Water-soluble pentosans from rye: II. Effects of rate
of dialysis on the retention of nutrients by the chick. Cereal Chem. 65:298-302.
Fremy, Edmond. 1855. Recherches chimiques sur les os, Annales de chim. Et de phys. 214 (43
of ser. 3), 47-109.
Fritz, J. C. and T. Roberts. 1968. Use of toe ash as a measure of calcification in the chick. J.
Assoc. Off. Anal. Chem. 51:519-594.
Gerry, R. W., C. W. Carrick, R. E. Roberts, and S. M. Hauge. 1947. Phosphate supplements of
different fluorine content as sources of phosphorus for chickens. Poult. Sci. 26:323-334.
Geyra, A. Z. Uni, and D. Sklan. 2001. Enterocyte dynamics and mucosal development in the
posthatch chick. Poult. Sci. 80:776-782.
39
Gillis, M. B., L. C. Norris, and G. F. Heuser. 1948. The utilization by the chick of phosphorus
from different sources. J. Nutr. 35:195-207.
Gillis, M. B., L. C. Norris, and G. F. Heuser. 1954. Studies on the biological value of inorganic
phosphates. J. Nutr. 54:115-125.
Green, S. 1987. Digestibilities of AAs in feedstuffs for poultry and pigs. Digestibility report
8/87, A. E. C. Rhone-Poulenc, Commentry, France, 34 pp.
Gyles, N. R. 1989. Poultry, people and progress. Poult. Sci. 68:1-8.
Harmon, B. G., M. A. Latour, and S. Norberg. 2001. Subject: The use of spray dried eggs, as an
ingredient for infantile pigs and broilers.
http://www.ansc.purdue.edu/swine/swineday/sday01/10.pdf. Accessed Dec. 2001.
Hart, E. B., H. Steenbock, S. Lepkovsky, and J. G. Halpin. 1923. The nutritional requirements of
baby chicks. III. The relation of light to the growth of the chicken. J. Biol. Chem. 58:33-
42.
Heartland Lysine. 1996. Digestibility of essential AAs for poultry and swine,
Version 3.3. (Heartland Lysine, Inc. : Chicago.)
Hesselman, K., K. Elwinger, and S. Tomke. 1982. Influence of increasing levels of β-glucanase
on the productive value of barley diets for broiler chickens. Anim. Feed. Sci. Technol.
7:351-358.
Hetland, H., M. Choct, and B. Svihus. 2004. Role of insoluble non-starch polysaccharides in
poultry nutrition. Wolrd’s Poult. Sci. J. 415-422.
Heuser, G. F. and L. C. Norris. 1926a. Rickets in chicks. I. Variations in the antirachitic potency
of different brands of cod liver oil. Poult. Sci. 6:9-17.

40
Heuser, G. F. and L. C. Norris. 1926b. Rickets in chicks. II. Variations in the antirachitic potency
of different grades of cod liver oil. Poult. Sci. 6:94-98.
Heuser, G. F., and L. C. Norris. 1928. Rickets in chicks. III. The effectiveness of mid-summer
sunshine and irradiation from a quartz mercury vapor arc in preventing rickets in chicks.
Poult. Sci. 8:89-98.
Hofshagen, M., and M. Kaldhushal. 1992. Barley inclusion and avoparcin supplementation in
broiler diets. I. Effect on small intestinal bacteria and performance. Poult. Sci. 71:959-
969.
Huang. K. H., V. Ravindran, X. Li, and W. L. Bryden. 2005. Influence of age on the apparent
ileal AA digestibility of feed ingredients for broiler chickens. Br. Poult. Sci. 46:236-245.
Huff, W. E. 1980. Discrepancies between bone ash and toe ash during aflatoxicosis. Poult. Sci.
59:2213-2215.
Iji, P. A. 1999. The impact of cereal non-starch polysaccharides on intestinal development and
function in broiler chickens. World’s Poult. Sci. J. 55:374-387.
Iji, P. A., A. A. Saki, and D. R. Tivey. 2001. Intestinal development and body growth of broiler
chicks on diets supplemented with non-starch plysaccharides. Anim. Feed Sci. Technol.
89:175-188.
Ikeno, T., and K. Ikeno. 1991. Amylase activity increases in the yolk of fertilized eggs during
incubation in chickens. Poult. Sci. 70:2176-2179.
Jamroz, D., K. Jacobsen, K. E. Cach Knudsen, A. Wilczkiewicz, and J. Orda. 2002. Digestibiligy
and energy value of the non-starch polysaccharides in young chickens, ducks and geese,
fed diets containing high amounts of barley. Comp. Bioch. Physiol.: A. 131:657-668.

41
Jin, S. H., A. Corless, and J. L. Sell. 1998. Digestive development in post-hatch poultry. World’s
Poult. Sci. 54:335-345.
Johnson D. W., and S. Kikuchi. 1989. Processing for producing soy protein isolates. Pages 66-77
in Proceedings of the World Congress on Vegetable Protein Utilization in Human Foods
and Animal Feedstuffs. American Oil Chemists Society, Champaign, IL.
Józefiak, D., A. Rutkowski, S. A. Martin. 2004. Carbohydrate fermentation in the avian ceca: a
review. Anim. Feed. Sci. Technol. 113:1-15.
Junqueira O. M., L. F. Araujo, C. S. S. Araujo, D. E. Faria, A. C. Laurentiz, and F. Dahlke. 2001.
Desempenho de frangos de corte alimentados com ovo em pó. Rev. Bras. Ciencia
Avicola. 3:65-73.
Kadim, I. T., P. J. Mougham, V. Ravindran. 2002. Ileal AA digestibility assay for the growing
meat chicken-comparison of ileal and excreta AA digestibility in the chicken. Br. Poult.
Sci. 44:588-597.
King, D. E., E. K. Asem, and O. Adeola. 2000. Ontogenic development of intestinal digestive
functions in White Pekin ducks. J. Nutr. 130:57-62.
Klein, M., M. Neubert, L. Hoffmann, W. Jentsch, M. Beyer, H. Scholze, and S. Kuhla. 2001.
Energy metabolism of cocks and broiler chickens fed on diets with different carbohydrate
sources. Arch. Anim. Nutr. 55:207-220.
Kocher, A., M. Choct, M. D. Porter, and J. Broz. 2002. Effects of feed enzymes on nutritive
value of soyabean meal fed to broilers. Br. Poult. Sci. 43:54-63.
Lambson, R. O. 1970. An electron microscopic study of the entodermal cells of the yolk sac of
the chick during incubation and after hatching. Am. J. Anatomy. 129:1-20.

42
Langhout, D. J., J. B. Schutte, P. Van Leeuwen, J. Wiebenga, and S. Tamminga. 1999. Effect of
dietary high- and low-methylated citrus pectin on the activity of the ileal microflora and
morphology of the small intestinal wall of broiler chicks. Br. Poult. Sci. 40:340-347.
Lee A. 1984. Neglected niches. The microbial ecology of the gastrointestinal tract. Pages 115-
162 in: Advances in microbial ecology. K. C. Marshal, ed. Vol. 8. Plenum Press, New
York.
Lesson, S., and J. D. Summers. 2001. Scott’s nutrition of the chicken. 4th ed. University books,
Guelph, Ontario, Canada.
Lemme, A., V. Ravindran, and W. L. Bryden. 2004. Ileal digestibility of AAs in feed ingredients
for broilers. World’s Poult. Sci. 60:423-437.
Likuski, H. J. A., and H. G. Dorrell. (1978). A bioassay for rapid determination of AA
availability values. Poult. Sci. 57:1658-1660.
Lilburn M. S. 1998. Practical aspects of early nutrition for poultry. J. Appl. Poult. Res. 7:420-
424.
Longo, F. A., J. F. M. Menten, A. A. Pedroso, A. Nogueira, A. M. C. Racanicci, J. B. Gaiotto,
and J. O. Berti. 2005a. Carboidratos na dieta pré-inicial de frangos de corte. Rev. Bras.
Zootec. 34:123-133.
Longo, F. A., J. F. M. Menten, A. A. Pedroso, A. Nogueira, A. M. C. Racanicci, J. B. Gaiotto,
and J. O. Berti. 2005b. Diferentes fontes de proteina na dieta pré-inicial de frangos de
corte. Rev. Bras. Zootec. 34:112-122.
Marchaim, U., and R. G. Kulka. 1967. The non-parallel increase of amylase, chymotrypsinogen
and procarboxypeptidase in the developing chick pancreas. Biochimia Biophysica Acta
146:553-559.
43
Mathur, C. R., C. V. Reddy, S. M. Siddique, and M. S. Reddy. 1976. Effect of feeding high
protein pre-starter ration on the performance of broilers. Indian Vet. J. 53:601-605.
Matterson, L. D., E. P. Singsen, and H. M. Scott. 1945. Rock phosphates as phosphorus
supplements for the growing chick. Poult. Sci. 24:188-190.
McCrudden, F. H. 1910. Studies of bone metabolism, especially the pathological process,
etiology and treatment of osteomalacia. Arch. Internal Medicine. 5:596-630.
Méndez, A., and N. Dale. 1998. Foot ash as a parameter to assay bone mineralization. Poult. Sci.
77 (Suppl. 1) 40 (Abstract).
Miller, M. W. and V. V. Joukovsky. 1953. Availability of phosphorus from various phosphate
materials for chicks. Poult. Sci. 32:78-81.
Moran, E. T. 1982. Starch digestion in fowl. Poult. Sci. 61:1257-1267.
Motzok, I., D. Arthur, and H. D. Branion. 1956. Utilization of phosphorus from various
phosphate supplements by chicks. Poult. Sci. 35:627-648.
Moughan, P. J., A. J. Darragh, W. C. Smith, and C. A. Butts. 1990. Perchloric and trichloroacetic
acids as precipitants of protein in endogenous ileal digesta from the rat. J. Sci. Food
Agric. 52:13-21.
Murakami, H., M. Horiguchi, and Y. Akiba. 1992. Growth and utilization of nutriments in
newly-hatched chicks with or without removal of residual yolk. Growth Dev. Aging.
56:75-84.
Nascimento, A. H., J. H. Vilar Da Silva, L. F. Teixeira, R. C. Runho, and P. C. Pozza. 2004.
Energia metabolizável e relação enegía:proteína bruta nas fases pré-inicial e inicial de
frangos de corte. Rev. Bras. Zootec. 33:911-918.

44
National Research Council. 1994. Nutrient requirements of poultry. 9th rev. ed. National
Academy Press, Washington, DC.
Nelson, T. S., and A. C. Walker. 1964. The biological evaluation of phosphorus compounds.
Poult. Sci. 43:94-98.
Nelson, T. S., L. K. Kirby, and Z. B. Johnson. 1990. The relative biological value of feed
phosphates for chicks. Poult. Sci. 69:113-118.
Nitsan, Z., E. A. Dunnington, and P. B. Siegel. 1991. Organ growth and digestive enzyme levels
to fifteen days of age in lines of chickens differing in body weight. Poult. Sci. 70: 2040-
2048.
Noy, Y., and D. Sklan. 1995. Digestion and absorption in the young chick. Poult. Sci. 74:366-
376.
Noy, Y., and D. Sklan. 1998a. Yolk utilization in the newly hatched poult. Br. Poult. Sci. 446-
451.
Noy, Y., and D. Sklan. 1998b. Metabolic responses to early feeding. J. Appl. Poult. Res. 7:437-
451.
Noy, Y., and D. Sklan. 1999. Different types of early feeding and performance in chicks and
poults. J. Appl. Poult. Res. 8:16-24.
Noy, Y., A. Geyra, and D. Sklan. 2001. The effect of early feeding on growth and small
intestinal development in the posthatch poult. Poult. Sci. 80:912-919.
Noy, Y., and D. Sklan. 2001. Yolk and exogenous feed utilization in the posthatch chick. Poult.
Sci. 80:1490-1495.
O’Dell, B. L., W. D. Woods, O. A. Laerdal, A. M. Jeffay, and J. E. Savage. 1960. Distribution of
the major nitrogenous compounds and AAs in chicken urine. Poult. Sci. 39:426-432.

45
Onyango, E. M., P. Y. Hester, R. Stroshine, and O. Adeola. 2003. Bone densitometry as an
indicator of percentage tibia ash in broiler chicks fed varying dietary calcium and
phosphorus levels. Poult. Sci. 82:1787-1791.
Obst, B. S. and J. Diamond. 1992. Ontogeny of intestinal nutrient transport in domestic chickens
(Gallus-gallus) and its relation to growth. AUK. 109:451-464.
Parsons, C. M. 1986. Determination of digestible and available AAs in meat meal using
conventional and caecectomized cockerels or chick growth assays. Br. J. Nutr. 56:227-
240.
Parsons, C. M. 1991. AA digestibilities for poultry: Feedstuff evaluation and requirements.
Kyowa Hakko Technical Review-1. (Kyowa:Chesterfield, MO) 15 pp.
Parsons, C. M. 2002. Digestibility and bioavailability of protein and AAs. Pages 115-135 in
Poultry Feedstuffs: supply, composition, and nutritive value. J. M. McNab and K. N.
Boorman, eds. CABI, Oxon, UK.
Payne, W. L., G. F. Combs, R. R. Kiefer, and D. G. Snider. 1968. Investigation of protein
quality-ileal recovery of AAs. Federation Proceedings. 27:1199-1203.
Peeler, H. T. 1972. Biological availability of nutrients in feeds: Availability of major minerals. J.
Anim. Sci. 35:695-712.
Potchanakorn, M., and L. M. Potter. 1987. Biological values of phosphorus from various sources
for young turkeys. Poult. Sci. 66:505-513.
Potter, L. M. 1988. Bioavailability of phosphorus from various phosphates based on body weight
and toe ash measurements. Poult. Sci. 67:96-102.

46
Potter, L. M., M. Potchanakorn, V. Ravindran, and E. T. Kornegay. 1995. Bioavailability of
phosphorus in various phosphate sources using body weight and toe ash as response
criteria. Poult. Sci. 74:813-820.
Rakowska, M., B. Rek-Cieply, E. Lipinska, T. Kubinski, I. Barcz, and B. Afanasjew. 1993. The
effect of rye, probiotics and nisin on faecal flora and histology of the small intestine of
chicks. J. Anim. Feed Sci. 2:73-81.
Rao, S. K., M. S. West, T. J. Frost, J. I. Orban, M. M. Bryant, and D. A. Roland, SR. 1993.
Sample size required for various methods of assessing bone status in commercial
Leghorn hens. Poult. Sci. 72:229-235.
Rao, S. K., D. A. Roland Sr., and R. W. Gordon. 1995. A method to determine and factors that
influence in vivo solubilization of phosphates in commercial Leghorn hens. Poult. Sci.
74:1644-1649.
Ravindran V., E. T. Kornegay, L. M. Potter, B. O. Ogunabameru, M. K. Welten, J. H. Wilson,
and M. Potchanakorn. 1995. An evaluation of various response criteria in assessing
biological availability of phosphorus for broilers. Poult. Sci. 74:1820-1830.
Ravindran, V. and W. L. Bryden. 1999. Amino acid availability in poultry-in vitro and in vivo
measurements. Aust. J. Agric. Res. 50:889-908.
Ravindran, V., L. I. Hew, G. Ravindran, and W. L. Bryden. 1999. A comparison of ileal digesta
and excreta analysis for the determination of AA digestibility in food ingredients for
poultry. Br. Poult. Sci. 40:266-274.
Read, N. W. 1987. Viscosity of food gums determined in vitro related to their hypoglycemic
actions. Am. J. Clin. Nutr. 46:72-77.
47
Rhone-Poulenc. 1993. Rhodimet nutrition guide. 2nd ed. (Rhone-Poulenc Animal
nutrition:Antony, France.)
Rhone-Poulenc. 1995. Digestibility database for poultry. (Rhone-Poulenc Animal
Nutrition: Antony, France.)
Rocha, P. T., J. H. Stringhini, M. A. Andrade, N. S. Mogyca, M. L. Andrade, M. B. Café. 2003.
Desempenho de frangos e corte alimentados com raçoes pré-iniciais contendo
differentes niveis de proteina bruta e energia metabolizável. Rev. Bras. Zootec. 32:162-
170.
Rooney L. W. 1978. Sorghum and pearl millet lipids. Cereal Chem. 55:584-590.
Rostagno, H. S., J. M. R. Pupa, and M. Pack. 1995. Diet formulation for broilers based on total
versus digestible AAs. J. Appl. Poult. Res. 4:293-299.
Sahoo, G. S., and B. S. Rao. 1974. Role of pre-starter and starter rations in broilers. The Indian J.
Nutr. Dietet. 11:169-177.
Saxena, A. K., and K. S. Singh. 1976. Effect of pre-starter diets on performance of broiler
chicks. Indian J. Poult. Sci. 11:132-138.
Sell, J. L., C. R. Ange., F. J. Piquer, E. G. Mallarino, and H. A. Al-Batshan. 1991. Development
patterns of selected characteristics of the gastrointestinal tract of young turkeys. Poult.
Sci. 70:1200-1205.
Sharma, B. D., V. R. Sadagopan, and V. R. Reddy. 1979. Utilization of different cereals in
broiler diets. Br. Poult. Sci. 20:371-378.
Sibbald, I. R. 1979. A bioassay for available AAs and true metabolizable energy in feedingstuffs.
Poult Sci. 58:668-675.
48
Sibbald, I. R. 1987. Estimation of bioavailable amino acids in feedingstuffs for poultry and pigs:
A review with emphasis on balance experiments. Can. J. Anim. Sci. 67:221-300.
Simon, O., T. Zebrowska, H. Bergner, and R. Munohmeyer. 1983. Investigations on the
pancreatic and stomach secretion in pigs by means of continuous infusion of 14C AAs.
Arch. Anim. Nutr. 33:9-12.
Singh, P., U. Singh, B. O. Eggum, K. A. Kumar, and D. J. Andrews. 1987. Nutritional evaluation
of high protein genotypes of pearl millet (Pennisetum americanum (L) Leeke). J. Sci.
Food Agric. 38:41-48.
Singh D. 2004. Subject: Evaluation of new millet varieties as poultry feed ingredient.
http://www.rirdc.gov.au/reports/CME/04-173.pdf. Accessed Dec. 2004.
Sklan, D. 2001. Development of the digestive tract in poultry. World’s Poult. Sci. J. 57:415-428.
Sklan D., and Y. Noy. 2003. Crude protein and essential AA requirements in chicks during the
first week posthatch. Br. Poult. Sci. 44:266-274.
Sklan, D., A. Geyra, E. Tako, O. Gal-Gerber, and Z. Uni. 2003. Ontogeny of brush border
carbohydrate digestion and uptake in the chick. Br. J. Nutr. 89:747-753.
Smith, H. J. 1956. History and development of feed phosphates. In “50 years of mineral
nutrition”. IMC Feed ingredients. CD-ROM, 2003.
Smith R. L., L. S. Jensen, C. S. Hoveland, and W. W. Hanna. 1989. Use of pearl millet,
sorghum, and triticale grain in broiler diets. J. Prod. Agric. 2:78-82.
Smits, C. H. M., and Annison, G. 1996. Non-starch plant polysaccharides in broiler nutrition-
towards a physiologically valid approach to their determination. World’s Poult. Sci. J.
52:203-221.

49
Smits C.H.M., A. Veldman, M. W.A.Verstegen and A. C. Beynen. 1997. Dietary
carboxymethylcellulose with high instead of low viscosity reduces macronutrient
digestion in broiler birds. J. Nutr. 127:483-487.
Smits, C. H. M., A. Veldman, H. J. Verkade, and A. C. Beynen. 1998. The inhibitory effect of
carboxymethylcellulose with high viscosity on lipid absorption in broiler chickens
coincides with reduced bile salt concentration and raised microbial numbers in the small
intestine. Poult. Sci. 77:1534-1539.
Smulikowska, S., A. Mieczkowska, C. V. Nguyen, and M. Babelewska. 2002. The influence of
digesta viscosity on the development of the stomach, on in vitro small intestine motility
and on digestion of nutrients in broiler chickens. J. Anim. Feed Sci. 11:683-694.
Stringhini, J. H., A. di Resende, M. B. Café, N. S. Mogyca, M. A. Andrade. 2003. Efeito do peso
inicial dos pintos e do periodo da dieta pré-inicial sobre o desempenho de frangos de
corte. R. Bras. Zootec. 32:353-360.
Sulistiyanto, B., Y. Akiba, and K. Sato. 1999. Energy utilization of carbohydrate, fat and protein
sources in newly hatched broiler chicks. Br. Poult. Sci. 40:653-659.
Sullivan, T. W. 1966. A triple response method for determining biological value of phosphorus
sources with young turkeys. Poult. Sci. 45:1236-1245.
Sullivan, T. W., J. H. Douglas, N. J. Gonzalez, and P. L. Bond, Jr. 1992. Correlation of
biological value of feed phosphates with their solubility in water, dilute hydrogen
chloride, dilute citric acid, and neutral ammonium citrate. Poult. Sci. 71:2065-2074.
Tarvid, I. 1995. The development of protein digestion in poultry. Poult. Avian Biol. Rev. 6:35-
54.
50
Thompson, D. J. 1970. What are feed phosphates? Technical release. In “50 years of mineral
nutrition”. IMC Feed ingredients. CD-ROM, 2003.
Uni, Z., Y. Noy, and D. Sklan. 1995. Posthatch Changes in Morphology and Function of the
Small-Intestines in Heavy-Strain and Light-Strain Chicks." Poult. Sci. 74:1622-1629.
Uni, Z. 1999. Functional development of the small intestine in domestic birds: Cellular and
molecular aspects. Poult. and Avian Biol. Rev. 10:167-179.
Uni, Z., E. Tako, O. Gal-Garber, and D. Sklan. 2003. Morphological, molecular, and functional
changes in the chicken small intestine of the late-term embryo. 82:1747-1754.
Uni, Z., and R. P. Ferket. 2004. Methods for early nutrition and their potential. World’s Poult.
Sci. J. 60: 101-111.
Van Dijk, A. J., H. Everts, M. J. A. Nabuurs, R. J. C. F. Margry, and A. C. Beynen. 2001.
Growth performance of weanling pigs fed spray-dried animal plasma: a review.
Livestock production Science 68:263-274.
Vieira, S. L., and E. T. Moran. 1999. Effect of egg of origin and chick post-hatch nutrition on
broiler live performance and meat yields. World’s Poult. Sci. J. 55:125-142.
Wagner, D. D., and O. P. Thomas. 1978. Influence of diets containing rye or pectin on the
intestinal flora of chicks. Poult. Sci. 57:971-975.
Waibel, P. E., N. A. Nahorniak, H. E. Dzuik, M. M. Walser, and W. G. Olson. 1984.
Bioavailability of phosphorus in commercial phosphate supplements for turkeys. Poult.
Sci. 63:730-737.
Ward, A. T., and R. R. Marquardt. 1987. Anti-nutritional activity of a water-soluble pentosan-
rich fraction from rye grain. Poult. Sci. 66:1665-1674.

51
Weurding, R. E., A. Veldman, W. A. G. Veen, P. J. van der Aar, and M. W. A. Verstegen. 2001.
Starch digestion rate in the small intestine of broiler chickens differs among feedstuffs. J.
Nutr. 131:2329-2335.
Wheeler, W. P. 1903. The importance of mineral matter and the value of grit for chicks. New
York Agr. Exp. Sta. Bull. 242.
White, W. B., H. R. Bird, M. L. Sunde, and J. A. Marlett. 1983. Viscosity of the beta-D-glucan
as a factor in the enzymatic improvement of barley for chicks. Poult. Sci. 62:853-862.
Wilson, J. 2005. Personal communication.
Yan, F., C. A. Keen, K. Y. Zhang, and P. W. Waldroup. 2005. Comparison of methods to
evaluate bone mineralization. J. Appl. Poult. Res. 14:492-498.
Yoshida, M. and H. Hoshii, 1983. Relationship between ash contents of the tibia bone and the
toe of chicks. Jpn. Poult. Sci. 20:51-54.
Zebrowska, T., R. Munchmeyer, H. Bergner, and O. Simon. 1986. Studies on the secretion of
AAs and urea into the gastrointestinal tract of pigs. 2. Net secretion of leucine into the
small and large intestines. Arch. Anim. Nutr. 36:17-24.

52
CHAPTER 2
EVALUATION OF PEARL MILLET FOR PRE-STARTER AND STARTER BROILER
DIETS1
1 A. R. Garcia, A. B. Batal, and N. M. Dale. To be submitted to the Journal of Applied Poultry Science.

53
SUMMARY
Three experiments were conducted to investigate the use of pearl millet (PM) as a grain
source for broiler pre-starter (from 1 to 4 or 7 d of age) and starter diets (from 8 to 14 or 21 d of
age). In all the studies, the three grains were incorporated into isocaloric, isonitrogenous diets,
low in energy such that it might be a limiting factor for optimum performance. In all rations,
soybean meal was the principal protein source. Additionally, a dextrose-soybean meal diet
served as a highly absorbable carbohydrate control. Body weight gain (BWG) and gain to feed
(GF) ratio were calculated at 4, 7, and 14 d of age in Experiment 1 and 3, and at 7, 14 and 21 d in
Experiment 2. Additionally, intestinal viscosity, cecal general aerobes, enterobacteria and lactic
acid bacteria were measured at 4 and 14 d of age in Experiment 1 and 4 and 21 d of age in
Experiment 2. To confirm and extend the results of Experiments 1 and 2, the relative weight of
yolk sacs at 4 d and gizzard at 4 and 14 d of age were determined in addition to BWG and GF
ratio in Experiment 3. Consistently greater BWG at 4, 7, and 14 d was observed in the chicks fed
the PM diet compared to those fed the corn diet (P<0.05), but not sorghum. Intestinal viscosity
was not consistently affected by grain source, but was significantly higher in the dextrose-soy
treatments. No differences among treatments were observed in the cecal bacterial counts
(P>0.05) or in relative yolk sac or gizzard weights. Pearl millet proved to be an excellent grain
for pre-starter diets for broilers, possibly superior to corn and grain sorghum. However, it
remains unclear as to why this effect was observed, as it was not related to a decreased intestinal
viscosity, proliferation of beneficial bacteria, more rapid yolk sac absorption or increased gizzard
activity during the first wk of life.
(Key words: Pearl millet, pre-starter diet, broiler chicks)

54
DESCRIPTION OF PROBLEM
Nutrition of the broiler chicken during the first wk posthatch is of increasing interest to
poultry nutritionists. As broiler growth rate has increased dramatically during the past decades,
the first 7 d represent about 17% of the total life of a six wk broiler [1]. A number of studies have
demonstrated that the digestive system of a broiler chick is immature during this stage. Several
events such as digestive enzymatic activity [2, 3, 4] nutrient uptake [5], utilization of nitrogen
[3], AAs and energy [6] have been shown to increase with age. As a strategy to enhance growth
during the first wk posthatch, more specialized diets for broiler chicks have been incorporated.
Usually the early enhancement of body weight is maintained through market age [7, 8]. A
significant potential exists for dietary modifications to address the chick’s digestive limitations at
an early age and thereby improve growth through use of a pre-starter diet to be fed during the
first 4 or 7 d posthatch. This approach has been used for some time by swine nutritionists and is
based on the principle of providing highly digestible feed ingredients to the weanling pig with a
nutrient composition approximating that of sow’s milk. A further objective of prestarter diets is
to maximize the utilization of nutrients by the immature digestive system. [9].
In virtually all poultry feeds grain is the major component. Due to its attractive
nutritional profile, availability and price, corn is the principal grain used by the U.S. poultry
industry. However, in countries where corn is not readily available for animal feeding, and in
some regions of the US, low tannin sorghum is a satisfactory alternative. Growth performance
of animals fed sorghum -based diets can be equivalent to that of animals fed corn-based diets
[10], although sorghum is generally recognized as being somewhat lower than corn in ME and
protein digestibility [11]. On the other hand, the use of pearl millet (PM) has attracted the interest
of nutritionists and producers for several reasons, such as its drought tolerance, low nutrient

55
needs, and its short growing season [12, 13]. Some nutritional characteristics observed in PM
include a higher energy density than yellow corn, in part from higher oil content and frequently
lower moisture [14], and a superior AA profile [13]. Studies have reported that performance of
poultry fed PM diets [15, 16, 17] is similar to that obtained with corn diets, thus establishing a
potential role for PM in broiler diets. However, most studies conducted to date have evaluated
PM as a feed ingredient for older chickens, without considering the changes occurring in the
digestive system of a chick during the first wk posthatch.
The nutritional value of corn, sorghum and PM has been generally assumed to be the
same for the young chick as for older birds. Corn and sorghum have been shown to have starch
digestibilities greater than 97% [18], and low contents of non-starch polysaccharides (NSP) [19].
By contrast, high levels of NSP have been implicated in increased intestinal viscosity [20, 21],
and have a negative impact on nutrient absorption. Furthermore, high levels of NSP may favor
the proliferation of certain bacterial populations associated with growth depression [20, 22, 23].
To date, little research has been conducted to determine whether PM is a suitable or possibly
superior grain for broiler pre-starter diets. Therefore, the objective of the present studies was to
compare PM to corn and sorghum in broiler pre-starter and starter diets for its relative effects on
growth performance, intestinal viscosity, and bacterial populations in the ceca during the pre-
starter and starter periods.
MATERIALS AND METHODS
General procedures
Three experiments were conducted to compare PM to yellow corn and grain sorghum as
grain sources for young broilers. In each experiment, one-d-old, straight-run, broiler chickens

56
(Cobb 500), obtained from a commercial hatchery, were allocated to pens in battery brooders1
with raised wire floors in an environmentally controlled room. The birds were randomly assigned
to four dietary treatments, consisting of diets formulated with commodity yellow corn, low
tannin-sorghum (Pioneer 1083 G66) or PM (TifGrain 102) as the grain source. A fourth
treatment was included in Experiments 1 and 2, in which the grain source was replaced with
dextrose (DX) as a highly absorbable carbohydrate control. Each treatment consisted of seven
replicate pens of ten chicks in Experiment 1 and eight pens in Experiments 2 and 3. Body weight
gain (BWG) and feed efficiency (gain:feed ratio) were calculated and adjusted for mortality at 4,
7 and 14 d in Experiments 1 and 3 and also at 21 d in Experiment 2. Samples of small intestine
and cecal contents were collected at 4 and 14 d of age in Experiment 1, and at 4 and 21 d of age
in Experiment 2 for the determination of intestinal viscosity and cecal bacterial profile. In
Experiment 3, samples of yolk sac at 4 d and gizzard at 4 and 14 d of age were collected for
determination of relative weights.
Diets
Diet composition is shown in Tables 1 and 2. In all experiments, dietary treatments
consisted of low-energy diets (2,900 kcal ME/kg for Experiment 1 and 2,825 kcal ME/kg for
Experiments 2 and 3, respectively) that met or exceeded the NRC [24] nutrient
recommendations. Metabolizable energy levels were kept lower than the NRC [24]
recommendations as this factor might prove limiting for optimum performance, and thus serve to
differentiate the contribution of the different grains. Diets were formulated to be isocaloric and
isonitrogenous, varying principally in grain source. Solka-floc2 was added as an inert filler to
keep inclusion of poultry fat constant while maintaining the same ME levels. In Experiments 1
1Petersime Incubator Co., Geltysburg, OH 45328 2Fiber Sales and Development Corp., Urbana , OH
57
and 3, the experimental diets were fed ad libitum from 1 to 14 d, whereas in Experiment 2 the
diets were fed ad libitum from 1 to 21 d of age so as to observe effects at the end of the
traditional starter period.
Intestinal viscosity and cecal bacteriology measurements
For determination of intestinal viscosity in Experiments 1 and 2, three birds were
randomly selected from each pen at 4 and 14 or 21 d of age, euthanized by CO2 asphyxiation and
dissected to expose the intestinal tract. Contents of the small intestine from the end of the
duodenal loop to the ileocecal junction were collected, pooled in a test tube and kept on ice until
the analysis. Tubes were centrifuged at 3000 rpm for 15 min, and viscosity determined in 1 ml of
supernatant in a Brookfield LVDV-II+P viscometer with a CPE-40 cone spindle3, at 40 C and 60
rpm [21].
The ceca of three birds per pen were aseptically removed, placed in sterile plastic bags
and weighed. Ten milliliters of sterile 0.1% peptone water per pair of ceca were added to each
bag containing three pairs of ceca (30 ml per bag), and the contents were blended in a Stomacher
Lab-Blender4 for 1 min. Ten-fold serial dilutions of this fluid were made in 0.1% peptone water
and plated on nutrient agar5, violet red bile glucose agar3 and lactic acid bacteria agar [25] for
quantification of general aerobes, enterobacteria and lactic acid bacteria, respectively, as
described by Hinton et al. [26]. Data is reported as colony forming units (CFU) per gram of ceca.
In Experiment 3, four birds per pen were randomly selected at 4 and 14 d of age,
euthanized by CO2 asphyxiation and opened to expose the intestinal tract. At 4 d, the remaining
yolk sac and the gizzard (after removal of adhering feed residues) were removed and weighed.
3 Brockfield Engineering Laboratories, Stoughton, MA, USA. 4 Seward Medical LTD., London SE1 1PP UK. 5 Fisher Scientific Company, Suwanee, GA 30024

58
At 14 d of age only the gizzard was collected and weighed. Organ weights are reported as
percents of body weight (grams per 100 grams of body weight).
Statistical analysis
Data of growth performance, intestinal viscosity, cecal bacteria counts after log
transformation, and yolk sac and gizzard relative weights were analyzed with the General Linear
Model procedure of SAS®. When significant differences were found (P < 0.05), treatment means
were compared by the Tukey’s multiple comparison procedure of SAS® [27].
RESULTS
Growth performance
Results of growth performance from Experiments 1, 2 and 3 are shown in Tables 3, 4 and
5, respectively. In Experiment 1, chicks fed the PM based diets gained numerically more weight
at 4 d, and significantly (P < 0.05) more at 7 and 14 d, than those fed corn or sorghum based
diets. In subsequent studies, chicks fed PM diets almost invariably gained more weight than
with either of the other grains, although this was not significant. The DX diet (positive control)
supported performance equal to (Experiment 1) or greater than (Experiment 2) the PM groups.
Without exception, at both 4 and 7 d of age, the chickens fed the PM diets had numerically
greater BWG than the other grain treatments. These ages (1 to 4 and 1 to 7 d) correspond to pre-
starter periods for broiler chicks.
Feed efficiencies (gain:feed) generally reflected the weight gain results discussed above.
Significant improvements were noted for the PM treatment in Experiment 1, while a consistent
trend was more difficult to detect in the latter two studies. In no case, however, were the PM fed
birds found to be significantly less efficient at converting feed to body gain than were chicks fed
the other grains.

59
Intestinal viscosity
In Experiment 1, no significant differences were observed in intestinal viscosity between
treatments (Table 6) at 4 d of age. At 14 d of age, the highest largest viscosity was found in birds
fed the DX diet (2.33 centipoises: cP). The viscosity of the birds fed the PM was not
significantly different from those fed the corn diet (1.86 and 1.84 cP, respectively). Chicks
receiving the sorghum based feed had the lowest intestinal viscosity value (1.63 cP).
In Experiment 2, at 4 d of age the highest viscosity value was again highest in the birds
fed the DX diet (3.0 cP). No significant difference was observed between viscosities of the corn
and PM diets (2.6 and 2.5 cP, respectively), while the lowest value was observed in the chickens
fed the sorghum diet (2.0 cP). At 21 d of age, the viscosity of birds fed PM (2.3 cP) was not
different from that of the birds receiving DX and corn (2.3 cP for both). The chickens fed the
sorghum diet had again the lowest value (1.90 cP).
Cecal Bacterial Populations
In Experiment 1, no significant differences (P < 0.05) between dietary treatments were
observed in lactic acid bacteria, enterobacteria or general aerobes at 14 d of age (Table 6).
Similarly, in Experiment 2 (Table 7), no significant differences in the CFU/g of ceca were
observed at 4 d of age. At 21 d of age, however, birds fed PM had significantly higher counts of
enterobacteria than those fed sorghum or DX (8.09, 6.56 and 6.87 CFU/g ceca for PM, sorghum
and DX, respectively). Counts of enterobacteria of the chickens fed the corn based diet (7.23
CFU/g ceca) were not statistically different from those fed PM.
Organ weight
The relative weights of the yolk sac at 4 d and gizzard at 4 and 14 d of age (Table 8) were
not significantly different between treatments (P > 0.05).

60
DISCUSSION
The results from these studies indicated that very young chickens fed diets based on PM
had generally superior weight gains at 4 and 7 d of age with respect to corn or sorghum, and the
effect was maintained until 14 or 21 d of age. Pearl millet has recently been evaluated as a feed
ingredient for broiler chickens [17] where it was incorporated in broiler starter diets from 2 to 16
d of age. Growth performance was at least as good as that of chicks fed a corn-soybean meal
diet. The positive results of the current studies are probably due to a more advantageous nutrient
profile possibly for early chick performance than that of either corn or sorghum. Several reports
have shown that AA and protein levels [28, 29], oil content and consequently metabolizable
energy [13, 14] are higher in PM. In addition to greater concentrations of protein and AAs,
digestibility coefficients of lysine, threonine and cystine in some varieties of PM have been
found higher than in sorghum [30].
In agreement with previous studies [6], the greatest growth performance was observed in
chicks fed the positive control DX diet, presumably because DX is a readily digestible
carbohydrate. Its absorption is thus expected to be more efficient. Surprisingly, the greatest
intestinal viscosity was observed in the chickens receiving this diet. Because DX contains no
protein, the level of inclusion of soybean meal in that particular diet increased up to 47%, versus
less than 40% in the diets based on cereal grains. The presence of indigestible oligosaccharides
in soybean meal can be as high as 6%, with approximately 3% water soluble NSP [31]. Both
oligosaccharides and NSP are considered antinutritional and may increase the viscosity of the
intestinal contents and subsequently reduce nutrient absorption [21]. Consequently, a greater
content of NSP in the DX diet might have led to a higher intestinal viscosity. However, growth
performance was not impaired in chicks fed the DX diet. The viscosity values observed were
61
below the levels previously reported for intestinal contents of chickens fed grains high in NSP
such as wheat or rye [32]. It is well-known that the concentration of NSP in corn and sorghum
are not sufficiently high to create problems of intestinal viscosity [19]. For PM, the concentration
of NSP has not been determined, although according to the results of the present research, it does
not appear to present a problem, as the intestinal viscosity of young chicks fed this grain was not
greater than that of chickens fed a standard corn-soybean meal diet.
It is well recognized that diet composition influences the intestinal microflora [20, 22,
33]. Undigested carbohydrates can be broken down by cecal bacteria, and undergo fermentation
[23] which could favor the proliferation of certain bacterial populations [22]. Lactic acid bacteria
such as Lactobacilli are considered beneficial to the chicken’s intestinal tract, and may represent
about 25 % of the total bacteria in the ceca at 4 d of age [34]. In contrast, E. coli and Salmonella
sp., both enterobacteria (Family Enterobacteriaceae) [35], are well-known pathogens for
chickens [22] and at the same age may represent up to 40 and 15 % of the cecal population,
respectively [34]. In the present study, bacterial populations were not significantly affected by
the different grain sources fed, except for the enterobacteria counts in Experiment 2. These were
somewhat higher in the birds fed the PM diet, although performance was not affected.
Absorption of the yolk sac occurs at a faster rate in chicks that have early access to feed,
possibly because nutrients stimulate intestinal peristalsis and yolk utilization [36]. Gizzard
development is partially associated with feed particle size, since feeding coarsely ground feed or
whole grains increases gizzard relative weight [22]. In the present study, it was thought that the
differences observed in growth performance in the first two experiments could be associated
with feed particle size, since grinding PM through a 3 mm screen leaves a coarse feed. However,
relative weights of yolk sac and gizzard were not significantly different between treatments,

62
indicating that the growth performance differences observed were not due to a better yolk
utilization or gizzard activity.
CONCLUSIONS AND APPLICATIONS
1. Growth performance of very young broiler chicks fed pearl millet-based diets is at least
as good as that of chicks fed corn or sorghum-based diets during the pre-starter and
starter periods.
2. The effects of pearl millet-based diets on intestinal viscosity and bacterial populations in
the ceca are not different from those found when feeding corn or sorghum-based diets.
3. Pearl millet is a valuable alternative grain for broiler pre-starter and starter diets.

63
REFERENCES AND NOTES
1. Lilburn M. S. 1998. Practical aspects of early nutrition for poultry. J. Appl. Poult.
Res. 7:420-424.
2. Nitsan, Z., Ben-Avraham, Z. Zoref, and I. Nir. 1991. Growth and development of the
digestive organs and some enzymes in broiler chickens after hatching. Br. Poult. Sci. 32:515-
523.
3. Noy, Y., and D. Sklan. 1995. Digestion and absorption in the young chicks. Poult.
Sci. 74:366-373.
4. Dunnington, E. A., and P. B. Siegel. 1995. Enzyme activity and organ development
in newly hatched chicks selected for high or low eight-week body weights. Poultry Sci. 74:761-
770.
5. Noy, Y., and D. Sklan. 2001. Yolk and exogenous feed utilization in the posthatch
chick. Poult. Sci. 80:1490-1495.
6. Batal A. B., and C.M. Parsons. 2002. Effects of age on nutrient digestibility in chicks
fed different diets. Poult. Sci. 81:400-407.
7. Noy, Y., and D. Sklan. 1999. Different types of early feeding and performance in
chicks and poults. J. Appl. Poult. Res. 8:16-24.
8. Sklan D., Y. Noy, A. Hoyzman, and I. Rozenboim. 2000. Decreasing weight loss in
the hatchery by feeding chicks and poults in hatching trays. J. Appl. Poult. Res. 9:142-148.
9. Van Dijk, A. J., H. Everts, M. J. A. Nabuurs, R. J. C. F. Margry, and A. C. Beynen.
2001. Growth performance of weanling pigs fed spray-dried animal plasma: a review. Livestock
Production Science 68:263-274.

64
10. Gualtieri M. and S. Rapaccini. 1990. Sorghum grain in poultry feeding. World’s
Poult. Sci. J. 46:246-254.
11. Elkin, R. G., E. Arthur, B. R. Hamaker, J. D. Axtell, M. W. Douglas and C. M.
Parsons. 2002. Nutritional value of a highly digestible sorghum cultivar for meat-type chickens.
J. Agric. Food Chem. 50:4146-4150.
12. Hill G. M. and W. W. Hanna. 1990. Nutritive characteristics of pearl millet grain in
beef cattle diets. J. Anim. Sci. 68:2061-2066.
13. Adeola O., and J. C. Rogler. 1994. Pearl millet in diets of white Pekin ducks. Poult.
Sci. 73:425-435.
14. Rooney L. W. 1978. Sorghum and pearl millet lipids. Cereal Chem. 55:584-590.
15. Smith R. L., L. S. Jensen, C. S. Hoveland, and W. W. Hanna. 1989. Use of pearl
millet, sorghum, and triticale grain in broiler diets. J. Prod. Agric. 2:78-82.
16. Collins, V. P., A. H. Cantor, A. J. Pescatore, M. L. Straw, and M. J. Ford. 1994.
Evaluation of pearl millet as a feed ingredient for poultry. Poult. Sci. 73(Suppl. 1):34. (Abstr.)
17. Davis A. J., N. M. Dale and F. J. Ferreira. 2003. Pearl millet as an alternative feed
ingredient in broiler diets. J. Appl. Poult. Res. 12:137-144.
18. Weurding, R. E., A. Veldman, W. A. G. Veen, P. J. Van der Aar, and M. W. A.
Verstegen. 2001. Starch digestion rate in the small intestine of broiler chickens differs among
feedstuffs. J. Nutr. 131:2329-2335.
19. Gracia M.I., M.J. Araníbar, R. Lázaro, P. Medel and G.G. Mateos. 2003. α-
Amylase supplementation of broiler diets based on corn. Poult. Sci. 82:436-442.

65
20. Choct, M., R. J. Hughes, J. Wang, M. R. Bedford, A. J. Morgan, and G. Annison.
1996. Increased small intestinal fermentation is partly responsible for the antinutritive activity of
non-starch polysaccharides in chickens. Br. Poult. Sci. 37:609-621.
21. Smits C.H.M., A. Veldman, M. W.A.Verstegen and A. C. Beynen. 1997. Dietary
carboxymethylcellulose with high instead of low viscosity reduces macronutrient digestion in
broiler birds. J. Nutr. 127:483-487.
22. Engberg R. M., M. S. Hedemann and B. B. Jensen. 2002. The influence of grinding
and pelleting of feed on the microbial composition and activity in the digestive tract of broiler
chickens. Br. Poult. Sci. 44:569-579.
23. Jozefiak, D., A. Rutkowski, S. A. Martin. 2004. Carbohydrate fermentation in the
avian ceca: a review. Anim. Feed. Sci. Technol. 113:1-15.
24. National Research Council. 1994. Nutrient requirements of poultry. 9th rev. ed.
National Academy Press, Washington, DC.
25. Atlas, R. M. 1997. Handbook of microbiological media. 2nd. ed. CRC Press, New
York, NY.
26. Hinton A. Jr., R. J. Buhr and K. D. Ingram. 2000. Reduction of Salmonella in the
crop of broiler chickens subjected to feed withdrawal. Poult. Sci. 79:1566-1570.
27. SAS Institute Inc., 1990. SAS STAT User’s Guide Release 6.08. SAS Institute Inc.,
Cary NC.
28. Burton G. W., A. T. Wallace, and K. O. Rachie. 1972. Chemical composition and
nutritive value of pearl millet (Pennisetum typhoides (Burm.) Stapf and E.C. Hubbard) grain.
Crop Sci. 12:187-188.

66
29. Ejeta, G., M. M. Hassen, and E. T. Mertz. 1987. In vitro digestibility and AA
composition of pearl millet (Pennisetum typhoides) and other cereals. Proc. Natl. Acad. Sci.
84:6016-6019.
30. Singh D. 2004. Subject: Evaluation of new millet varieties as poultry feed
ingredient. http://www.rirdc.gov.au/reports/CME/04-173.pdf. Accessed Dec. 2004.
31. Kocher, A., M. Choct, M. D. Porter, and J. Broz. 2002. Effects of feed enzymes on
nutritive value of soybean meal fed to broilers. Br. Poult. Sci. 43:54-63.
32. Steenfeldt S., A. Mullertz, and J. F. Jensen. 1998. Enzyme supplementation of
wheat-based diets for broilers. 1. Effect on growth performance and intestinal viscosity. Anim.
Feed. Sci. Technol. 75:27-43.
33. Lee A. 1984. Neglected niches. The microbial ecology of the gastrointestinal tract.
Pages 115-162 in: Advances in microbial ecology. K. C. Marshal, ed. Vol. 8. Plenum Press,
New York.
34. Amit-Romach E., D. Sklan, and Z. Uni. 2004. Microflora ecology of the chicken
intestine using the 16S ribosomal DNA primers. Poult. Sci. 83:1093-1098.
35. Boone, D. R., R. W. Castenholz, and G. M. Garrity, eds. 2001. Bergey's manual of
systematic bacteriology. 2nd ed. Springer, NY.
36. Noy, Y., and D. Sklan. 1998. Metabolic responses to early nutrition. J. Appl. Poult.
Res. 7:437-451.
Acknowledgments
The authors would like to thank Dr. Michael Azain (Department of Animal and Dairy
Science, University of Georgia, Athens, GA 30602) and Dr. Arthur Hinton Jr. (ARS-USDA,
67
Athens, GA 30604) for their technical assistance in the determination of intestinal viscosity and
cecal bacteriology.

68
TABLE 2.1. Composition (as fed-basis) of the diets, Experiment 1 Ingredient Corn Sorghum Pearl millet Dextrose % Grain source 46.516 49.335 51.089 43.108 Soybean meal 41.121 38.931 36.833 48.160 Fat, Poultry 4.400 4.400 4.400 4.400 Solka-Floc1 3.730 3.011 3.562 ----- Dicalcium phosphate 1.792 1.833 1.798 1.922 Limestone 1.271 1.237 1.243 1.159 Salt 0.572 0.534 0.533 0.582 DL-Methionine 0.298 0.342 0.217 0.369 L-Lysine·HCl ----- 0.077 0.025 ----- Vitamin premix2 0.250 0.250 0.250 0.250 Mineral premix3 0.050 0.050 0.050 0.050 Contents by calculation TMEN, kcal/kg 2900 2900 2900 2900 Crude protein, % 23 23 23 23 Digestible lysine, % 1.32 1.30 1.30 1.43 Digestible SAA4, % 1.00 1.00 1.00 1.00 Calcium, % 1.00 1.00 1.00 1.00 Available Phosphorus, % 0.47 0.47 0.47 0.47 1Fiber Sales and Development Corp., Urbana, OH 2Vitamin mix provided the following (per kg of diet): thiamin•mononitrate, 2.4 mg; nicotinic acid, 44 mg; riboflavin, 4.4 mg; D-Ca pantothenate, 12 mg; vitamin B12 (cobalamin),12.0 µg; pyridoxine•HCL, 4.7 mg; D-biotin, 0.11 mg; folic acid, 0.55 mg; menadione sodium bisulfate complex, 3.34 mg; choline chloride, 220 mg; cholecalciferol, 1,100 IU; trans-retinyl acetate, 5,500 IU; all-rac-tocopherol acetate, 11 IU; ethoxyquin, 125 mg. 3Trace mineral mix provides the following (per kg of diet): manganese (MnSO4•H2O), 60 mg; iron (FeSO4•7H2O), 30 mg; zinc (ZnO), 50 mg; copper (CuSO4•5H2O), 5 mg; iodine (ethylene diamine dihydroiodide), 0.15 mg; selenium (sodium selenite), 0.3 mg. 4SAA = Sulfur AAs.

69
TABLE 2.2. Composition (as fed-basis) of the diets, Experiment 2 and 3 Ingredient Corn Sorghum Pearl millet Dextrose % Grain source 53.196 56.435 58.444 44.624 Soybean meal 40.087 37.531 35.125 48.160 Fat, Poultry 1.000 1.000 1.000 2.884 Solka-Floc1 1.500 0.686 1.318 ----- Dicalcium phosphate 1.773 1.820 1.781 1.922 Limestone 1.287 1.248 1.256 1.159 Salt 0.570 0.527 0.526 0.582 DL-Methionine 0.287 0.339 0.195 0.369 L-Lysine HCl ----- 0.114 0.055 ----- Vitamin premix2 0.250 0.250 0.250 0.250 Mineral premix3 0.050 0.050 0.050 0.050 Contents by calculation TMEN, kcal/kg 2825 2825 2825 2825 Crude protein, % 23 23 23 23 Digestible lysine, % 1.32 1.30 1.30 1.43 Digestible SAA4, % 1.00 1.00 1.00 1.00 Calcium, % 1.00 1.00 1.00 1.00 Available Phosphorus, % 0.47 0.47 0.47 0.47 1Fiber Sales and Development Corp., Urbana, OH 2Vitamin mix provided the following (per kg of diet): thiamin•mononitrate, 2.4 mg; nicotinic acid, 44 mg; riboflavin, 4.4 mg; D-Ca pantothenate, 12 mg; vitamin B12 (cobalamin),12.0 µg; pyridoxine•HCL, 4.7 mg; D-biotin, 0.11 mg; folic acid, 0.55 mg; menadione sodium bisulfate complex, 3.34 mg; choline chloride, 220 mg; cholecalciferol, 1,100 IU; trans-retinyl acetate, 5,500 IU; all-rac-tocopherol acetate, 11 IU; ethoxyquin, 125 mg. 3Trace mineral mix provides the following (per kg of diet): manganese (MnSO4•H2O), 60 mg; iron (FeSO4•7H2O), 30 mg; zinc (ZnO), 50 mg; copper (CuSO4•5H2O), 5 mg; iodine (ethylene diamine dihydroiodide), 0.15 mg; selenium (sodium selenite), 0.3 mg. 4SAA = Sulfur AAs.

70
TABLE 2.3. Effect of various grain sources on weight gain and feed efficiency of broiler chicks at 4, 7 and 14 d of age, Experiment 11
Weight gain (g/bird) Gain:feed (g:kg) Diet Day 4 Day 7 Day 14 Day 4 Day 7 Day 14 Corn 44c 118b 322b 1098ab 673b 717b Sorghum 50ab 126b 333b 1031b 680b 718b Pearl millet 54a 135a 352a 1147a 712ab 735a Dextrose 48b 134a 361a 1110a 751a 757a Pooled SEM 1.5 2.1 4.3 23.2 16.0 7.1
a-c Means within a column with no common superscript differ significantly (P < 0.05). 1Means represent seven pens of ten birds each.

71
TABLE 2.4. Effect of various grain sources on weight gain and feed efficiency of broiler chicks at 4, 7, 14 and 21d of age, Experiment 21
Weight gain (g/bird) Gain:feed (g:kg) Diet Day 4 Day 7 Day 14 Day 21 Day 4 Day 7 Day 14 Day 21 Corn 45b 127c 375b 683c 961c 771b 744b 611b Sorghum 48a 130bc 393b 731b 949c 746b 752ab 641ab Pearl millet 50a 135b 386b 733b 1010b 764b 737b 608b Dextrose 50a 144a 423a 806a 1100a 843a 784a 670a Pooled SEM 1.3 2.6 7.4 10.8 16.1 12.5 11.1 12.6
a-c Means within a column with no common superscript differ significantly (P < 0.05). 1Means represent eight pens of ten birds each.

72
TABLE 2.5. Effect of various grain sources on weight gain and feed efficiency of broiler chicks at 4, 7 and 14 d of age, Experiment 31
Weight gain (g/bird) Gain:feed (g:kg) Diet Day 4 Day 7 Day 14 Day 4 Day 7 Day 14 Corn 43 122 383 912 793 718 Sorghum 44 126 390 892 764 699 Pearl millet 47 132 405 915 792 732 Pooled SEM 1.4 4.2 8.8 13.2 22.7 18.6
1Means represent eight pens of ten birds each.
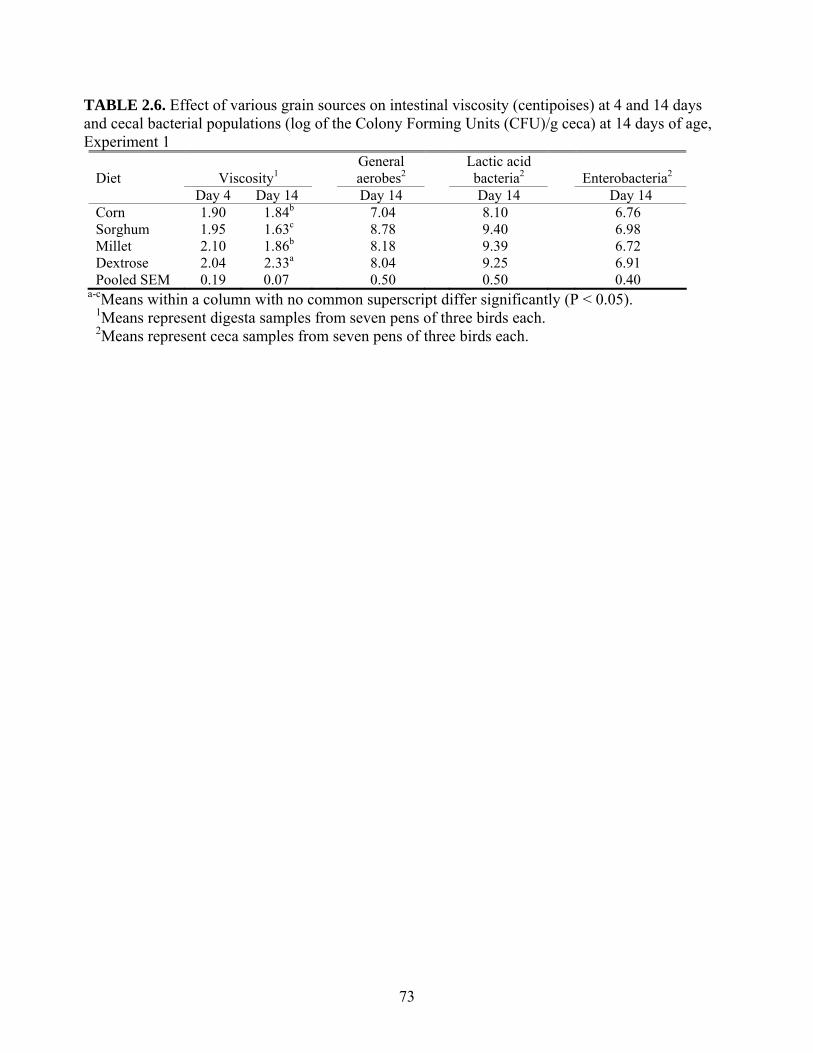
73
TABLE 2.6. Effect of various grain sources on intestinal viscosity (centipoises) at 4 and 14 days and cecal bacterial populations (log of the Colony Forming Units (CFU)/g ceca) at 14 days of age, Experiment 1
Diet
Viscosity1
General aerobes2
Lactic acid bacteria2
Enterobacteria2
Day 4 Day 14 Day 14 Day 14 Day 14 Corn 1.90 1.84b 7.04 8.10 6.76 Sorghum 1.95 1.63c 8.78 9.40 6.98 Millet 2.10 1.86b 8.18 9.39 6.72 Dextrose 2.04 2.33a 8.04 9.25 6.91 Pooled SEM 0.19 0.07 0.50 0.50 0.40
a-cMeans within a column with no common superscript differ significantly (P < 0.05). 1Means represent digesta samples from seven pens of three birds each. 2Means represent ceca samples from seven pens of three birds each.

74
TABLE 2.7. Effect of various grain sources on intestinal viscosity (centipoises) and cecal bacterial populations (log of the Colony Forming Units (CFU)/g ceca) at 4 and 21 d of age, Experiment 2 Diet
Viscosity1
General aerobes2
Lactic acid bacteria2
Enterobacteria2
Day 4 Day 21 Day 4 Day 21 Day 4 Day 21 Day 4 Day 21 Corn 2.6ab 2.3a 10.63 8.36 9.75 9.13 9.11 7.23ab Sorghum 2.0c 1.9b 10.33 8.97 10.17 9.76 8.81 6.56b Millet 2.5bc 2.3a 10.43 8.85 10.45 9.84 8.80 8.09a Dextrose 3.0a 2.4a 10.86 8.64 9.51 9.07 8.87 6.87b Pooled SEM 0.16 0.10 0.30 0.50 0.50 0.50 0.20 0.40
a-cMeans within a column with no common superscript differ significantly (P < 0.05). 1Means represent digesta samples from eight pens of three birds each. 2Means represent ceca samples from eight pens of three birds each.
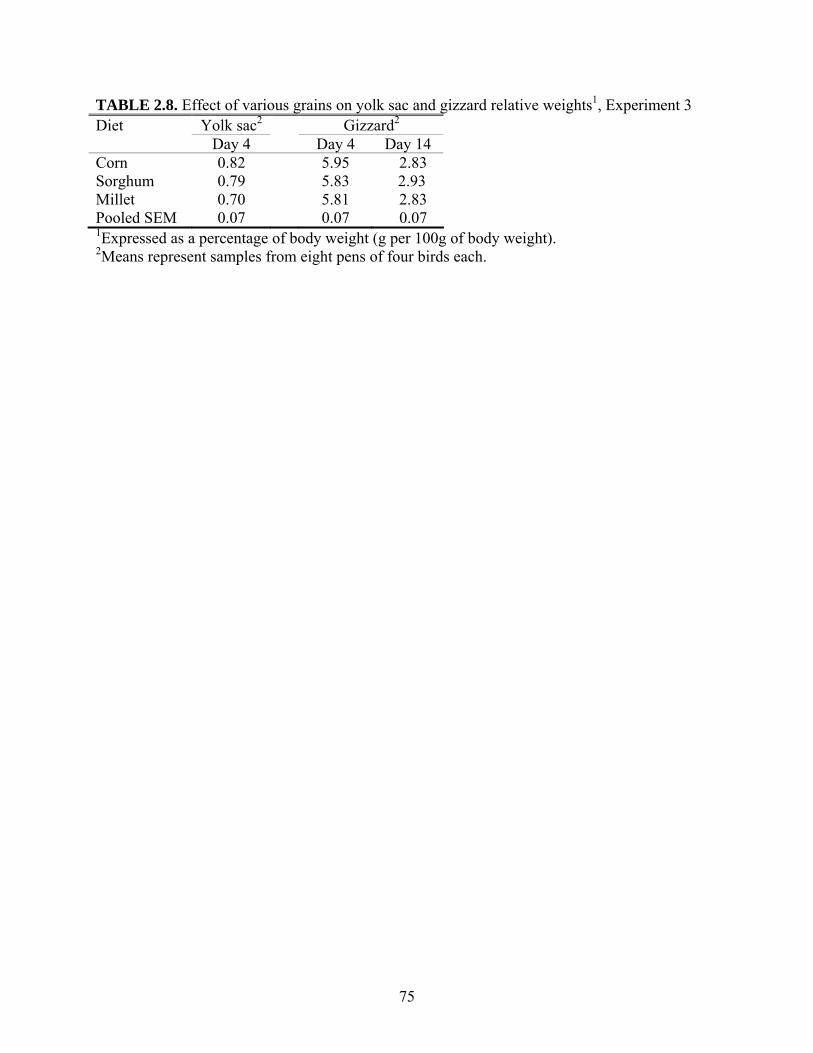
75
TABLE 2.8. Effect of various grains on yolk sac and gizzard relative weights1, Experiment 3 Diet Yolk sac2 Gizzard2 Day 4 Day 4 Day 14 Corn 0.82 5.95 2.83 Sorghum 0.79 5.83 2.93 Millet 0.70 5.81 2.83 Pooled SEM 0.07 0.07 0.07 1Expressed as a percentage of body weight (g per 100g of body weight). 2Means represent samples from eight pens of four birds each.

76
CHAPTER 3
CHANGES IN THE DIGESTIBLE LYSINE AND SULFUR AA NEEDS OF BROILER
CHICKS DURING THE FIRST THREE WEEKS POSTHATCHING1
1A. R. Garcia and A. B. Batal. To be submitted to Poultry Science.

77
ABSTRACT Four experiments were conducted to study the changes in the digestible lysine
(DLYS) and sulfur AA (DSAA) requirements of broilers during the first 21 d posthatching. Male
Cobb 500 broilers were fed corn-corn gluten meal-soybean meal diets formulated to be isocaloric
and isonitrogenous. Five graded levels of either DLYS or DSAA were used, varying from 0.78 to
1.28% DLYS (Experiments 1 and 2) and from 0.61 to1.08% DSAA (Experiments 3 and 4). Body
weight gain (BWG) and gain:feed ratio (GF) were calculated at 4, 7, and 21 d. The DLYS
requirements based on BWG varied from 0.98 at 4 d of age to 1.01% at 21 d in Experiment 1 and
from 0.95 at 4 d of age to 0.99% at 21 d, in Experiment 2. Based on GF, the DLYS requirement
varied from 1.08 and 1.10% in Experiment 1, and from 0.98 to 0.94% in Experiment 2 at 4 and
21 d, respectively. The estimated DSAA requirements for BWG varied from 0.83 to 0.88 % or
from 0.71 to 0.75% for 4 and 21 d, in Experiments 3 and 4, respectively. For GF the DSAA
slightly decreased from 0.88% at 4 d to 0.83% at 21 d in Experiment 3, but did not change in
experiment 4 (0.81%). Minimal changes in the DLYS or DSAA estimated requirements occurred
within 21d of age, which suggests that the recommended DLYS and DSAA levels determined at
21 d of age appear to be adequate for the first wk of age.
(Key words: digestible lysine, digestible sulfur AAs, broilers, age)
78
INTRODUCTION
The nutrient requirements for broiler chickens have been studied extensively, and
recommendations have been made for different growth phases. Most of the nutrient
recommendations for the starter period (0 to 21 d of age) are estimated from research studies
conducted from 7 to 21 d of age once the yolk sac is no longer present and not taking into
account the first seven d of age. In fact, the nutrient recommendations given by the NRC (1994)
consider the starter period of the broiler chicken from 1 to 21 d of age, assuming that no changes
occur in the capability of the bird to digest and utilize nutrients during this period. Nevertheless,
research has shown that several physiological changes do occur as the chick grows, and that
during the first wk of age the gastrointestinal tract is not completely functional. Nitsan et al.
(1991) reported that intestinal growth occurs at a faster rate than body growth until 7 to 10 d of
age. Amylase and trypsin activity increase with age until approximately 7 d of age (Sklan and
Noy, 2000). Nutrient utilization has also been demonstrated to change as the chick ages. Noy and
Sklan (1995) reported an increase in ileal nitrogen digestibility from 78 to about 90% from 4 to
21 d. Intestinal uptake of glucose and methionine was found to increase with age during the first
wk of age (Noy and Sklan, 2001). Batal and Parsons (2002) reported an increase in the AA (AA)
digestibility of a corn-soybean meal diet from 1 to 10 d, at which point a plateau was reached
and digestibility coefficients became similar to those reported for adult chickens. Thus, nutrient
requirements during the starter period (0 to 21 d of age) may need to account these physiological
changes, considering that the first wk of life of the modern broiler chicken represents about 17 %
of the total growth time (Lilburn, 1998).
Some of the latest research on AA requirements of young chicks, particularly lysine
(LYS) and sulfur AAs (SAA) has started to take into account the first seven d period. Labadan et
79
al (2001) reported an estimated LYS requirement on a total basis for broiler chickens from 0 to
14 d of age. Assuming an 88% of digestibility of LYS in a corn-soybean meal diet (Baker and
Han, 1994), such requirements would be 1.14% and 1.07% for body weight gain (BWG) and
feed efficiency (FE), respectively, The estimated LYS requirements obtained by Sklan and Noy
(2003) for broiler chicks at 7 d of age were 0.92% and 0.96% for BWG and FE, respectively,
expressed on a digestible basis. Neither estimate differs greatly from the NRC (1994) LYS
recommendation for the first 21 d of age, which is 0.97% transformed to a digestible basis.
Knowles and Southern (1998) obtained a requirement of 0.66% digestible SAA for maximum
daily gain, and 0.63% for FE in broiler birds from 0 to 15 d of age. This estimation for the first
15 d seems lower than the NRC (1994) recommendation for the first 21 d of age, which is
0.801% on a digestible basis. However, the estimated SAA requirements expressed on a
digestible basis for the first 7 d of age obtained by Sklan and Noy (2003) were 0.81% and
0.806% based on BWG and FE respectively, and do not appear to be different from the NRC
(1994) recommendation.
It is clear that changes occur in the functionality of the gastrointestinal tract during the
first 21 d posthatching, therefore it is likely that the requirement of LYS and SAA may also vary
during the same period. However, little research has been done to determine the AA
requirements of the chicken from 0 to 7 d of age and to evaluate whether or not they are different
from the recommendations determined at 21 d. Thus, the objective of the present studies was to
evaluate the changes in the estimated digestible lysine (DLYS) and sulfur AA (DSAA)
requirements at 4, 7, and 21 d of age.

80
MATERIALS AND METHODS
Four experiments were conducted using Cobb 500 male chicks, which were allocated in battery
brooders1 with raised wire floors in environmentally controlled rooms where the initial
temperature was 32 C, and weekly reduced by 2 degrees. Experiments 1 and 2 were designed to
study the variations in the estimated DLYS requirements between 4 and 21 d of age, whereas in
Experiments 3 and 4 the changes in DSAA were evaluated. At hatch, the birds were randomly
assigned to pens such that each pen had a similar initial weight and weight distribution.
Treatments consisted of five graded levels of either DLYS or DSAA with five replicate pens of
six birds each. The birds were allowed ad libitum access to the diets from 1 to 21 d of age, and
mortality was recorded daily. Body weight and feed intake were recorded at 4, 7, and 21 d of age
and body weight gain (BWG) and gain:feed ratio (GF) were calculated and corrected by
mortality for each pen.
A corn-soybean meal-corn gluten meal basal diet was formulated to meet or exceed the
NRC (1994) requirements for all nutrients except for LYS or SAA for broiler chicks during the
starter period (0 to 21 d of age) (Table 1). DL-methionine, L-arginine and L-threonine were
added to the basal diets for Experiments 1 and 2, whereas L-LYS HCl and L-threonine were
added to the diets for Experiments 3 and 4, to fulfill the requirements based on the digestible AA
profile established by Illinois Ideal Chick Protein ratios (Baker, 1997). Variable levels of
dextrose and L-glutamic acid were used to keep the experimental diets isocaloric and
isonitrogenous. L-LYS HCl and L-glutamic acid were added to the basal diets at the expense of
dextrose to meet the experimental levels of DLYS, which were 0.88, 0.98, 1.08, 1.18, and 1.28 %
in Experiment 1, and 0.78, 0.88, 0.98, 1.08, and 1.18% in Experiment 2. To meet the
experimental levels of DSAA in Experiments 3 and 4, DL-methionine and L-cystine were added
81
to the basal diet at the expense of dextrose and glutamic acid at a 1:1 ratio (for each 0.10%
increase in the DSAA, 0.05% DL-Met + 0.05% L-Cys were added). The experimental levels of
digestible DSAA were 0.68, 0.78, 0.88, 0.98 and 1.08% in Experiment 3 and 0.61, 0.71, 0.81,
0.91 and 1.01% in Experiment 4. The true AA digestibilities of the basal diets were determined
using the total fecal collection “precision-fed” rooster assay, in adult, cecectomized, Single-
Comb White Leghorn roosters (Han and Parsons, 1990). Five roosters were fed a 30-gram
sample of each basal diet via crop intubation, and five additional roosters were feed-deprived to
estimate endogenous losses. After 48 h the excreta were collected, freeze-dried and the samples
were sent to a laboratory2 for AA quantification in both the feed and excreta.
Statistical analysis
Data for BWG and GF at 4, 7, and 21 d of age were fitted to linear and quadratic
response curves (Draper and Smith, 1981) using the General Linear Models procedure of SAS®
(SAS Institute, 1990). The digestible AA requirements for both BWG and GF were estimated by
one-slope broken-line methodology (Robbins et al., 1979) and by fitting the data to a quadratic
response curve (Draper and Smith, 1981) and then determining the dietary AA level required for
maximal weight gain and feed efficiency (X at maximum Y value of quadratic response curve).
A value of 90% of the maximum quadratic curve response was selected as a subjective estimate
of the AA requirement. An objective estimate was obtained by calculating the first point where
the quadratic curve intersected the plateau value determined from the one-slope fitted broken-
line curve (Baker et al., 2002). Broken-line estimated requirements are reported herein.
1 Petersime Incubator Co., Geltysburg, OH 45328 2University of Missouri-Columbia, Columbia, MO 65211.

82
RESULTS AND DISCUSSION
Experiments 1 and 2
A significant quadratic response (P < 0.05) to increasing DLYS levels was observed for
BWG at 4, 7 and 21 d of age and for GF at 7 and 21 d of age in both experiments (Tables 2 and
3). Minor changes in the estimated break points were observed at 4, 7, and 21 d of age for both
BWG and GF (Table 6). In Experiment 1, the estimated DLYS requirements based on BWG and
GF, respectively, were 0.98 and 1.08% at 4 d, 1.01 and 1.10% at 7 d and 1.00 and 1.10% at 21 d.
In Experiment 2, the estimated DLYS requirements based on BWG and GF were 0.98% for both
at 4 d, 0.95 and 0.98% at 7 d, and 0.99 and 0.94% at 21 d, respectively. To date, most of the
work in AA requirements during the first three wk of age has provided estimates obtained from 7
to 21 d of age, but no attempt has been done to compare how the AA requirements for the first
wk of age differ to those for the first three wk posthatching. Baker and Han (1994) obtained a
DLYS requirement estimate of 1.07%, which was slightly higher than the estimated value of
1.00% obtained herein for chickens at 21 d of age. In a different study conducted by Baker et al.
(2002) the estimated DLYS requirement was lower (0.85 %). In these two studies, however, the
first wk of life of the chicken was not part of the evaluation. To date only Sklan and Noy (2003)
have reported estimated LYS requirements for broiler chickens at 7 d of age, which are 0.92 and
0.96% for BWG and GF, respectively. Assuming an 88% digestibility of LYS in a corn-soybean
meal diet (Baker and Han, 1994), their estimate is close to the NRC (1994) recommendation of
0.97% on a digestible basis from 0 to 3 wk of age. However, they did not compare their
estimates at 7 d with those at 21 d of age. Based on the results obtained herein, it seemed that a
minimal change occurred in the DLYS requirement within the first 21 d of age, varying from
0.95 to 1.01% for BWG, and the requirement at 7 d was not higher than at 21 d. These findings

83
are in contrast with what could be expected due to the physiological limitations of the digestive
tract of the baby chick. Since nutrient uptake and utilization are lower as compared to a mature
bird, and because the relative growth rate is faster during the first wk (Murakami et al., 1992) as
compared to older birds, and the protein deposition expressed in percentage of body weight
occurs at a faster rate (Kang et al., 1985), the AA needs were expected to be higher during the
first wk and progressively decline as the bird ages, at least up to 21 d of age. The yolk sac may
make some contribution to the nutrient needs of the chick, since it represents about 10% of the
chick weight and contains about 43% of the protein needs for the first d of age (Vieira and
Moran, 1999). Thus, it is likely that during the first wk posthatching, the contribution of nutrients
from the yolk sac may decrease the dietary need for LYS. The reason why the DLYS
requirement was not higher during the first seven d of age is not known, and more basic research
seems to be necessary to clarify this finding. However, if in reality the DLYS requirement at 7 d
of age is not higher than at 21 d, the LYS recommendation for the first 21 d of age is adequate to
meet the chick requirement at 7 d of age, and there is no need to supply more LYS despite the
lower digestibility of practical diets during the first wk of age.
Experiments 3 and 4
Body weight gain and gain:feed responded quadratically (P < 0.05) to graded levels of
DSAA (Tables 4 and 5) with the exception of data at 4 d of age. High variation between
experiments was observed between the estimated requirements at 4 and 7 d based on BWG as
compared to GF (Table 6). In Experiment 3, the estimated DSAA were 0.88, 0.87 and 0.83%
based on BWG at 4, 7 and 21 d of age, respectively. Based on GF, the DSAA requirements were
0.88, 0.88 and 0.83% at 4, 7 and 21 d, respectively. In Experiment 4, the DSAA requirements for
BWG were 0.71, 0.75 and 0.75% at 4, 7, and 21 d, respectively, whereas for GF the estimated

84
requirement was 0.81% at all ages. In Experiment 4 the estimated DSAA requirements based on
BWG were lower than those obtained in Experiment 3, but based on GF the estimated
requirements in the two experiments were in good agreement. Nevertheless, based on either
BWG or GF, the estimated DSAA requirements based on BWG and GF changed minimally
within the first 21 d of age in both experiments. The estimate obtained by Sklan and Noy (2003)
at 7 d for BWG and GF was 0.81% on a digestible basis, which is close to the estimated DSAA
obtained in Experiment 3 at 21 d of age. Compared to the estimate of 0.78% DSAA obtained by
Baker and Han (1994) at 21 d, the value obtained herein was slightly higher (0.83%). In
Experiment 3 it was noted that the DSAA requirements based on BWG and GF were practically
equal at the three ages. However, in Experiment 4, the estimates for GF were higher than those
for BWG for all age periods. The reason why the estimated requirements based on BWG were
substantially different from one experiment to another is not known, and these results should not
be used as reference values since the experiments were not designed to provide a
recommendation. Still, conclusions in regard of how the DSAA requirements change with age
could be obtained. Some other variables might be affecting the DSAA needs of the broiler chick
at the ages studied. For instance, besides being an essential AA for protein synthesis, methionine
is a precursor of cysteine, an intermediate in methyl group transfer and polyamine synthesis
(Wallis, 1999). Therefore, methionine is related in different metabolic processes involved in
growth that may be quite active during the first wk of the life of a chicken. Moreover, Noy and
Sklan (2001) found that methionine uptake increases with age during the first 7 d of life, thus it
was expected that the DSAA requirements would be higher during the first wk of age, but like
the DLYS requirement reported herein, no evidence was found to support that hypothesis.

85
Whether or not the yolk sac is accounting or contributing to the protein and AA needs of the
chick during the first seven d of age can not be concluded from this research.
From the results herein, it can be concluded that the estimated DLYS and DSAA
requirements do not seem to change significantly during the first 21 d of age, and the DLYS and
DSAA requirements of the broiler chick do not appear to be higher at 7 d than at 21 d of age.
Consequently, the DLYS and DSAA recommendations determined in studies conducted with
chickens from 7 to 21 d of age appear to be adequate for chicks from 0 to 7 d of age.
REFERENCES
Baker, D. H. 1997. Ideal AA profiles for swine and poultry and their applications in feed
formulations. BioKyowa Technol. Rev. 9:1-24.
Baker D. H., and Y. Han. 1994. Ideal AA profile for chicks during the first three weeks
posthatching. Poult. Sci. 73:1441-1447.
Baker D. H., A. B. Batal, T. M. Parr, N. R. Augspurger, and C. M. Parsons. 2002. Ideal ratio
(relative to lysine) of tryptophan, threonine, isoleucine, and valine for chicks during the
second and third weeks posthatch. Poult. Sci. 81:485-494.
Batal A. B., and C.M. Parsons. 2002. Effects of age on nutrient digestibility in chicks fed
different diets. Poult. Sci. 81:400-407.
Draper, N. R., and H. Smith. 1981. Applied Regression Analysis. 2nd. ed. John Wiley and Sons,
New York.
Han, Y., and C.M. Parsons. 1990. Determination of available AA and energy in alfalfa meal,
feather meal, and poultry by-products by various methods. Poult. Sci. 69:1544-1552.
Kang, C. W., M. L. Sunde, and R. W. Swick. 1985. Growth and protein turnover in the skeletal
muscle of broiler chicks. Poult. Sci. 64:370-379.

86
Knowles T. A., and L. L. Southern. 1998. The lysine requirement and ratio of total sulfur AAs to
lysine for chicks fed adequate or inadequate lysine. Poult. Sci. 77:564-569.
Labadan M. C., Jr., K. N. Hsu, and R. E. Austic. 2001. Lysine and arginine requirements of
broiler chickens at two- to three-week intervals to eight weeks of age. Poult. Sci. 80:599-
606.
Lilburn M. S. 1998. Practical aspects of early nutrition for poultry. J. Appl. Poult. Res. 7:420-
424.
Murakami, H., M. Horiguchi, and Y. Akiba. 1992. Growth and utilization of nutriments in
newly-hatched chicks with or without removal of residual yolk. Growth Dev. Aging.
56:75-84.
National Research Council. 1994. Nutrient requirements of poultry. 9th rev. ed. National
Academy Press, Washington, DC.
Nitsan, Z., Ben-Avraham, Z. Zoref, and I. Nir. 1991. Growth and development of the digestive
organs and some enzymes in broiler chickens after hatching. Br. Poult. Sci. 32:515-523.
Noy, Y., and D. Sklan. 1995. Digestion and absorption in the young chicks. Poult. Sci. 74:366-
373.
Noy, Y., and D. Sklan. 2001. Yolk and exogenous feed utilization in the posthatch chick. Poult.
Sci. 80:1490-1495.
Robbins, K. R., H. W. Norton, and D. H. Baker. 1979. Estimation of nutrient requirements from
growth data. J. Nutr. 109:1710-1714.
SAS Institute Inc., 1990. SAS STAT User’s Guide Release 6.08. SAS Institute Inc., Cary NC.
Sklan D., and Y. Noy. 2000. Hydrolysis and absorption in the small intestines of posthatch
chicks. Poult. Sci. 79:1306-1310.

87
Sklan D., and Y. Noy. 2003. Crude protein and essential AA requirements in chicks during the
first week posthatch. Br. Poult. Sci. 44:266-274.
Vieira S. L., and E. T. Moran. 1999. Effects of egg origin and chick post-hatch nutrition on
broiler live performance and meat yields. World’s Poult. Sci. J. 55:126-142.
Wallis I. R. 1999. Dietary supplements of methionine increase breast meat yield and decrease
abdominal fat in growing broiler chickens. Australian J. of Exp. Agric. 39:131-141.
-

88
TABLE 3.1. Composition (as fed-basis) of the lysine and sulfur AA deficient basal diets, Experiments 1, 2, 3 and 4 Ingredient Experiment 1 Experiment 2 Experiment 3 Experiment 4 % Corn 57.00 57.00 51.00 51.00 Soybean meal 24.60 25.10 37.50 39.20 Corn gluten meal 10.00 10.00 ---- ---- Dextrose 2.28 1.81 4.14 2.46 Soybean oil 2.00 2.00 3.50 3.50 Limestone 1.37 1.37 1.33 1.33 Dicalcium phosphate 1.85 1.85 1.80 1.80 Salt 0.30 0.30 0.30 0.30 Vitamin mix1 0.25 0.25 0.25 0.25 Mineral mix2 0.08 0.08 0.08 0.08 NaHCO3 ---- 0.05 ---- ---- L-Lysine HCl 0.06 ---- ---- 0.03 DL-Methionine 0.11 0.12 0.01 ---- L-Threonine 0.03 0.02 0.01 ---- L-Arginine 0.02 ---- ---- ---- L-Cystine ---- ---- 0.03 ---- Bacitracin MD3 0.05 0.05 0.05 0.05 Calculated composition TMEn, kcal/kg 3,230 3,260 3,150 3,140 Protein, % 23 23.6 22.2 23 Digestible lysine, % 0.90 0.88 1.11 1.18 Digestible SAA, % 0.80 0.83 0.65 0.63 Calcium, % 1.00 1.00 1.00 1.00 Available phosphorus, % 0.45 0.45 0.45 0.45 Analyzed composition Digestible lysine, %4 0.88 0.78 1.12 1.20 Digestible SAA, %4 0.81 0.83 0.68 0.61 1Vitamin mix provided the following (per kg of diet): thiamin•mononitrate, 2.4 mg; nicotinic acid, 44 mg; riboflavin, 4.4 mg; D-Ca pantothenate, 12 mg; vitamin B12 (cobalamin),12.0 µg; pyridoxine•HCL, 4.7 mg; D-biotin, 0.11 mg; folic acid, 0.55 mg; menadione sodium bisulfate complex, 3.34 mg; choline chloride, 220 mg; cholecalciferol, 1,100 IU; trans-retinyl acetate, 5,500 IU; all-rac-tocopherol acetate, 11 IU; ethoxyquin, 125 mg. 2Trace mineral mix provides the following (per kg of diet): manganese (MnSO4•H2O), 60 mg; iron (FeSO4•7H2O), 30 mg; zinc (ZnO), 50 mg; copper (CuSO4•5H2O), 5 mg; iodine (ethylene diamine dihydroiodide), 0.15 mg; selenium (sodium selenite), 0.3 mg. 3Contributed 27.5 mg/kg bacitracin methylene disalicylate. 4Analyzed values determined by total fecal collection of cecectomized roosters.

89
TABLE 3.2. Growth performance of broiler chicks at 4, 7, and 21 d of age fed graded levels of digestible lysine1, Experiment 1
Digestible lysine Weight gain (g) Gain:feed (g:kg) (% of diet)2 Day 4 Day 7 Day 21 Day 43 Day 7 Day 21
0.88 44 97 537 868 814 641 0.98 47 113 666 849 859 722 1.08 48 121 709 906 881 716 1.18 48 120 701 893 890 743 1.28 45 115 672 882 872 732
Pooled SEM 1.5 4.0 28.0 16.0 20.0 22.0 1Means represent five pens of six birds each. 2Lysine was provided as feed grade L-Lysine•HCl (78.8% Lys). 3Quadratic response was not significant (P > 0.05).
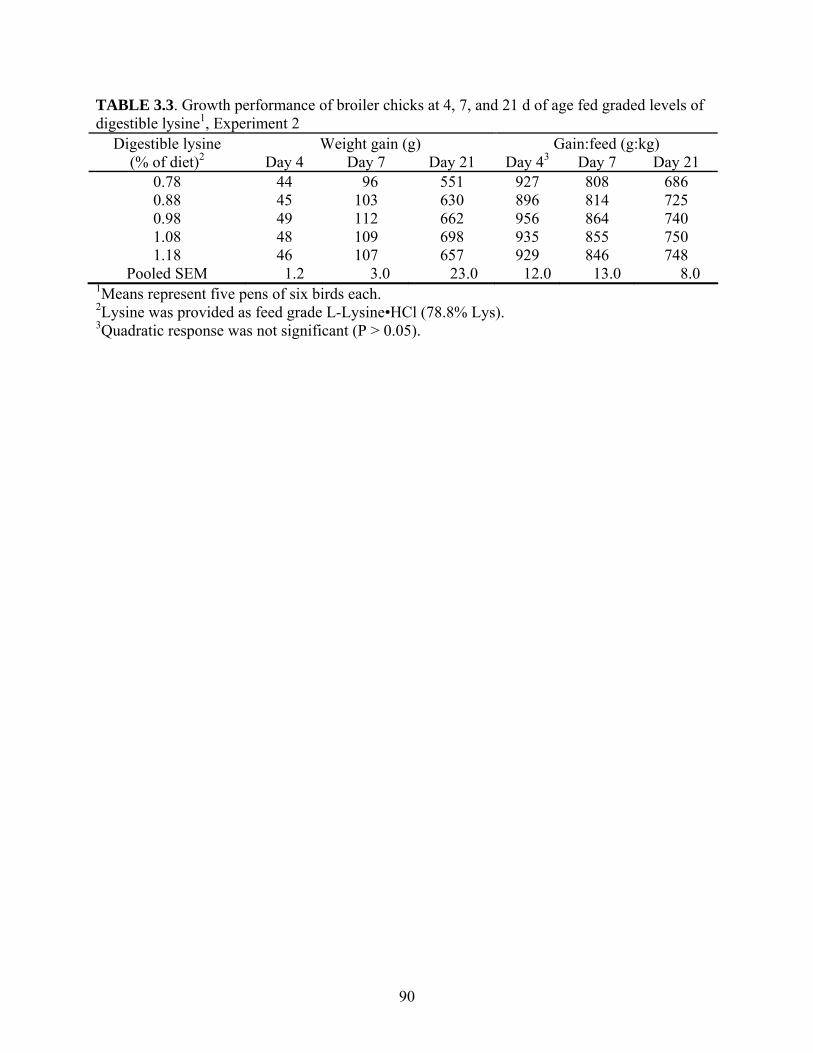
90
TABLE 3.3. Growth performance of broiler chicks at 4, 7, and 21 d of age fed graded levels of digestible lysine1, Experiment 2
Digestible lysine Weight gain (g) Gain:feed (g:kg) (% of diet)2 Day 4 Day 7 Day 21 Day 43 Day 7 Day 21
0.78 44 96 551 927 808 686 0.88 45 103 630 896 814 725 0.98 49 112 662 956 864 740 1.08 48 109 698 935 855 750 1.18 46 107 657 929 846 748
Pooled SEM 1.2 3.0 23.0 12.0 13.0 8.0 1Means represent five pens of six birds each. 2Lysine was provided as feed grade L-Lysine•HCl (78.8% Lys). 3Quadratic response was not significant (P > 0.05).

91
TABLE 3.4. Growth performance of broiler chicks at 4, 7, and 21 d of age fed graded levels of digestible sulfur AAs1, Experiment 3
Digestible sulfur Weight gain (g) Gain:feed (g/kg) AAs2 (% diet) Day 43 Day 7 Day 21 Day 43 Day 7 Day 21
0.68 44 108 601 853 832 663 0.78 45 115 682 836 843 737 0.88 49 126 730 892 875 762 0.98 43 116 712 850 845 749 1.08 47 121 732 844 853 748
Pooled SEM 1.9 7.0 22.0 27.0 74.0 16.0 1Means represent five pens of six birds each. 2Sulfur AAs were provided as DL-Met and L-Cys on a wt:wt basis (e.g. to increase the digestible sulfur AA level by 0.10%, 0.05% DL-Met + 0.05% L-Cys were added). 3Quadratic response was not significant (P > 0.05).

92
TABLE 3.5. Growth performance of broiler chicks at 4, 7, and 21 d of age fed graded levels of digestible sulfur AAs1, Experiment 4 Digestible sulfur Weight gain (g) Gain:feed (g/Kg)
AAs (% diet) Day 43 Day 7 Day 21 Day 43 Day 7 Day 21 0.61 42 97 602 874 814 716 0.71 47 106 676 884 822 738 0.81 47 112 704 921 879 770 0.91 42 108 692 895 857 773 1.01 47 108 703 911 828 745
Pooled SEM 1.7 2.8 22.0 17.0 20.0 19.0 1Means represent five pens of six birds each. 2Sulfur AAs were provided as DL-Met and L-Cys on a wt:wt basis (e.g. to increase the digestible sulfur AA level by 0.10%, 0.05% DL-Met + 0.05% L-Cys were added). 3Quadratic response was not significant (P > 0.05).

93
TABLE 3.6. Digestible requirement estimates1 (% of diet) of lysine and sulfur AAs for male broiler chicks at 4, 7, and 21 d of age (Experiments 1, 2, 3 and 4) Weight gain (g) Gain:feed (g:kg) AA Day 4 Day 7 Day 21 Day 4 Day 7 Day 21 Lysine
Experiment 1 0.98 1.01 1.00 1.083 1.10 1.10 Experiment 2 0.98 0.95 0.99 0.983 0.98 0.94
SAA2 Experiment 3 0.883 0.87 0.83 0.883 0.88 0.83 Experiment 4 0.713 0.75 0.75 0.813 0.81 0.81
1 Based on broken-line requirement estimates from tables 3, 4, 5 and 6. 2Sulfur AAs = SAA 3Data from which these requirement estimates were determined did not follow a significant quadratic response (P > 0.05).

94
CHAPTER 4
A COMPARISON OF METHODS TO DETERMINE AA DIGESTIBILITY OF FEED
INGREDIENTS FOR CHICKENS1
1 A. R. Garcia, A. B. Batal, and N. M. Dale. To be submitted to the Journal of Applied Poultry Research.

95
SUMMARY
Two experiments were conducted to compare standardized ileal AA (AA) digestibility in
7 and 21 d-old chicks and true AA digestibility as determined by the precision-fed cecectomized
rooster assay for several ingredients used in poultry feeds. Diets were formulated to contain
soybean, cottonseed, poultry by-product and fish meal in Experiment 1, and corn, wheat,
soybean meal, poultry by-product meal, feather meal and fish meal in Experiment 2, as the sole
source of protein. Celite™ was used as in indigestible marker and added at 1.5% of the diet. The
test diets were fed ad libitum to broiler chicks from 0 to 7 d of age in Experiment 1, and from 4
to 7 and 17 to 21 d of age in Experiment 2. Ileal digesta samples were collected after sacrificing
the birds at 7 d of age in Experiment 1 and at 7 and 21 d of age in Experiment 2. Additionally,
adult, cecectomized, Single-Comb White Leghorn roosters were used for crop-intubation of the
test diets for estimation of the true AA digestibility. Endogenous AA losses were corrected under
the ‘standardized AA digestibility’ concept for the ileal digestibility assay in chicks, and by
quantification of AA in the excreta of fasted birds for the true AA digestibility in roosters. In
Experiment 1, AA digestibility of all ingredients tested was significantly lower at 7 d of age than
that estimated by the rooster assay. In Experiment 2, no differences were detected between AA
digestibility at 7 or 21 d of age in the chicken assay for the majority of the indispensable AA.
However, the AA digestibility coefficients obtained by the chick assay at 7 and in some cases at
21 d of age, were significantly lower than those obtained by the rooster assay. In conclusion,
there were differences in the AA digestibility coefficients obtained through the chick and the
rooster assays. Such discrepancies could be mainly due to the methodological differences
between both methods.
Key words: Standardized ileal AA digestibility, chick assay, cecectomized rooster.

96
DESCRIPTION OF PROBLEM
The protein requirement of chickens is in fact a requirement for AAs (AA) [1, 2].
Therefore, more interest has been placed on determining AA requirements and using that
information for feed formulation. However, it is well known that not all AA in feedstuffs are
digested and available to the animal. Thus, more attention is given to the determination of AA
digestibility of feedstuffs because it will vary greatly depending upon the feed ingredient, and
also because digestible AA have been recognized as a sensitive indicator of their biological
availability [3, 4]. The use of digestible AA for feed formulation has been recognized as being
advantageous as compared to formulating diets on a total AA basis [5]. Therefore, determination
of AA digestibility of feed ingredients has become crucial. To date, there is a large body of
published work on AA digestibility coefficients for different feed ingredients [1, 6, 7, 8].
Nevertheless, the use of different methodologies for determining AA digestibility coefficients in
the published literature becomes confusing [9]. Among those methods, the precision-fed
cecectomized cockerel assay has been widely used for estimating AA digestibility of feedstuffs,
yielding very consistent results [10]. Criticisms of this methodology have arisen from the fact
that crop intubation is not a normal feeding pattern, and estimations are carried out in adult,
physiologically mature birds that might not reflect the digestive capabilities of younger chickens
[9]. As an alternative, Payne et al. [11] described the ileal digestibility assay, in which AA
digestibility is based on analysis of ileal digesta collected after sacrificing the birds. The main
advantage of this method is that the test diets are fed ad libitum, which is a normal feeding
pattern, and birds of different ages can be used. Controversy exists regarding what method
should be used to base the AA digestibility coefficients. For either assay, true rather than
apparent AA digestibility is preferred. However, since different methodologies have been

97
proposed for estimation of endogenous AA losses, the method of choice is still a subject of
debate [9]. In order to merge different criteria generated from a variety of studies, the term
‘standardized ileal digestibility’ has been proposed [4]. Under this concept, the ileal apparent AA
digestibility data generated by the chick assay are corrected for the basal endogenous AA
secretions determined by the enzymatically-hydrolyzed casein method. This method consists of
feeding enzymatically-treated casein, assuming that all of the free AA and small peptides yielded
from the hydrolysis will be absorbed, thus the fraction of AA in the excreta of these birds
corresponds most likely to endogenous losses [9]. For the purpose of standardization of AA
digestibility, the endogenous AA secretions obtained by the enzymatically-hydrolyzed casein
method that are published in the literature can be used [4].
To date, little work has been published comparing the AA digestibility coefficients
obtained by the different assays (i.e. chick ileal digestibility vs precision-fed cecectomized
rooster assay). Fernandez et al. [12] determined the true AA digestibility of corn-soy-cottonseed
meal diets in excreta of conventional 21-d-old chickens and compared these results to those
obtained by the precision-fed cecectomized rooster assay. According to the authors, the
digestibility coefficients obtained in adult roosters could very well predict AA digestibility in 21-
d-old chicks. However, there is recent evidence showing that AA digestibility in a corn-soybean
meal diet is lower during the first 7 d of age [13]. Furthermore, Huang et al. [14] reported that
AA digestibility coefficients determined by the chick assay for different feed ingredients were
lower in 14 d-old chicks as compared to 28 or 42 d-old chickens, possibly indicating that the AA
digestibility values obtained by the rooster assay might not be applicable for younger chickens.
Therefore, the objective of the present research was to determine if the AA digestibility

98
coefficients obtained by the ‘standardized ileal digestibility’ assay in chickens at 7 and 21 d of
age would drastically differ from those obtained by the precision-fed cecectomized rooster assay.
MATERIAL AND METHODS
General procedures
In order to compare the AA digestibility coefficients obtained by the chick ileal
digestibility and the precision-fed cecectomized rooster assays, two experiments were conducted.
In Experiment 1, a total of three hundred and sixty one-d-old male broiler chicks (Cobb 500)
were allocated in battery brooders [15] with raised wire floors in environmentally controlled
rooms where the initial temperature was 32 C, and weekly reduced by 2 degrees. The chicks
were randomly assigned to four dietary treatments of six replicate pens containing 15 chicks each
(90 birds per treatment). The birds received the experimental diets ad libitum from 0 to 7 d of
age.
In Experiment 2, a total of one thousand and three hundred one-d-old male broiler chicks
(Cobb 500) were allocated in battery brooders under similar conditions to those applied in
Experiment 1. The chicks were randomly assigned to six dietary treatments of six replicate pens
containing 36 chicks each (216 birds per treatment). The birds received the experimental diets ad
libitum from 4 to 7 and from 17 to 21 d of age. A corn-soybean meal broiler starter diet adequate
in all nutrients as recommended by NRC [1] was fed from 0 to 3 and 7 to 17 d of age, when the
birds were not fed the experimental diets.
Diets
The composition of the experimental diets is shown in Table 1 and 2. For Experiment 1,
the four test diets were formulated to contain soybean meal, cottonseed meal, pet-food grade
poultry by-product meal and fish meal as the only source of protein. For Experiment 2, the six

99
test diets contained corn, wheat, soybean meal, poultry by-product meal, feather meal and fish
meal in a similar manner to that used in Experiment 1. For both Experiments, no crystalline AA
were added to the diets, but they were fortified with minerals and vitamins. Celite™ was added
at 1.5% of the diet as an indigestible marker of acid insoluble ash (AIA).
Sampling
After the birds were allowed to consume the experimental diets, all the chicks from
Experiment 1, and from Experiment 2 twenty five and ten chicks per pen at 7 and 21 d,
respectively, were euthanized by CO2 asphyxiation for collection of ileal digesta. Ileum was
defined from the yolk sac diverticulum to the ileo-cecal junction. After collection, samples were
frozen at -20 C, freeze-dried and ground for further analysis.
The true AA digestibilities of the diets from both experiments were determined using the
total fecal collection “precision-fed” cecectomized rooster assay [3], for which adult, single-
comb White Leghorn roosters were cecectomized at 21 wk of age, and allowed a recovery time
of three months before the force-feeding was carried out. After a 24 hour-fasting period, four
roosters were fed a 35-gram sample of each diet via crop intubation. Additionally, four roosters
were feed-deprived to estimate endogenous AA secretions. Forty eight hours after the crop
intubation, excreta were collected, freeze-dried and ground. In order to obtain a sufficient
amount of ileal digesta or excreta for all analyses, samples of two pens per treatment were
combined, thus AA content in digesta and excreta and AIA in digesta were determined in three
samples per treatment. Feed, ileal digesta and excreta samples were submitted to a laboratory
[16] for AA quantification.
100
A subset of diet and ileal digesta samples was analyzed for AIA as reported by Scott and
Boldaji [17] in duplicate. The apparent ileal digestibility coefficients, using AIA as indigestible
marker, were calculated with the following formula:
{% AAf – [% AAi x % (AIAf /% AIAi)]}/ % AAf
where % AAf = pecent of AA in the feed; % AAi = percent of AA in the ileal digesta; %
AIAf = percent of AIA in the feed; % AIAi = percent AIA in ileal digesta. The apparent
digestibility coefficients were transformed to ‘standardized’ ileal digestibility by correcting for
the basal endogenous AA losses using the values obtained by the enzymatically hydrolyzed
casein method as reported by Lemme et al. [4], with the following formula:
Standardized digestibility coefficient (%) = Apparent digestibility coefficient (%) +
(Basal endogenous AA losses, as g/kg dry matter intake)/(AA content of the feedstuff, g/kg dry
matter) x 100.
The true AA digestibilities were calculated with the following formula:
{[AA feed (mg) – AA excreta (mg) + Endogenous AA (mg)] / AA feed (mg)} x 100.
Statistical analysis
Digestibility coefficients were analyzed by Analysis of Variance through the ANOVA
procedure of SAS® [18]. When significant differences were detected, treatment means were
separated and compared by the Tukey’s multiple comparison procedure of SAS® [18].
RESULTS AND DISCUSSION
Concentrations of AA in the test diets are presented in Tables 3 and 4. Digestibility
coefficients from Experiment 1 are shown in Tables 5 and 6. With the exception of histidine in
poultry by-product meal, and cysteine in fish meal, the digestibility coefficients of all AA were
significantly lower at 7d of age than those determined in adult roosters in all the ingredients
101
tested. The magnitude of the difference between the two assays varied greatly depending upon
the ingredient and the AA. For instance, lysine digestibility as determined by the rooster assay
was approximately 20% greater in soybean meal and 35% greater in cottonseed meal. In both
poultry by-product and fish meal, cysteine digestibility was remarkably low in chicks at 7 d of
age (27.8 and 48.1%, respectively) and roosters (44.4 and 47.5%, respectively). Lysine and
methionine digestibilities in cottonseed meal were also low in chicks at 7 d of age (29.6 and
37.7%, respectively). Low AA digestibility of cottonseed meal has been well documented [1, 12,
14], although no digestibility value has been reported in 7 d-old chicks for this feed ingredient.
Results from Experiment 2 are shown in Tables 7, 8, and 9. In corn, no differences were
observed in the digestibilities of lysine, methionine, arginine, threonine, valine and cysteine
between the chick assay at 7 and 21 d of age and the rooster assay. For the other AA, no
differences were detected in the chick assay at 7 and 21 d of age, but these coefficients were
significantly lower than those obtained by the rooster assay.
In wheat, the digestibility coefficients obtained by the rooster assay were significantly
greater than those obtained by the chick assay at 7 d, only with the exception of isoleucine.
Between the ileal digestibility assay in 21 d-old chick and the rooster assay, no significant
differences were found in histidine, leucine, methionine, cysteine, threonine and valine
digestibilities. Comparing the results within the chick assay at 7 or 21 d, only lysine, leucine,
phenylalanine and cysteine digestibilities were significantly lower at 7 d of age.
In soybean meal, the digestibilities of all the indispensable AA obtained by the rooster
assay were significantly greater than that obtained in 7 d-old chicks, and with the exception of
arginine, methionine, and isoleucine, also significantly greater than that in 21 d-old chicks.

102
Digestibilities of all the indispensable AA obtained by the chick assay were not different
between 7 and 21 d of age, with the only exception of threonine.
In poultry by-product meal, feather meal, and fish meal, the rooster assay yielded
significantly greater digestibility coefficients for all AA than those obtained by the chick assay.
Only with the exception of cysteine in feather meal, and lysine in fish meal, results at 7 and 21 d
of age were not significantly different.
The ileal digestibility coefficients determined at 21 d of age, before correction for
endogenous losses, are in very close agreement with the apparent ileal AA digestibility
coefficients published in previous reports [14, 19, 20]. Likewise, after correction for endogenous
AA secretions of the data reported herein, the standardized AA digestibility coefficients obtained
in 21 d-old chickens are in reasonable agreement with those reported by Lemme et al. [4] for
most AA. Individual differences might be due to variations among quality and origin of the
ingredients tested.
The standardized ileal digestibility coefficients did not differ significantly between 7 and
21 d-old chicks for the majority of the ingredients tested, which may be due to a low number of
replications (n = 3). Nevertheless, it was clear that the true AA digestibility coefficients
estimated by the precision-fed, cecectomized rooster assay, were different from the standardized
AA digestibility coefficients obtained in 7 and 21 d-old chicks, with the exception of corn and
some AA in wheat. This might not be surprising, since there are several methodological
differences between the two assays. In the chicken ileal AA digestibility assay, the birds had free
access to the feed, which is a normal feeding behavior, although it might represent a problem for
low palatable ingredients. The test diets contained an indigestible marker, which is expected to
follow the feed through the gastrointestinal tract at the same flow rate. However, for some

103
markers it has been demonstrated not always to be the case [21]. Quantification of AA was
carried out in ileal digesta, assuming that AA absorption at this intestinal portion has been
completed. However, there is evidence showing that this assumption might not be true [22].
Moreover, significantly greater protein digestibilities have been found in digesta samples taken
at the distal ileum as compared to the proximal or the entire ileum [23]. In the rooster assay, on
the other hand, the birds were force-fed, which is not a normal feeding behavior pattern but it
overcomes the problem of diets with low palatability. In the present study, the diets fed to
roosters contained an inert marker, however it was not used to estimate intake and excretion.
Therefore, the amount of both feed and excreta was determined, and results were based on total
excreta collection. Whereas criticisms exist in regard of the reliability of data obtained by the use
of indigestible markers for determination of nutrient digestibility, early reports suggested that
total collection methods were less precise [24]. Finally, in the rooster assay AA quantification
was carried out in excreta. For both assays, there is a correction for endogenous losses, which
varies substantially depending upon the method of estimation [9, 10]. Fasting was the method to
estimate endogenous losses for the rooster assay reported herein because it has been used in
several studies published as reference values [1, 6, 25]. It has been argued, however, that it is
probably not appropriate since it creates an abnormal physiological state [4]. The enzymatically-
hydrolyzed casein method has been preferred to estimate endogenous losses because it
overcomes the downsides of the other methods. Therefore, endogenous losses values obtained
through this method have been proposed for standardization of the apparent ileal AA digestibility
[4]. Comparatively, fasting birds usually yields the lowest endogenous losses values, but if
values obtained from other methods are used, digestibility values from the rooster assay become
greater than 100 % [10].

104
Another potential source of variation between the two assays tested is the different age of
the birds used. The digestive capabilities of seven d-old chicks are not fully developed [26],
which could explain the lower AA digestibilities in birds of that age as compared to adult
roosters. Lower AA digestibilities in young chickens have been well documented. Ten Doeschate
et al. [27] reported lower digestibility coefficients for some AA obtained in 29 d-old chickens as
compared to those obtained at 43 d of age. Increasing AA digestibility from 14 to 28 d and in
some cases to 42 d of age was reported by Huang et al. [14] for several feed ingredients.
In the present research there was an indication that the AA digestibility coefficients will
differ depending upon the methodology employed for their estimation. In recent years, however,
it has been recognized that the standardized ileal digestibility assay might be more appropriate
for estimation of AA digestibility, although the rooster assay can be more advantageous for
routine evaluation of feed ingredients. Thus, what method should be selected is still debatable.
The data reported herein also suggested that for some feed ingredients, AA digestibility
coefficients obtained by the rooster assay might not be applicable to young chicks. Thus, the
incorporation of different AA digestibility values in diet formulation for young chickens might
become necessary. The practicality of this application, however, remains to be evaluated.
CONCLUSIONS AND APPLICATIONS
1. The AA digestibility coefficients as determined by the precision-fed
cecectomized rooster assay are not applicable for young chicks during the first
week posthatch.
2. There is variation in the AA digestibility coefficients of several feed
ingredients depending upon the method of determination.

105
REFERENCES AND NOTES
1. National Research Council. 1994. Nutrient requirements of poultry. 9th rev. ed.
National Academy Press, Washington, DC.
2. Lesson, S., and J. D. Summers. 2001. Scott’s nutrition of the chicken. 4th ed.
University books, Guelph, Ontario, Canada.
3. Han, Y., and C.M. Parsons. 1990. Determination of available AA and energy in alfalfa
meal, feather meal, and poultry by-products by various methods. Poult. Sci. 69:1544-1552.
4. Lemme, A., V. Ravindran, and W. L. Bryden. 2004. Ileal digestibility of AAs in feed
ingredients for broilers. World’s Poult. Sci. 60:423-437.
5. Rostagno, H. S., J. M. R. Pupa, and M. Pack. 1995. Diet formulation for broilers based
on total versus digestible AAs. J. Appl. Poult. Res. 4:293-299.
6. Parsons, C. M. 1991. AA digestibilities for poultry: Feedstuff evaluation and
requirements. Kyowa Hakko Technical review-1. (Kyowa: Chesterfield, MO) 15 pp.
7. Rhone-Poulenc. 1995. Digestibility database for poultry. (Rhone-Poulenc Animal
Nutrition: Antony, France).
8. Heartland Lysine. 1996. Digestibility of essential AAs for poultry and swine, Version
3.3. (Heartland Lysine, Inc., Chicago.)
9. Ravindran, V. and W. L. Bryden. 1999. AA availability in poultry-in vitro and in vivo
measurements. Aust. J. Agric. Res. 50:889-908.
10. Parsons, C. M. 2002. Digestibility and bioavailability of protein and AAs. Pages 115-
135 in Poultry Feedstuffs: supply, composition, and nutritive value. J. M. McNab and K. N.
Boorman, eds. CABI, Oxon, UK.

106
11. Payne, W. L., G. F. Combs, R. R. Kiefer, and D. G. Snider. 1968. Investigation of
protein quality-ileal recovery of AAs. Federation Proceedings. 27:1199-1203.
12. Fernandez, S. R., Y. Zhang, and C. M. Parsons. 1995. Dietary formulation with
cottonseed meal on a total AA versus a digestible AA basis. Poult. Sci. 74:1168-1179.
13. Batal A. B., and C.M. Parsons. 2002. Effects of age on nutrient digestibility in chicks
fed different diets. Poult. Sci. 81:400-407.
14. Huang. K. H., V. Ravindran, X. Li, and W. L. Bryden. 2005. Influence of age on the
apparent ileal AA digestibility of feed ingredients for broiler chickens. Br. Poult. Sci. 46:236-
245.
15. Petersime Incubator Co., Geltysburg, OH 45328.
16. Agriculture Experiment Station Chemical Laboratories, University of Missouri-
Columbia, Columbia, MO 65211.
17. Scott, T. A., and F. Boldaji. 1997. Comparison of inert markers (chromic oxide or
insoluble ash (Celite™) for determining apparent metabolizable energy of wheat- or barley-
based broiler diets with or without enzymes. Poult. Sci. 76:594-598.
18. SAS Institute Inc., 1990. SAS STAT User’s Guide Release 6.08. SAS Institute Inc.,
Cary NC.
19. Ravindran, V., L. I. Hew, G. Ravindran, and W. L. Bryden. 1999. A comparison of
ileal digesta and excreta analysis for the determination of AA digestibility in food ingredients for
poultry. Br. Poult. Sci. 40:266-274.
20. Kadim, I. T., P. J. Mougham, V. Ravindran. 2002. Ileal AA digestibility assay for the
growing meat chicken-comparison of ileal and excreta AA digestibility in the chicken. Br. Poult.
Sci. 44:588-597.

107
20. Oberleas, D., Y. C. Li, B. J. Stoecker, S. A. Henley, K. S. Keim, and J. C. Smith.
1990. The rate of chromium transit through the gastrointestinal tract. Nutr. Res. 1990, Oct. 10.
21. Webb, K. E. 1990. Intestinal absorption of protein hydrolysis products: a review. J.
Anim. Sci. 6:3011-3022.
22. Jallier, V., G. Buecheller, R. Aureli, and A. M. Klunter. 2003. Influence of the
methodology of sampling content from different parts of the ileum on the values of apparent ileal
digestibility in broiler chickens. Br. Poult. Sci. 44:807-809 (Abstract).
23. Sibbald, I. R., J. D. Summers, and S. J. Slinger. 1960. Factors affecting the
metabolizable energy content of poultry feeds. Poult. Sci. 39:544-556.
24. Sibbald, I. R. 1986. The T. M. E. system of feed evaluation: methodology, feed
composition data and bibliography. Technical bulletin 1986-4E, Agriculture Canada, Ottawa.
114 pp.
25. Sklan, D. 2001. Development of the digestive tract in poultry. World’s Poult. Sci. J.
57:415-428.
26. Ten Doeschate, R. A. H. M., C. W. Scheele, V. V. A. M. Schreurs, and J. D. Van der
Klis. 1993. Digestibility studies in broiler chickens: influence of genotype, age, sex and method
of determination. Br. Poult. Sci. 34:131-146.

108
TABLE 4.1. Composition of the diets (%) used in the AA digestibility assays, Experiment 1
Ingredients Soybean
meal Cottonseed
meal Poultry by-
product meal Fish meal
% Test ingredient 42.11 50.00 30.89 31.75 Dextrose 50.94 41.15 63.67 64.82 Poultry fat 1.50 3.30 1.50 1.50 Limestone 1.31 1.19 0.10 0.10 Dicalcium phosphate 1.81 2.07 --- --- Salt 0.50 0.46 0.16 --- Vitamin premix1 0.25 0.25 0.25 0.25 Mineral premix2 0.08 0.08 0.08 0.08 Celite™3 1.50 1.50 1.50 1.50 Calculated composition TME (kcal/kg) 2,802 2,600 3,183 3,172 Crude protein, % 20.00 20.00 20.00 20.00 Lysine, % 1.26 0.62 0.87 1.62 TSAA, % 0.56 0.38 0.54 0.73 Analyzed composition Lysine, % 1.24 0.72 1.16 1.54 TSAA, % 0.66 0.56 0.59 0.77 1Vitamin mix provided the following (per kg of diet): thiamin•mononitrate, 2.4 mg; nicotinic acid, 44 mg; riboflavin, 4.4 mg; D-Ca pantothenate, 12 mg; vitamin B12 (cobalamin),12.0 µg; pyridoxine•HCl, 4.7 mg; D-biotin, 0.11 mg; folic acid, 0.55 mg; menadione sodium bisulfate complex, 3.34 mg; choline chloride, 220 mg; cholecalciferol, 1,100 IU; trans-retinyl acetate, 5,500 IU; all-rac-tocopherol acetate, 11 IU; ethoxyquin, 125 mg. 2Trace mineral mix provides the following (per kg of diet): manganese (MnSO4•H2O), 60 mg; iron (FeSO4•7H2O), 30 mg; zinc (ZnO), 50 mg; copper (CuSO4•5H2O), 5 mg; iodine (ethylene diamine dihydroiodide), 0.15 mg; selenium (sodium selenite), 0.3 mg. 3Celite Corporation, Lompoc, CA.

109
TABLE 4.2. Composition of the diets (%) used in the AA digestibility assays, Experiment 2
Ingredients
Corn Wheat
Soybean meal
Poultry by- product meal
Feather meal
Fish meal
% Test ingredient 92.25 92.25 47.50 43.40 27.00 37.10 Dextrose --- --- 45.10 49.20 65.60 55.50 Poultry fat 2.00 2.00 2.00 2.00 2.00 2.00 Limestone 1.47 1.47 1.22 1.22 1.22 1.22 Dicalcium phosphate 1.95 1.95 1.85 1.85 1.85 1.85 Salt 0.50 0.50 0.50 0.50 0.50 0.50 Vitamin premix1 0.25 0.25 0.25 0.25 0.25 0.25 Mineral premix2 0.08 0.08 0.08 0.08 0.08 0.08 Celite™3 1.50 1.50 1.50 1.50 1.50 1.50 Calculated composition TME (kcal/kg) 3,303 3,100 2,827 3,099 3,092 3,083 Crude protein, % 7.30 12.50 23.00 23.00 23.00 23.00 Lysine, % 0.22 0.37 1.43 0.95 0.28 1.37 TSAA, % 0.33 0.51 0.67 0.79 0.96 0.82 Analyzed composition Lysine, % 0.37 0.35 1.43 1.28 0.55 1.67 TSAA, % 0.42 0.46 0.67 0.72 1.46 0.87 1Vitamin mix provided the following (per kg of diet): thiamin•mononitrate, 2.4 mg; nicotinic acid, 44 mg; riboflavin, 4.4 mg; D-Ca pantothenate, 12 mg; vitamin B12 (cobalamin),12.0 µg; pyridoxine•HCl, 4.7 mg; D-biotin, 0.11 mg; folic acid, 0.55 mg; menadione sodium bisulfate complex, 3.34 mg; choline chloride, 220 mg; cholecalciferol, 1,100 IU; trans-retinyl acetate, 5,500 IU; all-rac-tocopherol acetate, 11 IU; ethoxyquin, 125 mg. 2Trace mineral mix provides the following (per kg of diet): manganese (MnSO4•H2O), 60 mg; iron (FeSO4•7H2O), 30 mg; zinc (ZnO), 50 mg; copper (CuSO4•5H2O), 5 mg; iodine (ethylene diamine dihydroiodide), 0.15 mg; selenium (sodium selenite), 0.3 mg. 3Celite Corporation, Lompoc, CA.

110
TABLE 4.3. AA concentration1 (%) in the test diets, Experiment 1 AA
Soybean meal
Cottonseed meal
Poultry by- product meal
Fish meal
Indispensable Arginine 1.47 1.85 1.35 1.24 Histidine 0.51 0.44 0.37 0.47 Isoleucine 0.92 0.53 0.70 0.82 Leucine 1.55 0.99 1.30 1.43 Lysine 1.24 0.72 1.16 1.54 Methionine 0.31 0.27 0.39 0.58 Phenylalanine 1.01 0.88 0.70 0.76 Threonine 0.79 0.54 0.73 0.81 Valine 0.97 0.74 0.85 0.96 Dispensable Alanine 0.87 0.67 1.26 1.31 Aspartic acid 2.28 1.51 1.57 1.81 Cysteine 0.35 0.29 0.20 0.19 Glutamic acid 3.62 3.20 2.48 2.66 Serine 0.97 0.70 0.75 0.75 Tyrosine 0.69 0.45 0.52 0.58 1Values reported from the analysis conducted at the Agriculture Experiment Station Chemical Laboratories, University of Missouri-Columbia, Columbia, MO 65211.

111
TABLE 4.4. AA concentration1 (%) in the test diets, Experiment 2 AA
Corn
Wheat
Soybean meal
Poultry by-product meal
Feather meal
Fish meal
Indispensable Arginine 0.50 0.55 1.62 1.43 1.55 1.40 Histidine 0.26 0.27 0.59 0.54 0.19 0.55 Isoleucine 0.34 0.43 1.03 0.93 1.10 0.98 Leucine 1.07 0.82 1.74 1.69 1.88 1.70 Lysine 0.37 0.35 1.43 1.28 0.55 1.67 Methionine 0.21 0.19 0.31 0.40 0.16 0.66 Phenylalanine 0.45 0.55 1.13 0.91 1.09 0.89 Threonine 0.33 0.33 0.85 0.87 1.05 0.91 Valine 0.47 0.53 1.09 1.16 1.69 1.17 Dispensable Alanine 0.71 0.42 0.97 1.58 1.03 1.44 Aspartic acid 0.66 0.57 2.49 1.86 1.51 2.01 Cysteine 0.21 0.27 0.36 0.32 1.30 0.21 Glutamic acid 1.64 3.56 4.03 2.99 2.40 2.85 Serine 0.40 0.50 0.99 0.84 2.28 0.80 Tyrosine 0.31 0.31 0.75 0.66 0.59 0.65
1Values reported from the analysis conducted at the Agriculture Experiment Station Chemical Laboratories, University of Missouri-Columbia, Columbia, MO 65211.

112
TABLE 4.5. Comparison of standardized ileal AA digestibility at 7 d of age in broiler chickens and true AA digestibility in cecectomized roosters for soybean meal and cottonseed meal, Experiment 1
AA Soybean meal1 Cottonseed meal1 7 d Rooster SEM 7 d Rooster SEM
Indispensable Arginine 80.1b 92.0a 1.3 76.2b 89.0a 0.8 Histidine 79.2b 91.6a 1.2 65.1b 82.1a 1.5 Isoleucine 73.0b 90.0a 1.6 42.8b 75.1a 2.0 Leucine 72.2b 89.6a 1.4 47.2b 76.2a 2.1 Lysine 73.2b 90.3a 1.5 29.6b 65.5a 3.0 Methionine 69.5b 82.2a 3.2 37.7b 64.3a 2.0 Phenylalanine 75.0b 91.6a 1.3 65.2b 83.8a 2.2 Threonine 67.5b 78.6a 1.9 44.3b 62.7a 2.3 Valine 71.6b 85.4a 1.8 50.8b 73.4a 1.9 Dispensable Alanine 66.1b 85.6a 1.9 42.6b 73.0a 2.4 Aspartic acid 70.9b 86.9a 1.4 55.4b 77.4a 1.7 Cysteine 62.6b 76.2a 3.3 61.0b 66.8a 1.6 Glutamic acid 76.2b 92.3a 1.3 69.6b 88.4a 1.0 Serine 67.9b 87.5a 1.3 51.9b 77.7a 1.8 Tyrosine 73.2b 91.5a 1.3 52.1b 81.0a 1.8 a-bMeans within row and ingredient with no common superscript differ significantly (P < 0.05). 1Means represent three observations per test ingredient.

113
TABLE 4.6. Comparison of standardized ileal AA digestibility at 7 d of age in broiler chickens and true AA digestibility in cecectomized roosters for poultry by product meal and fish meal, Experiment 1
AA Poultry by-product meal1 Fish meal1 7 d Rooster SEM 7 d Rooster SEM
Indispensable Arginine 68.7b 87.6a 1.6 65.4b 86.8a 0.4 Histidine 64.8 72.8 4.4 66.0 74.9 3.3 Isoleucine 57.9b 93.8a 1.4 58.6b 90.9a 2.3 Leucine 61.4b 80.5a 2.6 62.2b 82.7a 0.8 Lysine 66.1b 83.4a 2.2 65.2b 82.2a 0.9 Methionine 64.6b 85.0a 1.8 62.9b 81.9a 1.6 Phenylalanine 59.4b 85.4a 2.1 57.1b 84.5a 0.5 Threonine 59.3b 76.6a 2.4 58.3b 76.6a 1.3 Valine 56.5b 82.4a 2.2 59.3b 83.0a 0.3 Dispensable Alanine 61.9b 85.5a 1.3 61.4b 83.6a 0.4 Aspartic acid 45.5b 72.3a 1.9 54.2b 77.0a 0.8 Cysteine 27.8b 44.4a 4.6 48.1 47.5 5.8 Glutamic acid 59.6b 84.1a 1.6 59.6b 85.7a 0.2 Serine 55.0b 75.0a 2.8 55.7b 75.2a 1.2 Tyrosine 54.2b 76.7a 3.9 57.0b 79.9a 0.9
a-bMeans within row and ingredient with no common superscript differ significantly (P < 0.05).
1Means represent three observations per test ingredient.

114
TABLE 4.7. Comparison of standardized ileal AA digestibility at 7 and 21 d of age in broiler chickens and true AA digestibility in cecectomized roosters for corn and wheat, Experiment 2
AA Corn1 Wheat1 7 d 21 d Rooster SEM 7 d 21 d Rooster SEM
Indispensable Arginine 86.3 89.9 92.5 2.0 76.6b 78.6b 91.7a 1.9 Histidine 88.3 92.2 91.7 2.3 78.4b 88.2a 92.8a 1.4 Isoleucine 67.6b 79.4ab 95.0a 6.9 60.3 77.4 93.5 11.0 Leucine 91.9b 94.5ab 98.0a 1.7 80.1b 91.4a 95.8a 2.1 Lysine 80.4b 87.4ab 92.0a 2.6 57.6c 76.7b 90.6a 3.3 Methionine 84.1 88.9 91.5 2.4 65.1b 78.4ab 87.0a 5.7 Phenylalanine 87.2b 91.6b 98.6a 1.9 80.9c 91.2b 97.9a 1.6 Threonine 74.9 84.0 81.7 4.0 55.0b 80.8a 77.8a 3.8 Valine 83.9 90.5 90.6 2.3 69.7b 85.9a 88.3a 2.7 Dispensable Alanine 86.2b 88.5b 95.5a 1.3 58.0b 74.0ab 85.7a 4.7 Aspartic acid 76.4b 78.2b 87.2a 2.3 49.7b 62.2b 80.6a 5.1 Cysteine 82.9 84.7 86.6 2.7 77.7b 86.2a 89.5a 1.6 Glutamic acid 87.6b 89.8b 95.6a 1.2 89.7c 93.3b 97.5a 1.0 Serine 77.9b 78.9b 92.7a 1.9 70.8b 79.9b 91.8a 2.9 Tyrosine 84.6b 86.5b 96.5a 2.6 77.3b 83.7b 94.7a 2.2
a-cMeans within row and ingredient with no common superscript differ significantly (P < 0.05).
1Means represent three observations per test ingredient.

115
TABLE 4.8. Comparison of standardized ileal AA digestibility at 7 and 21 d of age in broiler chickens and true AA digestibility in cecectomized roosters for soybean meal and poultry by-product meal, Experiment 2
AA Soybean meal1 Poultry by-product meal1 7 d 21 d Rooster SEM 7 d 21 d Rooster SEM
Indispensable Arginine 78.1b 85.7ab 92.6a 2.5 70.7b 76.3b 88.2a 3.3 Histidine 81.7b 80.7b 91.9a 1.7 66.3b 63.4b 80.2a 3.4 Isoleucine 66.3b 77.6ab 93.6a 5.9 67.4b 67.4b 83.9a 3.4 Leucine 75.7b 79.6b 94.0a 2.4 67.6b 65.8b 85.4a 3.4 Lysine 80.4b 83.0b 94.4a 1.4 64.6b 67.0b 82.1a 3.0 Methionine 72.1b 76.0ab 89.0a 5.0 57.3b 55.9b 82.4a 3.0 Phenylalanine 79.0b 77.7b 95.7a 1.4 68.3b 66.3b 86.4a 3.4 Threonine 67.4c 70.5b 83.2a 3.4 57.8b 64.0b 78.5a 4.2 Valine 75.4b 75.8b 90.2a 2.1 62.9b 63.5b 80.3a 2.7 Dispensable Alanine 71.7b 72.8b 90.3a 2.7 69.1b 67.0b 84.4a 2.3 Aspartic acid 67.0c 78.0b 90.2 a 2.9 46.7b 53.8b 73.2a 3.4 Cysteine 57.8b 65.5b 83.5a 3.6 48.6b 55.8ab 73.8a 5.3 Glutamic acid 81.5b 77.8b 94.4a 1.7 67.4b 63.8b 84.1a 3.1 Serine 68.0c 78.7b 89.6a 2.9 53.9b 64.0b 81.5a 4.8 Tyrosine 86.1ab 80.9b 95.3a 3.8 64.5b 71.0ab 86.8a 5.2
a-cMeans within row and ingredient with no common superscript differ significantly (P < 0.05).
1Means represent three observations per test ingredient.

116
TABLE 4.9. Comparison of standardized ileal AA digestibility at 7 and 21 d of age in broiler chickens and true AA digestibility in cecectomized roosters for feather meal and fish meal, Experiment 2
AA Feather meal1 Fish meal1 7 d 21 d Rooster SEM 7 d 21 d Rooster SEM
Indispensable Arginine 55.3b 66.3b 84.9a 3.9 89.1b 87.8b 95.1a 1.0 Histidine 51.4 53.8 63.8 6.4 81.9b 85.8b 92.2a 1.5 Isoleucine 70.3b 70.9b 89.5a 2.7 82.5c 86.8b 95.4a 1.2 Leucine 59.8b 66.2b 86.4a 3.3 83.1b 86.8b 95.9a 1.1 Lysine 50.0b 52.3b 70.0a 4.9 82.0c 86.5b 94.0a 1.2 Methionine 38.6b 45.8b 66.8a 4.7 81.7b 84.5b 93.8a 4.6 Phenylalanine 61.9b 69.2b 89.0a 2.9 82.9b 85.5b 95.8a 1.5 Threonine 43.2b 47.7b 69.5a 4.1 81.7b 83.4ab 91.4a 2.3 Valine 64.4b 63.3b 83.4a 3.2 79.9b 84.3b 92.7a 1.5 Dispensable Alanine 57.1b 61.0b 82.6a 3.0 80.9b 84.7b 93.8a 1.3 Aspartic acid 19.7b 29.5b 51.4a 5.6 74.9b 74.7b 91.1a 1.2 Cysteine 33.2b 44.8ab 60.9a 5.2 65.6b 69.3b 80.5a 3.2 Glutamic acid 45.8b 55.6b 75.5a 3.6 79.9b 84.0b 94.0a 1.5 Serine 51.0c 64.3b 81.4a 3.6 80.7b 77.1b 91.3a 2.3 Tyrosine 65.4 60.2 80.9 7.7 79.3b 82.9b 94.4a 1.6
a-cMeans within row and ingredient with no common superscript differ significantly (P < 0.05).
1Means represent three observations per test ingredient.

117
CHAPTER 5
FOOT ASH AS A MEANS OF QUANTIFYING BONE MINERALIZATION IN CHICKS1
1 A. R. Garcia, and N. M. Dale. To be submitted to the Journal of Applied Poultry Research.

118
SUMMARY
Three studies were conducted to evaluate foot ash (FA) as an alternative method to
quantify the degree of bone mineralization in broiler chicks. In experiment 1, the objective was
to evaluate whether or not degree of bone mineralization would be reflected by foot ash in broiler
chickens at 14 d of age. Birds receiving 0.24, 0.32 or 0.40% of dietary available phosphorus
(AP) demonstrated significant differences in foot ash (10.93, 13.46 and 15.45%, respectively). In
experiment 2, it was determined that the time required for a foot sample to dry to a constant
weight at 105 C was 48 h. In experiment 3, the objective was to compare the response of bone
mineralization to dietary phosphorus levels as reflected by foot ash and by tibia bone ash, and
also to evaluate the effect of fat extraction on the determination of these parameters. Broiler
chicks were fed graded levels of AP (0.25, 0.30, 0.35 and 0.40%) from 1 to 14 d of age.
Significantly different responses between each dietary AP level could be detected by any method
used. A significant linear response was observed between dietary AP and percent of extracted or
unextracted tibia or foot ash, with determination coefficients above 90% found for all four
methods used. The slopes of the response to graded levels of AP as reflected by the standard “fat
extracted tibia” and “unextracted foot ash” assays were not significantly different. Results
confirmed that the dietary phosphorus levels affected bone mineralization and that the degree of
mineralization could reliably be reflected by foot ash. The assay was found to be as reliable as
the tibia bone ash in reflecting degree of bone mineralization in chicks during the first 14 d of
age. Fat extraction did not affect the reliability of either assay.
Key words: Foot ash, tibia bone ash, bone mineralization, phosphorus, broilers.

119
DESCRIPTION OF PROBLEM
The need to quantify bone mineralization has long been recognized by researchers in
poultry nutrition and physiology. At the present time, and for most of the past century, the most
popular assay for this purpose is that of tibia bone ash as described by the AOAC [1]. This well
known assay has been successfully used in innumerable studies, but has the disadvantage of
being very labor intensive and thus slow and expensive. As early as 1855, Fremy [2] conducted
studies to determine the ash content of bones of numerous animal species. In the following
decades, bone ash was used to quantify skeletal abnormalities in rachitic children [3] and horses
[4] as well as in other species. Determination of bone ash was thus a well established technique
for describing skeletal abnormalities long before the need arose for a means to quantify bone
mineralization in poultry.
Some of the first uses of bone ash as a parameter in nutrition research are described in the
reports of Bethke et al. [5] and Dutcher [6] in work with rats in 1923 and 1925, respectively.
Still, in the early 1920’s [7] and as late as 1926 [8], body weight gain and death were often the
principal response criteria in poultry research on anti-rachitic factors. In the late 1920’s,
however, a series of three studies on rickets in chickens by Heuser and Norris at Cornell
University [9, 10, 11] firmly established tibia bone ash as the most popular parameter for
quantifying bone mineralization. Upon review of these and other papers from the period,
however, it is evident that no effort was made to compare the efficacy of this assay with other
less tedious procedures. Instead, when researchers began to focus attention on the anti-rachitic
properties of cod liver oil [9, 10] and direct sunlight [11], and needed an assay to quantify bone
mineralization, a procedure (bone ash) was adopted which had been reported in the scientific
literature for almost 80 years. However, it is clear from reviewing these papers that the bone ash
assay was simply adopted and never critically tested or compared to other possible assays. Very

120
small numbers of chicks (as few as three per treatment) were often used in these studies. As
differences in response were often great, it was correctly observed that tibia (and/or tibia +
femur) ash was in fact a useful parameter. Thus, while the tibia bone ash assay has served
researchers very well for almost a century, it has never been demonstrated to be a superior or
simpler and less time intensive procedure. During the early 1940’s, several studies explored the
use of toe ash as a means of quantifying bone mineralization, and found it to be equally
acceptable to the existing tibia ash assay [12, 13]. The toe ash assay has been used sporadically
since (14, 15), with Yoshida and Hoshii [16] reporting a high degree of correlation with tibia
bone ash. More recently, Ravindran et al. [17] in studies on the biological availability of
phosphorus, found toe ash plus body weight to be slightly more sensitive than tibia ash, and were
vastly easier to obtain.
The “tips” or “heads” are those portions of the bone most sensitive to differences in
mineralization, as they include the growth plate. Thus, it can be hypothesized that the entire foot,
with 17 individual bones [18], as opposed to a tibia or toe, might well be the appendage of choice
in bone mineralization tests. Such an assay was initially evaluated at this laboratory [19, 20] and
found to give encouraging results. It is obvious that use of the dried whole foot, rather than the
dried, cleaned, fat extracted tibia would constitute a far less labor-intensive assay. The question
remains as to whether possible differences in skin, scales, flesh and fat might introduce an
unacceptable artifact into the results of a foot ash assay.
A series of studies was conducted to refine an assay for foot ash, and to evaluate whether
this assay might prove reliable in reflecting degree of bone mineralization in chicks. Should
these studies prove successful, the assay might also prove to be of special value in diagnosing leg
problems in the field, where the traditional tibia ash assay is far too slow.

121
MATERIALS AND METHODS
Experiment 1
This experiment was conducted to determine if the foot ash assay would be sensitive
enough to detect differences in bone mineralization in response to varying levels of dietary
phosphorus. Ninety one-day-old broiler chickens were randomly assigned to three dietary
treatments containing 0.24, 0.32 and 0.40% available phosphorus (AP) These levels were
designed to cover a range from a severe deficiency to a marginally adequate level. Treatments
contained three replicates of ten birds each. Nutrient levels for all dietary treatments were based
on those used in commercial broiler starter diets [21] varying only in AP concentrations (Table
1). The birds were allocated to battery brooders and fed the experimental diets ad libitum from 1
to 14 d of age. Body weight and feed intake were recorded and body weight gain and feed
conversion calculated at the end of the experiment. The chickens were euthanized by CO2
asphyxiation, and the foot samples obtained by severing the foot at the tibio-metatarsal joint,
labeled, dried for 60 h at 105 C, weighed, placed in porcelain crucibles to be ashed at 600 C
overnight.
Experiment 2
Since the ash determination is based on the dry weight of a sample before ashing, the
objective of this study was to determine the minimum time required to obtain an adequately
dried foot for the foot ash assay. Because muscle, tendons, skin and adipose tissue are not
removed, a satisfactory drying time could be markedly extended. Thirty feet were obtained from
sixteen day-old broiler chickens. All birds had been fed a diet adequate in all nutrients (Tables 1
and 2) containing 0.45% AP and 0.90% calcium. No symptoms of disease were observed. The
feet were severed at the tibio-metatarsal joint, labeled, weighed and placed in a drying oven at
105 C. At 6, 12, 24, 36, 48, 60, 72 and 90 h, all the feet were removed from the drying oven to

122
record their weight, and immediately returned to continue drying. After 90 h, all feet were ashed
at 600 C overnight, and the ash percent was calculated considering the weight at each time the
samples were removed.
Experiment 3
The objective of this experiment was to compare the results of the foot ash and the tibia
bone ash assays, and to investigate whether or not fat extraction would affect the ability of these
assays to detect differences in bone mineralization as a response to dietary phosphorus. One
hundred and sixty one-d-old broiler chickens were randomly assigned to four dietary treatments,
consisting of graded levels of AP (0.25, 0.30, 0.35 and 0.40%). The diets were formulated to be
isocaloric and isonitrogenous, varying only in the concentrations of AP mentioned above.
Nutrient requirements were based on those used in commercial broiler starter diets [21] (See
Table 2). The birds were housed in battery brooders and received the experimental diets ad
libitum from 1 to 14 d of age. At the end of the experiment, body weight gain and feed
conversion were calculated. For the tibia and foot ash assays, the chickens were euthanized with
CO2 and both tibiae and feet from each bird per pen were removed and labeled to preserve the
identity of the four samples. All tibias were boiled for approximately five min to loosen the
muscle and connective tissue, which were removed along with the fibulae, leaving the lateral
condyle and the ossified tibial cartilage [18]. The right tibiae were used for determining the
percent of ash according to the AOAC method [1] that includes a fat extraction procedure. The
left tibiae were cleaned from adhering tissue, dried, and ashed without fat extraction. The left
feet were subjected to the same fat extraction procedure as the right tibiae. The right feet were
assayed for foot ash as described for Experiment 1.
Statistical analysis

123
Body weight gain, feed conversion and percent of bone ash were analyzed by the
ANOVA procedure of SAS® [22], followed by the Tukey’s test for comparison of treatment
means. Bone ash data obtained from each method used in Experiment 3 was regressed to
supplemental phosphorus intake, and fitted to a linear model using Proc Reg of SAS® [22].
RESULTS AND DISCUSSION
In Experiment 1 (Table 3), as dietary AP increased, significantly greater weight gains
were observed, while feed conversion decreased with each increase in AP. There was a
significant increase in the percent of foot ash with increasing AP, which followed a significantly
linear response (r2 = 0.90). Therefore, foot ash effectively reflected the response in bone
mineralization to different dietary phosphorus levels, and it could potentially be employed to
quantify bone mineralization status in chickens.
The calculated percent of foot ash for each drying time is presented in table 4. The
percent of foot ash increased significantly from 0 to 24 h of drying, indicating that moisture
content of the feet had yet to reach a plateau. No significant increases were observed thereafter.
However, at 24 h the sample was not completely dry, since the ash percent difference between 24
and 90 h drying was 0.2 percent. The dry weight did not become virtually constant until after 48
h. Thus, for diagnostic purposes where speed is necessary, a 24 h drying period would be
adequate, but for research purposes, a 48 h drying period is necessary.
In Experiment 3, the chicks fed 0.25 % AP had significantly lower weight gain (Table 5),
than the chicks of the other treatments. No significant differences in feed conversion were
observed at any dietary AP level. The percent ash (Table 6) obtained by all four assay procedures
conducted herein was significantly responsive to dietary phosphorus levels, and significant
differences could be detected at each dietary level of AP. The ash percent obtained by all the

124
assays followed a significantly linear response, and determination coefficients obtained by each
method were above 90%. Fat extraction did not affect the sensitivity of either tibia or foot ash
assays. Numerically, the greatest bone ash percentage was observed in the lipid-free tibia ash
assay, where the response ranged from 31.8 to 41.4% from 0.25 to 0.40% dietary AP. This is not
surprising since the percentage of ash is highly dependent on the amount of organic matter
burned. For the unextracted tibia, the percent of ash at each phosphorus levels was slightly lower
than for the lipid-free tibia, ranging from 29.6 to 39.1%. When fat was extracted from the feet, a
slightly higher percentage of ash was also observed. However, this did not affect the sensitivity
of the assay. For the fat-extracted foot ash assay, results ranged from 11.7 to 16.3%, whereas for
the unextracted foot ash, values ranged from 11.6 to 15.7%. The effect of fat extraction in
reducing variation between samples was first noted in the early 1920’s by Bethke et al. [5] when
femur and tibia of rats were analyzed. Ever since, the lipid extraction procedure has been part of
the tibia bone ash method. However, under the present conditions, fat extraction did not affect
the sensitivity of the assays, since significant differences between dietary phosphorus levels
could be detected by using either the unextracted foot or tibia ash methods. Bone ash
measurements from older birds may be more variable due to higher lipid content, although that is
still subject of evaluation.
In numerous reports, it has been demonstrated that alternative methods to assess bone
mineralization are highly correlated to tibia ash, particularly toe ash [12, 13, 14, 15, 17]. Foot
ash might represent bone mineralization status more accurately than toe ash since a greater
number of bones are being included in the determination. This, however, was not addressed in
the current studies. A high degree of agreement between tibia and foot ash should not be
surprising, and has been previously suggested [19, 20, 23].

125
Further evaluation on how responsive foot ash might be to other factors influencing bone
mineralization such as calcium or vitamin D is still necessary. Nonetheless, the use of foot ash as
a criterion would facilitate research on feed ingredients or feed additives that influence bone
mineralization. Moreover, a potential exists for its use in assessing bone mineralization disorders
under field situations in a more rapid and expeditious manner, since results can be obtained
within 36 h after the samples arrive at the laboratory.
CONCLUSIONS AND APPLICATIONS
1. The foot ash assay effectively reflects differences in bone mineralization from different
levels of dietary phosphorus, being at least as precise as the tibia bone ash assay.
2. Fat extraction did not affect the sensitivity of either tibia or foot ash assays. This
drastically decreases the time required to conduct these assays.
3. The simplicity of the foot ash assay should encourage its use in a variety of applications
including research and diagnostics.

126
REFERENCES AND NOTES
1. Association of Official Analytical Chemists. 2000. Pages 61-62 in: Official Methods of
Analysis of the Association of Official Analytical Chemists. 17th ed. Vol. 2. Washington, DC.
2. Fremy, Edmond. 1855. Recherches chimiques sur les os. Annales de chim. Et de phys.
214 (43 of ser. 3), 47-109.
3. Brubacher, H. 1890. Ueber den Gelhalt an anorganishen Stoffen, besonders and Kalk,
in den Knochen und Organen normaler und rhachitisher kinder. Zeitschrift fur biologie. 27:517-
549.
4. McCrudden, F. H. 1910. Studies on bone metabolism, especially the pathological
process, etiology and treatment of osteomalacia. Arch. Int. Med. 5:596-630.
5. Bethke, R. M., H. Steenbock, and M. T. Nelson. 1923. Fat-soluble vitamins. XV.
Calcium and phosphorus relations to growth and composition of blood and bone with varying
vitamin intake. J. Biol. Chem. 58:71-103.
6. Dutcher, R. A., M. Creighton, and H. A. Rothrock. 1925. Vitamin studies. XI.
Inorganic blood phosphorus and bone ash in rats fed on normal, rachitic, and irradiated rachitic
diets. J. Biol. Chem. 66:401-407.
7. Hart, E. B., H. Steenbock, S. Lepkovsky, and J. G. Halpin. 1923. The nutritional
requirements of baby chicks. III. The relation of light to the growth of the chicken. J. Biol.
Chem. 58:33-42.
8. Mussehl, F. E., R. Hill, and J. A. Rosenbaum. 1926. The antirachitic properties of
irradiated feedstuffs. Poult. Sci. 6:25-30.
9. Heuser, G. F. and L. C. Norris. 1926. Rickets in chicks. I. Variations in the antirachitic
potency of different brands of cod liver oil. Poult. Sci. 6:9-17.

127
10. Heuser, G. F. and L. C. Norris. 1926. Rickets in chicks. II. Variations in the
antirachitic potency of different grades of cod liver oil. Poult. Sci. 6:94-98.
11. Heuser, G. F., and L. C. Norris. 1928. Rickets in chicks. III. The effectiveness of mid-
summer sunshine and irradiation from a quartz mercury vapor arc in preventing rickets in chicks.
Poult. Sci. 8:89-98.
12. Baird, F. D., and M. J. MacMillan. 1942. Use of toes rather than tibiae in A.O.A.C.
chick method of vitamin D determination. J. Assoc. Off. Agric. Chem. 25:518-524.
13. Evans, R. J. and J. S. Carver. 1944. The toe ash as a measure of calcification in
chicks. Poult. Sci. 23:351-352.
14. Fritz, J. C. and T. Roberts. 1968. Use of toe ash as a measure of calcification in the
chick. J. Assoc. Off. Anal. Chem. 51:519-594.
15. Potter, L. M. 1988. Bioavailability of phosphorus from various phosphates based on
body weight and toe ash measurements. Poult. Sci. 67:96-102.
16. Yoshida, M. and H. Hoshii, 1983. Relationship between ash contents of the tibia bone
and the toe of chicks. Jpn. Poult. Sci. 20:51-54.
17. Ravindran V., E. T. Kornegay, L. M. Potter, B. O. Ogunabameru, M. K. Welten, J. H.
Wilson, and M. Potchanakorn. 1995. An evaluation of various response criteria in assessing
biological availability of phosphorus for broilers. Poult. Sci. 74:1820-1830.
18. Lucas A. M., and P.R. Stettenheim. 1972. Avian anatomy and integument. Part I.
Page 35 in Superintendent of documents, U. S. Government printing office, Washington, DC.
19. Méndez, A., and N. Dale. 1998. Foot ash as a parameter to assay bone mineralization.
Poult. Sci. 77 (Suppl. 1) 40 (Abstract).

128
20. Méndez, A, N. Dale, and M. Garcia. 1998. Comparison of parameters to assay bone
mineralization. Poult. Sci. 77 (Suppl. 1) 176 (Abstract).
21. Agri-Stats, Fort Wayne, IN, USA.
22. SAS Institute Inc., 1990. SAS STAT User’s Guide Release 6.08. SAS Institute Inc.,
Cary, NC.
23. Dale, N., and A. R. Garcia. 2004. Evaluation of foot ash as an alternative to tibia bone
ash for quantifying bone mineralization. Int. Poult. Scientific Forum, Abstract No. 119.

129
TABLE 5.1. Composition (as fed-basis) of the experimental diets, Experiment 2
Ingredient 0.24% AP 0.32% AP 0.40% AP % Corn 57.78 57.31 56.82 Soybean meal 36.61 36.68 36.76 Animal fat 2.05 2.23 2.41 Limestone 2.04 1.88 1.73 Dicalcium phosphate 0.53 0.91 1.29 Salt 0.47 0.47 0.47 DL-Methionine 0.20 0.20 0.20 Vitamin mix1 0.25 0.25 0.25 Mineral mix2 0.07 0.07 0.07 Contents by calculation TMEn, kcal/kg 3025 3025 3025 Protein, % 22 22 22 Available phosphorus, % 0.24 0.32 0.40 Calcium, % 0.95 0.95 0.95 1Vitamin mix provided the following (per kg of diet): thiamin•mononitrate, 2.4 mg; nicotinic acid, 44 mg; riboflavin, 4.4 mg; D-Ca pantothenate, 12 mg; vitamin B12 (cobalamin),12.0 µg; pyridoxine•HCL, 4.7 mg; D-biotin, 0.11 mg; folic acid, 5.5 mg; menadione sodium bisulfate complex, 3.34 mg; choline chloride, 220 mg; cholecalciferol, 1,100 IU; trans-retinyl acetate, 5,500 IU; all-rac-tocopherol acetate, 11 IU; ethoxyquin, 125 mg. 2Trace mineral mix provides the following (per kg of diet): manganese (MnSO4•H2O), 60 mg; iron (FeSO4•7H2O), 30 mg; zinc (ZnO), 50 mg; copper (CuSO4•5H2O), 5 mg; iodine (ethylene diamine dihydroiodide), 0.15 mg; selenium (sodium selenite), 0.3 mg.

130
TABLE 5.2. Composition (as fed-basis) of the available-phosphorus deficient diets, Experiment 3 Ingredient 0.25% AP 0.30% AP 0.35% AP 0.40% AP % Corn 57.94 57.71 57.50 57.29 Soybean meal 36.58 36.62 36.65 36.69 Animal fat 2.00 2.08 2.16 2.23 Limestone 1.84 1.67 1.50 1.33 Dicalcium phosphate 0.65 0.93 1.20 1.47 Salt 0.47 0.47 0.47 0.47 DL-Methionine 0.20 0.20 0.20 0.20 Vitamin mix1 0.25 0.25 0.25 0.25 Mineral mix2 0.07 0.07 0.07 0.07 Contents by calculation TMEn, kcal/kg 3025 3025 3025 3025 Protein, % 22 22 22 22 Available phosphorus, % 0.25 0.30 0.35 0.40 Calcium, % 0.95 0.95 0.95 0.95 1Vitamin mix provided the following (per kg of diet): thiamin•mononitrate, 2.4 mg; nicotinic acid, 44 mg; riboflavin, 4.4 mg; D-Ca pantothenate, 12 mg; vitamin B12 (cobalamin),12.0 µg; pyridoxine•HCL, 4.7 mg; D-biotin, 0.11 mg; folic acid, 5.5 mg; menadione sodium bisulfate complex, 3.34 mg; choline chloride, 220 mg; cholecalciferol, 1,100 IU; trans-retinyl acetate, 5,500 IU; all-rac-tocopherol acetate, 11 IU; ethoxyquin, 125 mg. 2Trace mineral mix provides the following (per kg of diet): manganese (MnSO4•H2O), 60 mg; iron (FeSO4•7H2O), 30 mg; zinc (ZnO), 50 mg; copper (CuSO4•5H2O), 5 mg; iodine (ethylene diamine dihydroiodide), 0.15 mg; selenium (sodium selenite), 0.3 mg.

131
TABLE 5.3. Growth performance and foot ash percent of broiler chickens fed graded levels of available phosphorus (AP) from 1-14 days of age, Experiment 12
AP1 (%) Weight gain(g/chick) Feed conversion (kg:kg) Foot ash (%) 0.24 253c 1.35a 10.9c
0.32 283b 1.32ab 13.5b 0.40 315a 1.28b 15.5a
Pooled SEM 9.0 0.12 0.30 a-cMeans within a column with no common superscript differ significantly (P < 0.05). 1AP= Available phosphorus. 2Means represent six pens of five chicks each.

132
TABLE 5.4. Percent of foot ash obtained after different drying times, Experiment 2
Time of drying (hours) 0 6 12 24 36 48 60 72 90 % FA1 4.52d 11.11c 14.13b 14.74a 14.86a 14.90a 14.91a 14.93a 14.94a
SEM2 0.04 0.13 0.14 0.15 0.15 0.15 0.15 0.15 0.15 a-d Means within a row with no common superscript differ significantly (P < 0.05). 1FA= Foot ash. 2n=30 feet, r2 = 0.38, Linear trend P value < 0.0001.

133
TABLE 5.5. Growth performance and foot ash percent of broiler chickens fed graded levels of available phosphorus (AP) from 1-14 days of age, Experiment 31
AP2 (%) Weight gain(g/chick) Feed conversion (kg:kg) 0.25 241b 1.40 0.30 285a 1.30 0.35 283 a 1.33 0.40 310a 1.28
Pooled SEM 14.0 0.16 r2 0.48 0.17
Linear trend P value 0.003 0.11 a-cMeans within a column with no common superscript differ significantly (P < 0.05). 1Means represent four pens of 10 chicks each. 2AP= Available phosphorus.

134
TABLE 5.6. Comparison between foot and tibia ash with or without fat extraction, Experiment 31
AP2 % Foot Ash NFE3 Foot Ash FE4 Tibia Ash NFE3 Tibia Ash FE4 %
0.25 11.6d 11.7d 29.6d 31.8d 0.30 12.6c 12.8c 32.6c 34.8c 0.35 14.6b 15.1b 36.9b 39.5b 0.40 15.7a 16.3a 39.1a 41.5a
Pooled SEM 0.25 0.32 0.51 0.66 r2 0.92 0.90 0.90 0.93
Parameter estimates of the regression lines Intercept 8.631 ± 0.532 8.881 ± 0.426 23.638 ± 0.890 25.661 ± 1.148
Slope 0.040 ± 0.003 0.036 ± 0.003 0.082 ± 0.006 0.085 ± 0.008 P value < 0.0001 < 0.0001 < 0.0001 < 0.0001
a-dMeans within a column with no common superscript differ significantly (P < 0.05). 1Means represent four pens of ten chicks each. 2AP = Available phosphorus. 3NFE = Non-fat extracted. 4FE = Fat extracted.

135
CHAPTER 6
BIOLOGICAL AVAILABILITY OF PHOSPHORUS SOURCES IN PRE-STARTER AND
STARTER DIETS FOR BROILER CHICKS1
1 A. R. Garcia, A. B. Batal, and N. M. Dale. To be submitted to the Journal of Applied Poultry Research.

136
SUMMARY
Two of the most widely used phosphate sources for broiler diets are defluorinated
tricalcium phosphate (DFP) and dicalcium phosphate (DCP). Reports in the literature have
shown that the biological availability of phosphorus in DFP for broilers and laying hens is lower
than that in DCP. If this difference in bioavailability is even greater in young chicks, it might
preclude the inclusion of DFP in pre-starter and possibly starter diets. To address this question,
two experiments were conducted to compare the phosphorus bioavailability of DFP and DCP in
young broilers during the pre-starter (1 to 8 d) and starter (9 to 15 d) periods. In Experiment 1,
the first three treatments contained DFP, DCP or raw rock phosphate, which were added to the
diets to meet 0.32% available phosphorus (AP). Additionally, in other three treatments that
served as positive controls, potassium phosphate (KP) was added to meet AP levels of 0.24, 0.32
and 0.40%. No significant difference was observed between the foot ash percent of chickens fed
the DFP and DCP diets at 4, 8, and 15 d of age, indicating that the biological availability of
phosphorus in DFP was not significantly inferior to that of DCP. In Experiment 2, chick
responses to two levels of either DFP or DCP, added to meet AP levels of 0.28 and 0.34%, were
compared to those of chicks receiving KP, which was added to meet three AP levels (0.22, 0.28,
and 0.34%). Foot ash results at 6 and 15 d of age indicated that the phosphorus utilization of
chickens fed diets containing DFP was not significantly different to that of chickens fed the DCP
diets. The difference in phosphorus bioavailability between DFP and DCP at 6 or 15 d of age
was not greater than 10%. These results indicate that DFP can be satisfactorily utilized by young
chicks during the pre-starter and starter period, and do not support the view that DFP should be
excluded from diets for young chickens.
Key words: defluorinated phosphate, dicalcium phosphate, bioavailability, pre-starter diets.

137
DESCRIPTION OF PROBLEM
Recent research conducted with young poultry has documented physiological changes in
the gastrointestinal tract occurring during the first wk of age [1,2]. Nutrient uptake [3], digestive
enzymatic activity [4], and nutrient utilization in chickens [5, 6] have been found to gradually
increase during and after the first wk of life. Increased attention is now being given to the
nutritional needs of the chicken during the first wk posthatching, not only because this period has
become recognized as being even more critical in the development of modern broilers, but also
because broilers are reaching market weight in a shorter period of time [7]. As a strategy to
compensate for an initially immature digestive system, interest in the use of pre-starter diets has
arisen [8], with the goal of providing either a higher concentration of nutrients or more digestible
ingredients so as to facilitate nutrient utilization during the first wk of life.
Because the available phosphorus (AP) from common feedstuffs used in practical diets is
usually not sufficient to fulfill the phosphorus requirement of chickens, inorganic phosphorus
sources are generally added to the feed. The concentration and availability of phosphorus in
commercial phosphates must receive proper attention in feed formulation, not only because
absolute concentrations of phosphorus may vary, but also because differences in bioavailability
of different commonly used phosphates have been well documented [9, 10, 11, 12, 13, 14]. Two
of the most popular inorganic phosphate supplements are dicalcium phosphate (DCP) and
defluorinated tricalcium phosphate (DFP), the former being frequently employed as a standard
source in relative bioavailability (RBV) studies [15], whereas the later is popular because of
increased nutrient density (Ca + P + Na totals approximately 55%, vs. 39% in DCP) and as an
aid in improving pelleting efficiency [16, 17]. In several studies it has been reported that the
RBV of phosphorus in DFP is 5 to 10 % lower than that in DCP [9, 10, 12, 13]. However, these
138
studies have been largely conducted in laying hens, turkey poults or broiler chickens after 21 d of
age. To date, there is a lack of research regarding the bioavailability of phosphorus supplements
during the first wk of age when most digestive functions are still in a developmental stage and
phosphorus utilization could be affected. Should the bioavailability of phosphorus in DFP in
chicks be markedly lower than that of DCP during the first wk of life, this might preclude the
inclusion of DFP in broiler pre-starter or even starter diets. Therefore, the objective of the
present research was to evaluate and compare the biological availability of phosphorus in DFP
and DCP during the first two wk of age so as to determine if DFP is a suitable phosphorus source
for chicks during the first wk posthatch.
MATERIALS AND METHODS
General procedures
Two experiments were conducted to evaluate the phosphorus bioavailability of DFP and
DCP in young chicks. In Experiment 1, the objective was to compare DFP and DCP as inorganic
phosphorus sources for broiler diets during the pre-starter (1 to 8 d of age) and starter (9 to 15 d
of age) periods. Five hundred and eighty one-d-old, straight-run broiler chicks (Cobb 500),
obtained from a commercial hatchery, were placed in battery brooders [18] with raised wire
floors in environmentally controlled rooms. The birds were randomly assigned to six dietary
treatments, with six replicates of 16 chicks each initially. In both experiments, the basal diet
provided 0.13% non-phytin phosphorus (calculated). To establish a response pattern from a
highly available reagent grade phosphate, potassium phosphate (KP) (K2HPO4, dibasic) [19] was
added to three dietary treatments to meet AP levels of 0.24, 0.32 and 0.40% (0.11, 0.19, and
0.27% P from the inorganic source). In addition to these, three other treatments contained DFP,
DCP or raw rock phosphate (RRP), which were added to the diets to meet a level of 0.32% AP

139
(0.19% P from the inorganic source). The final phosphate source (RRP) served as a negative
control to test the sensitivity of the assay.
The objective of Experiment 2 was to first confirm the general observations made in the
initial Experiment, and also to directly compare the RBV of DFP and DCP during the pre-starter
and starter periods. Four hundred and seventy one-d-old, straight-run, broiler chicks (Cobb 500)
obtained from a commercial hatchery, were placed in battery brooders as described for
Experiment 1. In the first three treatments, increasing amounts of KP were added to the diets to
meet AP levels of 0.22, 0.28 and 0.34% (0.09, 0.15, and 0.21% P added from the inorganic
source), which again served as standard. The two test phosphates, DFP and DCP, were added to
the diets at variable concentrations to meet AP levels of 0.28 and 0.34% for each source (0.15
and 0.21% P from the inorganic source), totalizing four dietary treatments. Thus, a total of seven
dietary treatments were included in the experimental design, each with six replications of eleven
birds initially.
Body weight and feed intake were recorded at 4, 8, and 15 d of age in Experiment 1, and
at 6 and 15 d of age in Experiment 2 in order to calculate body weight gain (BWG) and gain to
feed ratio (GF). Additionally, five chicks per pen were randomly selected and euthanized by CO2
asphyxiation at 4, 8, and 15 d in Experiment 1, and at 6 and 15 d of age in Experiment 2. From
each bird, the right foot was removed for determination of foot ash (FA), according to the
method of Garcia and Dale [20]. Because FA is highly correlated to tibia bone ash [20], FA was
used as the parameter to evaluate phosphorus utilization.
Diets
The composition of the diets is presented in Tables 1 and 2. Diets were based on corn and
soybean meal, formulated to be isocaloric and isonitrogenous. Nutrient levels were similar to

140
those employed in commercial starter diets [21]. In both experiments, for purposes of diet
formulation, one hundred percent availability of the phosphorus in all phosphate sources was
assumed. Samples of DFP, DCP and RRP were submitted to a commercial laboratory [22] for
analysis of Ca and P prior to diet formulation. Concentrations of phosphorus and calcium of
these phosphates were 17.33 and 32.2%, 18.21 and 25.4%, and 14.04% and 24.3 % for DTP,
DCP and RRP, respectively. Diets were fed ad libitum for 15 d in both experiments.
Statistical Analysis
The data for BWG, GF and FA from both experiments was analyzed by ANOVA, and
when significant differences were found (P < 0.05), means were separated and compared by
Tukey’s multiple comparison procedure through SAS® [23]. Data for FA and supplemental
phosphorus intake (Experiment 2) was fitted to a linear model using Proc Reg of SAS® [23].
Coefficients of RBV for DTP and DCP were obtained by the parallel lines [24] and the standard
curve assay, both methods as outlined by Littell et al. [25].
RESULTS AND DISCUSSION
In Experiment 1, a significant increase in BWG was observed as AP increased from 0.24
to 0.40% in the groups fed KP at both 4 and 8 d (Table 3). At 15 d, there were no significant
differences in weight gain between dietary treatments, with the exception of the group fed the
RRP, in which growth was significantly depressed. There were no significant differences in GF
in any treatments at any age. There was a significant increase in FA at 4, 8, and 15 d in the
groups fed the KP diets as AP increased (Table 5), indicating that the assay was sensitive enough
to detect changes in FA due to AP level changes. The birds fed RRP as the P source had a
significant reduction in FA, as compared to birds fed KP, DFP and DCP. Such reduction was
observed at 4, 8, and 15 d, and confirmed again the sensitivity of the assay. The depression in FA

141
in birds receiving RRP was expected and is in agreement with previous studies [26, 27], since
biological availability of phosphorus in RRP has been reported to be low (from 25 to 65 %)
depending upon the geographical region. No significant differences were found between the FA
of chicks receiving DFP or DCP during either the pre-starter or starter periods (Table 4). These
results suggest that if in fact there is a reduced bioavailability of DFP, it was too small to be
detected under these assay conditions, and was certainly not exaggerated in the very young
chicks.
As cited previously, a number of reports using tibia bone ash as a response parameter (9,
10, 12, 13) found DFP to have a lower biological availability than DCP. However, in different
studies conducted with broilers receiving either DCP or DFP as their inorganic P supplement, no
significant differences were found in the tibia bone ash at 41 d of age [28, 29], which is in
agreement with the results obtained in the present research. Since growth performance results
and FA percent observed in Experiment 1 do not suggest that DCP had a markedly greater
phosphorus bioavailability than DFP, a second experiment was conducted to more critically
investigate this point.
In Experiment 2, no significant differences were found at 6 d of age for BWG or at 6 or
15 d for GF (Table 5). The chickens fed 0.22% AP containing KP had the lowest BWG at 15 d.
At levels of 0.28 and 0.34% AP, no significant differences were observed in the BWG of chicks
due to phosphate sources. There was a significant increase in FA at 6 and 15 d of age when
increasing levels of KP were fed (Table 6). However, no significant differences were found in
FA percent between DFP and DCP at the two levels of dietary P tested (0.28 and 0.34%) at either
6 or 15 d of age. After fitting the FA data to a linear model, the test for equality slopes was
significant (P < 0.0001), thus the RBV was calculated through the parallel lines assay as outlined

142
by Littell et al. [25]. The parameter estimates obtained at 6 and 15 d of age were: slope = 9.24
and 5.59, respectively; intercepts: -6.39, -7.23, and -7.58 at 6 d, and -2.22, -2.70 and -2.60 at 15 d
for KP, DFP and DCP, respectively. Additionally, coefficients of RBV were calculated by the
standard curve method, as outlined by Littell et al. [25]. The regression equations for the
response to KP, which was used as the standard, were: FA = 9.37107 + 0.0269(mg P intake), and
FA = 11.5557 + 0.00286(mg P intake) at 6 and 15 d of age, respectively. Coefficients of RBV
are presented in Table 7. At 6 d, regardless of the method of estimation, the RBV of DFP was
below 80%, whereas for DCP the RBV was above 80%. The difference between DFP and DCP
ranged from 6.67 to 9.1 percent points. At 15 d, the RBV of both phosphates was greater than
80%, although the RBV of DFP was approximately 3.5 percent points greater than that of DCP.
Regardless of the method of estimation, the difference observed between the RBV of both
phosphates was in the range of 5 to 10% that has been reported in studies conducted with older
birds [16, 30]. In neither case, however, there was no indication that DFP had a markedly lower
bioavailability than DCP for very young chicks. The coefficients of RBV at 6 and 15 d of age
obtained from this study were somewhat lower than those obtained in work with older birds [9,
10, 12, 13]. However, both the standard P sources and the methodology used to calculate the
RBV often differ between laboratories, a point which has been recognized in reviewing such
assays [31]. In the parallel lines assay, which was applied in the present research, the coefficients
of RBV are usually 10 to 18% lower than those obtained by slope ratio [25]. In the present
research, however, there was a close agreement in the RBV values obtained from parallel lines
and the standard curve methodology.
The objective of the current research was to determine if DFP might have a markedly
lower bioavailability than DCP for very young chicks. If this were the case, in spite of its

143
advantages in total nutrient density and improvements in pelleting efficiency, the use of DFP
might be constrained in pre-starter and starter diets. This was in fact found not to be the case, and
there appears to be no reason to exclude DFP from rations for very young chicks. Thus, for the
formulation of pre-starter and starter diets, where highly digestible ingredients are desired,
inclusion of DFP as an inorganic phosphorus source is acceptable.
CONCLUSIONS AND APPLICATIONS
1. The bioavailability of phosphorus in defluorinated tricalcium phosphate is not greatly
inferior to that of dicalcium phosphate for chicks during the first or second wk of age.
2. Defluorinated tricalcium phosphate is a satisfactory source of inorganic phosphorus for
pre-starter and starter diets for broiler chickens.

144
REFERENCES AND NOTES
1. Noy, Y., and D. Sklan. 1997. Posthatch development in poultry. J. Appl. Poult. Res.
6:344-354.
2. Jin, S. H., A. Corless, and J. L. Sell. 1998. Digestive system development in post-
hatch poultry. World’s Poult. Sci. J. 54:335-345.
3. Noy, Y., and D. Sklan. 2001. Yolk and exogenous feed utilization in the posthatch
chick. Poult. Sci. 80:1490-1495.
4. Nitsan, Z., Ben-Avraham, Z. Zoref, and I. Nir. 1991. Growth and development of the
digestive organs and some enzymes in broiler chickens after hatching. Br. Poult. Sci. 32:515-
523.
5. Noy, Y., and D. Sklan. 1995. Digestion and absorption in the young chicks. Poult.
Sci. 74:366-373.
6. Batal A. B., and C.M. Parsons. 2002. Effects of age on nutrient digestibility in chicks
fed different diets. Poult. Sci. 81:400-407.
7. Lilburn M. S. 1998. Practical aspects of early nutrition for poultry. J. Appl. Poult.
Res. 7:420-424.
8. Rocha, P. T., J. H. Stringhini, M. A. Andrade, N. S. M. Leandro, M. L. Andrade, M.
B. Café. 2003. Protein and metabolizable energy levels in pre-starter rations (1-7 days) on broiler
performance from 1 to 21 days. Brazilian J. Anim. Sci. 32:162-170.
9. Nelson, T. S., and A. C. Walker. 1964. The biological evaluation of phosphorus
compounds. A summary. Poult. Sci. 43:94-98.

145
10. Peeler, H. T. 1972. Biological availability of nutrients in feeds: Availability of
major minerals. J. Anim. Sci. 35:695-712.
11. Potter, L. M. 1988. Bioavailability of phosphorus from various phosphates based on
body weight and toe ash measurements. Poult. Sci. 67:96-102.
12. Nelson, T. S., L. K. Kirby, and Z. B. Johnson. 1990. The relative biological value of
feed phosphates for chicks. Poult. Sci. 69:113-118.
13. Sullivan, T. W., J. H. Douglas, N. J. Gonzalez, and P. L. Bond, Jr. 1992.
Correlation of biological value of feed phosphates with their solubility in water, dilute hydrogen
chloride, dilute citric acid, and neutral ammonium citrate. Poult. Sci. 71:2065-2074.
14. P. Wendt, and M. Rodehutscord. 2004. Investigations on the availability of
inorganic phosphate from different sources with growing white Pekin ducks. Poult. Sci. 83:1572-
1579.
15. Lima, F. R., C. X. Mendonça, Jr., J. C. Alvarez, J. M. F. Garzillo, E. Ghion, and P.
M. Leal. 1997. Biological evaluations of commercial dicalcium phosphates as sources of
available phosphorus for broiler chicks. Poult. Sci. 76:1707-1713.
16. Behnke, K.C., 1981. Pellet mill performance as affected by mineral source.
Feedstuffs 53(12):34-36.
17. Verner. W.A., 1988. Phosphates in pelleting: Best cost versus least cost. Feed
Management 39:(4):56-58.
18. Petersime Incubator Co., Geltysburg, OH 45328.
19. J. T. Baker, Phillipsburg, NJ 08865.
20. Garcia, A. R., and N. Dale. 2005. Foot ash as a means of quantifying bone
mineralization in chicks. J. Appl. Poult. Res. (In press).

146
21. Agri-Stats, Fort Wayne, IN, USA.
22. PhosLab, Inc. Lakeland, FL 33803
23. SAS Institute Inc., 1990. SAS STAT User’s Guide Release 6.08. SAS Institute Inc.,
Cary NC.
24. The percent of FA data for the standard and the test phosphate sources obtained in
Experiment 2 was fitted to a linear model with six parameters, according to the following
formula: FA = β0 + β1x1 + β2x2 + β3x3 + ε, where β0 is the intercept of the general linear model;
β1, β2 and β3 are the corresponding slopes for each phosphate source; x1, x2 and x3 are the
supplemental P intake for each phosphate source. Thereafter, an F test for reduction of terms to
four parameters was applied, with the following formula: Fv1,v2 = [SSE(reduced model) –
SSE(full model)/df(lost)]/[SSE(full model)/df(full model)], where v1 is the degrees of freedom
(df) of the numerator; v2 is the df of the denominator; and SSE is the sum of squares for error.
Two fitted models were tested: one with a common slope, and one with a common intercept.
Since the P-value of the test for a common slope was lower (P = 0.08) than that for a common
intercept (P = 0.12), the former model was chosen to estimate the RBV. Having three intercepts
and one common slope means that three parallel lines are being compared, thus the RBV was
calculated by the parallel lines assay. Data of P supplemental intake was logarithmically
transformed, and then regressed to FA percent and fitted to the linear models as described above.
The RBV was calculated with the following formula: Antilog[(Intercept of the test source –
Intercept of standard source)/Slope] x 100, as outlined by Littell et al. [25].
25. Littell, R. C., A. J. Lewis, and P. M. Henry. 1995. Statistical evaluation of
bioavailability assays. Pages 5-31 in Bioavailability of nutrients for animals: AAs, minerals and
vitamins. C. B. Ammerman, D. H. Baker, and A. J. Lewis, eds. Academic Press, NY, USA.

147
26. Osorio, J. G. and L. S. Jensen. 1986. Biological availability of phosphorus from a
Venezuelan rock phosphate for broiler chicks. Nutr. Rep. Int. 33:545-552.
27. Borges, F. M. O., M. A. O. Furtado, J. A. F. Veloso, and N. C. Baião. 1997.
Disponibilidade do fósforo de fontes inorgânicas para frangos de corte. Arq. Bras. Med. Vet.
Zootec. 49:639-647.
28. Rama Rao, S. V. and V. Ramasubba Reddy. 2001. Utilisation of different
phosphorus sources in relation to their fluorine content for broiler and layers. Br. Poult. Sci.
42:376-383.
29. Rama Rao, S. V. and V. Ramasubba Reddy. 2001. Relative bio-availability of
different phosphorus supplements in broiler and layer chicken diets. Asian-Australas. J. Anim.
Sci. 14:979-985.
30. De Groote, G., and G. Huyghebaert. 1997. The bioavailability of phosphorus from
feed phosphates for broilers as influenced by bio-assay method, dietary Ca-level and feed form.
Anim. Feed Sci. Technol. 69:329-340.

148
TABLE 6.1. Composition of the diets, Experiment 1 Ingredient K2HPO4
1 K2HPO41 K2HPO4
1 DFP2 DCP3 RRP4 % Corn 57.27 56.32 55.37 58.32 57.84 57.54 Soybean meal 37.06 37.21 37.35 36.78 36.97 37.02 Fat 2.20 2.55 2.90 1.76 1.99 2.10 Limestone 1.86 1.86 1.86 1.15 1.16 0.99 K2HPO4
1 0.62 1.07 1.53 --- --- --- DFP2 --- --- --- 1.15 --- --- DCP3 --- --- --- --- 1.05 --- RRP4 --- --- --- --- --- 1.36 Salt 0.47 0.47 0.47 0.33 0.47 0.47 DL-Methionine 0.20 0.20 0.20 0.19 0.20 0.20 Vitamin premix5 0.25 0.25 0.25 0.25 0.25 0.25 Mineral premix6 0.07 0.07 0.07 0.07 0.07 0.07
Contents by calculation TME, kcal/kg 3025 3025 3025 3025 3025 3025 Crude protein, % 22 22 22 22 22 22 Total lysine, % 1.24 1.24 1.24 1.24 1.24 1.24 TSAA, % 0.92 0.92 0.92 0.92 0.92 0.92 Ca, % 0.80 0.80 0.80 0.80 0.80 0.80 Available P, % 0.24 0.32 0.40 0.32 0.32 0.32 Na, % 0.20 0.20 0.20 0.20 0.20 0.20 1Potassium phosphate, analytical grade, contained 17.78% phosphorus (calculated). 2DFP = Defluorinated tricalcium phosphate, contained 17.33% phosphorus (analyzed). 3DCP = Dicalcium phosphate, feed grade, contained 18.21% phosphorus (analyzed). 4RRP = Raw rock phosphate, contained 14.04% phosphorus (analyzed). 5Vitamin mix provided the following (per kg of diet): thiamin•mononitrate, 2.4 mg; nicotinic acid, 44 mg; riboflavin, 4.4 mg; D-Ca pantothenate, 12 mg; vitamin B12 (cobalamin),12.0 µg; pyridoxine•HCl, 4.7 mg; D-biotin, 0.11 mg; folic acid, 5.5 mg; menadione sodium bisulfate complex, 3.34 mg; choline chloride, 220 mg; cholecalciferol, 1,100 IU; trans-retinyl acetate, 5,500 IU; all-rac-tocopherol acetate, 11 IU; ethoxyquin, 125 mg. 6Trace mineral mix provides the following (per kg of diet): manganese (MnSO4•H2O), 60 mg; iron (FeSO4•7H2O), 30 mg; zinc (ZnO), 50 mg; copper (CuSO4•5H2O), 5 mg; iodine (ethylene diamine dihydroiodide), 0.15 mg; selenium (sodium selenite), 0.3 mg.

149
TABLE 6.2. Composition of the diets, Experiment 2 Ingredient K2HPO4
1 K2HPO41 K2HPO4
1 DFP2 DFP2 DCP3 DCP3 % Corn 57.96 57.25 56.53 58.96 59.57 58.39 58.14 Soybean meal 36.83 36.93 37.05 36.67 36.58 36.76 36.80 Fat 1.98 2.25 2.51 1.62 1.08 1.83 1.92 Limestone 1.73 1.73 1.73 1.00 0.71 1.21 1.00 K2HPO4
1 0.51 0.85 1.19 --- --- --- --- DFP2 --- --- --- 0.86 1.21 --- --- DCP3 --- --- --- --- --- 0.82 1.15 Salt 0.47 0.47 0.47 0.37 0.33 0.47 0.47 DL-Methionine 0.20 0.20 0.20 0.20 0.20 0.20 0.20 Vitamin premix4 0.25 0.25 0.25 0.25 0.25 0.25 0.25 Mineral premix5 0.07 0.07 0.07 0.07 0.07 0.07 0.07
Contents by calculation TME, kcal/kg 3025 3025 3025 3025 3025 3025 3025 Crude protein, % 22 22 22 22 22 22 22 Total lysine, % 1.24 1.24 1.24 1.24 1.24 1.24 1.24 TSAA, % 0.92 0.92 0.92 0.92 0.92 0.92 0.92 Ca, % 0.75 0.75 0.75 0.75 0.75 0.75 0.75 Available P, % 0.22 0.28 0.34 0.28 0.34 0.28 0.34 Na, % 0.20 0.20 0.20 0.20 0.20 0.20 0.20 1Potassium phosphate, analytical grade, contained 17.78% phosphorus (calculated). 2DFP = Defluorinated tricalcium phosphate, contained 17.33% phosphorus (analyzed). 3DCP = Dicalcium phosphate, feed grade, contained 18.21% phosphorus (analyzed). 4Vitamin mix provided the following (per kg of diet): thiamin•mononitrate, 2.4 mg; nicotinic acid, 44 mg; riboflavin, 4.4 mg; D-Ca pantothenate, 12 mg; vitamin B12 (cobalamin),12.0 µg; pyridoxine•HCl, 4.7 mg; D-biotin, 0.11 mg; folic acid, 5.5 mg; menadione sodium bisulfate complex, 3.34 mg; choline chloride, 220 mg; cholecalciferol, 1,100 IU; trans-retinyl acetate, 5,500 IU; all-rac-tocopherol acetate, 11 IU; ethoxyquin, 125 mg. 5Trace mineral mix provides the following (per kg of diet): manganese (MnSO4•H2O), 60 mg; iron (FeSO4•7H2O), 30 mg; zinc (ZnO), 50 mg; copper (CuSO4•5H2O), 5 mg; iodine (ethylene diamine dihydroiodide), 0.15 mg; selenium (sodium selenite), 0.3 mg.

150
TABLE 6.3. Growth performance1 of broiler chickens at 4, 8, and 15 days of age in response to supplemental inorganic phosphorus from different sources, Experiment 1 Weight gain (g/bird) Gain:feed (g:kg) % Available P-Source2 Day 4 Day 8 Day 15 Day 4 Day 8 Day 15 0.24 K2HPO4 46.2b 134b 382a 1101b 892 779 0.32 K2HPO4 49.4ab 136ab 400a 1180a 906 769 0.40 K2HPO4 55.2a 151a 389a 1194a 906 741 0.32 DFP 48.8ab 139ab 381a 1155ab 883 751 0.32 DCP 50.2ab 142ab 398a 1183a 882 764 0.32 RRP 46.8b 116c 306b 1179a 864 751 SEM 2.60 4.8 12.1 19.1 15.0 13.9 1Means represent six pens of sixteen, eleven, and six birds each at 4, 8, and 15 days of age, respectively. 2K2HPO4 = Potassium phosphate; DFP = Defluorinated tricalcium phosphate; DCP = Dicalcium phosphate; RRP = Raw rock phosphate. a-cMeans within a column with common superscripts do not differ significantly (P < 0.05).

151
TABLE 6.4. Foot ash percent1 of broiler chickens at 4, 8, and 15 days of age in response to supplemental inorganic phosphorus from different sources, Experiment 1 % Available P-Source2 Day 4 Day 8 Day 15 0.24 K2HPO4 12.5d 12.3d 12.7c 0.32 K2HPO4 14.2b 14.5b 14.7b 0.40 K2HPO4 14.8a 15.2a 15.9a 0.32 DFP 13.6c 13.6c 14.5b 0.32 DCP 13.3c 13.4c 14.3b 0.32 RRP 11.5e 10.6e 12.9c SEM 0.16 0.28 0.20 1Means represent six pens of five feet each. 2K2HPO4 = Potassium phosphate; DFP = Defluorinated tricalcium phosphate; DCP = Dicalcium phosphate; RRP = Raw rock phosphate. a-eMeans within a column with common superscripts do not differ significantly (P < 0.05).
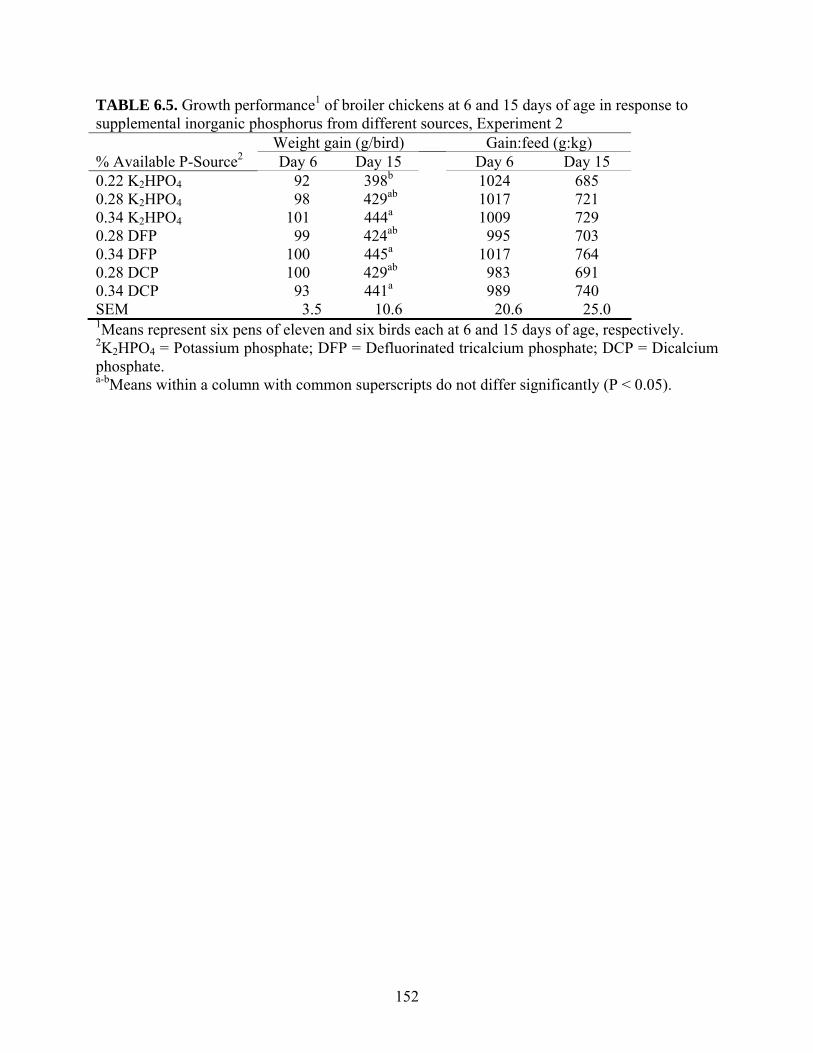
152
TABLE 6.5. Growth performance1 of broiler chickens at 6 and 15 days of age in response to supplemental inorganic phosphorus from different sources, Experiment 2 Weight gain (g/bird) Gain:feed (g:kg) % Available P-Source2 Day 6 Day 15 Day 6 Day 15 0.22 K2HPO4 92 398b 1024 685 0.28 K2HPO4 98 429ab 1017 721 0.34 K2HPO4 101 444a 1009 729 0.28 DFP 99 424ab 995 703 0.34 DFP 100 445a 1017 764 0.28 DCP 100 429ab 983 691 0.34 DCP 93 441a 989 740 SEM 3.5 10.6 20.6 25.0 1Means represent six pens of eleven and six birds each at 6 and 15 days of age, respectively. 2K2HPO4 = Potassium phosphate; DFP = Defluorinated tricalcium phosphate; DCP = Dicalcium phosphate. a-bMeans within a column with common superscripts do not differ significantly (P < 0.05).

153
TABLE 6.6. Foot ash percent1 of broiler chickens at 6 and 15 days of age in response to supplemental inorganic phosphorus from different sources, Experiment 2 % Available P-Source2 Day 6 Day 150.22 K2HPO4 11.3e 13.0d 0.28 K2HPO4 13.6bc 14.3bc 0.34 K2HPO4 15.0a 15.2a 0.28 DFP 12.0de 13.9c 0.34 DFP 14.3ab 14.7ab 0.28 DCP 12.8cd 13.8c 0.34 DCP 14.1b 14.7ab SEM 0.21 0.18 1Means represent six pens of five feet each. 2K2HPO4 = Potassium phosphate; DFP = Defluorinated tricalcium phosphate; DCP = Dicalcium phosphate. a-eMeans within a column with common superscripts do not differ significantly (P < 0.05).
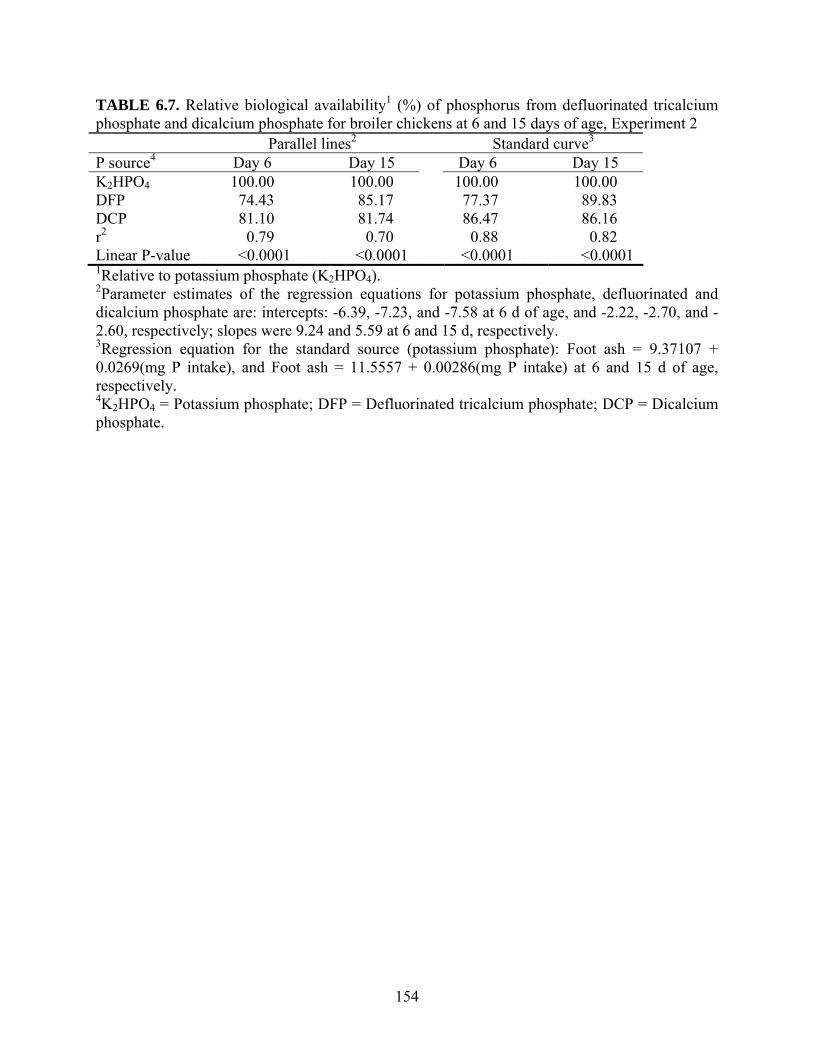
154
TABLE 6.7. Relative biological availability1 (%) of phosphorus from defluorinated tricalcium phosphate and dicalcium phosphate for broiler chickens at 6 and 15 days of age, Experiment 2 Parallel lines2 Standard curve3 P source4 Day 6 Day 15 Day 6 Day 15 K2HPO4 100.00 100.00 100.00 100.00 DFP 74.43 85.17 77.37 89.83 DCP 81.10 81.74 86.47 86.16 r2 0.79 0.70 0.88 0.82 Linear P-value <0.0001 <0.0001 <0.0001 <0.0001 1Relative to potassium phosphate (K2HPO4). 2Parameter estimates of the regression equations for potassium phosphate, defluorinated and dicalcium phosphate are: intercepts: -6.39, -7.23, and -7.58 at 6 d of age, and -2.22, -2.70, and -2.60, respectively; slopes were 9.24 and 5.59 at 6 and 15 d, respectively. 3Regression equation for the standard source (potassium phosphate): Foot ash = 9.37107 + 0.0269(mg P intake), and Foot ash = 11.5557 + 0.00286(mg P intake) at 6 and 15 d of age, respectively. 4K2HPO4 = Potassium phosphate; DFP = Defluorinated tricalcium phosphate; DCP = Dicalcium phosphate.

155
CHAPTER 7. GENERAL CONCLUSIONS
In the modern poultry industry, the progress accomplished mainly in the areas of genetics
and management is very well recognized. Since the modern strains of broiler chickens have an
accelerated growth rate, the age needed to reach the market weight has been dramatically
reduced. Consequently, under the current commercial settings, the first week posthatch accounts
for a more significant proportion of the productive life of a broiler chicken than previously. In
addition to this, research conducted with young chickens in recent years has demonstrated that
their gastrointestinal tract is not completely functional during the first seven days of age.
Therefore, considering these two factors, more emphasis must be placed in the area of early
nutrition for broiler chicks in order to support the high performance and productivity traits of
modern strains of birds.
To satisfy this demand, nutritionists have started to formulate specialized diets, named
pre-starters, with the objective of providing the nutrients that the chicks require during their first
week of life. However, there is a variety of factors involved in the formulation of a pre-starter
diet that should be evaluated, such as the type and quality of ingredients to use, or the
bioavailability of nutrients present in the feedstuffs. Therefore, evaluating the ingredients to
provide the components of this type of feed becomes crucial in order to meet the objectives of a
pre-starter diet. In the current research, three of the main components of the feed, these being
carbohydrate, protein and phosphorus sources, were evaluated with the purpose of formulating a
pre-starter diet.

156
Carbohydrate sources in the form of cereal grains were studied in the initial experiments.
It was observed that the incorporation of pearl millet into broiler diets could significantly
improve the growth performance of seven-d-old chicks as compared to chicks receiving a corn-
based diet. No detrimental effects on intestinal viscosity or bacterial populations in the ceca were
observed.
In evaluating the protein component of the feed, two approaches were taken: first, to
determine whether the chick’s requirements for the first and second limiting AAs (AA), lysine
and sulfur AA, would be greater at 7 d than at 21 d of age, considering the chick’s lower ability
to utilize nutrients during the first week posthatch. In the studies conducted in the present
research, no evidence was found to support the hypothesis that the digestible lysine and sulfur
AA requirements are higher during the first seven d of age.
The second approach was to evaluate how the AA digestibility coefficients of different
ingredients might differ when determined in 7 or 21-d-old chicks or adult, cecectomized roosters.
From the results obtained in the current research, lower AA digestibility was observed in chicks
at 7 and 21 d as compared to that determined in roosters. These results suggested that the AA
digestibility coefficients as determined in adult roosters might not be applicable to young chicks,
especially during the first seven d of age. Thus, adjustments in feed formulation for pre-starter
diets might be necessary.
For evaluation of phosphorus sources, the first objective was to further refine a technique
that would allow a more rapid but still accurate quantification of the bone mineralization status
in chicks. Tibia bone ash has been considered the standard methodology for such purposes over
the years. However, the procedure is so time consuming and labor intensive that better
alternatives have been investigated throughout the years. In the current research, the value of the

157
foot ash assay was confirmed. The proposed technique was sensitive enough to detect differences
in bone mineralization in response to phosphorus deficiencies that paralleled those obtained
through tibia bone ash.
Once the first objective was accomplished, foot ash was then used as a parameter to
evaluate if the phosphorus bioavailability of defluorinated phosphate is markedly lower than that
of dicalcium phosphate for 7-d-old chicks. These two inorganic phosphate sources were selected
for evaluation because they are widely used under commercial conditions by the US poultry
industry. The results obtained indicated that defluorinated phosphate can be satisfactorily utilized
by 7 and 14-d-old chicks, and thus is suitable for incorporation in broiler pre-starter diets.
In summary, from the cereal grains currently available, pearl millet appears as a very
promising alternative to corn for feeding young chickens, particularly in the state of Georgia
where corn must be shipped from other states, thus increasing the feed cost. Adjustments in the
digestible lysine and sulfur AA requirements for baby chicks do not seem necessary during the
first week posthatch. However, the AA digestibility coefficients for several ingredients might
need an adjustment for feed formulation for baby chicks. Finally, defluorinated phosphate is a
satisfactory source of P that can be very well utilized by baby chicks. The information provided
by the present research will hopefully be of interest for poultry nutritionists seeking to
incorporate pre-starter diets into the feeding program used in their companies.

158
APPENDICES
I. EFFECT OF DIETARY PROTEIN CONCENTRATION ON THE mRNA EXPRESSION OF
CHICKEN SREBP-11
1 Garcia, A. R., N. M. Dale, and A. J. Davis. To be submitted to the Journal of Nutrition

159
ABSTRACT In chicks the mRNA expression of malic enzyme and spot 14 (S14) is decreased as
early as 3 and 1.5 h, respectively by increasing dietary protein consumption. It has been
suggested that S14 might be regulating the expression of malic enzyme in response to varying
dietary protein levels. Recently, sterol regulatory element binding protein-1 (SREBP-1) has been
identified as a transcription factor that regulates lipid synthesis in mammalian and avian species.
Therefore, the purpose of the present research was to study the effect of dietary protein intake on
the expression of mRNA SREBP-1 in chickens. A series of studies was conducted with broiler
chicks which received low (13 g/ 100 g), basal (22 g/100 g) or high (40 g/100 g) protein diets for
1.5, 3, 6 or 24 h. At 3, 6 and 24 h, hepatic mRNA expression of SREBP-1 as determined by two-
step Real Time PCR was significantly lower in chicks fed the high protein diet when compared
to those fed the low protein diet. However, the mRNA expression of SREBP-1 in the chicks fed
the basal protein diet never differed from those fed the low-protein diet, and only differed from
the chicks fed the high protein diet at 24 h. In chicks fed the basal diet and injected with
triiodothyronine (T3), there was a significant increase in the mRNA expression of SREBP-1 at 1
h after injection, which confirmed the role of T3 in stimulating the expression of SREBP-1.
However, in chicks fed the high-protein diet, the plasma concentration of total and free T3 were
significantly lower than those fed the basal-protein diet only 3 h after access to the diets was
given, but there were no differences in T3 levels at 1 and 2 h. These results indicate that mRNA
expression of SREBP-1 is influenced by dietary protein intake. However, the changes in the
mRNA expression of SREBP-1 do not occur as rapidly as for malic enzyme or S14. Thus,
SREBP-1 does not seem to play a key initial role in the regulation of the mRNA expression of
S14 or malic enzyme in chickens in response to varying dietary protein intakes.
Key words: Chicks, SREBP-1, dietary protein, thyroid hormone.

160
II. FEEDING OF UNGROUND PEARL MILLET TO LAYING HENS1
1 A. R. Garcia and N. M. Dale. To be submitted to the Journal of Applied Poultry Research.

161
ABSTRACT Pearl millet has gained increased interest as an alternative feed ingredient for
poultry. While having approximately the same metabolizable energy as yellow corn, pearl millet
has a substantially higher level of protein (11-12%), and a far higher level of lysine (0.38-
0.41%). A major impediment to the use of pearl millet is that most feed mills do not have more
than one post-grinding storage bin. Previous studies with broilers indicated that it is not
necessary to grind millet prior to incorporation into mixed feeds. Three studies were conducted
to investigate whether unground pearl millet is also a satisfactory feed ingredient for laying hens.
In the first study, 5, 10, 20, 30, or 40% whole millet was incorporated into practical laying hen
rations. After a 7 day acclimation period, for a period of 24 hours feed intake was measured and
excreta quantitatively collected and screened under a light water spray for the presence of whole
millet. In all treatments, the disappearance of whole millet exceeded 98%. In the second study,
starch digestibility was determined in diets containing 15% of either ground or whole millet.
Digestibility of starch was slightly, but significantly, improved when whole millet was
incorporated into the diet. This suggests that intact millet grains may enhance gizzard function. A
third study measured relative feed intake over 4 weeks when 10% millet was incorporated into
the feed in either whole or ground form. After the first week acclimation period, no differences
in feed intake were detected. While the number of hens used per treatment (48) was limited, a
consistent improvement was noted in egg production in groups receiving whole as opposed to
ground millet. It is concluded that unground, whole millet is a satisfactory feed ingredient for
laying hens.
Key words: Pearl millet, starch, digestibility, whole grain