evaluating hap trends: a look at emissions, concentrations ...evaluating hap trends: a look at...
TRANSCRIPT

Evaluating HAP Trends: A Look at Emissions, Concentrations, and Regulation Analysesfor Selected Metropolitan Statistical Areas
Regi Oommen
Eastern Research Group, Inc. (ERG, Inc.)1600 Perimeter Park
Morrisville, NC
September 27, 2005
2005 Air Toxics Workshop - RTP, NC

2005 Air Toxics Workshop - RTP, NC
ACKNOWLEDGEMENTS
• Jaime Hauser• Garry Brooks• Dave Dayton• Heather Perez• Susan McClutchey• Andy Blackard• Randy Bower• Jody Tisano

CLEAN AIR ACT AMENDMENTS - BACKGROUND
• The Clean Air Act – first promulgated in 1960
• Primary focus was on Criteria Air Pollutants (CAPs)• Carbon monoxide• Lead• Oxides of nitrogen• Sulfur dioxide• Particulate matter• Volatile organic compounds*
• Amended 1963 and 1977
2005 Air Toxics Workshop - RTP, NC

CLEAN AIR ACT AMENDMENTS – HAPS FOCUS
• Major revisions in 1990
• Focus included: • source characterization• control device options• monitoring
• Primary focus was on Hazardous Air Pollutants (HAPs)
2005 Air Toxics Workshop - RTP, NC
TRENDS WORK
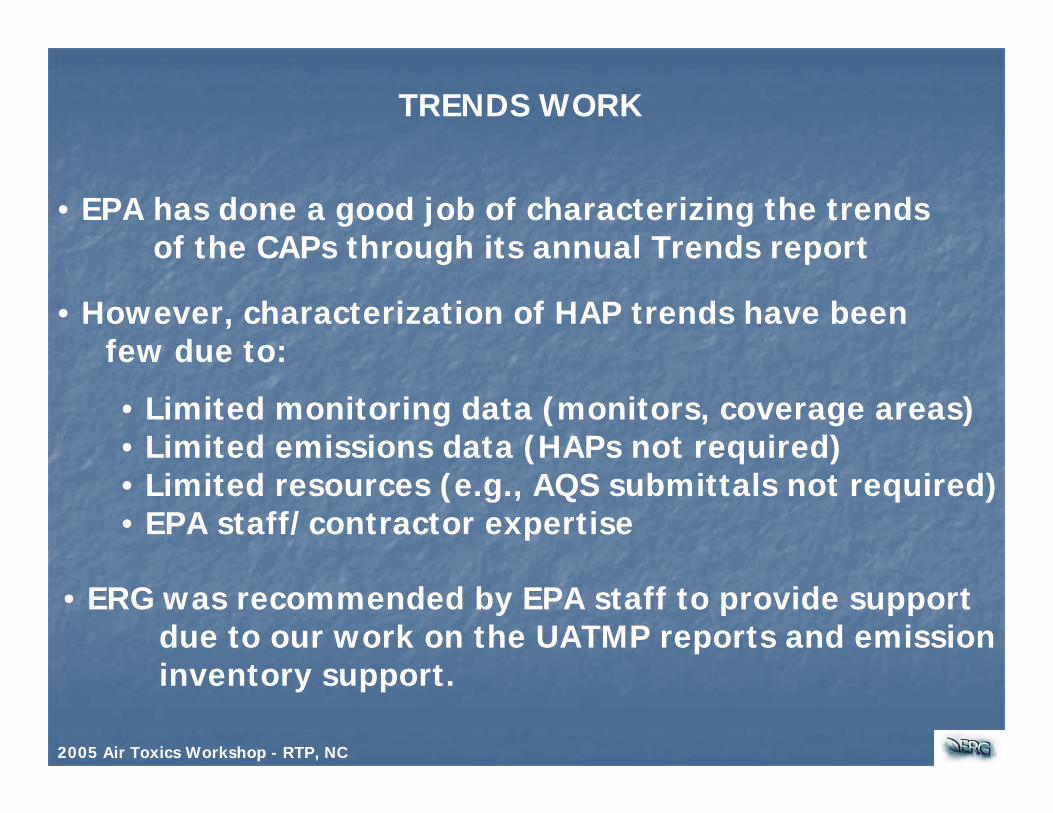
• EPA has done a good job of characterizing the trendsof the CAPs through its annual Trends report
• ERG was recommended by EPA staff to provide supportdue to our work on the UATMP reports and emissioninventory support.
• However, characterization of HAP trends have been few due to:
• Limited monitoring data (monitors, coverage areas)• Limited emissions data (HAPs not required)• Limited resources (e.g., AQS submittals not required)• EPA staff/contractor expertise
2005 Air Toxics Workshop - RTP, NC

TRENDS WORK
• Summer 2004, ERG received a Work Assignment
• Primary work was to compile a database of HAP ambient monitoring concentrations from:• Historical Archive (compiled by previous contractors)• IMPROVE data• AQS data supplemental (2001-2003)
• SQL Server and Access were chosen to house the data
• Database contained over 14,000,000 records
2005 Air Toxics Workshop - RTP, NC
• Data would be a great resource for trends analysis inthe UATMP reports.

POLICY-RELEVANT QUESTIONS
• What are the HAP concentration trends?
• Do HAP emissions show a decline due to HAP-specificfederal regulations?
• Have HAP-specific federal regulations been effective at reducing ambient concentrations?
2005 Air Toxics Workshop - RTP, NC
APPROACH – MSAs OF INTEREST
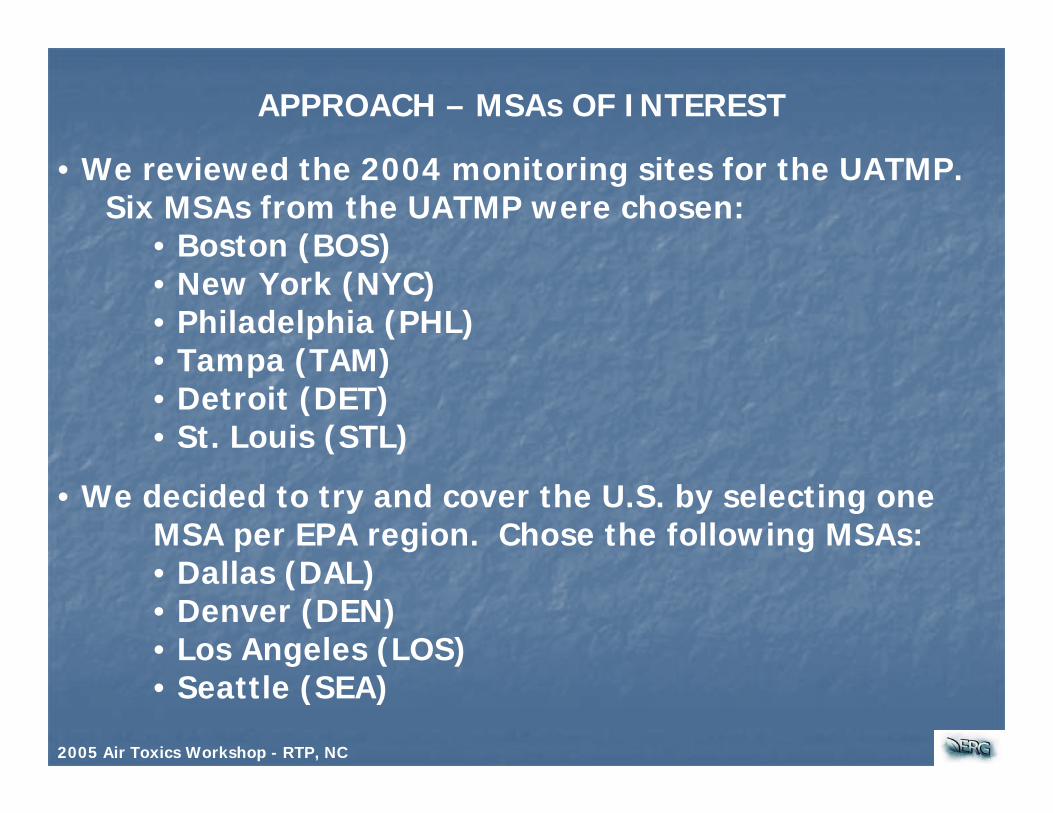
• We reviewed the 2004 monitoring sites for the UATMP.Six MSAs from the UATMP were chosen:
• Boston (BOS)• New York (NYC)• Philadelphia (PHL)• Tampa (TAM)• Detroit (DET)• St. Louis (STL)
• We decided to try and cover the U.S. by selecting oneMSA per EPA region. Chose the following MSAs:• Dallas (DAL)• Denver (DEN)• Los Angeles (LOS)• Seattle (SEA)
2005 Air Toxics Workshop - RTP, NC

APPROACH – MSAs OF INTEREST
2005 Air Toxics Workshop - RTP, NC
EPA Region 1
EPA Region 2
EPA Region 3
EPA Region 4
EPA Region 5
EPA Region 6
EPA Region 7
EPA Region 8
EPA Region 9
EPA Region 10

APPROACH – HAPs OF INTEREST
• Nine HAPs were chosen:• Acetaldehyde• Benzene• Cadmium• Ethylbenzene• Formaldehyde• Lead• Mercury• Toluene• Xylenes (total)
• EPA Core HAPs: acetaldehyde, benzene, cadmium,formaldehyde, and lead
2005 Air Toxics Workshop - RTP, NC

APPROACH – HAPs OF INTEREST
• Pollutant Types:• Carbonyls – acetaldehyde and formaldehyde• VOCs – benzene, ethylbenzene, toluene, and xylenes• Metals – cadmium, lead, mercury
• Noncancer compounds: all nine HAPs
• Cancer compounds: acetaldehyde, benzene, cadmium,ethylbenzene, and formaldehyde
2005 Air Toxics Workshop - RTP, NC

APPROACH – TIME PERIOD OF INTEREST
• CAAA promulgated 1990
• First EPA HAP emission inventory covered base years 1990-1993; Latest EPA HAP emission inventory covers 2002 base year
• Monitoring data: Several ambient monitoring sites began sampling post-1995. EPA’s NATTS Network begins monitoring in 2004.
• Chose 1990-2003 as our time period of interest
• Several stationary source and mobile source rules havebeen promulgated/implemented in the last 10 years
2005 Air Toxics Workshop - RTP, NC

METHODOLOGY
• Compare emissions at the MSA-level• 1990 to 2002• Grouped individual HAPs
• Xylene species (o-, m-, p-) summed• Metal species averaged
• MACT code assignments were retained• EPA is currently revising 1990 and 2002 NEI
• Compare concentrations at the MSA-level• 1990-94 to 2002-03• Limited data in early 90s• Grouped individual HAPs
• Xylene species (o-, m-, p-) summed• Metal species averaged
2005 Air Toxics Workshop - RTP, NC

RESULTS – POPULATION/VMT CHANGES
• Look at Population/VMT changes across each MSA
NA1992-1996+ 27%24,413,02519,203,015+ 23%3,141,7772,559,136Seattle MSA
Required1992-2003+ 16%105,856,57091,495,645+ 14%12,829,27211,273,720Los Angeles MSA
NA1992-2003+ 75%17,358,6709,909,750+ 39%2,301,1161,650,489Denver MSA
Opt-InNA+ 38%22,794,25016,530,120+ 6%2,759,4402,599,893St. Louis MSA
Opt-InNA+ 36%39,848,14529,273,000+ 40%5,589,6703,989,294Dallas MSA
NANA+ 29%36,788,71528,551,395+ 6%4,483,8534,248,699Detroit MSA
NANA+ 73%21,258,33012,304,150+ 22%2,531,9082,067,959Tampa Bay MSA
Required1992-1996+ 57%37,576,75024,002,035+ 6%5,772,9475,435,550Philadelphia MSA
Required1992-2000+ 29%105,869,71082,128,650+ 11%18,640,77516,863,671New York MSA
Opt-In1992-1996+ 74%32,582,82018,738,370+ 7%4,439,9714,133,895Boston MSA
MSA Reformulated
Gasoline Designation
Winter-Oxygenated Time
Period Implemented
% Change in MSA VMT
2003 MSA VMT
(1000s)
1990 MSA VMT
(1000s)
% Change in MSA
Population
2003 MSA Population
1990 MSA Population
MSA
2005 Air Toxics Workshop - RTP, NC
RESULTS – EMISSION CHANGES
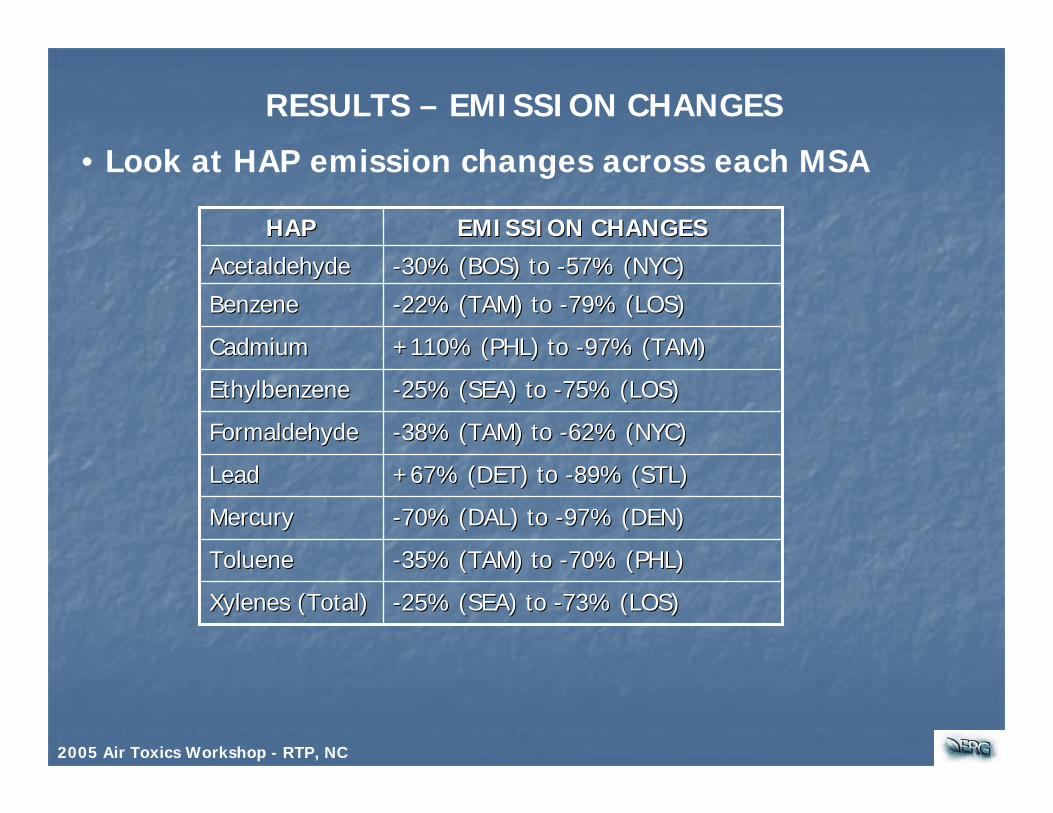
• Look at HAP emission changes across each MSA
--25% (SEA) to 25% (SEA) to --73% (LOS)73% (LOS)Xylenes (Total)Xylenes (Total)
--35% (TAM) to 35% (TAM) to --70% (PHL)70% (PHL)TolueneToluene
--70% (DAL) to 70% (DAL) to --97% (DEN)97% (DEN)MercuryMercury
+67% (DET) to +67% (DET) to --89% (STL)89% (STL)LeadLead
--38% (TAM) to 38% (TAM) to --62% (NYC)62% (NYC)FormaldehydeFormaldehyde
--25% (SEA) to 25% (SEA) to --75% (LOS)75% (LOS)EthylbenzeneEthylbenzene
+110% (PHL) to +110% (PHL) to --97% (TAM)97% (TAM)CadmiumCadmium
--22% (TAM) to 22% (TAM) to --79% (LOS)79% (LOS)BenzeneBenzene
--30% (BOS) to 30% (BOS) to --57% (NYC)57% (NYC)AcetaldehydeAcetaldehyde
EMISSION CHANGESEMISSION CHANGESHAPHAP
2005 Air Toxics Workshop - RTP, NC

RESULTS – EMISSION CHANGES
• What’s going on in PHL?
+110% (PHL) to +110% (PHL) to --97% (TAM)97% (TAM)CadmiumCadmiumEMISSION CHANGESEMISSION CHANGESHAPHAP
2005 Air Toxics Workshop - RTP, NC
• Emission Inventory Validation?
• 1990 PHL cadmium emissions = 2.9 tpy• 2002 PHL cadmium emissions = 6.3 tpy
RESULTS – EMISSION CHANGES
2005 Air Toxics Workshop - RTP, NC
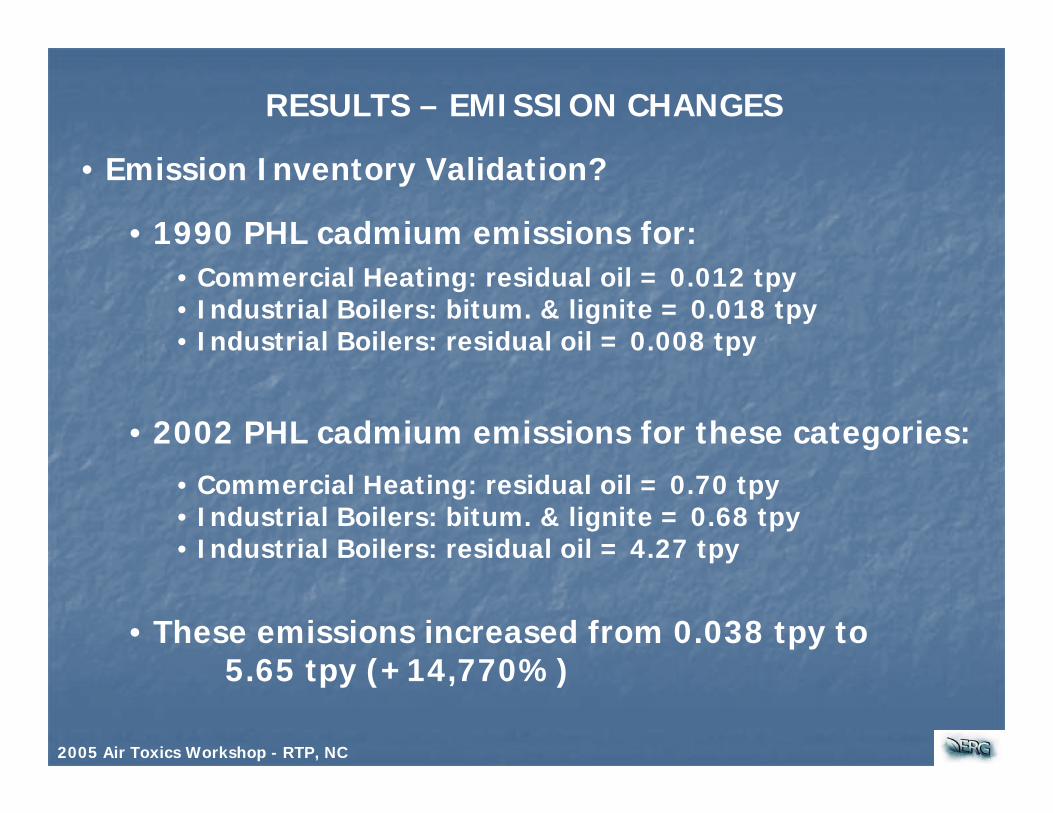
• Emission Inventory Validation?
• 1990 PHL cadmium emissions for:• Commercial Heating: residual oil = 0.012 tpy• Industrial Boilers: bitum. & lignite = 0.018 tpy• Industrial Boilers: residual oil = 0.008 tpy
• 2002 PHL cadmium emissions for these categories:• Commercial Heating: residual oil = 0.70 tpy• Industrial Boilers: bitum. & lignite = 0.68 tpy• Industrial Boilers: residual oil = 4.27 tpy
• These emissions increased from 0.038 tpy to 5.65 tpy (+14,770%)

RESULTS – EMISSION CHANGES
• What’s going on in DET?
+67% (DET) to +67% (DET) to --89% (STL)89% (STL)LeadLead
EMISSION CHANGESEMISSION CHANGESHAPHAP
2005 Air Toxics Workshop - RTP, NC
• Emission Inventory Comparison
• 1990 DET lead emissions = 19.0 tpy• 2002 DET lead emissions = 31.7 tpy

RESULTS – EMISSION CHANGES
2005 Air Toxics Workshop - RTP, NC
• Emission Inventory Validation?
• 1990 DET lead emissions for:• Utility oil-fired boilers = 0.21 tpy for entire MSA
• 2002 DET lead emissions for these categories:
• These emissions increased from 0.21 tpy to 17.2 (+8,100%)
• Detroit Edison Greenwood Energy Center = 13.7 tpy • St. Clair/Belle River Power Plant = 3.5

RESULTS – CONCENTRATION CHANGES
• Look at HAP concentration changes across each MSA
Xylenes (Total)Xylenes (Total)
TolueneToluene
MercuryMercury
LeadLead
FormaldehydeFormaldehyde
EthylbenzeneEthylbenzene
CadmiumCadmium
BenzeneBenzene
AcetaldehydeAcetaldehyde
HAPHAP
NoneNone
NoneNone
NoneNone
NoneNone
BOS, STL, LOSBOS, STL, LOS
NoneNone
PHL, LOSPHL, LOS
NoneNone
BOS, STLBOS, STL
Significant IncreasesSignificant Increases
BOS, NYC, PHL, DET, DAL, STL, LOSBOS, NYC, PHL, DET, DAL, STL, LOS
BOS, NYC, PHL, DET, DAL, LOSBOS, NYC, PHL, DET, DAL, LOS
NYC, DAL, STL, LOSNYC, DAL, STL, LOS
All MSAsAll MSAs
NYC, PHLNYC, PHL
BOS, NYC, PHL, DAL, LOSBOS, NYC, PHL, DAL, LOS
NYC, STL, DENNYC, STL, DEN
BOS, NYC, PHL, DET, DAL, STL, LOSBOS, NYC, PHL, DET, DAL, STL, LOS
NYC, PHL, LOSNYC, PHL, LOS
Significant DecreasesSignificant Decreases
2005 Air Toxics Workshop - RTP, NC

RESULTS – APPLICABLE IMPLEMENTED REGULATIONS
2005 Air Toxics Workshop - RTP, NC
• Title I: NSPS and NAAQS Programs• Solid Waste Combustion MACT rules• National VOC Emission Standards
• Title II: Mobile Sources Program:• Motor Vehicle Emission Standards (Tier I and II)• Fuel and Fuel Additives
• Title III: NESHAP Program: NESHAP Standards

RESULTS – REGULATIONS NOT CONSIDERED FOR STUDY
2005 Air Toxics Workshop - RTP, NC
• Title IV: Acid Rain Program – PM HAPs indirectly reduced through use of PM control devices
• Title V: Permitting Program – reduction of individual HAP sources
• Title VI: Stratospheric Ozone Protection Program
• Title VII: Enforcement
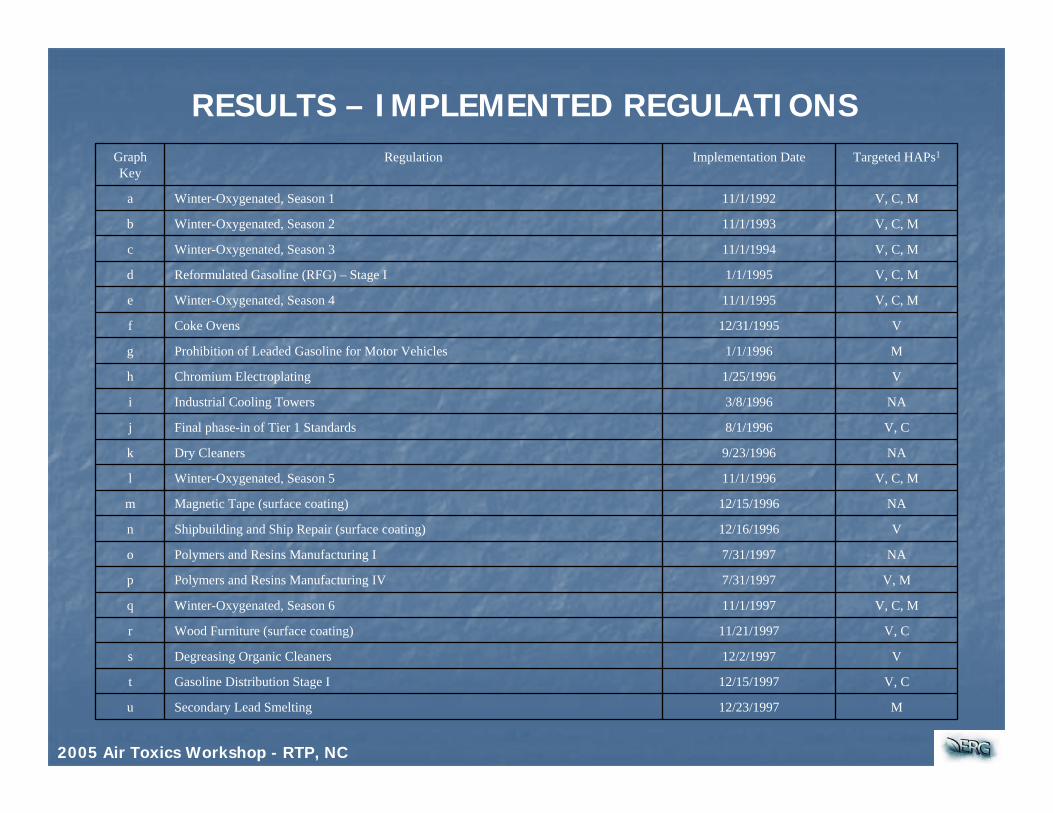
RESULTS – IMPLEMENTED REGULATIONS
M12/23/1997Secondary Lead Smeltingu
V, C12/15/1997Gasoline Distribution Stage It
V12/2/1997Degreasing Organic Cleanerss
V, C11/21/1997Wood Furniture (surface coating)r
V, C, M11/1/1997Winter-Oxygenated, Season 6q
V, M7/31/1997Polymers and Resins Manufacturing IVp
NA7/31/1997Polymers and Resins Manufacturing Io
V12/16/1996Shipbuilding and Ship Repair (surface coating)n
NA12/15/1996Magnetic Tape (surface coating)m
V, C, M11/1/1996Winter-Oxygenated, Season 5l
NA9/23/1996Dry Cleanersk
V, C8/1/1996Final phase-in of Tier 1 Standardsj
NA3/8/1996Industrial Cooling Towersi
V1/25/1996Chromium Electroplatingh
M1/1/1996Prohibition of Leaded Gasoline for Motor Vehiclesg
V12/31/1995Coke Ovensf
V, C, M11/1/1995Winter-Oxygenated, Season 4e
V, C, M1/1/1995Reformulated Gasoline (RFG) – Stage Id
V, C, M11/1/1994Winter-Oxygenated, Season 3c
V, C, M11/1/1993Winter-Oxygenated, Season 2b
V, C, M11/1/1992Winter-Oxygenated, Season 1a
Targeted HAPs1Implementation DateRegulationGraphKey
2005 Air Toxics Workshop - RTP, NC

RESULTS – IMPLEMENTED REGULATIONS
M6/4/2001Primary Lead SmeltingP
V, M4/16/2001Pulp and Paper IIO
V, M4/15/2001Pulp and Paper IN
C, M12/19/2000Municipal Waste Combustors – Large UnitsM
V, C, M11/1/2000Winter-Oxygenated, Season 9L
V, C8/1/2000National Low Emissions Vehicle Program – Stage IIK
NA2/1/2000Off-Site Waste Recovery OperationsJ
V, C, M1/1/2000Reformulated Gasoline (RFG) – Stage III
V, C, M11/1/1999Winter-Oxygenated, Season 8H
V10/7/1999Primary Aluminum ManufacturingG
V9/19/1999Marine Vessel LoadingF
V, C9/13/1999National VOC Rule for Architectural Surface CoatingE
C8/1/1999California Low Emissions Vehicle Program – Stage ID
V, C, M5/30/1999Printing and Publishing (surface coating)C
V, C5/12/1999Hazardous Organic NESHAPB
V, C1/1/1999National VOC Emission Standard for Autobody RefinishingA
V, C12/10/1998National VOC Emission Standard for Consumer Productsz
V, C, M11/1/1998Winter-Oxygenated, Season 7y
V, C, M9/1/1998Aerospace Manufacturing (surface coating)x
V, C, M8/18/1998Petroleum Refineriesw
V, C8/1/1998National Low Emissions Vehicle Program – Stage Iv
Targeted HAPs1Implementation DateRegulationGraphKey
2005 Air Toxics Workshop - RTP, NC

RESULTS – IMPLEMENTED REGULATIONS
V, C6/14/2002Wool Fiberglass ManufacturingZ
V, C, M6/14/2002Portland Cement ManufacturingY
M6/10/2002Phosphoric Acid ManufacturingX
NA6/10/2002Phosphate Fertilizer ProductionW
NA6/1/2002Polyether Polyols ProductionV
NA6/1/2002Mineral Wool ProductionU
NA11/21/2001Ferroalloys ProductionT
V, C, M11/1/2001Winter-Oxygenated, Season 10S
V10/8/2001Flexible Polyurethane Foam ProductionR
V, C, M9/21/2001Pharmaceuticals ProductionQ
NA6/22/2001Steel Pickling – HCl ProcessP1
Targeted HAPs1Implementation DateRegulationGraphKey
V12/23/2003Pesticide Active Ingredients Manufacture10
V, C, M11/1/2003Winter-Oxygenated, Season 129
M9/30/2003Hazardous Waste Combustion8
V, C, M3/24/2003Secondary Aluminum Production7
V, C, M1/20/2003Polymers and Resins Production III6
V, C, M11/1/2002Winter-Oxygenated, Season 115
V, C, M10/26/2002Publicly Owned Treatment Works4
M9/15/2002Hospital, Medical, Infectious Waste Incinerators3
M6/29/2002Generic MACT2
V, C, M6/17/2002Oil and Natural Gas Production1
V, C6/17/2002Natural Gas Transmission and Storage0
2005 Air Toxics Workshop - RTP, NC

RESULTS – BOSTON MSA
After the implementation of RFG Phase II (graph key = I) and the POTW MACT (graph key = 4), acetaldehyde concentrations appeared to have increased in the Boston MSA
2005 Air Toxics Workshop - RTP, NC
Boston-Cambridge-Quincy, MA-NH MSA Average Annual Acetaldehyde Concentrations (1990-2003)
0
5
10
15
20
25
30
35
40
1990 1991 1992 1993 1994 1995 1996 1997 1998 1999 2000 2001 2002 2003
Year
Con
cent
ratio
n (u
g/m
3)
a b c ed Iz,A D,E 4

RESULTS – NEW YORK MSA
Mercury concentrations appeared to have decreased after implementation of the Petroleum Refineries MACT (graph key = w), Reformulated Gasoline Phase II program (graph key = I), and the Large Municipal Waste Combustors MACT (graph key = M)
2005 Air Toxics Workshop - RTP, NC
New York-Northern New Jersey-Long Island, NY-NJ-PA MSA Average Annual Mercury Compound Concentrations (1990-2003)
0
10
20
30
40
50
1990 1991 1992 1993 1994 1995 1996 1997 1998 1999 2000 2001 2002 2003
Year
Con
cent
ratio
n (n
g/m
3)
a b c,d e l q y H,I M 3 8w Q

RESULTS – PHILADELPHIA MSA
Lead compound concentrations appeared to have decreased substantially after implementation of the Secondary Lead Smelter MACT (graph key = u) and the Gasoline
Distribution Stage I MACT (graph key = t)
2005 Air Toxics Workshop - RTP, NC
Philadelphia-Camden-Wilmington, PA-NJ-DE-MD MSA Average Annual Lead Compound Concentrations (1990-2003)
0
150
300
450
600
750
900
1050
1200
1350
1500
1990 1991 1992 1993 1994 1995 1996 1997 1998 1999 2000 2001 2002 2003
Year
Con
cent
ratio
n (n
g/m
3)
a b c,d e,g Iw,xt,u MC Q 3,4 8
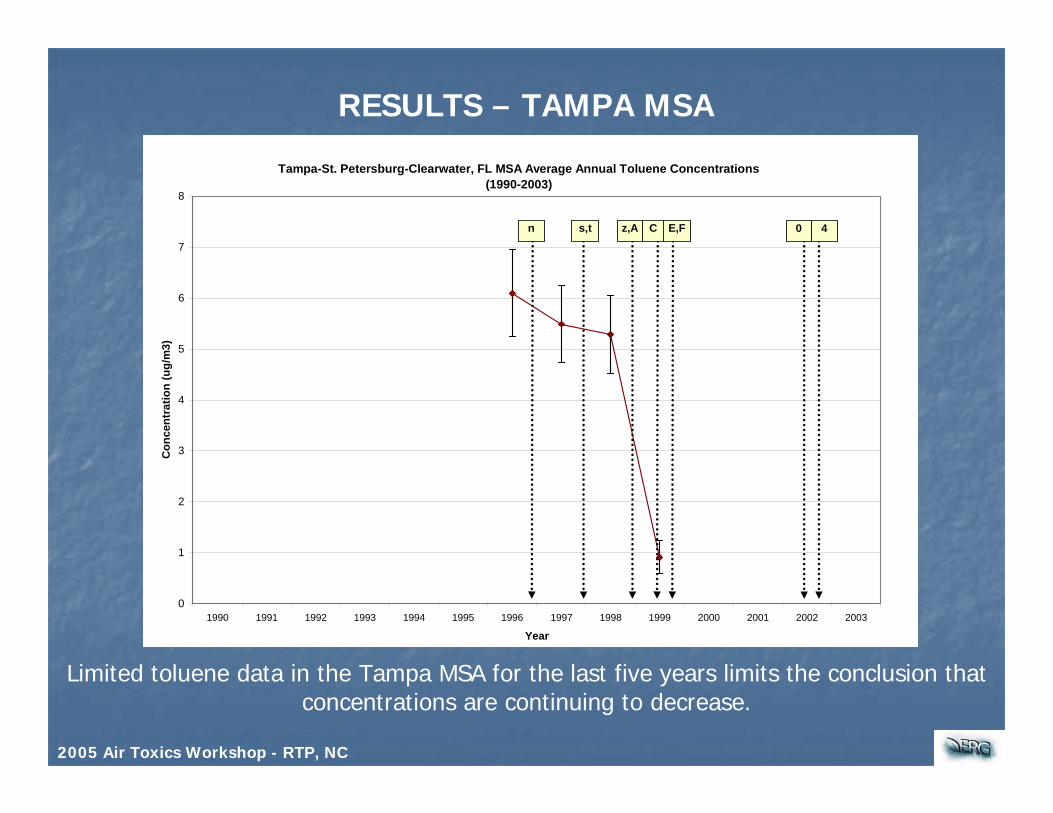
RESULTS – TAMPA MSA
Limited toluene data in the Tampa MSA for the last five years limits the conclusion that concentrations are continuing to decrease.
2005 Air Toxics Workshop - RTP, NC
Tampa-St. Petersburg-Clearwater, FL MSA Average Annual Toluene Concentrations (1990-2003)
0
1
2
3
4
5
6
7
8
1990 1991 1992 1993 1994 1995 1996 1997 1998 1999 2000 2001 2002 2003
Year
Con
cent
ratio
n (u
g/m
3)
n s,t E,Fz,A C 40
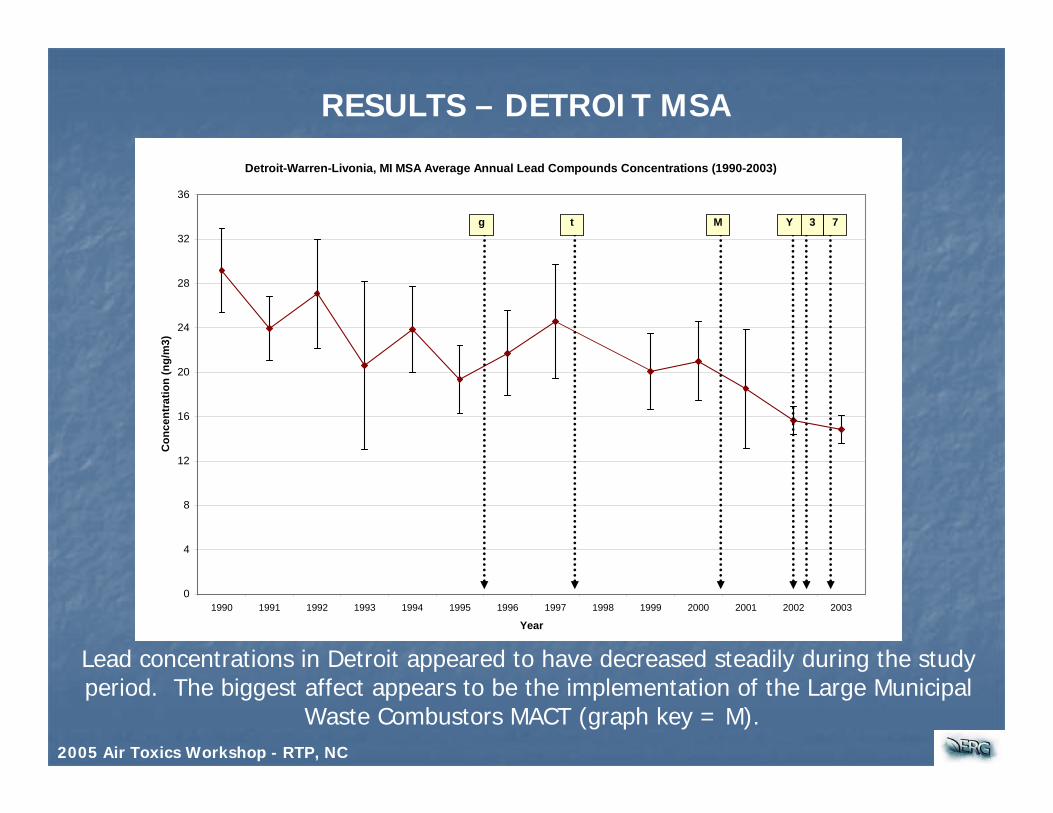
RESULTS – DETROIT MSA
Lead concentrations in Detroit appeared to have decreased steadily during the study period. The biggest affect appears to be the implementation of the Large Municipal
Waste Combustors MACT (graph key = M).2005 Air Toxics Workshop - RTP, NC
Detroit-Warren-Livonia, MI MSA Average Annual Lead Compounds Concentrations (1990-2003)
0
4
8
12
16
20
24
28
32
36
1990 1991 1992 1993 1994 1995 1996 1997 1998 1999 2000 2001 2002 2003
Year
Con
cent
ratio
n (n
g/m
3)
Yg t M 3 7

RESULTS – DALLAS MSA
Mercury compound concentrations appear to have decrease substantially with the implementation of the Reformulated Gasoline Phase 1 Program (graph key = d).
However, according to the NEI, mercury emissions from Hazardous Waste Combustors decreased by 97% from 1996 to 2002 for this MSA, most likely as a result of impending
regulations (graph key = 8). 2005 Air Toxics Workshop - RTP, NC
Dallas-Fort Worth-Arlington, TX MSA Average Annual Mercury Compound Concentrations (1990-2003)
0
200
400
600
800
1000
1200
1400
1990 1991 1992 1993 1994 1995 1996 1997 1998 1999 2000 2001 2002 2003
Year
Con
cent
ratio
n (n
g/m
3)Id Y 8

RESULTS – ST. LOUIS MSA
Total xylene concentrations in the St. Louis MSA declined dramatically from 1990 to 2003, apparently in response to several implemented stationary and mobile source
regulations targeting VOCs (graph keys = d-Q). However, limited data availability of xylene measurements between 1995 and 2000 limit the certainty of these conclusions.
2005 Air Toxics Workshop - RTP, NC
St. Louis, MO-IL MSA Average Annual Xylenes (m-,p-,o- ) Concentrations (1990-2003)
0
3
6
9
12
15
18
21
24
27
1990 1991 1992 1993 1994 1995 1996 1997 1998 1999 2000 2001 2002 2003
Year
Con
cent
ratio
n (u
g/m
3)Iw,x E,FB,Cz,Ar,tp Qd 4 60,1
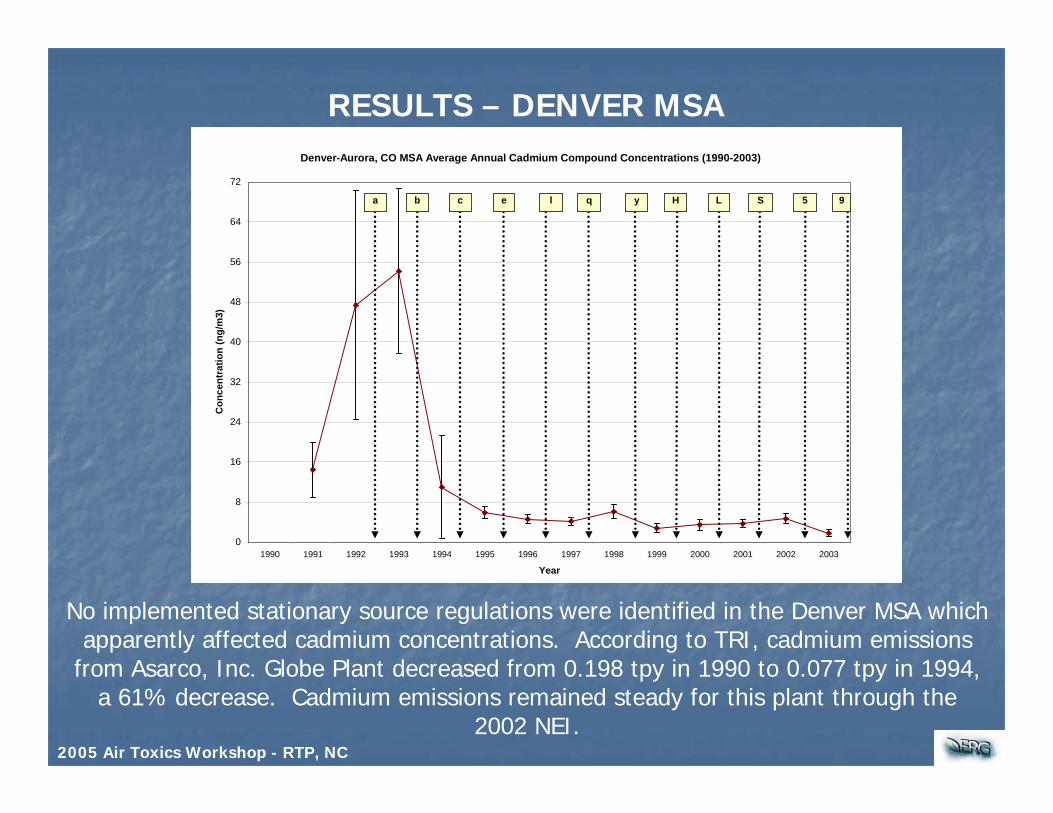
RESULTS – DENVER MSA
No implemented stationary source regulations were identified in the Denver MSA which apparently affected cadmium concentrations. According to TRI, cadmium emissions
from Asarco, Inc. Globe Plant decreased from 0.198 tpy in 1990 to 0.077 tpy in 1994, a 61% decrease. Cadmium emissions remained steady for this plant through the
2002 NEI. 2005 Air Toxics Workshop - RTP, NC
Denver-Aurora, CO MSA Average Annual Cadmium Compound Concentrations (1990-2003)
0
8
16
24
32
40
48
56
64
72
1990 1991 1992 1993 1994 1995 1996 1997 1998 1999 2000 2001 2002 2003
Year
Con
cent
ratio
n (n
g/m
3)
ya b l q Hec L S 5 9

RESULTS – LOS ANGELES MSA
Formaldehyde concentrations have steadily increased during the study period. This is most likely due to the implementation of the Reformulated Gasoline Phase I Program
(graph key =d).
2005 Air Toxics Workshop - RTP, NC
Los Angeles-Long Beach-Santa Ana, CA MSA Average Annual Formaldehyde Concentrations (1990-2003)
0
1
2
3
4
5
6
7
8
9
1990 1991 1992 1993 1994 1995 1996 1997 1998 1999 2000 2001 2002 2003
Year
Con
cent
ratio
n (u
g/m
3)
y,z,A
a b l q,r,t H,Iec,d L,M
Q,S 4,5,6
9B,C,D
w,x E,G
N,O 0,1,2
7

RESULTS – SEATTLE MSA
Over the last three years, formaldehyde concentrations have appeared to have increased, noticeably after the implementation of the Publicly Owned Treatment
Works MACT (graph key = 4). However, formaldehyde data prior to 2001 is limited or unavailable, thus making it difficult to characterize a trend.
2005 Air Toxics Workshop - RTP, NC
Seattle-Tacoma-Bellevue, WA MSA Average Annual Formaldehyde Concentrations (1990-2003)
0
1
2
3
4
5
6
1990 1991 1992 1993 1994 1995 1996 1997 1998 1999 2000 2001 2002 2003
Year
Con
cent
ratio
n (u
g/m
3)
N,Oa b c Ke z,A Ej r x 4

CONCLUSIONS
What are the HAP concentration trends?
Over 85% of the MSA-HAP combinations measured across the ten MSAs realized a decrease in their HAP concentrations, while less than 15% realized an increase.
This observation would suggest that most HAPs had a decreasing trend during the study period.
2005 Air Toxics Workshop - RTP, NC
Additionally, more than half of the percentage reduction comparisons for concentrations and emissions (30 of 57) were within 20% of each other, with one as close as 1% (e.g., Los Angeles total xylene emissions: 73% decrease in emissions, 74% decrease in average concentration).

CONCLUSIONS
Have HAP-specific federal regulations been effective atreducing ambient concentrations?
Sixty-four HAP-specific regulations were implemented between 1992-2003. During that time period, most HAP concentrations decreased, suggesting a correlation between the two. The most effective regulations on pollutant types, based on visual inspection of the regulation impact analysis figures, were:
VOCs: Reformulated Gasoline Phase I, VOC rules, Printing/Publishing MACT, Tier 1 Mobile Source Standards, Reformulated Gasoline Phase II
Metals: Prohibition of Leaded Gasoline, Aerospace Manufacturing MACT, Petroleum Refineries MACT, Reformulated Gasoline Phase II, Large Municipal Waste Combustors MACT, Secondary Lead Smelter MACT, Stage I Gasoline Distribution MACT, Primary Lead Smelter MACT
Carbonyls: Reformulated Gasoline Phase I, National Low Emissions Vehicle Program Phase II, Pharmaceuticals Production
2005 Air Toxics Workshop - RTP, NC

CONCLUSIONS
Do HAP emissions show a decline due to HAP-specificfederal regulations?
• HAP emissions for each MSA decreased substantially from 1990 to 2002.
• Total emissions across the ten MSAs for each HAP decreased from 580,000 tpy to 270,000 tpy (53% reduction).
• Emissions in the Los Angeles MSA decreased the most among the MSAs (69% reduction, 86,000 tpy).
• For the HAPs, mercury emissions realized the highest percent reduction (80%), while toluene emissions realized the highest mass reduction (140,000 tpy).
2005 Air Toxics Workshop - RTP, NC

QUESTIONS?
2005 Air Toxics Workshop - RTP, NC