evaluating planetesimal bow shocks as sites for...
TRANSCRIPT

Meteoritics & Planetary Science 39, Nr 11, 1809�1821 (2004)
Abstract available online at http://meteoritics.org
1809 © Meteoritical Society, 2004. Printed in USA.
Evaluating planetesimal bow shocks as sites for chondrule formation
Fred J. CIESLA,1* Lon L. HOOD,2 and Stuart J. WEIDENSCHILLING3
1NASA Ames Research Center, MS 245-3, Moffett Field, California 94035, USA2Lunar and Planetary Laboratory, University of Arizona, 1629 East University Boulevard, Tucson, Arizona 85721, USA
3Planetary Science Institute, 1700 East Fort Lowell, Tucson, Arizona 85719, USA*Corresponding author. E-mail: [email protected]
(Received 17 November 2003; revision accepted 28 May 2004)
Abstract�We investigate the possible formation of chondrules by planetesimal bow shocks. The
formation of such shocks is modeled using a piecewise parabolic method (PPM) code under a variety of
conditions. The results of this modeling are used as a guide to study chondrule formation in a one-
dimensional, finite shock wave. This model considers a mixture of chondrule-sized particles and
micron-sized dust and models the kinetic vaporization of the solids. We found that only planetesimals
with a radius of ~1000 km and moving at least ~8 km/s with respect to the nebular gas can generate
shocks that would allow chondrule-sized particles to have peak temperatures and cooling rates that are
generally consistent with what has been inferred for chondrules. Planetesimals with smaller radii tend
to produce lower peak temperatures and cooling rates that are too high. However, the peak temperatures
of chondrules are only matched for low values of chondrule wavelength-averaged emissivity. Very slow
cooling (<~100s of K/hr) can only be achieved if the nebular opacity is low, which may result after a
significant amount of material has been accreted into objects that are chondrule-sized or larger, or if
chondrules formed in regions of the nebula with small dust concentrations. Large shock waves of
approximately the same scale as those formed by gravitational instabilities or tidal interactions between
the nebula and a young Jupiter do not require this to match the inferred thermal histories of chondrules.
INTRODUCTION
Chondrules are millimeter-sized, silicate spheres that are
abundant in most chondritic meteorites. The textures of these
objects suggest that they formed before being incorporated
into their respective meteorite parent bodies (for a detailed
review of our current understanding of chondrules and their
formation, see Jones et al. [2000]). The exact method by which
these chondrule melts were formed and kept warm as crystals
grew has not yet been identified.
Recently, shock waves within the solar nebula have
been shown to be capable of explaining the complex thermal
histories that have been inferred for chondrules and possibly
allow for the formation of other meteoritic components (Iida
et al. 2001; Desch and Connolly 2002; Ciesla and Hood
2002; Ciesla et al. 2003). While such work supports the
hypothesis that shock waves were the dominant chondrule
forming mechanism in the solar nebula, the source of the
shocks still remains to be determined. In the studies
mentioned above, large scale shock waves (>105 km) were
modeled, suggesting that shocks due to gravitational
instabilities (Boss 2002) or tidal interactions of Jupiter with
the nebula (Bryden et al. 1999; Rafikov 2002) may have
been where chondrules formed. Other possible sources are
planetesimals, the orbits of which caused them to attain
supersonic velocities with respect to the nebular gas (Hood
1998; Weidenschilling et al. 1998). Such velocities could be
attained if the planetesimals were in highly eccentric or
inclined orbits around the Sun.
While the existence of planetesimals before the
formation of the very primitive chondrules (and thus the
chondrite parent bodies) seems paradoxical, it may have been
possible given the inferred extended lifetime of the nebula
before chondrule formation. Amelin et al. (2002) used Pb-Pb
dating to show that chondrules formed 2.5 ± 1.2 Myr after the
formation of calcium-aluminum-rich inclusions (CAIs), the
first objects to have formed in the solar nebula. This time is
much longer than the expected time needed to accrete large
bodies in a laminar solar nebula (~104 yr), and possibly long
enough to accrete these same bodies in a weakly turbulent
nebula (Weidenschilling 1988; Weidenschilling and Cuzzi
1993). In fact, it is possible that this age of chondrules
overlapped the global differentiation of the parent body of the
HED meteorites, thought to be the 500 km-diameter asteroid

1810 F. J. Ciesla et al.
4 Vesta, which must have occurred no later than 4 Myr after
CAI formation (Wadhwa and Russell 2000). If this were the
case, then it is reasonable to think that other such bodies
existed at the same time but were subsequently removed from
the asteroid belt (Chambers and Wetherill 2001). This
scenario requires further study due to the dependence on
unconstrained parameters used in solar nebula and accretion/
coagulation models. For the purposes of this study, we
assume that chondrule precursors existed in a nebula where
bodies up to 1000 km in size had accreted. These precursors
could either have been material that had not yet been accreted
by planetesimals or material ejected from the collisions of
planetesimals.
In addition, this scenario requires Jupiter to have formed
fairly rapidly so that it could stir up planetesimals in time to
make chondrules. A rapid formation of Jupiter is possible if it
formed via the gravitational instability mechanism (e.g., Boss
2002; Mayer et al. 2002). In addition, recent work suggests
that the core accretion mechanism for forming Jupiter can
work on much shorter timescales (~1 Myr) than previously
calculated, provided that the core migrated through the nebula
over time (Alibert et al. 2004). Thus, having Jupiter present at
the time of chondrule formation is possible through either
giant planet formation mechanism. Weidenschilling et al.
(1998; see also Marzari and Weidenschilling [2002]) found
that, in the solar nebula, planetesimals larger than 10 km
could get trapped in resonances with Jupiter and attain
velocities of 5 km/s or higher with respect to the nebular gas.
Hood (1998) performed hydrodynamic simulations to
investigate the characteristics of bow shocks that would be
created by such supersonic planetesimals. He found that the
shocks created by these planetesimals would be strong enough
to melt silicates in a few seconds, which is consistent with how
chondrules are thought to have formed, provided that the
planetesimals had relative velocities of at least 5.5�7 km/s
with respect to the gas. However, no explicit calculations have
been carried out to study the cooling histories of the silicate
particles heated by these small-scale (<100 km) shocks.
Hood and Ciesla (2001) found that cooling rates of
particles in a relatively small (<1000 km) shocked region of
the nebula that was filled significantly with micron-sized
dust particles could be similar to those of chondrules if
certain generous assumptions were made. Some of these
assumptions were that no relative motion between the
chondrule-sized particles and dust particles existed and that
all of the particles were initially at the same temperature
throughout the region of interest. If a shock wave passed
through a region of the nebula with dust (d = 1 Pm) and
chondrules (d = 1 mm), the particles would move through the
gas until they lost their velocity with respect to the gas. The
stopping distance of a particle is equal to the distance it must
travel before encountering a mass of gas equal to itself. This
distance is equal to xstop = 2U/Ugd, where U is the mass
density of the particle and Ug is the mass density of the gas.
For typical values of U and Ug (1 g/cm3 and 10�9 g/cm3
respectively), xstop is ~109d (108d in shocked gas where the
gas density increases by roughly an order of magnitude over
the ambient value). Thus, a millimeter-sized chondrule
would have a stopping distance three orders of magnitude
greater than that of the micron-sized dust particle. Therefore,
the assumption that no relative velocity between the two
solid particles would exist is not valid until the larger of these
distances has been traversed (~200 km for typical values).
The relative velocity between these particles could cause the
chondrules and dust to be at very different temperatures over
a large fraction of the region of interest, which was not
considered by Hood and Ciesla (2001).
In this paper, the model of Hood (1998) is extended to
investigate whether planetesimal bow shocks could have
thermally processed silicates in a manner similar to how
chondrules are believed to have been processed. In particular,
the cooling rates of the silicates are investigated to see if those
predicted in the model are consistent with those expected for
chondrules. In the next section, we present new simulations of
the bow shocks that would be created by supersonic
planetesimals and describe the structure of these shock waves
in detail. Using these results as a guide, we develop a one-
dimensional model to track the heating and cooling of a
particle-gas suspension with a mixture of chondrule-sized and
micron-sized particles that is overrun with produced shock
waves discussed in the Shock Model section. This model
allows for the vaporization and recondensation of the silicates.
We discuss the results of this modeling in the Results section.
In the Discussion section, we discuss what implications this
work has for understanding chondrule formation.
PLANETESIMAL BOW SHOCKS
We have used the publicly available Virginia
Hydrodynamics-1 code developed by John Blondin and
colleagues that solves the equations of gas dynamics using a
Lagrangian remap version of the piecewise parabolic method
(PPM). The code is based on the methods outlined in Colella
and Woodward (1984) and has been used to simulate a variety
of astrophysical problems (e.g., Richards and Ratliff 1998).
For this work, we used the code to study the flow of gas
around a planetesimal of arbitrary size and velocity in the
solar nebula. In our runs, the equation of state for the gas is
the ideal gas law, where effects such as dissociation and
radiation were not considered. Therefore, the gas behaves
adiabatically in these simulations.
In our simulations, we used a two-dimensional, 200 ×
200 Cartesian grid with the planetesimal centered in the
middle of the grid. The planetesimal was treated as a high-
density, low-pressure fluid with no velocity. The surrounding
nebular gas was set at a given temperature and pressure and
given an initial, arbitrary velocity with respect to the
planetesimal. The code was run until a steady state was

Evaluating planetesimal bow shocks as sites for chondrule formation 1811
formed and the dynamics of the flow were well established.
Since a Cartesian grid is used, the calculated flow is
essentially equal to that around an infinite cylinder rather than
a spherical planetesimal. Since we ignore the expansion of the
gas in the z-direction (into and out of the page), the densities
presented here may be slightly higher than they would be in
the case of a spherical planetesimal. Thus, we may be
overestimating the gas density in the vicinity of a
planetesimal�an issue we discuss in detail below.
We considered 10 km, 100 km, and 1000 km radii
planetesimals with gas velocities of 4 km/s, 6 km/s, and
8 km/s relative to the planetesimal. These velocities were
found to be representative of those found in the model runs of
Weidenschilling et al. (1998). Significantly higher velocities
would require much greater eccentricities or significant
inclinations of the planetesimal�s orbit (Hood 1998).
An example of one of our runs is shown in Fig. 1, where
we consider a 1000 km planetesimal moving through nebular
gas at a velocity of 8 km/s (we focus on this velocity because
it creates the strongest shocks and, therefore, the greatest
amount of heating of solids in the nebula). This velocity would
correspond to a planetesimal with an eccentricity of ~0.5 at
3 AU, near the maximum value as found by Marzari and
Weidenschilling (2002). The gas is assumed to initially be at
a density of 10�9 g/cm3 and at a temperature of 400 K upstream
of the planetesimal (same values used in Hood [1998]),
creating a shock of about Mach 4. In this figure, the density of
the gas is shown as it flows around the planetesimal (the dense
white object in the center). The gas initially flows from left to
right at a velocity of 8 km/s until the flow is disturbed by the
planetesimal. The modeled smaller planetesimals produced
similar shocks that scale with the size of the planetesimal. For
example, the 100 km-radius planetesimal produced results
similar to that shown in Fig. 1, except the distances on the two
axes were smaller by a factor of 10.
The shock front that forms in this scenario is the
parabolic discontinuity between the upstream gas and the
denser region behind it. For lower velocities of the upstream
gas, the curvature of the shock front is not as great. The shape
of this shock front is important to consider in studying the
processing of particles suspended in the nebula because the
strength of the shock wave is determined by the component of
the gas velocity that is perpendicular to the shock front. Since
the incident gas is moving directly left to right in Fig. 1, the
effective velocity with which it passes through the shock front
is less than the initial upstream velocity.
Figure 2 shows how the effective velocity of the shock
varies with distance from the center of the planetesimal for the
different velocities that were considered. Here, the distance
from the center of the planetesimal refers to the impact
parameter, or distance perpendicular to the initial gas flow
from the center of the planetesimal to the point of interest. The
effective velocity was found by tracing a trajectory parallel to
the velocity of the upstream gas through the shock and finding
the maximum density of the gas along this trajectory. Using
the ratio of this maximum density to the density of the
upstream gas, we calculated what velocity of shock would be
needed to produce that density jump. This treatment
determines the shock strength everywhere, accounting for the
fact that the gas velocity is not perpendicular to the shock
front. Note that the results shown in Fig. 2 are independent of
Fig. 1. A simulation of gas flow around a planetesimal using thepiecewise parabolic method to solve the equations of flow. Theplanetesimal is the white object at the center. The density of the gasis shown. The gas is assumed to be owing from the left boundary at8 km/s at a temperature of 400 K and a density of 10�9 g/cm�3. Theplanetesimal is assumed to have a radius of 1000 km.
Fig. 2. The effective shock velocities are plotted as a function ofdistance from the center of the planetesimal for a number ofplanetesimal-gas relative velocities (Vp). The effective velocitydecreases with distance from the planetesimal due to the curvature ofthe bow shock. The plot is truncated at ~1.5 Rp due to the complexflow near the surface of the planetesimal.

1812 F. J. Ciesla et al.
planetesimal size, as they are plotted in units of planetesimal
radii (in the runs of planetesimals of different sizes the results
did not vary). The bumps and wiggles of the plot are the result
of the finite resolution of the simulations.
The plots are truncated at ~1.5 planetesimal radii
because the flow of the gas around the surface of the
planetesimal is complex and does not allow for simple
considerations as those used here. This is because large
pressure gradients and lateral flow develop in the gas as it
flows around the planetesimal. Particles that enter the bow
shock inside of this distance would experience large
deflections due to this extreme change in gas flow. Since the
region interior to this distance makes up a small volume of
space, we feel that neglecting it will not change our results
significantly. For the purposes of this study, we focus on the
bow shock exterior to 1.5 planetesimal radii where the
lateral gas flow is low. We will discuss the likely effects of
chondrules entering the shocks inside of this distance at the
end of this paper. Overall, it is important to note that the
effective shock velocity drops off with increasing distance
from the planetesimal and the drop off is steeper with
increasing planetesimal velocity.
Figure 3 shows the density profile of the gas along the
horizontal trajectory at 1.6 planetesimal radii (1600 km)
from the center of the planetesimal in the simulation shown
in Fig. 1, where the effective shock velocity is near its
maximum value (~6 km/s). The distance is measured from
the left edge of the simulation. The gas density increases
sharply at the shock front, but then slowly decreases with
distance. The density actually reaches a value below the
original gas density in the wake of the planetesimal (~3
planetesimal radii behind the shock) as is found in other
simulations of flow around a rigid body. Similar profiles
would be found at larger distances from the planetesimal
with the maximum density decreasing with increasing
distance. Thus, this figure illustrates the structure of the one-
dimensional slice of the shock created by the planetesimal
and how the gas density (as well as temperature and
pressure) is elevated over a finite distance.
SHOCK MODEL
The structure of the shock in the one-dimensional model
used here is diagrammed in Fig. 4, where the temperatures of
the gas and particles are sketched at different points in the
shock. In the region upstream from the shock, particles are
heated by the radiation from the hot particles behind the shock
front. These particles in turn heat the gas as the shock front
approaches. Upon passing through the shock front, the gas
properties change as given by the Rankine-Hugoniot relations:
(1)
(2)
(3)
where T, n, and v represent the gas temperature, number
density of gas molecules, and gas velocity with respect to the
shock front, and the subscripts 1 and 2 represent the values
immediately before and after the shock, respectively, J is the
ratio of specific heats for the gas, and M is the Mach number
(the ratio of the speed of the gas with respect to the shock
front to the speed of sound in that gas immediately before
passage through the front).
Upon passing through the shock front, the gas begins to
cool rapidly due to the dissociation of hydrogen molecules.
The particles pass through the shock front unaffected and, due
to energy and momentum exchange with the gas, are rapidly
heated as their velocity with respect to the gas decreases. This
rapid heating is what causes the spike in the temperature
profile behind the shock front. After reaching their peak
temperatures, the particles begin to cool, rapidly at first,
before reaching a slower and roughly constant rate
(represented by the gentle slope immediately before the end
of the shock in the diagram). This slow cooling region is
where the radiative energy loss of the particles is only slightly
higher than the heat input due to thermal collisions with the
gas molecules and the absorbed radiative energy from the
surrounding hot particles. This region is called the �relaxation
zone� in this model.
After some distance, the gas will start to approach its
original, undisturbed, state. This likely happens after the gas
expands and cools and the nebula �erases� any evidence of
the shock. In our model, upon passing through the end of the
shock (assumed to be 3 planetesimal radii behind the shock
front), the gas properties return to what they were before
crossing through the shock front. The distance of 3
planetesimal radii was chosen to be consistent with Fig. 3
(over this distance, the gas density is at a higher value than in
the ambient state). The particles are, again, unaffected when
crossing through this region and exchange energy and
momentum with the gas as the system relaxes back to its
original state (same temperature and velocity as far upstream
from the shock). This immersion of the particles back in the
cool gas helps quench the particles, causing them to cool very
rapidly. In addition, since the gas begins to expand and carry
the solids with it, the decrease in concentration of the solids
weakens the radiation field that the particles will feel, and
thus the solids will not be able to absorb as much energy.
Previous shock models that focused on large scale shocks
(Iida et al. 2001; Desch and Connolly 2002; Ciesla and Hood
2002; and Ciesla et al. 2003) did not consider what happened
to the gas and particles as they exited the relaxation zone of
T2
T1
-----2JM
2 J 1�� ��> @J 1�� �M22+> @
J 1+� �2M
2> @-------------------------------------------------------------------------------=
n2
n1
-----J 1+� �M2
J 1�� �M22+> @
--------------------------------------=
v2
v1
----n1
n2
-----=

Evaluating planetesimal bow shocks as sites for chondrule formation 1813
the shock. The details likely depend on the source of the
shocks, but should be considered in future work.
In treating the system this way, a number of simplifying
assumptions have been made. In the simulations described in
the Planetesimal Bow Shocks section, the gas properties began
to relax back to their pre-shock values as they moved away from
the shock front rather than being maintained at the shocked
values. In the model used here, the gas expansion is ignored.
This means that the gas in the present model is kept at a higher
temperature and higher density than would be expected in a real
situation. Thus, this allows the gas to transfer a higher amount of
energy to the particles (and keep them warm) for a longer period
of time. Also, the shocked region is assumed to be infinite in the
directions perpendicular to the velocity of the shock for the
radiative transfer calculations. Both of these treatments likely
lead to underestimating the cooling rates of the particles in our
model. These assumptions will be discussed later.
The equations which govern the evolution of the
system are similar to those used by Ciesla and Hood
(2002). Along with chondrule-sized particles, we consider
the presence of micron-sized dust particles. The dust
particles interact with the gas in the same manner as the
chondrules. In addition, the chondrules and dust particles
are allowed to vaporize as they are heated. This process is
handled in the same manner that Moses (1992) treated
silicate vaporization. Thus, the equations which govern the
evolution of the solids are:
Mass Evolution
(4)
(5)
Density Evolution
(6)
(7)
Momentum Evolution
(8)
(9)
Energy Evolution
Fig. 3. The gas density is plotted along a horizontal trajectory inFig. 1 that crosses the bow shock approximately 1.5 Rp from thecenter of the planetesimal. The distance is measured from the leftboundary of Fig. 1. The density of the gas decreases immediatelybehind the shock front, reaching its original, pre-shock value aftertraveling a distance of approximately 3 Rp.
dmchon
dx-----------------
1
vchon
------------dmchon
dt-----------------=
dmdust
dx----------------
1
vdust
-----------dmdust
dt----------------=
d
dx------ Uchonvchon� �
Uchon
mchon
--------------vchon
dmchon
dx-----------------=
d
dx------ Udustvdust� �
Udust
mdust
------------vdust
dmdust
dx----------------=
d
dx------ Uchonvchon
2� � FD chon
Uchon
mchon
--------------vchon
2 dmchon
dx-----------------+=
d
dx------ Udustvdust
2� � FD dust
Udust
mdust
------------vdust
2 dmdust
dx----------------+=
(10)
(11)
d
dx------ CchonTchon
1
2---vchon
2+© ¹
§ · Uchonvchon Qg chon Qp chon Qchon rad� FD chon LUchon
mchon
--------------vchon
dmchon
dx----------------+
1
2---nchonv
chon
3+ ++=
dmchon
dx----------------- CchonTchon
Uchon
mchon
--------------vchon
dmchon
dx-----------------+
d
dx------ CdustTdust
1
2---vdust
2+© ¹
§ · Udustvdust Qg dust= Qp dust Qdust rad� FD dust LUdust
mdust
------------vdust
dmdust
dx----------------+
1
2---ndustvdust
3+ ++
dmdust
dx---------------- CdustTdust
Udust
mdust
------------vdust
dmdust
dx----------------+

1814 F. J. Ciesla et al.
where x is the one-dimensional spatial coordinate, mchon and
mdust are the mass of a chondrule and dust particle, vchon and
vdust are the velocities of the chondrules and dust particles
with respect to the shock front, Uchon and Udust are the mass
densities of the chondrules and dust particles suspended in
the gas, and Tchon and Tdust are the temperatures of the
chondrules and dust particles. Since we assume that the
chondrules and dust particles are composed of the same
material, the heat capacities, Cchon and Cdust, and latent heat of
vaporization, L, are assumed to be equal for the two particles.
The terms FD chon and FD dust represent the gas drag force
exerted on the particles per unit volume, while Qg chon and Qg
dust represent the rate at which thermal energy is transferred
from the gas to the particles per unit volume. These terms are
calculated in the same manner as described in Ciesla and
Hood (2002). The terms Qp chon, Qp dust, Qchon rad, and Qdust rad
represent the rate of radiative heating and cooling the
particles experience and are calculated using the principles of
radiative transfer as described in Desch and Connolly (2002).
The rate at which the particles lose mass is calculated in
a manner similar to that employed in Moses (1992). The rate
at which the chondrule would lose mass is given by:
(12)
with a similar equation describing the mass loss for the dust
particles. In the equation above, dchon is the diameter of the
chondrule, Peq represents the equilibrium vapor pressure of
the silicate particles (in dynes/cm2), Pfeel is the vapor pressure
the particles �feel� on their surfaces, P is the mean molecular
mass of the silicate vapor, and k is Boltzmann�s constant (note
Moses [1992] assumed that Pfeel was negligible and, thus, this
term was not included in that work). The equilibrium pressure
is calculated by:
(13)
where A = 13.176 and B = 24,605 (Moses 1992). The pressure
felt by the particle is given by:
(14)
where nSiV is the number density of silicate vapor molecules
present, USiV is the mass density of those molecules, and vg is
the velocity of the gas with respect to the shock front (Miura et
al. 2002). Following Moses (1992), we do not consider the
decomposition of the silicate particles into different
components (e.g., Mg2SiO4 + 3H2 o�2Mg + SiO + 3H2O),
but instead treat it as losing a single molecule of mean
molecular mass P. Since chondrules are not pure substances
and, therefore would decompose into a number of different of
species, tracking each species would be difficult. Since the
amount of vapor released by vaporization is small compared
the amount of hydrogen or helium present, it likely has little
effect on the results of this work.
We ignore the effects of collisions between particles in
our model and assume that the thermal and dynamical
histories of the particles would not be significantly affected
by such considerations. Unless collisions would lead to
large changes in the size distribution of the particles, which
would affect the opacity of the nebula, this assumption
should be valid. The most significant outcome of such
collisions may be the seeding of chondrule melts by
collisions with small dust particles (Connolly and Hewins
1995). This could affect the textures of the chondrule-sized
particles processed in these shocks.
The nebular gas also evolves as described by the
following equations:
Molecular Hydrogen Evolution
(15)
Atomic Hydrogen Evolution
(16)
Helium Evolution
(17)
Silicate Vapor Evolution
Gas Momentum Evolution
dmchon
dt----------------- Sdchon
2Peq Pfeel�� �
P2SkTchon
-----------------------© ¹§ · 1 2e
�=
Peq 10
AB
Tchon
-------------�
=
Pfeel nSiVKTg
1
3---USiV vchon vg�� �2
+=
d
dx------ nH2
vg� �K � H2=
d
dx------ nHvg� � 2KH2
=
d
dx------ nHevg� � 0=
(18)d
dx------ nSiVvg� �
1
mSiV
------------�dmchon
dx-----------------nchonvchon+
dmdust
dx----------------ndustvdust¹
ᩤ=
(19)d
dx------ Ugvg
2� �dP
dx------+ F� D chon F� D dust
Uchon
mchon
--------------vchon
2�
dmchon
dx-----------------
Udust
mdust
------------vdust
2�
dmchon
dx-----------------=

Evaluating planetesimal bow shocks as sites for chondrule formation 1815
Gas Energy Evolution
where KH2 is the rate of dissociation per unit volume of
hydrogen molecules, Qdiss is the rate of energy loss due to
dissociation per unit volume both calculated as described in
Iida et al. (2001), and nH are the number densities of
hydrogen molecules and atoms, nHe is the number density of
helium atoms, and Ug is the mass density of the nebular gas.
The terms eH2, eH, eHe, and eSiV represent the internal energies
of the hydrogen molecules, atoms, and silicate vapor,
respectively. They can be calculated using:
(21)
where i = H2, H, He, or SiV, Cip is the specific heat at constant
pressure for the corresponding species, and Ui is the
corresponding mass density.
In this model, we neglect line emission cooling of the
nebular gas. This effect has been considered in some shock
wave models for chondrule formation (Iida et al. 2001). The
importance of this cooling is strongly dependent on the
amount of coolant molecules present in the gas, with H2O
being the dominant cooling species. The concentration of
water in the nebular gas in the asteroid belt region (where we
are assuming chondrules formed) likely varied significantly
over time. J. Cuzzi (personal communication) has shown that
if there were a major �planetesimal sink� which accreted the
solids around it, such as a young Jupiter or a Jovian core near
the snow line, the region of the nebula interior to this sink
would be depleted in water by diffusion on timescales on the
order of ~105�6 yr.
The model investigated here requires that Jupiter had
grown to significant mass such that the planetesimals near
orbital resonances with the planet could be stirred up to
supersonic speeds. The results of Amelin et al. (2002) suggest
that chondrules formed ~2.5 Myr after the formation of the solar
nebula. If Jupiter formed over this time (by either core accretion
or gravitational instability), then this provides more than
enough time for diffusion to remove water from the nebular gas
(Stevenson and Lunine 1988; Cyr et al. 1998). In fact, if Jupiter
formed by core accretion, the removal of water from the inner
nebula may have been required to form the core (Stevenson and
Lunine 1988). Thus, neglecting the cooling by line emission
from water molecules would be a valid approximation.
If water vapor was not diffusively removed from the
inner nebula before the stage of nebula evolution considered
here, then it may have played a role in cooling the gas behind
the shock waves as discussed by Iida et al. (2001). The main
effect would be causing the gas to cool more quickly, which
would also increase the gas density slightly. This likely would
cause the particles to reach slightly higher peak temperatures
(due to the increase in gas density and, thus, in gas drag
heating immediately behind the shock front) but would also
likely increase the cooling rates of the particles due to loss of
thermal energy to the gas.
For the cases presented, the nebula is assumed to be
originally at some temperature, Ti, far upstream of the shock,
which sets the forward boundary condition for the radiative
transfer calculations. Far behind the shock (thousands of
kilometers, determined by the integration), the suspension
returns to this same original temperature and, therefore, the
end boundary condition for the radiative transfer is the
same. In solving the equations that describe the evolution of
the system, the temperature of the chondrules is initially
calculated after they pass through the shock front based on
the other modes of heat transfer. The calculations are then
repeated, and the heat transferred due to radiation from the
other particles is found using the previously calculated
temperature profile as a function of distance. The procedure
is repeated until the temperature of the chondrules does not
change by more than 1 K.
RESULTS
In all cases presented here, the region of the nebula under
consideration has an initial temperature of 400 K, a hydrogen
molecule number density of 2.5 × 1014 cm3, and a helium
number density of 5 × 1013 cm3 (Ug = 10�9 g/cm�3), for a total
pressure of ~10�5 bars. This gas density is roughly equal to that
expected at 2.5 AU in a minimum mass solar nebula, the type
used in previous studies of planetesimal bow shocks (Hood
1998; Weidenschilling et al. 1998). The properties of the
chondrule-sized particles are the same as those used in Ciesla
et al. (2003) (unless otherwise specified): diameter of 0.1 cm,
mass density of 3.3 g/cm�3, a wavelength averaged emissivity
of 0.9, a heat capacity of 107 erg g�1 K�1, and a latent heat of
melting of 4.5 × 10⁹ erg g�1 spread over the temperature range
1400�1900 K to account for incongruent melting of
chondrules. The latent heat of vaporization was assumed to be
1011 erg g�1 close to the values used by Moses (1992) and
Miura et al. (2002). The dust particles are assumed to have the
same properties as the chondrules, due to their assumed
similar composition, except they are originally treated as
spheres 1 Pm in diameter and have an assumed (constant)
(20)
d
dx------ eH2
eH eHe eSiV
1
2---Ugvg
2+ + + +© ¹
§ · vg Q� g chon Q� g dust F� D chonvchon F� D dustvdust Q� diss
1Uchon
2mchon
-----------------vchon
3 dmchon
dx-----------------�=
1Udust
2mdust
----------------vdust
3�
dmdust
dx---------------- C�
SiVpchon
T Uchon
mchon
--------------vchon
dmchon
dx----------------- C�
SiVpdust
T Udust
mdust
------------vdust
dmdust
dx----------------
nH2
ei UiCp
iTg=
1816 F. J. Ciesla et al.
wavelength averaged emissivity of 0.1. This lower emissivity
is used to account for the difficulty that small particles have
radiating away energy in wavelengths that are large compared
to the size of the particle. We assume that the silicate vapor has
a mean molecular mass of 50 mH and a specific heat capacity at
constant pressure of 9k/2mSiV, while the values for the
hydrogen molecules and atoms are 7k/2 and 5k/2mH,
respectively, and the value for helium is 5k/2mHe.
The dust was considered to have totally vaporized if its
mass dropped below 0.001 mdust 0, where mdust 0 is the original
mass of a dust particle. In none of the cases presented below
did the dust completely vaporize, despite reaching
temperatures over 2000 K. This is because as the dust began
to lose mass, the particles were cooled due to latent heat
effects. Stronger shocks (effective velocity >8 km/s) may
have provided enough energy to totally vaporize the particles.
The solids in the model are suspended at a solar ratio with
respect to the nebular gas such that (Uchon + Udust)/Ug = 0.005.
The mass of the solids is distributed such that 75% of the
mass is in chondrule-sized particles and 25% as micron-sized
dust (Desch and Connolly 2002). We investigate other
possible ratios of chondrules to dust and non-solar solids to
gas mass ratios in the section titled Various Chondrules: Dust
and Solid-Gas Mass Ratios. The solar values give a chondrule
number density of 2.5 × 10�8 cm�3 and a dust number density
of 0.85 cm�3.
10-km Planetesimal
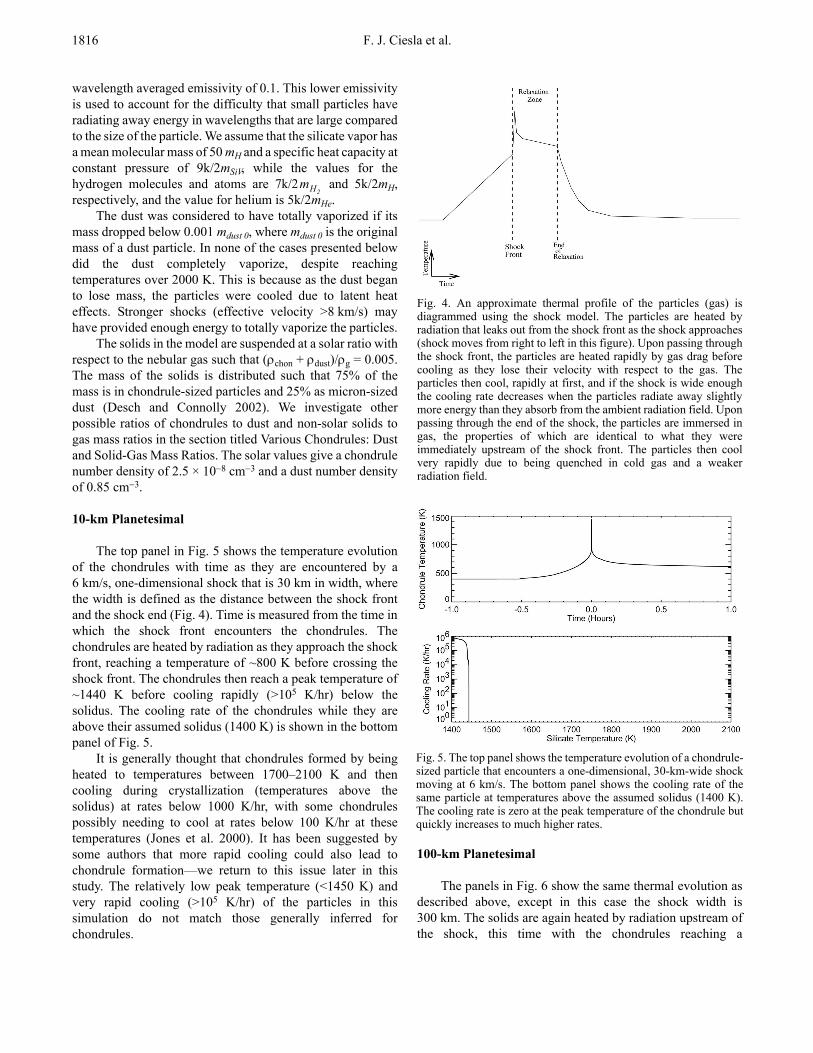
The top panel in Fig. 5 shows the temperature evolution
of the chondrules with time as they are encountered by a
6 km/s, one-dimensional shock that is 30 km in width, where
the width is defined as the distance between the shock front
and the shock end (Fig. 4). Time is measured from the time in
which the shock front encounters the chondrules. The
chondrules are heated by radiation as they approach the shock
front, reaching a temperature of ~800 K before crossing the
shock front. The chondrules then reach a peak temperature of
~1440 K before cooling rapidly (>105 K/hr) below the
solidus. The cooling rate of the chondrules while they are
above their assumed solidus (1400 K) is shown in the bottom
panel of Fig. 5.
It is generally thought that chondrules formed by being
heated to temperatures between 1700�2100 K and then
cooling during crystallization (temperatures above the
solidus) at rates below 1000 K/hr, with some chondrules
possibly needing to cool at rates below 100 K/hr at these
temperatures (Jones et al. 2000). It has been suggested by
some authors that more rapid cooling could also lead to
chondrule formation�we return to this issue later in this
study. The relatively low peak temperature (<1450 K) and
very rapid cooling (>105 K/hr) of the particles in this
simulation do not match those generally inferred for
chondrules.
100-km Planetesimal
The panels in Fig. 6 show the same thermal evolution as
described above, except in this case the shock width is
300 km. The solids are again heated by radiation upstream of
the shock, this time with the chondrules reaching a
mH2
Fig. 4. An approximate thermal profile of the particles (gas) isdiagrammed using the shock model. The particles are heated byradiation that leaks out from the shock front as the shock approaches(shock moves from right to left in this figure). Upon passing throughthe shock front, the particles are heated rapidly by gas drag beforecooling as they lose their velocity with respect to the gas. Theparticles then cool, rapidly at first, and if the shock is wide enoughthe cooling rate decreases when the particles radiate away slightlymore energy than they absorb from the ambient radiation field. Uponpassing through the end of the shock, the particles are immersed ingas, the properties of which are identical to what they wereimmediately upstream of the shock front. The particles then coolvery rapidly due to being quenched in cold gas and a weakerradiation field.
Fig. 5. The top panel shows the temperature evolution of a chondrule-sized particle that encounters a one-dimensional, 30-km-wide shockmoving at 6 km/s. The bottom panel shows the cooling rate of thesame particle at temperatures above the assumed solidus (1400 K).The cooling rate is zero at the peak temperature of the chondrule butquickly increases to much higher rates.

Evaluating planetesimal bow shocks as sites for chondrule formation 1817
temperature of ~1300 K before crossing the shock front. This
higher temperature is due to the fact that the radiation emitted
from behind the shock front is more intense due to the larger
volume of hot particles within the shock.
The increased width of the shock also allows the
chondrules to reach a higher peak temperature (~1580 K) than
in the case previously considered. This is because the
stopping distance of the chondrules (~200 km) is less than the
width of the shock, and thus they are heated by gas drag over
this distance and subjected to a higher radiation field. Since
the chondrules completely lose their velocity with respect to
the gas, they begin to cool while still within the shocked gas.
The higher temperature and density of the gas in this region
allow more heat to be transferred to the chondrules through
thermal collisions, and therefore they cool at a slower rate
than in the previous case.
Upon exiting the shocked region, the particles are
moving at a velocity with respect to the shock front that is
much less than when they entered the shock region. The gas,
as it exits the shock front, returns to the high value it had right
before entering the shock front (due to the assumptions made
in this model), and therefore there is a relative velocity
between it and the chondrules. This causes the chondrules to
be heated somewhat, which can be seen as the little rise in
temperature after the chondrules have cooled rapidly and
before the more gradual cooling begins (~0.05 hr after
crossing the shock front).
As in the previous case, the predicted peak
temperature (<1600 K) in this simulation and the cooling
rates (>104 K/hr) do not match those generally expected for
chondrules.
1000-km Planetesimal
The top panel in Fig. 7 shows the temperature evolution
of the chondrules in the same situations described, except that
the shock is 3000 km in width. The chondrules are heated to
an even higher temperature (~1400 K) upstream of the shock
front due to the larger volume of hot particles leading to a
more intense radiation field. This larger volume again helps
the chondrules reach a higher peak temperature than in the
previous cases.
The cooling of the particles in this case (bottom panel in
Fig. 7) is substantially slower than in the cases previously
considered. In fact, as the temperature of the chondrules
approaches the solidus, the cooling rate is ~103 K/hr, which is
the upper limit of expected chondrule cooling rates. Thus, a
shock of this size and strength seems to allow for cooling rates
comparable to the cooling rates that chondrules are thought to
have experienced. While the peak temperature of the
chondrules is only ~1600 K, it is not far off from temperatures
that chondrules are thought to have reached.
In Fig. 8, we show a similar model run as just described,
except that the chondrule averaged emissivity is assumed to
be 0.1 (as opposed to 0.9). In this case, the chondrules reach a
significantly higher peak temperature (~2020 K) due to the
fact that the chondrules cannot radiate as much energy away
during the initial period of heating by gas drag. The particles
then cool, rapidly at first, before again reaching a cooling rate
of ~103 K/hr as the temperature approaches the solidus. The
cooling rate is not greatly affected by the change in chondrule
emissivity. Since the emissivity was assumed to be 0.1, the
absorptivity was also assumed to be 0.1 to be consistent with
Kirchoff�s law. Thus, the amount of radiation emitted by the
chondrules decreases by the same factor as the amount
absorbed (the radiation field is dominated by the dust
particles). The interaction between the gas and the dust
control how quickly the system cools, and therefore a change
in the emissivity has little effect on the cooling of the
chondrules. The dust will determine the cooling rate of the
system as long as it is the major source of opacity. If the dust
were to be completely vaporized (which was not the case in
any of our runs), the cooling rate would likely be much lower.
This would require the shocks to have greater velocities than
considered here.
Various Chondrules:Dust and Solid:Gas Mass Ratios
The ratio of solids to gas in a given location of the nebula
may have varied greatly due to the settling of material into a
layer at the midplane or due to the accretion of large
planetesimals. Similarly, the size distribution of solids may
have varied due to the level of turbulence in the nebula, the
details of the accretion process, and the location where
chondrule formation took place. Thus, we also considered a
number of cases where these ratios were different from those
Fig. 6. Same as Fig. 5, except the shock is 300 km wide. The slightincrease in temperature after the rapid cooling in the top panel iswhere the particle passes through the end of the shock and isimmersed in the cool but fast moving gas of the nebula. The increasein the particle�s temperature is due to the collisions with the fastmoving gas. Again, the cooling rate is nearly zero at the peaktemperature of the chondrule, but quickly increases to >104 K/hrbefore slowly decreasing at lower temperatures.

1818 F. J. Ciesla et al.
described above. All other conditions are the same as
described for the 1000 km-radius planetesimal case described
above. The results of some of these cases are qualitatively
described below.
We considered one case where the distribution of
chondrule mass to dust mass was 50:50. The cooling rates of
the chondrule-sized particles were found to be much higher
than in the cases described previously. This was due to the
fact that as the chondrules drift away from the shock front, the
optical depth between them and the hot dust immediately
behind the shock front increases more rapidly than in the
previous cases. While they are heated initially by drag, the
heating due to radiation rapidly decreases. This loss of
heating becomes significant as the chondrules are surrounded
by cooler (compared to the temperature behind the shock
front) dust particles, which still heat the chondrules but to a
much lesser extent.
The opposite was true for the case in which the chondrule
to dust mass ratio was 90:10. Due to the decrease in opacity, the
chondrules are exposed to the radiation from the hot particles
immediately behind the shock front for a longer period of time.
This helps keep the chondrules from cooling too rapidly so the
cooling rate is as low as ~10 K/hr. The cooling rate increased
rapidly (to ~100 K/hr) as the chondrules drifted toward the end
of the shock where their radiation is not �trapped� any longer
and escapes to the unshocked regions of the nebula.
A similar result was found when we considered cases in
which the mass ratio of solids to gas suspended in the nebula
was not at the solar value. For those cases that resulted in
significant increases in the opacity of the nebula (larger
values of fine-grained dust), the cooling rates of the
chondrules increased. This is due to the fact that as the
chondrules drifted through the shocked gas, the optical depth
between them and the hot chondrules immediately behind the
shock front increased at a greater rate. Because of this, the
chondrules would be shielded from a major heat source, and
therefore cool at a greater rate. For cases when the opacity of
the nebula decreased (either due to vaporization of fine-
grained dust or its depletion due to accretion), the radiation
from the hot particles was able to travel further and help keep
the chondrules warm for longer periods of time. This
correlation of slower cooling rates and lower opacity of the
solids was also found in Desch and Connolly (2002) and
Ciesla and Hood (2002).
In summary, if chondrule-sized particles had emissivities
significantly less than 0.9 (Desch and Connolly [2002]
suggest a value of 0.8, which decreases when the chondrules
are near their peak temperatures), which may be possible
given the uncertainties of the measured optical constants,
both the peak temperature and cooling rates could be
consistent with what has been inferred for chondrules if they
were heated in a 3000 km-wide shock of the type described
here. However, cooling rates of 10�100 K/hr, which most
chondrules may have experienced (Jones et al. 2000), can be
reached only if the amount of dust present in the nebula is
small or if much of it is vaporized upon passing through the
shock front.
DISCUSSION
In all but one of the cases presented here, the cooling
rates and peak temperatures of the particles were not
consistent with what has been generally inferred for
chondrules. It has been argued that chondrules could have
formed by multiple instances of low level heating (peak
Fig. 7. Same as Fig. 5, except the shock is 3000 km wide. The coolingrate near the solidus is approximately consistent with the fastestcooling rates inferred for chondrules though the peak temperature isslightly below what has been inferred.
Fig. 8. Same as Fig. 7, except that the particle is assumed to have amuch lower wavelength-averaged emissivity. This prevents theparticle from radiating as much energy as it is heated by gas dragimmediately behind the shock front, and therefore it reaches ahigher peak temperature. The particle then cools at a cooling rate of~1000 K/hr, which is consistent with what has been inferred forsome chondrules.

Evaluating planetesimal bow shocks as sites for chondrule formation 1819
temperatures <1700 K) followed by rapid cooling (cooling
rates of about a few thousands of K/hr and higher) (Wasson
1996; Wasson and Rubin 2003). If this type of thermal
processing did result in textures and chemical zoning similar
to those of chondrules, then planetesimal bow shocks could
be possible sites for chondrule formation. Experiments
investigating these rapid cooling rates are needed.
There was one case presented in which the calculated
peak temperature and cooling rate of the silicates matched
those inferred for chondrules: the case of a 1000 km
planetesimal with low wavelength-averaged emissivities for
the chondrule-sized particles. In other cases we studied, the
cooling rates in our runs were found to decrease as the amount
of dust present decreased. Thus, it is possible that shocks
formed by large planetesimals could form chondrules if there
were only a small amount of material present as fine-grained
dust. However, it is unclear how such a scenario may be
achieved in the nebula. One possibility is that the larger
particles (millimeter-sized) could settle to the midplane much
faster than the dust particles. This would be possible over
long periods of time if nebula turbulence works such that only
very small (<<1 mm) particles are prevented from settling to
the midplane. This would be possible if the turbulent velocity
(D1/2cs, where D is the turbulence parameter and cs is the local
speed of sound) is greater than the settling velocity of the fine
particles (Weidenschilling and Cuzzi 1993). Thus, this
provides a natural way to separate particles by size. Another
possibility is that if the nebula is turbulent, Cuzzi et al. (2001)
showed that chondrule-sized particles can be locally
concentrated by turbulent eddies. These eddies can locally
increase the concentration of chondrule-sized particles but
not particles of other sizes. More work is needed to
investigate this possibility.
It should be remembered that the assumptions made in
this model favored slow cooling rates for the particles. A
more complex model, which accounts for three-dimensional
radiative transfer and relaxation (cooling and expansion) of
the gas in the relaxation zone, would likely predict more rapid
cooling rates than those found here. If one imagines a cube
radiating to space but only in one dimension (say, the x-
direction), it will radiate energy at the rate of 2AxVT4, where
Ax is the area of one cube face that is perpendicular to the x-
axis, T is the temperature of the cube, V is the Stefan-
Boltzmann constant, and the factor of 2 is due to the second
cube face that is perpendicular to the x-axis. If the cube is
allowed to radiate energy away in all three directions it will
lose energy at the rate of 2AxVT4 + 2AyVT4 + 2AzVT4, where Ay
and Az are the areas of the cube faces that are perpendicular to
the y- and z-axes, respectively. Since a cube by definition has
Ax = Ay = Az, the total rate of energy loss would be 6AxVT4.
Since we only consider a one-dimensional model, we likely
are underestimating the cooling rates by a factor of ~3, though
the exact factor would depend on what the total volume (and
dimensions) of the material processed by the bow shock was
(whether Ax differs greatly from Ay and Az, for example). To
fully determine the factor it would be necessary to determine
the intensity of radiation in the other two dimensions
(perpendicular to the initial gas velocity).
In addition, as shown in Fig. 3, the gas density in a bow
shock begins to decrease immediately behind the shock front.
As the density decreases, the number of collisions between
the gas and the solids would also decrease. Once at rest with
respect to the gas, the rate of heat input into a chondrule by
thermal collisions with the gas is given by (Hood and Horanyi
1991):
(22)
where Ug is the gas density, Tg is the temperature of the gas, Tc
is the chondrule temperature, J is the ratio of specific heat
temperatures of the gas, m is the mean molecular mass of a
nebular gas molecule, and k is Boltzmann�s constant. Taking
the typical values of these variables behind a shock wave once
the chondrule has lost its relative velocity with respect to the
gas (Ug = 10�8 g/cm3, Tg = 1600 K, Tc = 1500 K, J�= 1.4, and
m = 4 × 10�24 g), we find that the rate of heat input to the
chondrule is ~3 × 10⁵ erg/s. If the gas density decreases by a
factor of 10, as it does over a distance of ~5 planetesimal radii
in these simulations, then q also decreases by a factor of 10
(making the generous assumption that the gas and chondrule
temperatures remain the same), and thus the rate of heat input
would decay to 3 × 10⁴ erg/s. Assuming that the chondrule is
1.5 × 10�3 g and has a heat capacity of 107 erg/g/K, the loss of
this heat input would correspond to an increase in cooling rate
of ~18 K/s (>6 × 10⁴ K/hr).
This increase in cooling rate would take place as the
particle moved through the distance over which the gas density
decreased. Looking at the case of a 1000 km planetesimal, this
happens after a distance of ~5000 km. If the particle is moving
at an average velocity (relative to the planetesimal) of 1 km/s
(a typical speed in the post shock region), this means it takes
the chondrule 5000 sec to traverse this distance. Thus, the
cooling rate of the chondrule would increase by 0.0036 K/s/s
or ~13 K/hr/s as the gas density decreases. Taking a
conservative estimate that chondrules had to cool through a
temperature range of just 50 K at a rate of 1000 K/hr or lower
to form the textures and zoning observed in meteorites, this
means that the chondrules would have to have cooled for a
period of at least 0.05 hr or 180 sec. Over this time period, the
cooling rate would have increased by 2300 K/hr using the
numbers noted above. This again means that the cooling rates
presented here likely are underestimates of the real cooling
rates that particles would have experienced in the situations
studied here. Thus, it is likely that even for the case in which
the calculated cooling rates are within the expected range for
chondrules, in a more realistic model, the cooling rates would
be significantly higher than those presented here. The increase
Sd2q Ug Tg Tc�� �
J 1+
J 1�-----------© ¹§ · 1
8 S----------© ¹§ · 2k
m------© ¹§ ·
3 2eTg
1 2e=

1820 F. J. Ciesla et al.
would be most dramatic for smaller planetesimals as the
expansion happens over a shorter distance.
While the treatments made in this model likely would
lead to more rapid cooling, there are other effects that may
help slow the cooling. If supersonic planetesimals existed
during chondrule formation, then a large amount of solids
could have been in the form of cm-sized bodies or larger, and
most would be concentrated near the midplane of the nebula.
If this is the location of planetesimal bow shocks, then it is
possible that some of the m-sized bodies would also pass
through these shocks along with chondrule precursors and
fine-grained dust. These larger bodies would not be processed
exactly like the smaller bodies, but they could transfer some
of their kinetic energy into thermal energy of the gas as they
speed through the shocked gas. This may help the gas
maintain higher temperatures behind the shock front, which
in turn would keep the chondrules from cooling too quickly.
While this scenario cannot be ruled out, the efficiency and
likelihood of such a scenario must be quantitatively
investigated to maintain planetesimal bow shocks as a
possible site of chondrule formation.
Finally, this work has not considered the shock wave
that is created within 1.5 planetesimal radii of the
planetesimal center. Along a trajectory that goes through the
center of the planetesimal, the shock forms roughly 1 radius
in front of the planetesimal�s surface. Thus, for large
planetesimals, this distance will be greater than the stopping
distance of the chondrules (for planetesimals >~200 km in
radius). Chondrules could be heated and come to rest in front
of the planetesimal without crashing into its surface. The
chondrules, then, would likely be accelerated with the gas
around the planetesimal. More work is needed to investigate
how particles would cool if they entered a bow shock close to
the planetesimal. However, this makes up a relatively small
volume of the total shock that is formed, and thus may not be
a very efficient mechanism. On the other hand, passing close
to the planetesimal may make it easier for chondrules formed
in this manner to be accreted into parent bodies. Future work
will include a detailed investigation of this possibility.
Among the cases that we have considered, the larger
planetesimals seem to be those that come closest to allowing
silicates to be processed in a manner similar to how
chondrules were processed. Planetesimals larger than
1000 km may still have been trapped in resonances with
Jupiter and attained supersonic speeds (thus creating larger
shock waves), but such objects would likely have been rare.
Even if such objects did exist, the fraction of material in the
asteroid belt region that they could process would be very
small. For example, a 1000 km-radius planetesimal moving at
8 km/s would sweep out a volume (within 2 radii) on the order
of 1023 cm3/s or 1037 cm3 during the few Myr that chondrules
appear to have been produced. The volume of the asteroid belt
region (2�4 AU) at low inclinations (<1°) is ~2 × 1040 cm3.
Thus, a body of this size would only process ~0.1% of the
solids. While multiple bodies may have existed (a few Earth
masses would imply ~103 such bodies), only a few would be
trapped at resonances at a given time, and those are the ones
which would have velocities great enough to form shocks.
Thus, only a few percent of the mass in the asteroid belt would
be converted into chondrules. If chondritic meteorites
represent the makeup of the majority of the asteroid belt, then
this process seems to be too inefficient to explain the high
volume of chondrules in primitive meteorites. If smaller
planetesimals were capable of forming shocks which would
form chondrules, the efficiency would increase
(Weidenschilling et al. 1998). This becomes less of a problem
if chondritic meteorites are not representative samples of the
bulk asteroid belt.
Comparing the results of this work with those found in
other studies (Desch and Connolly 2002; Ciesla and Hood
2002; Ciesla et al. 2003), we conclude that the thermal
histories of particles in large scale shock waves (greater than a
few 1000 km) more closely resemble those of chondrules than
those in smaller scale shocks (<~1000 km). Large shock
waves are more efficient due to the large volumes of dense, hot
gas and solids that are created. If the shocked gas does not
decrease in density as quickly as shown in Fig. 3, then the
decrease in heat input from the thermal collisions with the gas
will not cause the chondrules to cool as quickly. Also, the large
volume of hot, concentrated particles increases the intensity of
radiation that particles are subject to, and thus helps them keep
warm by allowing them to absorb more energy. If the gas
properties began to rapidly relax back to their original state
immediately behind the shock front in bow shocks (Fig. 3),
this would cause the radiating solids to be less concentrated,
which would decrease the heat input into the chondrules. This
also means that if chondrule formation took place in a region
of the nebula with a lower gas density than assumed here, the
cooling rates would likely be too rapid to be consistent with
chondrules, unless the shocks were significantly stronger and
able to compress the gas by a greater amount.
Thus, if chondrules are a result of nebular shock waves,
the shock waves could have been small in scale provided that
they occurred in regions of the nebula with a low dust content
to allow radiation from hot chondrules to travel great distances
to keep the chondrules warm or must have been similar in
scale to those predicted to be created by gravitational
instabilities (Boss [2002] and earlier work by the same author)
or due to the tidal interaction of Jupiter with the solar nebula
(Bryden et al. 1999; Rafikov 2002). However, more work is
needed to investigate whether these large shocks would occur
in the proper region of the solar nebula to form chondrules,
whether they were of the proper strength (velocity), and
whether they can explain the ~2.5-Myr age difference between
CAIs and chondrules (Amelin et al. 2002). While they may not
have been the main source of chondrules, supersonic
planetesimals may still have been common in the solar nebula.
Since the thermal processing predicted in planetesimal bow

Evaluating planetesimal bow shocks as sites for chondrule formation 1821
shocks would be rapid (particularly for small planetesimals),
these shocks may still have occurred without leaving any
significant record in the chondrules (Jones et al. 2000).
Whether or not the shocks could have left some other record in
the meteorites remains to be investigated.
Acknowledgments�We thank Dante Lauretta, Jay Melosh, and
Joshua Emery for insightful discussions. Reviews by Taishi
Nakamoto, Patrick Cassen, and an anonymous reviewer
resulted in significant improvements to this paper. This work
was supported by a grant from NASA�s Origins program.
Editorial Handling�Dr. David Mittlefehldt
REFERENCES
Alibert Y., Mordasini C., and Benz W. 2004. Migration andgiant planet formation. Astronomy and Astrophysics 417:L25�L28.
Amelin Y., Krot A. N., Hutcheon I. D., and Ulyanov A. A. 2002. Leadisotopic ages of chondrules and calcium-aluminum-richinclusions. Science 297:1678�1683.
Boss A. P. 2002. Evolution of the solar nebula: V. Disk instabilitieswith varied thermodynamics. The Astrophysical Journal 576:462�472.
Bryden G., Chen X., Lin D. N. C., Nelson R. P., and Papaloizou J. C.B. 1999. Tidally induced gap formation in protostellar disks: Gapclearing and suppression of protoplanetary growth. TheAstrophysical Journal 514:344�367.
Chambers J. E. and Wetherill G. W. 2001. Planets in the asteroid belt.Meteoritics & Planetary Science 36:381�399.
Ciesla F. J. and Hood L. L. 2002. The nebular shock wave model forchondrule formation: Shock processing in a particle-gassuspension. Icarus 158:281�293.
Ciesla F. J., Lauretta D. S., Cohen B. A., and Hood L. L. 2003. Anebular origin for chondritic fine-grained phyllosilicates. Science299:549�552.
Colella P. and Woodward P. R. 1984. The piecewise parabolic method(PPM) for gas-dynamical simulations. Journal of ComputationalPhysics 54:174�201.
Connolly H. C. and Hewins R. H. 1995. Chondrules as products ofdust collisions with totally molten droplets within a dust-richnebular environment: An experimental investigation.Geochimica et Cosmochimica Acta 59:3231�3246.
Cuzzi J. N., Hogan R. C., Paque J. M., and Dobrovolskis A. R. 2001.Size-selective concentration of chondrules and other smallparticles in protoplanetary nebula turbulence. The AstrophysicalJournal 546:496�508.
Cyr K. E., Sears W. D., and Lunine J. I. 1998. Distribution andevolution of water ice in the solar nebula: Implications for solarsystem body formation. Icarus 135:537�548.
Desch S. J. and Connolly H. C. 2002. A model of the thermalprocessing of particles in solar nebula shocks: Application to thecooling rates of chondrules. Meteoritics & Planetary Science 37:183�207.
Hood L. L. 1998. Thermal processing of chondrule and CAIprecursors in planetesimal bow shocks. Meteoritics & PlanetaryScience 33:97�107.
Hood L. L. and Ciesla F. J. 2001. The scale size of chondruleformation regions: Constraints imposed by chondrule coolingrates. Meteoritics & Planetary Science 36:1571�1585.
Hood L. L. and Horanyi M. 1991. Gas dynamic heating of chondruleprecursor grains in the solar nebula. Icarus 93:259�269.
Iida A., Nakamoto T., Susa H., and Nakagawa Y. 2001. A shockheating model for chondrule formation in a protoplanetary disk.Icarus 153:430�450.
Jones R. H., Lee T., Connolly H. C., Love S. G., and Shang H. 2000.Formation of chondrules and CAIs: Theory versus observation.In Protostars and planets IV, edited by Mannings V., Boss A. P.,and Russell S. S. Tucson: The University of Arizona Press. pp.927�946.
Marzari F. and Weidenschilling S. 2002. Mean motion resonances,gas drag, and supersonic planetesimals in the solar nebula.Celestial Mechanics and Dynamical Astronomy 82:225�242.
Mayer L., Quinn T., Wadsley J., and Stadel J. 2002. Formation ofgiant planets by fragmentation of protoplanetary disks. Science298:1756�1759.
Miura H., Nakamoto T., and Susa H. 2002. A shock-wave heatingmodel for chondrule formation: effects of evaporation and gasflows on silicate particles. Icarus 160:258�270.
Moses J. I. 1992. Meteoroid ablation in Neptune�s atmosphere.Icarus 99:368�383.
Rafikov R. R. 2002. Planet migration and gap formation by tidallyinduced shocks. The Astrophysical Journal 572:566�579.
Richards M. T. and Ratliff M. A. 1998. Hydrodynamic simulations ofH alpha emission in Algol-type binaries. The AstrophysicalJournal 493:326�342.
Stevenson D. J. and Lunine J. I. 1988. Rapid formation of Jupiter bydiffuse redistribution of water vapor in the solar nebula. Icarus75:146�155.
Wadhwa M. and Russell S. S. 2000. Timescales of accretion anddifferentiation in the early solar system: The meteoritic evidence.In Protostars and planets IV, edited by Mannings V., Boss A. P.,and Russell S. S. Tucson: The University of Arizona Press. pp.995�1018.
Wasson J. T. 1996. Chondrule formation: Energetics and lengthscales. In Chondrules and the protoplanetary disk, edited byHewins R. H., Jones R. H., and Scott E. R. D. Cambridge:Cambridge University Press. pp. 45�54.
Wasson J. T. and Rubin A. E. 2003. Ubiquitous low-FeO relict grainsin type II chondrules and limited overgrowths on phenocrystsfollowing the final melting event. Geochimica et CosmochimicaActa 67:2239�2250.
Weidenschilling S. J. 1988. Formation processes and time scales formeteorite parent bodies. In Meteorites and the early solar system,edited by Kerridge J. F. and Matthews M. S. Tucson: TheUniversity of Arizona Press. pp. 348�371.
Weidenschilling S. J. and Cuzzi J. N. 1993. Formation ofplanetesimals in the solar nebula. In Protostars and planets III,edited by Levy E. H. and Lunine J. I. Tucson: The University ofArizona Press. pp. 1031�1060.
Weidenschilling S. J., Marzari F., and Hood L. L. 1998. The origin ofchondrules at jovian resonances. Science 279:681�684.