evaluating radiology resident rotation case volumes: · pdf fileevaluating radiology resident...
TRANSCRIPT
Evaluating Radiology resident rotation case volumes: How much to expect? Department of Medical Imaging, University of Toronto
Author: Peter Yang
Date: Friday, Sept 23, 2011
Outline
• Background
• Objective
• Methods
• Results
• Discussion
• Next Steps
2
Background
• Training standards vary by organization and arbitrary
• US: ACR and AIUM • Neuroimaging : AAN vs. ACR
• Continuous learning curve – no magic number
• Volume essential for adequate exposure
3

Background
• Resident evaluation challenging
• Competency-based curriculum needs objective criteria
• Limited data on case volumes per block
• Residents benefit from known expectations
4
Objective
• To establish case volumes in 4-week core rotations
• By modality • By level of training
• Prototype: Musculoskeletal imaging
• Multiple modalities involved
5

Current Recommendations
• Royal College • ≥6 blocks of MSK
• ACR • General radiography:
- American Board certified or equivalent; - 3-6 months formal training in other residency; or - 2 years experience
• US/CT/MRI: - American Board certified or equivalent, ≥300 examinations; - Residency completion without board certification,
≥500 examinations - Other residency, 200 hours of continuing education, ≥500
examinations
6

Methods
• Workload audit • Toronto residents at UHN/Mount Sinai sites • 2 years: n = 30 (2008/09) and n = 26 (2009/10)
• Each year • All studies by each resident, by training level and modality • Average #studies/modality/training level
• 2-year comparison by t-test
• Overall average of 2 years + SDs
7
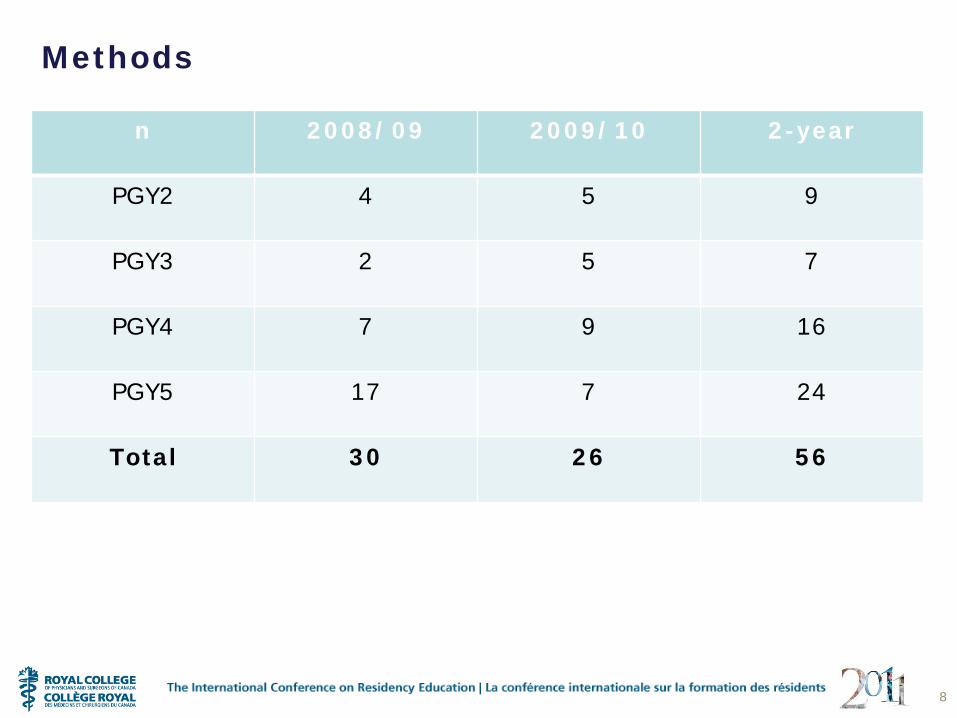
Methods
8
n 2008/09 2009/10 2-year
PGY2 4 5 9
PGY3 2 5 7
PGY4 7 9 16
PGY5 17 7 24
Total 30 26 56
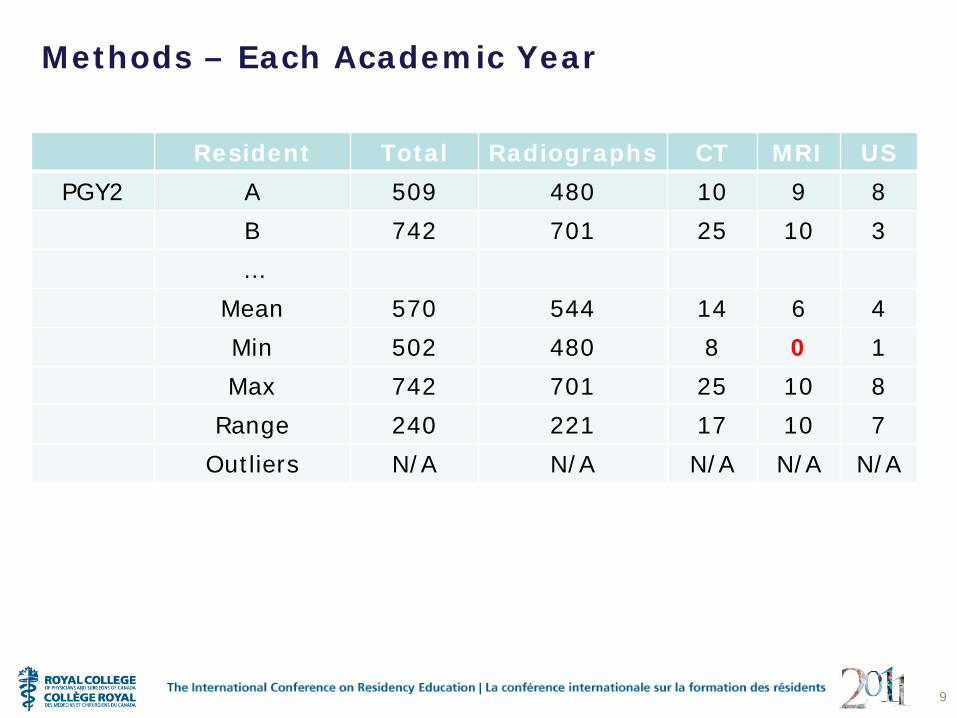
Methods – Each Academic Year
9
Resident Total Radiographs CT MRI US PGY2 A 509 480 10 9 8
B 742 701 25 10 3 …
Mean 570 544 14 6 4 Min 502 480 8 0 1 Max 742 701 25 10 8
Range 240 221 17 10 7 Outliers N/A N/A N/A N/A N/A

Methods – 2-year Comparison
10
CT 2008/09 2009/10 PGY2 10 7
25 1 … …
Mean 14 10 2-tailed T-test 0.67
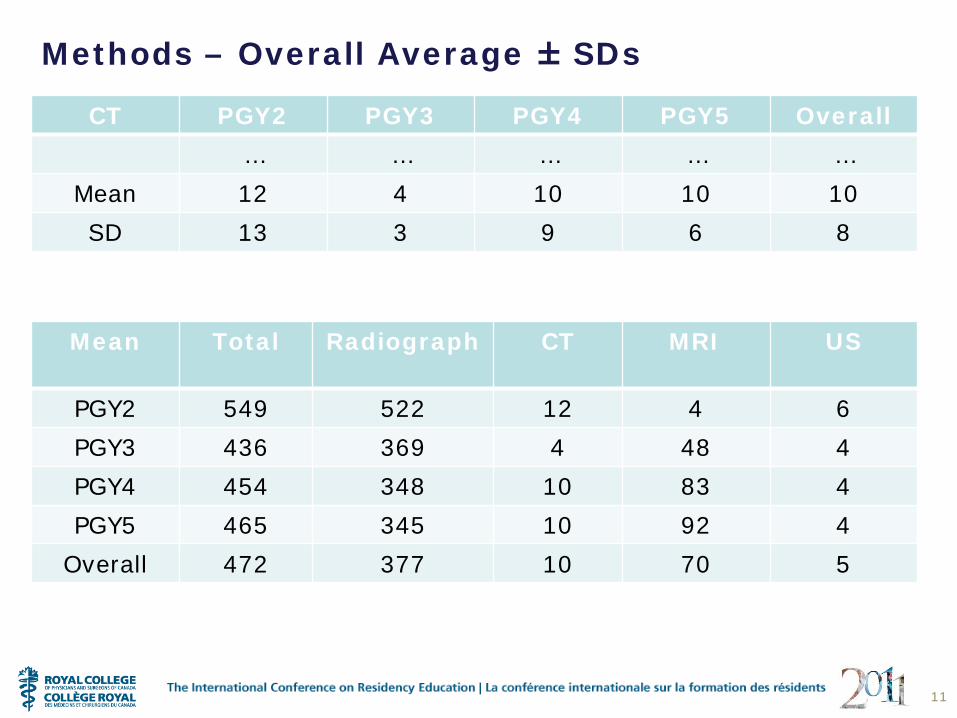
Methods – Overall Average ± SDs
CT PGY2 PGY3 PGY4 PGY5 Overall … … … … …
Mean 12 4 10 10 10 SD 13 3 9 6 8
11
Mean Total Radiograph CT MRI US
PGY2 549 522 12 4 6 PGY3 436 369 4 48 4 PGY4 454 348 10 83 4 PGY5 465 345 10 92 4
Overall 472 377 10 70 5
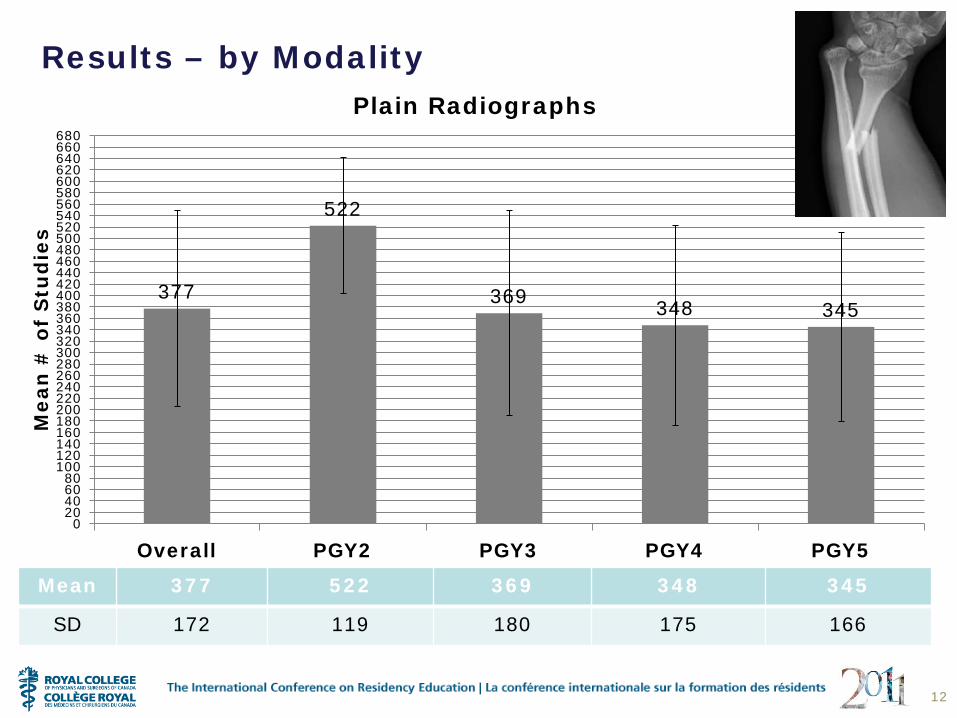
Results – by Modality
Mean 377 522 369 348 345
SD 172 119 180 175 166
12
377
522
369 348 345
0 20 40 60 80
100 120 140 160 180 200 220 240 260 280 300 320 340 360 380 400 420 440 460 480 500 520 540 560 580 600 620 640 660 680
Overall PGY2 PGY3 PGY4 PGY5
Mea
n #
of
Stu
die
s
Plain Radiographs
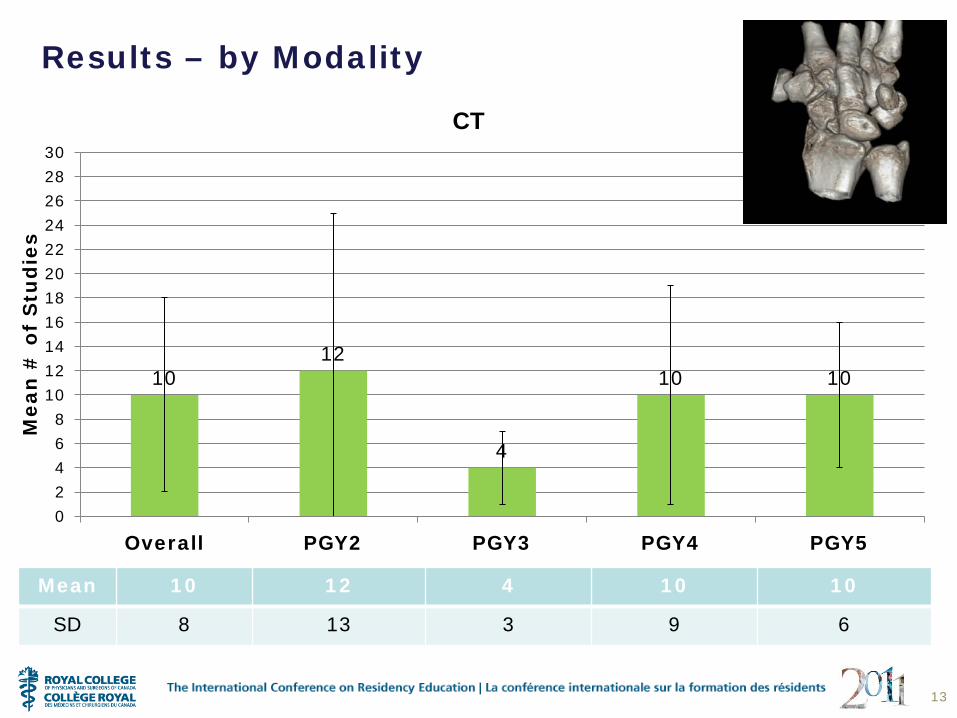
Results – by Modality
13
Mean 10 12 4 10 10
SD 8 13 3 9 6
10 12
4
10 10
0 2 4 6 8
10 12 14 16 18 20 22 24 26 28 30
Overall PGY2 PGY3 PGY4 PGY5
Mea
n #
of
Stu
die
s
CT

Results – by Modality
14
Mean 70 4 48 83 92
SD 49 5 28 50 38
70
4
48
83 92
0
10
20
30
40
50
60
70
80
90
100
110
120
130
140
Overall PGY2 PGY3 PGY4 PGY5
Mea
n #
of
Stu
die
s
MRI

Results – by Modality
15
Mean 5 6 4 4 4
SD 4 4 2 4 4
5 6
4 4 4
0
1
2
3
4
5
6
7
8
9
10
11
12
Overall PGY2 PGY3 PGY4 PGY5
Mea
n #
of
Stu
die
s
US
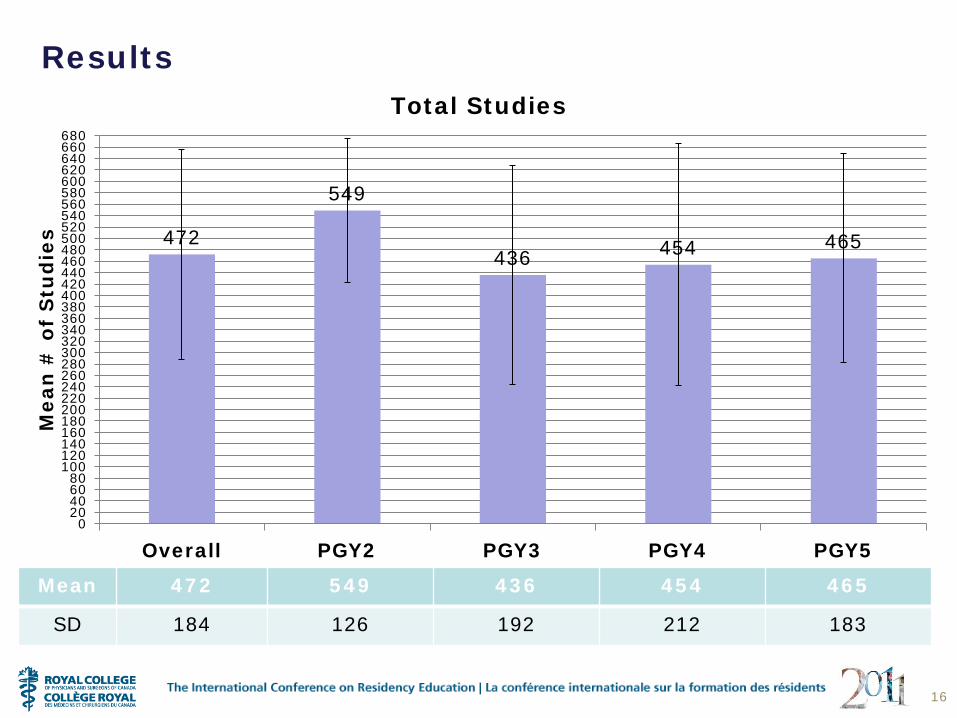
Results
16
Mean 472 549 436 454 465
SD 184 126 192 212 183
472
549
436 454 465
0 20 40 60 80
100 120 140 160 180 200 220 240 260 280 300 320 340 360 380 400 420 440 460 480 500 520 540 560 580 600 620 640 660 680
Overall PGY2 PGY3 PGY4 PGY5
Mea
n #
of
Stu
die
s
Total Studies
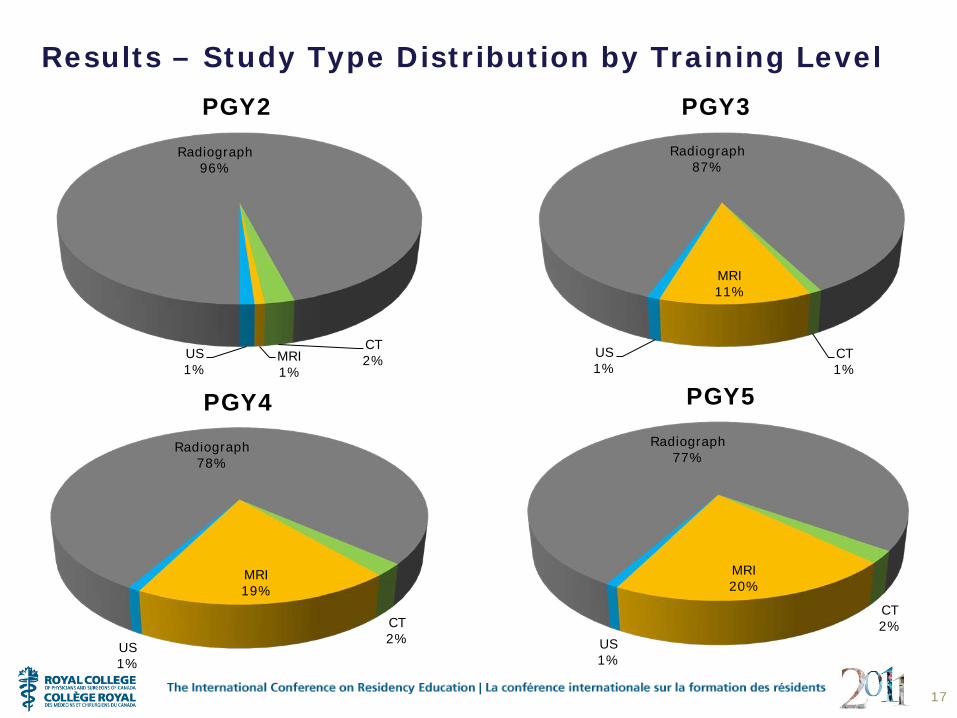
Results – Study Type Distribution by Training Level
17
Radiograph 96%
CT 2% MRI
1% US 1%
PGY2 Radiograph
87%
CT 1%
MRI 11%
US 1%
PGY3
Radiograph 78%
CT 2%
MRI 19%
US 1%
PGY4 Radiograph
77%
CT 2%
MRI 20%
US 1%
PGY5

Results
• No statistically significant difference between 2 academic years
• Less plain films and more MRIs with increased training
• CT and US volumes consistently low across training levels
• partially reflect the balance of work
18
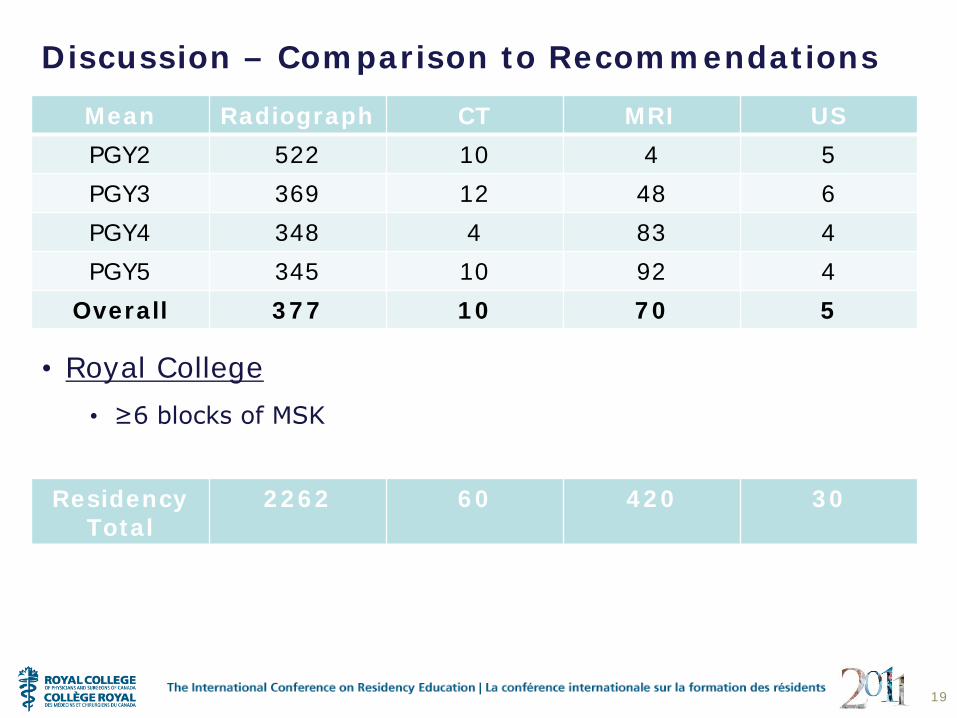
Discussion – Comparison to Recommendations
• Royal College • ≥6 blocks of MSK
19
Mean Radiograph CT MRI US PGY2 522 10 4 5 PGY3 369 12 48 6 PGY4 348 4 83 4 PGY5 345 10 92 4
Overall 377 10 70 5
Residency Total
2262 60 420 30

Discussion – Implications for the PD & Rotation Supervisors
• Ensure adequate exposure
• Explore reasons for lower numbers • i.e. US: resident initiative, conflict with other activities
• Inform goals and objectives – more teaching in areas of less exposure
• Monitor balance of plain films vs. MRIs • PFs are the mainstay in general/community practice • Difficulty with PFs on the RC exams
20

Next Steps
• Other rotations
• Other sites
• Differences between sites and time periods
• Volumes vs. accuracy and rotation evaluation
• Other schools
21

Acknowledgement
• Dr. Jeff Jaskolka
• Dr. Linda Probyn
• Dr. Robert Bleakney
• Department of Medical Imaging, University of Toronto
22
References • Hertzberg BS, Kliewer MA, Bowie JD, Carroll BA, DeLong DH, Gray L, Nelson RC.
Physician training requirements in sonography: how many cases are needed for competence? AJR Am J Roentgenol. 2000 May;174(5):1221-7.
• Rao VM, Levin DC. Turf wars in radiology: the past, present, and future importance of training standards in imaging. J Am Coll Radiol. 2005 Jul;2(7):602-6. Review.
• The Royal College of Physicians and Surgeons of Canada. Specialty training requirements in diagnostic radiology. 2009.
23
Thank you!
Any questions?
24