evaluating spatial, temporal, and clear-sky errors in satellite co 2 measurements katherine corbin,...
Post on 20-Dec-2015
215 views
TRANSCRIPT
Evaluating Spatial, Temporal, and Clear-Sky Errors in Satellite CO2
MeasurementsKatherine Corbin, A. Scott Denning,
Ian Baker, Aaron Wang, Lixin Lu
TransCom Meeting June 13-16, 2005

Orbiting Carbon Observatory (OCO)• Scheduled to launch in 2008• 3 high-resolution spectrometers measuring reflected sunlight
- 0.76 m O2 A-band- 1.61 and 2.06 m CO2 bands
• Column-average CO2 dry air mole fraction (XCO2)• Single shot precision of ~0.5% • 1:15 PM equator crossing time• 16-day repeat cycle•10 km-wide cross-track field of view (FOV) at nadir• FOV divided into eight 1.25-km wide samples• 2.25-km down-track resolution at nadir
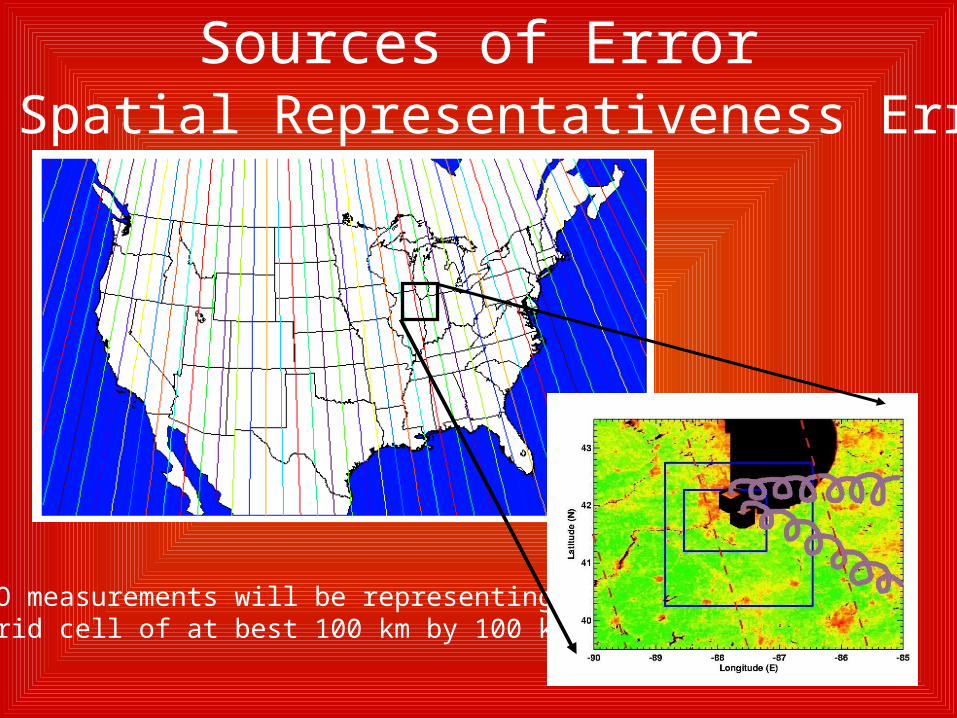
Sources of Error 1) Spatial Representativeness Errors
OCO measurements will be representing a grid cell of at best 100 km by 100 km
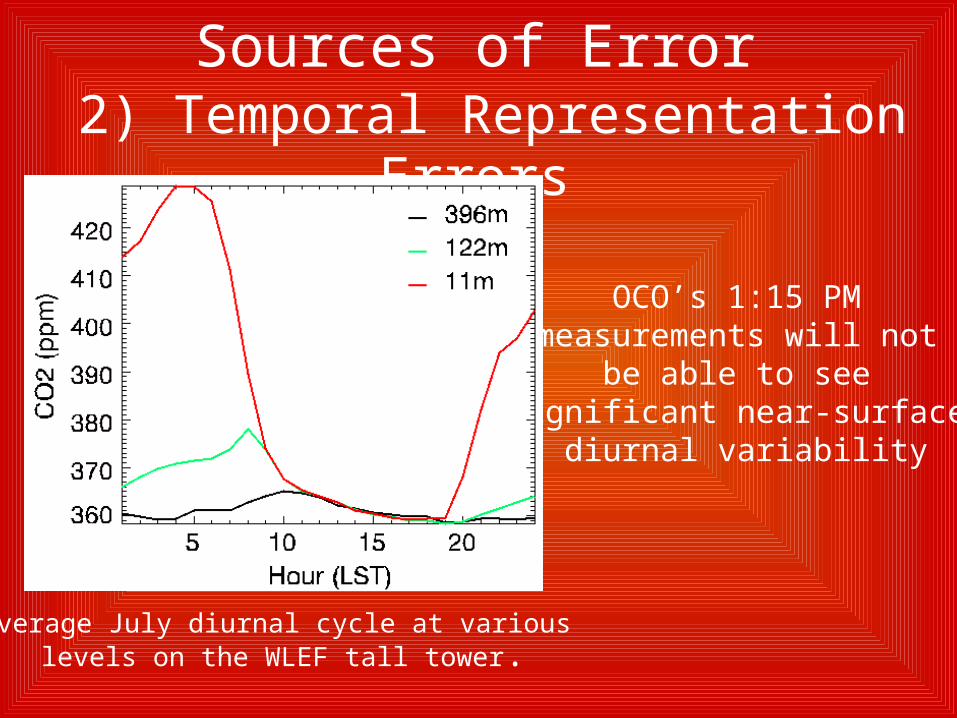
Sources of Error 2) Temporal Representation
Errors
OCO’s 1:15 PM measurements will not
be able to see significant near-surface
diurnal variability
Average July diurnal cycle at various levels on the WLEF tall tower.

Sources of Error3) Clear-Sky Errors
• Local Clear-Sky Errors - NEE is enhanced on cloudy days (e.g. Freedman et al., 2002; Gu et al., 2002; Law et al., 2002)
- For a given irradiance level, cloudy days have higher NEE than clear days (e.g. Gu et al., 2002; Baldocchi et al., 1997)
• Temporal Sampling Errors: - Clouds are frequently associated with fronts and changes of air masses
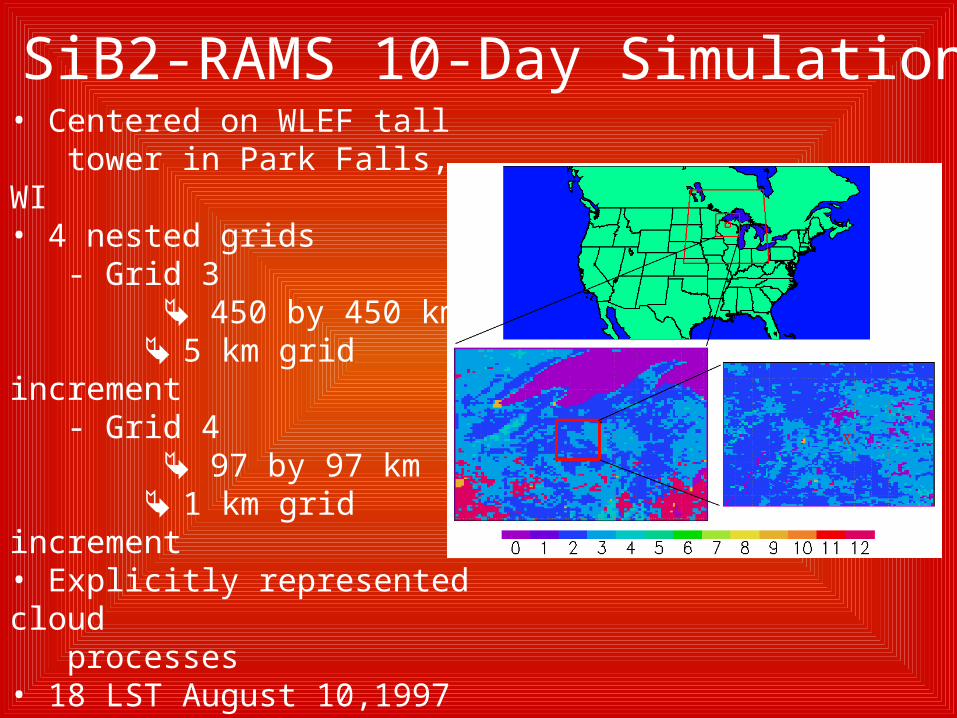
SiB2-RAMS 10-Day Simulation • Centered on WLEF tall tower in Park Falls, WI• 4 nested grids - Grid 3 450 by 450 km 5 km grid increment - Grid 4 97 by 97 km 1 km grid increment• Explicitly represented cloud processes • 18 LST August 10,1997 to 18 LST August 20, 1997 - Cold front Aug 12 ~ 2 LST - Cold front Aug 15 ~ 23 LST - Cold front Aug 17 ~ 18 LST
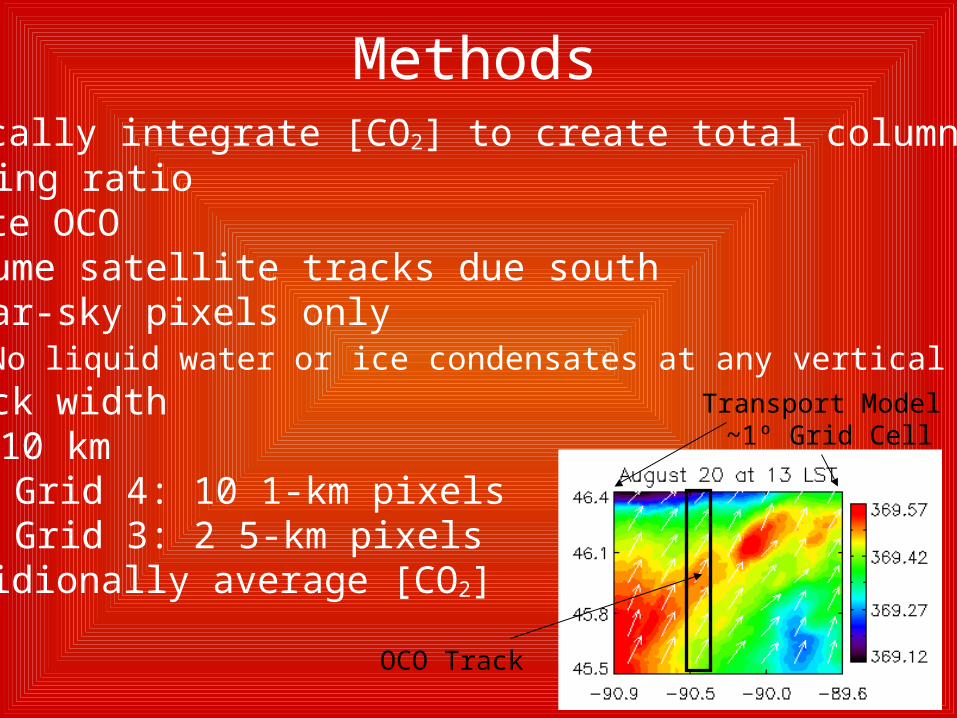
Methods• Vertically integrate [CO2] to create total column mixing ratio• Emulate OCO
- Assume satellite tracks due south- Clear-sky pixels only No liquid water or ice condensates at any vertical level- Track width 10 km
» Grid 4: 10 1-km pixels » Grid 3: 2 5-km pixels
- Meridionally average [CO2]
OCO Track
Transport Model ~1º Grid Cell
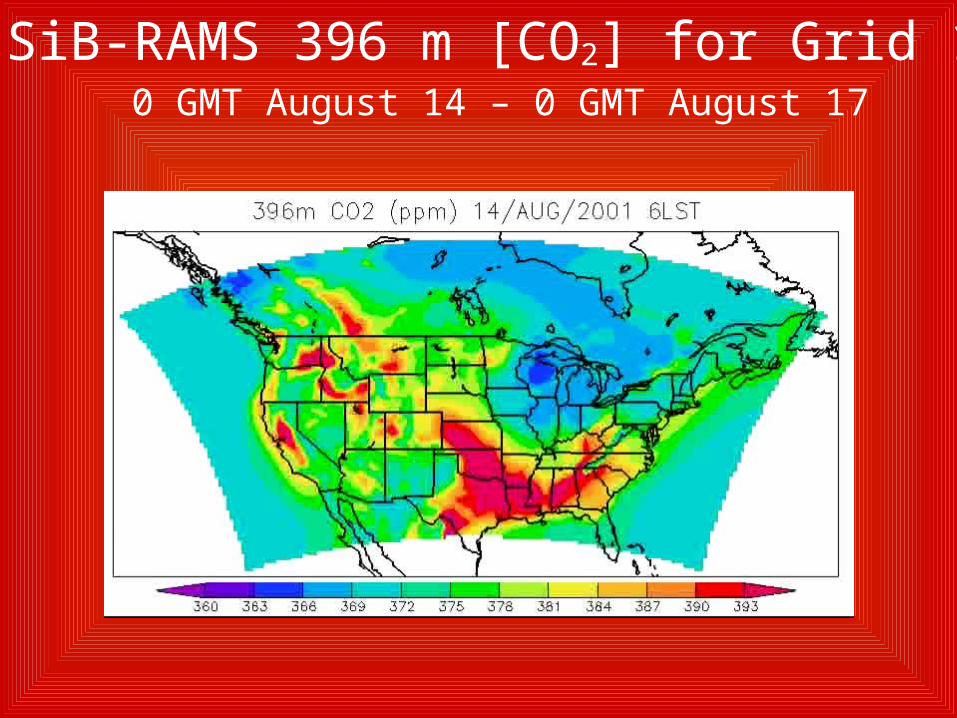
SiB-RAMS 396 m [CO2] for Grid 10 GMT August 14 – 0 GMT August 17

Total Column [CO2] vs. Cloud Cover
• Cloudy days have higher CO2
Cloud cover and the total column modeled CO2 concentration over WLEF. Cloud cover of 0 is clear sky, 1 is cloudy.

Total Column CO2 Variability
Daily 1 PM total column CO2 concentrations, in ppm.
Grid 3
Grid 4
450 km

Cloud Cover
Daily cloud cover at 1 PM. ClearCloudy

Spatial Representation Errors Fine Grid Coarse Grid
• Nearly symmetrical between under and overestimation• On grid 4, 95% of emulated satellite tracks capture domain average within 0.2 ppm• On grid 3, 95% of emulated satellite tracks capture domain average within 0.8 ppm … (includes Great Lakes)
Emulated Satellite [CO2] at 1 PM – Corresponding 1 PM Domain Average
Under Over

Temporal Representation Errors
• Strong dependence on timing of synoptic events• Temporal variability not well sampled with a single measurement • Using satellite [CO2] to optimize diurnally-averaged concentrations introduces large errors into the inversion
Emulated Satellite [CO2] at 1 PM – Domain-Average Diurnal Mean
Fine Grid Coarse Grid
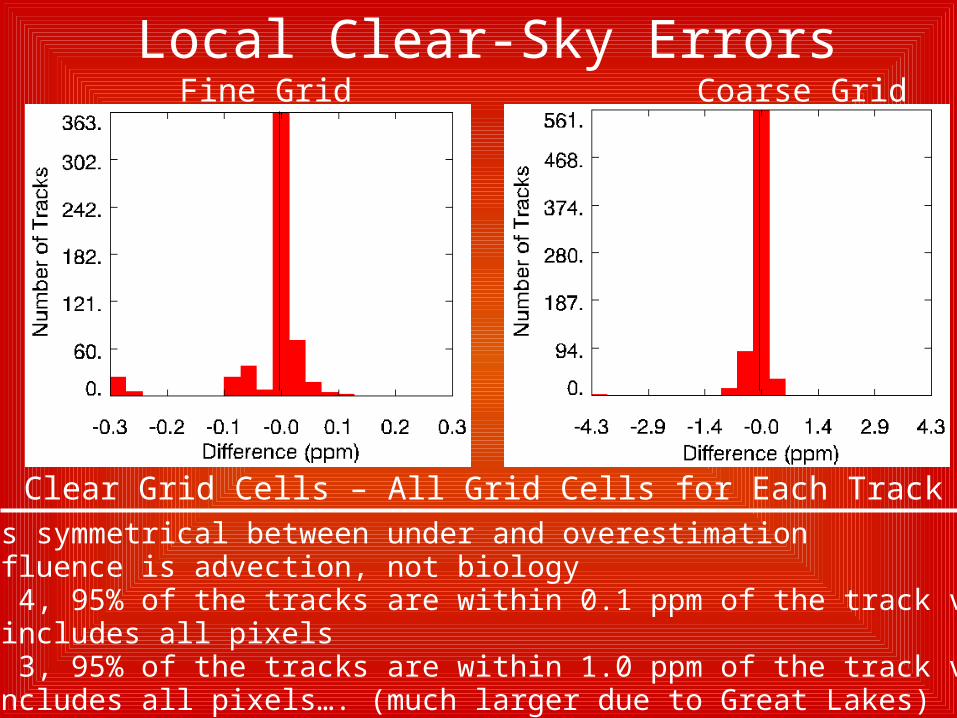
Local Clear-Sky Errors
Clear Grid Cells – All Grid Cells for Each Track• Error is symmetrical between under and overestimation• Main influence is advection, not biology• On grid 4, 95% of the tracks are within 0.1 ppm of the track value that includes all pixels• On grid 3, 95% of the tracks are within 1.0 ppm of the track value that includes all pixels…. (much larger due to Great Lakes)
Fine Grid Coarse Grid
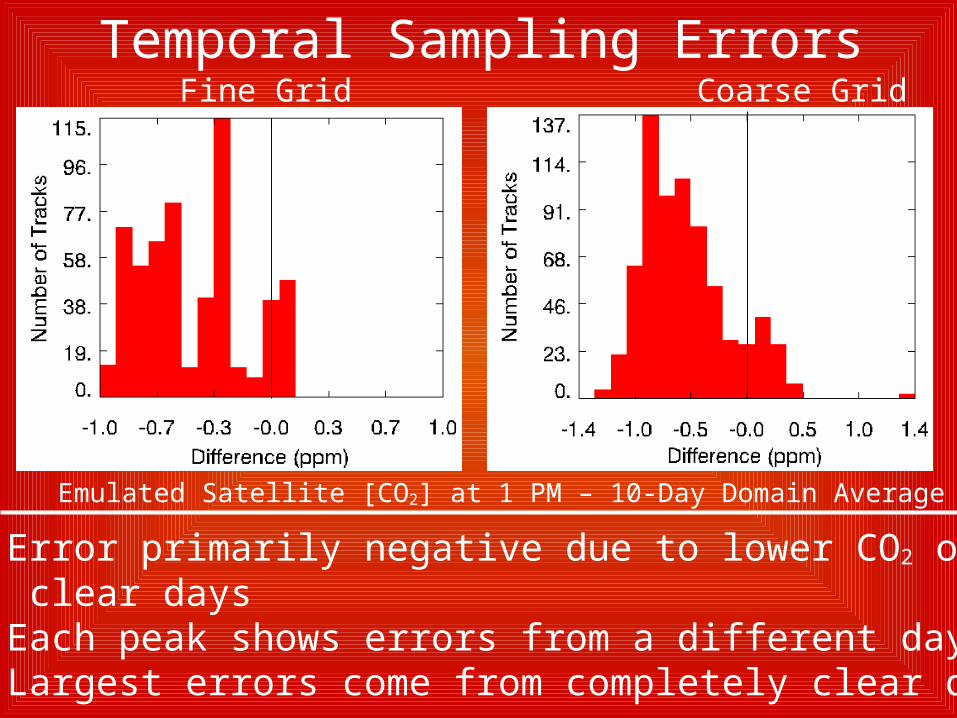
Temporal Sampling Errors
Emulated Satellite [CO2] at 1 PM – 10-Day Domain Average
• Error primarily negative due to lower CO2 on clear days• Each peak shows errors from a different day• Largest errors come from completely clear days
Fine Grid Coarse Grid
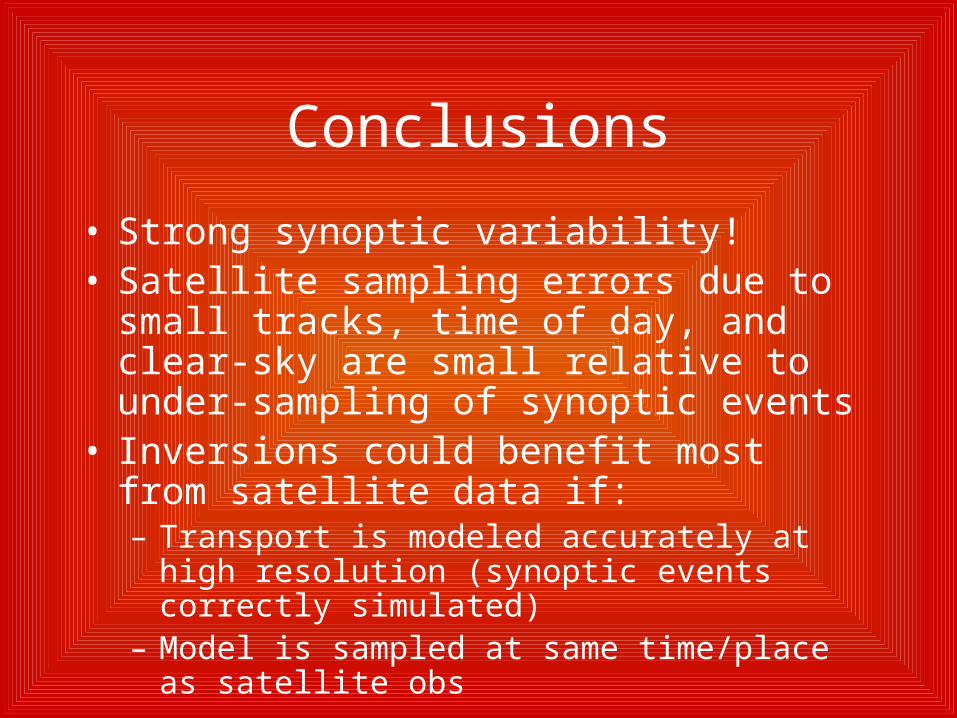
Conclusions
• Strong synoptic variability!• Satellite sampling errors due to small
tracks, time of day, and clear-sky are small relative to under-sampling of synoptic events
• Inversions could benefit most from satellite data if:– Transport is modeled accurately at high
resolution (synoptic events correctly simulated)
– Model is sampled at same time/place as satellite obs

Extra Slides!!
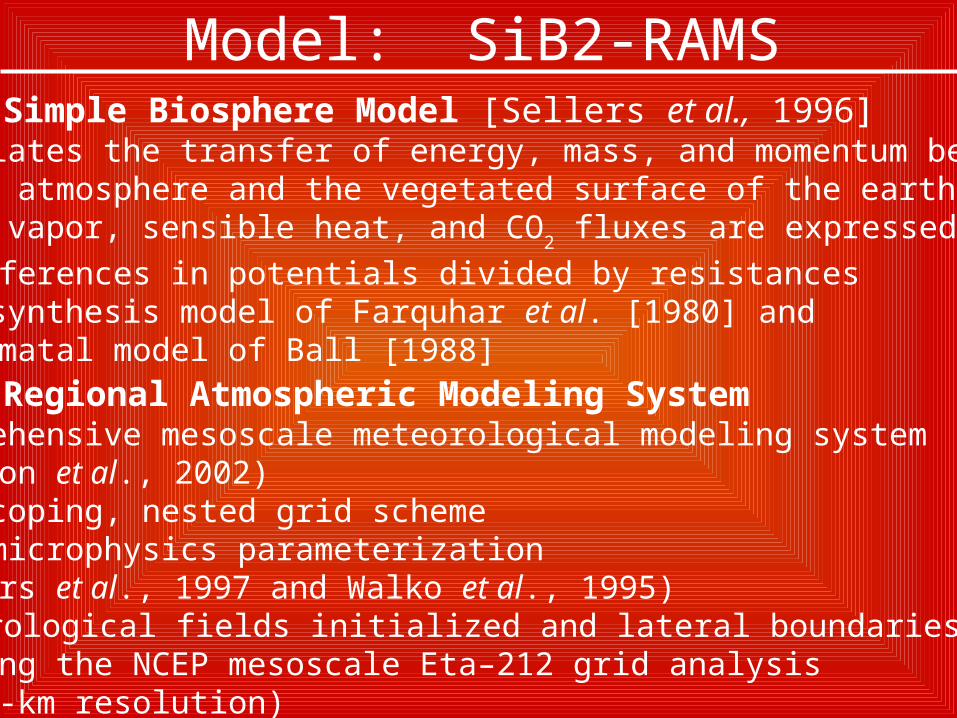
Model: SiB2-RAMS• SiB2 – Simple Biosphere Model [Sellers et al., 1996]
– Calculates the transfer of energy, mass, and momentum between the atmosphere and the vegetated surface of the earth – Water vapor, sensible heat, and CO
2 fluxes are expressed as
differences in potentials divided by resistances – Photosynthesis model of Farquhar et al. [1980] and stomatal model of Ball [1988]
• RAMS – Regional Atmospheric Modeling System– Comprehensive mesoscale meteorological modeling system (Cotton et al., 2002)– Telescoping, nested grid scheme– Bulk microphysics parameterization (Meyers et al., 1997 and Walko et al., 1995)– Meteorological fields initialized and lateral boundaries nudged using the NCEP mesoscale Eta–212 grid analysis (40-km resolution)
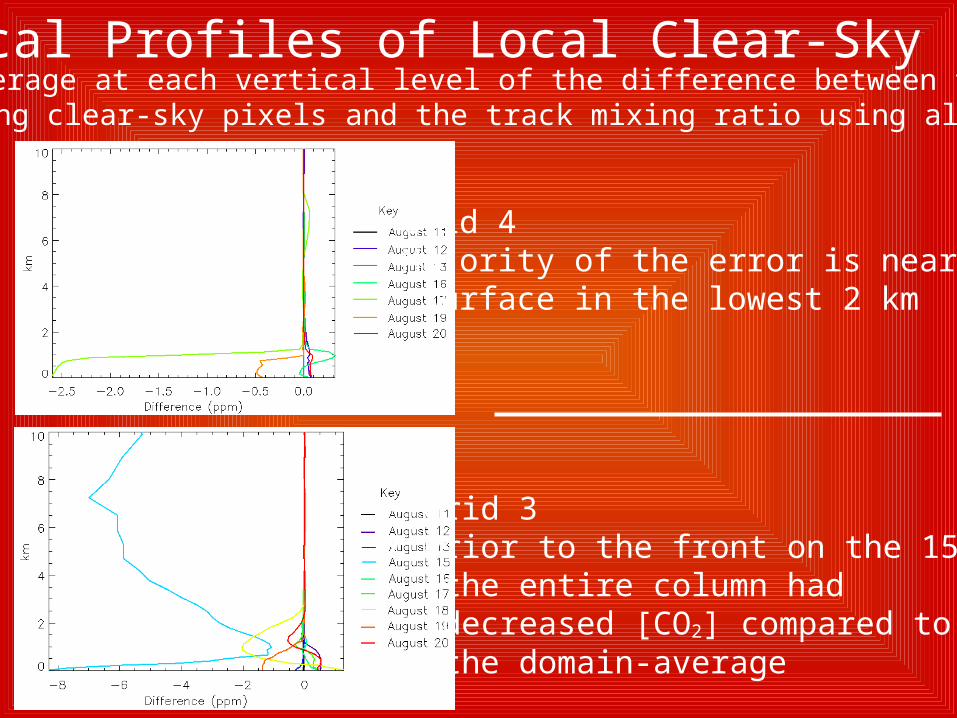
Vertical Profiles of Local Clear-Sky Errors
• Grid 4• Majority of the error is near the surface in the lowest 2 km
Domain Average at each vertical level of the difference between the track [CO2] using clear-sky pixels and the track mixing ratio using all pixels
• Grid 3• Prior to the front on the 15th, the entire column had decreased [CO2] compared to the domain-average

Local Clear-Sky Errors vs. Cloudiness
• Grid 4• Errors increase with increasing cloudiness• Errors primarily due to advection rather than biology
• Grid 3• Similar to grid 4, spread of errors increases as cloud fraction decreases• Errors again mostly due to advection
Differences between emulated satellite concentration at 1 PM using only clear-sky pixels and satellite concentration at 1 PM using all pixels in the track
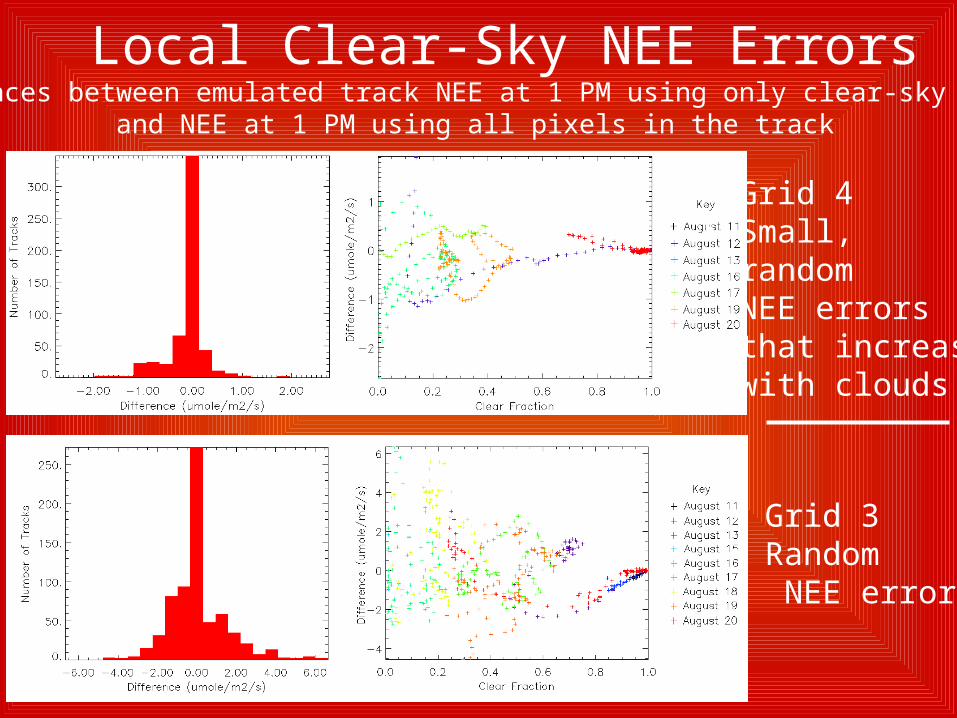
Local Clear-Sky NEE ErrorsDifferences between emulated track NEE at 1 PM using only clear-sky pixels
and NEE at 1 PM using all pixels in the track
• Grid 4• Small, random NEE errors that increase with clouds
• Grid 3• Random NEE errors
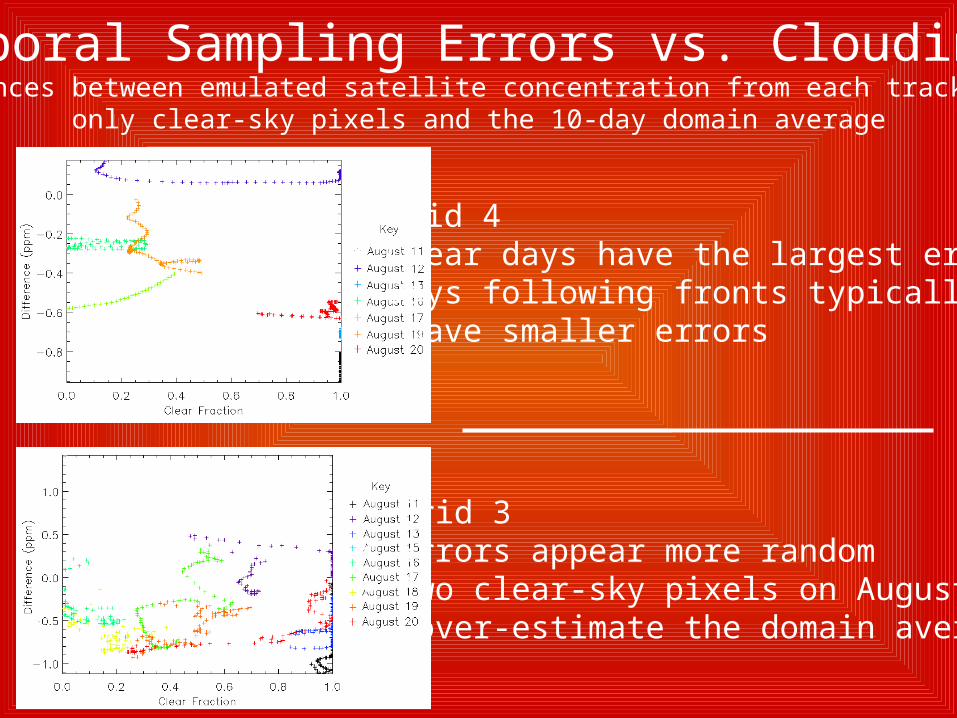
Temporal Sampling Errors vs. CloudinessDifferences between emulated satellite concentration from each track using
only clear-sky pixels and the 10-day domain average
• Grid 4• Clear days have the largest errors• Days following fronts typically have smaller errors
• Grid 3• Errors appear more random• Two clear-sky pixels on August 15 over-estimate the domain average
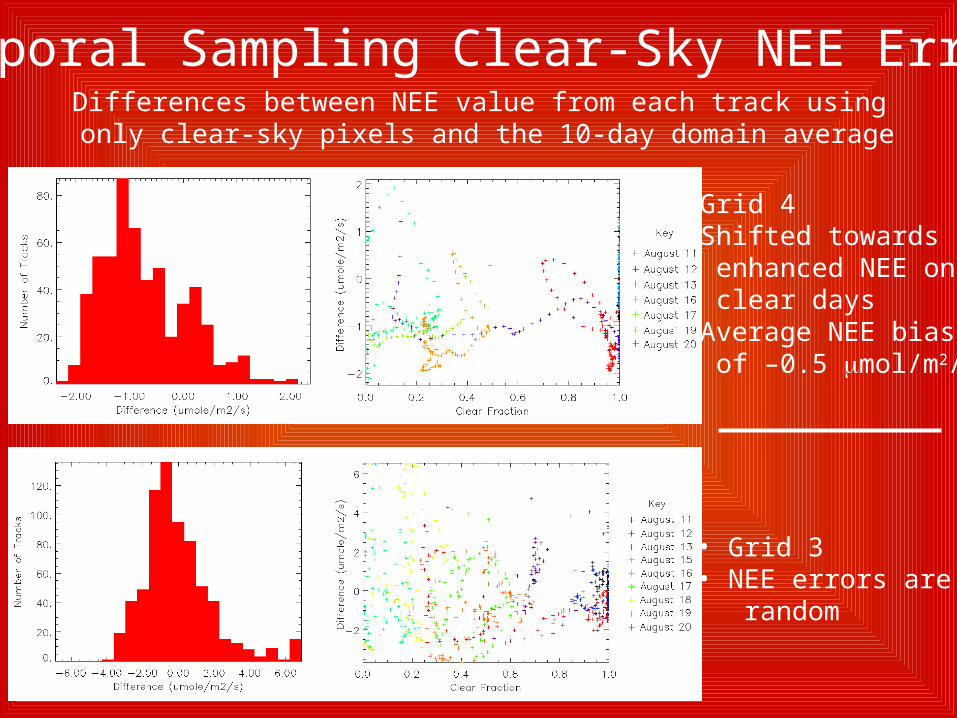
Temporal Sampling Clear-Sky NEE ErrorsDifferences between NEE value from each track using
only clear-sky pixels and the 10-day domain average
• Grid 4• Shifted towards enhanced NEE on clear days • Average NEE bias of –0.5 mol/m2/s
• Grid 3• NEE errors are random