evaluating the energy consumed for water use in the united states
TRANSCRIPT

LETTER
Evaluating the energy consumed for water use inthe United StatesTo cite this article: Kelly T Sanders and Michael E Webber 2012 Environ. Res. Lett. 7 034034
View the article online for updates and enhancements.
You may also likeIntegrable perturbations of saddlesingularities of rank 0 of integrableHamiltonian systemsA. A. Oshemkov and M. A. Tuzhilin
-
Energy for water and water for energy onMaui Island, HawaiiEmily A Grubert and Michael E Webber
-
Chemical exchange saturation transfer(CEST) and MR Z-spectroscopy in vivo: areview of theoretical approaches andmethodsMoritz Zaiss and Peter Bachert
-
Recent citationsQuantifying the impact of residential spaceheating electrification on the Texas electricgridPhilip R. White et al
-
An Integrated Food, Energy, and WaterNexus, Human Well-Being, and Resilience(FEW-WISE) Framework: New MexicoKamini Yadav et al
-
The historical footprint and futurechallenges of water-energy-food nexusresearch: a bibliometric review towardssustainable developmentXinxueqi Han et al
-
This content was downloaded from IP address 180.218.96.218 on 21/10/2021 at 14:26
IOP PUBLISHING ENVIRONMENTAL RESEARCH LETTERS
Environ. Res. Lett. 7 (2012) 034034 (11pp) doi:10.1088/1748-9326/7/3/034034
Evaluating the energy consumed forwater use in the United StatesKelly T Sanders and Michael E Webber
Department of Mechanical Engineering, The University of Texas at Austin, 204 E. Dean Keeton St. StopC2200, Austin, TX 78712-1591, USA
E-mail: [email protected] and [email protected]
Received 12 March 2012Accepted for publication 22 August 2012Published 20 September 2012Online at stacks.iop.org/ERL/7/034034
AbstractThis letter consists of a first-order analysis of the primary energy embedded in water in theUnited States. Using a combination of top-down sectoral assessments of energy use togetherwith a bottom-up allocation of energy-for-water on a component-wise and service-specificlevel, our analysis concludes that energy use in the residential, commercial, industrial andpower sectors for direct water and steam services was approximately 12.3± 0.3 quadrillionBTUs or 12.6% of the 2010 annual primary energy consumption in the United States.Additional energy was used to generate steam for indirect process heating, space heating andelectricity generation.
Keywords: energy, water, energy water nexus, residential, commercial, industrial
S Online supplementary data available from stacks.iop.org/ERL/7/034034/mmedia
1. Introduction
The relationship between energy and water, commonlyreferred to as the energy–water nexus, has received increasingattention in recent years in light of growing water and energyresource demand in the United States (US). The US watersystem is comprised of many stages of collection, treatment,conveyance, distribution, end-use preparation, reconditioningand release, each of which has important energy implications.National water-related energy use is expected to increaseas water-stressed states such as Texas, Florida, Arizona andCalifornia shift toward more energy-intensive technologiessuch as desalination plants and interbasin water pipelines toaddress current and future water-scarcity concerns. Althoughthese shifts toward more energy-intensive water are likely tohave an appreciable impact on future energy demand, verylittle analysis has been done to quantify water-related energyuse at the national-level to establish a benchmark for today’sconditions. Thus, there is a knowledge gap about the energyneeds of the water system. This analysis serves to fill thatgap by quantifying a baseline estimate of 2010 water-relatedenergy use in the US.
2. Background
The United States Geological Survey (USGS) estimates thattotal US water withdrawals in 2005 were approximately410 billion gallons per day. Of this amount, 349 billiongallons per day was freshwater. Water is allocated to severalcategories of users that either collect their own water for theirown internal uses (‘self-supplied users’) or draw their waterfrom the public water supply. Table 1 organizes 2005 waterwithdrawals reported by the USGS into four categories thatare consistent with the end-use sectors defined by the EnergyInformation Administration (EIA). (These end-use sectorsinclude Residential, Commercial, Industrial and Power, whichdeviate slightly from USGS’s standard reporting notation.)The vast majority (89%) of water withdrawals were byself-supplied users, divided among the sectors as listed intable 1. The public supply only accounted for 11% of 2005water withdrawals by volume [1].
The energy intensity of a volume of water is influencedby factors such as source water quality, proximity to awater treatment facility and end-use, intended end-use andsanitation level, as well as conveyance to and treatmentat a wastewater treatment facility. The energy intensityof a given water treatment technology correlates to the
11748-9326/12/034034+11$33.00 c© 2012 IOP Publishing Ltd Printed in the UK

Environ. Res. Lett. 7 (2012) 034034 K T Sanders and M E Webber
Table 1. The US withdrew 410 billion gallons of water per day in 2005. Freshwater withdrawals represent 85% of total waterwithdrawals [1].
Sector Description of water withdrawalsWithdrawals (billiongallons per day) Percentage (%)
Residential Self-supplied 3 830 0.9Public supply 25 600 6.3
Commercial Self-supplied Not reported —Public supply 14 100 3.4
IndustrialSelf-supplied (non-irrigation) 33 100 8.1Self-supplied (irrigation) 128 000 31.2Public supply 4 420 1.1
Power Self-supplied 201 000 49.0Public supply Not reported —
Total All withdrawals 410 000 100
size, concentration, and nature of the contaminant to beremoved. As source water becomes more degraded, moreenergy-intensive water treatments are required to removecontaminants. Likewise, water requiring a high end-usequality typically requires more energy for treatment thanwater requiring a lesser end-use quality. Since theserequirements differ by geographic location, climate, seasonand local water quality standards, the energy consumption ofregional water systems vary significantly.
While public water supply withdrawals are considerablysmaller than those of the thermoelectric power and irrigationsectors, these withdrawals typically have higher energyrequirements because this volume of water must be treatedto the acceptable drinking water standard specified by theUS Environmental Protection Agency’s (EPA) Safe DrinkingWater Act (SDWA). Water delivered in the public watersupply is also typically pumped longer distances, sinceself-supplied industrial and agricultural users generally drawwater in close proximity to where it will be used [2,3]. Providing water at this quality and at these volumesrequires significant amounts of energy to pump, treat anddistribute water to end-users, who are likely to heat, chill orpressurize this water to suit their needs on-site. After wateris used, much of it is collected and sent to a wastewatertreatment plant where it is reconditioned to an acceptablestandard so that it can be released back into a waterreservoir. In some cases, water is recycled or reclaimed,that is, it is treated to an acceptable standard for usein non-potable applications (e.g. agricultural and landscapeirrigation, groundwater recharge, industrial cooling/processwater, toilet flushing, etc). Depending on the circumstances,reclaimed water might require tertiary treatment followingstandard wastewater treatment to meet an end-quality levelappropriate for its intended end-use. However, in manyregions of the US, wastewater is treated to a standardacceptable for non-potable reuse and requires no treatment inaddition to standard practice. Thus, most of the current energyexpenditures for recycled water are those for pumping waterfrom the wastewater treatment facility, to its end-user [4].However, the use of reclaimed water for potable reuse inthe US is limited, comprising only 0.1% of the total volumemunicipal wastewater treated annually.
The US public water supply serves several differentend-uses that are highlighted in table 1. Over half of the publicsupply (58%) is delivered to Residential users, while 12% isdelivered for use in the Industrial sector (three-quarters of thetotal water used in the Industrial sector is self-supplied) [1].Of the remaining 30% of the public water supply, about halfis delivered to commercial users and the other half is used inpublic locations, such as municipal buildings and recreationspaces, and for public services such as street washing, firehydrants and fire fighting. A small percentage of the publicuse category includes water that is ‘lost’ or unaccountedfor. The USGS includes water used for public services andleaks in the same category, since a significant volume of thiswater is unmetered, so there is no way to distinguish thiswater use from losses in water systems [1]. Consequently, theactual volume of water that is lost through leakages is notknown since this category is determined by calculating thedifference between water released into the distribution systemand the volume of water delivered to billed customers. Someof this category might also include errors in water-metering.Statewide public use and losses have been reported anywherein the range of 3–41% of the total public supply [5]. Sincethe EIA includes municipal, public and recreational energyuse in its Commercial sector category, we include all waterdelivered to commercial, municipal and public users in the‘Commercial’ category of table 1.
Self-supplied water collected by power generators,irrigators and industrial facilities is not required to meetthe sanitation standards defined by the SDWA and is nottypically treated to potable quality. (However, some industrialusers such as producers of semi-conductors require water ofextremely high standards to prevent equipment fouling [6].)Although less rigorous water treatment uses less energy, otheraspects of water use often cancel out any energy savings. Forexample, self-supplied users often use less-efficient pumpsthan public utilities (due to reduced scales of pumping [7])and might also pressurize, heat or cool water accordingto their intended end-use. Many of these users are alsorequired to treat their wastewater before discharging it toa reservoir to remain in compliance with the EPA’s CleanWater Act [8]. Chemical and refining industries often require
2

Environ. Res. Lett. 7 (2012) 034034 K T Sanders and M E Webber
Figure 1. The energy intensity of each stage of the public water supply life-cycle varies according to regional topography, climate, andpolicy framework. The range in energy intensity of each stage included within the dotted region of the flowchart (top panel) is depicted inthe bar graph below it (bottom panel). Water is not always discharged to the same water source that it was originally extracted from. (Dataand flowchart adapted from [12].)
primary, secondary and tertiary treatments before water isof sufficient quality to discharge to public water treatmentfacilities or water reservoirs. Additionally, these industriesmust often strip wastewater with hot steam or gas streams toremove chemicals and oil from wastewater prior to primarywastewater treatment [9].
Figure 1, adapted from a 2005 report from theCalifornia Energy Commission (CEC) [10], defines a rangeof energy-intensities for each life-cycle stage included withinthe dotted boundaries of the flow diagram. In addition torigorous data collection in respect to the energy consumptionof Californian water utilities, these benchmarks are usefulsince several of the state’s public water supplies are amongthe most energy-intensive in the world, while others requirevery little energy. Data reported by other states such asNew York, Massachusetts, Wisconsin and Iowa regarding theenergy intensity of water supply segments fall well withinthe prescribed ranges defined in figure 1 [11]. The upperbound of each range represents an energy-intensive scenariobased on empirical data collected on Californian public watersystems. High-energy scenarios usually include water systemsthat require extensive water pumping (e.g. the State WaterProject and the Central Valley Project) and/or advanced watertreatment. The lower-bound represents a scenario requiringvery low-energy inputs. Low-energy scenarios generallyinclude situations in which gravity can be used to move waterwithout pumping and/or raw water is of very high quality.
Previous analyses have concluded that over 3% ofnational electricity consumption is used for the production,
conveyance, and treatment of water and wastewater in theUS and much more when considering the additional energyrequired for on-site heating, cooling, pumping, and softeningof water for end-use [7, 13]. Most of the estimates madeto date regarding the energy intensity of water are basedon work done by the Electric Power Research Institute(EPRI) over the past few decades. In 2002, EPRI publisheda report regarding the electricity consumed for providingwater and wastewater treatment in the US. The reportestimates the average electricity intensity of the water supplyby considering the energy to supply, treat and reconditionwastewater effluent. Electricity data from public water supplyagencies, publicly and privately owned wastewater facilities,and self-supplied sectors including domestic, commercial,industrial, mining, irrigation, livestock and thermal powergenerating sectors were analyzed to conduct the analysis. Thereport does not, however, attempt to quantify water-relatedenergy needs of end-use preparation such as heating, coolingand pressurization [7].
A report released in 2009 by the River Network extendsthe 2002 EPRI analysis to quantify water-related energyfor end-use in the Residential and Commercial sectors, aswell as the CO2 emissions associated with this energyuse [14]. While this report advances the state of understandingabout water-related energy and carbon for all public andself-supplied water-users by including end-use, its assumptionthat all end-use consumption of energy-for-water is in theform of electricity fails to consider the likelihood of direct useof fuels on-site (for example natural gas for water heating).
3

Environ. Res. Lett. 7 (2012) 034034 K T Sanders and M E Webber
Consequently, the assumptions for conversion efficiency arelikely to yield an over-estimate for total energy consumptionin context to the report’s scope. The work in this letter seeksto update and extend calculations in this body of prior workby using more recent data, performing more detailed analysisat the component levels, and refining the assumptions aboutconversion efficiencies at the power plant and in water heatersand treatment systems to account for direct and indirect usesof water.
While national studies have aggregated averages for theenergy use and energy intensity of various stages of theUS water system, these estimates do not capture the widedisparity between regional water systems. Several studieshave been completed to estimate water-related energy useat the state-level. California, a state that uses 19% of itselectricity and 32% of its natural gas to withdraw, collect,convey, treat, distribute, and prepare water for end-use, hasbeen especially diligent in accounting its water-related energyuse [12, 15]. While other states such as Massachusetts,Wisconsin, Iowa, and New York have also begun quantifyingtheir water and wastewater utility energy consumption at thestate-level, the data are sparse for most states [11].
Considering the disparity across regional water systems,calculating water-related energy consumption in the US isnot straightforward, as it requires analysis with temporal andgeographic fidelity. Furthermore, analysis is hindered by datagaps, the largest being outdated information on energy con-sumption by water and wastewater plants; incomplete data forwater-related end-uses, especially in non-residential sectors;and poor accounting for losses and leaks. The followingmanuscript will describe a first-order method of quantifyingbaseline water-related energy consumption in the US.
3. Methodology
This analysis builds on the work done by CEC, using datafrom the US EIA, the US Department of Energy (DOE), EPRIand private sources, to derive a first-order approximationfor the primary energy embedded in water in the US.We considered water-related energy in the Residential,Commercial, Industrial and Power sectors, which representjust over 70% of total US primary energy consumption [16].(Transportation, representing the remainder of energy use,was not included.) Results are reported for primary energyconsumption in terms of British Thermal Units (BTUs) to beconsistent with the notation of most US authoritative energyagencies.
3.1. Data sources
Residential and Commercial sector energy consumption datareflect DOE’s 2010 Building’s Energy Data Book [17, 18],various sources from the EIA [19–21], and EPRI’s projectionsregarding 2010 water and wastewater utility energy use [7].Industrial data reflect energy consumption projections for2010 published in EIA’s Annual Energy Outlook 2011 [19].(EIA projects industrial energy consumption on an annualbasis based on the Manufacturing Energy Consumption
Survey (MECS), which is only published every few years. Thelatest edition, as of early 2012, was the 2006 MECS, publishedin 2008.) Data regarding the Power sector are from the2010 DOE/EIA Form EIA-923 database, which characterizescombined heat and power (CHP) and electric power plantsin terms of electric power generation, fuel consumption,operation cooling water data, primary mover type, location,etc [22].
Supplementary reports were used in addition to theselarge, aggregate datasets, to gain insight into the technologyand/or fuel distribution across certain technologies (e.g.the fuel distribution across industrial boilers or commercialair-conditioners). Although we only used energy consumptiondata from 2010, we did not scale any fuel distributionestimates based on industry reports published prior to 2010,assuming that the general distribution of technologies changedvery little in the past decade. (For example, if 40% ofindustrial boilers in the Refining industry were fueled bynatural gas in 2005, we assume that this distribution was thesame in 2010.)
3.2. Allocation methods
Definition of water-related energy classifications. Totalprimary energy consumption data from 2010 were aggregatedand organized by sector and primary fuel consumption.Each sector included between 3 and 12 categories that wereanalyzed on a line-by-line basis to determine the fraction ofenergy, if any, that was attributable to water-related services.(Table 2 organizes these energy-consuming activities bycategory, j, and sector, i.)
We defined three general classifications of water-relatedenergy use based on whether energy was used to prepare waterto be delivered to an end-user or as a secondary product useddirectly or indirectly to produce another good or service.
These classifications are as follows:
(i) Direct water services. Direct primary fuel consumptionfor water heating, cooling, pumping, pressurization,evaporation, softening, removal and treatment. (Assigneda fraction, F(DWS)ij of total energy use, Eij. This directenergy-for-water is included in figure 3.)
(ii) Direct steam use. Energy for on-site steam generationthat is used directly (i.e. steam comes into directcontact with feedstocks) in processes. Examples wouldinclude steam used for sterilization and cleaning;boiling, steaming and blanching for food preparation;steam stripping in chemical manufacturing and refiningprocesses; and direct injection of steam in paper–pulpindustry processes. (Assigned a fraction, F(DSU)ij oftotal energy use, Eij. This direct energy-for-water is alsoincluded in figure 3.)
(iii) Indirect steam use. Energy for on-site steam productionthat is used for indirect process heating (i.e. steam doesnot come into direct contact with process feedstocks),space heating, and electricity generation. (Assigned afraction, F(ISU)ij of total energy use, Eij. This energy,considered indirect, is not included in figure 3.) Although
4

Environ. Res. Lett. 7 (2012) 034034 K T Sanders and M E Webber
Table 2. The sectors, i, and activities, j, that were aggregated in equations (1)–(3) are listed here.
Residential Commercial Industrial Powerj i = 1 i = 2 i = 3 i = 4
1 Space heating Space heating Chemical Power plant use2 Water heating Water heating Refining Steam-driven power3 Air conditioning Public water/wastewater utilities Paper and pulp Pumped storage4 Wet cleaning Air conditioning Construction5 Ranges, stoves, ovens Ventilation Mining6 Hot tubs, pools, spas Refrigerators and freezers Food7 Refrigerators Food service equipment Iron, steel, aluminum8 Separate freezers Cooking Agriculture9 Televisions Electronics/computers Other
10 Personal computers Lighting11 Lighting Other12 Other
steam for electricity generation is commonly consideredas an ‘energy-related water use’ in energy–water nexusstudies, it must also be considered as a ‘water-relatedenergy use’ in this analysis, since water must be boiledin order to be used for electricity generation. That is,without an initial conversion into steam, water cannot beused to generate power.
We used these three definitions to allocate a fractionof energy to one, two or all of these categories dependingon the nature of the energy use of each energy-consumingcategory included in table 2. Each fraction represented theratio of water-related energy use to total energy use in a givencategory.
Equations (1)–(3) were used to determine total energyfor direct water services (EDWS), direct steam use (EDSU)and indirect steam use (EISU), respectively. Total directand indirect energy embedded in water is categorized inequations (4) and (5), respectively.
EDWS =∑ ∑
F(DWS)ijEij (1)
EDSU =∑ ∑
F(DSU)ijEij (2)
EISU =∑ ∑
F(ISU)ijEij (3)
EW,Direct = EDWS + EDSU (4)
EW,Indirect = EISU. (5)
Water-related energy in the residential sector. The Residentialsector was divided into 12 energy-consuming categories basedon energy end-use splits defined in EIA’s 2010 BuildingsEnergy Data Book [17]. Although the EIA defines total energyconsumption in each category by fuel, it does not includeany further data resolution. Thus, each category had to bepainstakingly analyzed to determine (1) the percentage ofenergy in each category, j, that was consumed exclusivelyfor water-related purposes, (2) the fraction of water-relatedenergy consumed for direct water services, direct steam use,and indirect steam use in each category, j, and (3) the subset offuels that were consumed for each energy-consuming activity.
The EIA, for example, reports that 5.84 quads ofprimary energy was consumed for Residential Space Heatingin 2010 [17], but it does not split this category into
smaller device-specific subsets. Since some space heatingdevices require water as a heat delivering medium (i.e.hydronic systems including residential boilers, water-drivenheat-pumps, hot water radiant floors, etc) and others do not(e.g. central heating, ventilation and air conditioning systems),we first had to estimate the distribution of water-driven spaceheating technologies across the US. Based on the literature,we assumed that 11% of total energy for Space Heatingwas consumed by hydronic systems [20, 23, 24]. Secondly,we had to determine how to classify this water-relatedenergy. In this case, the entire fraction (i.e. 11% of 5.84quads) of water-related energy was considered in the indirectsteam use category since hydronic systems use steam or hotwater to deliver heat in a closed-loop system and, thus, theheat-carrying fluid does not come into direct contact with theair being heated. Thirdly, we approximated the distributionof fuels that made up this energy consumption based onEIA’s 2009 Residential Energy Consumption Survey and othersources in the literature [17, 18, 20, 25]. (When there were nodata to indicate otherwise, we assumed that the general fueldistribution across technologies did not change from earlierreports, as shifts in technology generally occur over manyyears.) We assumed that fossil-fuels supplied the majority ofthe energy consumed by these systems, primarily in boilers,but renewables such as wood and geothermal also contributeda small fraction of energy for hydronic space heating.
The remaining 11 Residential sector categories wereanalyzed with similar rigor to determine total water-relatedenergy for each. Most water-related energy in the Residentialsector was considered in the direct water services category,with the aforementioned exception of energy consumed inresidential space heaters. Categories such as water heating,hot tubs and pools were relatively straightforward to analyze,since most, if not all, of consumed energy was attributedto heating or pumping water. Categories such as lighting,television and personal computers were also straightforwardas they consume essentially no energy for water-relatedpurposes. Other categories were less clear and, like thespace heating category example, required device-specificinterpretation. For example, the majority of the energy used torun clothes washers, dryers, and dishwashers was consideredin the direct water services category since water is the required
5

Environ. Res. Lett. 7 (2012) 034034 K T Sanders and M E Webber
medium for cleaning; in the case of clothes dryers, operationis dependent on effectively removing water from clothes.Cooking related activities were also difficult to estimate sincesteaming, blanching, boiling, and other water-related cookingprocesses vary widely across residences and are not welldocumented. Categories that required more analysis or hadless available data at the device or activity-specific level,were assigned greater levels of uncertainty. (See subsectionon uncertainty below.) All assumptions for all sectors andcategories are detailed in supporting information (available atstacks.iop.org/ERL/7/034034/mmedia).Water-related energy in the commercial sector. Elevenenergy-consuming categories were defined and analyzed inthe Commercial sector with the same methodology discussedin the Space Heating example above. Activities such as publicwater and wastewater treatment, and distribution and waterheating were assigned values of F(DWS)ij = 1, as all ofthe energy consumed in these categories was to move andtreat water. Since the public water and wastewater utilitycategory is not explicitly defined in EIA’s 2010 BuildingsEnergy Data Book [18], we base this category on EPRI’sprojections for 2010 public water and wastewater utilityenergy consumption [7]. (We subtracted this primary energyuse from EIA’s other category, where it would otherwise beincluded.) EPRI’s projection regarding energy use by publicwater and waste water utilities in 2010 was based on datafrom 2000, and is therefore subject to error. However, morerecent energy data on public water utilities at the nationalscale are unavailable. Other categories required more rigorousanalysis based on more detailed sources such as EIA’s 2006Commercial Building Energy Consumption Survey [21] andthe 2005 Commercial Boiler Inventory published by [26].
Although category definitions were generally similar tothose in the Residential sector, results were generally verydifferent, reflecting large sectoral differences. For example,central chillers and district chilled water systems are twocommon technologies that use water as a means to extractheat from large spaces; air-conditioners in the Residentialsector, on the other hand, generally use air to cool residences(an exception being swamp coolers that are only used in avery small percentage of homes). We also assumed that somelarge commercial computer and electronics facilities (suchas data centers) used some water-related energy for coolingdevices. Commercial refrigerators, freezers and ice-makerswere also assumed to use an appreciable amount of energyfor chilling water and freezing ice. Although freezers andrefrigerators are also used for chilling drinking water andice in the Residential sector, we did not consider this energyuse since it is difficult to estimate this quantity of energyas a fraction of all energy consumed in these categories.However, this omission is unlikely to affect our results sincethis energy consumption is relatively small in comparison toother water-related, energy-consuming activities.
The Commercial and Industrial sectors use a significantfraction of their energy for generating steam in boilers. Thisenergy was generally assigned to the direct steam use and/orthe indirect steam use categories, depending on the nature ofthe steam use. Process heating and boilers consume a large
fraction of US industrial energy use to provide hot water(generally 250 ◦F) and steam (generally 350–400 ◦F). TheDOE estimates that 34% of 1994 Industrial sector energywas consumed to produce steam [27]. This energy use wasconsidered in the indirect steam use category unless boilersteam or hot water was injected directly into a process [26].Twelve per cent of the nation’s 4.7 million commercialbuildings are served by boilers that consume approximately1.6 quads of primary energy in the sector, the majority ofwhich are fueled by natural gas [26]. While industrial boilerstend to drive large industrial applications such as powergeneration, industrial process, and district heating with steam,commercial boilers are used primarily to provide hot waterfor space heating (2/3 of commercial boilers) and hot water(1/3 of commercial boilers) for buildings such as hospitals,food service, office buildings and apartment buildings [26].Consequently, the majority of commercial boilers are used incolder regions of the US. Hot water production by boilers isincluded in as a direct water service, while space heating isconsidered in the indirect steam use category.Water-related energy in the Industrial sector. The EIA’sManufacturing Energy Consumption Survey (MECS), theauthoritative data set on the manufacturing industry,was last published in 2006, so the nine 2010 energyconsumption categories we analyzed are reference caseestimates documented in the 2011 EIA Annual EnergyOutlook [25]. More detailed energy data for industrialprocesses are not generally available since most industriesconsider their energy consumption proprietary, so moreuncertainty was generally assigned to activities in thissector. Consequently, assignments made in the Residentialand Commercial sectors tended to be more straightforwardthan those made in the Industrial sector. Residential andCommercial water heating energy data, for example, areexplicitly reported by the EIA [17, 18], whereas theenergy consumed for on-site water treatment and pumpingin manufacturing industries had to be estimated basedon white papers, industry reports, boiler inventories, andcorrespondence with industry experts [9, 27–34].Water-related energy in the power generating sector. Wecharacterize the energy consumed by all steam-drivenpower generators contained in the 2010 DOE/EIA FormEIA-923 inventory as indirect steam use since steamis used for electricity generation. Steam-driven powergeneration technologies represented 75.5% of approximately40 quadrillion BTUs (1 quadrillion BTUs = 1 quad) of totalprimary energy consumed in the US Power sector in 2010.These technologies include steam turbines, the steam portionof combined-cycle systems, and combined-cycle single-shaftcombustion turbines and steam turbines that share a singlegenerator (representing 74%, 0.8%, and 0.6% of total 2010US primary energy consumption for electric generation,respectively) [22].
A small fraction of energy consumed by the Powersector is allocated to the direct water services category. Thisfraction includes energy for pumping and pressurizing coolingwater, which is used to extract heat from steam after it exitsthe turbine. Based on interviews with industry experts, we
6
Environ. Res. Lett. 7 (2012) 034034 K T Sanders and M E Webber
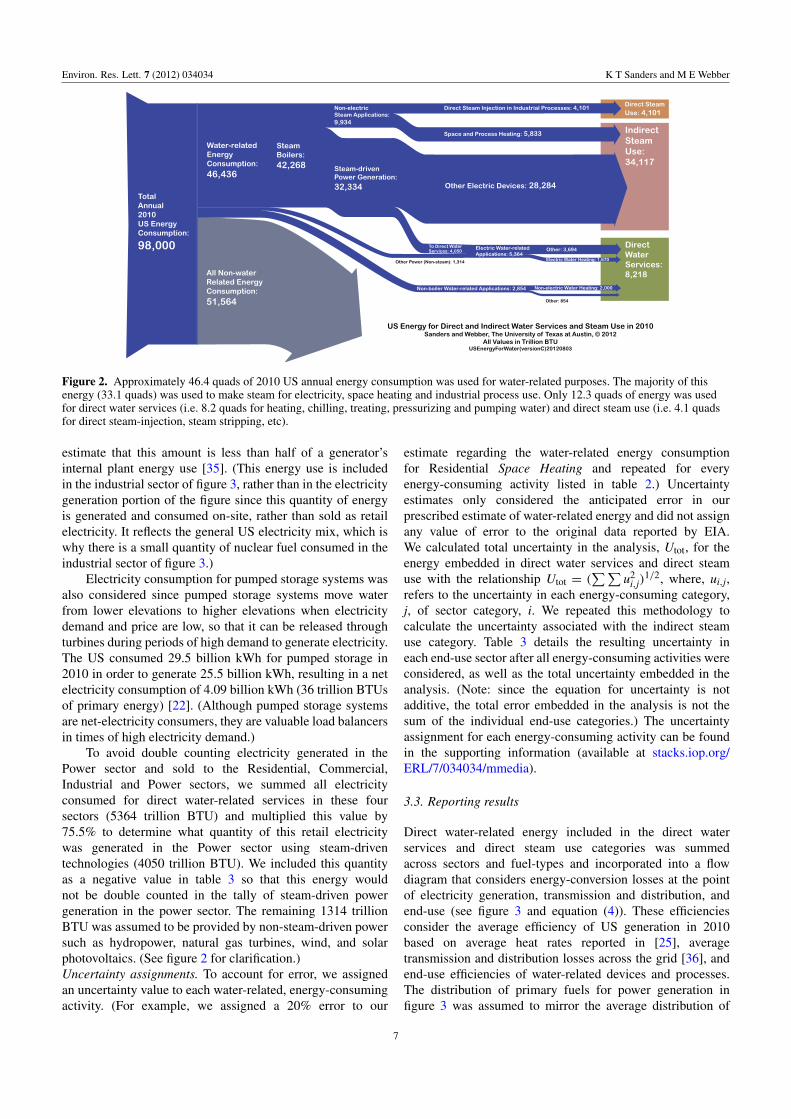
Figure 2. Approximately 46.4 quads of 2010 US annual energy consumption was used for water-related purposes. The majority of thisenergy (33.1 quads) was used to make steam for electricity, space heating and industrial process use. Only 12.3 quads of energy was usedfor direct water services (i.e. 8.2 quads for heating, chilling, treating, pressurizing and pumping water) and direct steam use (i.e. 4.1 quadsfor direct steam-injection, steam stripping, etc).
estimate that this amount is less than half of a generator’sinternal plant energy use [35]. (This energy use is includedin the industrial sector of figure 3, rather than in the electricitygeneration portion of the figure since this quantity of energyis generated and consumed on-site, rather than sold as retailelectricity. It reflects the general US electricity mix, which iswhy there is a small quantity of nuclear fuel consumed in theindustrial sector of figure 3.)
Electricity consumption for pumped storage systems wasalso considered since pumped storage systems move waterfrom lower elevations to higher elevations when electricitydemand and price are low, so that it can be released throughturbines during periods of high demand to generate electricity.The US consumed 29.5 billion kWh for pumped storage in2010 in order to generate 25.5 billion kWh, resulting in a netelectricity consumption of 4.09 billion kWh (36 trillion BTUsof primary energy) [22]. (Although pumped storage systemsare net-electricity consumers, they are valuable load balancersin times of high electricity demand.)
To avoid double counting electricity generated in thePower sector and sold to the Residential, Commercial,Industrial and Power sectors, we summed all electricityconsumed for direct water-related services in these foursectors (5364 trillion BTU) and multiplied this value by75.5% to determine what quantity of this retail electricitywas generated in the Power sector using steam-driventechnologies (4050 trillion BTU). We included this quantityas a negative value in table 3 so that this energy wouldnot be double counted in the tally of steam-driven powergeneration in the power sector. The remaining 1314 trillionBTU was assumed to be provided by non-steam-driven powersuch as hydropower, natural gas turbines, wind, and solarphotovoltaics. (See figure 2 for clarification.)Uncertainty assignments. To account for error, we assignedan uncertainty value to each water-related, energy-consumingactivity. (For example, we assigned a 20% error to our
estimate regarding the water-related energy consumptionfor Residential Space Heating and repeated for everyenergy-consuming activity listed in table 2.) Uncertaintyestimates only considered the anticipated error in ourprescribed estimate of water-related energy and did not assignany value of error to the original data reported by EIA.We calculated total uncertainty in the analysis, Utot, for theenergy embedded in direct water services and direct steamuse with the relationship Utot = (
∑ ∑u2
i,j)1/2, where, ui,j,
refers to the uncertainty in each energy-consuming category,j, of sector category, i. We repeated this methodology tocalculate the uncertainty associated with the indirect steamuse category. Table 3 details the resulting uncertainty ineach end-use sector after all energy-consuming activities wereconsidered, as well as the total uncertainty embedded in theanalysis. (Note: since the equation for uncertainty is notadditive, the total error embedded in the analysis is not thesum of the individual end-use categories.) The uncertaintyassignment for each energy-consuming activity can be foundin the supporting information (available at stacks.iop.org/ERL/7/034034/mmedia).
3.3. Reporting results
Direct water-related energy included in the direct waterservices and direct steam use categories was summedacross sectors and fuel-types and incorporated into a flowdiagram that considers energy-conversion losses at the pointof electricity generation, transmission and distribution, andend-use (see figure 3 and equation (4)). These efficienciesconsider the average efficiency of US generation in 2010based on average heat rates reported in [25], averagetransmission and distribution losses across the grid [36], andend-use efficiencies of water-related devices and processes.The distribution of primary fuels for power generation infigure 3 was assumed to mirror the average distribution of
7

Environ. Res. Lett. 7 (2012) 034034 K T Sanders and M E Webber
Tabl
e3.
Tota
lene
rgy
use
inth
edi
rect
wat
erse
rvic
esan
ddi
rect
stea
mus
eca
tego
ries
was
appr
oxim
atel
y12
.3qu
adri
llion
BT
Us
in20
10.A
nad
ditio
nal3
4.1
quad
sof
ener
gyw
asco
nsum
edin
the
indi
rect
stea
mus
eca
tego
ryfo
ron
-site
elec
tric
ityge
nera
tion,
indi
rect
proc
ess
heat
ing
and
spac
ehe
atin
g.N
ote:
dire
ctw
ater
and
stea
mse
rvic
esis
the
sum
ofth
edi
rect
wat
erse
rvic
ean
dth
edi
rect
stea
mus
eca
tego
ries
,whi
char
ein
divi
dual
lylis
ted
inth
esu
ppor
ting
docu
men
t(av
aila
ble
atst
acks
.iop.
org/
ER
L/7
/034
034/
mm
edia
).
Cat
egor
yD
escr
iptio
n
Wat
er-r
elat
eden
ergy
cons
umpt
ion
bypr
imar
yfu
el[t
rilli
onB
TU
]
Coa
lN
atur
alga
sO
ilR
enew
able
/oth
erSu
b-to
tal
Prim
ary
ener
gyfo
rpu
rcha
sed
elec
tric
ityTo
tale
nerg
yus
eE
rror
Res
iden
tial
Dir
ectw
ater
and
stea
mse
rvic
es0
1472
191
51
668
2802
447
0±
70In
dire
ctst
eam
use
2039
523
122
668
066
8±
100
Com
mer
cial
Dir
ectw
ater
and
stea
mse
rvic
es0
737
283
91
029
1812
284
1±
96In
dire
ctst
eam
use
5384
918
00
108
20
108
2±
162
Indu
stri
alD
irec
twat
eran
dst
eam
serv
ices
252
2366
1422
604
100
714
481
4±
324
Indi
rect
stea
mus
e75
318
3813
9696
408
30
408
3±
373
Pow
erD
irec
twat
eran
dst
eam
serv
ices
9610
250
158
3619
4±
19In
dire
ctst
eam
use
1966
220
5836
510
249
3233
4−
4050
2828
4±
1616
Tota
lD
irec
twat
eran
dst
eam
serv
ices
348
4585
1898
124
695
653
6412
319
±34
6In
dire
ctst
eam
use
2048
851
4021
7210
367
3816
7−
4050
3411
7±
1670
8

Environ. Res. Lett. 7 (2012) 034034 K T Sanders and M E Webber
Figure 3. This diagram summarizes the water-related energy flows in the United States included in the direct water services and directsteam use categories. Primary fuels (on the left) are used directly and indirectly via electricity generation for different purposes (on theright). The thickness of the flows is proportional to the amount of energy consumed. About 58% of the total energy consumption is lost aswaste heat. Note: the 5.4 quads used for electricity generation only includes retail electricity sold to residential, commercial and industrialcustomers; the primary energy consumed for electricity generated and used on-site is included in the sector where it was generated.
fuels consumed for US electricity generation in 2010 asreported in [25]. (On a primary energy basis this distributionis as follows: coal 47%, natural gas 19%, petroleum 1%,nuclear 21% and renewables 11%.) These assumptions arediscussed further in subsequent sections. Water-related energyconsumption considered in the indirect steam use category isnot included in the figure.
4. Results and discussion
Our analysis indicates that direct water-related energyconsumption (i.e. energy considered in the direct waterservices and the direct steam use categories) was 12.6%(12.3 ± 0.346 quads) of 2010 national primary energyconsumption. (Total primary energy consumption was 98.0quads for all sectors (including transportation) in 2010 [16].)Approximately 8.2 quads of energy was consumed for directwater services (see equation (1)) and about 4.1 quads wereconsumed in the direct steam use category (see equation (2)).An additional 34.1 quads of energy was consumed for indirectsteam use. Figure 2 summarizes the energy used in each ofthese three categories.
Table 3 details the water-related energy consumption ineach of the end-use sectors analyzed. Although water-relatedenergy in the transportation sector was not included in theanalysis, the majority of the energy consumed in this sectoris for petroleum-based transportation fuels, which would notbe considered within the scope of the analysis. An exceptionwould be fuel consumed for the transportation of waterproducts, but this energy consumption is not likely to be large.
Figure 3 summarizes the 12.3 quads of water-relatedenergy flows in the US for the direct water services and
direct steam use categories (Note that the indirect steam usecategory is not included). Primary fuels (on the left) areused directly and indirectly via retail electricity generationfor the three end-use sectors (on the middle-right). Thethickness of the flows is proportional to the amount of energyconsumed. In order to visualize primary retail electricityused in the Residential, Commercial and Industrial (whichincludes Power) sectors, primary electricity data from theEIA were proportioned to reflect the distribution of primaryfuels consumed to generate net US electricity in 2010 asreported in the EIA’s Annual Energy Review [25]. Losses atthe point of electricity generation were calculated using anormalized average national 2010 net heat rate of HRavg =
8830 BTU kWh−1 [25]. (Heat rate is weighted based on2010 heat rates for fossil-fuel and nuclear generators.)Approximately 56% (6955 trillion BTUs) of primary energywas burned directly for water; the remaining proportion (5364trillion BTUs) was converted into electricity for retail saleand then used for water. As figure 3 indicates, much of theprimary energy used in retail electricity production is lost aswaste heat. National electricity production in 2010 was 38.5%efficient based on the aforementioned average national heatrate. Of the useful electricity generation, an additional 6%–8%is lost during transmission and distribution [36], but theselosses are considered in figure 3 at the point-of-use, rather thanat the point of electricity generation.
Heating water consumed nearly three-fourths of theResidential sector’s and approximately one-third (35%) of theCommercial sector’s direct water-related energy, respectively.(Note that the proportions highlighted in the blue boxesof figure 3 reflect energy consumption at the point-of-use
9

Environ. Res. Lett. 7 (2012) 034034 K T Sanders and M E Webber
and do not include energy losses at the power plant. Seethe supporting information (available at stacks.iop.org/ERL/7/034034/mmedia) for details regarding the total primaryenergy use for each energy-consuming activity.) On-sitewater pumping was relatively low in the Residential sector,in comparison to the Industrial and Commercial sectors,as housing units tend to be smaller. Residential watersystems often operate off the prevailing pressure of the waterdistribution network, so often times pumps are not neededat all. Large industrial facilities and high-rise buildings, bycontrast, tend to require large quantities of energy to movewater around on-site.
Determining the average efficiency of each end-usesector required additional engineering assumptions as nationaldata sets do not detail specific water-related processes andtechnologies when they report energy consumption data. Weassume that electric power losses between the point of powergeneration and final end-use average 18% when averageelectric device end-use efficiencies are also considered. (Thisestimate assumes average transmission and distribution lossesand 10%–12% losses at end-use based on [36, 37].)
For on-site primary energy consumption, we estimatedefficiencies based on known, commercial-scale technologies.For example, according to the American Council for anEnergy-Efficient Economy (ACEEE), average residentialelectric and natural gas water heaters are 90% and 60%efficient, respectively; those fueled by petroleum by-products(namely fuel oil and liquid petroleum gas (LPG)) are about55% efficient [37]. The efficiency rating of a particularwater heater varies based on the effective transfer of thermalenergy from the heating element to the water, energy lossesduring storage, and the energy consumed by the device byswitching between active and idle modes and does not includepower plant losses or distribution losses. Additional energylosses occur during the conveyance of water from the waterheater to the point-of-use at a particular appliance withinthe home or facility. However, these losses vary a great dealdepending on piping network characteristics such as total pipelength, geometry and insulation properties, and the ambienttemperature around the pipe. Commercial water heatingefficiency varies considerably depending on the facility. Somehighly efficient commercial facilities have natural gas waterheaters approaching 75%, while less-efficient facilities arecomparable to average residential water heaters.
For the purpose of this analysis, we assume that theaverage end-use efficiency of non-electric energy consump-tion in the Residential, Commercial and Industrial/Powersectors were 55%, 65% and 45%, respectively. We base theseassumptions on the premise that Residential and Commercialsector water-related energy consumption is dominated bywater heating (discussed above), while the energy consumedin the Industrial and Power sectors is mainly in boilers to makesteam and generate electricity. Although, non-steam processesand devices in the Industrial and Power sectors tend to bemore efficient than in the Residential and Commercial sectorsdue to economies of scale, these processes consume much lessenergy than industrial steam boilers.
The efficiency of any boiler is sensitive to its size, ageand fuel type. New boilers typically fall in the range of
60%–85% efficient [27, 38]; however, two-thirds of large,industrial boilers are greater than 30 yr old and have muchlower efficiencies [26]. Efficiencies for electricity generationtechnologies in the industrial sector vary by technology butare generally in the range of 15% (for simple-cycle woodboilers) to 51% efficient for combined-cycle applications [38].Based on the literature [26, 27, 33, 38], we chose an averageend-use efficiency for the Industrial/Power sector of 45% as aconservative estimate.
Energy losses at the point of electricity generation,transmission and distribution, and end-use are representedby the quantity ‘rejected energy’ in figure 3. This quantityrepresents 58% of the total primary energy that was consumedfor water-related purposes in 2010. It is important to notethat this quantity reflects broad estimates about the averageefficiency of each sector’s water-related energy processes,which are extremely diverse, and is therefore subject touncertainty.
Useful observations can be derived from these generaltrends. Firstly, economies of scale, such as those inthe Industrial sector and large commercial facilities, aretypically more efficient than those that are smaller in scale,such as individual households. Secondly, when consideringend-to-end efficiency, it is much less energy-intensive toheat water by direct use of natural gas on-site, rather thanby using that natural gas to first make electricity that isused to heat water because of the large conversion lossesat power plants [39]. From the perspective of displacingfossil-fuel use, solar thermal water heater systems are evenmore advantageous.
5. Conclusion
This analysis is the first to quantify water-related energyconsumption in the US Residential, Commercial, Industrialand Power sectors, that differentiates consistently betweenprimary and secondary uses of energy-for-water, incorporatesthe relative efficiencies for power plants and direct use,integrates the most recent primary data and statistics collectedby relevant agencies, and allocates embedded energy from abroad range of relevant appliances and functions.
Results indicate that the energy embedded in the USwater system represents 12.3 ± 0.346 quads (12.6%) ofnational primary energy consumption in 2010. To put thisresult in context, 12.3 quads of energy is the equivalent annualenergy consumption of roughly 40 million Americans [40].We estimate that 5.4 quads of this primary energy(611 billion kWh delivered) were used to generate electricityfor pumping, treating, heating, cooling and pressurizing waterin the US, which is approximately 25% more energy thanis used for lighting in the Residential and Commercialsectors [40]. (Despite this equivalency, much more policyattention has been invested in energy-efficiency for lighting,rather than reducing hot water consumption or investing inenergy-efficient water heating methods, even though the lattermight have just as much impact.)
Future analyses will assess the opportunities forcarbon and energy reductions by water-conservation efforts,efficiency improvements, and new technologies. They will
10

Environ. Res. Lett. 7 (2012) 034034 K T Sanders and M E Webber
also include the increasing role of the bottled water industrywhich has large energy and carbon implications that werenot explored in this analysis [41]. Additionally, future workwill aim to identify a general framework for characterizingthe energy and carbon intensities of water systems basedon regional variability in geography, climate and policyframeworks. This extension of the analysis will becomeincreasingly significant as population growth, water-scarcityand increasing drinking water quality standards force regionalplanners to identify solutions for ensuring adequate drinkingwater to the US population without exacerbating energy andcarbon expenditures.
Acknowledgments
This work was sponsored by the Energy Foundation and theCynthia and George Mitchell Foundation. We also thank GaryKlein for his insight and expertise.
References
[1] Kenny J F, Barber N L, Hutson S S, Linsey K S,Lovelace J K and Maupin M A 2009 Estimated Use ofWater in the United States in 2005 (Reston, VA: USGS)
[2] EPA 2009 National Primary Drinking Water Regulations(Tech. Rep. EPA 816-F-09-004) (Washington, DC:US Environmental Protection Agency)
[3] Roberson J 2011 Environ. Sci. Technol. 45 154–60[4] Stillwell A, Twomey K, Osborne R, Greene D and
Webber M 2011 J. Water Reuse Desalination 1 208–23[5] Templin W, Herbert R, Stainaker C, Horn M and
Solley W 1997 Water use National Handbook ofRecommended Methods for Water Data Acquisition(Reston, VA: USGS) chapter 11 (http://pubs.usgs.gov/chapter11)
[6] Williams E 2004 Environ. Sci. Technol. 38 6166–74[7] Goldstein R and Smith W 2002 Water and Sustainability
Vol. 4: US Electricity Consumption for Water Supply andTreatment—The Next Half Century (Palo Alto, CA: ElectricPower Research Institute)
[8] EPA 2011 Clean Water Act (Washington, DC: USEnvironmental Protection Agency)
[9] Pellegrino J, Brueske S, Carole T and Andres H 2007 Energyand Environmental Profile of the US Petroleum RefiningIndustry (Columbia, MD: Energetics Inc.)
[10] California Energy Commission 2012 How an EvaporativeCooler Works (Sacramento, CA: Consumer Energy Center)(www.consumerenergycenter.org/home/heating cooling/evaporative.html)
[11] DOE 2011 Average energy intensity of public water suppliesby location (kWh per million gallons) Buildings EnergyData Book (Washington, DC: US Department of Energy)
[12] California Energy Commission 2005 California’s water-energyrelationship Tech. Rep. CEC-700-2005-011-SF(Sacramento, CA: California Energy Commission)
[13] Natural Resources Defense Council 2004 Energy Down theDrain. The Hidden Costs of California’s Water Supply(Oakland, CA: Natural Resources Defense Council)
[14] Griffiths-Sattenspiel B and Wilson W 2009 The CarbonFootprint of Water (Portland, OR: River Network)
[15] Stokes J R and Horvath A 2009 Environ. Sci. Technol.43 2680–7
[16] EIA 2011 Primary energy consumption estimates by source,selected years, 1949–2010 Annual Energy Review 2010(Washington, DC: US Energy Information Administration)
[17] DOE 2011 2010 residential energy end-use splits, by fuel typeBuildings Energy Data Book (Washington, DC: USDepartment of Energy)
[18] DOE 2011 2010 commercial energy end-use splits, by fueltype Buildings Energy Data Book (Washington, DC: USDepartment of Energy)
[19] EIA 2011 Industrial sector key indicators and consumptionAnnual Energy Outlook (Tech. Rep. EPA 816-F-09-004)(Washington, DC: US Energy Information Administration)
[20] EIA 2009 Residential Energy Consumption Survey(Washington, DC: US Energy Information Administration)
[21] EIA 2008 Commercial Buildings Energy Consumption Survey(Washington, DC: US Energy Information Administration)
[22] DOE 2011 Power Plant Operations Report: Form EIA-923(2011) (Washington, DC: US Department of Energy)
[23] Lekov A, Franco V and Meyers S 2010 Economics ofcondensing gas furnaces and water heaters potential inresidential single family homes ACEEE Summer Study onEnergy Efficiency in Buildings (Pacific Grove, CA, 15–20August 2010) pp 180–91
[24] Navigant 2007 The US Energy Information AdministrationTechnology Forecast Updates—Residential andCommercial Building Technologies—Reference Case,Second Edition (Revised) (Tech. Rep. 20070831.3)(Washington, DC: Navigant Consulting, Inc.)
[25] EIA 2011 Annual Energy Review 2010 (Tech. Rep.DOE/EIA-0384(2011)) (Washington, DC: US EnergyInformation Agency)
[26] EEA 2005 Characterization of the US Industrial/CommercialBoiler Population (Arlington, VA: Energy andEnvironmental Analysis, Inc.)
[27] DOE 2002 Best Practices: Steam Overview (Tech. Rep.DOE/GO-102002-1583) (Washington, DC: US Departmentof Energy)
[28] BCS 2002 Mining Industry of the Future: Energy andEnvironmental Profile of the US Mining Industry(Washington, DC: BCS, Inc.)
[29] EPA 2010 Available and Emerging Technologies for ReducingGreenhouse Gas Emissions From the Pulp and PaperManufacturing Industry (Washington, DC: USEnvironmental Protection Agency)
[30] Kramer K J, Masanet E, Xu T and Worrell E 2009 EnergyEfficiency Improvement and Cost Saving Opportunities forthe Pulp and Paper Industry (Tech. Rep. LBNL-2268E)(Berkeley, CA: Lawrence Berkeley National Laboratory)
[31] Okos M R and ACEEE 1998 Energy Usage in the FoodIndustry (Washington, DC: American Council for anEnergy-Efficient Economy)
[32] Worrell E, Phylipsen D, Einstein D and Martin N 2000 EnergyUse and Energy Intensity of the US Chemical Industry(Tech. Rep. LBNL-44314) (Berkeley, CA: Ernest OrlandoLawrence Berkeley National Laboratory)
[33] DOE 2002 Steam System Opportunity Assessment for the Pulpand Paper, Chemical Manufacturing, and PetroleumRefining Industries (Washington, DC: Office of EnergyEfficiency and Renewable Energy, The US Department ofEnergy)
[34] CCI 2003 Pulp and Paper—A Guide to Steam Conditioning(Rancho Santa Margarita, CA: Control Components Inc.)
[35] Lee L 2011 personal communication with Austin Energy[36] ABB 2007 Energy Efficiency in the Power Grid (Norwalk, CT:
ABB Inc.)[37] ACEEE 2012 Water Heating (Washington, DC: American
Council for an Energy-Efficient Economy) (http://aceee.org/node/3068)
[38] CIBO 2003 Energy Efficiency and Industrial Boiler Efficiency:An Industry Perspective (Warrenton, VA: Council ofIndustrial Boiler Owners)
[39] Czachorski M 2009 Source Energy and Emission Factors ForBuilding Consumption (Washington, DC: American GasAssociation)
[40] EIA 2008 US Residential Electricity Consumption by EndUse, 2008: Frequently Asked Questions (Washington, DC:US Energy Information Agency)
[41] Gleick P and Cooley H 2009 Environ. Res. Lett. 4 014009
11