evaluating the impact of interviewer observed auxiliary
TRANSCRIPT
BLSBUREAU OF LABOR STATISTICS
U . S . D E PA RT M E N T O F L A B O R
Evaluating the Impact of InterviewerObserved Auxiliary Information in
Nonresponse Adjustments2011 AAPOR Conference
May 13, 2011
Jeffrey M. Gonzalez
Office of Survey Methods Research
U.S. Bureau of Labor Statistics
Auxiliary Information in Nonresponse Adjustments – p. 1/49

BLSBUREAU OF LABOR STATISTICS
U . S . D E PA RT M E N T O F L A B O R
Outline
1. Introduction and motivation
2. Methods
3. Results(a) Summary statistics for CE data(b) Strength of correlations(c) Differences in point estimates(d) Impact on variances
4. Discussion
Auxiliary Information in Nonresponse Adjustments – p. 2/49

BLSBUREAU OF LABOR STATISTICS
U . S . D E PA RT M E N T O F L A B O R
Disclaimer
The views expressed in this presentation are thoseof the authors and do not necessarily reflect thepolicies of the U.S. Bureau of Labor Statistics.
Auxiliary Information in Nonresponse Adjustments – p. 3/49

BLSBUREAU OF LABOR STATISTICS
U . S . D E PA RT M E N T O F L A B O R
Outline
1. Introduction and motivation
2. Methods
3. Results(a) Summary statistics for CE data(b) Strength of correlations(c) Differences in point estimates(d) Impact on variances
4. Discussion
Auxiliary Information in Nonresponse Adjustments – p. 4/49

BLSBUREAU OF LABOR STATISTICS
U . S . D E PA RT M E N T O F L A B O R
Unit nonresponse
Occurs when the sample unit fails to respond tothe entire survey request
Three distinct causes of nonresponse (Groves,et al., 2004)1. Failure to deliver the survey request2. Refusal to participate3. Inability to participate
Auxiliary Information in Nonresponse Adjustments – p. 5/49

BLSBUREAU OF LABOR STATISTICS
U . S . D E PA RT M E N T O F L A B O R
Effects of nonresponse on survey products
Sometimes nonresponse adversely affectssurveys products and sometimes it does not
Negative consequences can include (Dillman,et al., 2002)
Biases in point estimatorsInflation of the variances of point estimatorsBiases in customary estimators of precision
Auxiliary Information in Nonresponse Adjustments – p. 6/49

BLSBUREAU OF LABOR STATISTICS
U . S . D E PA RT M E N T O F L A B O R
Compensating for nonresponse
Survey design strategies (Groves, et al., 2004)Offering multiple modes of data collectionVarying the number and timing of contactattemptsOffering incentives
Statistical adjustments to estimates (Dillman, etal., 2002)
Typically involve assigning a nonresponseweight to each respondent and thencomputing a weighted estimate based onthese weights
Auxiliary Information in Nonresponse Adjustments – p. 7/49
BLSBUREAU OF LABOR STATISTICS
U . S . D E PA RT M E N T O F L A B O R
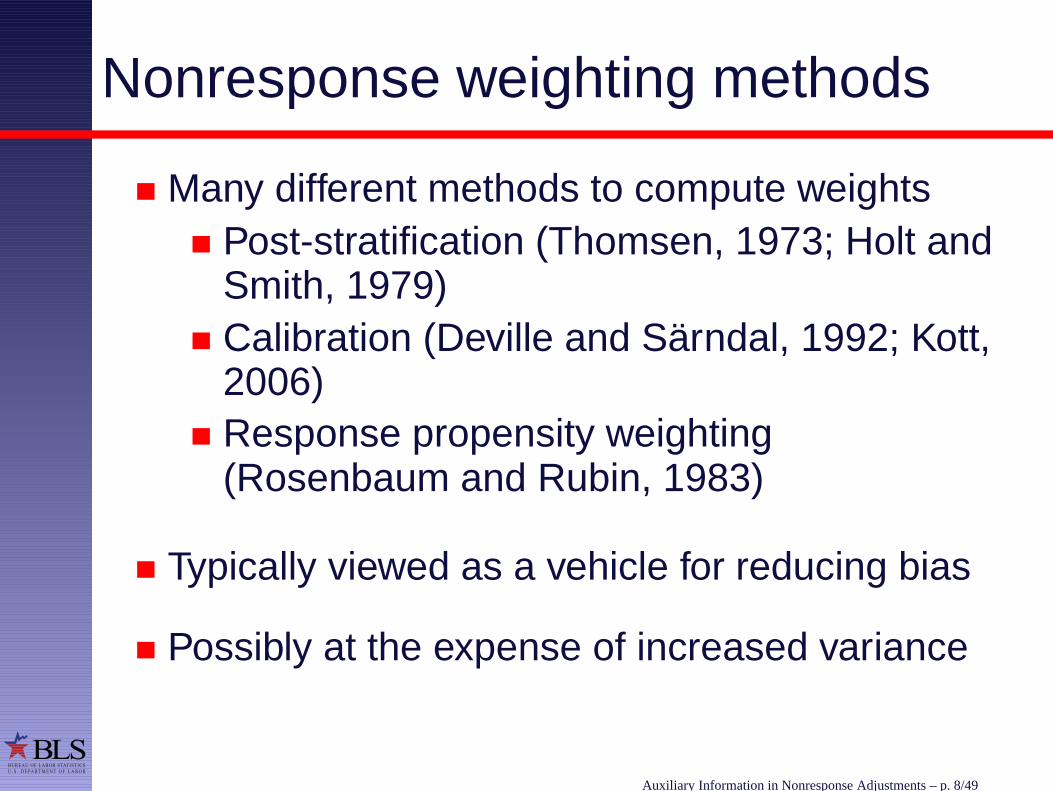
Nonresponse weighting methods
Many different methods to compute weightsPost-stratification (Thomsen, 1973; Holt andSmith, 1979)Calibration (Deville and Särndal, 1992; Kott,2006)Response propensity weighting(Rosenbaum and Rubin, 1983)
Typically viewed as a vehicle for reducing bias
Possibly at the expense of increased variance
Auxiliary Information in Nonresponse Adjustments – p. 8/49

BLSBUREAU OF LABOR STATISTICS
U . S . D E PA RT M E N T O F L A B O R
Characteristics of effective auxiliary infor-mation
Summarized from Little and Vartivarian, 2005
Auxiliary Information in Nonresponse Adjustments – p. 9/49
BLSBUREAU OF LABOR STATISTICS
U . S . D E PA RT M E N T O F L A B O R
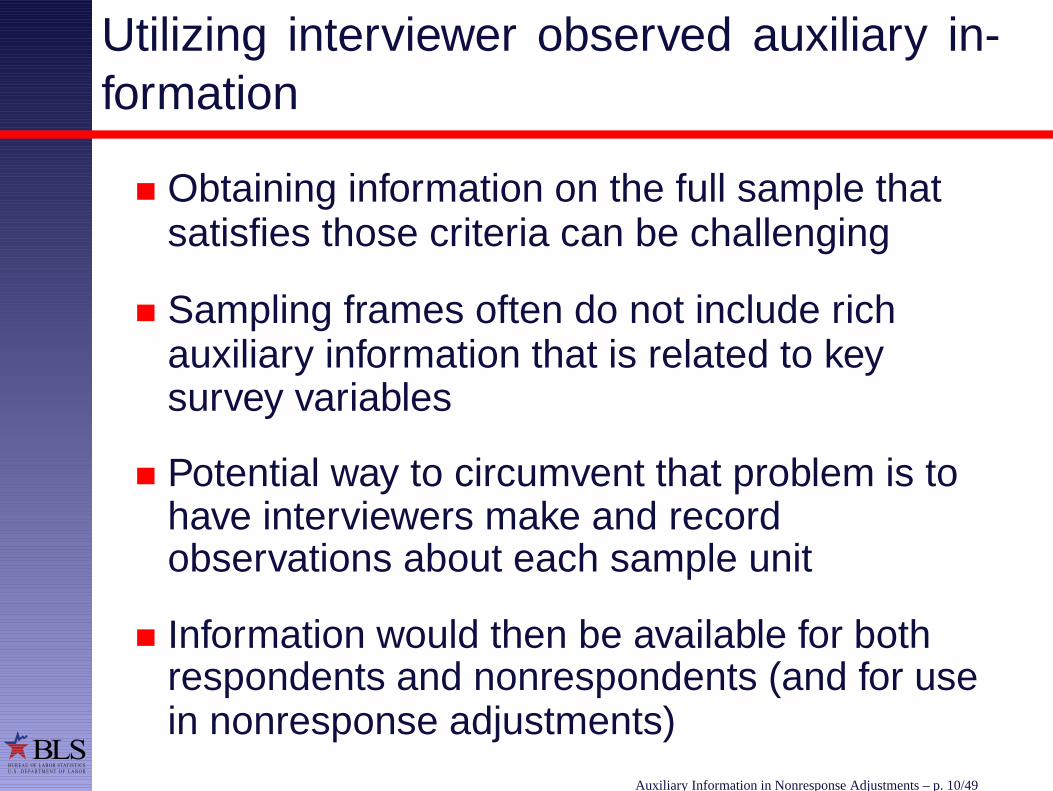
Utilizing interviewer observed auxiliary in-formation
Obtaining information on the full sample thatsatisfies those criteria can be challenging
Sampling frames often do not include richauxiliary information that is related to keysurvey variables
Potential way to circumvent that problem is tohave interviewers make and recordobservations about each sample unit
Information would then be available for bothrespondents and nonrespondents (and for usein nonresponse adjustments)
Auxiliary Information in Nonresponse Adjustments – p. 10/49

BLSBUREAU OF LABOR STATISTICS
U . S . D E PA RT M E N T O F L A B O R
Previous research involving interviewer col-lected auxiliary information
Kreuter, et al. (2010)Present results from five projectsReplication of methods from this paper
West, B. (2010); Casas-Cordero, C. (2010)Investigate measurement error in interviewerjudgmentsEffectiveness of information in nonresponseadjustmentsImplications of measurement error for theeffectiveness
Auxiliary Information in Nonresponse Adjustments – p. 11/49

BLSBUREAU OF LABOR STATISTICS
U . S . D E PA RT M E N T O F L A B O R
Application to the Consumer ExpenditureSurvey (CE)
Personal visit interview in which interviewersmake observations about sample units
Among the information collected/observed is:Whether the sample unit owns/rents his/herunit (tenure)Perceived concerns about participating inthe survey
Possible that this information could be relatedto both response propensity and key surveyoutcomes (e.g., expenditures)
Auxiliary Information in Nonresponse Adjustments – p. 12/49

BLSBUREAU OF LABOR STATISTICS
U . S . D E PA RT M E N T O F L A B O R
Purpose of research
Investigate the value of incorporatinginterviewer observed auxiliary information into anonresponse adjustment for the CE
To accomplish this, we will:Examine the strength of bivariatecorrelationsCompare point estimates with and withoutinformationEvaluate the impact on variances
Auxiliary Information in Nonresponse Adjustments – p. 13/49

BLSBUREAU OF LABOR STATISTICS
U . S . D E PA RT M E N T O F L A B O R
Outline
1. Introduction and motivation
2. Methods
3. Results(a) Summary statistics for CE data(b) Strength of correlations(c) Differences in point estimates(d) Impact on variances
4. Discussion
Auxiliary Information in Nonresponse Adjustments – p. 14/49
BLSBUREAU OF LABOR STATISTICS
U . S . D E PA RT M E N T O F L A B O R
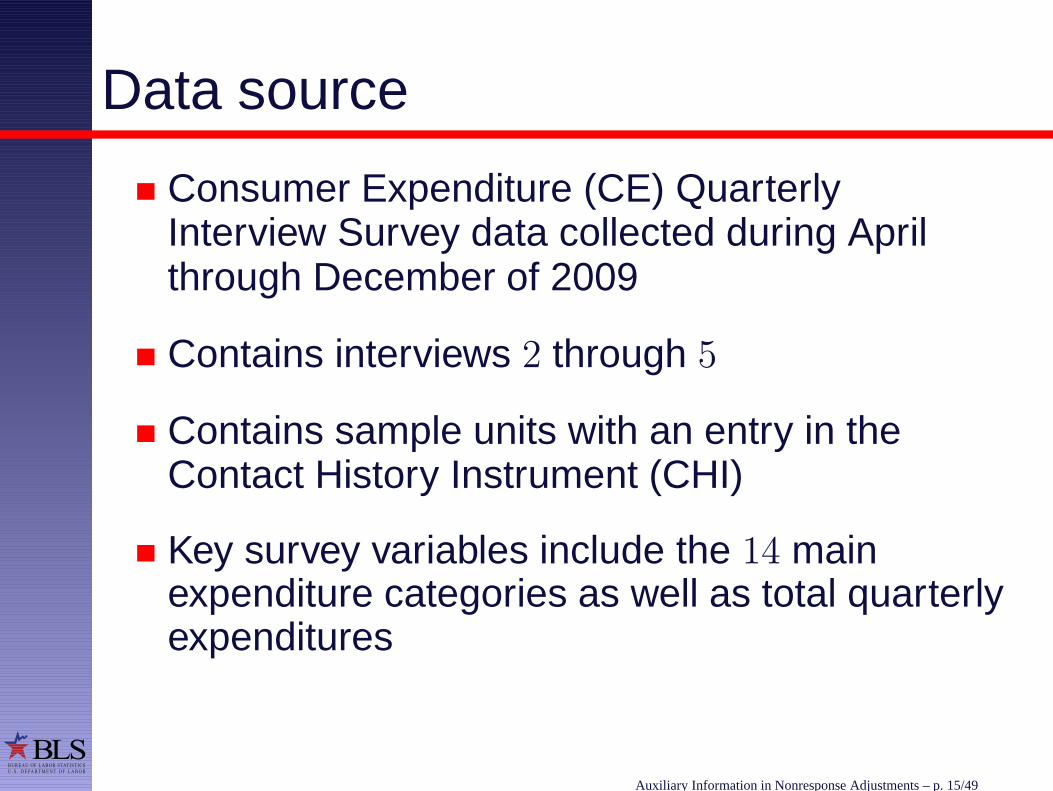
Data source
Consumer Expenditure (CE) QuarterlyInterview Survey data collected during Aprilthrough December of 2009
Contains interviews 2 through 5
Contains sample units with an entry in theContact History Instrument (CHI)
Key survey variables include the 14 mainexpenditure categories as well as total quarterlyexpenditures
Auxiliary Information in Nonresponse Adjustments – p. 15/49
BLSBUREAU OF LABOR STATISTICS
U . S . D E PA RT M E N T O F L A B O R
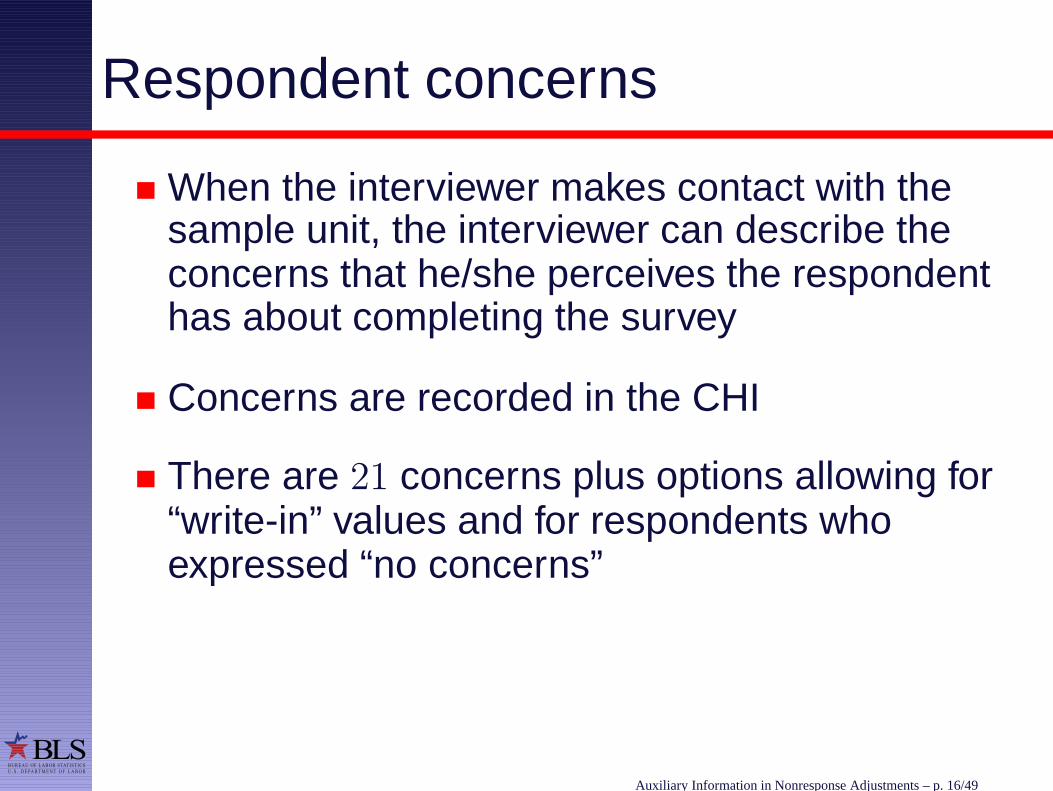
Respondent concerns
When the interviewer makes contact with thesample unit, the interviewer can describe theconcerns that he/she perceives the respondenthas about completing the survey
Concerns are recorded in the CHI
There are 21 concerns plus options allowing for“write-in” values and for respondents whoexpressed “no concerns”
Auxiliary Information in Nonresponse Adjustments – p. 16/49

BLSBUREAU OF LABOR STATISTICS
U . S . D E PA RT M E N T O F L A B O R
Respondent concerns CHI screen
Auxiliary Information in Nonresponse Adjustments – p. 17/49
BLSBUREAU OF LABOR STATISTICS
U . S . D E PA RT M E N T O F L A B O R
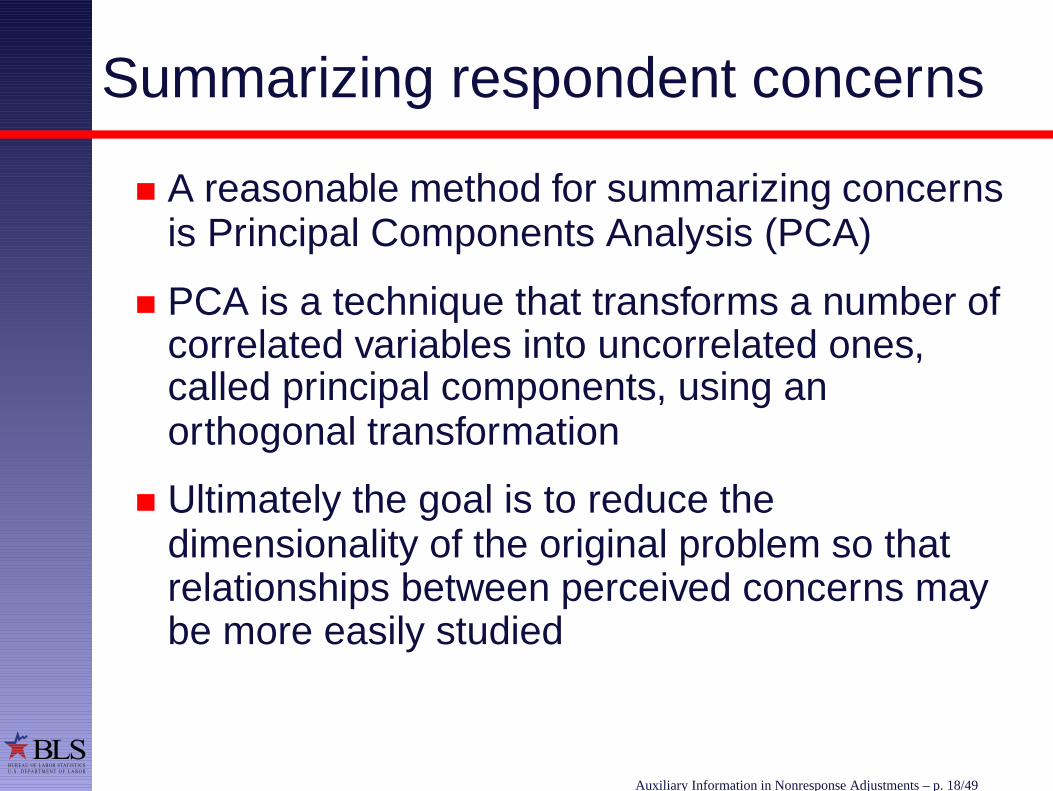
Summarizing respondent concerns
A reasonable method for summarizing concernsis Principal Components Analysis (PCA)
PCA is a technique that transforms a number ofcorrelated variables into uncorrelated ones,called principal components, using anorthogonal transformation
Ultimately the goal is to reduce thedimensionality of the original problem so thatrelationships between perceived concerns maybe more easily studied
Auxiliary Information in Nonresponse Adjustments – p. 18/49

BLSBUREAU OF LABOR STATISTICS
U . S . D E PA RT M E N T O F L A B O R
Perceived Concerns Index (PCI)
The PCI for the ith consumer unit (CU) becomes:
PCIi =R∑
j=1
wjPCij
where:
R is the number of retained principalcomponents
wj is the weight of the jth principal componentscore (ratio of variance explained by PCj andtotal variance explained by all retained principalcomponents)
Auxiliary Information in Nonresponse Adjustments – p. 19/49

BLSBUREAU OF LABOR STATISTICS
U . S . D E PA RT M E N T O F L A B O R
Bivariate correlations
All sample cases for which auxiliary informationis available are used to estimate thecorrelations between the auxiliary information,z, and the response indicator, p
This correlation is denoted as ρ(z, p)
The correlation between the auxiliaryinformation and the key survey outcomes, y,can only be estimated from respondents
This correlation is denoted as ρ(z, y)
Auxiliary Information in Nonresponse Adjustments – p. 20/49
BLSBUREAU OF LABOR STATISTICS
U . S . D E PA RT M E N T O F L A B O R
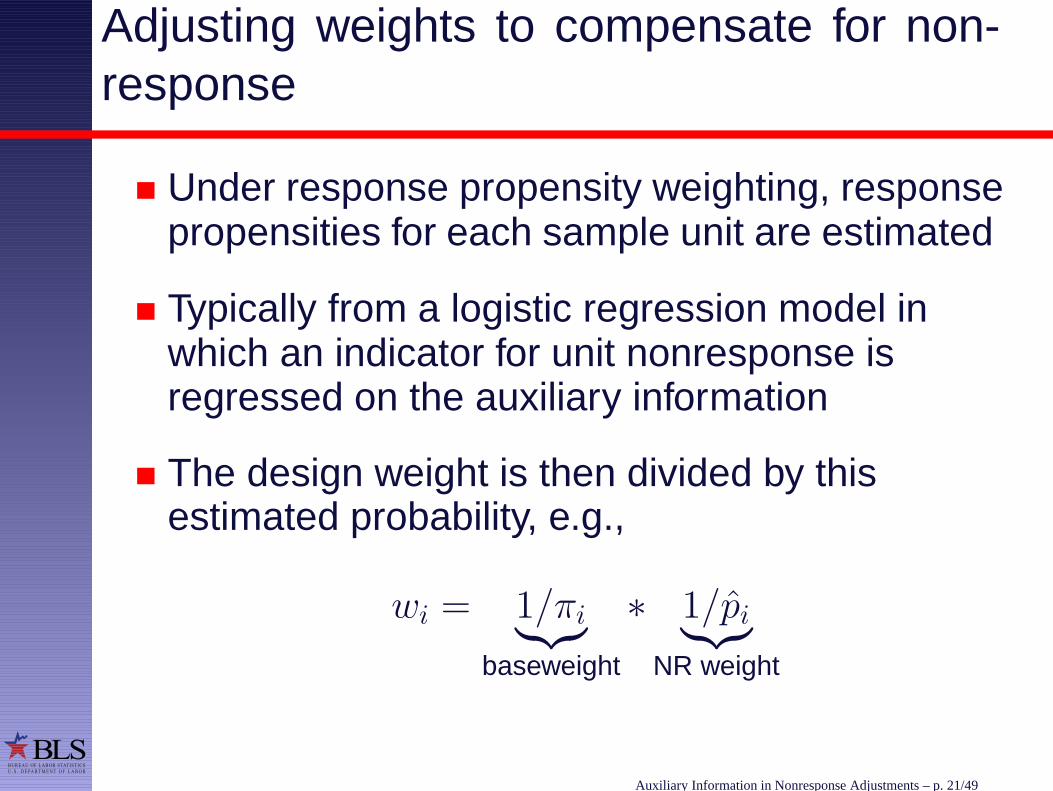
Adjusting weights to compensate for non-response
Under response propensity weighting, responsepropensities for each sample unit are estimated
Typically from a logistic regression model inwhich an indicator for unit nonresponse isregressed on the auxiliary information
The design weight is then divided by thisestimated probability, e.g.,
wi = 1/πi︸︷︷︸
baseweight
∗ 1/pi︸︷︷︸
NR weight
Auxiliary Information in Nonresponse Adjustments – p. 21/49

BLSBUREAU OF LABOR STATISTICS
U . S . D E PA RT M E N T O F L A B O R
Estimation of response propensities
We estimated response propensities using fourdifferent logistic regression models:
1. logit(pT i) = β0 +4∑
j=2
β1j ∗ REGIONij
2. logit(pOi) =
β0 +4∑
j=2
β1j ∗ REGIONij + β2 ∗ TENUREi
Auxiliary Information in Nonresponse Adjustments – p. 22/49

BLSBUREAU OF LABOR STATISTICS
U . S . D E PA RT M E N T O F L A B O R
Estimation of response propensities (2)
3. logit(pPi) = β0 +4∑
j=2
β1j ∗ REGIONij + β2 ∗ PCIi
4. logit(pBi) =
β0 +4∑
j=2
β1j ∗ REGIONij + β2 ∗ TENUREi
+β3 ∗ PCIi
Auxiliary Information in Nonresponse Adjustments – p. 23/49
BLSBUREAU OF LABOR STATISTICS
U . S . D E PA RT M E N T O F L A B O R
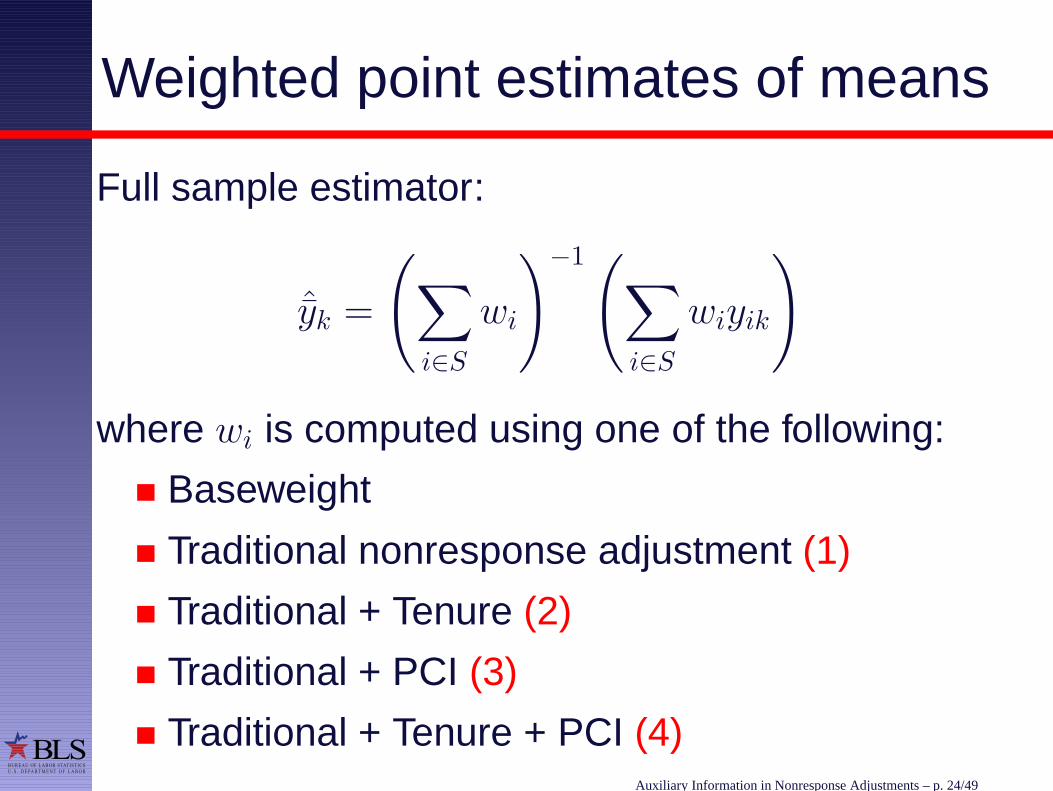
Weighted point estimates of means
Full sample estimator:
ˆyk =
(∑
i∈S
wi
)−1(
∑
i∈S
wiyik
)
where wi is computed using one of the following:
Baseweight
Traditional nonresponse adjustment (1)
Traditional + Tenure (2)
Traditional + PCI (3)
Traditional + Tenure + PCI (4)Auxiliary Information in Nonresponse Adjustments – p. 24/49
BLSBUREAU OF LABOR STATISTICS
U . S . D E PA RT M E N T O F L A B O R
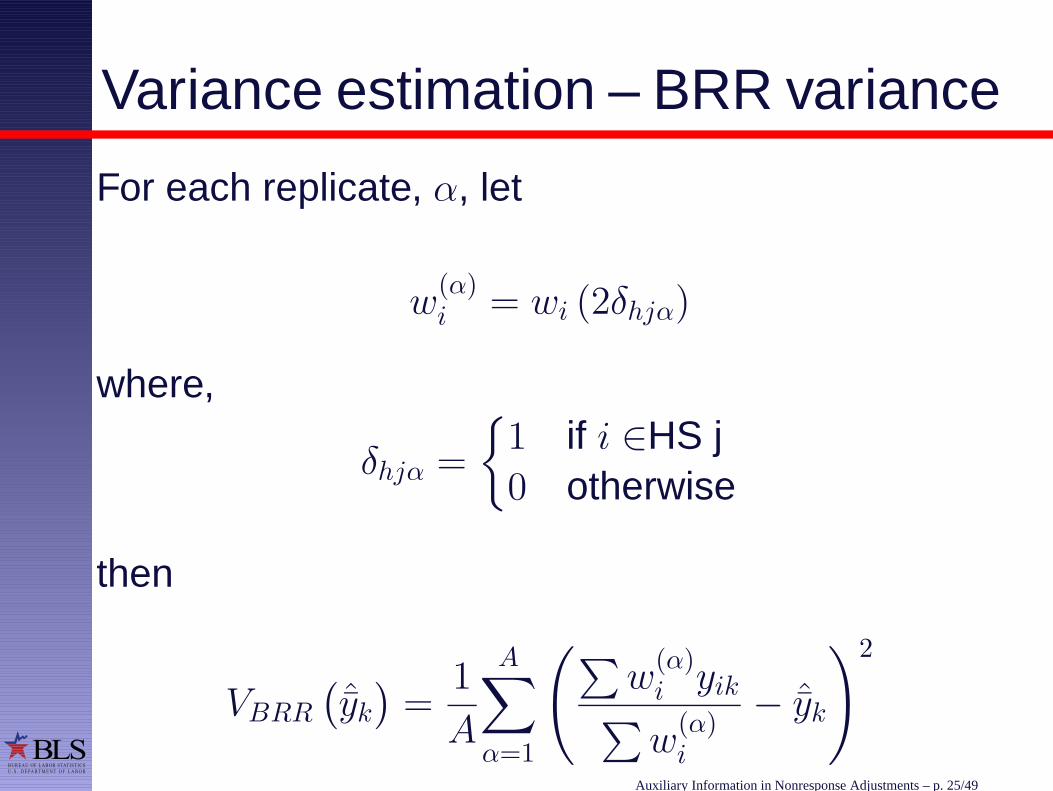
Variance estimation – BRR variance
For each replicate, α, let
w(α)i = wi (2δhjα)
where,
δhjα =
{1 if i ∈HS j0 otherwise
then
VBRR
(ˆyk)=
1
A
A∑
α=1
(∑w
(α)i yik
∑w
(α)i
− ˆyk
)2
Auxiliary Information in Nonresponse Adjustments – p. 25/49

BLSBUREAU OF LABOR STATISTICS
U . S . D E PA RT M E N T O F L A B O R
Outline
1. Introduction and motivation
2. Methods
3. Results(a) Summary statistics for CE data(b) Strength of correlations(c) Differences in point estimates(d) Impact on variances
4. Discussion
Auxiliary Information in Nonresponse Adjustments – p. 26/49

BLSBUREAU OF LABOR STATISTICS
U . S . D E PA RT M E N T O F L A B O R
Summary of expenditure categories
Expenditure Category Baseweighted Variance (SE) Share
Total 11,499.73 27,940.90 (167.16) 100
Housing 3,981.75 3,744.18 (61.19) 34.62
Transportation 1,881.32 2098.74 (45.81) 16.36
Food 1,749.21 362.90 (19.05) 15.21
Insurance 1,172.47 1,008.74 (31.76) 10.20
Health care 771.80 296.38 (17.22) 6.71
Entertainment 580.77 231.61 (15.22) 5.05
Cash contributions 402.91 514.17 (22.68) 3.50
Apparel and services 256.76 37.94 (6.16) 2.23
Education 239.44 151.38 (12.30) 2.08
Miscellaneous 183.65 32.97 (5.74) 1.60
Tobacco 93.09 9.10 (3.02) 0.81
Alcoholic beverages 86.26 10.97 (3.31) 0.73
Personal care 75.87 3.99 (1.99) 0.66
Reading 27.00 0.92 (0.96) 0.23Auxiliary Information in Nonresponse Adjustments – p. 27/49

BLSBUREAU OF LABOR STATISTICS
U . S . D E PA RT M E N T O F L A B O R
Reporting rates of perceived concerns
Perceived Concern Proportion Std. Dev
22 - No concern perceived 0.578 0.494
2 - Too busy 0.123 0.329
1 - Not interested 0.114 0.317
7 - Privacy concerns 0.072 0.259
3 - INTV too time consuming 0.066 0.249
5 - Scheduling difficulty 0.066 0.249
6 - Survey voluntary 0.052 0.221
23 - Other 0.046 0.210
19 - Too many INTVs 0.043 0.203
8 - Anti-government 0.036 0.186
21 - Intends to quit survey 0.025 0.155
11 - Hangs up; slams door 0.021 0.143
12 - Hostile; threatening 0.021 0.143
18 - Too many personal Q previously 0.017 0.131
14 - Talk to specific HH member 0.016 0.124Auxiliary Information in Nonresponse Adjustments – p. 28/49

BLSBUREAU OF LABOR STATISTICS
U . S . D E PA RT M E N T O F L A B O R
Outline
1. Introduction and motivation
2. Methods
3. Results(a) Summary statistics for CE data(b) Strength of correlations(c) Differences in point estimates(d) Impact on variances
4. Discussion
Auxiliary Information in Nonresponse Adjustments – p. 29/49

BLSBUREAU OF LABOR STATISTICS
U . S . D E PA RT M E N T O F L A B O R
Cross-tabulation of CU tenure by response
Respondents (1) Nonrespondents (0) Total
Owner (1) 13,604 (73.8%) 4,816 18,420
Renter (0) 6,705 (76.7%) 2,034 8,739
Total 20,309 (74.8%) 6,850 27,159
Note that ρ(z, p) = −0.0309
Auxiliary Information in Nonresponse Adjustments – p. 30/49
BLSBUREAU OF LABOR STATISTICS
U . S . D E PA RT M E N T O F L A B O R
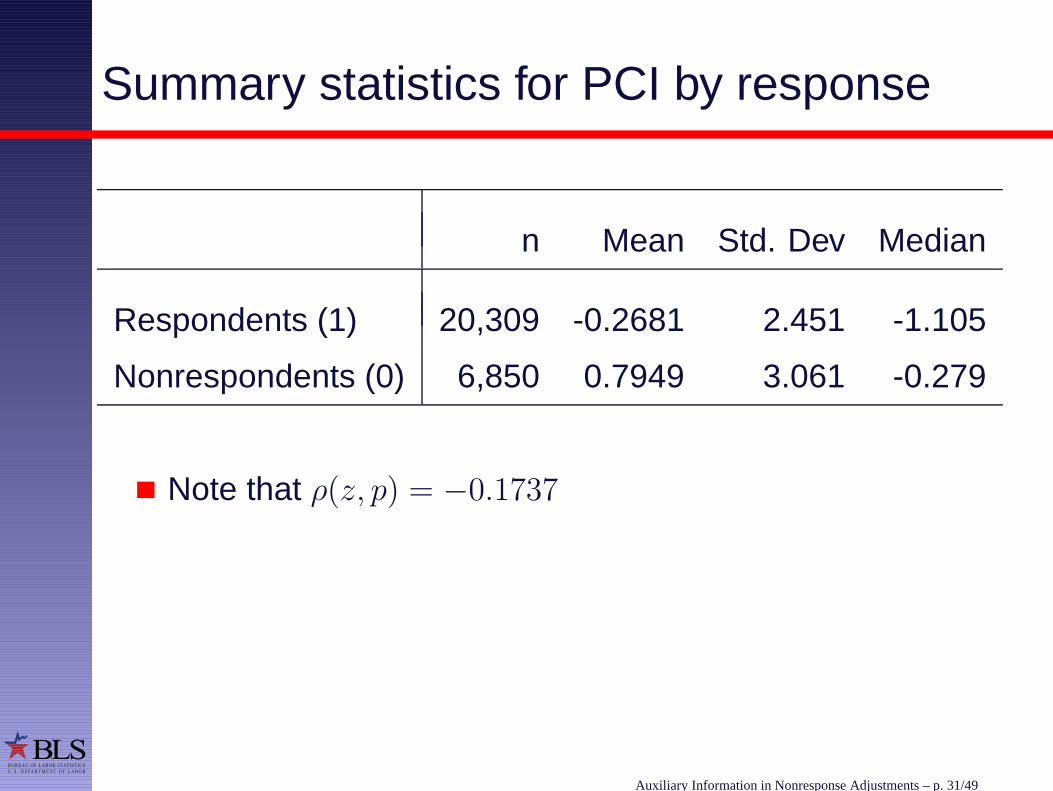
Summary statistics for PCI by response
n Mean Std. Dev Median
Respondents (1) 20,309 -0.2681 2.451 -1.105
Nonrespondents (0) 6,850 0.7949 3.061 -0.279
Note that ρ(z, p) = −0.1737
Auxiliary Information in Nonresponse Adjustments – p. 31/49

BLSBUREAU OF LABOR STATISTICS
U . S . D E PA RT M E N T O F L A B O R
Correlations of expenditure categories witheach of tenure and PCI
Expenditure Category Tenure PCI
Total (sum of all major categories) 0.2529 -0.0273
Housing (including shelter, utilities, etc.) 0.1657 0.0064
Transportation 0.1155 -0.0239
Food (at and away from home) 0.2128 0.0268
Personal insurance and pensions 0.2025 -0.0460
Health care 0.2109 -0.0146
Entertainment 0.1119 -0.0318
Cash contributions 0.0707 -0.0010
Apparel and services 0.0632 -0.0231
Education 0.0421 -0.0058
Miscellaneous 0.0598 -0.0172
Tobacco and smoking -0.0284 -0.0287
Alcoholic beverages 0.0415 -0.0288
Personal care 0.1530 -0.0215
Reading 0.1144 -0.0344Auxiliary Information in Nonresponse Adjustments – p. 32/49
BLSBUREAU OF LABOR STATISTICS
U . S . D E PA RT M E N T O F L A B O R
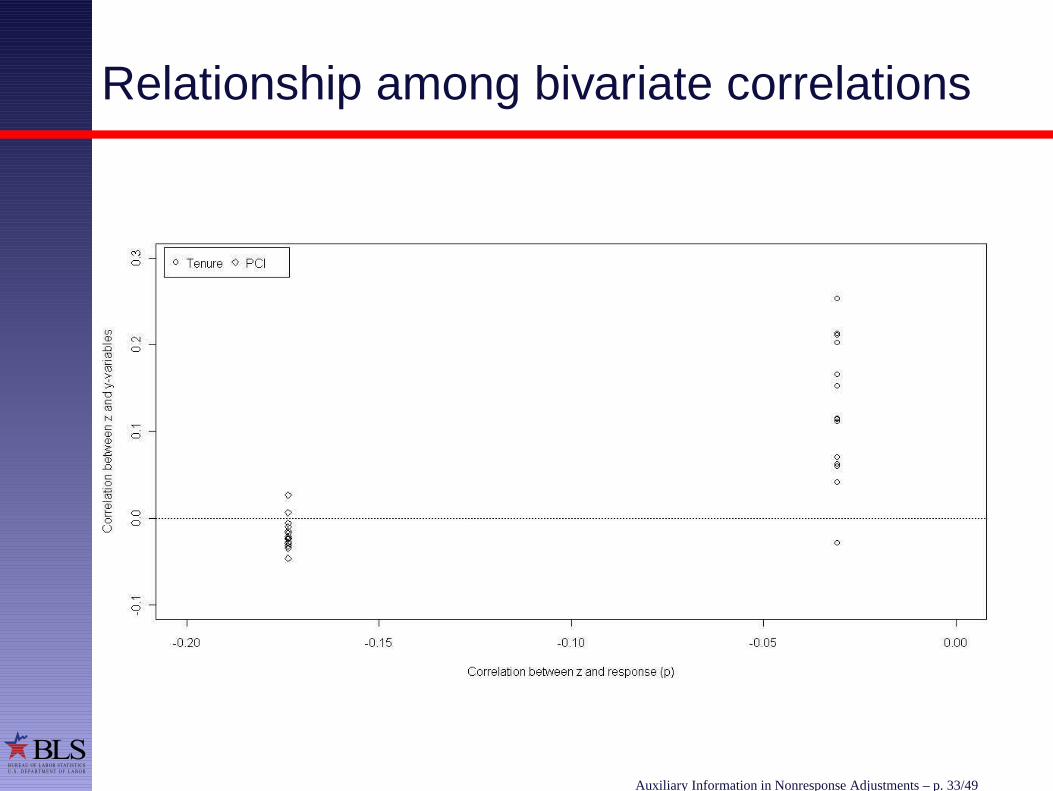
Relationship among bivariate correlations
Auxiliary Information in Nonresponse Adjustments – p. 33/49
BLSBUREAU OF LABOR STATISTICS
U . S . D E PA RT M E N T O F L A B O R
Outline
1. Introduction and motivation
2. Methods
3. Results(a) Summary statistics for CE data(b) Strength of correlations(c) Differences in point estimates(d) Impact on variances
4. Discussion
Auxiliary Information in Nonresponse Adjustments – p. 34/49
BLSBUREAU OF LABOR STATISTICS
U . S . D E PA RT M E N T O F L A B O R
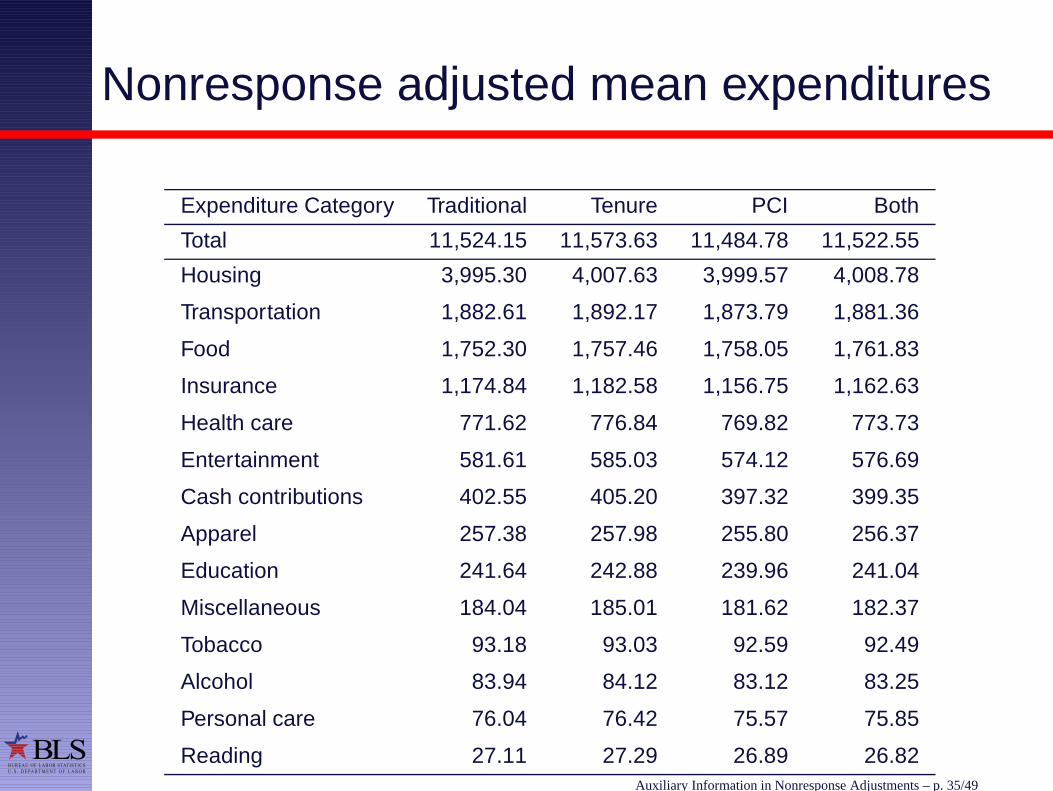
Nonresponse adjusted mean expenditures
Expenditure Category Traditional Tenure PCI Both
Total 11,524.15 11,573.63 11,484.78 11,522.55
Housing 3,995.30 4,007.63 3,999.57 4,008.78
Transportation 1,882.61 1,892.17 1,873.79 1,881.36
Food 1,752.30 1,757.46 1,758.05 1,761.83
Insurance 1,174.84 1,182.58 1,156.75 1,162.63
Health care 771.62 776.84 769.82 773.73
Entertainment 581.61 585.03 574.12 576.69
Cash contributions 402.55 405.20 397.32 399.35
Apparel 257.38 257.98 255.80 256.37
Education 241.64 242.88 239.96 241.04
Miscellaneous 184.04 185.01 181.62 182.37
Tobacco 93.18 93.03 92.59 92.49
Alcohol 83.94 84.12 83.12 83.25
Personal care 76.04 76.42 75.57 75.85
Reading 27.11 27.29 26.89 26.82Auxiliary Information in Nonresponse Adjustments – p. 35/49

BLSBUREAU OF LABOR STATISTICS
U . S . D E PA RT M E N T O F L A B O R
Comparing the effect of incorporating theauxiliary information into the weights
Compute and plot the following two quantitiesagainst each other:
1.
∣∣∣∣
ˆywr(xz)−ˆy
wr(x)
SE(ˆywr(x))
∣∣∣∣
2. ρ (pxz, y)− ρ (px, y)
Auxiliary Information in Nonresponse Adjustments – p. 36/49

BLSBUREAU OF LABOR STATISTICS
U . S . D E PA RT M E N T O F L A B O R
Shift in weighted point estimates
Auxiliary Information in Nonresponse Adjustments – p. 37/49

BLSBUREAU OF LABOR STATISTICS
U . S . D E PA RT M E N T O F L A B O R
Outline
1. Introduction and motivation
2. Methods
3. Results(a) Summary statistics for CE data(b) Strength of correlations(c) Differences in point estimates(d) Impact on variances
4. Discussion
Auxiliary Information in Nonresponse Adjustments – p. 38/49

BLSBUREAU OF LABOR STATISTICS
U . S . D E PA RT M E N T O F L A B O R
Ratio of variances
To study the impact of incorporating the interviewerobserved auxiliary information into the nonresponseadjustment we compute the following, which is aratio of BRR variances:
R =V ar
(ˆywr(x)
)
V ar(ˆywr(xz)
)
Auxiliary Information in Nonresponse Adjustments – p. 39/49

BLSBUREAU OF LABOR STATISTICS
U . S . D E PA RT M E N T O F L A B O R
BRR variance estimates (Tenure)
Expenditure Traditional Variance (SE) Tenure Variance (SE) R
Total 26,892.10 (163.99) 28,424.06 (168.59) 0.946
Housing 3,357.74 (57.95) 3,325.00 (57.66) 1.010
Transportation 2,109.53 (45.93) 2,293.32 (47.89) 0.920
Food 345.72 (18.59) 359.56 (18.96) 0.962
Insurance 968.39 (31.12) 914.84 (30.25) 1.059
Health care 295.41 (17.19) 349.69 (18.70) 0.845
Entertainment 227.95 (15.10) 227.66 (15.09) 1.001
Cash contributions 512.51 (22.64) 530.76 (23.04) 0.966
Apparel 37.95 (6.16) 38.71 (6.22) 0.981
Education 139.80 (11.82) 137.53 (11.73) 1.017
Miscellaneous 33.08 (5.75) 34.69 (5.89) 0.954
Tobacco 9.25 (3.04) 9.01 (3.00) 1.026
Alcohol 10.62 (3.26) 10.45 (3.23) 1.016
Personal care 3.80 (1.95) 3.57 (1.89) 1.063
Reading 0.92 (0.96) 0.98 (0.99) 0.941Auxiliary Information in Nonresponse Adjustments – p. 40/49
BLSBUREAU OF LABOR STATISTICS
U . S . D E PA RT M E N T O F L A B O R
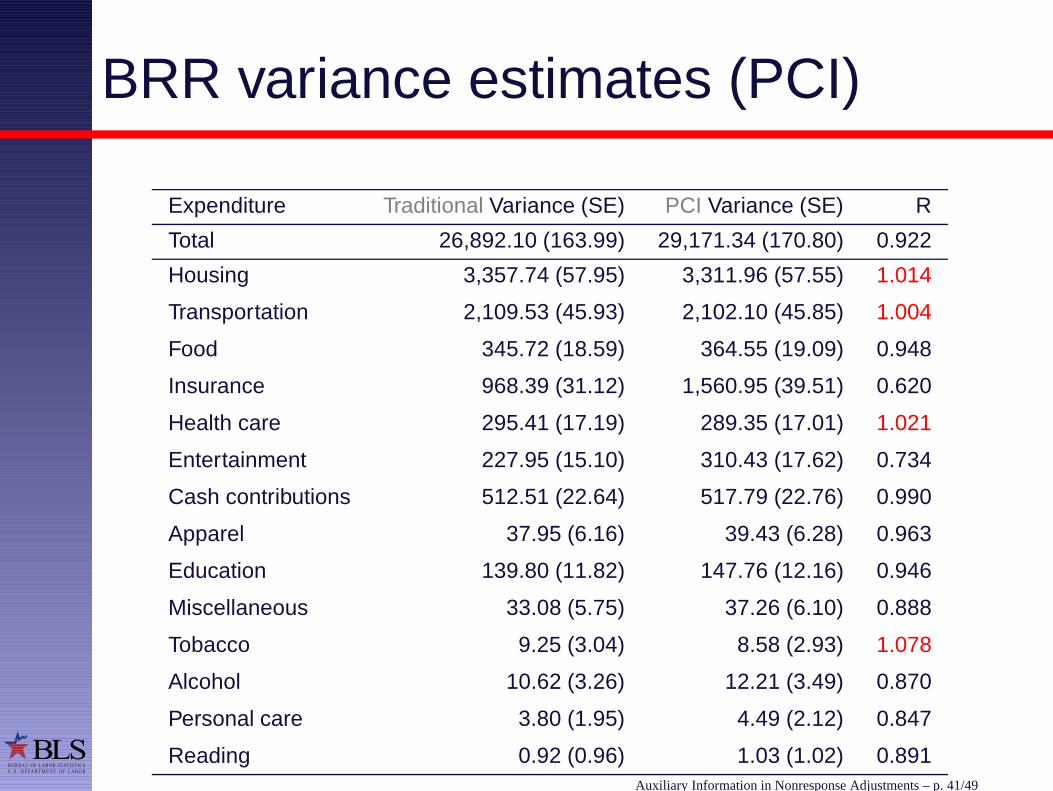
BRR variance estimates (PCI)
Expenditure Traditional Variance (SE) PCI Variance (SE) R
Total 26,892.10 (163.99) 29,171.34 (170.80) 0.922
Housing 3,357.74 (57.95) 3,311.96 (57.55) 1.014
Transportation 2,109.53 (45.93) 2,102.10 (45.85) 1.004
Food 345.72 (18.59) 364.55 (19.09) 0.948
Insurance 968.39 (31.12) 1,560.95 (39.51) 0.620
Health care 295.41 (17.19) 289.35 (17.01) 1.021
Entertainment 227.95 (15.10) 310.43 (17.62) 0.734
Cash contributions 512.51 (22.64) 517.79 (22.76) 0.990
Apparel 37.95 (6.16) 39.43 (6.28) 0.963
Education 139.80 (11.82) 147.76 (12.16) 0.946
Miscellaneous 33.08 (5.75) 37.26 (6.10) 0.888
Tobacco 9.25 (3.04) 8.58 (2.93) 1.078
Alcohol 10.62 (3.26) 12.21 (3.49) 0.870
Personal care 3.80 (1.95) 4.49 (2.12) 0.847
Reading 0.92 (0.96) 1.03 (1.02) 0.891Auxiliary Information in Nonresponse Adjustments – p. 41/49

BLSBUREAU OF LABOR STATISTICS
U . S . D E PA RT M E N T O F L A B O R
BRR variance estimates (Both)
Expenditure Traditional Variance (SE) Both Variance (SE) R
Total 26,892.10 (163.99) 26,924.15 (164.09) 0.999
Housing 3,357.74 (57.95) 3,337.44 (57.77) 1.006
Transportation 2,109.53 (45.93) 2,099.06 (45.82) 1.005
Food 345.72 (18.59) 413.00 (20.32) 0.837
Insurance 968.39 (31.12) 1,296.50 (36.01) 0.747
Health care 295.41 (17.19) 310.78 (17.63) 0.951
Entertainment 227.95 (15.10) 269.49 (16.42) 0.846
Cash contributions 512.51 (22.64) 509.26 (22.57) 1.006
Apparel 37.95 (6.16) 38.33 (6.19) 0.990
Education 139.80 (11.82) 142.02 (11.92) 0.984
Miscellaneous 33.08 (5.75) 34.71 (5.89) 0.953
Tobacco 9.25 (3.04) 8.53 (2.92) 1.084
Alcohol 10.62 (3.26) 11.88 (3.45) 0.894
Personal care 3.80 (1.95) 4.02 (2.01) 0.944
Reading 0.92 (0.96) 0.96 (0.98) 0.959Auxiliary Information in Nonresponse Adjustments – p. 42/49
BLSBUREAU OF LABOR STATISTICS
U . S . D E PA RT M E N T O F L A B O R
Outline
1. Introduction and motivation
2. Methods
3. Results(a) Summary statistics for CE data(b) Strength of correlations(c) Differences in point estimates(d) Impact on variances
4. Discussion
Auxiliary Information in Nonresponse Adjustments – p. 43/49

BLSBUREAU OF LABOR STATISTICS
U . S . D E PA RT M E N T O F L A B O R
Summary of results
Overall the correlations are weak and do notshow the strength needed for an effectivenonresponse adjustment
PCI was more correlated with response, whiletenure status was more correlated with the keysurvey variables
Auxiliary Information in Nonresponse Adjustments – p. 44/49

BLSBUREAU OF LABOR STATISTICS
U . S . D E PA RT M E N T O F L A B O R
Summary of results (2)
We see an increase in the movement of theweighted estimate with increasing change inthe correlation of the estimated propensityscore and the outcome variables
Variance estimate for total expendituresgenerally increases as additional information isadded to the nonresponse adjusted weights, butfor some individual categories there appears tobe the potential for a variance reduction
Auxiliary Information in Nonresponse Adjustments – p. 45/49

BLSBUREAU OF LABOR STATISTICS
U . S . D E PA RT M E N T O F L A B O R
Limitations
Did not consider the measurement errorproperties of the interviewer observations
Focused only on changes in estimates of meanexpenditures, different results might beobtained if interest lies in regressioncoefficients or other quantities
No direct assessment of bias, since trueexpenditure value is not available
Auxiliary Information in Nonresponse Adjustments – p. 46/49

BLSBUREAU OF LABOR STATISTICS
U . S . D E PA RT M E N T O F L A B O R
Acknowledgments
The authors would also like to thank AshleyBowers, John Eltinge, Scott Fricker, Patsy Gregory,Brandon Kopp, Bill Mockovak, Polly Phipps, SallyReyes-Morales, Adam Safir, Lucilla Tan, DaniellToth, Roger Tourangeau, Shirley Tsai, and BradyWest for their contributions to this presentation.
Auxiliary Information in Nonresponse Adjustments – p. 47/49
BLSBUREAU OF LABOR STATISTICS
U . S . D E PA RT M E N T O F L A B O R
References1. Deville, J.-C. and Sarndal, C.-E. (1992). Calibration Estimators in Survey Sampling.
Journal of the American Statistical Association, 87(418), 376–82.
2. Dillman, D. A., Eltinge, J. L., Groves, R. M., and Little, R. J. A. (2002). SurveyNonresponse in Design, Data Collection, and Analysis, in Groves, R. M., Dillman, D.A., Eltinge, J. L., and Little, R. J. A. (eds.). Survey Nonresponse, 3–26, New York:Wiley.
3. Groves, R. M., Fowler, F. J., Couper, M. P., Lepkowski, J. M., Singer, E., andTourangeau, R. (2004). Survey Methodology, Hoboken, New Jersey: Wiley.
4. Holt, D. and Smith, T. M. F. (1979). Post Stratification. Journal of the AmericanStatistical Association, 142, 33–46.
5. Kott, P. S. (2006). Using Calibration Weighting to Adjust for Nonresponse andCoverage Errors. Survey Methodology, 32(2), 133–42.
6. Kreuter, F., Olson, K., Wagner, J., Yan, T., Ezzati-Rice, T. M., Casas-Cordero, C.,Lemay, M., Peytchev, A., Groves, R. M., and Raghunathan, T. E.. (2010). Using ProxyMeasures and Other Correlates of Survey Outcomes to Adjust for Nonresponse:Examples from Multiple Surveys. Journal of the Royal Statistical Society, Series A,173(3), 389–407.
Auxiliary Information in Nonresponse Adjustments – p. 48/49

BLSBUREAU OF LABOR STATISTICS
U . S . D E PA RT M E N T O F L A B O R
References (2)
7. Little, R. J. A. and Vartivarian, S. (2005). Does Weighting for Nonresponse Increasethe Variance of Survey Means? Survey Methodology, 31(2), 161–8.
8. Rosenbaum, P. R. and Rubin, D. B. (1983). The Central Role of the Propensity Scorein Observational Studies for Causal Effects. Biometrica, 70, 41–55.
9. Tan, L. and Tsai, S.-L. (2008). An Exploration of Respondent Concerns Perceived bythe Interviewer for the Consumer Expenditure Interview Survey.
10. Thomsen, I. (1973). A Note on the Efficiency of Weighting Subclass Means to Reducethe Effects of Non-Response When Analyzing Survey Data. Statistisk Tidskrift, 11,278–83.
11. West, B. (2010). An Examination of the Quality and Utility of Interviewer Estimates ofHousehold Characteristics in the National Survey of Family Growth (NSFG). Apresentation given for the University of Michigan’s Program in Survey MethodologyBrown Bag Seminar Series, November 2010.
Auxiliary Information in Nonresponse Adjustments – p. 49/49