evaluating the impact of man-made disasters on...
TRANSCRIPT

Contents lists available at ScienceDirect
Biological Conservation
journal homepage: www.elsevier.com/locate/biocon
Evaluating the impact of man-made disasters on imperiled species: Pipingplovers and the Deepwater Horizon oil spillDaniel Gibsona,⁎, Daniel H. Catlina, Kelsi L. Hunta, James D. Frasera, Sarah M. Karpantya,Meryl J. Friedricha, Melissa K. Bimbib, Jonathan B. Cohena,1, Sidney B. Maddocka,2a Department of Fish and Wildlife Conservation, Virginia Polytechnic Institute and State University, Blacksburg, VA 24060, United Statesb U.S. Fish &Wildlife Service, South Carolina Field Office, Charleston, SC 29407, United States
A R T I C L E I N F O
Keywords:Piping ploverCharadrius melodusDeepwater Horizon oil spillShorebird winter ecologyAnthropogenic disturbance
A B S T R A C T
Even in the presence of environmental safeguards, catastrophic accidents related to anthropogenic activitiesoccur that can result in both immediate and chronic impacts on local biota. However, due to the unplannednature of catastrophes, studies aimed to identify the effects of these accidents on an ecosystem and its in-habitants often have imperfect study designs that are reactive rather than proactive, resulting in methodologicaland analytical challenges. On 20 April 2010, following an explosion on the Deepwater Horizon oil rig, a wellblowout occurred on the seafloor approximately 80 km off the Louisiana coast in the Gulf of Mexico. Thisblowout resulted in the largest marine oil spill in United States history, which impacted critical migratorystopover and overwintering habitat for many seabird and shorebird species, including species of high con-servation concern such as the piping plover (Charadrius melodus). Here, we assessed the potential longer-termdemographic impacts of the Deepwater Horizon oil spill on piping plovers in a capture-mark-recapture frame-work. We examined whether a series of demographic processes, including probabilities of remaining at a specificwintering site, over-winter and annual apparent survival, winter stopover duration, and abundance variedamong oiled and unoiled habitats. We found that the perceived amount of oiling on land, in water, and onindividual birds, as well as numerous demographic processes, were spatially or temporally variable. However,we found little support that piping plover demography was negatively influenced by the magnitude of oil ob-served at an impacted area, or that demographic rates substantially varied between reference and oil impactedareas. Nor did we find that piping plovers that were observed to be oiled had lower survival probabilitiesfollowing the DWH oil spill relative to non-oiled individuals from the same winter population. Although we didnot find that the Deepwater Horizon oil spill substantially influenced piping plovers, our methods provide ananalytical framework to more appropriately address both the near or long-term impacts of an anthropogenicdisturbance on a species.
1. Introduction
Even in the presence of functional environmental safeguards, cata-strophic accidents related to anthropogenic activities occur that nega-tively affect the surrounding environment and its inhabitants. Theseaccidents, such as oil spills, often result in immediate acute impacts onnearby biota such as injury or mortality (Piatt and Ford, 1996) thatdissipate relatively quickly, followed by chronic impacts related tocontinued exposure to an environmental toxin (Rice et al., 2001) orshifts in ecosystem function (Bodkin et al., 2002; Peterson et al., 2003).Catastrophic accidents can have community-level effects by influencing
primary productivity (Mendelssohn et al., 2012), predator-prey dy-namics (Velando et al., 2005), and habitat composition (Peterson,2001), leading to a reduction in species richness or population sus-tainability relative to unaffected habitats or pre-accident levels(Macnaughton et al., 1999; Dauvin, 2000). Additionally, in the case ofoil spills, a chemical may be sequestered in the environment throughvarious geophysical processes (Hayes and Michel, 1999), persisting fordecades (Peterson et al., 2003). Sub-lethal, chronic exposure to theseenvironmental toxins can indirectly inhibit the recovery of an eco-system and its inhabitants through numerous demographic mechanismssuch as reductions in growth rates, breeding propensity, egg size, or
http://dx.doi.org/10.1016/j.biocon.2017.05.027Received 29 November 2016; Received in revised form 19 May 2017; Accepted 25 May 2017
⁎ Corresponding author.
1 Current address: Department of Environmental and Forest Biology, State University of New York College of Environmental Science and Forestry, Syracuse, NY 13210, United States.2 Current address: P.O. Box 1359, Buxton, NC 27920, United States.
E-mail address: [email protected] (D. Gibson).

fecundity (Andres, 1999; Rice et al., 2001; Lauritsen et al., 2017;Schwacke et al., 2017).
The magnitude of the acute and long-term effects of catastrophicaccidents are a function of the location and the spatial or temporal scaleof the incident (Millward and Kraft, 2004), as well as the sensitivity ofthe impacted system and its inhabitants to the experienced perturbation(Miller et al., 2011). As such, incident-specific ecological assessmentsare conducted a posteriori when catastrophic accidents occur. Due tothe unplanned nature of catastrophic accidents, these studies often haveimperfect, hastily planned study designs (e.g., lack of before-impactdata or treatment replication) that are reactive rather than proactive,resulting in methodological and analytical challenges (Wiens andParker, 1995). Ultimately, the assessment of true impacts of single-timeevents (e.g., catastrophic accidents) is highly sensitive to study design,and researchers must consider the potential for confounding amongenvironmental variables and each response variable. For example, re-coveries of oil-covered wildlife are often used to quantify absolute in-dividual mortality following oil spills (Piatt et al., 1990; Burger, 1993;Garrott et al., 1993; Piatt and Ford, 1996). Although these imagesgarner public attention, carcass recoveries and observations of oil-covered individuals have limited utility as metrics for assessing popu-lation-level impacts of an oil spill. Numerous processes influence thedetection of wildlife casualties associated with an oil spill includingpopulation density or distribution (Burger, 1993), body size (Burger,1997), ocean and wind currents (Bibby and Lloyd, 1977), distancebetween the shore and the oil spill (Page et al., 1990), shore topography(Flint et al., 1999), observer search effort and methodology (Ford,2006; Hampton and Zafonte, 2006; Byrd et al., 2009), and scavengerintensity (Van Pelt and Piatt, 1995; Fowler and Flint, 1997). Suchfactors obscure the true relationship between the magnitude of an oilspill and type (e.g., species, age-class) and numbers of individuals killed(Burger, 1993). Despite these concerns, the number of detected wildlifecausalities continue to be used in resource equivalency analyses todetermine monetary damages related to oil spills (Zafonte andHampton, 2007).
On 20 April 2010, following an explosion on the Deepwater Horizon(DWH), an oil drilling rig leased to, and operated by British Petroleum(BP), a well blowout occurred on the seafloor approximately 80 km offthe Louisiana coast, and began releasing oil into the Gulf of Mexico(Silliman et al., 2012). Over the 87 days before the well was sealed, anestimated 4.9 million barrels of oil were released into the surroundingwaters (McNutt et al., 2012). This spill was the largest volume marineoil spill in United States history, releasing> 19 times the volume of oilof the Exxon Valdez disaster (Piatt et al., 1990). Likewise, the DWH oilspill resulted in the largest clean-up and recovery operation in responseto an environmental disaster in the United States, ultimately employingover 20,000 individuals across all oil impacted areas (Levy andGopalakrishnan, 2010). Despite a variety of techniques used to collect,disperse, or otherwise mitigate the spill, some level of oiling was de-tected on approximately 2100 km of shoreline throughout the GulfCoast states, predominately in Louisiana, Florida, Mississippi, andAlabama (Nixon et al., 2016). Although immediate clean-up activitiessuccessfully reduced the amount of oil along impacted shorelines andwaterways (Michel et al., 2013), clean-up operations continued fiveyears after the incident (Cornwall, 2015).
Approximately 50% of the shorelines impacted by oil were beachecosystems (Michel et al., 2013), which serve as critical migratorystopover and overwintering habitat for 34 species of shorebirds, in-cluding species of conservation concern such as the piping plover(Charadrius melodus; Withers, 2002), red knot (Calidris canutus), andAmerican oystercatcher (Haematopus palliatus). Oil spills can im-mediately affect birds through direct contact with oil, which can resultin a considerable injury and mortality through 1) chemical toxicity, 2)inability to exchange oxygen with the environment (i.e., suffocation),and 3) reduction in insulation, flotation, or movement properties offeathers (Leighton, 1993). Relative to other bird species, the impacts of
oil spills on seabirds have attracted the most concern (Kingston, 2002);however, the foraging habitats of many shorebird species make themparticularly susceptible to being oiled once an oil spill makes landfall(Burger, 1997; Amirault-Langlais et al., 2007; Henkel et al., 2012).Despite the potential for shorebirds to be directly exposed to oil, < 1%of all direct recoveries of live or dead birds immediately following theDWH oil spill were oiled shorebirds (Henkel et al., 2012), but theproportion of affected individuals that were never detected is unclear.
The immediate and long term effects of oil spills on shorebird po-pulations are relatively unknown because studies demonstrating de-mographic or physiological effects of oiling on seabirds may not beapplicable to shorebirds due to taxa-specific vulnerabilities or sensi-tivities to oiling (Piatt et al., 1990). Additionally, the literature in-vestigating the potential impacts of oil spills on shorebirds is sparse andprimarily descriptive (e.g., Amirault-Langlais et al., 2007; Dominguezand Vidal, 2009) or behavioral (e.g., Burger, 1997; Dominguez andVidal, 2009). However, migratory shorebirds may experience addi-tional stressors related to nutrient availability and, subsequently, bodycondition that may influence the timing of or survival during migrationor the following breeding season (see Henkel et al., 2012 for review).For example, Burger (1997) found that the amount of time oiled san-derlings (Calidris alba) spent standing and preening, instead of foraging,increased as the percent of oiled plumage increased. Furthermore, ex-perimentally oiled sanderlings spent more time foraging than controlindividuals, and experienced a decline in weight over a 10-day interval,while control birds did not (Burger and Tsipoura, 1998).
The population-level impact of behavioral and condition responsesof wildlife in general, and shorebirds in particular, to an oil spill re-mains largely unknown as demographic assessments of impacted po-pulations following oil spills are relatively uncommon. A long-termstudy that encompassed multiple oil spills found that overwinter sur-vival of adult common guillemots (Uria aalge) was substantially lowerduring years when the wintering habitat was impacted by an oil spill(Votier et al., 2005); however, population-level impacts were reduceddue to increased recruitment of juveniles into the breeding populationduring these years (Votier et al., 2008). Another study observed re-duced reproductive effort and success for black oystercatchers (Hae-matopus bachmani) following the Exxon Valdez oil spill (Andres, 1997),however this population had largely recovered by nine years followingthe oil spill (Murphy and Mabee, 2000). Additionally, sea otters (En-hydra lutris) exposed to Exxon Valdez oil spill had lower survival oversubsequent years relative to individuals born after the oil spill (Monsonet al., 2000). Reduced survival for river otters (Lontra canadensis),however, was not observed following the Exxon Valdez oil spill despiteexposure to habitats impacted by oiling (Bowyer et al., 2003). Demo-graphic assessments following the DWH oil spill found no support forreduced survival of Brown pelicans (Pelecanus occidentalis) immediatelyfollowing the spill; however, the long-term impacts were unknown atthe time of publication (Walter et al., 2014). In contrast, multiple pe-lagic fish species experienced an immediate reduction in larvae abun-dance following the DWH oil spill (Rooker et al., 2013). Together, thesestudies suggest that demographic responses to oil spills should be ex-pected to be variable and related to species-specific susceptibilities.
Our goal was to provide a rigorous framework for the evaluation ofdemographic effects of a catastrophic accident on target wildlife.Specifically, we assessed the potential long term demographic impactsof the DWH oil spill on an imperiled shorebird species, the pipingplover. Our objective was to use capture-mark-recapture models toestimate and assess the influence of environmental disturbances relatedto the DWH oil spill on a series of demographic processes, includingprobabilities of remaining at a wintering site in addition to over-winterand annual apparent survival. We also assessed broad-scale patterns inmovement rates, winter stopover duration, and abundance among oiledand unoiled populations.
D. Gibson et al.

2. Methods
2.1. Field methods
2.1.1. Study areaSeven regional sites determined to be important for wintering
piping plovers were selected from previous surveys (Gratto-Trevoret al., 2016; Fig. 1). Four of these sites were within the DWH oil impactzone (Cocodrie, LA, Grand Isle, LA, Ocean Springs, MS, and DauphinIsland, AL; Table 1 and Fig. 1). In addition to these impact areas, westudied plovers in 3 reference areas that were outside of the oil impactzone (Corpus Christi, TX, Tampa, FL, and Little Saint Simon's Island,GA; Table 1 and Fig. 1). Each study site was further broken into 5–10subsites (e.g., discrete beaches, islands, backshore habitat, etc.).
2.1.2. SurveysWe attempted to count piping plovers, evaluate them for visible
evidence of oiling, and read any color-banded individuals at each siteapproximately every 2–3 days. We moved through all suitable (definedas open sandy habitat with < approximately 50% of vegetation) ha-bitat at each location during each visit. We scanned all potential habitat
with a spotting scope (20–60×) or binoculars (8–10×). When sur-veyors detected plovers, they approached (typically within 25 m) thebirds to identify bands and determine oiling status. We recorded allobserved band combinations and categorized each bird sighted into oneof five predetermined categories of oiling: 1. none (0%), 2. trace(≤5%), 3. light (6–20%), 4. moderate (21–40%), and 5. heavy(> 40%; Fig. S1). We also recorded the total number of piping ploversobserved in addition to the number of individually marked pipingplovers observed. We reduced the bias associated with double countingunmarked individuals by only counting marked or unmarked in-dividuals in front of the surveyors. Following this protocol, markedindividuals that were previously encountered, but were subsequentlyreencountered in front of the survey were counted again. However,marked individuals visible, but behind surveyors were not counted.Survey efforts were initially inhibited by stalled negotiations betweenthe U.S. Fish and Wildlife Service (USFWS) and BP; however, we begansurveys as soon as logistically possible at each site (29 Aug 2010–19 Oct2010; Table 1) and continued surveys through 13 Apr 2011. We per-formed surveys regardless of tidal cycle except when access to a loca-tion was dependent on tides. Although piping plovers were pre-dominantly on their breeding habitats immediately following the DWH
Fig. 1. Locations of the Deepwater Horizon explosion (star) and the study sites monitored for piping plovers on the Gulf of Mexico and Atlantic southeast from 29 August 2010–15 April2011. Study sites directly impacted by the oil spill (Area of Potential Impact; Triangles) consisted of two discrete wintering populations, East (Blue triangles) and West (Red Triangles)River, which were each divided into two additional monitoring sites (East of River: Dauphin Island, AL and Ocean Springs, MS; West of River: Cocodrie, LA; Grand Isle, LA). Study sites notdirectly impacted by the oil spill (Reference; Circles) consisted of three discrete wintering populations, Texas (Corpus Christi, TX, Black), Tampa (Tampa, FL, Gray), and Georgia (LittleSaint Simon's Island, GA, White). (For interpretation of the references to color in this figure legend, the reader is referred to the web version of this article.)
D. Gibson et al.
oil spill (Haig and Oring, 1988), piping plovers can arrive on theirwinter range in July (Drake et al., 2001). As such, the delay in the onsetof survey efforts resulted in an unknown number of piping ploversmigrating into oil impacted areas prior to our ability to monitor thesehabitats, reducing our ability to determine immediate impacts.
In addition to collecting data on plovers, we also noted the presenceor absence of oil smell in the air, oil in the water, oil on the land (in-cluding tar balls and dried oil), clean-up crews, and any other humandisturbance (e.g., pedestrians, vehicles, dogs) that appeared to affectthe birds' behavior.
2.1.3. Trapping and bandingIn addition to birds that were previously banded during other stu-
dies concentrated in seasonal piping plover breeding habitats, wecaptured and banded piping plovers at each of our wintering sites. Weused these captures and recaptures to augment the sample size ofbanded birds within the study areas, to evaluate oiling rates in the hand(Fig. S1), and to determine the condition of birds within the impactzone and at reference locations. We captured foraging and roostingplovers with drop-nets and whoosh-nets (Sutherland et al., 2004;Doherty, 2009). We marked each adult with a unique combination of 4color bands and a color leg flag.
2.1.4. Supplemental surveys and sightingsIn addition to regular survey efforts following the DWH oil spill, we
performed supplemental surveys of all sites along the Gulf of Mexicoand the Atlantic southeast from August–September 2011 to locate anyindividuals that may have migrated back to these locations. We alsoincorporated ancillary resightings for all individuals that 1) we un-iquely marked; and 2) were observed at one of the wintering sites thewinter immediately following the DWH oil spill, from migration andbreeding locations (between May–August from 2011 to 2015), and fromthe seven winter sites during the non-breeding season (betweenSept–April from 2012 to 2016). Additionally, the piping plover inter-national census, which attempts to survey all potential piping ploverbreeding habitat throughout the species' range every 5 years, occurredin June 2011 (Haig and Plissner, 1993; Haig et al., 2005). Because ofthe widespread involvement of the plover management community inthe DWH response and the international census, most monitors andsurveyors were cognizant of the need for resighting of banded birds onthe breeding or wintering grounds.
2.2. Data analyses
To model temporal changes in various parameters of interest (e.g.,oiling rates, survival, abundance), we divided the season into two-weekperiods (n = 17) beginning with the first official survey (29 August2010) and continuing through to the last survey (13 April 2011). Foranalyses sensitive to movements of individuals between study sites (i.e.,Jolly-Seber super population model), we combined data from the fourstudy sites within the area of potential impact (Table 1) into two studyareas: west of the Mississippi River (Cocodrie and Grand Isle; hereafter,
‘West of River’) and east of the Mississippi River (Ocean Springs andDauphin Island; hereafter, ‘East of River’; Fig. 1). The study areas thatwere combined were adjacent to one another and banded birds readilymoved between the combined areas, indicating that these were notdemographically distinct locations. For analyses less sensitive to po-pulation closure (i.e., Cormack-Jolly-Seber), we did not combine thedata from the four study areas within the area of potential impact. Forthese analyses, marked birds were assigned to the study area wherethey were observed most frequently. Preliminary data suggested thatthe reference areas were geographically and demographically isolatedfrom one another, as such they were treated individually for eachanalysis. Any statistics labeled ‘area of potential impact’ or ‘reference’represents the mean estimate for all study areas within those classifi-cations.
2.2.1. Explanatory variablesThe format of survey data was designed to be in compliance with
the mandatory Natural Resource Damage Assessment (NRDA) protocolsand data requests, which limited the ability to modify data collectionprocedures over the course of the study. Given these constraints, weused a series of six environmental variables to explain variation inobserved demographic processes. First, we generalized the temporaland spatial variation in oiling rates or other oil-related disturbance ateach study area within the area of potential impact as functions of theproportion of sub-sites within each study area that were documented tohave oil visible on 1) land or 2) water, or 3) were currently receivingclean-up efforts (response injury) during each survey relative to thetotal number of subsites surveyed. Additionally, we used 4) whether anindividual was observed as visibly oiled on each bi-weekly occasion as atime-varying individual-level covariate. We also assessed the influenceof environmental variability beyond the oil spill on various demo-graphic parameters. As such, for all study areas (i.e., area of potentialimpact and reference), we used the 5) mean daily minimum tempera-ture downloaded from the nearest NOAA weather station to each studyarea (http://www.ncdc.noaa.gov/) to account for weather-relatedpatterns in movement or survival. Lastly, we used 6) whether an in-dividual plover was ever observed oiled as a binomial individual-levelcovariate to determine if known-oiled plovers had lower survival thanthe rest of the monitored population over a five-year period followingthe DWH oil spill. The temporal and spatial scale of the explanatoryvariables differed among analyses as a function of the underlying scaleof inference for each model, and are further explained in the specificmodel descriptions below.
2.2.2. Wintering site entry rate, persistence, duration of stay, andpopulation size
We estimated the probabilities of entering and remaining in a winterpopulation, and the average duration an individual remained at anoverwinter site, and the total overwinter super population size usingcaptures and resights of marked individuals as well as counts of bothmarked and unmarked individuals during the winter period at each ofour study sites. We used a state-space formulation of a hierarchical
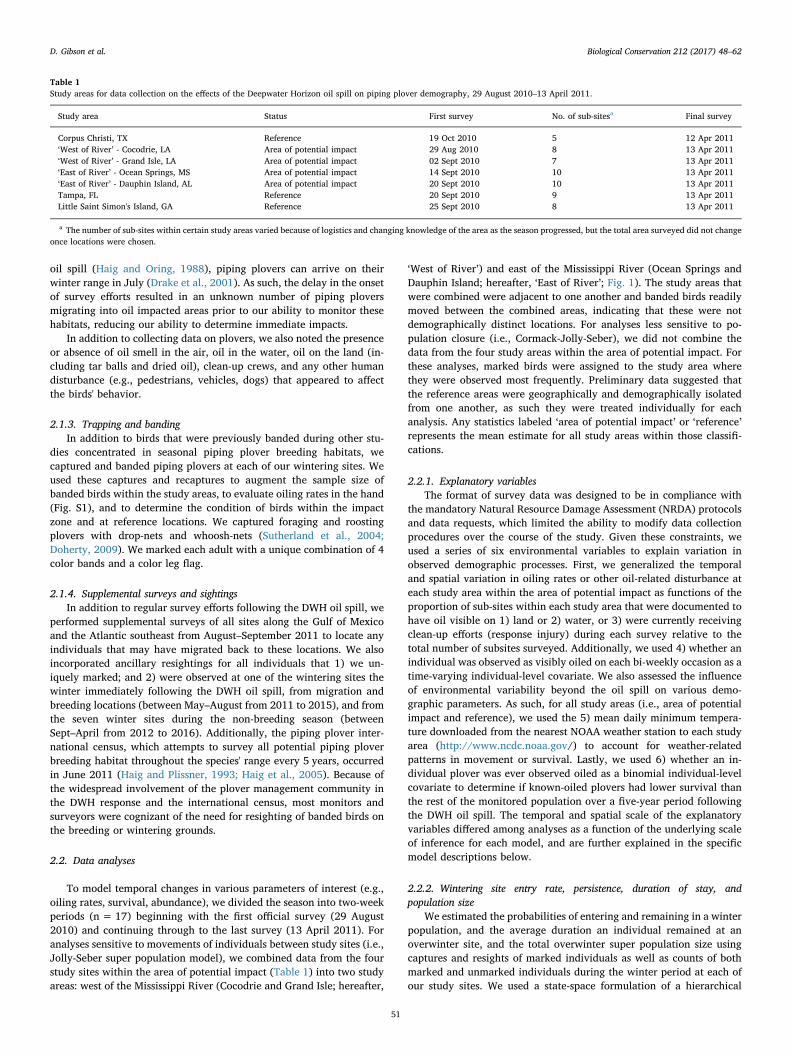
Table 1Study areas for data collection on the effects of the Deepwater Horizon oil spill on piping plover demography, 29 August 2010–13 April 2011.
Study area Status First survey No. of sub-sitesa Final survey
Corpus Christi, TX Reference 19 Oct 2010 5 12 Apr 2011‘West of River’ - Cocodrie, LA Area of potential impact 29 Aug 2010 8 13 Apr 2011‘West of River’ - Grand Isle, LA Area of potential impact 02 Sept 2010 7 13 Apr 2011‘East of River’ - Ocean Springs, MS Area of potential impact 14 Sept 2010 10 13 Apr 2011‘East of River’ - Dauphin Island, AL Area of potential impact 20 Sept 2010 10 13 Apr 2011Tampa, FL Reference 20 Sept 2010 9 13 Apr 2011Little Saint Simon's Island, GA Reference 25 Sept 2010 8 13 Apr 2011
a The number of sub-sites within certain study areas varied because of logistics and changing knowledge of the area as the season progressed, but the total area surveyed did not changeonce locations were chosen.
D. Gibson et al.

Bayesian Jolly-Seber (JS) super population model described by Lyonset al. (2016) to estimate probabilities of entering (Β) each over wintersite and remaining alive (local persistence; φp) at each site conditionedon entering an over winter site. This model also integrates a binomialmodel into the JS likelihood that incorporates count data of marked andunmarked individuals to derive predictions of overwinter super popu-lation size (N*, the total number of animals that used a site) andoverwinter duration (Sl, the duration between an individual's estimatedarrival and departure at a site). We expanded upon the model publishedin Lyons et al. (2016) to allow for simultaneous estimation of demo-graphic rates for geographically distinct super populations. For thisanalysis, we binned all data for each site (n = 5) into 14-day intervals(n = 17). The individual-based capture history represents the presenceor lack of an observation of an individual during each interval. Thecount data represent the total number of birds observed (in groups or asindividuals, banded or banded plus unbanded) during all surveyscompleted within a given interval since areas within a site were oftensurveyed multiple times during a week.
2.2.3. Data augmentationAn analytical concern for capture-recapture models that are not
conditioned on initial capture is that the true parameter space is un-known as there are an unknown number of individuals that wereavailable for detection, but never observed (i.e., all zero encounterhistories). We used parameter expanded data augmentation (PX-DA;Royle and Dorazio, 2012) as suggested by Kery and Schaub (2012) andLyons et al. (2016) to fix the parameter space to a known value. The PX-DA approach adds a known amount of all zero encounter histories (n′)to the encounter histories of observed individuals (n) to create anaugmented set of capture histories (A = n′ + n), which must be suffi-ciently larger than the true population size to allow for estimation ofabundance in each model iteration (Kery and Schaub, 2012). For eachtime step, each previously unobserved individual in A undergoes aBernoulli trial, which estimates the probability (wi) that it was a part ofthe super population and entered the observable population. As ourcapture history was also indexed by site (j = 7) in addition to in-dividual (i = A) and interval (t= 19), the most straightforward ap-proach for data augmentation, while maintaining symmetry across athree-dimensional capture history was for A to be constant across allsites, but have unobserved individuals at each site (nj′) vary among sitesas a function of the difference between individuals available at all sites(A) minus individuals observed at each site (nj) (Eq. (1)).′ = −n A nj j (1)
This results in ′nj being inversely proportional to n; however, al-lowing all parameters, most importantly Β and w, to vary independentlyamong sites allowed for unbiased posterior distributions for eachparameter. A priori, we initially set n′ to be 400 individuals, whichresulted in ′nj ranging from 623 to 698 (5.3–17.0 times greater thanobserved) depending on the observed number of individuals at each siterelative to the total number of individuals observed.
2.2.4. Jolly-Seber model developmentFor these analyses, we were interested in 1) estimating site-specific
demographic rates to make comparisons among oiled and unoiledareas, and assessing how these estimates changed over time; and 2)using explanatory variables to assess the influence of various metrics ofenvironmental perturbation (e.g., weather, oiling rates) on persistence(surviving and not emigrating) at a wintering site during the non-breeding season. For the first objective, we used a model that allowedfor the parameters determining the probabilities of entering the popu-lation (B), local persistence (φp), detection (p), and proportion of theobserved population that was marked at each site (ψ) to vary by oc-casion and site (hereafter, global JS model). As banding efforts wereboth opportunistic and continuous throughout the season, allowing ψ tovary among sites and time prevents newly marked individuals from
being assigned as new recruits. However, allowing ψ to vary in-dependently across time could result in unrealistic shifts in currentsuper population size related to small shifts in the number of markedindividuals relative to the total number of individuals observed, as suchwe constrained ψ to vary as a function of a linear effect of bi-weeklyinterval, with an independent slope of site (Lyons et al., 2016). Re-gardless of the aforementioned constraint, ψ should be interpreted as anuisance parameter. Like with CJS models, the final (k) φ and p esti-mate in a full time-varying JS model are not identifiable, which wealleviated by constraining pk − 1 to equal pk allowing for an identifiableestimate of φk. This constraint did not influence the interpretation ofour results as we did not use covariates to assess variation in φp duringthe final two time periods.
For the second objective, we developed a model that constrained φp
to vary as a function of a series (n) of explanatory variables (c) andunexplained temporal (t) and site (j) variation (εj,t).∑= + +=φ βx εlogit( ) interceptj t
c
n
c j t j t,1
, , ,
ε τ~normal(0, )j t,
We suspected that φp would be reduced during the migration perioddue to migrants passing through our winter sites, which would influ-ence the assessment of covariate effects. As such, we reduced the po-tential for bias from this source by only allowing explanatory variablesto influence φp during the period between fall and spring migrations,which we determined a priori was approximately between 1 Novemberand 31 March. Explanatory variables were modeled as bi-weekly time-varying covariates, which represented the conditions during the surveysor weather conditions that occurred during that two-week interval. Forexplanatory variables associated with the oil spill (i.e., oiling rates onland, water, and individuals, and rate of clean-up activities), the modelwas constrained to only consider the effect explanatory variables on φp
at the two sites within the area of potential impact (i.e., East of andWest of River). For explanatory variables that were not necessarilyassociated with the oil spill (i.e., average weekly minimum tempera-ture), the model allowed φp for all sites to vary as a function of eachexplanatory variable.
We did not assess the effect of explanatory variables on the prob-ability of entering the population (B) because the rate and timing ofentry into each study site would be influenced by its relative placementin the plover migratory pathway, which would be partially confoundedwith any explanatory variable that varied along a latitudinal gradient(e.g., temperature, oiling rates). Additionally, plovers were capturedand marked opportunistically throughout the winter, therefore, spatialand temporal variation in capture success could manifest itself asvariability in population entry. As such, B was the product of biologi-cally informative processes (e.g., timing of migration) and artifacts ofstudy design (e.g., timing of initial survey efforts, capture success) andshould be interpreted as a nuisance parameter. However, as we allowedfor spatial and temporal variation in ψ, parameters derived from Bshould remain biologically informative. We could not directly modelthe influence of explanatory variables on N* or Sl as they were derivedquantities directly informed by multiple modeled parameters (e.g., B,φp, p). As such, we report estimates for N* or Sl from a model thatestimated B, φp, ψ, and p independently by site and time, but we werelimited to only make qualitative assessments among sites. Priors for allparameters are provided in the Supplemental material (Table S1).
2.2.5. Apparent seasonal and annual survivalWe estimated seasonal (i.e., fall, winter, breeding) and annual ap-
parent survival using captures and resights of marked individuals ob-served during the non-breeding period (Fall: September–December;Winter: January–April) at our study sites and throughout the speciesbreeding range (May–August; hereafter breeding period) fromSeptember 2010–August 2015. In this model, seasonal survival
D. Gibson et al.

estimates should be interpreted as survival into the following interval.For example, individuals that survived the fall were predicted to bealive at some point during the winter. For these analyses, we includedonly individuals that were observed at either one of our reference or oil-impacted sites the winter immediately following the DWH oil spill(September 2010–April 2011), and followed that cohort through time.As such, this analysis deals with individuals that were potentially di-rectly affected (i.e., were observed alive within the context of our studysystem) by exposure to the oil spill. Capture histories for individualsmarked by other research groups elsewhere across the species rangewere incomplete during the final three years of this study; therefore weonly considered individuals that were marked by our research group(n = 280). We used a seasonal Cormack-Jolly-Seber (CJS) model,which allowed for seasonal and year-specific estimates of apparentsurvival (φ) and detection (p). We used the state-space formulation ofthe Bayesian hierarchical CJS model (Kery and Schaub, 2012). Al-though apparent survival is the product of survival and fidelity, thespatial breadth and survey intensity of the range-wide observation ef-fort during the spill and supplemental period would make permanentemigration unlikely for this species during our study. As temporarymovements among sites would not influence estimates of φ, we con-sidered each of the four study sites within the area of potential impact(i.e., Cocodrie, Dauphin Island, Grand Isle, and Ocean Springs) andthree reference areas as independent entities.
2.2.6. Cormack-Jolly-Seber model developmentFor these analyses, we were interested in 1) estimating seasonal-
(i.e., fall (φf), winter (φw), breeding season (φb), or annual (φa)), andsite-specific estimates of φ to make comparisons among oiled and un-oiled areas; and 2) using explanatory variables to assess the influence ofvarious metrics of environmental perturbation (e.g., weather, oilingrates) on near and long-term effects of the DWH oil spill. To assessspatial and seasonal variation in φ of individuals potentially affected bythe DWH oil spill, we used a model that allowed for occasion (n = 17;i.e., year (September 2010–August 2015) plus season (n = 3)) and site(n = 7) specific estimates of φ and p following the DWH oil spill. Wederived annual estimates of φa from the product of φf, φw, and φb foreach year. For the second objective, we developed a series of models toexplore near- and long-term effects of the DWH oil spill. First, we as-sessed the near-term impacts by developing a series of models thatconstrained φf, φw, and φb for non-breeding (φf and φw) and breedingseasons immediately following the DWH spill to vary as a function ofour explanatory variables. For this analysis, we allowed for season-specific parameter coefficients for each explanatory variable that al-lowed us to independently assess the near-term effects for each ex-planatory variable. Second, we assessed long-term impacts by devel-oping a series of models that allowed φ for all years following the DWHspill to vary as a function of the series of explanatory variables relatedto the DWH oil spill. For each model in the second objective, we spe-cified models that allowed φ to vary as a function of each explanatoryvariable as well as unexplained seasonal and site variation. For theseanalyses, we included whether a plover was observed oiled once sub-sequent to the DWH oil spill as an individual-level explanatory variable.Priors for all parameters are provided in the Supplemental material(Table S2).
2.2.7. Model specificationsWe specified models within R (R Core Team, 2012) using the
package ‘jagsUI’ to call JAGS (Plummer, 2003) and export model resultsback to R. After assessing the performance of a series of exploratorymodel runs, we ran four chains of 30,000 iterations with a burn-inperiod of 5000 for each analysis and retained every 10th sample, or3000 iterations. We determined parameter convergence by 1) visualinspection of how well posterior distribution chains mixed; and 2) usingthe Brooks-Gelman-Rubin criterion (Rl) (Brooks and Gelman, 1998). Weconsidered models that had <R 1.1l at each parameter node to have
reached convergence.
2.2.8. Goodness of fitGoodness of fit tests for CJS are relatively straightforward (Burnham
and Anderson, 2002); however, a unifying approach to assess goodness-of-fit of JS models has not been established. It has been suggested thatperforming the median ̂c test to assess the fit of the data relative to afully time-varying CJS model is a suitable proxy for a JS specific test(Lyons et al., 2016). As such, for both the seasonal CJS and JS analyses,we used the median ̂c test as implemented in program MARK (Whiteand Burnham, 1999) to assess goodness-of-fit for each analysis.
2.2.9. Model selectionWe used stochastic search variable selection (SSVS; George and
McCulloch, 1993) to assess model support for explanatory variables,which has been demonstrated to be an efficient and reliable approachfor Bayesian variable selection (O'Hara and Sillanpaa, 2009). SSVS, likeother methods of indicator variable model selection, uses a binomialmixture parameter (i.e., indicator variable; γ) that delineates whether avariable was included in the posterior distribution for each independentiteration during the Markov chain Monte Carlo (MCMC) model up-dating process. As posterior distributions for all parameters are basedon the sampled MCMC output that were kept based on a specifiedMCMC algorithm (e.g., Gibbs sampling), the posterior distribution of γrepresents the proportion of successful iterations that contained avariable, and can be used to rank variable importance. As the posteriordistribution for γ is the realization of a series of Bernoulli trials, itranges between 0 and 1, necessitating assignment of a threshold todelineate ‘importance’. A priori, we elected to use the median prob-ability model (MDM; Barbieri and Berger, 2004) approach, in which allvariables where γ≥ 0.50 are considered explanatory (see Ghosh, 2015for review). We also ran the same suite of models without the indicatorvariable included to produce unbiased posterior distributions for the βcoefficients for each explanatory variable (O'Hara and Sillanpaa, 2009).Similar to information theoretic approaches (Burnham and Anderson,2002), we assumed variables were, at most, weakly supported if their95% credible intervals overlapped 0.
3. Results
3.1. Surveys
Surveys began on 29 August and were occurring at all sites by 19October 2010. We continued surveying at locations on the Gulf andAtlantic southeast until 13 April 2011. There were 357 uniquelymarked piping plovers observed throughout the study area during thistime, of which 203 we marked. We observed movements of markedindividuals between the sites that comprised West of River (i.e., be-tween Cocodrie and Grand Isle; n = 5) and East of River (i.e., betweenDauphin Island and Ocean Springs; n = 22). However, we observedrelatively few movements among other areas (n = 4), and each of thesemovements occurred during either the fall or spring migration.
3.2. Visible oiling
Signs of oil were encountered on> 80% of surveys within the areaof potential impact and on none of the surveys outside of that area (Fig.S2; Table 2). Clean-up activities were encountered more frequently atthe East of River impact site (50.6%) than at the West of River impactsite (39.4%).
We made 23,307 plover observations and 5414 observations ofbanded plovers with binoculars and telescopes. We recorded 204(0.89%) observations of piping plovers as visibly oiled (Table 3; Figs.S1–S2). All but 4 (1.96%) of the 204 observations were within the areaof potential impact. Most of the sightings of oiled birds were categor-ized as trace (Table 3). We evaluated 230 birds for visible oiling during
D. Gibson et al.
trapping and banding. We recorded 8 (3.5%) piping plovers with traceoiling during trapping (Table 3). All observations of oiled birds in thehand were recorded within the area of potential impact.
3.3. General model results
The median ̂c test indicated minimal overdispersion ( ̂c = 1.04) forthe seasonal CJS and ( ̂c = 1.15) JS analyses. Consequently, we did notincorporate any changes to model design or inference. Based on visualobservations of chain mixture and Rl estimates, we achieved an ac-ceptable level of convergence in both analyses for all monitored para-meters prior to the initial model run specifications of 30,000 iterations.For the JS analysis, the bi-weekly detection of marked individuals (p)during the winter following the DWH oil spill was high −−x( p js = 0.77,SD = 0.17), but variable among study areas (study area range −p js:0.68–0.88) and time (bi-weekly range −p js: 0.56–0.92, Fig. S3A).Seasonal detection probabilities from the CJS analysis were highlyvariable across season, sites, and years indicative of substantial varia-tion in survey effort (Fig. S4).
The probability of entering our monitored winter population washighest (−B = 0.17, SD = 0.05) at the onset of survey efforts as in-dividuals migrated into the winter population (Fig. S3B), and declinedthroughout the migratory period. The proportion of the population thatwas marked (ψ) was variable among our study sites at the onset of thestudy (study area range ψonset: 0.07–0.18) and increased at all sitesthroughout the winter as heavily marked breeding populations mi-grated into our study systems and unmarked individuals were capturedand marked locally within our study systems (study area range ψend:0.11–0.35; Fig. S3C).
3.4. Local persistence
Local persistence (φp), or the probability an individual remained(i.e., survived and did not emigrate) at an overwinter site, variedthroughout the non-breeding season following the DWH oil spill(Fig. 2A). Periods of lower persistence occurred during the fall (priorto ~ mid-October 2010; Julian date: 296) and spring (after ~ mid-March 2011; Julian date: 71) migrations as individuals migratedthrough the study areas. Between these migratory periods, bi-weekly φp
was generally high and stable (−−φp All = 0.926, SD = 0.006) acrossstudy sites, and was not reduced in the area of potential impact(−−φp API = 0.944, SD = 0.006) relative to the reference areas(−−φp Ref = 0.915, SD = 0.009). However, φp at the reference site inGeorgia was substantially lower during a four-week period in Decemberand January (φp = 0.520, SD = 0.115) relative to the other referencesites (Tampa: φp = 0.895, SD = 0.053; Texas: φp = 0.913,SD = 0.051) as well as the oil impacted sites (East of River:φp = 0.898, SD = 0.054; West of River: φp = 0.922, SD = 0.034).
Across all study sites, we did not find support from parameter es-timates (Figs. 2B, 3A–E) or variable inclusion probabilities (γ) for near-term negative effect of minimum winter temperature (γtemp = 0.23) onφp. We did find that the period of low local persistence in Georgia wasassociated with the period of coldest temperatures for the site, andamong the coldest temperatures recorded across the entire study (Fig.S2A). Other sites, however, did not respond similarly under comparabletemperatures. In the area of potential impact, we did not find supportfrom either parameter inclusion probabilities for a negative effect ofvariation in bi-weekly oiling rates on land (γland = 0.17), in water(γwater = 0.16), or on individuals (γindiv = 0.08) on probabilities of localpersistence (Figs. 2B, 3). We also did not find support for a negativeeffect of variation in bi-weekly clean-up activities (γclean = 0.16) onlocal persistence.
3.5. Population size
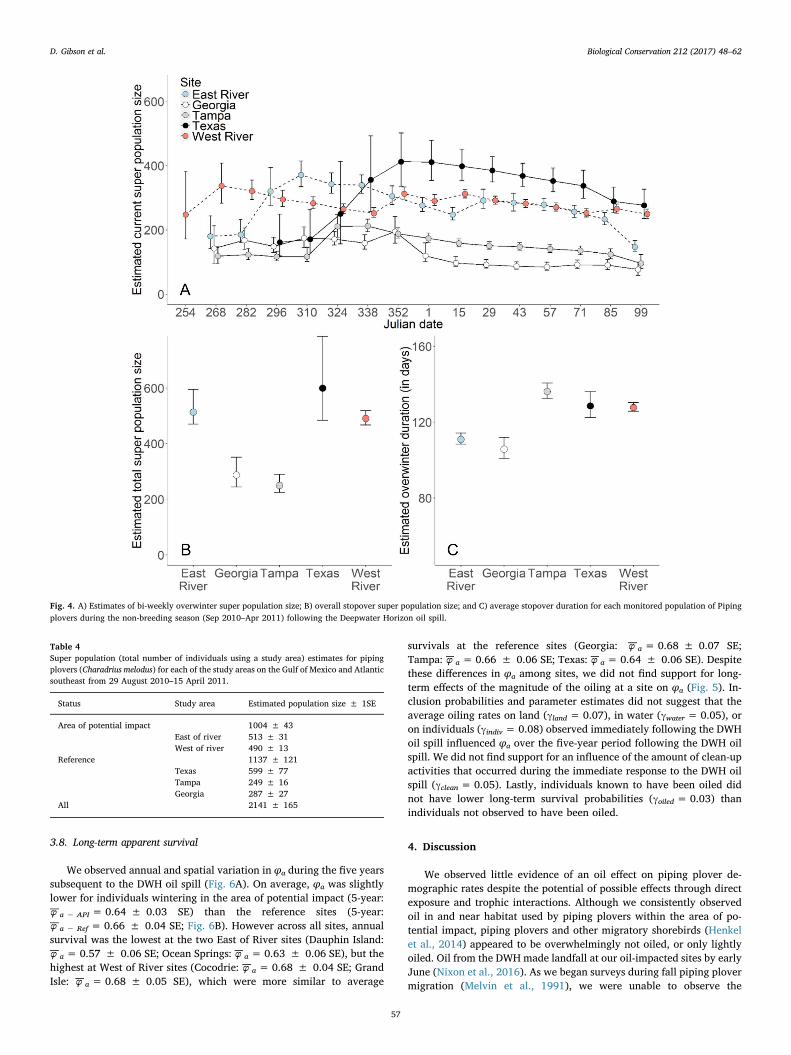
Overall, plover abundance increased throughout the fall migration;however, we observed site-specific differences in the timing or fre-quency of population entrants, as well as retention of individuals withineach site (Fig. 4A). Most sites experienced a sharp increase followed bya slow decline in population size early in the migratory period. Al-though most sites lost individuals throughout the winter, the Georgiasite experienced a 52% decline in population size over a 4-week period(Julian dates: 352–15), which coincided with the decline in local per-sistence and with colder temperatures (Fig. 2A).
We estimated that approximately 2141 (± 165 SE) plovers usedsites within the spatial and temporal extent of our survey efforts with1004 (± 44 SE) predicted to have used the monitored sites within thearea of potential impact and 1137 (± 121 SE) predicted to have usedthe monitored sites at our reference areas (Table 4). Similar numbers ofplovers used each of the sites within the area of potential impact (Eastof River: 513 ± 31 SE; West of River: 490 ± 13 SE) as well as Texas(599 ± 78 SE) during the study. Fewer plovers used the other
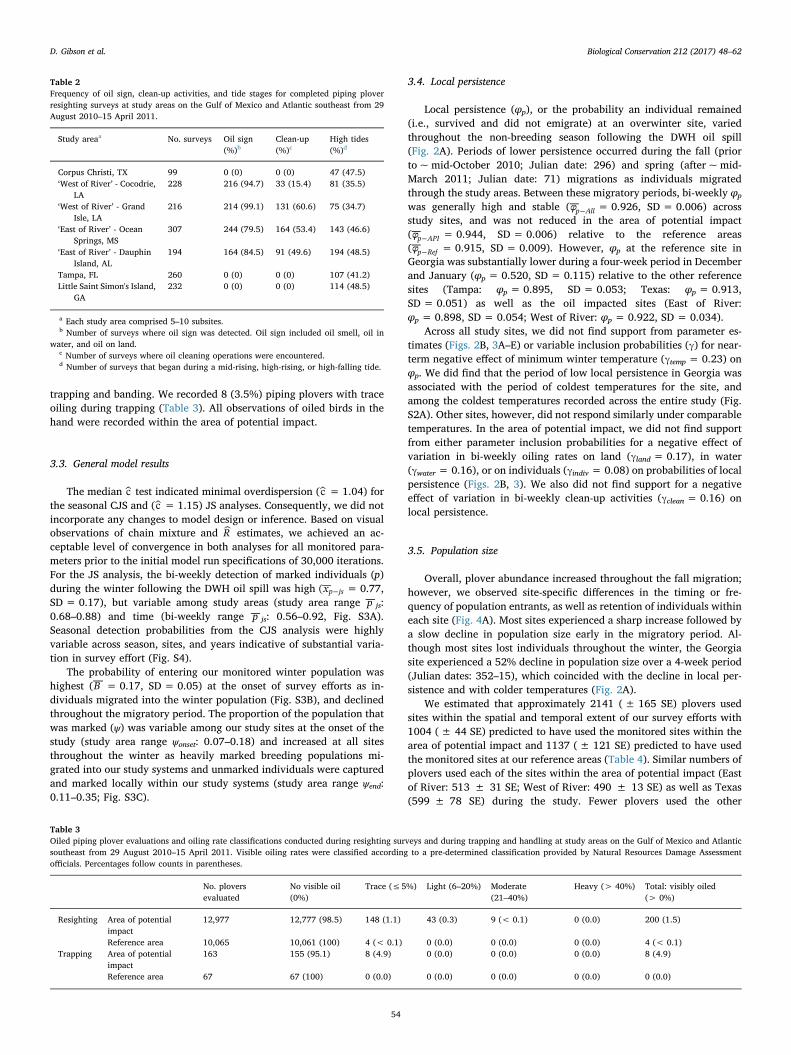
Table 2Frequency of oil sign, clean-up activities, and tide stages for completed piping ploverresighting surveys at study areas on the Gulf of Mexico and Atlantic southeast from 29August 2010–15 April 2011.
Study areaa No. surveys Oil sign(%)b
Clean-up(%)c
High tides(%)d
Corpus Christi, TX 99 0 (0) 0 (0) 47 (47.5)‘West of River’ - Cocodrie,
LA228 216 (94.7) 33 (15.4) 81 (35.5)
‘West of River’ - GrandIsle, LA
216 214 (99.1) 131 (60.6) 75 (34.7)
‘East of River’ - OceanSprings, MS
307 244 (79.5) 164 (53.4) 143 (46.6)
‘East of River’ - DauphinIsland, AL
194 164 (84.5) 91 (49.6) 194 (48.5)
Tampa, FL 260 0 (0) 0 (0) 107 (41.2)Little Saint Simon's Island,
GA232 0 (0) 0 (0) 114 (48.5)
a Each study area comprised 5–10 subsites.b Number of surveys where oil sign was detected. Oil sign included oil smell, oil in
water, and oil on land.c Number of surveys where oil cleaning operations were encountered.d Number of surveys that began during a mid-rising, high-rising, or high-falling tide.
Table 3Oiled piping plover evaluations and oiling rate classifications conducted during resighting surveys and during trapping and handling at study areas on the Gulf of Mexico and Atlanticsoutheast from 29 August 2010–15 April 2011. Visible oiling rates were classified according to a pre-determined classification provided by Natural Resources Damage Assessmentofficials. Percentages follow counts in parentheses.
No. ploversevaluated
No visible oil(0%)
Trace (≤5%) Light (6–20%) Moderate(21–40%)
Heavy (> 40%) Total: visibly oiled(> 0%)
Resighting Area of potentialimpact
12,977 12,777 (98.5) 148 (1.1) 43 (0.3) 9 (< 0.1) 0 (0.0) 200 (1.5)
Reference area 10,065 10,061 (100) 4 (< 0.1) 0 (0.0) 0 (0.0) 0 (0.0) 4 (< 0.1)Trapping Area of potential
impact163 155 (95.1) 8 (4.9) 0 (0.0) 0 (0.0) 0 (0.0) 8 (4.9)
Reference area 67 67 (100) 0 (0.0) 0 (0.0) 0 (0.0) 0 (0.0) 0 (0.0)
D. Gibson et al.

reference sites (Georgia: 287 ± 27 SE, Tampa: 249 ± 16 SE; Fig. 4B).
3.6. Stopover duration
Stopover duration (S )l , or the length of time the average individualpersisted at one the wintering sites varied among our winter sites(Fig. 4C). Sl was approximately three weeks shorter at Georgia(105.76 ± 2.85 days) and East of River (110.93 ± 1.47 days) than atWest of River (127.78 ± 1.21 days), Texas (128.58 ± 3.51 days), andTampa (136.15 ± 2.14 days). On average, individuals remainedwithin the area of potential impact sites for approximately 4 fewer days(SlAPI = 119.36 ± 0.98 days) relative to the reference sites(SlRef = 123.49 ± 2.19 days).
3.7. Overwinter apparent survival
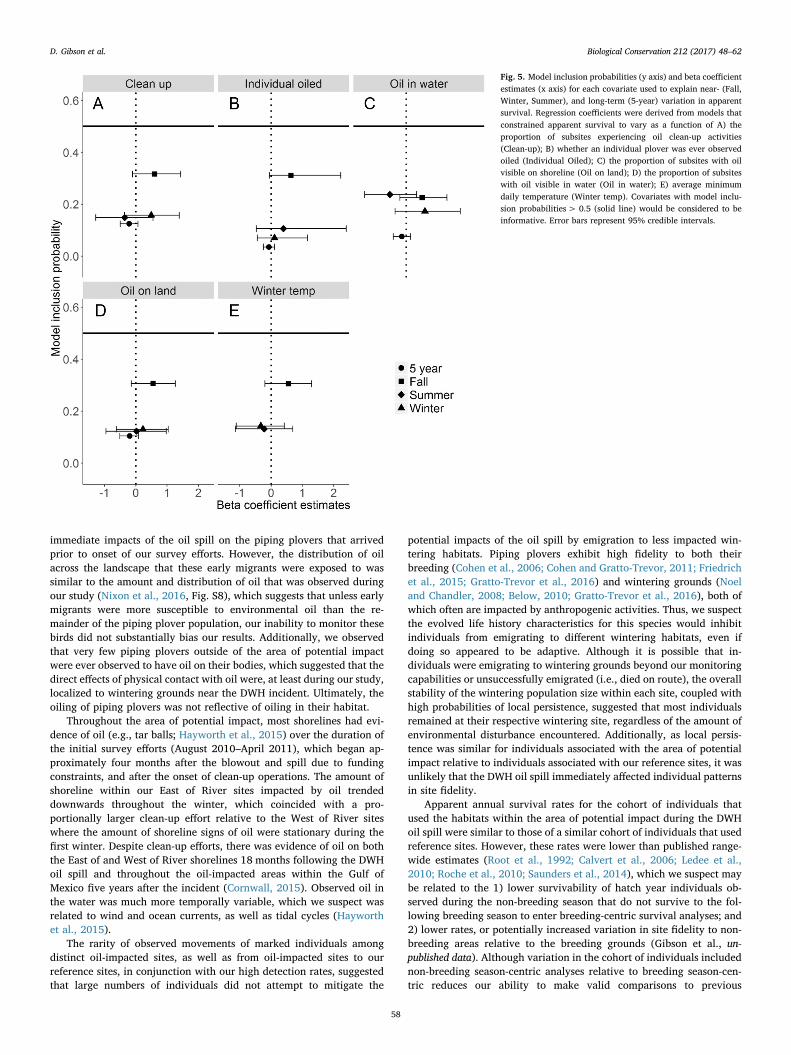
Estimates of apparent survival during the fall (Sept–Dec) immediatelyfollowing the DWH oil spill were relatively similar among study sites (range:−φ f =0.85–0.94; Fig. S5A), except for Georgia (−φ f =0.62 ± 0.08 SE).Overall, we did not find that φ from the fall or winter (Jan–Apr) followingthe DWH oil spill was lower for sites within the area of potential impact(−φ f − API =0.89 ± 0.02 SE; −φ w − API =0.89 ± 0.03 SE; Fig. 5B) re-lative to the reference sites (Including Georgia:−φ f − Ref =0.81 ± 0.03 SE;−φ w − Ref =0.84 ± 0.03 SE; Excluding Georgia:−φ f − Ref 0.91 ± 0.03 SE;−φ w − Ref 0.81 ± 0.04 SE). Likewise, we did not find support from eitherinclusion probabilities (γ) or parameter estimates (Fig. 5) for a negativeeffect of the average oiling rates on land (Fall: γland=0.19; Winter:γland =0.21) or in water (Fall: γwater =0.28; Winter: γwater=0.14), onprobabilities of apparent fall or winter survival. We also did not find support
Fig. 2. A) Estimates of bi-weekly overwinter persistence for each monitored population of Piping plovers during the non-breeding season (Sept 2010–Apr 2011) following the DeepwaterHorizon oil spill. B) Model inclusion probabilities (y axis) and beta coefficient estimates (x axis) for each covariate used to explain temporal and spatial variation in overwinterpersistence. Covariates with model inclusion probabilities > 0.5 (solid line) would be considered to be informative. Error bars represent 95% credible intervals.
D. Gibson et al.

for an influence of average amount of clean-up activities (Fall: γclean =0.18;Winter: γclean =0.20) on φf or φw. We did not find support that ploversobserved to have oil on their bodies at least once following the DWH oil spillwere less likely to survive through the winter relative to the rest of themarked population (Fall: γoiled =0.23; Winter: γoiled=0.29). We foundsupport for an effect of average temperature on survival during the fall, as95% credible intervals associated with the parameter estimate did not crosszero (βtemp =0.74; 95% C.I.: 0.07–1.48). However, the inclusion prob-abilities did not quite reach our threshold of 0.5 (Fall: γtemp =0.48). Ad-ditionally, we found no support for an effect of winter temperature onsurvival during that period (Winter: γtemp =0.26; βtemp =−0.62; 95% C.I.:−1.48–0.22), which together suggests that the relationship betweenweather conditions and survival is more complex than simply an effect of
temperature.We did not find that φb from the breeding season following the DWH
oil spill was lower for individuals associated with sites within the areaof potential impact (−φ b − API = 0.88 ± 0.03 SE; Fig. 5B) relative tothe reference sites (−φ b − Ref = 0.88 ± 0.03 SE). We also did not findsupport for carry-over effects (Fig. 5) of the average oiling rates on land(γland = 0.14) or in water (γwater = 0.17) on apparent survival the fol-lowing breeding season (φb). We did not find support that φb was in-fluenced by the average amount of clean-up activities (γclean = 0.13), oraverage winter temperature (γtemp = 0.19). Lastly, we did not find thatoiled individuals had lower survival the following breeding season(γoiled = 0.09) than individuals not observed to have been oiled.
Fig. 3. Estimates of bi-weekly overwinter persistence for each monitored population of piping plovers plotted against the observed value of each explanatory variable during that bi-weekly period. Regression coefficients (solid black line) were derived from models that constrained overwinter persistence to vary as a function of A) proportion of subsites with oil visibleon shoreline; B) proportion of subsites with oil visible in water; C) average minimum temperature; D) whether a piping plover was observed with oil on its body within the area ofpotential impact relative to individuals in the reference areas; and E) proportion of subsites experiencing oil clean-up activities. Dashed lines and bars represent 95% credible intervals.
D. Gibson et al.
3.8. Long-term apparent survival
We observed annual and spatial variation in φa during the five yearssubsequent to the DWH oil spill (Fig. 6A). On average, φa was slightlylower for individuals wintering in the area of potential impact (5-year:−φ a − API = 0.64 ± 0.03 SE) than the reference sites (5-year:−φ a − Ref = 0.66 ± 0.04 SE; Fig. 6B). However across all sites, annualsurvival was the lowest at the two East of River sites (Dauphin Island:−φ a = 0.57 ± 0.06 SE; Ocean Springs:−φ a = 0.63 ± 0.06 SE), but thehighest at West of River sites (Cocodrie: −φ a = 0.68 ± 0.04 SE; GrandIsle: −φ a = 0.68 ± 0.05 SE), which were more similar to average
survivals at the reference sites (Georgia: −φ a = 0.68 ± 0.07 SE;Tampa:−φ a = 0.66 ± 0.06 SE; Texas:−φ a = 0.64 ± 0.06 SE). Despitethese differences in φa among sites, we did not find support for long-term effects of the magnitude of the oiling at a site on φa (Fig. 5). In-clusion probabilities and parameter estimates did not suggest that theaverage oiling rates on land (γland = 0.07), in water (γwater = 0.05), oron individuals (γindiv = 0.08) observed immediately following the DWHoil spill influenced φa over the five-year period following the DWH oilspill. We did not find support for an influence of the amount of clean-upactivities that occurred during the immediate response to the DWH oilspill (γclean = 0.05). Lastly, individuals known to have been oiled didnot have lower long-term survival probabilities (γoiled = 0.03) thanindividuals not observed to have been oiled.
4. Discussion
We observed little evidence of an oil effect on piping plover de-mographic rates despite the potential of possible effects through directexposure and trophic interactions. Although we consistently observedoil in and near habitat used by piping plovers within the area of po-tential impact, piping plovers and other migratory shorebirds (Henkelet al., 2014) appeared to be overwhelmingly not oiled, or only lightlyoiled. Oil from the DWH made landfall at our oil-impacted sites by earlyJune (Nixon et al., 2016). As we began surveys during fall piping plovermigration (Melvin et al., 1991), we were unable to observe the
Fig. 4. A) Estimates of bi-weekly overwinter super population size; B) overall stopover super population size; and C) average stopover duration for each monitored population of Pipingplovers during the non-breeding season (Sep 2010–Apr 2011) following the Deepwater Horizon oil spill.
Table 4Super population (total number of individuals using a study area) estimates for pipingplovers (Charadrius melodus) for each of the study areas on the Gulf of Mexico and Atlanticsoutheast from 29 August 2010–15 April 2011.
Status Study area Estimated population size ± 1SE
Area of potential impact 1004 ± 43East of river 513 ± 31West of river 490 ± 13
Reference 1137 ± 121Texas 599 ± 77Tampa 249 ± 16Georgia 287 ± 27
All 2141 ± 165
D. Gibson et al.
immediate impacts of the oil spill on the piping plovers that arrivedprior to onset of our survey efforts. However, the distribution of oilacross the landscape that these early migrants were exposed to wassimilar to the amount and distribution of oil that was observed duringour study (Nixon et al., 2016, Fig. S8), which suggests that unless earlymigrants were more susceptible to environmental oil than the re-mainder of the piping plover population, our inability to monitor thesebirds did not substantially bias our results. Additionally, we observedthat very few piping plovers outside of the area of potential impactwere ever observed to have oil on their bodies, which suggested that thedirect effects of physical contact with oil were, at least during our study,localized to wintering grounds near the DWH incident. Ultimately, theoiling of piping plovers was not reflective of oiling in their habitat.
Throughout the area of potential impact, most shorelines had evi-dence of oil (e.g., tar balls; Hayworth et al., 2015) over the duration ofthe initial survey efforts (August 2010–April 2011), which began ap-proximately four months after the blowout and spill due to fundingconstraints, and after the onset of clean-up operations. The amount ofshoreline within our East of River sites impacted by oil trendeddownwards throughout the winter, which coincided with a pro-portionally larger clean-up effort relative to the West of River siteswhere the amount of shoreline signs of oil were stationary during thefirst winter. Despite clean-up efforts, there was evidence of oil on boththe East of and West of River shorelines 18 months following the DWHoil spill and throughout the oil-impacted areas within the Gulf ofMexico five years after the incident (Cornwall, 2015). Observed oil inthe water was much more temporally variable, which we suspect wasrelated to wind and ocean currents, as well as tidal cycles (Hayworthet al., 2015).
The rarity of observed movements of marked individuals amongdistinct oil-impacted sites, as well as from oil-impacted sites to ourreference sites, in conjunction with our high detection rates, suggestedthat large numbers of individuals did not attempt to mitigate the
potential impacts of the oil spill by emigration to less impacted win-tering habitats. Piping plovers exhibit high fidelity to both theirbreeding (Cohen et al., 2006; Cohen and Gratto-Trevor, 2011; Friedrichet al., 2015; Gratto-Trevor et al., 2016) and wintering grounds (Noeland Chandler, 2008; Below, 2010; Gratto-Trevor et al., 2016), both ofwhich often are impacted by anthropogenic activities. Thus, we suspectthe evolved life history characteristics for this species would inhibitindividuals from emigrating to different wintering habitats, even ifdoing so appeared to be adaptive. Although it is possible that in-dividuals were emigrating to wintering grounds beyond our monitoringcapabilities or unsuccessfully emigrated (i.e., died on route), the overallstability of the wintering population size within each site, coupled withhigh probabilities of local persistence, suggested that most individualsremained at their respective wintering site, regardless of the amount ofenvironmental disturbance encountered. Additionally, as local persis-tence was similar for individuals associated with the area of potentialimpact relative to individuals associated with our reference sites, it wasunlikely that the DWH oil spill immediately affected individual patternsin site fidelity.
Apparent annual survival rates for the cohort of individuals thatused the habitats within the area of potential impact during the DWHoil spill were similar to those of a similar cohort of individuals that usedreference sites. However, these rates were lower than published range-wide estimates (Root et al., 1992; Calvert et al., 2006; Ledee et al.,2010; Roche et al., 2010; Saunders et al., 2014), which we suspect maybe related to the 1) lower survivability of hatch year individuals ob-served during the non-breeding season that do not survive to the fol-lowing breeding season to enter breeding-centric survival analyses; and2) lower rates, or potentially increased variation in site fidelity to non-breeding areas relative to the breeding grounds (Gibson et al., un-published data). Although variation in the cohort of individuals includednon-breeding season-centric analyses relative to breeding season-cen-tric reduces our ability to make valid comparisons to previous
Fig. 5. Model inclusion probabilities (y axis) and beta coefficientestimates (x axis) for each covariate used to explain near- (Fall,Winter, Summer), and long-term (5-year) variation in apparentsurvival. Regression coefficients were derived from models thatconstrained apparent survival to vary as a function of A) theproportion of subsites experiencing oil clean-up activities(Clean-up); B) whether an individual plover was ever observedoiled (Individual Oiled); C) the proportion of subsites with oilvisible on shoreline (Oil on land); D) the proportion of subsiteswith oil visible in water (Oil in water); E) average minimumdaily temperature (Winter temp). Covariates with model inclu-sion probabilities> 0.5 (solid line) would be considered to beinformative. Error bars represent 95% credible intervals.
D. Gibson et al.

estimates, the spatial breadth of this study allowed for comparisonsbetween individuals and populations impacted from the DWH oil spill,and those that were not. Individuals that were observed to have beenoiled had similar survival rates relative to piping plovers that werenever observed to have been oiled. We did, however, observe a slightdecline in annual survival within the area of potential impact two yearsfollowing the year of the oil spill relative to survival the year of the oilspill as well as survival at the reference sites, which was predominantlydriven by lower survival rates at the East of River sites (i.e., DauphinIsland and Ocean Springs). Additionally, stopover duration for in-dividuals associated with the East of River sites was more similar to thatof Georgia than that of individuals that used the other sites. Stopoverduration is influenced by multiple demographic processes including thetiming of both migration events (i.e., fall and spring), local persistence,and mortality, which decreases generalizability and limits the potentialto infer the direct demographic mechanism. For Georgia, we observed asharp decline in both local persistence and apparent survival during thefall that was correlated with an extended period of cold weather, whichtogether suggested that mortality drove the reduction in stopoverduration. For East of River, we did not see a similar drop in local per-sistence; however, East of River had slightly lower local persistence andseasonal survival rates than the other sites. Without data prior to theDWH oil spill from these sites, we cannot definitively distinguishwhether this response was related to the DWH oil spill, clean-up efforts,or other environmental features unique to the East of River. However,regardless of the environmental mechanism, the majority of demo-graphic rates were similar between the area of potential impact and thereference sites. This result suggested that the direct impacts of the oilspill on survival, remaining on, or returning to the wintering groundswere either small or not separable from background environmentalvariability (McGowan et al., 2011).
Our results were contrary to initial expectations as it is generallyassumed that large oil spills should negatively impact wildlife throughmortality following the event, which may result in a long-term reduc-tion in population vital rates (Peterson et al., 2003). Similar to previousoil spills (Piatt and Ford, 1996), a non-trivial number of carcasses (e.g.,seabirds, cetaceans; Williams et al., 2011, Haney et al., 2014) wererecovered following the DWH oil spill. However, the use of carcassrecovery as a metric for assessment of impacts continues to be criticized(Williams et al., 2011). For example, Brown pelicans (Pelecanus occi-dentalis) were commonly observed oiled and many carcasses were col-lected (Tran et al., 2014); however, there was no evidence of a near-term effect of the DWH oil spill on various demographic processes(Walter et al., 2014). Similarly, northern gannets (Morus bassanus) alsowere frequently observed oiled, but individuals exposed to oil duringthe DWH oil spill were physiologically similar to those that were not(Franci et al., 2014). On the other hand, declines in reproductive effortor success for other species that were observed oiled, or recovered deadless frequently, such as the seaside sparrow (Ammodramus maritimus)(Burns et al., 2014) and the common bottlenose dolphin (Tursiopstruncates) (Lane et al., 2015) have been linked to the DWH oil spill.Together, this highlights that species respond differently to similarenvironmental stressors, and the danger of extrapolating a single re-sponse to an environmental disaster to the overall ecological impact.
Despite the limited direct contact between oil and piping plovers(i.e., oiling) in contaminated areas, and lack of support for an impact ofthe DWH oil spill or the subsequent clean-up operation on demographicprocesses, it has become increasingly evident that oil released duringthe DWH oil spill will physically and chemically persist throughout theGulf of Mexico, and in its inhabitants (Bonisoli-Alquati et al., 2016).The long-term implications for ecosystem function are unclear (Michelet al., 2013; Hayworth et al., 2015), but in the short term, it appears as
Fig. 6. Estimates of annual apparent survival for each monitored population of Piping Plovers in southeastern United States following the Deepwater Horizon oil spill (August 2010–April2016). Estimates of annual apparent survival are visualized by A) individuals associated with each site; and B) by individuals associated with the area of potential impact or referencesites.
D. Gibson et al.

though piping plovers, and perhaps species with related habitat re-quirements, may have escaped egregious effects of the DWH spill asassessed during the time frame of our study. We suspect that as timingof the DWH oil spill occurred during the breeding season, in whichpiping plover occur at more northern latitudes, put piping plovers atless of a risk of negative consequences relative to other avian speciesthat breed in the Gulf of Mexico (Haney et al., 2014).
The only other assessment of the potential impacts of the DWH oilspill on piping plovers was released as part of the official NRDA as-sessment that estimated a loss (e.g., mortality or failed reproduction) of26–41 piping plovers due to the DWH oil spill (Deepwater HorizonNatural Resource Damage Assessment Trustees, 2016). These resultsappeared to be based on a recovery of a single unoiled piping plovercarcass, which was then extrapolated to account for imperfect recoveryrates and lost fitness potential of impacted individuals. Although ourresults are not directly comparable, the fundamental differences in datacollection and analytical methods (i.e., extrapolating from counts ofoiled individuals and recovered carcasses in impacted area versus acontrolled comparison that estimated the underlying demographicprocesses) provide an opportunity to evaluate the approach NRDA usesto assess the impacts of oil spills on species. Here, we found no supportthat the DWH oil spill resulted in a net loss of piping plovers betweenAugust 2010–April 2011 (i.e., near-term, but not immediate impacts)that could not have been explained by normal environmental variation.Additionally, we found that oiling rates observed on individuals were 3times greater for captured birds (i.e., bird in hand; Table 3) than for aresighted bird. Together these discrepancies highlight that broadly ex-trapolating losses as a function of oiling rates from a distance or carcassrecoveries may not result in realistic estimates for certain species.
The focus of NRDA on immediate, observable effects is under-standable from a legal standpoint, but neglects the potential forchronic, long-term effects that are not indicated by short-term damage(Peterson et al., 2003). The data we used to assess long-term impactswere collected by volunteer efforts and collection was not funded di-rectly through the oil-spill response, which may be impractical for mostother species. Moreover, the narrow scope of the approved study pro-hibited collection of data that would have broadened the inferencespossible (e.g., habitat use data, prey data), thus potentially increasingthe ratio of benefits to costs. We suggest that in the future NRDA shouldconsider approving more flexible study designs to more adequatelyaccount for system-specific variability in disturbances and perceivedeffects.
This study is an example of the way that future post-oil spill studiescould allow for inference on more than just immediate mortality rate,which is more consistent with the general advancements in in-vestigating the ecological consequences of anthropogenic disturbance(e.g., Winder et al., 2015; Atwood et al., 2016). Our methods weredeveloped to address a variety of factors: both lethal and sub-lethal,near- and long-term, and at local and regional scales. Outside of specificeffects on piping plovers, our methods represent a more rigorous as-sessment of the effect of oiling than many previous studies and otherscarried out during the oil spill response. Our assessment was focused ona single, threatened species, but could be easily expanded to a variety ofother species. Coupled with physiological assessments and larger, eco-system oriented studies, responses to such catastrophes can provide amore comprehensive picture of environmental damage and the long-term effects of these events on a host of organisms. Furthermore, ana-lytical frameworks similar to ours can used to calculate more appro-priate levels of monetary compensation for species in which direct re-coveries of casualties are unreliable. As an example, the estimatedimpact of an oil spill on a demographic process and the estimatednumber of individuals exposed to the oil spill can be used to predict thetrue population losses (e.g., mortality or reproductive failure), whichcan replace or amend the observed casualties in resource equivalencyanalyses. Although the model developed for this manuscript wassystem-specific and influenced by the outcome of data collection
process, this flexibility was only possible due to a priori decisions in thespatial and temporal-scales of data collection. Additionally, recent ad-vances in the use and understanding of Bayesian models in populationecology (Hooten and Hobbs, 2015) provide researchers with a malle-able modeling framework in scenario-specific models that can be rela-tively simply tailored to reduce the propensity of magnitude of theunderlying assumptions violated (e.g., Hobbs et al., 2015; Weegmanet al., 2016). A concern regarding many demographic analyses is thatthey require data (e.g., individually marked animals) that may not existfor many species prior to an incident. For this study, previous workfocused on piping plover demography (e.g., Roche et al., 2010; Catlinet al., 2015) provided a sample of marked individuals that could beimmediately incorporated into our analyses. However, 59% (n = 203)of the individuals in our analyses were originally marked following theDWH oil spill specifically for this study and that would have been asufficient sample size to draw inference in the absence of previouslymarked birds.
Acknowledgements
This study was performed under a contract with the U.S. Fish andWildlife Service, on behalf of the Natural Resource Trustees for theDeepwater Horizon Natural Resource Damage Assessment andRestoration case. We would like to acknowledge the numerous partners,land stewards, and technicians that made this work possible. We wouldlike to thank C. Aron, K. Brennan, R. Cobb, S. Coleman, B. Firmin, A.Hecht, and P. Kelly for their dedicated service and logistical help duringthe response. This work was performed under Institutional Animal Careand Use Committee permit number 14-003, and U.S. Fish and WildlifeService Threatened and Endangered Species permits TE070027-0 andTE103272-3.
Appendix A. Supplementary data
Supplementary data to this article can be found online at http://dx.doi.org/10.1016/j.biocon.2017.05.027.
References
Amirault-Langlais, D.L., Thomas, P.W., McKnight, J., 2007. Oiled piping plovers(Charadrius melodus melodus) in eastern Canada. Waterbirds 30, 271–274.
Andres, B.A., 1997. The Exxon Valdez oil spill disrupted the breeding of black oys-tercatchers. J. Wildl. Manag. 61, 1322–1328.
Andres, B.A., 1999. Effects of persistent shoreline oil on breeding success and chickgrowth in black oystercatchers. Auk 116, 640–650.
Atwood, T.C., Marcot, B.G., Douglas, D.C., Amstrup, S.C., Rode, K.D., Durner, G.M.,Bromaghin, J.F., 2016. Forecasting the relative influence of environmental and an-thropogenic stressors on polar bears. Ecosphere 7, e01370. http://dx.doi.org/10.1002/ecs2.1370.
Barbieri, M.M., Berger, J.O., 2004. Optimal predictive model selection. Ann. Stat. 32,870–897.
Below, T.H., 2010. Wintering and winter site-fidelity of piping plovers Charadrius melodusin SW Florida, USA. Wader Study Group Bull. 117, 51–55.
Bibby, C.J., Lloyd, C.S., 1977. Experiments to determine fate of dead birds at sea. Biol.Conserv. 12, 295–309.
Bodkin, J.L., Ballachey, B.E., Dean, T.A., Fukuyama, A.K., Jewett, S.C., McDonald, L.,Monson, D.H., O'Clair, C.E., VanBlaricom, G.R., 2002. Sea otter population status andthe process of recovery from the 1989 Exxon Valdez oil spill. Mar. Ecol. Prog. Ser.241, 237–253.
Bonisoli-Alquati, A., Stouffer, P.C., Turner, R.E., Woltmann, S., Taylor, S.S., 2016.Incorporation of Deepwater Horizon oil in a terrestrial bird. Environ. Res. Lett. 11,114023.
Bowyer, R.T., Blundell, G.M., Ben-David, M., Jewett, S.C., Dean, T.A., Duffy, L.K., 2003.Effects of the Exxon Valdez oil spill on river otters: Injury and recovery of a sentinelspecies. Wildl. Monogr. 153, 1–53.
Brooks, S.P., Gelman, A., 1998. General methods for monitoring convergence of iterativesimulations. J. Comput. Graph. Stat. 7, 434–455.
Burger, A.E., 1993. Estimating the mortality of seabirds following oil spills - effects of spillvolume. Mar. Pollut. Bull. 26, 140–143.
Burger, J., 1997. Effects of oiling on feeding behavior of sanderlings and semipalmatedplovers in New Jersey. Condor 99, 290–298.
Burger, J., Tsipoura, N., 1998. Experimental oiling of sanderlings (Calidris alba): behaviorand weight changes. Environ. Toxicol. Chem. 17, 1154–1158.
Burnham, K.P., Anderson, D.R., 2002. Model Selection and Multimodel Inference: A
D. Gibson et al.

Practical Information-Theoretic Approach. Springer, New York.Burns, C.M.B., Olin, J.A., Woltmann, S., Stouffer, P.C., Taylor, S.S., 2014. Effects of oil on
terrestrial vertebrates: predicting impacts of the Macondo blowout. Bioscience 64,820–828.
Byrd, G.V., Reynolds, J.H., Flint, P.L., 2009. Persistence rates and detection probabilitiesof bird carcasses on beaches of Unalaska Island, Alaska, following the wreck of theM/V Selendang Ayu. Mar. Ornithol. 37, 197–204.
Calvert, A.M., Amirault, D.L., Shaffer, F., Elliot, R., Hanson, A., McKnight, J., Taylor, P.D.,2006. Population assessment of an endangered shorebird: the piping plover(Charadrius melodus melodus) in eastern Canada. Avian Conserv. Ecol. 1, 4.
Catlin, D.H., Fraser, J.D., Felio, J.H., 2015. Demographic responses of piping plovers tohabitat creation on the Missouri River. Wildl. Monogr. 192, 1–42.
Cohen, J.B., Gratto-Trevor, C., 2011. Survival, site fidelity, and the population dynamicsof piping plovers in Saskatchewan. J. Field Ornithol. 82, 379–394.
Cohen, J.B., Fraser, J.D., Catlin, D.H., 2006. Survival and site fidelity of piping plovers onLong Island, New York. J. Field Ornithol. 77, 409–417.
Cornwall, W., 2015. Deepwater Horizon: after the oil. Science 348, 22–29.Dauvin, J.C., 2000. The muddy fine sand Abra alba - Melinna palmata community of the
bay of Morlaix twenty years after the Amoco Cadiz oil spill. Mar. Pollut. Bull. 40,528–536.
Deepwater Horizon Natural Resource Damage Assessment Trustees, 2016. DeepwaterHorizon Oil Spill: Final Programmatic Damage Assessment and Restoration Plan andFinal Programmatic Environmental Impact Statement. Retrieved from. http://www.gulfspillrestoration.noaa.gov/restoration-planning/gulf-plan.
Doherty, J.P., 2009. A modern, portable drop net can safely capture a suite of shorebirds.Waterbirds 32, 472–475.
Dominguez, J., Vidal, M., 2009. Factors affecting plumage oiling levels in a Kentish ploverCharadrius alexandrinus population after a major oil spill. Acta Ornithol. 44, 119–126.
Drake, K.R., Thompson, J.E., Drake, K.L., Zonick, C., 2001. Movements, habitat use, andsurvival of nonbreeding piping plovers. Condor 103, 259–267.
Flint, P.L., Fowler, A.C., Rockwell, R.F., 1999. Modeling bird mortality associated withthe M/V citrus oil spill off St. Paul Island, Alaska. Ecol. Model. 117, 261–267.
Ford, R.G., 2006. Using beached bird monitoring data for seabird damage assessment: theimportance of search interval. Mar. Ornithol. 34, 91–98.
Fowler, A.C., Flint, P.L., 1997. Persistence rates and detection probabilities of oiled kingeider carcasses on St Paul Island, Alaska. Mar. Pollut. Bull. 34, 522–526.
Franci, C.D., Guillemette, M., Pelletier, E., Chastel, O., Bonnefoi, S., Verreault, J., 2014.Endocrine status of a migratory bird potentially exposed to the Deepwater Horizon oilspill: a case study of northern gannets breeding on Bonaventure Island, EasternCanada. Sci. Total Environ. 473–474, 110–116.
Friedrich, M.J., Hunt, K.L., Catlin, D.H., Fraser, J.D., 2015. The importance of site to matechoice: mate and site fidelity in piping plovers. Auk 132, 265–276.
Garrott, R.A., Eberhardt, L.L., Burn, D.M., 1993. Mortality of sea otters in Prince-Williamsound following the Exxon-Valdez oil-spill. Mar. Mamm. Sci. 9, 343–359.
George, E.I., McCulloch, R.E., 1993. Variable selection via Gibbs sampling. J. Am. Stat.Assoc. 88, 881–889.
Ghosh, J., 2015. Bayesian model selection using the median probability model. WileyInterdiscip. Rev. Comput. Stat. 7, 185–193.
Gratto-Trevor, C., Haig, S.M., Miller, M.P., Mullins, T.D., Maddock, S., Roche, E., Moore,P., 2016. Breeding sites and winter site fidelity of piping plovers wintering in theBahamas, a previously unknown major wintering area. J. Field Ornithol. 87, 29–41.
Haig, S.M., Oring, L.W., 1988. Distribution and dispersal in the piping plover. Auk 105,630–638.
Haig, S.M., Plissner, J.H., 1993. Distribution and abundance of piping plovers - resultsand implications of the 1991 International Census. Condor 95, 145–156.
Haig, S., Ferland, C., Cuthbert, F., Dingledine, J., Goossen, J., Hecht, A., McPhillips, N.,2005. A complete species census and evidence for regional declines in piping plovers.J. Wildl. Manag. 69, 160–173.
Hampton, S., Zafonte, M., 2006. Factors influencing beached bird collection during theLuckenbach 2001/02 oil spill. Mar. Ornithol. 34, 109–113.
Haney, J.C., Geiger, H.J., Short, J.W., 2014. Bird mortality from the Deepwater Horizonoil spill. I. Exposure probability in the offshore Gulf of Mexico. Mar. Ecol. Prog. Ser.513, 225–237.
Hayes, M.O., Michel, J., 1999. Factors determining the long-term persistence of ExxonValdez oil in gravel beaches. Mar. Pollut. Bull. 38, 92–101.
Hayworth, J.S., Clement, T.P., John, G.F., Yin, F., 2015. Fate of Deepwater Horizon oil inAlabama's beach system: understanding physical evolution processes based on ob-servational data. Mar. Pollut. Bull. 90, 95–105.
Henkel, J.R., Sigel, B.J., Taylor, C.M., 2012. Large-scale impacts of the DeepwaterHorizon oil spill: can local disturbance affect distant ecosystems through migratoryshorebirds? Bioscience 62, 676–685.
Henkel, J.R., Sigel, B.J., Taylor, C.M., 2014. Oiling rates and condition indices ofshorebirds on the northern Gulf of Mexico following the Deepwater Horizon oil spill.J. Field Ornithol. 85, 408–420.
Hobbs, N.T., Geremia, C., Treanor, J., Wallen, R., White, P.J., Hooten, M.B., Rhyan, J.C.,2015. State-space modeling to support management of brucellosis in the Yellowstonebison population. Ecol. Monogr. 85, 3–28.
Hooten, M.B., Hobbs, N.T., 2015. A guide to Bayesian model selection for ecologists. Ecol.Monogr. 85, 525–556.
Kery, M., Schaub, M., 2012. Bayesian Population Analysis Using WinBUGS - AHierarchical Perspective. Academic Press, Burlington.
Kingston, P.F., 2002. Long-term environmental impact of oil spills. Spill Sci. Technol.Bull. 7, 53–61.
Lane, S.M., Smith, C.R., Mitchell, J., Balmer, B.C., Barry, K.P., McDonald, T., Mori, C.S.,Rosel, P.E., Rowles, T.K., Speakman, T.R., Townsend, F.I., Tumlin, M.C., Wells, R.S.,Zolman, E.S., Schwacke, L.H., 2015. Reproductive outcome and survival of common
bottlenose dolphins sampled in Barataria Bay, Louisiana, USA, following theDeepwater Horizon oil spill. Proc. R. Soc. B Biol. Sci. 282, 20151944.
Lauritsen, A.M., Dixon, P.M., Cacela, D., Brost, B., Hardy, R., MacPherson, S.L., Meylan,A., Wallace, B.P., Witherington, B., 2017. Impact of the Deepwater Horizon oil spillon loggerhead turtle Caretta caretta nest densities in northwest Florida. Endanger.Species Res. 33, 83–93.
Ledee, O.E., Arnold, T.W., Roche, E.A., Cuthbert, F.J., 2010. Use of breeding and non-breeding encounters to estimate survival and breeding-site fidelity of the pipingplover at the Great Lakes. Condor 112, 637–643.
Leighton, F.A., 1993. The toxicity of petroleum oils to birds. Environ. Rev. 1, 92–103.Levy, J.K., Gopalakrishnan, C., 2010. Promoting ecological sustainability and community
resilience in the US gulf coast after the 2010 Deepwater Horizon oil spill. J. Nat.Resour. Policy Res. 2, 297–315.
Lyons, J.E., Kendall, W.L., Royle, J.A., Converse, S.J., Andres, B.A., Buchanan, J.B., 2016.Population size and stopover duration estimation using mark-resight data andBayesian analysis of a superpopulation model. Biometrics 72, 262–271.
Macnaughton, S.J., Stephen, J.R., Venosa, A.D., Davis, G.A., Chang, Y.J., White, D.C.,1999. Microbial population changes during bioremediation of an experimental oilspill. Appl. Environ. Microbiol. 65, 3566–3574.
McGowan, C.P., Ryan, M.R., Runge, M.C., Millspaugh, J.J., Cochrange, J.F., 2011. Therole of demographic compensation theory in incidental take assessments for en-dangered species. Biol. Conserv. 144, 730–737.
McNutt, M.K., Camilli, R., Crone, T.J., Guthrie, G.D., Hsieh, P.A., Ryerson, T.B., Savas, O.,Shaffer, F., 2012. Review of flow rate estimates of the Deepwater Horizon oil spill.Proc. Natl. Acad. Sci. U. S. A. 109, 20260–20267.
Melvin, S.M., Griffin, C.R., Macivor, L.H., 1991. Recovery strategies for piping plovers inmanaged coastal landscapes. Coast. Manag. 19, 21–34.
Mendelssohn, I.A., Andersen, G.L., Baltz, D.M., Caffey, R.H., Carman, K.R., Fleeger, J.W.,Joye, S.B., Lin, Q., Maltby, E., Overton, E.B., Rozas, L.P., 2012. Oil impacts on coastalwetlands: implications for the Mississippi River delta ecosystem after the DeepwaterHorizon oil spill. Bioscience 62, 562–574.
Michel, J., Owens, E.H., Zengel, S., Graham, A., Nixon, Z., Allard, T., Holton, W., Reimer,P.D., Lamarche, A., White, M., Rutherford, N., Childs, C., Mauseth, G., Challenger, G.,Taylor, E., 2013. Extent and degree of shoreline oiling: Deepwater Horizon oil spill,Gulf of Mexico, USA. PLoS One 8.
Miller, A.D., Roxburgh, S.H., Shea, K., 2011. How frequency and intensity shape diversity-disturbance relationships. Proc. Natl. Acad. Sci. U. S. A. 108, 5643–5648.
Millward, A.A., Kraft, C.E., 2004. Physical influences of landscape on a large-extentecological disturbance: the northeastern North American ice storm of 1998. Landsc.Ecol. 19, 99–111.
Monson, D.H., Doak, D.F., Ballachey, B.E., Johnson, A., Bodkin, J.L., 2000. Long-termimpacts of the Exxon Valdez oil spill on sea otters, assessed through age-dependentmortality patterns. Proc. Natl. Acad. Sci. U. S. A. 97, 6562–6567.
Murphy, S.M., Mabee, T.J., 2000. Status of black oystercatchers in Prince William Sound,Alaska, nine years after the Exxon Valdez oil spill. Waterbirds 23, 204–213.
Nixon, Z., Zengel, S., Baker, M., Steinhoff, M., Fricano, G., Rouhani, S., Michel, J., 2016.Shoreline oiling from the Deepwater Horizon oil spill. Mar. Pollut. Bull. 107,170–178.
Noel, B.L., Chandler, C.R., 2008. Spatial distribution and site fidelity of non-breedingpiping plovers on the Georgia Coast. Waterbirds 31, 241–251.
O'Hara, R.B., Sillanpaa, M.J., 2009. A review of bayesian variable selection methods:what, how and which. Bayesian Anal. 4, 85–117.
Page, G.W., Carter, H.R., Ford, R.G., 1990. Numbers of seabirds killed or debilitated in the1986 Apex Houston oil spill in central California. Stud. Avian Biol. 14, 164–174.
Peterson, C.H., 2001. The Exxon Valdez oil spill in Alaska: acute, indirect and chroniceffects on the ecosystem. Adv. Mar. Biol. 39, 1–103.
Peterson, C.H., Rice, S.D., Short, J.W., Esler, D., Bodkin, J.L., Ballachey, B.E., Irons, D.B.,2003. Long-term ecosystem response to the Exxon Valdez oil spill. Science 302,2082–2086.
Piatt, J.F., Ford, R.G., 1996. How many seabirds were killed by the Exxon Valdez oil spill.In: Proceedings of the Exxon Valdez Oil Spill Symposium 18, pp. 712–719.
Piatt, J.F., Lensink, C.J., Butler, W., Kendziorek, M., Nysewander, D.R., 1990. Immediateimpact of the Exxon Valdez oil-spill on marine birds. Auk 107, 387–397.
Plummer, M., 2003. A program for analysis of Bayesian graphical models using Gibbssampling. In: 3rd International Workshop on Distributed Statistical Computing(DCS2003), Vienna, Austria.
R Core Team, 2012. R: A language and environment for statistical computing. In: RFoundation for Statistical Computing, Vienna, Austria, (URL http://www.R-project.org/).
Rice, S.D., Thomas, R.E., Carls, M.G., Heintz, R.A., Wertheimer, A.C., Murphy, M.L.,Short, J.W., Moles, A., 2001. Impacts to pink salmon following the Exxon Valdez oilspill: persistence, toxicity, sensitivity, and controversy. Rev. Fish. Sci. 9, 165–211.
Roche, E.A., Cohen, J.B., Catlin, D.H., Amirault-Langlais, D.L., Cuthbert, F.J., Gratto-Trevor, C.L., Felio, J., Fraser, J.D., 2010. Range-wide piping plover survival: corre-lated patterns and temporal declines. J. Wildl. Manag. 74, 1784–1791.
Rooker, J.R., Kitchens, L.L., Dance, M.A., Wells, R.J.D., Falterman, B., Cornic, M., 2013.Spatial, temporal, and habitat-related variation in abundance of pelagic fishes in theGulf of Mexico: potential implications of the Deepwater Horizon oil spill. PLoS ONE8, 1–9.
Root, B.G., Ryan, M.R., Mayer, P.M., 1992. Piping plover survival in the Great Plains. J.Field Ornithol. 63, 10–15.
Royle, J.A., Dorazio, R.M., 2012. Parameter-expanded data augmentation for Bayesiananalysis of capture-recapture models. J. Ornithol. 152, S521–S537.
Saunders, S.P., Arnold, T.W., Roche, E.A., Cuthbert, F.J., 2014. Age-specific survival andrecruitment of piping plovers Charadrius melodus in the Great Lakes region. J. AvianBiol. 45, 437–449.
D. Gibson et al.
Schwacke, L.H., Thomas, L., Wells, R.S., McFee, W.E., Hohn, A.A., Mullin, K.D., Zolman,E.S., Quigley, B.M., Rowles, T.K., Schwacke, J.H., 2017. Quantifying injury tocommon bottlenose dolphins from the Deepwater Horizon oil spill using an age-, sex-and class-structured population model. Endanger. Species Res. 33, 265–279.
Silliman, B.R., van de Koppel, J., McCoy, M.W., Diller, J., Kasozi, G.N., Earl, K., Adams,P.N., Zimmerman, A.R., 2012. Degradation and resilience in Louisiana salt marshesafter the BP-Deepwater Horizon oil spill. Proc. Natl. Acad. Sci. U. S. A. 109,11234–11239.
Sutherland, W.J., Newton, I., Green, R.E., 2004. Bird Ecology and Conservation: AHandbook of Techniques. Oxford University Press, New York, New York.
Tran, T., Yazdanparast, A., Suess, E.A., 2014. Effect of oil spill on birds: a graphical assayof the Deepwater Horizon oil spill's impact on birds. Comput. Stat. 29, 133–140.
Van Pelt, T.I., Piatt, J.F., 1995. Deposition and persistence of beachcast seabird carcasses.Mar. Pollut. Bull. 30, 794–802.
Velando, A., Munilla, I., Leyenda, P.M., 2005. Short-term indirect effects of the prestigeoil spill on European shags: changes in availability of prey. Mar. Ecol. Prog. Ser. 302,263–274.
Votier, S.C., Hatchwell, B.J., Beckerman, A., McCleery, R.H., Hunter, F.M., Pellatt, J.,Trinder, M., Birkhead, T.R., 2005. Oil pollution and climate have wide-scale impactson seabird demographics. Ecol. Lett. 8, 1157–1164.
Votier, S.C., Birkhead, T.R., Oro, D., Trinder, M., Grantham, M.J., Clark, J.A., McCleery,R.H., Hatchwell, B.J., 2008. Recruitment and survival of immature seabirds in
relation to oil spills and climate variability. J. Anim. Ecol. 77, 974–983.Walter, S.T., Carloss, M.R., Hess, T.J., Leberg, P.L., 2014. Demographic trends of Brown
pelicans in Louisiana before and after the Deepwater Horizon oil spill. J. FieldOrnithol. 85, 421–429.
Weegman, M.D., Bearhop, S., Fox, A.D., Hilton, G.M., Walsh, A.J., McDonald, J.L.,Hodgson, D.J., 2016. Integrated population modelling reveals a perceived source tobe a cryptic sink. J. Anim. Ecol. 85, 467–475.
White, G.C., Burnham, K.P., 1999. Program MARK: survival estimation from populationsof marked animals. Bird Study 46, 120–139.
Wiens, J.A., Parker, K.R., 1995. Analyzing the effects of accidental environmental im-pacts: approaches and assumptions. Ecol. Appl. 5, 1069–1083.
Williams, R., Gero, S., Bejder, L., Calambokidis, J., Kraus, S.D., Lusseau, D., Read, A.J.,Robbins, J., 2011. Underestimating the damage: interpreting cetacean carcass re-coveries in the context of the Deepwater Horizon/BP incident. Conserv. Lett. 4,228–233.
Winder, V.L., Gregory, A.J., McNew, L.B., Sandercock, B.K., 2015. Responses of maleGreater Prairie-Chickens to wind energy development. Condor 117, 284–296.
Withers, K., 2002. Shorebird use of coastal wetland and barrier island habitat in the Gulfof Mexico. Sci. World J. 2, 514–536.
Zafonte, M., Hampton, S., 2007. Exploring welfare implications of resource equivalencyanalysis in natural resource damage assessments. Ecol. Econ. 61, 134–145.
D. Gibson et al.