evaluating the impact of trade agreement for central america · pdf fileevaluating the impact...
TRANSCRIPT

Evaluating the impact of trade agreement for Central America:
Does trade integration improve poverty and inequality?1
Paolo Giordano and Masakazu Watanuki2
April 2008
Draft for discussion: comments are welcome. Please do not circulate.
Abstract
In recent years, trade and poverty have received enormous attention in Latin America and elsewhere. In Central America, this issue was culminated in the CAFTA negotiations and its subsequent ratification processes. Despite impressive achievements in the external fronts in the 1990s, the speed of improvement in poverty has been slow. High and persistent inequality remained unchanged. Central America is now engaged in the negotiations of a bi-regional trade agreement with the European Union. This study evaluates the impact of this trade agreement. We apply a sequential, top-down, CGE-microsimulation approach. The simulation results show that the agreement will be a favorable option. It is welfare-improving and unambiguously expansionary. Agriculture and agro-industries will be big winners. Central American will strengthen their comparative advantage in agriculture. But the agreement has little effects in enhancing export diversification of manufactured sectors, changing the economic structure and strengthening technology-intensive industries. The microsimulation analysis shows the agreement will have pro-poor and, to a lesser extent, pro-equality effects. Income generation process via labor market is the determinant factor to reduce poverty. Trade agreement will generate the positive impact on labor market for low- and semi-skilled workers—employment creation, wages increases or both. The aggregate inequality declines but, may not necessarily fall in all regions. In coordination with other domestic policies, Central America should well consider liberalization process in agriculture, which will be the focal point of the negotiations. Improved market access is the key of making trade work. But, export growth does not necessarily guarantee to reduce poverty. Lessons from CAFTA process should be fully capitalized. When all of these work, trade will play as a powerful catalyst for poverty reduction, and the agreement will truly give a window of opportunities for the bloc. Keywords: Central America, Regional Integration, CGE Model, Micro-simulation
1 Paper presented at the GTAP Eleventh Annual Conference “Future of Global Economy", in Helsinki, Finland, June 12-14, 2008. This study received support of the Trade and Poverty Trust Fund of the Inter-American Development Bank (IDB). The authors are grateful to Augusto Stabilito for his superb research assistance. 2 The views expressed in this document are those of the authors, and do not necessarily reflect views of the Inter-American Development Bank and its member countries. The authors are responsible for remaining errors and omissions. [email protected]; [email protected].
- 1 -

1. Introduction In recent years, trade and poverty, two key policy ingredients, have received enormous attention in Latin America and elsewhere. In Central America, this issue was culminated in the negotiations of CAFTA, the historic free-trade agreement between the United States and five countries in Central America (Costa Rica, El Salvador, Guatemala, Honduras and Nicaragua. Throughout Central America, the negotiations and the subsequent national ratifications drew fierce political debates and social protests organized by socially and economically the weak: trade unions, farmers and civic groups. Particularly in Costa Rica, the country was deeply divided and forced to render a referendum, which finally yielded to ratify the agreement by a narrow margin. Trade and integration have been and continue to be an engine for growth. Since the 1980s, Central America has implemented sweeping trade liberalization in a three-tier approach. 3 While tariffs on external trade were dramatically reduced and non-tariff barriers were widely eliminated, CACM was reactivated: intra-bloc free trade and the adoption of common external tariffs (CET). These active trade reforms have generated visible outcomes. In the 1990s, the bloc has achieved significant growth of trade and diversification of trade. As a result, CACM has achieved the highest degree of trade openness: 0.75 as a percent of GDP (World Bank, 2005). Despite this impressive achievement in trade and integration fronts, the economic performance has been mediocre or lackluster.4 From the start of this decade, Central America has been strongly influenced by the global economic upheavals. Latin American economic crisis occurred at the end of the 1990s has choked off the region’s economy. The bloc’s economic growth was much slower than in the late 1990s and lagged behind the rest of Latin America, due to adverse external factors on one hand, and the decline of export dynamism of maquila trade due to stronger competition from China and other Asian countries for their major market, the United States (IDB, 2007), one the other hand. In this sense, CAFTA is a vital strategy for Central America, to consolidate the preferential market access under the Caribbean Basin Initiative (CBI) program. Yet the closer trade link with the Unites States, which was already high before CAFTA, would expose the bloc to greater vulnerability of the US economic cycle. Poverty is the topmost important domestic agenda in Central America. Since the early 1990s, poverty is declining thanks partially to trade and integration initiatives, but its speed is considerably slow. Statistics show that the higher the initial poverty is, the slower the progress is. According to ECLAC (2005), Guatemala is the best performer in reducing poverty by 9 percent in 1989-2002, followed by 6 percent in Costa Rica and 5.3 percent in El Salvador, whereas Honduras is the worst; it took 12 years to reduce poverty by 2.7 percent from 80.8 percent in 1990 to 77.3 percent in 2002, which is still extremely high. The progress is somewhat better in Nicaragua, but remains underperformed. In Central America, poverty is still extremely high particularly in rural and hinterland regions.5 Trade and integration have made a significant contribution to growth in Central America in the 1990s, but its impact has not been sufficient enough to lift the aggregate growth to transform the economies in the region and to radically reduce poverty (World Bank, 2005). 3 Trade liberalization undertaken in Central America and other Latin America comprises: multilateral liberalization under the auspices of the then GATT-WTO; regional initiatives, coined as “open regionalism”; and unilateral approach. 4 See World Bank (2005) for the annual GDP growth for each country between 1990 and 2004, and Moreno-Brid (2003) for longer records in the period of 1950-1999. 5 But it is also ironically true that the majority of the poor is likely to live in Metropolitan (Central) region with higher income due to larger population share. For instance, 50 percent of the poor live in Central region in Costa Rica and 60 percent in Honduras. Nicaragua is the exception; Metropolitan Managua has the smallest 15 percent of tha nation’s poor.
- 2 -

Inequality is also a paramount policy issue. In common with other countries in Latin America, Central America has high inequitable and inflexible income distribution. While poverty was improved slowly in the 1990s, the region’s performance on inequality was a slight disappointment. Poverty declined a little in Honduras, but essentially remained unchanged in Nicaragua, whereas it worsened, albeit at a small margin, in Costa Rica and El Salvador (De Ferranti et al, 2003). According to ECLAC (2006), Honduras with 0.584 Gini index is ranked in a “very high” inequality group, and Nicaragua is placed in the worst in the “high” inequality class. Costa Rica and El Salvador are, on the other hand, grouped in “mid-level” category. Recently there is a burgeoning literature and a large number of empirical studies analyzing the impact of trade on poverty and, to lesser extent, on inequality. Applying cross country regression analysis, Dollar and Kraay (2001) find that average income of the poorest quintile moved almost one-for-one with the average income. Winters, McCulloch and McKay (2004) conclude that the empirical evidence, which broadly supports the view that trade liberalization, following the economic theory, is poverty-alleviating in the long run and on average. In their evaluation of trade and financial liberalization in Latin America, Ganuza, Paes de Barros and Vos (2002) find that trade liberalization has clear positive impact on poverty. In contrast, the empirical findings of trade on inequality are mixed. Barro (2000), Lundberg and Squire (2003) and Lopez (2004) find that trade tends to widen inequality at least in low-income countries, while Dollar and Kraay (2004) find no correlation between openness to trade and income distribution. In the meantime, Kraay (2003) finds some evidence that openness reduces poverty and inequality. For Latin America, Ganuza, Paes de Barros and Vos (2002) report that the impact of trade liberalization on inequality is more ambiguous. They also draw to conclusion that changes in wages are the most important determinant in the changes in inequality, more important than the changes in employment or labor participation. Following the EU-Central America Summit in May 2006 and the subsequent Association Agreement in June 2006, Central America held the first round of the negotiations in October 2007 to conclude a bi-regional free trade agreement. With CAFTA in place, Central America secured the most important market. But this also makes the region more vulnerable to the US economic cycle, as seen today, due to closer trade and economic linkages, which has been already high before CAFTA. In this sense, the EU negotiations will be a window of opportunity for the bloc, although being difficult and complicated, as both have sensitive issues particularly in market access in agriculture. In view of these development challenges at external fronts and social dimensions, this study aims to evaluate the potential impact of the EU-CACM trade agreement on each of the Central American countries. The key policy questions on the external fronts are (i) what will be the impact of the agreement; is it welfare-enhancing or not? (ii) which sectors will gain and which will lose; particularly is agriculture hurt or benefited? (iii) does the agreement have complementary effects to counterbalance the negative impact and enhance positive outcomes of CAFTA? For the social dimensions, main questions are: (i) does poverty reduce and inequality improve? (ii) if so, what would be the magnitude of the improvement? (iii) is the impact over regions even or heterogonous; in other words, are the poor in rural or hinterland regions better off or worse off faster than the poor in urban or Metropolitan area? To answer these policy questions, we apply a sequential top-down CGE model plus microsimulation analysis. The first step is undertaken by a new global, multi-region static CGE model, which incorporates several innovations in modeling and data to capture the reality in Central America. The second step is implemented by the microsimulation methodology for each region in three countries: Costa Rica, Honduras and Nicaragua. The impacts simulated by the CGE model, expressed in the vectors of factor returns and commodity prices, are transferred to individual households, who are disaggregated by location, through different income generation processes.
- 3 -

In short, regional agreement with the European Union is a favorable and appealing option for the region, to increase social welfare, to reduce poverty and improve inequality. The CGE simulation results indicate that the agreement are unambiguously expansionary, generating small but positive effects on trade, production and other macro variables. Reflecting large share in exports and the EU’s high initial protection, agriculture and agro-industries appear to be the clear winners. But this will be at the expense of capital-intensive manufacturing industries. Domestic resources move away from heavy industries to agro-industries and agriculture, which will also create employment particularly in non-high skill workers. Because of almost perfectly complementary trade linkage—exporting agriculture and agro-products in exchange for capital goods—the agreement has little effects to enhance export diversification outside agriculture and agro-industries, and is unlikely to reinforce technology-intensive industries. The microsimulation analysis shows the agreement is pro-poor, increasing social welfare and reducing the incidence of the poor. Shown in many empirical studies, income generation via labor market is the determinant factor to reduce poverty by raising household income of the poor. Following the economic theory, and as Winters, McCulloch and McKay (2004) point, growth effects play a key role in reducing poverty. The impact is greater in fast-growing countries, as they increase employment opportunities and wages or both. Geographically poverty declines much faster in agriculture-dominant regions, where labor-intensive agriculture hires more workers particularly in low- and semi-skilled classes. The aggregate impact on inequality is marginal but positive. There cannot be found valid pattern between the initial levels of inequality and the magnitude of the impact. In Costa Rica, regions with low initial inequality improve the most, due probably to the structure of the least inequitable income distribution, whereas the opposite is the case in Honduras, where inequality declines the most within region. In the meantime, inequality within region modestly rises in region with initially high inequality. This is also the case in Nicaragua, but at much lesser extent. The rest of the paper is organized as follows. Section 2 presents the analytical approaches-CGE model used in the first step, key extensions and innovations, followed by the microsimulation approach in the second step. Section 3 documents the socio-economic features of the Central American countries at the benchmark, to provide the foundation and background to understand the subsequent CGE simulation and microsimulation results. This section analyzes the structure of trade and protection in some detail. Section 4 reports macroeconomic and sectoral impacts on trade. Section 5 evaluates the impact of the trade agreements on poverty and inequality. Finally, Section 6 summarizes the main findings and conclusions.
2. Analytical Approaches In this study, we apply a CGE model-microsimulation methodology in a two-step, top-down sequential approach. At the top tier, a multi-region CGE model evaluates the impact of trade integration option for Central America. At the second stage, the microsimulation analysis is carried out to measure the impact on poverty and inequality over the entire households with new income vectors, which are estimated from the economy-wide impacts simulated by the CGE model.
2.1. IDB-INT CACM CGE Model To evaluate trade integration options on poverty and inequality for Central America, we develop a new CGE model, called IDB-INT CACM-Central American Common Market-model, which accommodates economic structures unique to the region. The model is a global, multi-region, multi-sector, static model
- 4 -

comprising 19 countries6 and regions with 27 sectors, which are aggregates into six macro sectors. All regions are fully endogenized and linked only through trade. Therefore, the model only deals with the real side of the economy and does not consider financial or monetary markets. It is built on individual Social Accounting Matrices (SAMs) for each region and country, benchmarked at base year 2004. Each region in the model traces the circular flows of income through factor payments from producers to institutions—households, firms and government—and back to final demand for goods in commodity markets. These institutions represent the respective economic agents, whose behaviors and interactions are explicitly specified in the model. Private consumption, intermediate use, government consumption and investment are the four components of domestic demand. Households in each region choose the optimal levels of commodity bundles for their consumption by maximizing their utility, which is expressed in Cobb-Douglas function, subject to the budget constraint and given market prices. The government collects various taxes and receives foreign transfers, and allocates for goods and services, earmarks subsidies to domestic institutions (households and firms), and amortizes payments to domestic and foreign lenders. For each sector, the model explicitly specifies output-supply and input-demand equations. Production consists of intermediate inputs determined by the Leontief fixed IO coefficients, plus primary factors, which are specified in a function of constant elasticity of substitution (CES) with a constant returns-to-scale technology. Producers maximize profits, implying that each factor is demanded in such a way that marginal value product exactly equals its corresponding marginal cost. However, each factor does not necessarily generate a uniform returns (wages, capital rent and land prices) across sectors. Instead, the model incorporates factor market rigidities or distortions, which exogenously fix the ratios of the relative sectoral returns to the economy-wide average return for that factor at benchmark. Primary factors comprise labor with six categories, capital, land, and natural resources. The treatment of international trade follows the standard specifications in common with other trade-focused CGE models. The model specifies a set of export-supply and import-demand equations for traded sectors, allowing national product differentiation. Both exports and imports are modeled in a two-stage nested structure. Exports are modeled in a constant elasticity of transformation (CET) function. The optimal allocation of supply is determined by revenue-maximization choice between domestic sales and aggregate export supply at the upper stage, and among exports destined to different markets at lower stage. At the lower stage, however, the specification of imperfect substitutes for some products in certain regions or countries can be partially or entirely turned off, permitting perfect substitutes. Likewise imports are modeled by a constant elasticity of substitution (CES) function, following the “Armington” assumption. 7 The optimal allocation of demand is determined by cost-minimization choice between domestic demand and aggregate import purchases at the upper level, and imports from different markets at lower stage. In factor markets, the model applies different treatments, reflecting certain peculiarities due to geographic differences. For labor, the model includes multiple labor categories and applies different treatments between Central America—detailed in the following section—and non-Central America. For the latter, labor market in each region is decomposed into skilled and non-skilled categories. Labor is mobile across sectors within each region or country. In non-Central American regions, the supply of unskilled labor is endogenous for developing regions, whereas it is fixed for developed regions. No international labor migration is allowed. Capital is mobile only within each region, and its aggregate supply is fixed at
6 Regions in the model are five Central American countries (Costa Rica, El Salvador, Guatemala, Honduras, Nicaragua), 10 hemispheric countries (Canada, United States, Mexico, Colombia, Ecuador, Peru, Venezuela, Argentina, Brazil, Chile) and four extra-hemispheric partners (European Union, Japan, China, rest of world). 7 Armington (1969).
- 5 -

benchmark. Land is used only in agriculture, and sector-specific in developed regions, but mobile across sectors in developing regions due to the fact that multiple cropping patters are common and farmers easily shift from one crop to another in view of domestic and international demands. Natural resources are treated as fixed factors in all countries and regions. Although being in static nature, the model incorporates exogenous total factor productivity (TFP) growth in the production process. It is widely acknowledged that trade liberalization or trade openness has dynamic effects on productivity, arising from economies of scale, externalities, technological spillovers, specialization, increased investment and so on.8 Empirical studies show that developing countries can boost domestic productivity through technological spillovers by importing a variety of intermediate inputs and capital goods that embody foreign knowledge, particularly in the formation of North-South trade agreements. 9 This is a crucial element for small open economies in Central America, where trade is key driving force for growth and foreign currency earnings, enhancing global competitiveness in production and exports. In the model, there are three key macroeconomic closures: public finance; saving-investment; and external balance. There are a large number of different choices available. The choice does not affect the equilibrium solution, which exactly replicate the SAMs at benchmark, but influences simulation results because of different closure rules. The key is which choice in each closure would be the most appropriate and realistic to meet the objectives of the study. For government fiscal balance, there are several options, namely endogenizing one of tax variables, transfers to domestic institutions or public savings. We apply the last, which is determined residually as the gap between current revenues and expenditures, while all transfers are fixed. This treatment allows fiscal surplus or deficit to adjust to balance public finance.10 Moreover, to control possible welfare effects arising from variations in public spending, government consumption demand is fixed in real term. For saving-investment balance, the current amount of nominal investment must be completely financed by the aggregate savings in each country and region. This is because the model is of the static nature and does not allow international capital mobility over regions. The model applies “investment-driven” Johansen closure, so that private saving rates are endogenous. This is intended to avoid misleading welfare effects arising from changes in foreign savings and investment. For external market closure, there are basically two options: (i) fixed trade balance, and (ii) fixed exchange rate. The choice depends on time horizon to be considered, responsiveness or resilience to the external shocks of the countries or regions under study, and the objective of the study. The former alternative enables us to evaluate the impact on real exchange rates, associated with changes in trade flows. With fixed external capital flows and transfers, an increase in import demand due to trade liberalization must be financed by increased exports. This enables us to capture dynamic interactions among domestic resources, production, trade in the external account. Declines in domestic import prices reduce domestic input costs and drive resources to exporting sectors due to rising demand by partners. 8 Cross-country studies on productivity include: Coe and Helpman (1995); Coe, Helpman and Hoffmaister (1997); Nicita and Olarreaga (2001); and Schiff, Wang and Olarreaga (2002). County-specific studies include: Karacaovali (2006) for Colombia; Trybout and Westbrook (1995) for Mexico; Moreira (2000), Muendler (2004), and Schor (2004) for Brazil; Lopez-Cordoba and Moreira (2002) for Mexico and Brazil respectively; and Roberts (2001) and Stiroh (2001) for the United States. Some studies apply the endogenous link into the CGE models. They include: de Melo and Robinson (1992); Lewis, Robinson and Wang (1995); Hinojosa-Ojeda, Lewis and Robinson (1997); Monteagudo, Stabilito, and Watanuki (2004), Giordano and Watanuki (2007). 9 See Schuff and Winters (2003) for comprehensive analysis on regional integration. De Melo and Panagariya also analyze various trading blocs in the context of regionalism vs. multilateralism. 10 Fiscal neutral assumption adopted by, for instance, van der Mensbrugghe (2005) or Harrison, Rutherford and Tarr (2003), may not be necessarily appropriate for some countries. See Taylor and von Arnim (2006).
- 6 -

Thus, exchange rates play a role to equilibrate external market balances. In other words, trade is balanced for each country and region valued at world prices; initial balance of trade in goods and services remains constant. On the other hand, the latter closure measures the impact on the position of trade balance due to changes in demand at home and by partners.11 In short, the former is in long-term perspective, whereas the latter is in short-run nature. Refer to Lofgren, Harris and Robinson (2001) for concise and detailed explanations regarding three alternative macro closure rules.
2.2. Extensions and Innovations of the CGE Model Recently a dozen of studies, applying country-specific CGE models, evaluate trade and integration policies for Central America. Sauma and Sànchez (2004) examine various liberalization options for Costa Rica, Cuesta and Sànchez (2004) for Honduras, and Acevedo (2004) for El Salvador. All of them apply static CGE models. As CAFTA became the most politically sensitive and focused trade agenda in the western hemisphere, several studies attempted to measure the possible effects of CAFTA on poverty and inequality, using CGE-microsimulation top-down approach. Sànchez and Vos (2006, 2007) assess the impact for Costa Rica and Nicaragua. while Morley, Nakasone and Piñeiro (2007, 2008) examine the agreement for El Salvador and Honduras, respectively. Both studies apply dynamic recursive models. Bussolo and Niimi (2007) measure the impact for Nicaragua, using a static model. On the other hand, a handful of studies evaluate the impact of CAFTA for Central America in the context of US-centered FTAs, with the use of multi-region CGE models. Hiraire and Yang (2004) simulate CAFTA, using the static GTAP model. Brown, Kiyota and Stern (2004) analyze the agreement, with their Michigan monopolistic competition model. Francois, Rivera and Rojas-Romagosa (2007) assess the CAFTA agreement for the region—Costa Rica and the rest of Central America—with the GTAP model and new database. Although these studies provide first-hand assessment of the CAFTA impact on Central America, they have some important technical issues on three grounds related to maquila and zona franca, operated in export processing zone. They are considerably important economic activities in terms of production, trade, employment and current account and unique in Central America. First, trade flows of these activities are not differentiated from ordinary goods. Treatment of trade of these products is not uniform in Central America: some do not handle it as merchandise trade, others deal with trade as a value added in trade account, while the rest applies in services account. Because of its magnitude in trade, it is of particular importance to grasp clear commodity flows between origin, home (Central America) and destination. Second, related to the first, the true nature of these activities is not well accurately modeled and captured. Because of its nature of production sharing from firms’ viewpoint, these activities involve quite high import/export shares. The net gain in Central America is to generate value added by re-exporting these products. In a standard CGE modeling, exports are specified either by constant elasticity of transformation (CET) or perfect substitute between domestic sales and the aggregate exports. Irrespective of the specifications, these forms hugely overestimate domestic production capacity of these activities, because they cannot express the nature of re-exports. Moreover, production technology is quite different between domestic production and these activities. While the former uses high inter-industry inputs due to backward and forward linkages, the latter has little production linkage with domestic industries.
11 Under the second closure, trade balance in developing countries tends to sharply deteriorate as a result of greater tariff elimination or reduction in many developing than in developed regions. Imports tend to increase faster than exports, replacing domestic production.
- 7 -

Third, protection (tariffs) for maquila and zona franca is not accurately measured or adjusted at all. These activities are operated in free-zone, so that imports are duty-free in Central America. This is also true in case the origin and the destination are the same; for instance, the United States has essentially zero tariffs on maquila imports from Central America meeting the standards of rules of origin, while imposing high tariffs on non-maquila products. In this respect, USITC (2004) adjust tariffs both in the United States and Central America in their evaluations of the CAFTA-DR agreement. Thus, one should be careful about that the model simulations without capturing re-export nature, appropriate production specifications and adjustments in tariffs for maquila and zona franca are likely overestimate the potential impact of CAFTA on Central America. So far there are few studies measuring the impact of trade agreement between Central America and the European Union. To fill this void from the Central American perspectives particularly focusing on poverty and inequality, the model is extended in several ways with improvements in technical issues addressed above. First, the model incorporates all five Central American countries, built on a multi-regional framework. The previous SAMs were updated to 2004 base year and sectors are reconciled, identifying important sectors or activities in each country. This is intended to capture two important effects related to trade and integration, which cannot be measured by singly-country models: (i) demand effects by trade partner—European Union—that has high protection against imports from Central America; and (ii) trade-diversion effects due to erosion of preferences within the bloc. The omission of these effects might be serious particularly for open and small economies like the ones in Central America. Second, the model precisely traces trade flows of maquila and zona france, and introduces the unique specification to accommodate re-exports of these activities. These sectors are newly created in the model, capturing flows between sources and destinations. For maquila, its trade is separated from general textiles and apparel, while electronic equipment and medical instruments produced in zona franca is also decomposed from general machinery and equipment. Following IO coefficients and factor payments in the previous SAMs, new transaction matrices for input use and sales are estimated for the sectors in the model. Based on valued added and import/export shares reported in official statistics, production in each country is calculated. Factor payments are then adjusted using labor payments from household sample surveys. Finally RAS procedure is carried out to guarantee row-column sum equality. While using the same functional form, production technology of maquila is completely differentiated from domestic textiles and apparel, and this is also the case with zona franca. In order to accommodate the characteristic of re-exports in the model, re-exports of these products are expressed in the function of domestic production and the aggregate imports:
( ,r r )rXE f X XM= (1)
where XEr is the aggregate re-exports Xr is output and XMr denotes the aggregate imports in region r, respectively. The model applies the CES form. With this specification, producers operating maquila and zona franca in Central America behave to maximize their profits. The maximization decision yields the optimal levels of domestic outputs and aggregate imports originating from the respective source countries, given resource constraints and factor costs at home and import prices. Third, labor market is segmented by gender and skill in Central America. The impact of changes in trade policy affects households largely through two main transmitting channels. One is income channel; among various income categories, labor income irrespective of wage-earners or self-employed is by far dominant
- 8 -
factor for the greater majority of households, as shown in Table 7. The other is price channel; trade policy shocks directly affect commodity prices for households in two ways, as consumers and producers. In Central America, the vast majority of households are the net consumers of staple agricultural commodities. In the meantime, farmers are also engaged in producing these commodities particularly in rural areas (World Bank, 2005). The price changes driven by trade agreement will improve welfare for the former, but worsen it for the latter. All depend on the structure of income generation and consumption for each household. To capture the heterogeneity particularly in income generation process, it is extremely important to identify different labor income sources and mechanism at greater detail. To this end, labor market is disaggregated into six categories decomposed by gender and skill: low-skill male, low-skilled female, semi-skilled male, semi-skilled female, skilled male and skilled female. Fourth, the model incorporates the new IDB-INT hemispheric tariff database, benchmarked in 2005/06, constructed on the basis of DINAMO database.12 The new tariff database updates key regional trade agreements and preferential treatments in place in the Western Hemisphere and European Union. They include seven regional trade agreements: the North American Free Trade Agreement (NAFTA), the Central America Common Market (CACM), the Caribbean Community and Common Market (CARICOM), the Andean Community (AC), the Southern Common Market (Mercosur), the G-3 (Mexico, Colombia and Venezuela), and the new European Union (EU25). It covers 4 bilateral agreements (Mercosur-Bolivia, Mercosur-Chile, Canada-Chile, and Mexico-Chile). In addition to the MFN tariffs, the database also includes 3 important US preferential treatments: Caribbean Basin Initiative (CBI) for Central America and the Caribbean; Andean Trade Promotion and Drug Eradication Act (ATPDEA) for 4 Andean countries (Bolivia, Colombia, Ecuador, and Peru); and Generalized System of Preference (GSP) for countries in the rest of Latin America. In this study, our database updates the GSP applied by the European Union to Central America. Tariff includes ad valorem, ad valorem equivalents of specific and compound tariffs plus TRQs, estimated at the HTS 8 digit. Specific and compound tariffs are converted to the ad valorem equivalents, based on the estimations of the Method 1 and 2 by the United Nations Conference on Trade and Development (UNCTAD).
2.2. Microsimulation Analysis The essence of the microsimulation analysis is to model the behavior of individual agents using micro database. Specifically the application on poverty and inequality in this study focuses on income generation process at each household level. Households’ income comprises various sources such as factor incomes—wages, capital and land rents—as well as transfers from government, private, firms and remittance, domestic and abroad. But this income generation process is highly heterogeneous. It depends on family structure, occupation, education, gender, marital status, age, location and so on. As literature shows, labor income is by far the main source for the majority of households, particularly for the rural poor in developing countries. This is clearly the case with Central America.13 Furthermore, many studies also show that important determinants of labor income are skill and gender. Based on these empirical findings, the microsimulation analysis deals with income generation process, with particular focus on labor market segmented by skill and gender, which is the main channel to transmit the impact of trade policy changes on household income. We use two-step, “top-down” CGE-microsimulation approach. This sequential approach is designed to translate the economy-wide impact of trade policy shocks into the changes in income at each household. No rigorous attempt is made to accommodate feedback effects from changes at individual households 12 The database is innovated by the Integration and Trade Sector of the Inter-American Development Bank (IDB-INT) to support the negotiations in the western hemisphere. It covers detailed information of tariff phase-out over time and rules of origin of the trade agreements in the region. 13 See Table 7 for the structure of regional household income in Central America.
- 9 -

back through returns of factor markets at macro level.14 However, a major advantage of this top-down approach is that the analysis based on household survey data can be carried out separately from the top-tier CGE analysis. It is ideal but not necessary to reconcile the household data with the national data (Ganuza et al., 2004). In practice, it is extremely difficult, if not impossible, to accommodate macro-micro feedbacks in a multi-region framework dealing with several countries at once for microsimulation analysis. In the process, there is a crucial methodological issue; namely, how the changes in labor market can be translated into the microsimulation analysis. For instance, workers will move from depressed industries to booming ones, may change occupation, and some will lose jobs at the worst case. New workers, who are previously unemployed, may be employed in booming sectors. The issue is what methodology would be appropriate precisely to capture these changes in segmented labor market. To deal with these issues, recently two methodologies were innovated. The first is concerned with the estimation of a microeconomic, household income generation model in a partial equilibrium framework. This process involves a system of equations that determine occupational choice, returns to labor and human capital, consumer prices and other household income components. Bourguignon, Fournier, and Gurgand (2001) pioneer this approach using econometric specifications, while Bourguignon, Robilliard, and Robinson (2003) apply this methodology in a “top-down” framework with CGE model. The second applies a random selection procedure as a proxy of occupational shifts within the segmented labor markets. This approach permits one to impose counterfactual changes in main labor market parameters such as unemployment, composition of employment, wage structures on given distribution based on household survey, and to estimate the impact of these changes on poverty and income distribution at household levels. This methodology is, for instance, applied in the “top-down” CGE-microsimulation sequence by Vos and de Jong (2003) and Ganuza et al. (2006). Our application basically follows the second. This is due largely two technical reasons. First is concerned with modeling intensity in CGE modeling. The former approach requires huge modeling challenges in order to maintain consistency between CGE model and the microsimulation. On the other hand, the latter approach does not demand additional constraints. Second is related to convergence issue in the simulation exercises. As explained, our multi-region CGE model is considerably large with 19 regions, 27 sectors and six segmented labor markets in Central America. As a result, imposing strict consistency risks convergence in the policy simulations. To avoid this possibility but to be as a practical application, we apply the second approach. Poverty is measured by the familiar Foster-Greer-Thorbecke (FGT) indices15 of additively decomposable measures. The FGT poverty indices are in general expressed as:
1
1 qi
i
z yPn z
α
α=
−⎛= ⎜⎝ ⎠
∑ ⎞⎟ (2)
where is the population size, q is the number of people below poverty line, n iy is income of the
th households. The poverty aversion parameter i α takes three values. The headcount index of poverty is
14 However, as the behaviors of the households are explicitly modeled in a general equilibrium framework, it implicitly captures feedback effects through income-expenditure linkages on factor returns and consumption behaviors on prices. 15 Foster, Greer, and Thorbecke (1984).
- 10 -
expressed with 0α = . The poverty gap has 1α = , measuring the distance from the poverty line. The severity of poverty is measured in 2α = .
Based on poverty indices and poverty and extreme poverty lines, new poverty and extreme poverty lines are calculated by adjusting sampling weights following household sample size and population statistics at each region. In the policy simulations, both poverty lines are updated by using the national consumer price index in each country. Poverty and inequality analysis is undertaken by the DAD (Distributive Analysis) 4.4 software developed by Duclos, Araar, and Fortin (2004). The microsimulation analysis requires several key assumptions particularly on labor market. Trade policy shocks affect labor market in several ways; workers will shift their jobs from one sector to another due to wage changes; some will get employed in booming sectors, while others will be out of jobs in depressed industries; workers may change occupational status or categories, with new skills, training or education; some non-economically active family members may enter the labor market, while others leave. All of these greatly influence labor income, which is the dominant source of household income. First policy shocks simulated by the CGE model in the labor market are decomposed into the changes in employment for each labor category in the respective sectors in each region. It is assumed that the new sectoral labor demand is first met by the changes in workers presently employed in each labor market. Based on attributes of the status of household head, gender, education, skill, age and location, potential workers are identified among the unemployed. The random assignment is carried out to identify new employment or job losses to meet the changes in each labor market in the respective regions. To guarantee the validity or sensitivity of the results, this process is repeated over 10 times over labor categories across regions. For simplicity, it is assumed that labor does not change its skill categories, and does not move over regions. Income inequality is measured by two familiar indicators, Theil and Gini indices, which are given in the following formulas:
1 logi
i
iy yTheil indexn μ μ
⎛ ⎞= ⎜
⎝ ⎠∑ ⎟ (3)
1 ( 1) i
i j j
Gini index y yn nμ >
=− ∑∑ j− (4)
where is the population size, n μ is the mean income, and iy is income of the i th households.
3. The Benchmark Data of the Central American Countries This section briefly outlines the economic structures of the five countries in Central America at benchmark. Because the study evaluates the impact of trade policy option for the region, the section focuses on trade flows and protection at greater accuracy. This provides an overview of the structure of trade and protection in the form of tariffs in order to lay the ground for better understanding of the CGE simulation results and microsimulation exercises.
3.1. Macroeconomic Indicators of the Central American Countries Table 1 presents key comparative macroeconomic statistics for Central America. Compared with other regions in Latin America, Central America is relatively less heterogeneous in terms of population and labor force. The population of Guatemala is three times as large as Costa Rica, and two times larger in
- 11 -
terms of labor force. While the population increases at the similar rate at around 2 percent per annum across the countries, the growth of labor force varies. Labor force expands as twice fast as the population in Costa Rica and Nicaragua, but that grows slightly higher than the population in other countries. <INSERT TABLE 1> Table shows there are some differences in economic size. In terms of GDP, Guatemala accounts for nearly 40 percent of the aggregate regional GDP, while Nicaragua, the smallest country in the region, shares only 6 percent. The region is highly characterized by the existence of maquila (offshore assembly for re-export) and zona franca (export free zone). But the magnitude and the composition of trade of these activities vary significantly country by country. Throughout the region, maquila trade is exclusively dominated by textile and apparel. In Central America, Honduras is the largest exporter in this category, followed by El Salvador. Costa Rica is the only exception, where electronics are the leading exports, followed by medical instrument, both of which are produced in zona franca. Across the region, one of the striking features in external account is the structural trade deficit. This is most serious in Guatemala and El Salvador, whose value of imports are nearly twice larger than those of exports. Affected by the contraction of world economy, which bottomed out in 2001, the region’s economy grew much slower than in the 1990s and lagged behind the rest of Latin America, after recovering in 2003. This economic underperformance can be largely explained by two external factors. First, the rising international prices of raw material hurt Central America, which is a net importer of commodities such as petroleum, food stuffs and basic products. This worsened terms of trade, and widened trade deficit. Second, the region suffered the loss of dynamism of maquila exports due to the declines in US demand and increased competition from China and other Asian countries. The GDP growth ranges from the lowest 2.5 percent in Guatemala to the highest 5.2 percent in El Salvador between 2000 and 2005. In all countries, imports grew faster than exports in the same period, resulting in aggravating trade account positions. Compared with other countries in Latin America and elsewhere with the similar economic size, trade openness of Central America, measured in terms of trade flows over GDP, is high. Honduras is the most open country, whereas Guatemala is the least open in Central America.
3.2. Trade Flows and Barriers in Trade Trade flows and protection are the most important variables to examine the impact of changes in trade and integration policies. The former is the key agent to transmit shocks among partners induced by the changes in protection, because the model only deals with the real side of the economy without incorporating financial or monetary accounts. The latter, on the other hand, serves as policy instrument of trade policies and integration strategies. In this study, we only consider tariffs among the market access policy instruments. Trade Ling with Major Partners Table 2 shows the market share of Central America’s trade with major partners. Regarding exports, the United States is by far the main destination, absorbing more than half of the bloc’s total exports. The market dependency on the United States, however, varies greatly by country. The United States accounts for the highest 80 percent of the market share for Honduras, followed by Nicaragua and El Salvador. In contrast, Costa Rica has the lowest reliance of 38 percent. The United States is the major source of imports for all countries, but its market share is lower for imports than for exports and there is no clear correlation of the US reliance between exports and imports. Honduras again has the highest import dependency (55 percent) on US, followed by Costa Rica (45 percent), while Nicaragua only depends on 28 percent of its imports from the US origin. Central America’s high dependency on the US market
- 12 -

intensifies after CAFTA, and this makes the region more vulnerable to the US economic cycle, as experienced in the past. <INSERT TABLE 2> After the United States, intra-CACM is the second largest market for the bloc as a whole and for most CACM members. On exports, El Salvador and Guatemala sells a quarter of their exports to the sub-bloc market, while Honduras does the least with only 6.6 percent. On imports, Nicaragua relies the most on the intra-bloc market, purchasing more than 20 percent of its aggregate imports. The opposite is Costa Rica, which is dependent only 4 percent of imports on Central American sources. The European Union is the third largest market for the bloc. Compared with the United States, however, it still remains new market for the bloc with larger variations among Central American countries. Costa Rica has greater reliance on the European Union with 26 percent of market share, followed by Honduras (10 percent). The EU’s market share on imports is more even among countries, ranging from 6.5 percent in Nicaragua to 11.6 percent in Costa Rica. Sectoral Composition of Trade with the European Union Table 3 presents the composition of Central America’s exports to the European Union. CACM exports to the European Union are highly dominated by agriculture-origin. Agriculture accounts for some 70 percent of exports to the European Union for Guatemala, followed by Honduras (68 percent) and Nicaragua (65 percent). It shares 45 percent in El Salvador. Across Central America except Costa Rica, coffee is by far the single largest exporting commodity with the share topping 40 percent in Guatemala, Honduras and Nicaragua. In value term, Costa Rica exports of coffee to the European Union after Honduras and Guatemala, but its share accounts for only 5 percent. Among agriculture, vegetable and fruits are also important exports for Honduras (25 percent share). But this does (may) not tell the region’s true potential in agricultural exports. In comparing products exported to the United States, the region also sells sugar, processed meat (beef, pork and poultry) and dairy products. Since all of them are sensitive products in both the United States and Central America, the value of exports is small. However, sales of these products are almost completely excluded in the EU market, since they are, because of political sensitivity, heavily protected by multiple barriers such as hefty tariffs, sizable domestic support and export subsidies, in addition to quotas, technical barriers and other non-tariff measures. <INSERT TABLE 3> After agriculture, processed foods are the second largest commodity group. These products account for some 20 percent for El Salvador and Guatemala, 16-17 percent for Honduras and Nicaragua. Again Costa Rica is the exception with only 4.5 percent share. On the other hand, light manufactures including textiles, apparel, leather or footwear have a smaller share across Central America. Costa Rica has unique export structure completely different from other members. Its exports are characterized by high-technology content. While vegetable and fruits account for 20 percent of the country’s exports to the EU market, agriculture account for the smaller share of 28 percent, the lowest in bloc. In fact, microprocessors are the leading exports, followed by medical instruments, produced both in zona fraca. These products alone account for half of Costa Rica’s exports destined to the European Union. Imports are heavily concentrated on heavy manufactured products. These products account for 87 percent of the total imports from the European Union in Honduras, followed by El Salvador (82 percent) with the lowest share of 67 percent in Costa Rica. Across Central America, machinery and electric equipment are the major imports, followed by chemical products in Costa Rica and Guatemala or motor vehicles in El Salvador. Thus, trade structure between Central America and the European Union is almost perfectly
- 13 -

complementary; the former exports agriculture plus food products in exchange for heavy manufactured products. Applied Tariffs by Central American countries to the European union While completely having liberalized intra-bloc market already, each of the Central American countries maintains high tariffs across the sectors against extra-CACM imports. Tariffs are well structured to protect domestic producers particularly of sensitive products,16 and therefore vary country by country. In agriculture, “rice and wheat” is the most protected sector across the region. Because of domestic sensitivity, tariff on rice is 63 percent in Nicaragua, and 45 percent in Honduras at commodity level. Sugar in Costa Rica is also protected with 23.5 percent tariff. Processed foods are also protected heavily in a wide range of products. In fact, trade-weighted tariffs of these products are 4-5 percentage points higher than agriculture. Tariffs on processed meat including sensitive beef, pork and poultry are 24 percent in Costa Rica and 20 percent in El Salvador. At tariff line, tariff on poultry (leg quarters) is 150 percent in Costa Rica and over 160 percent in other countries. Dairy products are also heavily protected particularly in Costa Rica (34 percent tariff). In addition, “beverages and tobaccos” industries are protected in Guatemala and El Salvador. Table 4 displays Central America’s tariffs on imports from outside the regional bloc, which are applied to the European Union. <INSERT TABLE 4>
Table 5 reports the EU’s applied tariffs imposed on imports from Central America. Clearly protection is distorted in favor of bloc’s agriculture and processed foods. Reflecting the composition of exports shown in Table 3, the aggregate trade-weighed tariffs on agriculture vary considerably country by country. Costa Rica and El Salvador face the highest 13 percent of tariffs on their exports to the European Union, followed by Honduras (5.4 percent) and Guatemala (3.6 percent). Nicaragua faces only a marginal protection (1.8 percent). But sensitive products are heavily protected—106 percent for sugar on the top, 29 percent for cereal grains, and 20 percent for rice and wheat, although these products are not the major export commodities from Central America. On the other hand, coffee, region’s leading agricultural exports, faces a marginal 1.7 percent of tariffs. <INSERT TABLE 5> Among processed foods, sensitive products are again heavily protected: 50 percent for processed meat and 43 percent for dairy products. Other food products consisting of a variety of food stuffs still face 9 percent of protection. Although the sectoral tariffs remain high on a wide range of light manufacturing products, the aggregate trade-weighted tariffs are marginal due to low CACM’s exports in these categories. On the other hand, protection is quite low over heavy manufactured products, with the highest protection of 2.6 percent on motor vehicles. Given the region’s dominant exports of agriculture-origin and the EU’s high protection on agriculture, it is highly expected that Central America will benefit from trade agreement with the European Union. Clearly agriculture will be the winner, and this will contribute to reduce poverty of the vast majority of poor farmers, who are engaged in wide range of agricultural activities.
4. CGE Simulations: Macro and Sectoral Results 16 In Central America, sensitive agricultural products include: rice, beans, fresh potatoes, yellow maize, sorghum, beef, pork, poultry and dairy products. See World Bank (2005) and Morley (2006) in theie evaluations of CAFTA.
- 14 -
4.1. Macroeconomic Results This study evaluates the impact of trade agreement between under negotiations between Central America and the European Union. As already demonstrated in the CAFTA negotiations with the United States, agriculture will be the most contentious and the centerpiece of the negotiations. In Central America, agriculture is an important source of livelihoods, and the home of more than 11,800 thousand people, sharing a third of the region’s population. In particular, the population share reaches 46 percent in Guatemala The sector is also important in economic terms. Excluding maquila and zona franca, it accounts for more than 30 percent of the gross exports in Guatemala and Honduras, and interestingly 40 percent in Costa Rica, the only country with upper-middle income. The sector generates approximately 20 percent of GDP in Guatemala and Nicaragua, and around 10 percent in El Salvador and Costa Rica. To assess the overall impact of the trade agreement, this study considers tariff elimination or reduction as the policy instrument. Taking into account the market access commitments under CAFTA, vital importance and highly political sensitivity in the region and the EU’s position on agriculture, we exclude sensitive agricultural products in the main simulation exercise reported here. 17 This is based on the following market access commitments under CAFTA; (i) sensitive products are phased out for an extended period with the longest 18-20 years; (ii) tariff reductions are back-loaded, with no initial cuts in earlier stages of the phase-out and larger cut in later years; and (iii) Central America is granted to longer tariff phase-out and greater share of back-loaded phase-out period than the United States. In fact, these sensitive products are mostly produced for domestic consumption or only traded within regional market. 18 To measure the impact of these sensitive products, we also carry out additional exercise of the full tariff elimination in both Central America and the European Union. This exercise shows that the impact on macroeconomic variable is hardly changed, due to sparse trade flows of these products, although the sectoral impact on some products is significant. The most affected sector is dairy products in Central America excluding Nicaragua, which has no imports of these products from European Union. Table 6 shows the aggregate effects on macroeconomic variables, which in general follow what international trade theory dictates. The agreement appears to be attractive from the macroeconomic policy perspective. The impact is unambiguously expansionary. All CACM countries will be winners from the regional initiative. Exports to the European Union increase from 14-15 percent in Costa Rica, El Salvador and Nicaragua to 27 percent in Honduras. This translates into the rise of the aggregate exports ranging from 1 percent in El Salvador to 3 percent in Costa Rica. The impact on imports from the European Union is much greater than that of exports, except Honduras. This is primarily because the region eliminates tariffs by greater degree on main imports (machinery and equipment) of the EU origin than its leading exports to the EU market. The sharp rise in imports faster than exports widens the current trade account deficits particularly in El Salvador and Guatemala. <INSERT TABLE 6> Despite relatively small trade exchange, real GDP will expand by roughly 1 percent from the base. This is due to increased resource allocation towards export-oriented sectors, efficiency gains among import competing industries and improvement of market access to the European Union. Welfare measured by equivalent variation (EV) increases by 1.6-1.7 percent in Costa Rica and Honduras, and 1 percent in Guatemala and Nicaragua. One important and promising result in the efforts of poverty reduction is that
17 In the European Union, sensitive products are: rice, wheat, cereal grains, sugar, beef, pork and dairy products. 18 In Central America, the exception is rice, wheat and cereal grains, which are almost exclusively imported from the Unites States in each country.
- 15 -

trade agreement will create new employment opportunities particularly for low-skilled and semi-skilled workers. The economy increases employment by around 1 in Costa Rica, 0.9 percent in Honduras and 0.5 percent in Nicaragua. This corresponds to 16,000 workers in Costa Rica, 21,300 workers in Honduras, and 8,900 workers in Nicaragua, respectively. Sectoral Impact on Trade with the European Union and Production Costa Rica Costa Rica increases its exports to the European Union by 15 percent. “Vegetables and fruits” enjoy the fastest expansion with 60 percent growth. Exports of coffee, another important agricultural product in value term, increase by modest 4 percent. These contribute to boost agricultural exports, which sharply jump by 45 percent. Due to high growth particularly by vegetables and fruits, agriculture alone constitutes some 80 percent of increased exports to the European Union. Exports of processed foods also increase rapidly with the growth of 38 percent, but their contribution on the new exports is limited to around 10 percent share. On the other hand, exports of heavy manufactured products dominated by microprocessors and medical instruments produced in zona franca, combined with machinery and electric equipment, are marginal, since these products are almost duty-free in the European Union. Because of the least exchange of intra-bloc trade and the greater geographic diversification, Costa Rica hardly experiences trade diversion effects. Figure 1 shows the impact of exports by macrosector, and Figure 2 displays the composition of new exports to the European Union. <INSERT FIGURE 1> <INSERT FIGURE 2> Among Central America, Costa Rica undergoes the most heterogeneous impact on production; in other words, the country will experience the largest disruption of production process. Agriculture will be a winner, expanding outputs by 5.4 percent. In particular, “vegetable and fruits” driven by sharp export boost are the largest beneficiaries, with expansion of production of 16 percent from the base. Since “rice and wheat” continue to be protected with no imports from the European Union, this sector does not negatively affected. Conversely, an increase in welfare translates into income gains of households, who consume more domestic staples so that domestic production of this sector slightly increases. These changes in production and resultant wages drive significant labor market adjustments. In agriculture, labor will move from coffee and cereal grains largely to booming “vegetables and fruits” In addition, agriculture will create additional employment mostly for male workers in low skilled (4,600 workers) and semi-skilled (8,100), who are household heads. The impact on other sectors is mixed. Due to the same reasons as in “rice and wheat”, production of “processed meat” and “dairy products” slightly rises, which leads to an increase in employment. On the other hand, manufacturing industries and the energy sectors will be the losers with the largest production decline in domestic textiles (-3.4 percent). Maquila and zona franca also experience the negative, though small, impact on production. Services marginally expand outputs due to the rise in demand arising from increased domestic income. In labor market adjustments, other light manufacturing industries followed by heavy manufacturing industries will release workers almost in all labor categories. Services will create employment particularly in semi-skilled categories—1,600 female and 1,100 male workers. El Salvador The aggregate exports to the European Union increase by 15 percent. But unlike other Central American countries, agriculture is not a big winner. This is because the country does not export “vegetables and
- 16 -

fruits”, while the leading agricultural commodities are coffee, which faces low protection (1.7 percent tariff) in the EU market. Besides, tariffs on sugar, the second largest Salvadorian agricultural exports after coffee, are not reduced in the European Union, because of sensitivity. Agriculture as a whole increases exports by 6 percent. On the other hand, exports of processed foods sharply increase (40 percent). As a result, these products alone constitute nearly 60 percent of new exports. Light manufacturing industries particularly maquila as well as “leather and footwear” also enjoy rapid expansion of exports, but they do not much contribute to increased exports (15 percent share). Since El Salvador has substantial regional trade exchange and high reliance on the United States particularly on exports, intra-bloc trade declines by 1.4 percent, and 1.5 percent with the United States. El Salvador increases the aggregate production by 0.7 percent, the least among Central America. Reflecting export performance, the impact is small across agricultural sectors. Yet production of coffee increases the most by 2 percent. Maquila will also increase outputs by 2.6 percent, as exports to the European Union expand by more than 30 percent. Labor movements largely follow the sectoral impact on production. Labor will shift from depressed industries such as “beverages and tobaccos” and “motor vehicles” to agriculture and services. However, agriculture is unlikely to absorb replaced workers or to create new employment as with the magnitude of Costa Rica. Guatemala The aggregate exports to the European Union increase by 20 percent. “Vegetable and fruits” are the clear winners with 65 percent jump of exports. Coffee, main export commodity with 46 percent share of aggregate exports destined to the EU market, also increases exports by 7 percent. These products push up agricultural exports by 14 percent, and they constitute the half of the new exports. Processed foods also experience impressive export performance: 57 percent by “beverages and tobaccos” and 40 percent by other foods products. These products account for 45 percent of the increased exports. Maquila also enjoys booming exports (33 percent), and the sector contributes around 10 percent of the new exports. Due to greater dependence on intra-regional trade and with the United States, Guatemala suffers the largest trade diversion effects; intra-CACM trade declines by 2 recent, and trade with the United States falls by 1.6 percent. Agricultural production increases by 1 percent. Booming exports increase production of “vegetables and fruits’ as well as coffee by 1.6 percent and 1.2 percent, respectively. On the other hand, an increase in household income is the main source to raise production of ‘rice and wheat’ and “oilseeds and soybeans”. Other processed foods as well as sensitive “processed meat” and “dairy products” also experience modest but positive impact on production. Exports contribute the former, while domestic income gains are the main driver for the latter. Maquila is also a beneficiary with an increase of production by 2.5 percent. In agriculture, labor moves to coffee, “vegetable and fruits”, and “rice and wheat”, driven by rising wages. In industries, maquila, other food products as well as services will increase employment. Honduras Among Central American countries, Honduras will be the largest beneficiary of expanding exports. Its aggregate exports to the European Union jump by 27 percent. The patter of the sectoral export performance in agriculture is quite similar to that of Costa Rica or Guatemala. But the greater share of coffee relative to the fastest growing “vegetables and fruits” in the composition of exports reduces the export performance of agriculture (26 percent). Agriculture contributes around two-thirds of the increased exports. Like Guatemala, processed foods enjoy sharp export growth; 57 percent for “beverages and tobaccos” and 39 percent for other food products. Processed foods roughly account for a quarter of the new exports. Like other countries in Central America, exports of maquila also expand by more than 30
- 17 -

percent. While Honduras is nearly immune from the trade diversion effects due to the low-level of intra-CACM trade, the country modestly suffers decline in trade with the United States. Like Costa Rica, agriculture is the clear winner in production with an increase of 4.7 percent. Among sectors, “vegetables and fruits” sharply increase production by 11 percent, followed by coffee (3 percent). Like Guatemala, food industries also enjoy an increase in production. However, manufacturing industries in a wide range suffer decline in outputs. Production falls by almost 2 percent in “motor vehicles” and “machinery and equipment”. Labor market adjustment follows the pattern similar to Costa Rica. Employment increases in “cereal grains”, “vegetables and fruits” and coffee, and create new jobs, particularly low-skilled male (7,400 jobs) and semi-skilled male categories (3,200 jobs). On the other hand, food industries expand employment particularly for female workers—low-skill (1,900 workers) and semi-skill (1,400 workers). Conversely manufacturing industries will reduce employment in all labor groups, and those who are replaced are absorbed mostly in food industries and services sector, while some will shift to agriculture. Nicaragua The aggregate exports increase by 14 percent, with the magnitude similar to Costa Rica and El Salvador. While the export performance of agriculture is around 6 percent, equivalent to El Salvador, the sectoral pattern closely follows that of Guatemala. Namely, “Vegetables and fruits” enjoy the sharpest increase in exports, whereas the coffee, the main export products with the share of almost 50 percent of the aggregate exports to the European Union, is the driver to push export growth. Agriculture accounts for 30 percent of new exports. Like other Central American countries, Nicaragua expands exports of processed foods (40 percent growth), and these products account for the half of new exports. Maquila also enjoys increased exports (32 percent), followed by “leather and footwear”. Light manufacturing products constitute 20 percent of new exports, the largest share among Central American countries. Nicaragua experiences trade diversion effects: 0.8 percent decline in intra-bloc trade and 0.5 percent fall of trade with the United States. The impact on sectoral production is relatively monotonic. Coffee is the largest winner with an increase in output by 3 percent, followed by maquila (2.7 percent) and “leather and footwear” (2.3 percent). Despite the sharp rise in exports, “vegetable and fruits” increase production by mere 1 percent. In processed food group, other food products expand production by 1.7 percent. Compared with the monotonic impact on production, labor market adjustment is relatively large. Agriculture will create 4,300 new jobs mostly in low skilled workers, and the greater majority (87 percent) is male workers who are household heads. Food industries also increase job opportunities for low and semi-skilled workers, but the sector, unlike agriculture, employs largely female workers (70 percent). Light manufacturing industries particularly in maquila create new jobs for semi-skilled categories, and mostly female workers. Services also expand employment (1,900 jobs) in low and semi-skill workers, but the sector will reduce employment in high skilled workers.
5. Impact of Trade and Integration Option on Poverty and Inequality This section measures the impact of CACM-EU trade agreement on poverty and inequality in Costa Rica, Honduras and Nicaragua. Based on the simulation results measured by the CGE model, policy shocks are transmitted down to individual household levels. Specifically in this process, the changes in vectors of factor returns and commodity prices are applied to measure new income of each household. Finally the microsimulation is carried out to evaluate the impact of trade agreement on poverty and inequality.
5.1. Structure of Household Income
- 18 -

Based on the recent national household survey data,19 households are disaggregated by region. This is because households in each region tend to have geographic commonalities and shared characteristics. In addition, poverty and inequality are spatial issue. In Central America, poverty is dominant and almost ubiquitous. But as seen in other countries in Latin America and elsewhere, it is more severe in rural hinterlands than in metropolitan areas. To capture this geographic aspect and to pinpoint in which region poverty is more acute in the country, we focus on the geographic dimensions in poverty and inequality analysis. Costa Rica has six regions, three regions in Honduras and four regions in Nicaragua.20 Table 7 shows the sources of household income by region in each country. While showing some common patters across countries, Table also reveals significant heterogeneity in the composition of household income within each country and over countries. First, clearly labor income is the main source of income for households in each region in all countries. But its importance differs greatly among countries. High income Costa Rica has the largest reliance on labor income with the share of 87 percent, and the variations over regions are relatively small. The opposite is the case with Honduras and Nicaragua. Compared with Costa Rica, labor income share is 20 percentage points lower in Honduras, and 15 percentage points in Nicaragua. Besides, the regional variations between high and low labor income shares are 10 percentage points. Figure 3 displays distribution of household income by region. <INSERT TABLE 7> <INSERT FIGURE 3> Second, households in low income regions greatly rely on income from low-skilled labor, or semi-skilled, or both. The most obvious cases are Occidental and Oriental in Honduras, and Central and Atlantic in Nicaragua. In these regions, where agriculture is the home for the vast majority of rural farmers, income from low-skilled labor is the largest source, and the combined income with semi-skilled labor constitutes around 70 percent of labor income. In Costa Rica, income generated from semi-skilled labor accounts for around half of labor income in Central Pacific, Brunca, Atlantic Hunter and North Hunter, where again agriculture is the main activity. Third, there are salient differences in the composition of income between male and female categories, and they are greater in low-skilled labor groups than in high-skilled counterparts. This phenomenon is common across Central America. Interestingly Costa Rica exhibits the largest disparities in both low and semi-skilled categories than in Honduras and Nicaragua. Furthermore, these differentials are greater in low income regions in all countries. Two reasons may explain this fact. Rural households, mostly low-skilled farmers, are engaged in agriculture, which often requires hard labor. Because of this, female farmers work as a part-time or secondary to help male household heads. Besides there are large wage differentials between male and female workers in the same labor categories.21 On average, male wages are approximately 50-60 percent higher than female wages In Honduras, wage differential between male and female workers in skilled category reaches 90 percent. 19 The source of household survey data is the Program Improving the Surveys of Living Conditions in Latin America and the Caribbean (MECOVI), IDB: Costa Rica, Encuesta de Hogares de Propósitos Múltiples (2004); Honduras, Encuesta de Condiciones de Vida (2004); and Nicaragua, Encuesta Nacional de Hogares sobre Medición de Niveles de Vida (2005). 20 Regions are: Central, Chorotega, Central Pacific, Brunca, Atlantic Huetar and North Huetar in Costa Rica; Central, Occidental and Oriental in Honduras; and Managua, Pacific, Central and Atlantic in Nicaragua. 21 Wage differentials between labor categories are another issue. In Costa Rica and Nicaragua, wages in high-skilled workers are roughly 3times larger than those of low-skilled both male and female workers. This disparity widens in Honduras, where the ratio is 5.7 for male and 4.7 for female.
- 19 -

Fourth, transfer income accounts for a substantial portion of household income in Central America. This income comprises government subsides, household transfers, firms’ pensions, remittance and so on. In Nicaragua, around one-third of household income comes from this source, and a little less than 30 percent in Honduras. But the composition of transfer income differs by country. Government subsidies account for 70 percent of transfers in Costa Rica, while remittance from family members residing overseas constitutes half of the transfers in Nicaragua and 20 percent in Honduras. As many recent studies show,22 it is crucial to examine policy effects though labor market channel with greater care and detail. As seen in Table 7, labor market in Central America is considerably segmented by gender, skill, location and other factors. Wage differentials are of grave magnitude, between male and female, between regions within the country, and between labor categories. As a result, income generation process at individual household levels is tremendously heterogeneous. In addition, it is of particular importance to keep in mind that poor households mostly engaged in agriculture rely on income largely from low-skilled labor. This is particularly the case in Central America.
5.2. Poverty Profile in Central America Based on the familiar FGT indices, Table 8 reports poverty and extreme poverty profiles for Costa Rica, Honduras and Nicaragua. Poverty lines in each region are estimated on the basis of the national urban and rural poverty lines adjusted by regional sampling weights. In Costa Rica, poverty lines are directly estimated from the poverty statistics decomposed by region. Poverty is evaluated by the population. Costa Rica has the smallest poverty incidence, but still one over four people is below poverty line. Brunca is the poorest region with 43 percent of poverty headcount, followed by Chorotega (38 percent). In these regions, approximately 15 percent of the population lives below extreme poverty. In contrast, poverty is the least severe in Central region, with 18 percent of headcount for poverty and 4 percent for extreme poverty. However, the population distribution of the poor significantly differs over regions. Due to large population share, Central region accounts for half of the poor, followed by Brunca (14 percent) and Chorotega (12 percent). The region distribution of extreme poor follows the similar patter to the poor. <INSERT TABLE 8> Honduras is one of the poorest countries in Latina America, and has the highest incidence of the poor in Central America. At the national level, poverty measured by headcount reaches 70 percent of the population. In addition, 45 percent of the population is extreme poor or indigent. They correspond to 4.8 million and 3.5 million out of 6.5 million people in the country. Particularly poverty is the most severe in Oriental region, where nine in ten people live below poverty, and approximately two-thirds are under extreme poverty, whereas that in Occidental region is equivalent to the national average. Poverty gap, income-gap measure, is considerably high in these regions. Particularly poverty is a grave concern in Oriental region with 50 percent of poverty severity, which is the worst index among the poorest countries in the world. Only Central region has lower poverty incidence than the national rate, but the level is still fairly high, compared with other countries in Latin America. Moreover, nearly 60 percent of the national poor live in this region with the higher income, implying greater income disparity. By region, 60 percent of the poor live in Central region, and the remaining 40 percent live in other two regions almost equally. Poverty is still serious in Nicaragua. Approximately half of the population lives below poverty line (2.5 million), and 17 percent are classified as extreme poverty (880,000). Poverty is largely dichotomized into east-west geographic divide. Managua and Pacific region with high population density and facing the Pacific ocean have lower poverty rate than the national average. In constant, rural hinterland (Central and
22 For instance, Winter, McCullch and McKay, (2004) and Ganuza, Paes de Barros and Vos (2002).
- 20 -

Atlantic) with sparse population has more than 10 percentage-point higher poverty incidence than the national average. In these regions, approximately a quarter of the residents are in extreme poverty. By region, 40 percent of the poor in the nation live in Central region, another 28 percent in Pacific region, and 18 percent in Atlantic region.
5.3. Inequality Table 9 presents income inequality measured by three indices: mean income ratio over the national average; Theil and Gini indices. Clearly income distribution is highly heterogeneous over regions in Central America. <INSERT TABLE 9> In Central America, Costa Rica has the lowest inequality, with Theil and Gini indices at 0.41 and 0.47, respectively. Costa Rica is also ranked as the country with the most equitable distribution of income in mid-level inequality category (ECLAC, 2006). Inequality within each region is much lower or at maximum equivalent to the national index. Atlantic Huetar, with the lowest mean income relative to the national average, is the region with the most equitable distribution of income with Theil index of 0.25 and 0.39 Gini coefficient. Inequality in Brunca and North Huetar is nearly the same as the national level. Central region, where 64 percent of the national population lives, seems to have low inequality.23 Central Pacific with 5 percent population share is the only exception. Inequality indices are 0.7 for Theil and 0.54 Gini. Inequitable income distribution persists in Honduras. The national Gini index is 0.61, while Theil index reaches 0.85. In fact, the top 5% households share 37 percent of the national income, and the richest 10% account for half, while the lowest 10% have the tiny share of 0.5 percent. Moreover, the mean income of the top 10% is shockingly 90 times higher than that of the lowest 10 %. Thus, income distribution is tremendously inflexible and skewed to the rich. Regional mean income in the wealthiest Central region is 2.5 times larger that of the poorest Occidental region. In the country, Occidental region exhibits the highest inequality. Central region, where 63 percent of the population resides, also has high inequality nearly equivalent to Occidental. Inequality is the lowest in Oriental region with 0.56 Gini index, but the level is still high enough in the measurement of inequality and in the context of Latin America. In recent years, Nicaragua has slightly improved inequality, but its level is still high in Latin America(ECLAC, 2006), with 0.48 Gini and 0.49 Theil indices. But compared with Costa Rica and Honduras, inequality variations are relatively small. Interestingly Managua, capital region, has the lowest inequality in the country; despite its mean income is 40 percent higher than the national average. Inequality of Central region is high but almost the same as that in Managua. On the contrary, inequality in Pacific and Atlantic regions is slightly higher than the national index. In terms of mean income, Pacific region has the income equivalent to the national average, while that is 20 percent lower in Central region and 24 percent lower in Atlantic region than the national mean respectively.
5.4. Impact on Per Capita Household Income, Poverty and Inequality Impact on Per Capita Household Income
23 Inequality in Costa Rica may be much higher than reported here. In the sample household surveys, seemingly high income individuals mostly household heads are reluctant to disclose their true incomes, and instead reported fictitious income such as 9 in six-digit. Therefore, individuals with this type of income reporting are eliminated from the samples. The incidence is highest in Central region.
- 21 -

Given the composition of household income inherent to each region as analyzed in the previous section, income generated by labor market channel constitutes by far the dominant share of the new household income. The aggregate labor income accounts for 90 percent in Nicaragua, 95 percent in Honduras and 97 percent in Costa Rica. The impact on labor income decomposed by labor category shows some common traits among regions, but it also demonstrates some salient differences. Figure 4 shows the impact on per capita labor income for the respective regions decomposed by labor category. The impact on distribution of household income gains are presented in Figures 5. <INSERT FIGURE 4> <INSERT FIGURE 5> First, income increases in all regions across Central America, implying that the agreement will improve households’ welfare at both regional as well as national levels. Employment creation is the main driver of this positive income gains. Second, corresponding to the magnitude of the macro economic impact, an increase in income gains is the largest in Costa Rica, Honduras and Nicaragua in this order. Third, because agriculture appears to be the winner in the region, the positive impact is greater in agriculture-dominant rural regions than in urban metropolitan regions. This findings implies that trade agreement will have a potential effect of reducing poverty particularly in rural area and narrowing regional disparities between metropolitan and rural hinterland regions, although these potentials are not automatically guaranteed. Fourth, related to the above, labor income generated by low- and semi-skilled workers is greater than that earned by high-skilled labor, despite huge wage gaps over skill categories. This suggests that income disparity between the rich and the poor will narrow. Fifth, the agreement does not necessarily generate pro-gender effects in favor of female labor. In fact, the opposite is the more likely outcome. The positive impact is greater on male than on female workers in all labor categories in three countries. In Costa Rica, the national aggregate labor income increases by 1.5 percent. The impact will be larger in agriculture-dominant rural regions relative to urban regions. In particular in Atlantic Huetar, where agriculture is the main activity and the largest source of employment, income generated by semi-skilled workers engaged in agriculture accounts for more than half of new labor income. This is also true in North Huetar and Chorotega. In these regions, income accrued from low-skilled labor categories constitutes larger share than in urban regions. On the contrary, in Central region, where nearly two-thirds of the population resides and most economic activities (manufacturing industries and services) concentrate, income gains due to wage increase in high skilled workers and new employment for semi-skilled workers in services contribute the greater income share of semi-and high skilled categories. Across the country, one striking finding is that income generated by make workers, who are household heads, accounts for far greater share, while income by female workers is mostly marginal. Particularly the contribution of female worker income is almost negligible across the country. This is probably due to low female participation in agricultural workforce in country with relatively higher education nationwide. The aggregate labor income increases by 1 percent in Honduras, smaller than that of Costa Rica. But like Costa Rica, income gain is larger in agricultural regions—Occidental and Oriental—than in Central region. In these regions, the magnitude of impact and patters by labor category are almost identical, as the structure of labor force (employment) and wage differentials are nearly the same. Again like Costa Rica, income gains by female workers are small across regions. But what is different from Costa Rica is the greater contribution of low-skilled male labor income: 44 percent of new regional labor income in Occidental and 40 percent in Oriental region. This is primarily because low-skilled male workers constitute the largest share in employment in these regions: 30 percent in Occidental and 25 percent in Oriental. Central region benefits around 1 percent increase in labor income. The impact over labor categories follows the similar pattern as in Costa Rica. Namely employment is created for semi-skilled
- 22 -

both male and female workers in services, along with new employment for low-skilled workers in agriculture, while wage increases are the main source for skilled labor income gains. Reflecting relatively smaller impact on macroeconomic variables and on production, Nicaragua, among three Central American countries, benefits the least with 0.54 percent of household income gains at the national level. The aggregate impact is less heterogeneous over regions, and the composition by labor category closely follows those in Honduras. In agriculture-dominant Central and Atlantic regions, income gains generated by male workers alone constitute more than 40 percent of the increased labor income. In particular, Central region contributes to account for 40 percent of new employment, creating some 3,600 workers mostly in low-skilled categories. The opposite is the case in Managua and Pacific regions, where manufacturing industries and services are operated. In these regions, employment is created mostly in food industries or light manufacturing industries including maquila for semi-skilled classes, and services absorb high skilled workers displaced from largely heavy manufacturing industries. Impact on Poverty and Extreme Poverty Table 10 presents the impact on poverty measured in terms of percentage changes from the base, using the FGT indices. In line with findings in many recent empirical studies, it shows several stylized results; some are related to the structure of household income generation and the inherent nature of poverty, while others are more concerned with the impact on factor and commodity markets generated by trade agreement. To facilitate how the impact affects poverty in each region, Figure 6 shows the potential number of people, who will be lifted out of poverty by trade agreement. <INSERT TABLE 10> <INSERT FIGURE 6> First, trade integration option appears to be pro-poor, although the pro-poor effects are not large enough. Second, income generation process via labor market—new employment and increases in wages—is the key factor to reduce poverty by raising household income of the poor. Third, faster economic growth has greater potential to reduce poverty, as booming economy increases employment and wages or both. Fourth, poverty is reduced faster in agriculture-dominant rural regions relative to urban regions. In general, first three points are common findings generated by trade liberalization or trade agreements, but the last would be a unique outcome related to integration initiative with the European Union, which maintains high protection in agriculture. In Costa Rica, poverty reduces by 0.5 percentage-point, which corresponds to 22,000 people nationwide, as the country undergoes fast growth and enjoys the largest welfare gains (Table 6). This positive macroeconomic gain is into income gains largely through labor market channels particularly for the poor in agriculture-dominant rural regions. The higher the initial poverty rate is, the greater the poverty reduction is. The degree of inequality also influences the outcome in reducing poverty; the more equitable income distribution is, the lager the impact is. Poverty declines the most by 2.3 percentage points in Chorotega, followed by Brunca with 1.2 percentage of reduction, both have higher poverty incidence in Costa Rica. In these two regions, extreme poverty falls by 2.2 percent and 1.2 percent in Chototega. This is not the case in Atlantic Huetar, despite the most equitable income distribution in the country. This is primarily because the region has relatively lower poverty incidence and income distribution is skewed to upper income side, while poverty line (not shown in the Figure) lies to the left of the peak of the distribution. This is also the case in Central region. In the evaluation of DR-CAFTA, Sánchez and Vos (2007) find that, with roughly similar macroeconomic magnitude (1.3 percent of GDP growth), trade agreement will reduce poverty by 1.5 percent in the first five years, and 2.2 percent thereafter. Although
- 23 -

this result cannot be directly compared with ours because of different exercise, model structure and assumptions, it gives some inferences in evaluating growth effects and poverty for Costa Rica.24
In Honduras, poverty declines by 0.4 percent, which correspond to 30,000 people. The positive impact is greater in poverty-prone Oriental and Occidental regions than Central region. The impact on extreme poverty is more pronounced. The headcount rate declines by 0.6 percent at the national level, equivalent to 49,000 people, who will be lifted out of indigent poverty. Again agrarian Oriental and Occidental regions are the largest beneficiaries, with greatest improvement in poverty gap and severity not only in the country but also in Central America. Despite the highest macroeconomic growth in Central America, the impact on poverty is dwarfed in Honduras than Costa Rica, and even smaller than Nicaragua. This will be explained by two important social traits in Honduras, as analyzed in the previous section: (i) highly distorted and inflexible structure of income distribution skewed to the rich; and (ii) ridged labor market segmented by skills and gender as well as regional wage differentials. These factors significantly hinder equitable distribution of gains. Morley, Nakasone and Piñeiro (2008) report that CAFTA will reduce poverty by more than 10 percentage points in 2020.25 In Nicaragua, poverty drops around half percentage point, equivalent to 29,500 people nationwide. The modest improvement in poverty corresponds to slower economic growth and moderate welfare gains. This impact is smaller than Costa Rica, but better than Honduras, thanks to less inequitable income distribution and less inflexible labor market than Honduras. Geographically poverty declines in the poorest Central and Atlantic regions by around 0.5 percentage point. The impact on extreme poverty is modest, but greater improvement in poor Central and Atlantic regions than Managua and Pacific regions. By geographic origin, Central region contributes 30 percent of the people who are out of poverty. But interestingly Managua accounts for 40 percent. This is primarily because Managua has higher labor income reliance, smaller wage differentials among labor categories, higher female participation in employment particularly in low and semi-skilled categories plus least inequitable income distribution in the country. In recent integration analysis, Bussolo and Niimi (2005) find that CAFTA will reduce poverty by 0.7 percent under the neutral distribution and 0.3 percent in the full distribution scenarios, respectively. Despite different trade option, the magnitude of the impact is comparable to our estimation. Effects on Income Inequality Recent studies imply that while trade liberalization has poverty-alleviating, their impact on income inequality is more ambiguous. In their cross-country studies of trade liberalization in Latin America in the 1990s, Ganuza, Paes de Barros and Vos (2002) report that changes in wage differentials are the most important determinant of the changes in inequality. They also find that the changes in the structure and wage differentials are the major factors on the impact of labor market changes on income inequality than changes in employment or labor participation. Since trade agreement with the European Union benefits the agricultural sector, which in turn creates employment largely for low and semi-skilled workers, this integration also contributes to reduce inequality at least within the country. The magnitude is not large enough to break stark inequality, but positive. Yet this beneficial effect is uneven and not shared in each region, due to large heterogeneity in income generation process at individual household levels, large wage 24 Their model is a single country recursive dynamic so that it captures capital accumulation effects besides TFP growth. Yet, the most significant difference, which greatly influences the impact on labor market, is that their model assumes the perfectly elastic labor supply, while fixing the economy-wide rages. 25 It seems that their results fairly overestimate the potential impact of CAFTA on Honduras. According to ECLAC (2005), poverty rate is 80.8 percent and extreme poverty is 60.9 percent in 1990 by population. It took 15 years to reduce poverty by 10 percentage point with external and domestic policy measures. How it is possible to reduce another 10 percentage point of poverty by CAFTA alone? Many products originating from Central America to the United States were duty-free under the CBI and CBTPA preferential treatments excluding textiles, apparel and some sensitive agricultural products, before entering CAFTA.
- 24 -

differentials over skill categories as well as between genders, and highly inequitable and inflexible income distribution. Contrary to the finding by Ganuza, Paes de Barros and Vos (2002), however, the impact of employment creation particularly for low and semi-skilled labor is more associated with the improvement of inequality at least at regional levels, as it contributes to poverty reduction. In Costa Rica, inequality declines by a modest 0.27 percent in Gini and 0.5 percent in Theil indices. But inequality improves the most in Chorotega and Brunca with the lowest income. This is primarily due to the largest income gains attributed to an increase in employment with low skill intensity in agriculture. Initial low level of inequality contributes to this virtuous circle. Other regions also reduce inequality but at much slower pace. The exception is Central Pacific region with the highest initial inequality. In contrast with other regions, inequality in Central Pacific seems slightly widens, as the region undergoes the smallest increase in employment creation for low-skilled workers and the resultant smallest labor income gains. Table 11 presents the impact on inequality in Central America. <INSERT TABLE 11> Despite the highest inequality in Latin America, Honduras improves income distribution modestly both at national and regional levels. The positive impact is the largest among three Central American countries, slightly greater than that in Costa Rica. This is contributed by employment creation effects particularly in low- and semi-skilled workers by greater extent than wage increases in these labor groups. Occidental region improves the most by 0.5 percent decline inequality by Gini index and 1.23 percent by Theil indices. Occidental region is followed by Oriental region, where mean income rises the highest 1.65 percent. This reflects the greater composition of labor income in household gross income with 10 percentage higher than the national average (Table 7). Inequality declines in Central region but at slower speed, as income gains for poor households are smallest as does regional income. Honduras experiences the smallest effect in reducing inequality in Central America. In spite of initial inequality at the similar level to Costa Rica, the positive impact is roughly half of Costa Rica. This is largely due to the smallest income gains (see Figure 4 and the mean income changes in Table 11). Despite slightly larger employment creation effects for low and semi-skilled workers than in Costa Rica, those effects are not strong enough to alter the structure of income distribution at household levels. Central region with the second lowest initial inequality after Managua will reduce inequality the most within region. On the contrary, inequality seems to aggravate slightly in Pacific region, where per capita income gains is the smallest (Figure 4).
6. Summary and Conclusion In recent years, trade and poverty have received enormous attention among policy makers and the public in Latin America. In Central America, this issue was culminated in the CAFTA negotiations and its subsequent ratification processes. As in other countries in Latin America, these twin policy ingredients are extremely important for the region. Trade and integration have been and continue to be an engine for growth. In the meantime, poverty is the foremost important social agenda, as the region continues to face persistent and severe poverty, combined with a high degree of inequality. Trade and integration have made a significant contribution to growth in the 1990s, yet its impact on poverty has not been sufficient to lift the aggregate growth to transform the economies of the region to radically reduce poverty (World Bank, 2005). Following the EU-Central America Summit and the subsequent Association Agreement in 2006, Central America launched the negotiations in 2007 to conclude a bi-regional trade agreement with the European Union. The key questions to be addressed are what the potential impact would be on these policy agendas
- 25 -

in the region, particularly on poverty. To meet these policy challenges, we apply a sequential, top-down, CGE-microsimulation approach. The simulation results show that trade agreement is welfare-improving and their impact is unambiguously expansionary. Agriculture and agro-industries will be a big winner, but at the expense of capital-intensive manufacturing industries. Domestic resources are mobilized into these booming sectors relocated particularly from heavy manufacturing industries. Likewise, flourishing agriculture will create employment particularly for low- and semi-skilled but mostly male workers. The simulation results also reveal important policy challenges. Central American countries will further strengthen their comparative advantage in agriculture, driven by a surge in agriculture-related exports. Yet the agreement has little effects in enhancing export diversification of manufactured goods, changing the economic structure and strengthening technology-intensive industries. Regarding the impact on the social dimensions, trade agreement will have pro-poor and, to a lesser extent, pro-equality effects. As economic theory dictates, trade openness contributes to increase social welfare and reduce the incidence of the poor. As demonstrated by many empirical studies in the similar vein, the key element for poverty reduction is the income generation process through labor market channel particularly for low- and semi-skilled workers: job creation, or wage increases or both. Poverty declines much faster in agriculture-dominant regions than Metropolitan areas. Regarding the impact on gender, the microsimulation results indicate that integration option has positive effects on female employment and wages, but mostly less than those for male workers. The impact on inequality is positive at least at the aggregate national level, but smaller than on poverty; inequality may not necessarily decline in all regions. No valid stylized pattern is found between the initial level of inequality and the magnitude of the impact. This geographic asymmetry will be mostly the outcome of the heterogeneity in income generation process and household structure unique to some specific regions. Improved market access is the key of making trade work. By all means, agriculture, which occupies one-third of region’s population and the home of the vast poor, will be the focal and sticking point of the negotiations. As well known, the European Union maintains huge barriers to trade in agriculture: extremely high tariffs, massive domestic support and export subsidies. All of these measures are tremendous impediments for the region’s agricultural exports to the EU market. In the negotiation process, this should be well taken to maximize gains from trade to help lift the poor out of poverty in the region.26 Export growth does not necessarily guarantee to contribute to reduce poverty automatically. Trade liberalization is a powerful tool to modernize domestic industries, to achieve more resilient productive sectors for long-term sustainable growth, and to diversify export structure. In the face of globalization particularly to compete with Asian rivals, this is a vital component. In the negotiations, Central America should well consider liberalization process in agriculture, which is linked with other domestic policies. Lessons learned throughout the CAFTA process should be also fully capitalized. When all of these work, trade will play as a powerful catalyst in the efforts of poverty reduction, and the agreement will truly give a window of opportunities for the bloc. As Winters, McCulloch and McKay (2004) advocate trade will be one of the most cost-effective anti-poverty policies readily available and, with due care, can be important components of a “pro-poor” development strategy.
26 See Giordano, Parra and Watanuki (2008) for the evaluation of agricultural liberalization under the WTO framework.
- 26 -

References Armington, P.A. (1969) A Theory of Demand for Products distinguished by Place of Production. IMF
Staff Papers, 16(1), 159-178.
Alatas, V. and F. Bourguignon (2005) “The Evolution of Income Distribution During Indonesia’s Fast Growth 1980-96” in F. Bourguignon, F.H.G. Ferreira, and N. Lusting (eds.) The Microeconomics of Income Distribution Dynamics in East Asia and Latin America, Oxford University Press.
Barro, R. (2000) “Inequality and Growth in a Panel of Countries”, Journal of Economic Growth. Bourguingnon, F. (2003) “The Growth Elasticity of Poverty Reduction” in T. Eicher and S. Turnovsky
(eds.) Inequality of Growth, MIT Press: Cambridge, MA. Bourguignon, F., M. Fournier and M. Gurgand (2001) “Fast Development with a Stable Income
Distribution: Taiwan, 1979-94”, Review of Income and Wealth, 47(2), June. Bourguignon, F., A. Robilliard, and S. Robinson (2003) “Representative versus Real Households in the
Macro-economic Modeling of Inequality”, DELTA Working Paper 2003-05, mimeo, World Bank and IFPRI: Washington, D.C.
Bourguignon, F., L. Pereira da Silva, and N. Stern (2002). “Evaluating the Poverty Impact of Economic
Policies: Some Analytical Challenges”, mimeo, World Bank: Washington, D.C. Brown, D., K. Kiyota and R. Stern (2004) “Computational Analysis of the U.S. FTAs with Central
America, Australia and Morocco”, RSIE Discussion Papers No. 507, School of Public Policy, the University of Michigan.
Bussolo, M., and Y. Niimi (2005) “Do the Poor benefit from Regional Trade Pacts? An Illustration from
the Central America Free Trade Agreement in Nicaragua, Paper presented at the 8th Annual Conference on Global Economic Analysis, June 9-11, Lübeck, Germany.
CEPAL (Comisión Económica para América Latina y el Caribe) (2005) Panorama Social de América
Latina 2005, Documento Informativo, CEPAL: Santiago, Chile. Coe, D.T. and E. Helpman (1995) “International R&D Spillovers,” European Economic Review, 39, 859-
887. _____________, _____________ and A.W. Hoffmaister (1997) “North-South R&D Spillovers,” The
Economic Journal, 107, 134-149. Cororaton, C.B., and E.L. Corong (2006) Agriculture-sector Policies and Poverty in the Philippines: A
Computable General Equilibrium 9CGE) Analysis, MPIA Working Paper 2006-09, PEP. Cuesta, J. and M.V. Sánchez (2006) “Honduras: Export-Orientation and its Effect on Growth, Inequality and Poverty”, in R. Vos, E. Ganuza, S. Morley and S. Robinson (eds.,) Who Gains from Free Trade? Export-led Growth, Inequality and Poverty in Latin America, New York: Routledge. De Ferranti, D., G. Perry, D. Lederman and W. Maloney (2003) NAFTA Report, World Bank,
Washington, D.C.
- 27 -

De Melo, J., and A. Panagariya (1992) New Dimensions in Regional Integration, Center for Economic Policy Research, Cambridge University Press: New York.
De Melo, J., and S. Robinson (1992) “Productivity and Externalities: Models of Export-led Growth”,
Journal of International Trade and Economic Development, 1, 41-69. Devarajan, S., J.D. Lewis and S. Robinson (1993) “External Shocks, Purchasing Power Parity, and the
Decaluwé, B., J.C. Dumon and L. Savard (1999) “Measuring Poverty and Inequality in a Computable General Equilibrium Model”, Cahier de recherché du CRÉFA No. 99-20, Université Laval, Québec, Canada.
Decaluwé, B., A. Patry, L. Savard and E. Thorbecke (1999) “Poverty Analysis Within a General
Equilibrium Framework”, Working paper 9909, CRÉFA 99-06. Duclos, J., A. Arrar and C. Fortin (2004) DAD: Distributive Analysis, Laval University, Quebec, Canada. Duran, J.E.L., C.J. de Miguel and A.R. Schuschny (2005) “Andean Countries and USA: how much can be
expected from FTAs?”, Paper presented at the 9th Annual Conference on Global Trade Analysis, Addis Ababa, Ethiopia, June 15-17, 2006.
Foster, J., J. Greer and E. Thorbecke (1984) “A Class of Decomposable Poverty Measures”,
Econometrica 52(3), 761-766. Francois, J., L. Rivera and H. Rojas-Romagosa (2007) Economic Perspectives for Central America after
CAFTA: A GTAP-based Analysis, Paper presented at the GTAP 10th Annual Conference on “Assessing the Foundations of Global Economic Analysis”, June7-9, 2007, Indiana, United States.
Giordano, P., M. M. Parra and M. Watanuki (2007) Agriculture in the Doha Development Agenda:An
Opportunity for Latin America? Paper presented at the 10th Annual Conference on “Assessing the Foundations of Global Economic Analysis”, June 7-9, 2007. Indiana, United States.
Ganuza, E., R. Paes de Barros, and R. Vos (2002) “Labor Market Adjustment, Poverty and Inequality
During liberalization”, in R. Vos, L. Taylor, and R. Paes de Barros (eds.,) Economic Liberalization, Distribution and Poverty, Edward Elgar Publishing Ltd.: Masachusetts.
Ganuza, E., S. Morley, S. Robinson and R. Vos (2006) “Are Export Promotion and Trade Liberalization
Good for Latin America’s Poor?, in R. Vos, E. Ganuza, and S. Morley (eds.,) Who Gains from Free Trade?: Export-led Growth, Inequality and Poverty in Latin America, Routledge: New York.
Hiraire, A. and Y. Yang (2004) “The United States and the New Regionalism/Bilateralism”, Journal of
World Trade, 38(4), 603-625. Inter-American Development Bank (2002) Beyond Border: the New Regionalism is Latin America,
Economic and Social Progress in Latin America, IDB: Washington, D.C. Inter-American Development Bank (2007) Central American Report, no. 3 INT-INTAL, IDB:
Washington, D.C. Karacaovali, B. (2006) “Productivity Matters for Trade Policy: Theory and Evidence”, Policy Research
Working Paper No. 3925, World Bank: Washington, D.C.
- 28 -

Kraay, A. (2003) When is Growth Pro-Poor? Cross Country Evidence, World Bank Policy Research
Working Paper, no. 3225, Washington, D.C. Lall, S., M. Albaladejo, and M.M. Moreira (2004) Latin American Industrial Competitiveness and the
Challenge of Globalization, INTAL-ITD IECI Occasional Paper No. 05, Inter-American Development Bank: Washington, D.C.
Lofgren, H., R.L. Harris and S. Robinson (2001) A Standard General Equilibrium (CGE) Model in
GAMS, TMD Discussion Paper 75, IFPRI: Washington, D.C. Lopez, J. Humberto (2004) Pro-Poor—Pro-Growth: Is There Trade off? World Bank, Washington, D.C. Lundberg. M. and L Squire (2003) “The Simulation Evolution of Growth and Inequality”, World Bank,
Washingon, D.C. Morley, S., E. Nakasone and V. Piñeiro (2007) The Impact of CAFTA on Poverty, Distribution and
Growth in El Salvador, IFPRI Discussion Paper 00743. December. Morley, S., E. Nakasone and V. Piñeiro (2008) The Impact of CAFTA on Employment, Production and
Poverty in Honduras, IFPRI Discussion Paper 00748. January. Moreno-Brid, J.C (2003) Trade Liberalization and Economic Growth in Central America, CEPAL
Review, CEPAL, December. Nicita, A., and M. Olarreaga (2001) “Trade and Productivity, 1976-99”, Policy Research Paper No.
2701, World Bank: Washington, D.C. Ravallion. M. (1997) “Can High-Inequality Developing Countries Escape Absolute Poverty?”, World
Bank Policy Research Working Paper No. 1775. World Bank: Washington, D.C. Rodrik, D. (1997) Has Globalization Gone Too Far?, Institute of International Economics, Washington,
D.C. Sánchez, M.V., and R. Vos (2006) DR-CAFTA: ¿Panacea o Fatalidad para el Desarrollo Economico y
Social en Nicaragua? Estudios y Perspectivas 57, CEPAL: Mexico, D.F. Sánchez, M.V., and R. Vos (2007) Trade Liberalization under DR-CAFTA: General Equilibrium Effects
on Growth, Distribution and Poverty in Costa Rica and Nicaragua, Paper presented at the 10th Annual Conference on “Assessing the Foundations of Global Economic Analysis”, June 7-9, 2007. Indiana, United States.
Sauma, P. and M.V. Sánchez (2006) “Cost Rica: Export-Orientation and its Effect on Growth, Inequality
and Poverty”, in R. Vos, E. Ganuza, S. Morley and S. Robinson (eds.,) Who Gains from Free Trade? Export-led Growth, Inequality and Poverty in Latin America, New York: Routledge.
Schiff, M. and L.A. Winters (2003) Regional Integration and Development, World Bank: Washington,
D.C. Taylor, L. and R. von Arnim (2006) Modelling the Impact of Trade Liberalization: A Critique of
Computable General Equilibrium Model, Oxfam International Research Report, July.
- 29 -

Trybout, J.R., and M.D. Westbrook (1995) “Trade Liberalization and the Dimensions of Efficiency
Changes in Mexican Manufacturing Industries”, Journal of International Economics, Vol. 39 (1/2), 53-78.
U.S. International Trade Commission (ITC), (2004) U.S.-Central America-Dominican Republic Free
Trade Agreement: Potential Economywide and Selected Sector Effects, Investigation No. TA-2104-13, USITC Publication 3717, August.
Vos, R. and N de Jong, (2003) “Trade Liberalization and Poverty in Ecuador: a CGE-Microsimulation
Analysis”, Economic Systems Research, Vol. 15(2), 212-232, June. Winters, L.A., N. McCulloch, and A. McKay (2004), “Trade Liberalization and Poverty: the Evidence So
Far”, Journal of Economic Literature, Vol. XLII (March), 72-115. World Bank (2005) DR-CAFTA: Challenges and Opportunities for Central America, Central America
Department and Office of the Chief Economist, World Bank: Washington, D.C.
- 30 -

Table 1. Comparative Macroeconomic Indicators for Central America
Population and Labor Force: 2005Population (1,000) 4,326 6,880 12,600 7,200 5,490/1
Labor Force (1,000) 1,903 2,770/1 4,080/1 2,544 2,203Average Annual Change (%): 2000-2005
Population 1.96 2.10 2.44 2.19 2.05Labor Force 4.39 2.76 2.76 2.53 3.95
GDP and Trade Flows/2 /3: 2005 ($million)GDP 20,021 16,974 31,923 8,374 4,910Exports 7,057 3,475 5,381 4,477 1,548
Maquila and Zona Franca 4,072 1,818 2,002 2,594 682Non-Maquila/Zona Franca 2,984 1,657 3,378 1,883 866
Imports 9,423 6,783 10,493 6,208 3,005
Annual Growth Rate (%): 2000-2005GDP 4.08 5.26 2.53 3.60 3.05Exports 3.70 3.33 5.35 6.46 12.47
Maquila and Zona Franca 3.95 2.47 6.73 2.27 24.21Non-Maquila/Zona Franca 3.35 4.32 4.59 14.56 6.59
Imports 8.14 6.51 12.00 7.83 9.96Trade Openness (Trade/GDP:%)
Exports/GDP 35.2 20.5 16.9 53.5 31.5Imports/GDP 47.1 40.0 32.9 74.1 61.2
Notes /1: Labor Statistics, ILO./2: Merchandise trade excluding services trade./3: Including trade of maquila and zona franca from the IDB-INT trade statistics.
Sources: Central Bank of each country.
NicaraguaCosta Rica El Salvador Guatemala Honduras
Table 2. Market Share of Central American Trade with Major Partners (2004)
(%)Value
($million)Rest ofWorld World
ExportsCosta Rica 8,045 10.2 37.6 26.7 13.3 4.6 7.5 100.0El Salvador 3,322 24.9 65.3 5.0 2.0 0.3 2.4 100.0Guatemala 5,080 24.4 53.6 5.8 6.5 1.1 8.7 100.0Honduras 4,292 6.6 78.9 10.3 2.4 0.4 1.3 100.0Nicaragua 1,422 15.3 67.5 9.5 5.9 0.3 1.5 100.0CentralAmerica 22,160 15.3 55.3 14.4 7.5 2.1 5.4 100.0
ImportsCosta Rica 8,263 4.2 45.6 11.6 19.9 9.8 8.9 100.0El Salvador 6,406 16.6 34.5 8.9 17.5 8.7 13.8 100.0Guatemala 8,666 10.3 40.2 9.0 15.1 8.9 16.5 100.0Honduras 5,638 13.0 55.0 8.6 9.3 4.2 9.9 100.0Nicaragua 2,385 22.8 28.0 6.5 22.6 8.9 11.2 100.0CentralAmerica 31,358 11.4 42.2 9.4 16.4 8.3 12.4 100.0
Note: Merchandise trade, excluding trade in services. Trade on maquila and zona franca is based on customs basis.Sources: IDB-INT CACM model database.
Japan/ ChinaCentralAmerica United States European
UnionRest of
Americas
- 31 -

Table 3. Composition of Central America's Exports to the European Union (2004)
(%)ProductsVegetables and Fruits 20.4 9.3 25.2 2.1Oil seeds and Soybeans 2.6 12.5Sugar 4.7Coffee and Cocoa 4.8 36.7 46.7 42.4 48.9Livestock 2.7 1.1Other Agriculture 2.3 1.1 12.7 0.3 3.0Agriculture 27.6 45.2 72.5 67.9 66.3Coal, Oil and Gas 4.8Energy 4.8Processed Meat 1.1Beverages and Tobaccos 3.0 1.1 3.9Other Food Products 4.5 23.0 18.2 15.3 13.5Processed Foods 4.5 23.0 21.2 16.4 18.4Maquila 0.4 6.5 2.5 8.2 7.0Leather and Footwear 0.2 0.8 2.5Other Light Manufactures 0.3 1.2 2.0 1.8 3.7Light Manufactures 0.9 8.5 4.5 10.0 13.1Chemical and Plastics 0.4 1.2 1.3Metals Products 0.1 1.0 1.1Motor Vehicles 2.5Machinery and Equipment 17.3 18.6 0.6 0.9 1.1Zona Franca 49.3Heavy Manufactures 67.1 23.4 1.9 0.9 2.2Total 100.0 100.0 100.0 100.0 100.0Note: Merchandise Trade. Trade on maquila and zona franca is based on customs basis.
Exports less than $1 million are omitted.Sources: IDB-INT CACM model database.
NicaraguaCosta Rica El Salvador Guatemala Honduras
Table 4. Central America's Tariffs on Imports from European Union
(%)CommoditiesRice and Wheat 22.25 25.00 18.46 22.50 36.63Cereal Grains 7.20 5.42 7.69 6.92 5.38Vegetables and Fruits 14.44 13.80 13.91 13.76 14.06Oil seeds and Soybeans 3.42 2.50 2.50 2.50 2.00Sugar 23.50 12.50 12.50 12.50 11.25Coffee and Cocoa 7.84 7.36 7.36 7.26 6.74Livestock 6.61 6.03 6.03 6.03 5.00Other Agriculture 6.72 6.58 6.42 6.32 6.16Agriculture 7.84 8.75 7.36 8.17 8.73Coal, Oil and Gas 2.79 1.89 2.20 2.34 2.05Petroleum 5.50 4.17 6.67 6.67 7.05Energy 5.42 4.17 3.31 3.41 7.05Processed Meat 24.24 20.00 12.08 14.40 12.73Dairy Products 34.21 10.38 8.75 9.74 13.15Beverages and Tobaccos 13.67 21.63 27.95 13.21 14.40Other Food Products 10.69 10.77 9.82 10.23 9.79Processed Foods 12.81 13.33 16.61 11.43 11.11Textiles 8.61 15.93 11.18 10.10 5.69Wearing Apparel 14.73 23.76 17.47 14.78 14.78Maquila 0.00 0.00 0.00 0.00 0.00Leather and Footwear 9.98 11.35 12.24 9.74 8.64Other Light Manufactures 7.71 7.49 7.50 7.43 5.68Light Manufactures 8.12 9.96 9.23 8.42 5.68Chemical and Plastics 3.46 2.76 2.81 2.62 2.44Metals Products 3.69 3.08 2.97 2.97 2.12Motor Vehicles 6.08 5.83 7.06 5.40 5.14Machinery and Equipment 3.50 3.32 3.42 3.05 2.87Zona Franca 0.00 0.00 0.00 0.00 0.00Heavy Manufactures 3.17 4.22 3.72 3.15 3.03Total 4.71 5.26 5.24 3.98 4.66Note: Tariffs in "macrosectors" and "total" are trade-weighted.Source: IDB-INT Tariff Database (2005/06).
NicaraguaCosta Rica El Salvador Guatemala Honduras
- 32 -

Table 5. EU's Tariffs on Imports from Central America
(%)CommoditiesRice and Wheat 20.41 20.41 20.41 20.41 20.41Cereal Grains 29.32 29.32 29.32 29.32 29.32Vegetables and Fruits 15.74 15.74 15.74 15.74 15.74Oil seeds and Soybeans 0.00 0.00 0.00 0.00 0.00Sugar 106.39 106.39 106.39 106.39 106.39Coffee and Cocoa 1.73 1.73 1.73 1.73 1.73Livestock 3.17 3.17 3.17 3.17 3.17Other Agriculture 1.93 1.93 1.93 1.93 1.93Agriculture 13.67 13.46 3.60 5.41 1.86Coal, Oil and Gas 0.00 0.00 0.00 0.00 0.00Petroleum 0.00 0.00 0.00 0.00 0.00Energy 0.00 0.00 0.00 0.00 0.00Processed Meat 49.57 49.57 49.57 49.57 49.57Dairy Products 43.21 43.21 43.21 43.21 43.21Beverages and Tobaccos 9.33 9.33 9.33 9.33 9.33Other Food Products 9.33 9.33 9.33 9.33 9.33Processed Foods 9.33 9.33 9.33 9.33 11.67Textiles 7.46 7.46 7.46 7.46 7.46Wearing Apparel 8.78 8.78 8.78 8.78 8.78Maquila 8.12 8.12 8.12 8.12 8.12Leather and Footwear 4.48 4.48 4.48 4.48 4.48Other Light Manufactures 0.36 0.36 0.36 0.36 0.36Light Manufactures 1.27 0.50 0.16 0.07 0.91Chemical and Plastics 0.57 0.57 0.57 0.57 0.57Metals Products 0.91 0.91 0.91 0.91 0.91Motor Vehicles 2.60 2.60 2.60 2.60 2.60Machinery and Equipment 0.42 0.42 0.42 0.42 0.42Zona Franca 0.42Heavy Manufactures 0.11 0.72 0.52 0.42 0.66Total 6.72 9.27 4.58 4.97 3.43Note: Tariffs in "macrosectors" and "total" are trade-weighted.Source: IDB-INT Tariff Database (2005/06).
NicaraguaCosta Rica El Salvador Guatemala Honduras
Table 6. Impact on Welfare and Macroeconomic Indicators (percentage change from base)
Exports/1
Aggregate 3.00 1.13 1.64 1.90 1.78European Union 15.10 15.50 20.35 27.02 14.48
Imports/1
Aggregate 2.64 1.04 1.25 1.32 0.94European Union 25.28 25.58 29.03 19.04 25.08
Exchange Rate/2 -0.10 0.51 0.51 -0.04 0.20Real GDP (expenditure) 0.95 0.82 0.96 1.07 0.85Welfare (EV)/3 1.76 0.82 1.05 1.67 1.01Tariff Revenue -14.18 -14.16 -10.65 -11.65 -8.02Employment 0.97 0.30/4 0.37/4 0.88 0.51Notes: /1: Exclude trade in services.
/2: Price-level-deflated exchange rate./3: Equivalent variations./4: Preliminary.
NicaraguaCosta Rica El Salvador Guatemala Honduras
- 33 -

Table 7. Structure of Regional Household Income in Central America
(percentage share)
Sub-total Transfers Male Female Male Female Male Female
Costa RicaCentral 5.02 1.07 24.03 6.83 32.86 17.43 87.24 2.39 10.37 100.00 Chorotega 11.08 1.94 30.66 6.53 20.74 16.16 87.11 0.89 12.00 100.00 Central Pacific 12.48 2.24 34.38 6.82 20.85 11.25 88.01 1.41 10.57 100.00 Brunca 10.29 2.10 32.34 7.14 19.51 12.93 84.32 1.57 14.10 100.00 Atlantic Huetar 16.53 2.61 40.32 8.04 13.15 10.51 91.15 0.74 8.11 100.00 North Huetar 11.68 2.12 32.30 8.62 19.21 13.96 87.89 3.83 8.29 100.00 National 8.02 1.53 28.08 7.04 27.13 15.62 87.43 2.06 10.51 100.00
HondurasCentral 7.54 2.79 14.59 6.54 24.29 11.85 67.60 2.88 29.52 100.00 Occidental 19.33 5.40 15.09 6.36 14.75 5.71 66.65 1.54 31.81 100.00 Oriental 19.36 5.34 20.99 6.61 14.82 8.94 76.07 6.55 17.38 100.00 National 9.47 3.21 15.17 6.53 22.73 11.12 68.24 3.08 28.68 100.00
NicaraguaManagua 5.08 2.59 15.56 6.57 22.51 14.71 67.00 3.55 29.45 100.00 Pacific 11.79 5.13 11.98 4.66 16.27 8.89 58.72 2.70 38.58 100.00 Central 22.77 5.25 13.23 3.74 11.14 7.04 63.17 1.64 35.19 100.00 Atlantic 28.96 4.26 15.41 4.11 8.11 6.73 67.57 3.43 29.00 100.00 National 19.14 4.63 13.74 4.44 13.19 8.43 63.57 2.63 33.80 100.00 Sources: MECOVI Households Survey Database, IDB, based on household sample surveys in each country.
Costa Rica: Encuesta de Hogares de Propósitos Mùltiples (2004).Honduras: Encuesta de Condiciones de Vida (2004).Nicaragua: Encuesta Nacional de Hogares sobre Medición de Niveles de Vida (2005).
TotalIncomeLow-skilled Semi-skilled High-skilled
Labor IncomeCapitalIncome
Table 8. Poverty Profile in Central American Countries: 2004
(%)
Gap (P1) Gap (P1)
Costa RicaCentral 18.46 6.96 3.91 4.25 1.56 0.85Chorotega 38.60 16.83 10.11 13.66 5.52 3.03Central Pacific 28.24 11.60 6.82 9.60 3.49 1.96Brunca 43.45 19.67 12.02 15.60 5.97 3.48Atlantic Huetar 27.04 10.09 5.69 7.02 2.80 1.59North Huetar 30.49 11.23 6.40 11.05 4.78 2.77National 23.91 9.52 5.49 6.88 2.57 1.43
HondurasCentral 65.51 36.01 24.34 36.47 17.13 10.73Occidental 69.11 41.27 29.31 57.31 31.20 20.95Oriental 89.07 63.66 50.03 64.40 35.80 24.86National 70.10 41.95 30.16 45.31 24.03 16.12
NicaraguaManagua 28.02 9.57 4.47 6.07 1.65 0.75Pacific 45.91 18.04 9.62 13.33 4.47 2.30Central 59.22 27.59 16.26 24.05 8.27 4.01Atlantic 61.71 30.23 18.81 28.77 11.28 6.20National 48.31 21.06 11.94 17.20 5.99 3.03Sources: MECOVI Households Survey Database, IDB, based on household sample surveys in each country.Note: Poverty measurements follow the FGT indices.
Poverty Extreme poverty
Headcount (P0) Severity (P2) Headcount (P0) Severity (P2)
- 34 -

Table 9. Inequality in Central America: 2004
Theil Gini
Costa RicaCentral 1.13 0.38 0.46Chorotega 0.71 0.36 0.46Central Pacific 1.10 0.70 0.54Brunca 0.61 0.41 0.48Atlantic Huetar 0.69 0.25 0.39North Huetar 0.85 0.41 0.48National 1.00 0.41 0.47
HondurasCentral 1.27 0.80 0.59Occidental 0.49 0.81 0.61Oriental 0.60 0.59 0.56National 1.00 0.85 0.61
NicaraguaManagua 1.41 0.42 0.46Pacific 1.00 0.51 0.46Central 0.79 0.44 0.47Atlantic 0.76 0.50 0.50National 1.00 0.49 0.48Sources: MECOVI Households Survey Database, IDB, based on
household sample surveys in each country.Note: Measured by the population.
Mean Income Ratio Inequality Indices
Regional vs.National
Table 10. Impact on Poverty for Selected Central American Countries
Gap (P1) Gap (P1)Costa RicaCentral -0.67 -0.19 -0.11 -0.22 -0.04 -0.03Chorotega -2.33 -0.94 -0.67 -1.21 -0.48 -0.30Central Pacific -1.00 -0.13 -0.07 -0.08 -0.03 -0.01Brunca -1.20 -0.93 -0.71 -2.21 -0.50 -0.37Atlantic Huetar -0.49 -0.10 -0.04 -0.29 -0.02 -0.01North Huetar -0.87 -0.41 -0.20 -0.40 -0.13 -0.06National -0.53 -0.30 -0.19 -0.75 -0.11 -0.07
HondurasCentral -0.37 -0.43 -0.38 -0.61 -0.33 -0.23Occidental -0.74 -0.75 -0.73 -0.99 -0.78 -0.69Oriental -0.67 -0.55 -0.58 -0.98 -0.64 -0.47National -0.39 -0.47 -0.45 -0.60 -0.44 -0.36
NicaraguaManagua -0.38 -0.16 -0.05 -0.26 -0.02 -0.01Pacific -0.43 -0.23 -0.12 -0.31 -0.04 -0.02Central -0.56 -0.37 -0.24 -0.33 -0.11 -0.05Atlantic -0.54 -0.31 -0.26 -0.42 -0.20 -0.11National -0.47 -0.28 -0.17 -0.24 -0.08 -0.04Source: IDB-INT CACM model simulations and miscrosimulation.
Poverty Extreme PovertyHeadcount (P0) Severity (P2) Headcount (P0) Severity (P2)
- 35 -
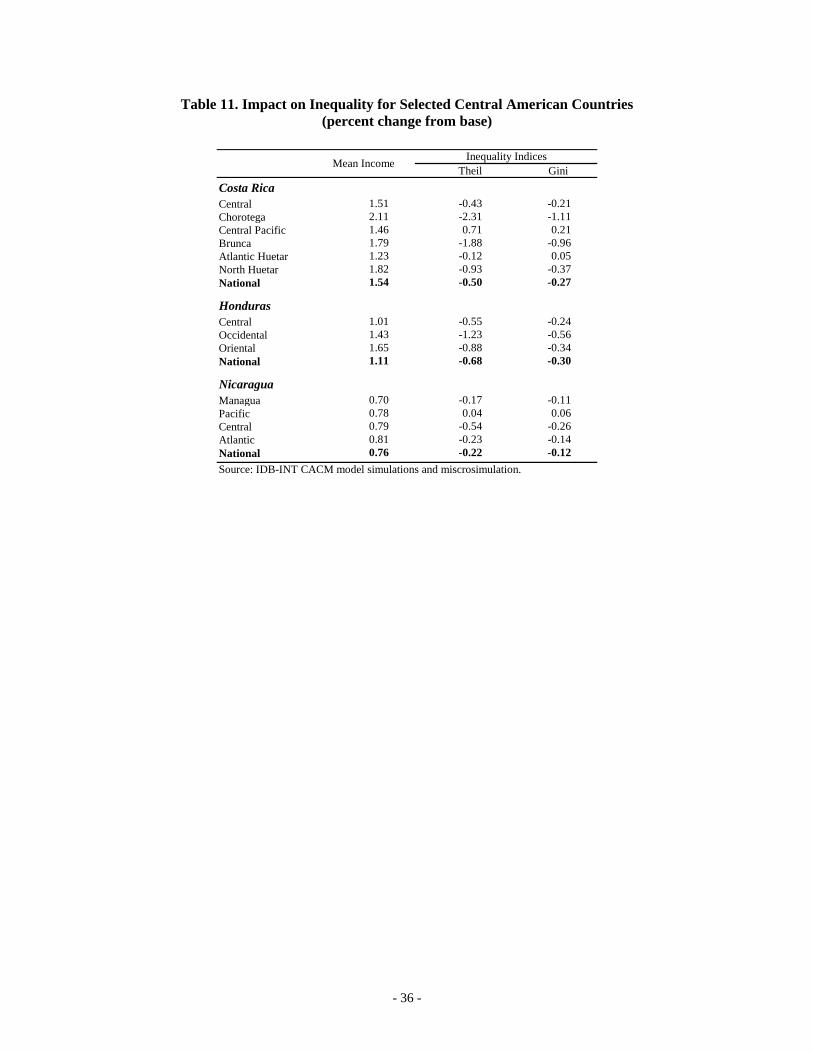
Table 11. Impact on Inequality for Selected Central American Countries (percent change from base)
Theil Gini Costa RicaCentral 1.51 -0.43 -0.21Chorotega 2.11 -2.31 -1.11Central Pacific 1.46 0.71 0.21Brunca 1.79 -1.88 -0.96Atlantic Huetar 1.23 -0.12 0.05North Huetar 1.82 -0.93 -0.37National 1.54 -0.50 -0.27
HondurasCentral 1.01 -0.55 -0.24Occidental 1.43 -1.23 -0.56Oriental 1.65 -0.88 -0.34National 1.11 -0.68 -0.30
NicaraguaManagua 0.70 -0.17 -0.11Pacific 0.78 0.04 0.06Central 0.79 -0.54 -0.26Atlantic 0.81 -0.23 -0.14National 0.76 -0.22 -0.12Source: IDB-INT CACM model simulations and miscrosimulation.
Mean Income Inequality Indices
- 36 -

Figure 1. Impact on Central America’s Sectoral Exports to the European Union (1) Costa Rica (3) Guatemala (5) Nicaragua
(2) El Salvador (4) Honduras
Legend:AGR: Agriculture FOOD: Food Products
LMFG: Light Manufactures HMFG: Heavy Manufactures
Source: IDB-INT CACM model estimations.
0
10
20
30
40
50
AGR FOOD LMFG HMFG TOTAL 0
10
20
30
40
50
AGR FOOD LMFG HMFG TOTAL
0
10
20
30
40
50
AGR FOOD LMFG HMFG TOTAL 0
10
20
30
40
50
AGR FOOD LMFG HMFG TOTAL
0
10
20
30
40
50
AGR FOOD LMFG HMFG TOTAL
- 37 -

Figure 2. Composition of Central America's New Exports to the European Union
(Percent)
Legend:Agriculture Food Products
Light Manufactures Heavy Manufactures
Source: IDB-INT CACM model estimations.
0
10
20
30
40
50
60
70
80
90
100
Costa Rica El Salvador Guatemala Honduras Nicaragua
- 38 -

Figure 3. Distribution of Household Income in Central America
- 39 -

Figure 4. Impact on Per Capita Labor Income decomposed by Labor Category (percentage change from base)
- 40 -

Figure 5. Impact on Household Income Gains in Central America
- 41 -

Figure 6. Number of People out of Poverty by Region
- 42 -