evaluating the nutrition quality and marketing of … · evaluating the nutrition quality and...
TRANSCRIPT

Support for this project was provided by grants from the Robert Wood Johnson Foundation and the Rudd Foundation.
Evaluating the Nutrition Quality and Marketing of Children’s Cereals

Cereal FACTS: Evaluating the nutrition quality and marketing of children’s cerealsAuthors:Jennifer L. Harris, Ph.D., M.B.A.Marlene B. Schwartz, Ph.D.Kelly D. Brownell, Ph.D.Vishnudas Sarda, M.B.B.S., M.P.H.Megan E. Weinberg, M.A.Sarah SpeersJackie ThompsonAmy UstjanauskasAndrew Cheyne, M.A.Eliana Bukofzer, M.P.H.Lori Dorfman, Dr.PH.Hannah Byrnes-Enoch
Rudd Center for Food Policy and Obesity October, 2009

Acknowledgements
We would like to thank the following people for their assistance in collecting, coding and analyzing the data:Amir Goren, Ph.D.Jessee Leili-JonesCarly LitzenbergerJulie McComishKathryn O’ShaughnessyDoug RanshausWarren SethachutkulCozette Tran-Caffee, M.P.P.
We would also like to thank our steering committee and other advisors:Frank J. Chaloupka, Ph.D.William H. Dietz, M.D., Ph.D.Steve FajenThomas R. Frieden, M.D., M.P.H.*Kipling J. Gallion, M.A.Corinna Hawkes, Ph.D.Shiriki Kumanyika, Ph.D., M.P.H.Tim Lobstein, Ph.D.Susan T. Mayne, Ph.D.Lisa M. Powell, Ph.D.Mike Rayner, Ph.D.Mary Story, Ph.D., R.D.Stephen Teret, J.D., M.P.H.Ellen Wartella, Ph.D.James G. Webster, Ph.D.Jerome D. Williams, Ph.D.
*Dr. Frieden served on the steering committee prior to assuming his role at the C.D.C.
Thank you to our colleagues at the Rudd Center, especially Rebecca Oren, Andrea Wilson, Meredith St. John and Tricia Wynne. Finally, we thank the leadership and staff at the Robert Wood Johnson Foundation, with special thanks to the Childhood Obesity Team, including C. Tracy Orleans, Ph.D., Punam Ohri-Vachaspati, Ph.D., R.D., Stephanie Weiss, M.P.H., and David Adler.
Support for this project was provided by grants from the Robert Wood Johnson Foundation and the Rudd Foundation

Cereal FACTS iii
List of Tables. . . . . . . . . . . . . . . . . . . . . . . . . . . . . . . . . . . . . . . . . . . . . . . . . . . . . . . . . . . . . . . . . . . . . . . . . . . . . . . . . . . iv
List of Figures . . . . . . . . . . . . . . . . . . . . . . . . . . . . . . . . . . . . . . . . . . . . . . . . . . . . . . . . . . . . . . . . . . . . . . . . . . . . . . . . . .v
Executive Summary . . . . . . . . . . . . . . . . . . . . . . . . . . . . . . . . . . . . . . . . . . . . . . . . . . . . . . . . . . . . . . . . . . . . . . . . . . . .v1
Introduction . . . . . . . . . . . . . . . . . . . . . . . . . . . . . . . . . . . . . . . . . . . . . . . . . . . . . . . . . . . . . . . . . . . . . . . . . . . . . . . . . . 10
Methods . . . . . . . . . . . . . . . . . . . . . . . . . . . . . . . . . . . . . . . . . . . . . . . . . . . . . . . . . . . . . . . . . . . . . . . . . . . . . . . . . . . . . . 14Overview . . . . . . . . . . . . . . . . . . . . . . . . . . . . . . . . . . . . . . . . . . . . . . . . . . . . . . . . . . . . . . . . . . . . . . . . . . . . . . . . . . . . . 14
Nutrition quality . . . . . . . . . . . . . . . . . . . . . . . . . . . . . . . . . . . . . . . . . . . . . . . . . . . . . . . . . . . . . . . . . . . . . . . . . . . . . . . 15
Media advertising . . . . . . . . . . . . . . . . . . . . . . . . . . . . . . . . . . . . . . . . . . . . . . . . . . . . . . . . . . . . . . . . . . . . . . . . . . . . . . 17
Internet marketing. . . . . . . . . . . . . . . . . . . . . . . . . . . . . . . . . . . . . . . . . . . . . . . . . . . . . . . . . . . . . . . . . . . . . . . . . . . . . .18
In-store marketing. . . . . . . . . . . . . . . . . . . . . . . . . . . . . . . . . . . . . . . . . . . . . . . . . . . . . . . . . . . . . . . . . . . . . . . . . . . . . 22
Cereal FACTS Index . . . . . . . . . . . . . . . . . . . . . . . . . . . . . . . . . . . . . . . . . . . . . . . . . . . . . . . . . . . . . . . . . . . . . . . . . . . 24
Results . . . . . . . . . . . . . . . . . . . . . . . . . . . . . . . . . . . . . . . . . . . . . . . . . . . . . . . . . . . . . . . . . . . . . . . . . . . . . . . . . . . . . . . 27Overview of cereal market . . . . . . . . . . . . . . . . . . . . . . . . . . . . . . . . . . . . . . . . . . . . . . . . . . . . . . . . . . . . . . . . . . . . . . .27
Cereal nutrition quality . . . . . . . . . . . . . . . . . . . . . . . . . . . . . . . . . . . . . . . . . . . . . . . . . . . . . . . . . . . . . . . . . . . . . . . . . 28
Media advertising . . . . . . . . . . . . . . . . . . . . . . . . . . . . . . . . . . . . . . . . . . . . . . . . . . . . . . . . . . . . . . . . . . . . . . . . . . . . . . 31
Advertising spending . . . . . . . . . . . . . . . . . . . . . . . . . . . . . . . . . . . . . . . . . . . . . . . . . . . . . . . . . . . . . . . . . . . . . . . . . . 31
Television advertising exposure . . . . . . . . . . . . . . . . . . . . . . . . . . . . . . . . . . . . . . . . . . . . . . . . . . . . . . . . . . . . . . . . . .32
Television advertising content. . . . . . . . . . . . . . . . . . . . . . . . . . . . . . . . . . . . . . . . . . . . . . . . . . . . . . . . . . . . . . . . . . . .35
Internet marketing. . . . . . . . . . . . . . . . . . . . . . . . . . . . . . . . . . . . . . . . . . . . . . . . . . . . . . . . . . . . . . . . . . . . . . . . . . . . . 38
Child-targeted websites . . . . . . . . . . . . . . . . . . . . . . . . . . . . . . . . . . . . . . . . . . . . . . . . . . . . . . . . . . . . . . . . . . . . . . . 38
Banner advertising on third party websites . . . . . . . . . . . . . . . . . . . . . . . . . . . . . . . . . . . . . . . . . . . . . . . . . . . . . . . . 45
Social media . . . . . . . . . . . . . . . . . . . . . . . . . . . . . . . . . . . . . . . . . . . . . . . . . . . . . . . . . . . . . . . . . . . . . . . . . . . . . . . . .47
In-store marketing. . . . . . . . . . . . . . . . . . . . . . . . . . . . . . . . . . . . . . . . . . . . . . . . . . . . . . . . . . . . . . . . . . . . . . . . . . . . . 49
Supermarket shelf space allocation and placement. . . . . . . . . . . . . . . . . . . . . . . . . . . . . . . . . . . . . . . . . . . . . . . . . . 50
In-store displays and promotions . . . . . . . . . . . . . . . . . . . . . . . . . . . . . . . . . . . . . . . . . . . . . . . . . . . . . . . . . . . . . . . . . 51
Product packaging . . . . . . . . . . . . . . . . . . . . . . . . . . . . . . . . . . . . . . . . . . . . . . . . . . . . . . . . . . . . . . . . . . . . . . . . . . . .53
Cereal FACTS Index . . . . . . . . . . . . . . . . . . . . . . . . . . . . . . . . . . . . . . . . . . . . . . . . . . . . . . . . . . . . . . . . . . . . . . . . . . . .55
Discussion . . . . . . . . . . . . . . . . . . . . . . . . . . . . . . . . . . . . . . . . . . . . . . . . . . . . . . . . . . . . . . . . . . . . . . . . . . . . . . . . . . . 57
Endnotes . . . . . . . . . . . . . . . . . . . . . . . . . . . . . . . . . . . . . . . . . . . . . . . . . . . . . . . . . . . . . . . . . . . . . . . . . . . . . . . . . . . . .62
Ranking Tables. . . . . . . . . . . . . . . . . . . . . . . . . . . . . . . . . . . . . . . . . . . . . . . . . . . . . . . . . . . . . . . . . . . . . . . . . . . . . . . 66
Appendices . . . . . . . . . . . . . . . . . . . . . . . . . . . . . . . . . . . . . . . . . . . . . . . . . . . . . . . . . . . . . . . . . . . . . . . . . . . . . . . . . . . 78A. U.K. OFCOM Nutrient Profiling (NP) Model . . . . . . . . . . . . . . . . . . . . . . . . . . . . . . . . . . . . . . . . . . . . . . . . . . . . . . .78
B. FACTS Index scoring calculations . . . . . . . . . . . . . . . . . . . . . . . . . . . . . . . . . . . . . . . . . . . . . . . . . . . . . . . . . . . . . .83
C. Master list of cereals and nutrition information . . . . . . . . . . . . . . . . . . . . . . . . . . . . . . . . . . . . . . . . . . . . . . . . . . 87
D. Summary of marketing data by cereal and brand . . . . . . . . . . . . . . . . . . . . . . . . . . . . . . . . . . . . . . . . . . . . . . . . . .97
Table of Contents

List of TablesTable 1: CFBAI better-for-you criteria for cereals. . . . . . . . . . . . . . . . . . . . . . . . . . . . . . . . . . . . . . . . . . . . . . . . . . . . . . . 11
Table 2: Child and family brands. . . . . . . . . . . . . . . . . . . . . . . . . . . . . . . . . . . . . . . . . . . . . . . . . . . . . . . . . . . . . . . . . . .27
Table 3: Nutrition content of child, family and adult cereals. . . . . . . . . . . . . . . . . . . . . . . . . . . . . . . . . . . . . . . . . . . . . 28
Table 4: Nutrition quality comparison of child and family cereals by company . . . . . . . . . . . . . . . . . . . . . . . . . . . . . . 29
Table 5: Nutrition scores for cereals approved as better-for-you under the CFBAI. . . . . . . . . . . . . . . . . . . . . . . . . . . . .30
Table 6: Total advertising spending for child, family and adults brands and companies . . . . . . . . . . . . . . . . . . . . . . . . 31
Table 7: Total advertising spending for child and family brands by company (excluding company level advertising). . . 32
Table 8: Exposure to television advertising for child, family and adult cereals in 2008 among African American youth and youth on Spanish-language television. . . . . . . . . . . . . . . . . . . . . . . . . . . . . . . . . . . . . . . . . . . . . . . . . . . . . . 34
Table 9: Television advertising content by brand for ads targeted to children . . . . . . . . . . . . . . . . . . . . . . . . . . . . . . . 36
Table 10: Television advertising content for family brands . . . . . . . . . . . . . . . . . . . . . . . . . . . . . . . . . . . . . . . . . . . . . . .37
Table 11: Cereal company websites with content targeted to young people . . . . . . . . . . . . . . . . . . . . . . . . . . . . . . . . .39
Table 12: Targeted visitor ratios for websites with child-targeted content. . . . . . . . . . . . . . . . . . . . . . . . . . . . . . . . . . . 40
Table 13: Child-targeted website content analysis . . . . . . . . . . . . . . . . . . . . . . . . . . . . . . . . . . . . . . . . . . . . . . . . . . . . 42
Table 14: Interactive content on child-targeted web pages as of March, 2008 . . . . . . . . . . . . . . . . . . . . . . . . . . . . . . 44
Table 15: Top 10 web publishers with advertising for child cereal brands . . . . . . . . . . . . . . . . . . . . . . . . . . . . . . . . . . 45
Table 16: Content analysis of banner advertising for child brands . . . . . . . . . . . . . . . . . . . . . . . . . . . . . . . . . . . . . . . . .47
Table 17: Social media presence for child and family brands . . . . . . . . . . . . . . . . . . . . . . . . . . . . . . . . . . . . . . . . . . . 48
Table 18: Cereals most often stocked on the middle shelf in the supermarket. . . . . . . . . . . . . . . . . . . . . . . . . . . . . . . . 51
Table 19: In-store marketing by child, family and adult brands and company . . . . . . . . . . . . . . . . . . . . . . . . . . . . . . . .52
Table 20: Health messages on cereal boxes. . . . . . . . . . . . . . . . . . . . . . . . . . . . . . . . . . . . . . . . . . . . . . . . . . . . . . . . . 54
Table 21: Child and family cereals with no significant marketing activity . . . . . . . . . . . . . . . . . . . . . . . . . . . . . . . . . . . 56
Ranking Tables1: Brand nutrition . . . . . . . . . . . . . . . . . . . . . . . . . . . . . . . . . . . . . . . . . . . . . . . . . . . . . . . . . . . . . . . . . . . . . . . . . . . . . . 66
2: Advertising spending . . . . . . . . . . . . . . . . . . . . . . . . . . . . . . . . . . . . . . . . . . . . . . . . . . . . . . . . . . . . . . . . . . . . . . . . . 68
3: Television advertising exposure . . . . . . . . . . . . . . . . . . . . . . . . . . . . . . . . . . . . . . . . . . . . . . . . . . . . . . . . . . . . . . . . . 69
4: Child-targeted website exposure . . . . . . . . . . . . . . . . . . . . . . . . . . . . . . . . . . . . . . . . . . . . . . . . . . . . . . . . . . . . . . . . .70
5: Banner advertising exposure . . . . . . . . . . . . . . . . . . . . . . . . . . . . . . . . . . . . . . . . . . . . . . . . . . . . . . . . . . . . . . . . . . . .70
6: Supermarket shelf space . . . . . . . . . . . . . . . . . . . . . . . . . . . . . . . . . . . . . . . . . . . . . . . . . . . . . . . . . . . . . . . . . . . . . . . 71
7: Supermarket in-store marketing . . . . . . . . . . . . . . . . . . . . . . . . . . . . . . . . . . . . . . . . . . . . . . . . . . . . . . . . . . . . . . . . . .73
8: On-package child engagement messages . . . . . . . . . . . . . . . . . . . . . . . . . . . . . . . . . . . . . . . . . . . . . . . . . . . . . . . . .75
9: On-package health and ingredient claims . . . . . . . . . . . . . . . . . . . . . . . . . . . . . . . . . . . . . . . . . . . . . . . . . . . . . . . . . 76
10: FACTS Index. . . . . . . . . . . . . . . . . . . . . . . . . . . . . . . . . . . . . . . . . . . . . . . . . . . . . . . . . . . . . . . . . . . . . . . . . . . . . . . .77
Cereal FACTS iv

List of FiguresFigure 1: Calculating the Cereal FACTS Index . . . . . . . . . . . . . . . . . . . . . . . . . . . . . . . . . . . . . . . . . . . . . . . . . . . . . . . 24
Figure 2: Additional nutrition criteria for child, family and adult cereals . . . . . . . . . . . . . . . . . . . . . . . . . . . . . . . . . . . . 29
Figure 3: Nutrition quality improvements for child, family and adult cereals. . . . . . . . . . . . . . . . . . . . . . . . . . . . . . . . . .30
Figure 4: Nutrition quality improvements for child and family cereals by company . . . . . . . . . . . . . . . . . . . . . . . . . . . .30
Figure 5: Exposure to child, family and adult cereal television advertising in 2008, by age . . . . . . . . . . . . . . . . . . . . . 33
Figure 6: Young people’s exposure to child and family brand advertising (excluding corporate advertising) by company in 2008 . . . . . . . . . . . . . . . . . . . . . . . . . . . . . . . . . . . . . . . . . . . . . . . . . . . . . . . . . . . . . . . . . . . . . . . . . . . . . 33
Figure 7: Young people’s exposure to television advertising: 2008 vs. 2009 projected . . . . . . . . . . . . . . . . . . . . . . . . 34
Figure 8: Differences in television advertising content for child, family and adult cereal brands. . . . . . . . . . . . . . . . . .35
Figure 9: Brands marketed most to children on television and the internet . . . . . . . . . . . . . . . . . . . . . . . . . . . . . . . . . 49
Figure 10: Relative share of advertising and shelf space for child and family brands . . . . . . . . . . . . . . . . . . . . . . . . . 50
Figure 11: Child engagement messages on cereal boxes . . . . . . . . . . . . . . . . . . . . . . . . . . . . . . . . . . . . . . . . . . . . . . .53
Figure 12: Advertising spending on child brands in 2008 . . . . . . . . . . . . . . . . . . . . . . . . . . . . . . . . . . . . . . . . . . . . . . 59
Cereal FACTS v

Cereal FACTS vi
Extensive marketing to children for foods of poor nutritional quality has been identified as a con-tributor to the obesity crisis. The food industry has responded, through the Children’s Food and Beverage Advertising Initiative (CFBAI) sponsored by the Council of Better Business Bureaus, with pledges by most of the largest food marketers to reduce unhealthy marketing to children. The ques-tion raised by health advocates is whether self-reg-ulatory actions such as these do in fact reduce the harm associated with unhealthy food marketing to children. Cereal FACTS addresses that question.
Ready-to-eat (RTE) cereals are the largest category of packaged food marketed directly to children; in 2006, cereal companies spent $229 million to target children and adolescents. In this report, we present the nutrient quality of cereals, evaluate the products marketed to children as compared to those marketed to adults, quantify young people’s exposure to cereal marketing, and describe the marketing practices used to reach children and their parents.
We make a fundamental distinction between brands marketed directly to children (i.e., child brands); those marketed to parents and adults as appropriate to feed their children and/or families (i.e., family brands); and those marketed to adults for adult consumption only (i.e., adult brands). Due to their greater vulnerability to marketing influence, we begin with the assumption that products and messages used to market foods to youth must be held to a higher standard than those used to market to parents and adults.
We first evaluate the nutrient content of 277 RTE cereals offered by 13 companies in the United States and compare the quality of child, family and adult brands. To conduct this evaluation, we utilize an overall Nutrition Profiling Index (NPI) score based on the nutrient profiling system used in the United Kingdom to identify healthy foods that can be advertised to children on television.
To quantify cereal company marketing practices, we evaluated television advertising, marketing on the internet (including cereal company websites and advertising on other websites), and in-store marketing (including shelf space allocation, point-of-sale programs, and product packaging). These forms of marketing represent 97.5% of cereal companies’ total youth marketing budgets. We utilized a variety of data sources and methods. To document young people’s exposure to advertising for individual brands, we licensed syndicated media research data, including television ratings data from The Nielsen Company and comScore Media Metrix and Ad Metrix data to measure website and internet advertising exposure. To quantify in-store marketing practices, we commissioned an audit of a
nationally representative sample of supermarkets across the United States. We supplement these exposure data with content analyses to examine the messages presented in television advertisements, child-targeted websites, banner advertising on youth-oriented websites, and cereal packages.
Cereal FACTS presents a comprehensive and independent science-based evaluation of cereal company marketing to children and adolescents in 2008 through early 2009: the period prior to and immediately following full implementation of cereal company CFBAI pledges.
Nutrition quality In spite of their pledges to reduce unhealthy marketing to children, the large cereal companies continue to target children with their least healthy products. Child cereals contain 85% more sugar, 65% less fiber and 60% more sodium when compared to adult cereals. In fact, not one cereal that is marketed directly to children in the United States would be allowed to advertise to children on television in the United Kingdom. Only one, Cascadian Farm Clifford Crunch, would be eligible to be included in cereals offered through the USDA Women, Infants and Children (WIC) program. In addition, 42% contain potentially harmful artificial food dyes.
All companies do have more nutritious cereals in their portfolios, but these cereals are marketed only to adults. Even the more nutritious cereals promoted for child consumption (e.g., Kellogg Mini-Wheats, General Mills Kix and Quaker Life) are marketed to parents, not to children. In contrast, the majority of child and family cereals offered by the smaller companies (e.g., Kashi Mighty Bites, Barbara’s Bakery Puffins and Annie’s Bunnies) have significantly less sugar, more fiber and no food dyes. Clearly, children will eat these more nutritious options.
We also found that stated efforts by the larger cereal companies to improve the nutrition quality of their children’s cereals have been inadequate. Although they have reformulated approximately two-thirds of their child and family products, these improvements have been minimal; in most cases, the equivalent of reducing sugar content from 3 ½ tsp to 3 tsp per serving. New cereal introductions and cereal brand extensions may provide a better indicator of companies’ commitment to improve the nutrition quality of their product lines; however, these efforts again disappoint. Nutrition scores for new products introduced within the past two years indicate that the major cereal companies have not attempted to improve the nutrition quality of their product portfolio and thus expect to continue the status quo going forward.
Executive Summary

Cereal FACTS vii
Advertising spending and television advertising Cereal companies spent $156 million in 2008 to promote child cereals in the media. General Mills and Kellogg dominate cereal advertising to children, spending 94% of this total on just 11 brands. According to first quarter 2009 numbers, total media spending for child and family cereal brands in 2009 is on track to remain consistent with 2008 spending. In contrast, Quaker spent less than $200,000 on its only child brand: Cap’n Crunch.
It appears that the CFBAI has not reduced the amount of cereal advertising to children on television. The average child in the U.S. continues to view 1.6 ads on television every day for products with cereal companies’ poorest quality nutrient profile. According to first quarter 2009 numbers, some companies may have even increased their television advertising targeted to children. In addition, children see over five times as many of these ads as compared to adults; therefore, much of this exposure occurs when parents are not watching. Finally, children’s cereal advertisements have little to do with food; cereals are typically represented as toys or play-things, playmates in exciting adventures, and even magical entities. The main purpose of child cereal ads appears to be to associate these poor quality products with positive emotional experiences, including having fun, being cool and winning acceptance by peers.
This analysis also presents disturbing news about exposure to cereal advertising by very young children. Although General Mills and Kellogg have pledged that they will not advertise to preschoolers directly, the average 2- to 5-year-old viewed more than 500 television ads for child cereals in 2008, and 89% of them were from General Mills and Kellogg. These children have no cognitive abilities to defend against advertising messages; therefore, advertising to them is inherently unfair and potentially harmful given the nutritional quality of the products promoted.
Finally, General Mills has by far the most child-targeted cereal advertising; they are responsible for almost 60% of all cereal advertisements seen by children. The products advertised most extensively (Cinnamon Toast Crunch, Honey Nut Cheerios, Lucky Charms, Cocoa Puffs and Trix) are all on their list of “better-for-you” foods that can be advertised to children; however, these products are all significantly “worse-for-you” than other cereals in the General Mills portfolio. Kellogg and Post also advertise their own least nutritious products directly to children. Compared to General Mills, however, they promote fewer products and invest less advertising per brand. Kellogg also advertises its lower sugar children’s cereals (Rice Krispies and Frosted Mini-Wheats) to parents (instead of children) directly. Only Quaker has discontinued advertising directly to children on television.
Internet marketing The majority of brands that advertise directly to children on television also maintain an extensive child-targeted marketing presence on the internet. Millsberry.com and Postopia.com are among the largest youth-targeted websites on the internet with content devoted to promoting their child brands. On Millsberry.com alone, an average of 767,000 young people spend 66 minutes per month on the site interacting with branded content for child cereals, including Trix, Lucky Charms and Honey Nut Cheerios. Postopia,com, Post’s website that prominently features marketing for Fruity and Cocoa Pebbles and Honeycomb cereals, is also visited by 265,000 young people who spend more than 30 minutes on the site each month. Smaller child-targeted websites for Apple Jacks, Froot Loops, Reese’s Puffs, Corn Pops, Frosted Flakes and Cookie Crisp also attract up to 80,000 young people each month with entertaining branded content. Only three websites (FrostedMiniWheats.com, Cheerios.com and Chex.com) included child-targeted web pages that did not promote cereals with high sugar content. However, these pages were contained within an adult-targeted website and did not generate enough visitors to measure.
The highly engaging and entertaining content that appears in these child-targeted cereal websites explains their popularity. Virtually all pages within the sites promote at least one child brand; therefore, they serve as powerful marketing devices. As found in television advertising, these sites represent cereal products primarily as a toy or plaything and attempt to associate the unhealthy products featured with fun and, in some cases, good health. Only one site (General Mills’ Choosebreakfast.com) provided accurate health or nutrition information to children.
General Mills and Kellogg also use banner advertising on third party websites extensively to direct children to their own child-targeted websites. These banner ads are highly-engaging promotional devices designed to grab children’s attention. Even when children do not click through to the cereal website, banner ads provide another form of brand advertising to increase affinity and desire for the advertised cereals. Almost three-quarters of these banner ads appeared on only four web publishers’ sites: Gorilla Nation Kids (including Millsberry.com), Viacom (including Nick.com and Neopets.com), CartoonNetwork.com and Disney.com.
Reliable outside data sources are not yet available to track social media marketing; however, our survey of cereal presence on Facebook and MySpace demonstrates considerable viral marketing activity for many of these brands in social media. Company-sponsored fan pages on Facebook for Froot Loops, Frosted Flakes, Lucky Charms and Cocoa Puffs all have more than 10,000 fans each.
Executive Summary

Cereal FACTS viii
In-store marketingThese data also confirm that the large cereal companies place considerable resources behind in-store marketing and packaging to drive purchase of their child and family cereals. Child and family cereals comprise approximately one-half of the shelf space in the cereal aisle; but they are more likely to be stocked on the prime middle shelf and are disproportionately marketed with special in-store displays and promotions. In addition, the cereal box is crowded with child engagement and health messages to attract the attention of both children and parents. An average box of cereal from one of the large companies contains 1.4 child engagement and 2.0 health messages.
The in-store marketing analysis also reveals significant differences in marketing strategies of the major cereal companies. Whereas General Mills spends a disproportionate amount on advertising its child and family brands on television and has developed a significant child-targeted presence on the internet, Kellogg stands out in the supermarket with the greatest number of special displays and promotions. All four large cereal companies use child engagement messages extensively (averaging between 1.2 and 2.0 per box). Notably, General Mills also appears to speak to parents directly on their boxes, with an average of 3.2 health messages per box, including on their least nutritious child brands. Kellogg includes more promotions on its cereal boxes and Post highlights its gaming website most extensively.
Cereal FACTS IndexThe cereal FACTS Index score combines nutrition quality and marketing exposure to assign one overall score for each child and family brand. Of the 43 child and family brands in our analysis, 24 had no advertising spending and low supermarket presence during the period we examined, therefore, we could not assign a marketing score to these brands. Of the 19 brands that were marketed during the time period of this study, only Kellogg Mini-Wheats received a healthy nutrition rating, therefore, it is the only brand to receive a high combined score.
The FACTS Index clearly highlights the 10 worst offenders. These brands all market extensively to children and parents, and all have low nutrition scores. The six worst brands belong to General Mills: Lucky Charms, Cinnamon Toast Crunch, Honey Nut Cheerios, Trix, Reeses’s Puffs and Cocoa Puffs. Post follows with their Fruity and Cocoa Pebbles brand. Finally, Kellogg Frosted Flakes, Corn Pops and Froot Loops complete the worst offenders list. As demonstrated throughout this report, these cereals with the lowest nutrition quality market directly to children in high volumes on television, the internet and in the supermarket.
ConclusionsWe found that cereal companies are in full compliance with their self-defined CFBAI pledges to reduce unhealthy marketing to children. And yet, we also found that that the amount of cereal marketing to children and the nutrition quality of children’s cereals remain at unacceptable levels and have not objectively or meaningfully improved. This finding is unfortunate as RTE cereals have the potential to provide a convenient, economical and nutritious breakfast option for children. All the cereal companies already have healthier products that could be marketed to children.
Rather than promote their best products, however, the large cereal companies have instead chosen to aggressively market only their least nutritious products directly to children. Even children as young as two- to five-years-old are exposed to marketing messages for these cereals daily on television. Children are also exposed to substantial amounts of child-targeted marketing on the internet and in the supermarket, and much of the marketing on television and the internet occurs without parents’ awareness. Most of these cereals contain high levels of sugar, and many contain artificial food dyes; the healthier cereals, quite literally, pale in comparison. In addition, with their implicit messages that these foods are fun and appropriate options for breakfast, the substantial marketing that cereal companies direct to children makes parents’ efforts to encourage a healthy diet even more difficult.
RecommendationsBased on these findings, current food industry self-regulation does not protect young people from the unhealthy influence of cereal marketing and much stronger action is needed. First and foremost, cereals marketed to children must meet objective nutrition standards that have children’s health as the aim. Foods marketed to children must be more, not less, nutritious than foods marketed to adults; and the standards should be established by the government and nutrition experts with no ties to the food companies.
In addition, the definition of children’s advertising must incorporate all types of marketing to which children are exposed, including television advertising that appears in prime-time or other programming that is not viewed primarily by children, but does have large child audiences. Similarly, children are exposed to numerous forms of marketing that are not covered by current CFBAI pledges, notably promotions, in-store marketing and product packaging, that represent 29% of cereal company marketing expenditures. Without limits on all forms of marketing, it is conceivable that even complete bans on food advertising to children, as defined by the CFBAI, could be offset by increased promotion at the point-of-sale or other unregulated types of marketing.
Executive Summary

Cereal FACTS ix
A significant risk for the public health community and government is that regulations that dictate changes in industry practices will not improve diet or could even worsen it. This can happen if industry complies with specific regulations, but continues to find new, perhaps even more effective, ways to market their products. We believe that a performance-based approach to industry regulation that mandates outcomes (e.g., reduced consumption of sugar-
sweetened cereals by young people) should be taken seriously. Given marketers’ skill in developing new and creative practices to sell their products, one can argue that this approach is the only way to generate real reductions in the harm to children’s health caused by food marketing. If the food industry wants to be a true partner in the fight against childhood obesity, food companies must also accept responsibility for the results of their actions.
Executive Summary

Cereal FACTS 10
In 2006 the Institute of Medicine (IOM) released a report on children’s food marketing beginning with two words, “Marketing works.”1 Also in 2006, the World Health Organization (WHO) issued a report, noting that “…exposure to the commercial promo-tion of energy-dense, micronutrient-poor foods and beverages can adversely affect children's nu-tritional status.”2
Both the IOM and WHO reports noted the dire state of children’s food marketing and called for sweeping changes, but left open the possibility that food companies might be persuaded by good will, public pressure, or the threat of government regulation to change marketing practices. This sentiment is captured in the title of the IOM report, Food Marketing to Children and Youth: Threat or Opportunity?
Much has transpired since the release of the WHO and IOM reports. There have been many more research papers on food marketing,3-7 reviews,8, 9 and reports calling for change;10-13 concerns with rising prevalence of childhood obesity have intensified, alarms have been raised about marketing in developing countries,14, 15 and the food industry has engaged in a number of self-regulatory actions.16 The question is whether appreciable changes have occurred and whether the current marketing landscape protects children from harm.
Aims and contextIn 2008, the Rudd Center for Food Policy and Obesity at Yale University received a grant from the Robert Wood Johnson Foundation to study the amount and impact of food marketing directed at children and youth. The goal was to highlight both helpful and harmful industry practices by conducting objective, science-based evaluation of the marketing and nutrition footprint for specific companies and food products. Ready-to-eat (RTE) cereals are the first food category to be evaluated.
The following Cereal FACTS report quantifies the nutrient qualities of cereals marketed and not marketed to children and the full array of marketing practices used to promote these cereals to children and their parents. This information is synthesized into a FACTS Index that presents an overall nutrition and marketing score by brand and company.
The Index provides a means to evaluate current marketing practices and offers a metric against which future changes can be monitored. This analysis is the most extensive of its type ever undertaken. We incorporate the same media measurement data used by advertisers to quantify exposure to television and internet marketing; utilize additional quantitative studies to measure nutrition quality and in-store marketing practices; and conduct content analyses
to evaluate the messages presented in television, internet and on-package marketing. We also present data on differential exposure by age and racial group. The objective is to provide a transparent, science-based evaluation of the amount and content of cereal marketing to which children and adolescents are exposed.
There are many potential interested parties. Our aim is to be sensitive to each while placing the health and well being of children at the forefront. Food, advertising, and media companies are heavily invested in these issues, but so are the public health community, parents, and of course children. In fact, every citizen has a stake because of the public costs of diseases related to poor diet. The health care costs for just obesity are estimated at $147 billion annually,17 half of which are paid for by public funds through Medicare and Medicaid. To the extent poor diet compromises health, the promotion of unhealthy foods will be related to the quality of the nation’s workforce, how students learn in schools, and even the number of eligible military recruits.
Why cereals?Children are exposed to marketing for a great variety of foods, but cereals hold a special place:
■ Cereal companies spend more money than any other packaged food category in marketing their products to children ($229 million in 2006).18 Therefore, understanding the nutrition quality and marketing practices of cereal products is crucial.
■ Earlier research from 2006 and 2007 demonstrated that cereals marketed to children are less healthy overall and have higher sugar content than those marketed to adults.19
■ Children’s exposure to cereal advertising on television also exceeds that for any other category and represents 25% of all food and beverage advertising seen by children.20, 21
■ Cereal companies disproportionately advertise to children; children see twice as many television ads for cereals compared to adults.22
■ Cereal companies sponsor large advergaming websites targeted to children and cereal ads appear frequently on children’s websites.23 Internet marketing has been studied far less extensively than television, but health advocates raise concerns about the significant amount of time young people spend interacting with advertising content online.24, 25
■ In 2007, three of the four major cereal companies pledged to reduce marketing of less healthy cereals to children, offering an opportunity to examine the impact of industry self-regulation.
Introduction

Cereal FACTS 11
Food industry self-regulatory pledgesAn important objective of this work is to provide information that might help evaluate the impact of industry self-regulation. Coinciding with declining public trust and a growing body of research questioning industry practices, food and beverage companies have responded as industries typically do by launching a series of highly publicized self-regulatory actions.26 It is essential to know whether industry pledges have been kept and if they have, whether any benefit to public health has occurred.
Several industry pledges pertain to children’s marketing and to food labeling:
■ A 2006 agreement by the beverage industry to market and sell fewer sugar-sweetened beverages in schools.27 This agreement was brokered by the Alliance for a Healthier Generation, a partnership between the Clinton Foundation and the American Heart Association, and the American Beverage Association.
■ The 2007 Children’s Food and Beverage Advertising Initiative (CFBAI) brokered by the Council of Better Business Bureaus, which as of October 1, 2009, involved 15 major companies (Burger King, Cadbury Adams, Campbell Soup, Coca-Cola, ConAgra Foods, General Mills, Hershey, Kellogg, Kraft, Mars, McDonald’s, PepsiCo, Nestlé USA, Dannon, and Unilever USA).28 The companies have agreed to market only “better-for-you” foods in media aimed at young children.
■ An agreement made by Disney in 2006 and by Nickelodeon in 2007 to discontinue the use of their names and characters on unhealthy foods.29, 30
■ The 2009 Smart Choices program in which a group of companies pledged to use a uniform symbol on products to designate healthier choices.31
For the purposes of this report, the CFBAI is most important. The 15 signatory companies pledged to “shift the mix of advertising messages directed to children under 12 to encourage healthier dietary choices and lifestyles.” Of the large cereal companies, General Mills, Kellogg, and PepsiCo (owner of Quaker) had made pledges as of October 1, 2009, but Post (purchased by Ralcorp in 2008) had not. All pledges were scheduled to be fully implemented by January 1, 2009. The commitment is for 100% of advertising in measured media primarily directed to children under 12 to be for “better-for-you foods.”32 The companies also agreed to feature only “better-for-you” products on company-owned websites directed to children under 12 and in conjunction with licensed characters.
In the case of cereals, “better-for-you” criteria are nearly identical to those established through the Smart Choices program and are shown in Table 1.
Several potentially important loopholes exist in these industry pledges. First is that industry sets the nutrition criteria that it agrees to abide by. Lax criteria would permit most or all products to receive the “better-for-you” designation. Second
Ingredient Company Criteria What it means
Sugar GeneralMillsandKellogg ≤12gperserving This“limit”permitsupto43%sugarcontentina 28gserving
Pepsico(Quaker) ≤25%addedkcal Effectively,PepsiCodoesnothaveasugarlimit “Unlesstheproduct oncereals contains10%DVoffiber ormeetsothercriteria”
Calories GeneralMillsandKellogg ≤175-200kcalperserving Nearlyallcerealsfallunderthiscalorie
requirement
PepsiCo None
Fat GeneralMills ≤3gperserving Nearlyallcerealshavelessthan1%fatcontent
Kellogg Nolimit
PepsiCo 30%kcal
Sodium GeneralMillsandKellogg ≤230mg Allowsupto820mgper100gofproduct (fora28gserving)
PepsiCo ≤480mg Allowsupto1700mgper100gofproduct(fora 28gserving)
PositiveNutrients GeneralMills Allrequirepositivenutrients, Nearlyallcerealsqualifybecausetheyare Kellogg functionalbenefitsorpositive fortifiedwithvitaminsandmineralsand/or
PepsiCo foodgroups(i.e.,vitamins containsmallamountsoffiberorprotein
andminerals,fiber,protein, fruits,vegetablesorlow-fat dairy)
Table 1. CFBAI “better-for-you” criteria for cereals
Introduction

Cereal FACTS 12
is the definition of children’s media. The industry defines advertising directed to children under 12 as programming where children are a majority of the audience. Only half of the food advertising that children see occurs on programming where children comprise half the audience or greater, so programs with vast numbers of youth viewers (e.g., American Idol) are not affected.33
Industry self-regulatory pledges are likely to play a major role in children's nutrition in the future. The extent of their positive or negative impact must be tested if the United States and other countries are to form judgments about whether industry actions are sufficient or whether intervention by legislators and regulatory agencies will be necessary.
On creating a transparent, open, and objective processThe data presented in our report and the algorithm upon which our Index is based are described in complete detail. The components of the report and Index are based on available science, the types of marketing data currently available, and strategic studies aimed at filling important gaps in information. The scope of the report and information to be collected were developed through detailed reviews of the literature and multiple discussions with experts in the field. A consultant meeting and a number of phone conferences were held with nutrition, marketing, and public health experts who serve on an advisory committee for this project.
We recognize that marketing methods are evolving at an unprecedented rate. What was once advertising only on Saturday morning cartoon television is now all-day children’s programming and an exploding array of marketing practices based on advances in digital technology. Grave concerns have been raised about privacy, whether even adults fully understand when marketing is occurring, whether developmental vulnerabilities of children are being exploited, and whether parents can truly monitor what their children see.34, 35 There is real risk that research on any technology may have limited value because the technology it examines will yield to another by the time the research is complete. It is important, therefore, to develop a means of testing total marketing exposure, a means flexible enough to accommodate new methods of marketing as they emerge.
No piece of scientific work is perfect, especially in its first iteration, and our Cereal FACTS report and Index are no exceptions. We have learned a great deal from previous work on complex rating systems, particularly the Environmental Performance Index pioneered by Esty and colleagues.36, 37 It is simply not possible to quantify the full universe of each and every type of marketing and to evaluate them for their impact on children. We approach Cereal FACTS recognizing that new data will become available and that any rating
system must be updated regularly. Therefore, feedback from interested parties will be invaluable in making the information and index as valid and accurate as possible. We invite feedback and plan to convene stakeholder meetings to solicit input on maximizing the value of the index.
The report and IndexIn this report, we make a fundamental distinction between brands marketed directly to children (i.e., child brands); those marketed to parents and adults as appropriate to feed to their children and/or families (i.e., family brands); and those marketed to adults only for adult consumption (i.e., adult brands). We begin with the assumption that products and messages used to market foods to children and adolescents must be held to a higher standard than those marketed to parents and adults. Numerous studies confirm that children do not have the cognitive capacity to understand that marketing presents a potentially biased point of view until age seven or eight years, and that they do not automatically access their knowledge about marketing biases until age 14 years.38,
39 Adolescents are also highly susceptible to influence from food marketing as their capabilities to control their impulses and forgo short-term rewards for long-term benefits are still developing.40 In addition, marketing can play an influential role as adolescents establish their own individual identity.41, 42 We also examine evidence of marketing that disproportionately reaches African American and Hispanic youth. These populations face some of the highest risks of obesity and obesity-related diseases and therefore the nutritional quality of foods targeted to these groups warrants close attention.43, 44
We first evaluate the nutrition quality of 277 RTE cereals offered by 13 companies in the United States, and compare the quality of child, family and adult brands. We then present data on all advertising spending and volume of television and internet advertising, focusing on child and family brands. These data include advertising spending and television ratings data from The Nielsen Company (Nielsen) and internet data from comScore. Through these syndicated sources, we document young people’s exposure to advertising for individual brands, including differential exposure by age and racial group. We supplement this exposure data with content analyses of television ads, child-targeted websites, and banner ads on other youth-oriented websites, as well as a survey of cereal presence in social media, to evaluate the messages and techniques commonly used to market cereals to children. To quantify in-store marketing practices for child, family and adult brands, we present results from an audit of a nationally representative sample of supermarkets that documents shelf space allocation and placement and special displays and promotions by brand and company, as well as a content analysis of marketing messages on cereal packaging. Finally, we consolidate these data into a Cereal FACTS Index
Introduction

Cereal FACTS 13
Introduction
to quantify and compare the overall nutrition quality and marketing practices for brands and companies that promote their cereals to children and parents.
The remainder of the report is organized into three sections: 1) Methods details the data sources, procedures and calculations used to collect and analyze the data; 2) Results
presents the detailed findings from each of these analyses; and 3) Discussion presents overall conclusions, implications and recommendations for further improvements to cereal products and marketing practices. We provide further information on cereal nutrition and marketing practices by brand on our interactive website: www.cerealfacts.org.

Cereal FACTS 14
OverviewWe utilized a variety of data sources and methods to provide the most comprehensive analysis possible of the ready-to-eat cereal market in the United States. Through publicly available data, we thoroughly document and evaluate common marketing practices used to promote the majority of widely-available cereal products, including television advertising, company websites, internet advertising on third party websites, social media, product packaging and shelf space allocation and promotions in the supermarket.
Methods include analyzing the nutrition quality of cereal products; purchasing media exposure and spending data from syndicated sources (i.e., The Nielsen Company [Nielsen] and comScore); commissioning an audit of cereal distribution and promotion in supermarkets across the country; and conducting content analyses of television advertisements, child-targeted company websites, internet banner advertising, and product packaging. We augment these analyses with information searches on company websites, monitoring the business and consumer press, and numerous visits to the supermarket. Finally, we combine the available data to calculate the Cereal Food Advertising to Children and Teens Score (FACTS) Index. The FACTS Index provides an overall evaluation of the quality and quantity of cereal marketing by brand. These methods are described in detail in the following sections.
We did not have access to food industry proprietary documents, including privately-commissioned market research, media or marketing plans or other strategic documents; therefore, we do not attempt to interpret the cereal companies’ goals or objectives for their marketing practices. Rather, we provide comprehensive and transparent documentation of a) the nutrition quality of cereal products; b) the extent of children’s and adolescents’ exposure to cereal marketing, in numerous forms; and c) the content of the marketing messages. We also evaluate the products and marketing practices targeted to young people as compared to those targeted to adults and compare the products and marketing practices of different cereal companies and brands.
Scope of the analysis
To obtain a full list of ready-to-eat (RTE) cereal products to include in our analysis, we first compiled a list of all products stocked in the cereal and natural food aisles of a large, local supermarket, as well as products listed on websites for the large cereal companies and a list of cereals obtained from The Nielsen Company (Industry Classification Code = F122). We then excluded any hot cereals (e.g., oatmeal or Cream of Wheat), any products targeted to small specialized segments of the population (e.g., baby cereals or diabetic products), and any cereal branded products that are not traditional RTE cereals (e.g., Kellogg cereal straws or any
type of cereal bar). We also excluded generic cereals, such as store brands or Malt-o-Meal cereals, from the analysis.
The data reflect cereal product formulations as of May 31, 2009 and the marketing practices used to promote cereals from January 1, 2008 through May 31, 2009. Specific time frames examined for each type of data are described in the methods sections. We chose this time frame to assess nutrition and marketing practices following implementation of food industry pledges to improve product nutrition and advertising targeted to children in connection with the Children's Food and Beverage Advertising Initiative.1 All pledges were scheduled to be implemented during 2008 with full implementation by January 1, 2009.2 Cereal products and marketing practices continue to evolve; therefore, the information presented in this report does not include new products or product reformulations, website redesigns, new advertising campaigns or other marketing programs introduced after May 31, 2009.
To simplify data analysis, we utilized several criteria to categorize cereals. We first assigned a company and brand designation to each cereal:
■ Company refers to the company that is listed on the package (e.g., General Mills or Kellogg). In most cases, the company listed on the package is the same as the cereal brand’s parent company, with a few exceptions. In 2008, Ralcorp acquired Post Cereals from Kraft Foods; these cereals are listed under the Post company. In addition, Quaker cereals is a division of PepsiCo, Kellogg Company owns Kashi and General Mills owns Cascadian Farm. Packaging for these cereals includes few or no mentions of the parent company; therefore, we categorize them as separate companies.
■ Brand references the marketing unit for each cereal. For most cereals, the brand is clear from the name of the cereal (e.g., Berry Berry Kix, Honey Kix and Kix are all different versions of the Kix brand). In some cases, however, marketing practices differed significantly between products with the same brand name. In those instances, marketing practices determined the brand designation. For example, Honey Nut Cheerios markets extensively to children directly, but other types of Cheerios are marketed exclusively to adults. Therefore, we designated Honey Nut Cheerios and Cheerios (excluding Honey Nut) as two separate brands. In other instances, the names of the cereals differ somewhat, but they are marketed under the same campaign (e.g., Rice Krispies and Cocoa Krispies). In those cases, we assigned the cereals to one brand (i.e., Rice and Cocoa Krispies).
■ Cereal identifies the specific variety of the cereal. In cases where one variety of the cereal has the same name as the brand (e.g., the Lucky Charms brand includes both Lucky Charms and Lucky Charms Chocolate), we identify the
Methods

Cereal FACTS 15
cereal as Lucky Charms (regular) and the brand as Lucky Charms.
We also categorized the brands as either child, family or adult brands according to the marketing practices we documented: ■ Child brands include any brands for which we found
marketing that spoke directly to children. To determine this classification, we first examined the brand’s television advertising. If children were exposed to significantly more advertisements for the brand than were adults and/or the advertising message appealed specifically to children, the brand was designated as a child-targeted brand. If the brand did not advertise on television during our analysis period, we examined the product website to determine whether it was designed only for children to access on their own (i.e., not together with their parents). Finally, any products that included a popular children’s licensed character or celebrity in the name of the cereal were designated as child-targeted cereals (e.g., Clifford Crunch or Hannah Montana cereal).
■ Family brands include any brands for which we found any marketing mention that indicated the brand was appropriate to serve to children, excluding those identified as child brands. In a few cases, television advertising for these brands addressed parents directly with reasons to feed the product to their children (e.g., Kellogg’s Rice Krispies and Frosted Mini-Wheats). For most products, however, wording on the company website or child features on the packaging (e.g., games and puzzles or cartoon characters) provided evidence that child consumption was suggested. We also designated products as family brands if we did not find evidence of child-targeted marketing after January 1, 2008, even if they had been advertised directly to children in the past (e.g., Count Chocula or Mini-Swirlz cereals).
■ Adult brands include all other brands. These products contained no mention in any of their marketing materials to indicate that children should or would want to consume these cereals.
The purpose of this report is to document the products and marketing practices used to promote cereals for child and adolescent consumption. Therefore, although we collected data for all child, family and adult cereals, the analyses focus on nutrition and marketing practices of child and family brands.
Nutrition qualityThe nutrient information from each cereal’s nutrition facts label provided the data to evaluate the nutrition quality of cereals on our list. All nutrient information reflects product formulations as of May 31, 2009. Given that many of these products were reformulated during 2008 to improve their
nutrition quality, our decision to conduct the analysis using more recent nutrition data provides the most positive evaluation of cereal nutrition quality. These data do not, however, reflect cereal reformulations that occurred after May 31, 2009.
We used a number of methods to evaluate cereal nutrition quality. Our primary evaluation tool, the Nutrition Profiling Index (NPI) score, is based on the nutrition rating system established by Rayner and colleagues for the Food Standards Agency in the United Kingdom.3 In addition, we examined the sugar, fiber, saturated fat and sodium content separately to highlight differences between individual nutrients within the NPI score; identified whether the products contain artificial food dyes or artificial sweeteners; and evaluated the cereals according to other established criteria for nutrition quality. Finally, we evaluated cereal companies’ commitment to improve product nutrition by examining changes in the nutrition quality of individual cereals that occurred after 2006, as well as the nutrition quality of new cereals and cereal brand extensions introduced after January 1, 2007. The following describes each of these methods and criteria in more detail.
NPI score
The NPI score is adapted from the Nutrient Profiling model (NP) currently used by the United Kingdom Office of Communications (OFCOM) to identify nutritious foods that are appropriate to advertise to children on television.4 The model has also been approved by Food Standards Australia New Zealand to identify products that are permitted to utilize health claims in their marketing.5 The NP model provides one overall nutrition score for a product based on total calories and proportion of both healthy and unhealthy nutrients and specific food groups or items, including saturated fat, sugar, fiber, protein, sodium, and unprocessed fruit, nut and vegetable content.
The NP model has several advantages over other nutrient profiling systems. The model was developed by nutrition researchers at the University of Oxford independent of food industry funding, its development and scoring method are publicly documented and transparent, and it has been validated to reflect the judgment of professional nutritionists.6 It also produces a continuous score that provides a relative evaluation of products, in contrast to threshold models that simply classify foods as “good” or “bad”. In addition, the model includes only nutrients that are reasonable and well-justified based on existing nutrition science. In particular, the model does not award points for micronutrient fortification thereby discouraging companies from adding vitamins and minerals to inherently unhealthy products as has occurred in some recently introduced products (e.g., Jelly Belly Sport jelly beans with carbs, electrolytes and vitamins B & C, or Diet Coke Plus with niacin, vitamins B6 & B12, zinc and magnesium). Appendix A provides a detailed description of the model design, scoring method, and benefits.
Methods

Cereal FACTS 16
The interpretation of the original scores produced by the NP model are not intuitively obvious to the lay person because the original model is reverse scored (i.e., a higher score indicates a product of worse nutritional quality) and range from +34 to –15. In addition, a score of 3 points or lower identifies healthy foods that are allowed to be advertised to children in the United Kingdom. For the purpose of these analyses, we created an NP Index (NPI) score using the following formula: NPI score = (-2) * NP score + 70. This recalculation produces a score from 0 (poorest nutritional quality) to 100 (highest nutritional quality) that is easier to interpret and compare.
Additional nutrient quality measures
To provide more detailed information about specific healthy and unhealthy nutrients in each cereal, we also calculated the proportion of cereal content from sugar, fiber and fat (i.e., g of the nutrient divided by g per serving) and mg of sodium per 100 g of cereal. These standardized measures allow comparisons between products of differing serving sizes. In addition to these nutrients, we also examined product ingredient lists on the nutrition facts labels to determine whether the cereals contain artificial sweeteners (aspartame, acesulfame potassium, saccharin or sucralose) or artificial food dyes. Although these ingredients are allowed by the FDA, some parents may not wish to feed their children unnecessary chemicals. In addition, research, although not entirely consistent, has shown a relationship between food dyes and hyperactivity in children.7 Consumer pressure in Britain has led several food companies to discontinue the use of food dyes in products there, but this has not yet occurred in the United States. Therefore, we also indicate whether products contain artificial sweeteners or food dyes.
In addition, we evaluated the cereals according to other established nutrition criteria, including WIC guidelines, United Kingdom guidelines for advertising to children and products approved by the Better Business Bureau (BBB) for CFBAI participating companies.
■ Women, Infants and Children (WIC) guidelines. The Food and Nutrition Service of the USDA offers grants to states to provide supplemental foods to low-income pregnant and breastfeeding women, infants and children under age five years.8 Each state establishes its own list of products that can be included in their WIC food package; however, the USDA has determined that all cereals included in the package “must contain ≤ 21.2 g sucrose and other sugars per 100 g dry cereal (≤ 6 g per dry oz)”. This measure indicates whether the cereals in our analysis meet this sugar cut-off and would be eligible to include in states’ WIC package.
■ United Kingdom guidelines for advertising to children. We also identified cereals included in our analysis that
could be advertised to children on television in the United Kingdom.9 OFCOM only allows food products with an NP score of 3 or lower to be advertised on children’s television programs or during programs with a disproportionate number of children under 16 years old. This score translates to an NPI score over 62 according to our revised model.
■ BBB-approved products. Finally, we indicate cereals that CFBAI participants have identified as “better-for-you” foods that meet their nutrition standards and can be included in advertising primarily directed to children under 12 years old in the United States.10 Only products offered by participating companies (i.e., General Mills, Kellogg and Quaker) were evaluated under this criterion.
Changes in nutrition quality
Finally, we evaluated cereal companies’ commitment to improving the nutrition quality of their products with two measures: reformulations of pre-existing cereals and nutrition quality of new cereals and other products introduced under the cereal brands.
■ Cereal reformulations. This measure quantifies changes in nutrition quality for existing cereals. We used information from the nutrition facts label from our previous paper on the nutrition quality of children’s cereals.11 These data were collected in February 2006 and included information on 108 General Mills, Kellogg, Post and Quaker cereals. We then calculated NPI scores for the cereals included in the prior analysis using information from both the 2006 and May 2009 nutrition facts labels. The difference in these scores provides the change in nutrition quality measure: a positive value indicates improvement and a negative value indicates a decline in nutrition quality.
■ New cereal and other cereal-branded product introductions. We used Datamonitor’s Product Launch Analytics database to identify new cereal products introduced in the United States from January 2007 to August 2009.12 We also searched for product introductions under each brand name for all the cereals on our master list, including ready-to-eat cereals and cereal branded extensions (e.g., Kellogg cereal straws). Both new cereals and other types of products introduced under a cereal brand name provide an indicator of the brands’ commitment to improving the nutrition quality of their product line. We identified 126 cereals and 122 cereal brand extensions that were introduced during this period. We then searched company websites and product packaging to collect the nutrition facts labels, and this information was used to calculate the NPI score. Data were not available for 14 new cereals and 20 brand extensions. Powdered drink mixes were also excluded due to difficulties in calculating the nutrition score. We then calculated average new cereal and other cereal-branded products NPI scores for each cereal brand.
Methods

Cereal FACTS 17
Marketing practicesAccording to the Federal Trade Commission report on food marketing to children and adolescents, cereal companies spent 97.5% of their youth marketing budgets in 2006 on television, internet, product packaging and point-of-sale programs.13 Although many food companies also market extensively on radio and in digital media, cereal companies spent very little on those media. Cereal companies do advertise in magazines; however, those efforts are targeted primarily at adults. Therefore, in this analysis, we chose to focus our data collection on television advertising, internet marketing (including company-owned websites, advertising on third party websites, and social media), and point-of-sale marketing (including shelf space allocation and special displays and promotions).
Media advertising To measure cereal company advertising practices in traditional measured media we licensed data from The Nielsen Company (Nielsen) for advertising spending in all measured media and exposure to television advertising by age group and ethnicity, and conducted a content analysis of the messages presented in television advertisements. These data provide a complete picture of cereal company advertising spending and television advertising from January 1, 2008 through March 31, 2009.
Advertising spending and television advertising exposure
Nielsen tracks total media spending in 18 different media including television, radio, magazines, newspaper, free standing insert (FSI) coupons, and outdoor advertising. We licensed these data for all products in our list of RTE cereals for the 15-month period. These data provide a measure of all advertising spending.
To measure exposure to cereal advertising, we licensed gross rating points (GRP) data from Nielsen for the same period and products. GRPs measure the total audience delivered by a brand’s media schedule. It is expressed as a percentage of the population that is exposed to each commercial over a specified period of time across all types of television programming. They are the advertising industry’s standard measure to assess audience exposure to advertising campaigns; and Nielsen is the most widely used source for these data.14 GRPs, therefore, provide an objective outside assessment of advertising exposure. In addition, GRPs can be used to measure advertisements delivered to a specific audience, e.g., specific age and other demographic groups (also known as target rating points or TRPs) and provide a “per capita” measure to examine relative exposure among groups. For example, if a cereal
product had 2000 GRPs in 2008 for 2- to 11-year-olds and 1000 GRPs for 18- to 49-year-olds, then we can conclude that children saw twice as many ads for that brand in 2008 as compared to adults.
The GRP measure differs from the measure used to evaluate food industry compliance with their CFBAI pledges. As discussed, the pledges apply only to advertising in children’s television programming as defined by audience composition (i.e., programs in which 25 to 50% of the audience are under age 12); approximately one-half of all advertisements viewed by children under 12 years old occur during children’s programming.15 In contrast, GRPs measure children’s total exposure to advertising during all types of television programming. Therefore, evaluating GRPs will determine whether participating companies actually reduce television advertising to this age group, or simply shift advertising from children’s television to other types of programming viewed by large numbers of children.
In the television advertising analyses, we first identified GRPs in 2008 and Q1 2009 for the following demographic groups: ages 2-5 years, 6-11 years, 12-17 years, and 18-49 years. These data combine exposure to national (network, cable and syndicated) and local (i.e., spot) television. In addition, we identified GRPs for African American youth (2-17 years) for national television. Nielsen does not provide spot market GRPs for African Americans at the individual level; however, only 2.4% of cereal advertising occurred in spot market television during the period examined.16 Therefore, these data reflect virtually all African American youth exposure to television cereal advertising. Nielsen has only recently begun to report GRPs for Hispanic demographic groups; therefore, we do not present total advertising exposure for Hispanics. As a proxy, we provide GRP data for advertising that occurred on Spanish-language television.
Nielsen calculates GRPs as the sum total of all advertising exposures for all individuals within a demographic group, including multiple exposures for individuals (i.e., gross impressions), divided by the size of the population times 100. For an audience not trained in advertising measurement, GRPs may be difficult to interpret. Therefore, we also use GRP data to calculate the following television advertising measures:
Average advertising exposure. This measure is calculated by dividing total GRPs for a demographic group during a specific time period by 100. It provides a measure of ads viewed by the average individual in that demographic group during the time period measured. For example, if Nielsen reports 2000 GRPs for 2- to 11-year-olds for a specific product in 2008, we can conclude that the average 2- to 11-year-old viewed 200 ads for that product in 2008.
Targeted GRP ratios. As GRPs provide a per capita measure of advertising exposure for specific demographic groups, we also used GRPs to measure relative exposure
Methods

Cereal FACTS 18
to advertising between demographic groups. We report the following targeted GRP ratios:
■ Child to adult targeted ratio = GRPs for 2-11 years/GRPs for 18-49 years
■ Teen to adult targeted ratio = GRPs for 12-17 years/GRPs for 18-49 years
■ African American to all youth ratio = GRPs for African American 2-17 years/GRPs for all 2-17 years. This measure uses only national GRPs.
A targeted ratio greater than 1.0 indicates that the average person in the group of interest (i.e., the child in the child to adult ratio) viewed more advertisements than the average person in the comparison group (i.e., the adult), and a targeted ratio under 1.0 indicates that they viewed fewer ads. For example, a child to adult targeted ratio of 2.0 indicates that children viewed twice as many ads as adults viewed. If this ratio is greater than the relative difference in the amount of television viewed by each group, we can conclude that the advertiser has designed a media plan to reach this specific demographic group more often than would naturally occur.
Television advertising content analysis
We also conducted a content analysis of the messages and other advertising techniques presented in cereal company television advertisements. We utilized the AdScope database from TNS Media Intelligence to obtain digital copies of all cereal advertisements aired on United States television from July 1, 2007 through March 31, 2009.17 This search identified 308 advertisements. We then removed ads for cereals not included in this analysis (e.g., hot cereals or diabetic cereals) and duplicate advertisements. Duplicates included :15 second shortened versions of :30 second ads, as well as ads with the same creative execution but somewhat different endings. This list was cross-referenced with the Nielsen database to identify advertisements that appeared on television from January 1, 2008 to March 31, 2009.
To develop a comprehensive coding manual, we first developed a list of potential items used in prior food advertising content analyses.18-20 Researchers then viewed a sample of the cereal advertisements to identify additional items of interest to include in the coding manual, including advertising techniques, perceived target for the ads, and explicit and implicit product claims and offers. Two coders were trained to review the advertisements and code them for all items in the manual. The project manager and two coders fine-tuned the manual by first coding 10 ads during each of two pre-test sessions. After each session, the coders and project manager met to review the items and coding procedures and identify any areas of confusion or dispute. After making revisions to the initial manual based on these discussions, pilot testing was conducted on a random
sample of 30 advertisements. Cohen’s Kappa was used to measure inter-rater reliability. The coders and project managers then met to discuss items with low reliability and to finalize the coding manual.
The final coding manual included six main categories:
■ Identifying information, including the company, brand and cereal name and tagline.
■ Actors in the ad, including age and ethnicity of human actors, celebrities, animated characters, and cereal as more than food; and perceived target audience (i.e., children, parents or other adults).
■ Explicit promotions, including give-aways and sweepstakes, promotional tie-ins with third parties, and directions to website URLs.
■ Product descriptions, including nutrient content and other information about the product itself (e.g., taste, shape, value, etc.).
■ Product promise, or what the product will do for the consumer. Promises include health and other physical benefits (e.g., mental performance or weight control) and emotional benefits (e.g., fun, cool, family bonding).
■ Eating behaviors, either portrayed or discussed. Behaviors include depictions of other healthy or unhealthy foods, time and place of consumption (if any), and other suggested behaviors (e.g., part of a balanced breakfast or cooking together).
All advertisements were randomly assigned to one of the two coders, with 25% of the ads assigned to both coders for reliability testing. Coding occurred over a five-week period with periodic meetings between the coders and project manager to address questions or difficulties. Cohen’s Kappas were used to measure inter-coder reliability for the overlapping ads. Final inter-coder reliability was good. Kappa values ranged from .55 to 1.00 and the majority of items receiving ratings over .80. There was one outlier of .38 for “cool”; implicit claims such as this were more difficult to agree upon.
Internet marketingWe examined three types of youth-targeted marketing on the internet: company-sponsored websites, banner advertising on other (i.e., third party) websites and social media marketing. We also conducted content analyses of child-targeted websites and banner advertising.
Company-sponsored websites
We began with a list of 26 branded websites generated from all cereals available at a major grocery store chain between October 2008 and March 2009, supplemented with internet searches for any websites sponsored by cereal brands on
Methods

Cereal FACTS 19
our list that did not have a URL listed on the package. For the purposes of this study, a website is defined as all pages containing the same stem URL. For example, Millsberry.com is the website of interest, and Millsberry.com/_____ are secondary pages contained within the site.
We then eliminated all branded sites without any pages designed for young people to access directly. A website was determined not to be youth-oriented if it predominantly had instructions for mothers, contained only recipes, had no games or Flash animation, was generally text-oriented, or a combination of the above. For example, CapnCrunch.com, though colorful, was determined not to be a child-targeted website because it contained messages addressed to parents (e.g. “help your family live a healthy lifestyle,” had product information but no games, no Flash animation, and contained photographs of children with their mothers). It is important to note that Quaker introduced a Cap’n Crunch advergaming website directly targeted to children in April 2009; however, because this website was introduced after the time period of interest, it is not included in this analysis. Websites that included child-targeted pages within a primarily adult website were also included in this analysis.
We obtained data on exposure to these websites from the comScore Media Metrix Key Measures Report.21 comScore maintains the largest existing audience measurement panel and captures the internet behavior of a representative panel of approximately one million users in the United States.22 They collect data at both the household and individual level using Session Assignment Technology, which can identify computer users without requiring them to log in. Companies participating with comScore have beacons placed on their web content and advertisements. As a result, we were able to identify which websites and advertisements individual users were exposed to, and examine exposure for both children and adults in the same household. comScore uses these panel data to extrapolate their findings to the total population. Their Media Metrix database provides internet exposure data by month for any websites visited by at least 30 of their panel members in a given month. If the number of panel visitors is large enough in a given month, comScore also provides an estimate of total unique visitors in the United States, visits per month, minutes spent on the website per visit and pages viewed. In addition, Media Metrix provides exposure information by visitor age and ethnicity for larger volume websites.
We first searched the comScore Media Metrix database to identify the youth-targeted cereal websites for which exposure data were available from January 2008 through March 2009. The volume of visitors was large enough to obtain exposure data for ten of these websites.
For each month during this period, we collected the following data for available cereal websites: total unique visitors, total visits, average minutes per visit, and average visits per
unique visitor. In addition, when the website traffic was high enough in a given month, we also collected these measures separately for children ages 2 to 11 years, 12 to 17 years, 2 to 17 years, and African American youth ages 2 to 17 years. During the period examined, data were not available from comScore for Hispanic visitors. We also collected data for adults ages 18 to 49 years and total unique visitors to the internet overall for each age and demographic group as comparison groups.
For each website in our analysis, we report the following website exposure measures:
■ Average unique visitors per month for 2- to 11-year-olds, 12- to 17-year-olds and African American 2- to 17-year-olds. This measure was calculated by adding total unique visitors reported each month from January 2008 through March 2009 for each demographic group divided by the number of months for which these data were available for each website.
■ Average visits per month23 and average minutes per visit for each unique visitor. Monthly numbers, as reported by comScore, were averaged by the number of months for which data were available for each website. comScore only reports these data for the larger demographic groups. If separate data were not available for the specific demographic group in a given month, we used the information for the next largest demographic group. For example, if data were not available for 2- to 11-year-olds specifically, we report the data for 2- to 17-year-olds or, in a few cases, ages 2+.
■ Targeted visitor ratios were calculated for children versus adults, teens versus adults and African American versus all youth. To determine these ratios, we first calculated percent of internet visitors exposed to the website for each demographic group (ages 2-11 years, 12-17 years, 2-17 years, 18-49 years, and African Americans 2-17 years) for each month. This number was calculated by dividing the number of unique visitors to the website in a given month (for the specific demographic group) by the number of unique visitors to the total internet for the same month and demographic group. The percent of unique visitors was then multiplied by the average number of visits to the website in that month for the demographic group to provide an average number of visits to the website for all internet users in that group. This measure takes into account both the reach of the website to the population of interest and the frequency the specific population visited the website in a given month. This per capita measure of exposure was then used to calculate the targeted visitor ratios.
Child to adult and teen to adult visitor ratios were calculated by summing the monthly average number of visits for children or teens and dividing this number by the sum of the average number of visits for adults.
Methods

Cereal FACTS 20
African American to all youth ratio was calculated by summing the monthly average number of visits for African American 2- to 17-year-olds and dividing this number by the sum of the average number of visits for all youth ages 2 to 17 years.
Website content analysis
During March 2009, we collected all website pages to be coded in this analysis. Each page was recorded as a video if there was movement on the page or the activity on the page required clicking the mouse; if the page was static, it was recorded as a PDF.
We developed a codebook with questions about online marketing techniques based on categories described in previous analyses of children’s websites,24, 25 digital marketing techniques,26 and online advergames.27, 28 We added further questions based on our observations both from a pilot exploration of the websites under study and from two child-oriented websites for different products [FruitGushers.com, Myslurp.com]. Finally, we incorporated questions from the codebook of the television advertisement content analysis.
On each site we coded for content according to a variety of features. We assessed all nutrition and health claims made regarding the branded cereals. Nutrition claims refer to statements about properties of the cereals themselves, such as “has whole grains.” By contrast, health claims directly state health benefits from consuming the product, such as “builds strong bones.” We established whether the cereal was portrayed as more than food, such as being used as an object or piece of equipment in an advergame. We noted all promotions, for both online and offline prizes, as well as any licensed characters, such as the Flintstones, used to promote a cereal.
We further catalogued three types of techniques found only online:
■ Branded engagement techniques are devices that use the online medium to attract and keep visitors on a website. These include content such as online videos or advergames that feature the company logo, spokes-characters (e.g. Tony the Tiger), licensed third-party characters (e.g. the Flintstones), or the product itself.
■ Web engagement techniques refer to engagement devices that keep the user interacting with the page longer, such as the ability to download items or to design a digital alter ego, or avatar.
■ Behavioral targeting techniques refer to any method by which a company collects information about a website user, such as a poll, quiz, or user registration.
Finally, we tracked all advertising identifications, including labels on specific sections of a page marking it as an advertisement or a generic label in the corner of a page
saying that the whole page is an advertisement or may contain advertisements.
Two coders tested the coding instrument on two food websites (MySlurp.com and FruitGushers.com) and refined the instrument to address discrepancies. The two coders then coded two websites included in this study (FrootLoops.com and LuckyCharms.com) and made final changes to the coding instrument to clarify unclear questions. Finally, these coders assessed the content of all websites under consideration. Values for Scott’s pi intercoder reliability statistic for these questions ranged between .80 and 1, confirming reliability among coders.
Advertising on third party websites
Data for exposure to cereal brand advertising on third party websites (i.e., websites sponsored by other companies) were extracted from the comScore Ad Metrix Advertiser Report.29 comScore Ad Metrix monitors the same panel of users as comScore Media Metrix, but additionally tracks any advertisements that are fully loaded onto a user’s web browser. Ad Metrix, therefore, measures individual exposure to banner ads presented in rich media (SWF files) and traditional image based ads (JPEG and GIF files). It does not capture text, video or html-based ads. Ad Metrix also ties the advertisement to the unique user viewing it, the third party website where the advertisement was viewed, and the company sponsoring the advertisement. In addition, Ad Metrix captures copies of the actual ads.
comScore began reporting these data by product category in October 2008; therefore, we were able to obtain information for the six months from October through March 2009. During this time period, Ad Metrix did not report demographic information about the individuals who were exposed to these advertisements; therefore, we cannot differentiate between exposure by any specific age group (including children or adolescents).
comScore’s Cereal and Breakfast Product Dictionary was used to determine the advertisements of interest. For each month, comScore reported data for any cereal product in the dictionary with at least ten raw ad views on the total internet or on a specific publisher site. In addition to these cereal products, we also collected data for Millsberry.com and Postopia.com. Measures available from comScore for each month include total display ad views (i.e., the number of advertisements fully downloaded and viewed on publisher websites), advertising exposed unique visitors (i.e., the number of different individuals exposed to advertisements on a publisher website), and average frequency of ad views by cereal advertiser. This information is available for the total internet and for individual publisher websites.
As we could not separate ads viewed by young people from those viewed by adults, we identified the websites on which the advertising appeared that were disproportionately
Methods

Cereal FACTS 21
targeted to youth (i.e., youth websites). We defined a youth website as a website that met one of two conditions: 1) it was identified by comScore as an entertainment website for youth ages 2 to 17 years during the period examined, or 2) the proportion of visitors ages 2 to 17 years to the website exceeded the total percent of 2- to 17-year-old visitors to the internet in the given month.
We only examined child brands in this analysis as we could not conclusively differentiate between ads viewed by young people versus adults. As these child brands are primarily targeted to children, we assume that advertising on the internet, especially those placed on youth websites, will also be viewed disproportionately by young people. From the comScore data, we calculated the following measures for each child cereal brand for which banner advertising was found:
■ Average monthly unique viewers30 was calculated by taking an average of the monthly unique viewers of a given brand’s advertisements from October 2008 through March 2009.
■ Average number of ads viewed per month was calculated by taking an average of the average frequency of ad views by viewer for the cereal brand each month from October 2008 through March 2009.
■ Percent ad views on youth websites was calculated by dividing the cereal brand’s total display ad views that appeared on youth-targeted websites by their total display ad views that appeared on all websites during the six-month period from October 2008 through March 2009.
Banner advertising content analysis
In addition to measuring the volume of advertisements for child cereals on third party websites, we also conducted a content analysis to examine the messages commonly presented in those ads. These types of ads typically appear as banner advertising in a sidebar or “banner” on a webpage. The purpose of such ads is to increase brand awareness for the advertised product and to direct viewers to the advertiser’s website.
Copies of the most widely viewed banner advertisements identified in the third party advertising exposure analysis were acquired through the comScore Ad Metrix Advertiser Report. The sample included the three most frequently viewed banner advertisements per month for each cereal brand (including Millsberry.com and Postopia,com) from October 2008 through March 2009. A total of 66 banner ads were identified. We then selected the ads for child brands (including Millsberry.com and Postopia.com) and eliminated duplicate ads. Duplicate ads were defined as ads with the same graphics and headline, but that included small variations (e.g., ads that differed only by size or orientation [vertical vs. horizontal bar] or that had the same graphics but slight variations in text).
The television advertising and website coding manuals were adapted to create the coding manual for the banner ads with items that were not relevant to banner advertising removed. The final banner advertising coding manual included the following categories: 1) general information about the company, brand, and target audience; 2) use of cereal as more than food; 3) animated characters; 4) engagement techniques, including Flash animation, video, links to games or games in the ad itself, and behavioral targeting; 5) use of advertising disclaimers; and 6) main point of the ad. The main point of the banner ad was coded as either promotion or giveaway; cereal shape or flavor; game, video or website; or product claim.
The banner ads were randomly assigned to two coders with a 50% overlap to assess inter-rater reliability. Kappa values ranged from .52 to 1.00, which is considered moderate to very good agreement.
Social media marketing
Reliable data to assess the reach of social media marketing is not available as of yet; however, we felt that it was important to survey cereal company activities in this domain. Use of social media, including social networking websites, has become an increasingly viable method of advertising for food companies. The interactive nature of such websites increases consumer engagement with brands, creating an environment conducive to contests, giveaways, and other traditional marketing techniques while providing a space for user-generated content.31
Recent interest in social networking has focused on Twitter, the fastest-growing social networking website as of May 2009, and Facebook, the most widely used global social networking website.32 Twitter, a micro-blogging site, is restricted to 140-word updates, while Facebook allows users to create profiles that include photos, information about the user, and options to post status updates and leave comments and notes for other users. MySpace, which shares many characteristics with Facebook, maintains a significant market share despite losing ground to both Facebook and Twitter. Measuring social media marketing is notoriously difficult; Twitter, Facebook, and MySpace each include means to count the number of people choosing to affiliate themselves with a given product (i.e., fans, friends or members), but these numbers change often as individuals add or remove themselves and as groups or fan pages are added or deleted.
For this analysis, we examined the 43 child and family brands on our list and first searched Facebook and MySpace for each brand (e.g., General Mills Cheerios). Results pertaining to individual cereal varieties (e.g., Strawberry Frosted Mini-Wheats) were not included. Search terms consisted of cereal name (e.g., Life) followed by use of cereal name plus company (e.g., Quaker Life) and cereal name plus the word ‘cereal’ (e.g., Life cereal) when necessary to differentiate from
Methods

Cereal FACTS 22
other uses of the name (e.g. Life the game). Based on the nature of the service, only cereal companies were searched on Twitter, in September 2009. For each cereal brand, details of Facebook fan pages, Facebook groups, MySpace groups, and MySpace profiles were collected during June 2009.
■ Facebook fan pages can be created only by an “authorized representative of the subject of the page” and they may be used to “promote a business or other commercial, political, or charitable organization or endeavor (including non-profit organizations, political campaigns, bands, and celebrities)”33 Facebook fan pages for cereals, therefore, must be established by a representative of the cereal company and are likely designed for marketing purposes. For each brand, we recorded the number of Facebook fan pages and the number of fans of each page.
■ MySpace profiles were searched and those with a name that was readily identifiable as a cereal (e.g.,. “Cocoa Puffs” or “Cocoapuffs”) and a recognizable image of the cereal as a profile picture were identified. MySpace profiles may be established by any member, but are often used to promote bands, products, etc. A subset of product-focused profiles was identified. These profiles contained content that focused on the product in question, either presented as “written” by an anthropomorphized cereal or cereal mascot, or by focusing on a liking or craving for the cereal. Results for each brand were recorded until all profiles had been examined or 20 profiles were identified.
■ Facebook groups and MySpace groups can be created by any individual with a specific interest. Although the majority of cereal groups were not likely established by a cereal company, they do provide an indicator of interest in the product and a source of viral marketing. For these groups, the founding member can select whether the group will be open for any member to join or limit membership to a pre-determined group (i.e. by invitation from the group’s administrator only). Only open groups and English-language groups were included in these data. We first recorded the total number of search results for each cereal, and then identified the name and number of members for groups that clearly referred in some way to the cereal (e.g. “Waffle Crisp addicts” or “We love the Kellogg’s Raisin Bran Crunch commercials”) until all groups were examined up to a maximum of 20.
■ Finally, we searched Twitter for cereal company names to identify companies with a Twitter presence. Cereal company websites were also examined for links or mentions of company presence on Twitter. We included users who self-identified as being associated with the company and who had tweeted at least once.
In-store marketingTo examine marketing practices in the supermarket, we commissioned an audit of shelf space allocation and in-store promotions in a large nationally representative sample of supermarkets in the United States. In addition, we conducted inventories of marketing on cereal packages in a large local supermarket at three different times.
Supermarket audit
The supermarket audit was conducted in two parts. The first part measured the allocation of shelf space in the cereal aisle(s) of a nationally representative sample of 400 supermarkets. A series of follow-up audits conducted in a smaller group of stores for four consecutive weeks examined additional displays and promotions for cereals. These analyses provide a comprehensive picture of the cereal selection in supermarket chains across the country. In addition, they quantify the amount and types of in-store marketing for all cereals so as to better understand cereal marketing within the supermarket environment.
A market research firm was hired to oversee and conduct in-person audits of RTE cereals in supermarkets across the country. The research firm specializes in retail research conducted through a nationwide network of trained, experienced field personnel in major metropolitan areas. They maintain a comprehensive quality control program to ensure the collection of accurate data, which includes data checking, calculation checks and store rechecks when necessary. A nationally representative sample of 400 stores located in 18 metropolitan areas was included in the main audit. The markets were Baltimore, Boston, Chicago, Cleveland, Dallas, Detroit, Kansas City, Los Angeles, Miami, Orlando, Philadelphia, Phoenix, Pittsburgh, San Francisco, Seattle and St. Louis. The sample included stores from large supermarkets and grocery store chains within each market, as well as Wal-Mart because of its sizeable volume of grocery product sales. Excluded from the sample were other mass merchandisers (besides Wal-Mart) and convenience and drug stores. The primary audit was conducted during the week of May 18, 2009 between Monday and Friday (week 1). During the following four weeks (weeks 2 to 5), from May 25 to June 15, 2009, one weekly promotional check was conducted in 87 supermarkets in the same 18 metropolitan areas between Monday and Wednesday. This smaller group of stores was condensed from the original audit sample by selecting one store per chain within each market.
Field personnel in each market received detailed instructions and a comprehensive survey instrument to conduct the store audits. The audit instrument tracked 277 RTE cereals, including all known brands and flavors for the major cereal manufacturers (General Mills, Kellogg, Post, Quaker, Kashi and Cascadian Farm) as well as children’s natural cereals
Methods

Cereal FACTS 23
(e.g., Annie’s and EnviroKidz). Store and generic variations of popular brands were also tracked.
In the primary audit (week 1), field personnel first indicated whether the cereal was stocked in the primary cereal aisle or in a separate location in the store (e.g., the natural foods aisle). For all these cereals, coders then recorded both the shelf or shelves on which the cereal was located (top, middle, bottom) and the number of shelf facings. A facing was defined as any package front pointing toward the customer, including those boxes physically touching the shelf as well as any stacked on top. For example, if one cereal was displayed three boxes across and two boxes high, it was recorded as six facings (i.e., the fronts of six boxes were seen). Boxes stacked behind the front cereal package were not counted. If the top, bottom or side panels of the package were facing the customer they were not counted. The packages did not have to be at the front of the shelf in order to be counted and prepackaged cereal (i.e. value packs with multiple boxes) were counted as one facing.
In the promotional audits (weeks 2 to 5), the field reps documented any additional cereal displays and promotional materials that were present anywhere within the store. Additional cereal displays were classified as being either 1) in-aisle display, 2) end-cap display or 3) any other cereal display. An in-aisle display was defined as a free-standing manufacturer or case display located within an aisle; in-aisle displays usually contain a limited amount of the product. An end-cap display is structurally similar to an in-aisle display but is located at either end of an aisle. Any displays located elsewhere, such as at the store entrance or exit, were coded as an “other” cereal display.
Promotional materials for cereals found in the store were placed into one of four groups: 1) shelf coupon machines placed within the aisle that dispense manufacturer coupons, 2) special price signage in the aisle that display sale prices or special bargains; these can be either store or manufacturer generated, 3) shelf danglers in the aisle: signs that hang from a shelf calling the shopper’s attention to a particular item, or 4) any other in-store promotional material, including promotional materials that did not fit into the first three categories, such as a floor graphic or an advertisement on a shopping cart. The first three types of promotions are the shelf point-of-purchase materials used most commonly by the cereal category in supermarkets (POPAI 2001).34
Product packaging analysis
We also conducted a comprehensive audit of marketing messages presented on cereal packaging. For this analysis, researchers surveyed the main cereal and natural food aisles of a large suburban supermarket on three separate visits in September and December 2008 and March 2009. A team of four to five investigators conducted each of the audits.
Researchers recorded information for each different package for each cereal. If a cereal had more than one package design, data for each package were coded separately. Packages that differed in size, but displayed the same images and messages on the package were counted as a single box. A detailed product inventory instrument was used to record all items of interest that appeared on each package.
Investigators examined each unique cereal box and first recorded general information including cereal name, aisle and shelf, and then inspected the package for marketing features in three categories: child engagement messages, health messages and URLs.
■ Child engagement messages included messages designed to attract a child’s attention and/or encourage them to interact with the product. These include promotions and other child features.
A promotion was defined as any mention or tie-in to any character, personality, group, or product separate from the cereal company. Investigators recorded a short description of the promotion and noted the promotion type and partner for all promotions found anywhere on the package. Promotion types were categorized as one of the following: giveaways of free or discounted items; licensed characters present on the packaging; celebrity endorsements, either direct or indirect; or other types, which included sweepstakes or donations to charities. Promotion partners (i.e., the group, company, or product being promoted on the cereal box) were categorized as one of the following: commercial television, public television, movie, toy, video or computer game, sports, charity, music, other entertainment, and other general partners (most often diet websites).
Child features were defined as features designed to appeal directly to children, including games or child-targeted activities, such as puzzles, mazes, or other interactive illustrations; and brand characters, including any generally-recognizable characters intrinsically tied to the identity of the brand.
■ Health messages. Due to the large number of health and ingredient claims on cereal boxes, we recorded only those that were on the front of the box and readable or recognizable at arm’s length (i.e., those that might reasonably draw the consumer’s attention). We divided health and ingredient claims and labels into two types.
Ingredient claims reference the product’s macro- or micronutrients, including whole grain, fats, sugars, vitamins/minerals, calcium, and fiber, as well as mentions of “natural,” “organic,” or “no additives or preservatives”. Specific ingredients listed within a separately recorded health label (e.g. “nutrition highlights” panels on General Mills or Kellogg’s cereals) were not counted in this category.
Methods

Cereal FACTS 24
Health claims describe the product’s health outcome benefits, overall healthfulness, or role in a healthy lifestyle (e.g. “lower your cholesterol,” “heart healthy”). Health claims include functional benefits related to certain ingredients (i.e., health claims regulated by the FDA) and unregulated claims that suggest health benefits.
■ Researchers recorded all URLs (website addresses) found on the package, excluding only those found on the nutrition panel itself (these tend to be in very small typeface). URLs sponsored by the cereal company were categorized according to the information and features of their website: general URLs direct users to the company’s or brand’s main website; health URLs specifically highlight health information about the company’s cereals; fun/games URLs offer games or entertainment for consumers (primarily children); and other URLs that did not fit into any of the previous categories. URLs belonging to promotion partners were recorded separately.
Cereal FACTS IndexThe Cereal FACTS Index synthesizes the nutrition and marketing exposure information presented in this report to provide one overall score for each child and family brand. The score provides a means to evaluate and compare current marketing practices and a metric against which future changes can be monitored. Appendix B provides a more detailed description of the data and calculations used to compute the final Index. Figure 1 provides a pictorial depiction of this process.
Index components
The Index is computed by multiplying the nutrition multiplier with the marketing exposure for the brand.
■ The nutrition multiplier measures the positive or negative overall nutrition quality of the brand. This number is
Figure 1: Calculating the Cereal FACTS index
Nutrition Multiplier Marketing Exposure Cereal FACTS IndexX =
In-Store Exposure
(15%)
Adult and Other Media
Exposure (15%)
Youth Marketing Exposure
(70%)
Age and Race Multipliers
Nutrition Profiling Index (NPI) Score
Supermarket Shelf Space Allocation
Adult Television Exposure
Cereal Websites for Children
Television Advertising
Advertising on Third Party Websites
Advertising Spending on Other
Media
COMPONENTS
MEASURES
ChIld ANd AdOlESCENT ExPOSURE
Methods

Cereal FACTS 25
derived from the NPI score. Brands with an overall healthy nutrition profile (i.e., over 62) receive a positive multiplier, whereas brands with an overall unhealthy nutrition profile (i.e., under 62) receive a negative multiplier. When multiplied by the marketing exposure score, brands with a positive overall score are contributing positively to young people’s nutrition environment, whereas brands with a negative score contribute negatively to the environment.
The marketing exposure score includes three components:
■ In-store exposure measures the amount of shelf space allocated to each cereal brand in the supermarket. In-store exposure influences parents’ decision to buy a cereal brand directly, as well as by attracting children’s attention and triggering them to “pester” parents to buy the product. As this exposure occurs on a weekly, as opposed to daily basis for media exposure, we have weighted in-store marketing as 15% of the marketing exposure score.
■ Adult and other media exposure measures the amount of marketing to which parents are exposed on television and in other media (including magazines and radio). Marketing affects adults, as well as children, and likely has a significant influence on the cereals that parents choose to serve their children; however, adults are better able to defend against marketing influence than children and adolescents. Therefore, we have weighted adult exposure as 15% of the marketing score.
■ Youth marketing exposure measures the amount of marketing to which children and adolescents are exposed on television, cereal company websites for children, and cereal advertising on third party websites. We posit that young people’s exposure to marketing messages in the media has the most direct effect on their attitudes and desire to consume cereal brands; therefore, this component contributes 70% of the marketing score.
Nutrition and marketing score measures
The following describes each of the measures that contribute to the nutrition and marketing scores.
■ The nutrition multiplier is derived from the NPI score for the brand. If a brand has more than one cereal, the brand NPI score is a weighted average (according to % of shelf facings in the supermarket) of all cereals in the brand. Using the NPI cut-off for foods that can be advertised to children on television in the United Kingdom as the threshold for “healthy” foods, any score over 62 contributes positively to the Index and any score under 62 contributes negatively (a score of 62 is neutral). The positive or negative nutrition multiplier is computed by subtracting 62 from the NPI score. Therefore, a product with a good NPI score (e.g., 85) will receive a positive nutrition score (+23), whereas a product with a poor NPI score (e.g., 35) will receive a negative nutrition score (-27).
■ Supermarket shelf space allocation, is the percent of facings in the cereal aisle(s) allocated to each brand according to our supermarket audit. This number provides the in-store exposure measure.
Adult and other media exposure includes two measures: adult television exposure and advertising spending on other media.
■ Adult television exposure is measured by total GRPs for adults, ages 18 to 49 years, for national (i.e., network, cable and syndicated programming) and local (i.e., spot) television for each brand from January 1, 2008 through March 31, 2009. Television advertising comprised 90% of advertising spending for cereal brands;35 therefore, adult television exposure contributes 90% of the adult exposure measure. These data were licensed from Nielsen.
■ Advertising spending on other media includes spending in non-television media, including magazines, radio, newspaper, FSI coupons and outdoor advertising by brand from January 1, 2008 through March 31, 2009. Other advertising spending contributes 10% of the adult exposure measure. Data were licensed from Nielsen.
■ These two measures were standardized and then weighted (90% for television exposure and 10% for other advertising spending) to produce the adult and other media exposure measure.
Youth marketing exposure includes measures of child and adolescent exposure to television, cereal company websites and advertising on third party websites.
■ Television advertising exposure is measured by total GRPs for national and spot television for each brand from January 1, 2008 through March 31, 2009. GRPs were licensed from Nielsen for each of the following age and demographic groups: ages 2 to 5 years, ages 6 to 11 years, and ages 12 to 17 years (national and local programming); African American ages 2 to 17 years (national programming); and ages 2 to 17 on Spanish-language programming.
■ Cereal website exposure. To provide a comparable measure to television exposure, we calculated a GRP-equivalent for website exposure using comScore Media Metrix Key Reports data. Separate GRP equivalents were calculated for children (ages 2-11 years), adolescents (ages 12-17 years) and African American youth (ages 2-17 years). As nearly all pages on cereal websites contain branded content that exposes visitors to involving advertising messages, we assumed that 30 seconds spent on a cereal website was equivalent to exposure to one :30 second television ad. For example, if a visitor spent 15 minutes on a website, we assumed that visit was equivalent to viewing 30 television ads. Data were collected for exposure from January 1, 2008 through March 31, 2009. Appendix B provides a detailed
Methods

Cereal FACTS 26
description of the calculation used to compute GRP equivalents for website exposure.
■ Banner advertising exposure. We also computed a GRP-equivalent measure for banner ads that appeared on third party websites using comScore Ad Metrix Advertiser Report data. As exposure information was not available for individual demographic groups, this number includes one total exposure number for ads for child cereals that appeared on youth websites. In addition, banner advertising data were available only for the 6-month period from October 2008 through March 2009. Appendix B provides a detailed description of the calculation used to compute GRP equivalents for banner ad exposure.
■ Age and race/ethnicity multipliers. We then applied age and racial and ethnic multipliers to the exposure numbers for children and African American and Hispanic youth to adjust for their increased risk from unhealthy advertising influence.
❯ Preschool-age child exposure (i.e., 2- to 5-year-olds, available only for television advertising) was multiplied by 5. Children this age do not have the cognitive ability to understand the persuasive intent of advertising, therefore advertising seen by this age group is inherently harmful.36, 37
❯ Child exposure (ages 6-11 for television and ages 2-11 for website exposure) was multiplied by 2. Children this age do not have the ability to automatically access information about the persuasive intent of advertising when viewing the ads and, therefore, require additional protection from unhealthy influence.38
❯ Specific exposure for African American youth (ages 2-17 years) and exposure by youth (ages 2-17 years) on Spanish-language television were also included as separate items in the final score, in effect, doubling the exposure for these more at-risk populations.
■ The final youth marketing exposure component was calculated as follows:
TV ad exposure: (5*(GRPs 2-6 years) + 2*(GRPs 2-11 years) + (GRPs 12-17 years) + (GRPs African American 2-17 years) + (GRPs Spanish-language 2-17 years)
+ Website exposure: (2*(GRP-equiv. 2-11 years) + (GRP-equiv. 12-17 years) + (GRP-equiv. African American 2-17 years)
+ Banner ad exposure: (GRP-equiv. for ads viewed on youth websites)
Combining the components
To combine the three marketing score components, we first standardized the results for the individual components and then calculated a weighted average according to the assigned component weightings. We then multiplied the positive or negative nutrition multiplier by the combined marketing exposure score to produce an overall nutrition and marketing score. Finally, we distributed the resulting scores from 0 (worst overall combined nutrition/marketing score) to 100 (best overall score) to produce the final score. For a complete description of all the calculations, please refer to Appendix B.
Methods

Cereal FACTS 27
Results
The following analysis includes data for 13 companies, 115 brands and 277 cereals, excluding data for store or other generic brands. General Mills had 25 brands, followed by Kellogg with 24 and Post with 12. These three companies comprise 53% of all brands and 61% of all cereals examined. Barbara’s Bakery, Cascadian Farm (owned by General Mills), Kashi (owned by Kellogg), Nature’s Path and Quaker also had five or more cereal brands each. We also included several companies with only one or two brands each that were stocked in more than 5% of supermarkets: Annie’s, Newman’s Own, Peace Cereal, Uncle Sam and Weetabix. Finally, we included Dorset cereals and Nestle in our analysis, although they were stocked in 4% or fewer supermarkets.1 Appendix C provides the complete list of companies, brands and cereals examined.
We identified 19 brands marketed directly to children (i.e., child brands) and 27 family brands (see Table 2). General Mills promotes the most child and family brands, followed by Kellogg and Post. Cascadian Farm, Quaker, Nature’s Path, Kashi, Barbara’s Bakery, and Annie’s also offered at least one child and/or family brand each. The majority of cereals (58%) were marketed only to adults for adult consumption.
Most child brands were classified as such because they were advertised directly to children on television in 2008; however, two additional brands qualified for their child-targeted websites (Nature’s Path EnviroKidz Organic and Quaker Cap’n Crunch) and four brands because of licensed characters or child celebrities in their names (General Mills Dora the Explorer, Kellogg Disney High School Musical and Hannah Montana cereals, and Cascadian Farm Clifford Crunch).
Only two family brands qualified as family brands due to television advertising directed toward parents (Kellogg Rice or Cocoa Krispies and Mini-Wheats). The remaining qualified because their adult-targeted websites suggested that the cereal is for family or child consumption or due to children’s features on the product package (e.g., puzzles, games or cartoon characters). Several of the family cereals had been marketed directly to children prior to 2008 (e.g., General
Mills Boo Berry and Count Chocula or Kellogg Honey Smacks and Smorz); however, we found no evidence of more recent child-directed marketing and therefore classified them as family cereals.
Table 2. Child and Family Brands
Definitions Cereal market
Company Companynameindicatedonthecerealpackage,includingcompaniesordivisionsownedbya separateparentcompany(e.g.,QuakerandKashiarelistedasseparatecompanies).
Brand Marketingunitforafamilyofcereals(e.g.,CocoaPuffs(regular)andCocoaPuffsCombosbelong totheCocoaPuffsbrand).
Cereal Individualcerealorvariety(e.g.,CocoaPuffs(regular)andCocoaPuffsCombosarelistedas separatecereals).
Childbrand Abrandthatismarketeddirectlytochildren.
Familybrand Abrandthatisnotmarketeddirectlytochildren,butissuggestedforchildorfamilyconsumptionin anymarketingmaterials,includingtelevision,websitesand/orproductpackaging.
AdultBrand Abrandthatisonlymarketedtoadultsforadultconsumptionand/orcontainsnomarketing referencestochildorfamilyconsumption.
Company Child brands Family brands
GeneralMills CinnamonToastCrunch BooBerry*CocoaPuffs Cheerios(excludingCookieCrisp HoneyNut)DoratheExplorer ChexHoneyNutCheerios CountChoculaLuckyCharms FrankenBerry*Reese’sPuffs GoldenGrahamsTrix Kaboom* Kix
Kellogg AppleJacks CookieCrunchCornPops HoneySmacksDisneyHighSchool Mini-Swirlz
Musical Mini-WheatsFrootLoops RiceorCocoaFrostedFlakes KrispiesHannahMontana Smorz
Post Honeycomb AlphaBitsFruityorCocoaPebbles GoldenCrisp RaisinBran WaffleCrisp
Cascadian CliffordCrunch CinnamonCrunchFarm HoneyNutO’s
PurelyO’s
Quaker Cap’nCrunch Life
Nature’sPath EnviroKidzOrganic
Kashi HoneySunshine MightyBites
Barbara’sBakery OrganicWildPuffs Puffins
Annie’s Bunnies
*Brandsstockedinfewerthan5%ofstoresthatwerenotadvertisedafterJanuary1,2008.Theseproductsmaybediscontinuedorofferedseasonally.
Overview of cereal market

Cereal FACTS 28
Using information on the nutrition facts label, we calculated the NPI score for all cereals on our list. In the following nutrition analysis, we excluded any cereals stocked in fewer than 5% of supermarket shelves to eliminate those that are likely to be discontinued or stocked seasonally. In addition, we do not report fat content as the majority of cereals contain less than 1 g per serving. Appendix C provides detailed nutrition information for all cereals in our inventory.
The nutrition quality of cereals varied widely, from a very good NPI score of 82 (Kellogg Unfrosted Mini-Wheats and Post Original Shredded Wheat) to a very low 30 (Kellogg Chocolate Peanut Butter Corn Pops and Quaker Cap’n Crunch with Crunch Berries). Unfortunately, as found in prior research,3, 4 the nutrition quality of children’s cereals continues to be significantly worse than other cereals (see Table 3). This analysis expands on prior studies and demonstrates that the nutrition quality of cereals marketed directly to children (i.e., child cereals) is also significantly worse than those marketed to parents to serve to their children (i.e., family cereals).
The lower overall nutrition score for child cereals is largely due to added sugar. The sugar content of cereals marketed directly to children averages 35% and ranges from 20% to 53%. In contrast, the average adult cereal contains only 20% added sugar. Child cereals also have higher sodium and lower fiber content than adult cereals. In fact, most cereals marketed directly to children contain little or no fiber: 5% of total content, on average, or less than 1.5 g per 28 g serving. The average 28 g serving of child-targeted cereal, therefore,
contains the equivalent of 2 ½ tsp of added sugar and the fiber equivalent of less than ½ a banana.
The nutrition quality of family cereals falls between that of child and adult cereals: family cereals score significantly worse on overall nutrition and contain more sugar, less fiber and more sodium as compared to adult cereals. These cereals are, however, significantly more nutritious than the cereals marketed directly to children. Therefore, cereal companies market their least nutritious cereals directly to children, whereas healthier cereals that they have determined to be appropriate for child consumption are marketed to parents. Unfortunately, the most nutritious cereals are promoted only for adult consumption.
According to other criteria, cereals marketed to children also compare unfavorably to family and adult cereals (see Figure 2). Only 8% of child cereals meet the sugar limit to be
Definitions Cereal nutrition quality
NutritionProfiling AmeasureofoverallnutritionqualitythattakesintoaccountbothpositiveandnegativenutrientsinIndex(NPI)score foods.Scoresrangefrom0(verypoor)to100(excellent).Thisscoringsystemisbasedonasystem developedbyresearchersintheUnitedKingdomforuseintheOfficeofCommunication’s(OFCOM) guidelinestoprohibitjunkfoodadvertisingtochildren.
Women,Infantsand GuidelinesestablishedbytheUSDAtospecifyproductsthatindividualstatesmayincludeintheirChildren(WIC) supplementalfoodpackagesformothers,infantsandchildrenunder5years.2WIC-approvedguidelines cerealsmustcontainnomorethan22.1%oftotalweightinsugar.
UnitedKingdom TheUnitedKingdomallowstelevisionadvertisingtochildrenonlyforfoodproductswithanNPI scoreover62.Inadvertisingguidelinesthisreport,weusethiscriteriontodefinehealthycerealsas thosewithanNPIscoreover62.
BetterBusinessBureau CriteriaestablishedbyindividualcompanieswhoparticipateintheChildren’sFoodandBeverage Advertising(BBB)approvedproductsInitiative(CFBAI)todesignate“better-for-you”productsthat theycanadvertisetochildrenunder12yearsold.
Fooddyes Syntheticdyescommonlyaddedtofoodproducts.Thesetypesofdyesmaybelinkedto hyperactivityinchildren.
Cerealreformulation RevisionsmadetothenutritioncontentofexistingcerealsafterFebruary1,2006.
Cerealproduct NewcerealproductsintroducedafterJanuary1,2007.introductions
Cerealbrandextensions NewproductsintroducedafterJanuary1,2007thatcontainthenameofacerealbrandonanother typeoffoodproduct(e.g.,cerealstrawsorsnackbars).
Table 3. Nutrition content of child, family and adult cereals
NPIscore Sugar Fiber Sodium content content (mgper 100g)
Child 42b,c 35%b,c 5.1%c 553c
Family 50a,c 25%a,c 7.1%c 509c
Adult 58a,b 20%a,b 10.6%a,b 348a,b
aSignificantlydifferentfromchildcerealsbSignificantlydifferentfromfamilycerealscSignificantlydifferentfromadultcereals
Cereal nutrition quality
Results

Cereal FACTS 29
eligible for the WIC program, not one would be allowed on children’s television advertising in the United Kingdom, and 42% contain food dyes. In spite of their poor nutrition quality, 79% of child cereals and 35% of family cereals offered by companies who participate in the CFBAI are included on companies’ list of better-for-you foods that can be advertised to children.5 In fact, these companies’ better-for-you cereals had significantly more sugar (33% vs. 28%) as compared to their other products that are not approved for advertising to children, t(119) = 4.0, p < .001; and significantly less fiber (4.9% vs. 5.8%), t(119) = 2.4, p = .02.
Figure 2. Additional nutrition criteria for child, family and adult cereals
*Includes only cereals from CFBAI participants as of May 31, 2009 (General Mills, Kellogg and Quaker)
Nutrition quality by company and brandRanking Table 1 ranks all child and family brands by average brand NPI score. Only three child brands rated in the ten best for nutrition quality: Kellogg Hannah Montana, Cascadian Farm Clifford Crunch and Nature’s Path EnviroKidz Organic cereals. Interestingly, two of these cereals have licensing agreements with entertainment companies. In contrast, child cereals comprise 8 of the 10 worst cereals, with General Mills Reese’s Puffs at the bottom. The two family cereals in the bottom 10 (General Mills Golden Grahams and Kellogg Smorz) had been marketed to children directly in the past, but they have not been advertised since 2007.
Child and family brands from the smaller companies (i.e., Annie’s, Barbara’s Bakery, Cascadian Farm, Kashi and Nature’s Path) have the best overall nutrition quality (see Table 4). Their cereals contain 22% sugar and 9% fiber, on average, and no food dyes. Kellogg, General Mills and Quaker also offer at least one more nutritious product among their child and family cereals. For example, Kellogg offers the only child or family cereal that would be allowed to be advertised to children in the United Kingdom (Mini-Wheats).
Unfortunately, five out of nine varieties of Mini-Wheats also contain food dyes and artificial sweeteners that are not captured in the NPI score. In addition, one-quarter of General Mills’ child and family cereals do meet the WIC guidelines (i.e., some varieties of Cheerios, Chex and Kix); as well as two of three Quaker Life cereals. Post cereals also contain more fiber as compared to the other large cereal company brands.
Unfortunately, as discussed earlier, these healthier cereals are marketed primarily to parents, not to children. In fact, of the 41 cereals we examined that are included on the lists of “better-for-you foods” that can be marketed to children (from General Mills, Kellogg and Quaker)6, 76% had a low NPI score under 50, and over one-third scored under 40 (see Table 5). As discussed earlier, only Kellogg Mini-Wheats cereals scored over 62 and would be allowed to be marketed to children in the United Kingdom. Kellogg cereals are more likely to be approved to be marketed to children under the CFBAI, but this is likely due to a different marketing strategy. General Mills and Quaker only include cereals on their “better-for-you list” that are marketed directly to children, whereas Kellogg includes cereals marketed both to children and parents.
Improvements in nutrition qualityThis analysis reflects improvements in nutrition quality due to product reformulations implemented as part of companies’ CFBAI pledges to market healthier choices to children.7 Since 2006 (and prior to May 31, 2009), 57% of child cereals and 65% of family cereals offered by the four largest cereal companies have been reformulated. Unfortunately, these reformulations improved the overall nutrition quality of all companies’ existing cereals by only 2 to 5% (see Figures 3 and 4). Improvements resulted primarily from reducing added sugar from 13-15 g per serving to 12 g (i.e., the added sugar limit established by most CFBAI participants). In effect, added sugar in one serving of most child cereals went from 3 ½ tsp to 3 tsp. We did find some more positive developments in reformulations of a few individual cereals. For example, the overall nutrition quality of Quaker Cap’n Crunch improved by 18% and Post Fruity and Cocoa Pebbles improved by 14%, the result of additional fiber content.
BBB Approved*
ContainFood Dyes
Meet UnitedKingdom Child
AdvertisingGuidelines
Meet WICSugar Limit
0% 20% 40% 60% 80% 100%
■Adult Brands
■Family Brands
■Child Brands
Table 4. Nutrition quality comparison of child and family cereals by company
NPI Sugar Fiber Sodium score content content (mgper 100g)
GeneralMills 44 29% 5.6% 645
Kellogg 49 32% 5.1% 401
Post 43 35% 7.8% 538
Quaker 44 32% 5.0% 602
Othercompanies 52 22% 9.3% 525
Results

Cereal FACTS 30
We also reviewed 112 new cereals and 102 brand extensions for 48 different cereal brands. It may be difficult for cereal companies to reformulate existing products to improve their nutrition quality without alienating loyal customers who are satisfied with the taste and nutrition of the cereals they buy. Cereal companies do not have those constraints, however, when they introduce new cereals and cereal-branded product extensions. Therefore, these new product introductions may provide a better indicator of companies’ commitment to improve the nutrition quality of their overall product lines.
New cereals and cereal-branded product extensions introduced after January 1, 2007 did show greater
improvement in nutrition quality from 2006, as compared to reformulations. Overall nutrition scores for newly introduced child and family cereals, as well as those of child brand product extensions, improved by 16 to 20% over average NPI scores for child and family cereals in 2006. The nutrition quality of product extensions for family brands, however, declined by 20%.
Further examination of differences by company in the nutrition quality of new product introductions, however, indicates that the improvement in overall nutrition for new cereals and cereal-branded products was due almost exclusively to new products introduced by smaller cereal companies (see Figure 4). New child and family cereals introduced
NPI Score Kellogg General Mills Quaker
Over62 Mini-Wheats:Unfrosted/bitesize Mini-Wheats:Frosted/bigbite Mini-Wheats:Frosted/bitesize Mini-Wheats:FrostedBlueberryMuffin Mini-Wheats:FrostedCinnamonStreusel Mini-Wheats:FrostedStrawberryDelight Mini-Wheats:LittleBites/HoneyNut
50-62 Mini-Wheats:LittleBites/Chocolate RiceKrispiesJumboMulti-Grain HannahMontana
40-49 FrostedFlakesGold HoneyNutCheerios Cap’nCrunch FrostedFlakes/ReducedSugar CocoaPuffsCombos DisneyHighSchoolMusical CookieCrisp(Regular) Eggo:MapleSyrup Mini-Swirlz RiceKrispies(Regular) FrootLoops/ReducedSugar FrostedFlakes(Regular) AppleJacks(Regular) CookieCrunch CocoaKrispies(Regular) RiceKrispiesStrawberries
Under40 FrootLoopsFruityGoldenBars CocoaPuffs(Regular) Cap’nCrunchCrunchBerries FrootLoops(Regular) Trix FrootLoopsSmoothie CinnamonToastCrunch(Regular) FrootLoopsStarberries BerryLuckyCharms RiceKrispiesTreats LuckyCharms(Regular) CornPops(Regular) ChocolateLuckyCharms RiceKrispiesFrosted Reese’sPuffs
Table 5. Nutrition scores for cereals approved as better-for-you under the CFBAI
Results
Figure 3. Nutrition quality improvements for child, family and adult cereals
*Cereals included in the 2006 analysis (N=108)
Figure 4. Nutrition quality improvements for child and family cereals by company
Child Brands
NPI S
core
Family Brands Adult Brands20
30
40
50
60
55
45
35
25 NPI S
core
GeneralMills
Kellogg Post Quaker OtherCompanies
20
30
25
40
50
60
55
45
35
■2006 Nutrition*■2009 Nutrition*■New Cereal Introductions■Cereal Brand Extensions

Cereal FACTS 31
by General Mills, Kellogg and Post are of poorer nutritional quality than their existing cereals, and brand extensions by General Mills and Kellogg are considerably worse.
Nutrition quality overviewThese findings are very disappointing. In spite of pledges by cereal companies to reduce marketing of unhealthy products to children, they all continue to target children with their most unhealthy products. In fact, not one cereal that is marketed directly to children would be allowed in advertising to children on television in the United Kingdom, and only one, Cascadian Farm Clifford Crunch, is eligible to be included in cereals offered through the WIC program. Sugar is a primary ingredient in most cereals marketed directly to children and 42% also contain potentially harmful food dyes. All companies do have much healthier cereals in their product portfolios, but these cereals are marketed only to adults. Even their more nutritious children’s cereals (e.g., Kellogg Frosted Mini-Wheats, General Mills Kix and Quaker Life) are marketed to parents, not to children. In addition, the majority of child and family cereals offered by the smaller companies (e.g., Kashi Mighty Bites, Barbara’s Bakery Puffins and Annie’s Bunnies) have significantly less sugar, more fiber and no food dyes; obviously children will eat these more nutritious options.
Stated efforts by the larger cereal companies to improve the nutrition quality of their children’s cereals have also been inadequate. Although they have reformulated the majority of child and family products, these improvements have been minimal; in most cases, the equivalent of reducing sugar content from 3 ½ tsp to 3 tsp per serving. New cereal introductions and cereal brand extensions may provide a better indicator of companies’ commitment to improve the nutrition quality of their product lines; however, these efforts again disappoint. Nutrition scores for new products introduced within the past two years indicate that the major cereal companies have not attempted to improve the nutrition quality of their product portfolio and thus expect to continue the status quo going forward.
Cereal marketing practicesAlthough cereal companies continue to target children with their least nutritious products, the marketing landscape could improve if they reduced the amount of marketing they direct to children for these unhealthy products and/or conveyed the message in their advertising that these unhealthy foods are a special treat that should only be consumed occasionally. Therefore, to understand the scope and potential impact of recent cereal company marketing practices, we examined young people’s exposure to different forms of marketing as well as the content of the messages presented in that marketing. Appendix D summarizes the marketing data we collected for each cereal and brand.
In the following discussion of cereal company marketing practices, we first present total advertising spending in measured media and then provide detailed analyses of cereal marketing on television, the internet and in the supermarket. We present differences between marketing practices for child, family and adult brands, as well as differences by company. We also describe specific marketing practices used to promote child and family brands.
Media advertising
Advertising spending
A total of 53 cereal brands advertised in any measured medium during the 15-month period from January 2008 through March 2009. Across all media, companies spent $628.5 million in 2008 to advertise cereal products and $143.7 million during the first quarter of 2009 (see Table 6).8 Cereal companies spent approximately one-half (53%) of their advertising budgets on child and family brands combined (25% on child brands and 28% on family brands).9 In addition, they spent over $50 million on company-level advertising during this period to promote all their cereals (e.g., General Mills ads for “Big G” cereals).
Both General Mills and Kellogg spent on average $26 million to advertise each of its child and family brands (see Table 7). With the most brands in its portfolio, General Mills spent over $260 million during the period examined, and Kellogg spent $160 million. Post and Quaker spent significantly less overall on their two brands, but they also spent 75% less per brand as compared to General Mills and Kellogg. Of
Results
Advertised AdvertisingSpending: brands 2008($000) Q12009($000)
Child 15 $156,267 $38,811
Family 7 $168,738 $45,985
Adult 31 $255,024 $54,702
Company-level 7 $48,528 $3,977
©TheNielsenCompany
Table 6. Total advertising spending for child, family and adult brands and companies
Definitions Advertising spending
Advertisingspending Amountspentonallmeasured media,includingtelevision, magazines,radio,newspapers, freestandinginsertcouponsand outdooradvertising.Datawere licensedfromTheNielsen Company.

Cereal FACTS 32
the smaller cereal companies, only Barbara’s Bakery and Nature’s Path advertised their family brands. Their spending represented less than 0.5% of the total in 2008, and they did not advertise in the first quarter of 2009.
As Table 7 shows advertising spending in first quarter 2009 indicates that cereal companies are on track to spend a similar amount on their child brands in 2009 ($155.2 million) compared to 2008, somewhat more on their family brands ($183.9 million annualized), and slightly less on their adult brands ($218.8 million annualized). In addition, according to first quarter numbers, Kellogg appears to be increasing advertising spending by 21% in 2009 ($137.0 million annualized); whereas General Mills may be decreasing spending slightly ($188.2 million). Quaker spending has decreased significantly (to an annualized $1.9 million, a decline of 90%) and Post spending in 2009 remains level with 2008 ($9,884).
Ranking Table 2 presents advertising spending for each child and family cereal brand. The top three brands (General Mills
Honey Nut Cheerios and Cheerios (Excluding Honey Nut) and Kellogg Mini-Wheats) spent $229 million, or more than half of all advertising spending during the period examined. General Mills spent more to market only one child brand (Honey Nut Cheerios) than Kellogg spent on all of its child brands combined. In contrast, Kellogg spent relatively more on its family brands, including $60 million on Mini-Wheats and $38 million on Rice and Cocoa Krispies. Other child cereals with spending over $10 million include Kellogg Frosted Flakes and Corn Pops and General Mills Cinnamon Toast Crunch and Lucky Charms.
Overall then, General Mills and Kellogg dominate cereal advertising in measured media with 93% of all advertising spending to promote child and family cereals. Not only do these two companies promote more brands, they also spend more per brand than others. According to first quarter 2009 numbers, total media spending for child and family cereal brands in 2009 is on track to remain consistent with 2008 spending.
Results
Spending Advertisingspending perbrand
Advertised 2008 Q12009 brands ($000) ($000) ($000)
GeneralMills 10 $189,358 $47,063 $26.2
Kellogg 6 $113,685 $34,253 $26.5
Post 2 $9,758 $2,471 $6.6
Quaker 2 $11,548 $467 $6.3
Othercompanies 2 $655 $541 $1.1
©TheNielsenCompany
Table 7. Total advertising spending for child and family brands by company (excluding company-level advertising)
Definitions Television advertising exposure
GrossRatingPoints Measureofthepercapitanumberoftelevisionadvertisementsviewedbyaspecificdemographic(GRPs) groupoveraperiodoftimeacrossalltypesofprogramming.GRPsdividedby100provide thenumberofadsviewedbytheaverageindividualinthedemographicgroupfortheperiod examined.GRPsforspecificdemographicgroupsarealsoknownastargetratingpoints(TRPs). DatawerelicensedfromTheNielsenCompany.
Averageadvertising GRPsdividedby100.Providesameasureofthenumberofadsviewedbytheaverageindividualexposure duringthetimeperiodmeasured.
Spanish-language TelevisionprogrammingpresentedinSpanish(e.g.,UnivisionorTelemundo).television
Targetedratio: GRPsfor2-to11-year-oldsdividedbyGRPsfor18-to49-year-olds.ProvidesameasureofrelativeChildrentoadults exposureofchildrentoadults.
Targetedratio: GRPsfor12-to17-year-oldsdividedbyGRPsfor18-to49-year-olds.ProvidesameasureofrelativeTeenstoadults exposureofteenstoadults.
Targetedratio: GRPsforAfricanAmerican2-to17-year-oldsdividedbyGRPsforall2-to17-year-olds.ProvidesaAfricanAmericantoall measureofrelativeexposureofAfricanAmericantoallyouth.2-to17-year-olds
Television advertising exposure
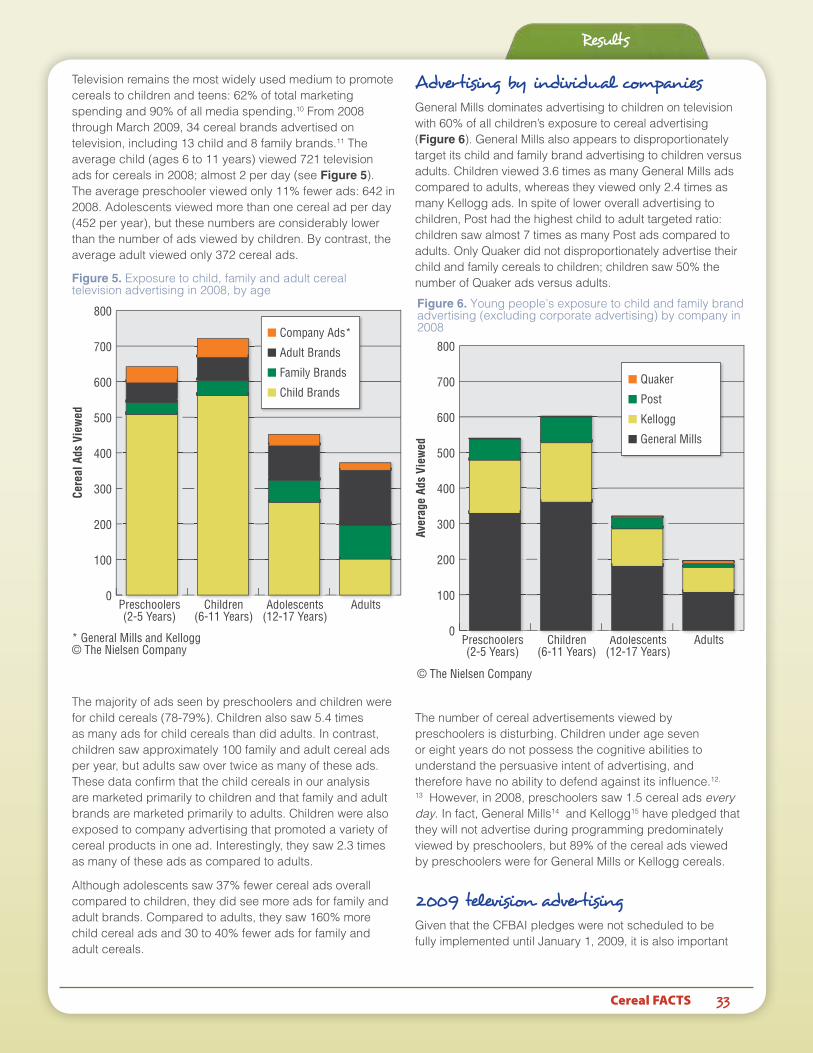
Cereal FACTS 33
Television remains the most widely used medium to promote cereals to children and teens: 62% of total marketing spending and 90% of all media spending.10 From 2008 through March 2009, 34 cereal brands advertised on television, including 13 child and 8 family brands.11 The average child (ages 6 to 11 years) viewed 721 television ads for cereals in 2008; almost 2 per day (see Figure 5). The average preschooler viewed only 11% fewer ads: 642 in 2008. Adolescents viewed more than one cereal ad per day (452 per year), but these numbers are considerably lower than the number of ads viewed by children. By contrast, the average adult viewed only 372 cereal ads.
The majority of ads seen by preschoolers and children were for child cereals (78-79%). Children also saw 5.4 times as many ads for child cereals than did adults. In contrast, children saw approximately 100 family and adult cereal ads per year, but adults saw over twice as many of these ads. These data confirm that the child cereals in our analysis are marketed primarily to children and that family and adult brands are marketed primarily to adults. Children were also exposed to company advertising that promoted a variety of cereal products in one ad. Interestingly, they saw 2.3 times as many of these ads as compared to adults.
Although adolescents saw 37% fewer cereal ads overall compared to children, they did see more ads for family and adult brands. Compared to adults, they saw 160% more child cereal ads and 30 to 40% fewer ads for family and adult cereals.
Advertising by individual companies
General Mills dominates advertising to children on television with 60% of all children’s exposure to cereal advertising (Figure 6). General Mills also appears to disproportionately target its child and family brand advertising to children versus adults. Children viewed 3.6 times as many General Mills ads compared to adults, whereas they viewed only 2.4 times as many Kellogg ads. In spite of lower overall advertising to children, Post had the highest child to adult targeted ratio: children saw almost 7 times as many Post ads compared to adults. Only Quaker did not disproportionately advertise their child and family cereals to children; children saw 50% the number of Quaker ads versus adults.
The number of cereal advertisements viewed by preschoolers is disturbing. Children under age seven or eight years do not possess the cognitive abilities to understand the persuasive intent of advertising, and therefore have no ability to defend against its influence.12,
13 However, in 2008, preschoolers saw 1.5 cereal ads every day. In fact, General Mills14 and Kellogg15 have pledged that they will not advertise during programming predominately viewed by preschoolers, but 89% of the cereal ads viewed by preschoolers were for General Mills or Kellogg cereals.
2009 television advertising
Given that the CFBAI pledges were not scheduled to be fully implemented until January 1, 2009, it is also important
Results
Figure 5. Exposure to child, family and adult cereal television advertising in 2008, by age
* General Mills and Kellogg© The Nielsen Company
Cere
al A
ds V
iew
ed
Preschoolers(2-5 Years)
Children(6-11 Years)
Adolescents(12-17 Years)
Adults0
100
200
300
400
500
600
700
800
P h l Child Ad l t Ad lt
■Company Ads*
■Adult Brands
■Family Brands
■Child Brands
Aver
age
Ads
View
ed
Preschoolers(2-5 Years)
Children(6-11 Years)
Adolescents(12-17 Years)
Adults0
100
200
300
400
500
600
700
800
P h l Child Ad l t Ad lt
■Quaker
■Post
■Kellogg
■General Mills
Figure 6. Young people’s exposure to child and family brand advertising (excluding corporate advertising) by company in 2008
© The Nielsen Company

Cereal FACTS 34
to assess changes in cereal advertising to children from 2008 to 2009. We calculated annualized 2009 advertising volume according to first quarter 2009 numbers. Although, as reported earlier, first quarter 2009 advertising spending indicates that cereal companies’ total media budgets will remain flat in 2009 versus 2008, television advertising to young people is on track to rise by 14 to 19% for child brands (see Figure 7). In contrast, annualized 2009 advertising for adult cereals shows a decline over 2008 numbers. Both General Mills and Post show a large increase in advertising to young people according to their first quarter 2009 numbers: General Mills by 19 to 25% and Post by 14 to 30%. In contrast, young people’s exposure to Kellogg advertising remained flat and Quaker did not advertise at all.
Figure 7. Young people’s exposure to television advertising: 2008 vs. 2009 Projected
© The Nielsen Company
Advertising to racial and ethnic minority youth
We found little evidence that cereal companies disproportionately targeted racial and ethnic minority youth with their advertising placements (see Table 8). African American youth did see 26% more television ads for cereals in 2008 as compared to all youth; however, this overexposure can be attributed to 38% higher overall levels of television viewing.16 Young people saw only 25 television ads per year on Spanish-language television.
Television advertising by brand
Ranking Table 3 provides detailed exposure data for child and family brands from January 1, 2008 through March 31, 2009. Five General Mills brands (Cinnamon Toast Crunch, Honey Nut Cheerios, Lucky Charms, Cocoa Puffs and Trix) comprised 48% of all cereal advertising seen by 2- to 11-year-olds. The top ten brands (also including Kellogg Frosted Flakes, Post Fruity and Cocoa Pebbles, General Mills Reese’s Puffs, Kellogg Corn Pops and Kellogg Froot Loops) represent 80% of all cereal ads viewed by children. Children saw over 7 times as many ads for Lucky Charms, Cocoa Puffs, Fruity or Cocoa Pebbles, Reese’s Puffs and Cookie Crisp as did adults. Only three child and family brands advertised on Spanish-language television during this period: General Mills Cheerios (Honey Nut and all other) and Kellogg Frosted Flakes.
In summary, General Mills, Kellogg and Post advertised 13 child brands on television from January 1, 2008 through March 31, 2009, and these cereals represented over three-quarters of all cereal ads viewed by children. Unfortunately, these cereals are also among the least nutritious cereal products offered by these companies. General Mills is by far the largest cereal advertiser to children on television, with 60% of all cereal advertising viewed by children for only six General Mills brands.
Even more troubling, in spite of its CFBAI pledge to reduce unhealthy food marketing to children (scheduled to be fully implemented by January 1, 2009), General Mills appears
Results
Aver
age
Ads
View
ed
ChildBrands:
2-11Years
ChildBrands:12-17Years
GeneralMills:2-11Years
Kellogg:2-11Years
Post:2-11Years
0
100
200
300
400
500
600
700
800
■2008
■2009: Projected
Table 8. Exposure to television advertising for child, family and adult cereals in 2008 among African American youth and youth on Spanish-language television
Average ad exposure: GRP targeted ratio: Average ad exposure: African Americans 2-17 years African American to all 2-17 years Spanish-language television for 2-17 years
Child 518 1.2 15
Family 60 1.5 3
Adult 105 1.5 7
Company-level 54 1.3 4
©TheNielsenCompany

Cereal FACTS 35
to have increased the total amount of cereal advertising targeted to children in 2009. Similarly, both General Mills and Kellogg have pledged that they will not advertise to preschoolers, but the average 2- to 5-year-old viewed 474 ads for their cereals in 2008. Post also appears to have
increased advertising for children’s cereals in 2009. Only Quaker substantially reduced its television advertising to children in 2008 and 2009, and Quaker did not advertise its Cap’n Crunch brand on television during this period.
Results
In addition to documenting the volume of television advertising targeted to children, we also examined the messages portrayed in those ads. Although 98% of television food advertisements seen by children promote products of poor nutritional quality17 and children viewed television advertisements for the least nutritious cereals in 2007,18 the actual messages presented in those advertisements could determine whether they have a positive or negative influence on children’s eating habits. For example, if an advertisement for an unhealthy product indicates that the food is a special treat that should only be consumed on certain occasions, the influence could be positive. Unfortunately, past research indicates the contrary; the majority of children’s food advertising has traditionally associated unhealthy products with fun and happiness and portrays unhealthy food consumption behaviors.19 Therefore, understanding both the volume of advertising and the messages presented is required to appropriately evaluate progress in improving children’s nutritional environment.
To assess the messages presented in television advertising for cereals, we analyzed the content of 175 unique television advertisements that aired from January 1, 2008 through March 31, 2009, including 61 ads for 13 child cereal brands, 66 ads for 7 family brands, and 48 ads for 13 adult brands. Figure 8 presents the most common features of child, family (including company ads) and adult cereal advertisements and differences between the different types of ads.
We found clear differences between advertising techniques and messages used in child, family and adult cereals. Not surprisingly, three-quarters of ads for child cereals used animation, whereas no adult ads used that technique. More surprising were distinct differences between how cereal products were portrayed in the advertisements. Over half of
Television advertising content
FamilyBonding
Fun/Cool
Ingredient/HealthClaims
CerealShape
CerealMore Than
Food
Animation
0% 10% 20% 30% 40% 50% 60% 70% 80%
Figure 8. Differences in television advertising content for child, family and adult cereal brands.
■Adult Brands
■Family Brands
■Child Brands
Key definitions Television advertising content
Animation Includesanimatedbrandcharacters(e.g.TonytheTiger),licensedcharacters(e.g.,Nickelodeon orDisneycharacterslicensedforusefromathirdparty)andothernon-brandedanimated characters,aswellasotherusesofanimationintheadvertisement.
Cerealasmorethanfood Whenthecerealpiecesareportrayedasaplay-thingorforuseinsomethingotherthan consumption(e.g.,cerealpiecesbecomearollercoasterrideoracharacterinthead).
Ingredientandhealth Includesdescriptionsofproductnutrientsoringredients(e.g.,wholegrains,lowfat,vitamins,claims calcium,fiber,or“natural”ingredients)and/orhealthbenefitclaims(i.e.,thecerealis“healthy;” reducestheriskofdisease;lowerscholesterolorbloodpressure;improvesbodilyfunctionssuchas digestion;improvesphysicalormentalperformance;and/orpromotesweightcontrol).
Emotionalbenefits: Implicitclaimsthatassociatethecerealwithfun,coolandpeeracceptance.Child-targeted
Emotionalbenefits: Implicitclaimsthatassociatethecerealwithfamilylove,bonding,ortogetherness.Familybonding
GamesURL Theadvertisementdirectstheviewer(eitherverballyorinwritingon-screen)toanadvergaming website.
Targetaudience Thetypeofviewertowhichtheadvertisementappearstobeappealing,asindicatedbythetextin theadorthepersonconsumingthecereal.

Cereal FACTS 36
all ads for child cereals represented the cereal as much more than food. In these ads, cereals had magical powers, were the building blocks of thrill-rides, and even transformed into walking, talking animated characters. The few ads for child cereals that did present actual characteristics of the product focused on its shape (e.g., Corn Pops’ “unique shape” or Lucky Charms’ hourglass-shaped marshmallow piece) and not on features associated with its qualities as a food. In contrast, most family and adult cereal ads discussed healthy features of the cereal, including its nutritious ingredients and/or the health benefits of consuming the cereal.
Emotional appeals were also used extensively in advertising for child cereals, with the majority of ads conveying the message to children that consuming these products is fun, cool and/or promotes peer acceptance. A family bonding appeal also appeared in ads for some family cereals. In contrast, adult cereal ads primarily focused on feeling good as a result of the health benefits of the product (e.g., lowering your cholesterol or losing weight). Humor was also commonly used in adult and family cereal ads (38 and 32% of ads).
We also examined the consumption messages commonly presented in the cereal advertisements. Cereal ads commonly depicted the cereal being consumed; however, the actual behaviors presented differed significantly for child and adult cereals. Approximately two-thirds of ads for both adult and child cereals showed cereal being consumed, compared to only 39% of family ads. Ads for adult and family cereals were twice as likely to present the product being consumed at a table or meal, whereas only 16% of the eating behaviors presented in ads for child cereals occurred at a meal or table.
Ads for adult and family cereals made no mention of eating the cereal as part of a balanced breakfast, however, ads for child cereals included this suggestion 71% of the time. Family cereal advertising also depicted cooking or eating together as a family, whereas those for child and adults cereals did not.
Finally, we quantified the number of ads that provided information about the company website. Family and adult cereals were more likely to advertise the company URL in the television ad (30% and 31%); but 18% of child cereal ads directed the viewer to the product’s advergame website URL.
Differences by brand and company
We also examined differences in television advertising content by brand and company for the child and family cereals. Although we had used child to adult GRP targeting ratios to identify child cereals (i.e., cereals for which children saw relatively more ads as compared to adults), the content analysis did identify two child brands that also appeared to target adults in some of their ads. Among the ads for Honey Nut Cheerios, 60% appealed directly to adults, and 40% of Cinnamon Toast Crunch ads also appealed to adults. Not surprisingly, these brands also have lower child to adult targeted ratios as compared to the other brands (2.4 and 4.0 compared to 6.0 to 7.1 for most other child cereal brands). Therefore, we removed the Honey Nut Cheerios and Cinnamon Toast Crunch ads targeted to adults from the following analysis of ads by brand.
Table 9 presents the messages and techniques commonly used in child-targeted ads for child cereals. This analysis
Results
Number Cereal as Ingredient Fun, cool, Food of child- more than Cereal and/or peer consumed at
targeted ads Animation food shape health claims acceptence meal or table
Kellogg FrostedFlakes 11 82% 0% 0% 18% 91% 18%
Kellogg CornPops 5 40% 80% 40% 0% 60% 0%
GeneralMills HoneyNutCheerios 2 100% 50% 0% 0% 100% 0%
GeneralMills Cinnamon 3 0% 33% 67% 0% 67% 0% ToastCrunch
Kellogg Trix 5 80% 100% 20% 20% 80% 20%
Post FruityorCocoaPebbles 5 100% 80% 40% 0% 100% 40%
GeneralMills LuckyCharms 5 100% 100% 80% 20% 80% 0%
GeneralMills CocoaPuffs 4 100% 75% 0% 25% 75% 0%
Kellogg AppleJacks 4 100% 50% 25% 0% 100% N/A
Kellogg FrootLoops 5 100% 100% 20% 0% 100% 0%
Post Honeycomb 3 0% 0% 0% 0% 67% 33%
GeneralMills Reese’sPuffs 2 0% 100% 0% 0% 100% 50%
GeneralMills CookieCrisp 2 100% 50% 50% 50% 100% 100%
Table 9. Television advertising content by brand for ads targeted to children.

Cereal FACTS 37
demonstrates surprising consistencies between cereal advertisements targeted to children. Only three brands did not use animation in their ads (Cinnamon Toast Crunch, Honeycomb and Reese’s Puffs), and only two (Frosted Flakes and Honeycomb) did not represent the cereal as more than food. All brands communicated that the product was fun, cool and/or promoted peer acceptance in at least two-thirds of their ads. A small number of ads (approximately one each for five of the brands) presented ingredient and/or health claims in their ads targeted to children. Unfortunately, none of the cereals advertised to children are nutritious. Of the 13 child brands in this analysis, only six presented the food being consumed at a meal or table (Apple Jacks never presented the cereal being consumed).
We did find a difference between companies in their presentation of games URLs in the ads. All Kellogg brands presented the URL for an advergame website in at least one of their ads. In contrast, only General Mills Cocoa Puffs and Trix presented a games website URL in any of their ads, and Post did not include the URL for their games website.
Although most family brands were identified as such because the company website indicates that the products are for children or families, the majority of television ads for these brands promoted adult consumption only. Only Kellogg Mini-Wheats and Rice Krispies and Quaker Life specifically addressed parents and encouraged child consumption in the majority of their ads (see Table 10). The most common messages presented in these ads were ingredient and/or health claims (primarily in ads targeted to adults) and family bonding (in ads targeted to parents). Post Raisin Bran and General Mills Chex only had one ad each, and these ads had a somewhat different message. The Post Raisin Bran ad was a vintage ad that promoted the amount of raisins in each box. The Chex ad focused on convenience and ease of preparation.
Finally, although we found no evidence that cereal companies specifically target racial and ethnic minorities when placing their advertising, we did find evidence of racial targeting in the advertising content of one child cereal. African Americans have been shown to be more responsive
Results
Table 10. Television advertising content for family brands*
Number Targeted Ingredient and/or Family of ads to parents health claims bonding
GeneralMills Cheerios(excludingHoneyNut) 24 4% 100% 8%
Kellogg RiceorCocoaKrispies 11 100% 0% 91%
Kellogg Mini-Wheats 7 86% 100% 0%
Quaker Life 4 100% 25% 75%
Barbara’sBakery Puffins 3 33% 100% 0%
Post RaisinBran 1 0% 0% 0%
GeneralMills Chex 1 0% 0% 0%
*Doesnotincludecompany-leveladvertisments.
“Childhood is calling.”
“Keep your kids full and focused.”“Cocoa-lossal chocolatey taste.”
“A yogurty treasure!”

Cereal FACTS 38
to advertising that presents actors of their own race,20 and advertisements for Reese’s Puffs only included African American actors. In contrast, other ads typically showed a range of racial and ethnic minorities when groups of children appeared. Reese’s Puffs, therefore, appears to design its ads to appeal specifically to African American children. Unfortunately, Reese’s Puffs also has the poorest nutritional quality of all the brands in our analysis.
In summary, television advertising for cereals targeted to children has very little to do with food. The main purpose of the ads appears to be to associate these products with positive emotions that are likely to appeal to this age group: fun, being cool and fitting in. In addition, these advertisements typically present the product more as a toy or companion, as opposed to something to eat. Similarly, they commonly promote the shape of the product and/or present it doing something that food cannot do. These same techniques are used consistently by all companies who advertise directly to children. In contrast, Kellogg and Quaker market several of their family cereals to parents with a message about family bonding (Rice or Cocoa Krispies and Life) and improving their children’s mental performance (Mini-Wheats). All other family cereals are primarily advertised to adults for adult consumption, with a message about nutrition and/or health.
Television advertising overviewCereal advertising to children on television appears to have changed very little as a result of the CFBAI. The average child in the United States continues to view 1.6 cereal ads on television every day, and all of the cereals advertised to them directly are among the worst quality cereals produced by cereal manufacturers. The large cereal companies, as well as all of the smaller companies, do have more nutritious children’s products in their portfolios; however, most of these products are advertised much less extensively, if at all, and only to adults. Children’s cereal advertisements have little to do with food; their main purpose appears to be to associate these poor quality products with fun, being cool and peer acceptance. In addition, much of this exposure is likely to occur without parents’ awareness. Children see over five times as many of these ads as adults see and the products advertised to them have significantly more sugar, sodium and food dyes and significantly less fiber. Not surprisingly then, parents believe that their children see far fewer ads for cereals: approximately one ad per week.21
This analysis also presents unfortunate news about the potential impact of cereal television advertising and companies’ pledges to improve their marketing practices. In addition to the elementary-school-age children that companies say they are marketing to, almost equal numbers of very young children are also being exposed to these advertisements. These children have no cognitive abilities
to defend against advertising messages;22, 23 therefore, advertising to them is inherently unfair and potentially extremely harmful given the nutritional quality of the products. It also appears that the overall number of cereal advertisements viewed by children will not decline due to the CFBAI. According to first quarter 2009 numbers, some companies have even increased the amount of cereal advertising targeted to children.
Finally, General Mills had by far the most cereal advertising to children: almost 60% of all cereal advertisements seen by children. The products advertised most extensively (Cinnamon Toast Crunch, Honey Nut Cheerios, Lucky Charms, Cocoa Puffs and Trix) are all on their list of “better-for-you” foods that can be advertised to children; however, these products are all significantly “worse for you” than other cereals in their portfolio. Kellogg and Post also advertise their least nutritious products directly to children; however, they promote fewer products and at lower levels. Kellogg also advertises its lower sugar children’s cereals (Rice Krispies and Frosted Mini-Wheats) to parents directly. Only Quaker has discontinued advertising directly to children on television.
Internet marketing
Television remains the primary advertising medium used by cereal companies to promote their brands to children and adolescents. In 2006, only 6.0% of their youth advertising budgets were devoted to websites and other forms of internet marketing, totaling $14.2 million.24 Digital media are far less expensive than traditional forms of advertising, however, and we found several brands that aggressively use a variety of digital marketing practices to advertise to children and adolescents, including child-targeted websites, banner advertising on other (i.e., third party) websites, and social media marketing. Given the highly entertaining and interactive content of child-targeted websites, and the fact that no regulations limit the amount or types of marketing that can be directed to young people via the internet, health researchers have become increasingly concerned about digital marketing practices.25, 26
Child-targeted websitesWe identified 17 branded cereal websites with content targeted to young people. These sites were sponsored by General Mills, Kellogg and Post, and included two sites specifically targeted to children that featured multiple brands from one company, 11 child-targeted sites for individual cereal brands, three adult-targeted websites with some child content, and one additional unbranded site for children by General Mills (see Table 11). Of the 17 websites with child-targeted content, ten had enough website traffic to obtain exposure data from comScore.
Results

Cereal FACTS 39
Website exposure
Results
Table 11. Cereal company websites with content targeted to young people
Company Website Main audience Products featured comScore data available
GeneralMills Millsberry.com Children Multiplebrands Yes
Post Postopia.com Children Multiplebrands Yes
GeneralMills CookieCrisp.com Children Onebrand Yes
GeneralMills ReesesPuffs.com Children Onebrand Yes
GeneralMills CuckooShow.com(CocoaPuffs) Children Onebrand No
GeneralMills HoneyNutCheerios.com Children Onebrand No
GeneralMills LuckyCharms.com Children Onebrand No
GeneralMills SillyRabbit.com(Trix) Children Onebrand No
Kellogg AppleJacks.com Children Onebrand Yes
Kellogg CornPops.com Children Onebrand Yes
Kellogg FrootLoops.com Children Onebrand Yes
Kellogg FrostedFlakes.com Children Onebrand Yes
Post Beeboy.com(Honeycomb) Children Onebrand No
GeneralMills Cheerios.com Adult Onebrand Yes
GeneralMills Chex.com Adult Onebrand Yes
Kellogg FrostedMiniWheats.com Adult Onebrand No
GeneralMills Choosebreakfast.com Children Unbranded No
Definitions Website exposure*
Averageuniquevisitors Averagenumberofindividuals(ineachdemographicgroup)visitingthewebsiteeachmonthfrompermonth:2-11years; January2008throughMarch2009.12-17years;AfricanAmerican2-17years
Averagevisits Averagenumberoftimeseachuniquevisitor(ineachdemographicgroup)visitedthewebsiteeachpermonth27 monthfromJanuary2008throughMarch2009.
Averageminutes Averagenumberofminuteseachvisitor(ineachdemographicgroup)spentonthewebsiteeachpervisit timeheorshevisitedfromJanuary2008throughMarch2009.
Targetedvisitorratios: ProvidestherelativeproportionofchildrenandteenswhovisitedthewebsiteascomparedtoChildtoadult;Teento theproportionofadultvisitorsandtherelativeproportionofAfricanAmerican2-to17-year-oldsadult;AfricanAmerican ascomparedtoall2-to17-year-olds.Forexample,ifthechildtoadultratioforawebsitewas2.0,toallyouth thenchildrenweretwiceaslikelytovisitthewebsitecomparedtoadults.
*Data retrieved from comScore Media Metrix Key Measures Report
Ranking Table 4 provides total unique child and adolescent visitors, average visits per month and average minutes per visit for cereal websites with child-targeted content for the period from January 2008 through March 2009.
The numbers are astonishing. The two cereal multi-brand websites are major internet destinations for children and
adolescents. Every month, on average, 767,000 young people spent a total of 66.4 minutes engaged in General Mills’ Millsberry.com. Fewer young people visited Post’s multi-brand website, but the numbers are still considerable. On average, 265,000 visited Postopia.com every month and spent 30.4 minutes on the website. Many of the General Mills child brands (Cocoa Puffs, Cookie Crisp, Honey Nut

Cereal FACTS 40
Cheerios, Lucky Charms, Reese’s Puffs and Trix) also have their own child-targeted websites, but only two (Reese’s Puffs and Cookie Crisp) had enough visitors to report during the period examined. In addition, Post has a separate, relatively low volume, website for its Honeycomb brand (Beeboy.com).
Kellogg appears to follow a different internet marketing strategy for its child-targeted brands. In place of one very large multi-brand website, Kellogg maintains separate moderately large websites for four of its child brands (Apple Jacks, Corn Pops, Froot Loops and Frosted Flakes). These sites averaged approximately 47,000 child and teen visitors each month and visitors spent a total of 12.1 minutes on the sites.
In contrast, the number of young people visiting General Mills’ adult-targeted websites with some child content (Cheerios.com and Chex.com) was low: an average of 21,000 visitors each month spending 5.3 minutes in total. In addition, children and adolescents were less likely to visit these sites as compared to adults. The volume of traffic to General Mills’ nutrition website (Choosebreakfast.com) was too low to report.
Age and racial targeting. The proportion of child to adult and teen to adult visitors to these websites confirm that they
appeal primarily to children younger than 12 years (see Table 12). The targeted ratios by age range from 2.7 for Postopia.com (i.e., children were almost 3 times as likely to visit the site as compared to adults) to 0.4 for Chex.com. Interestingly, only Millsberry.com appears to be a popular destination for adolescents; teens were twice as likely to visit the site as compared to adults. For a few of the sites (FrootLoops.com, CookieCrisp.com, FrostedFlakes.com, Cheerios.com and Chex.com) teens visited relatively less often than did adults.
In addition to their primary appeal to young people, nearly all the child-targeted sites also appear to appeal disproportionately to African American youth. FrostedFlakes.com, CookieCrisp.com, Millsberry.com, and ReesesPuffs.com were all visited 2.5 to 6 times as often by African American 2- to 17-year-olds, as compared to all young people in that age group. In contrast, African American youth visited Postopia at a similar rate as all youth. As African American youth spend a comparable amount of time playing internet games as compared to their white counterparts,28 many of the cereal sites appear to disproportionately appeal to this at-risk population.
Results
Table 12. Targeted visitor ratios for websites with child-targeted content
Company Website Child African American to adult Teen to adult to all youth
Post Postopia.com 2.7 1.4 1.0
Kellogg FrootLoops.com 2.4 0.8 2.2
Kellogg CornPops.com 2.3 1.0 1.4
GeneralMills ReesesPuffs.com 2.1 1.3 2.7
GeneralMills Millsberry.com 1.7 1.7 2.5
Kellogg AppleJacks.com 1.7 1.0 1.9
GeneralMills CookieCrisp.com 1.3 0.8 4.2
Kellogg FrostedFlakes.com 1.2 0.4 5.9
GeneralMills Cheerios.com 0.9 0.5 1.8
GeneralMills Chex.com 0.4 0.7 3.3
*RatioscalculatedasdescribedinMethodsusingdatafromcomScoreMediaMetrixKeyMeasuresReport,(January2008–March2009).

Cereal FACTS 41
Website content analysis
Results
Definitions Website content analysis
Ingredientorhealth Ingredient claims refertostatementsaboutpropertiesofthecerealsthemselves,suchas“Hasclaims wholegrains.”Health claims directlystatehealthbenefitsfromconsumingtheproduct,suchas “Buildsstrongbones.”
Cerealasmore Whenthecerealpiecesareportrayedasaplay-thingorforuseinsomethingotherthanthanfood consumption(e.g.,anadvergamethatisplayedusingcerealpieces).
Promotionsorlicensed Onlinepromotionsincludecross-promotionssuchasthepresenceofFlintstonecharacters,characters andsweepstakesforonlineprizes.Offlinepromotionsincludesweepstakesredeemableforoffline prizes,andincentivestopurchaseanofflineproduct(usuallyaspecificcereal)togainaccessto specialonlinecontent.
Brandengagement Engagement techniques arebrandedandunbrandeddevicesthatutilizethemediumoftheinternettechniques toattractandkeepvisitorsonawebsite.Brand engagement techniques refertoanyofthese devicesthatspecificallykeepusersengagedwiththebrand.Examplesincludethebrandlogo, spokes-characters[e.g.TonytheTiger],licensedcharacters[e.g.theFlintstones],ortheproduct itself.
Webengagement Web engagement techniques refertoengagementdevicesthatkeeptheuserinteractingwiththetechniques pagelonger,suchastheabilitytodownloaditemsordesignadigitalalterego,oravatar.
Behavioraltargeting Anymethodbywhichacompanycollectsinformationaboutawebsiteuser,suchasapoll,quiz,or userregistration.
Advertisingidentification Referseithertolabelsonspecificsectionsofapagemarkingitasanadvertisementortoageneric labelinthecornerofapagesayingthatthewholepageisanadvertisementormaycontain advertisements.
In the website content analysis, we examined a total of 452 unique, child-oriented pages from the 17 cereal websites that contained child-targeted content. Not surprisingly given the amount of time young people spend on these sites, Millsberry.com had the most child-targeted pages on its website (167), followed by Postopia.com with 112 pages. Although these two sites are sponsored by General Mills and Post, they prominently feature only a few child cereal brands. At Millsberry.com, branded content for Trix, Lucky Charms and Honey Nut Cheerios appeared on 79 to 82% of all pages (132 to 137 pages each). Reese’s Puffs also appeared on 9% of pages and Cinnamon Toast Crunch on 7%. At Postopia.com, branded content for Honeycomb appeared on 97% of pages and Fruity and Cocoa Pebbles appeared on 100%. The number of child-targeted pages on other sites ranged from 1 to 31, with branded content on most.
Table 13 provides a summary of the content of cereal websites’ child-targeted pages, including health and nutrition claims, representing the cereal as more than food, promotions and licensed characters, brand and web engagement techniques, and behavioral targeting.
Ingredient and health claims. Six of the 17 sites carried ingredient or health claims. The majority of these statements promoted a cereal as having whole grains (27 pages), while others promoted vitamins or minerals (8), calcium (8), or fiber (3). Two sites—FrostedFlakes.com and FrostedMiniWheats.com —went beyond touting a cereal’s ingredients to suggest
health benefits from consuming the product. Most of these health claims referred to enhanced mental performance (8 pages), while others suggested that eating the cereal would enhance physical capabilities (3) or build stronger bones (1). Of the cereals promoting health claims to children on their websites, only Frosted Mini-Wheats would qualify as healthy according to the NPI model. All other cereals scored low on the NPI model (46 or lower) and contain a minimum of 9 g of sugar per serving (31 – 41% of total content). Three-quarters of all nutrition claims, and 45% of health claims, were graphically integrated into a website, as opposed to text-only statements.
The Frosted Flakes site, for instance, advises kids that, “Just like you need to refuel in the morning, you also need to refuel before you lace up your shoes and hit the track, trail, field or court. Enjoy Kellogg’s Frosted Flakes cereal with milk, and you’ll be ready to do your best.” In the Reese’s Puffs skiing game on the Millsberry website, the user sees images touting the “whole grains” in the cereal while associating that ingredient claim with the General Mills brand logo.
Three websites (AppleJacks.com, FrootLoops.com, and ReesesPuffs.com) did present a message that would periodically (usually after a period of 15 minutes) alert children to take a physical activity break from spending time online although children could easily override this notice and continue playing. Only one website (Choosebreakfast.com by General Mills) did not included branded products and

Cereal FACTS 42
Results
Table 13. Child-targeted website content analysis
Ingredient Cereal Promotions orhealth morethan orlicensed Brand Web Behavioral claims food characters engagement engagement targeting Total number %of %of %of %of #per %of #per ofpages pages pages pages pages page pages page %ofpages AdID
Millsberry.com 167 3% 3% 2% 6% 1.7 25% 3.5 22% Yes
Postopia.com 112 1% 34% 97% 61% 1.8 78% 6.0 73% Yes
FrootLoops.com 31 0% 39% 29% 42% 3.9 52% 4.3 3% Yes
LuckyCharms.com 24 0% 67% 21% 75% 3.3 79% 4.8 71% Yes
SillyRabbit.com(Trix) 22 37% 14% 32% 32% 2.4 55% 2.6 55% Yes
FrostedFlakes.com 20 10% 0% 30% 0% 35% 1.6 0% No
FrostedMiniWheats.com 15 87% 7% 0% 13% 2.0 20% 2.3 27% No
AppleJacks.com 13 0% 38% 0% 54% 3.0 100% 2.3 8% Yes
ReesesPuffs.com 10 50% 0% 33% 20% 3.0 70% 1.7 90% Yes
Beeboy.com(Honeycomb) 9 0% 11% 0% 22% 2.0 44% 2.5 0% No
HoneyNutCheerios.com 5 0% 60% 0% 80% 3.0 80% 5.0 60% Yes
Cheerios.com 4 0% 0% 0% 0% 50% 1.0 0% No
Chex.com 4 0% 0% 75% 0% 50% 1.0 75% No
CuckooShow.com 4 0% 25% 0% 75% 2.3 100% 2.3 0% Yes(CocoaPuffs)
CookieCrisp.com 2 0% 50% 0% 100% 3.0 100% 3.0 0% Yes
Froot Loops’ activity break screen. Enjoy a healthy snack before the game Reese’s Puffs with whole grain
primarily offered a nutrition education message to encourage kids to "choose breakfast."
Entertainment content. As found in the television advertising content analysis, the majority of websites for child brands also commonly represent the cereal itself as more than food, typically by incorporating the cereal into the game as either a piece of equipment, playmate, or an object used in the course of the game. For example, in a game on Millsberry.com called Fruity Cheerios Bumper Boats, the
characters in the game use Fruity Cheerios pieces as their bumper boats in an attempt to bump other players outside of the designated play space; or children are invited to play a racing game with Apple Jacks’ “CinnaMon” and “Apple” characters.
Not surprisingly, given the considerable time that young people spend on these websites, the most common features on all pages were devices designed to keep children engaged and interacting with the content, including promotions,

Cereal FACTS 43
licensed characters and brand and web engagement techniques. In addition, the majority of sites included behavioral targeting devices on many website pages. Table 14 summarizes the techniques found on these sites.
General Mills websites stood out for the most intrusive and at times misleading content, including claims touting the cereals’ nutritional benefits. As in their television advertising, Reese’s Puffs also utilized African American characters almost exclusively on its website and appeared to target its message specifically to African American children. General Mills also employed the widest range of behavioral targeting techniques to gather information about children and teens that use its sites. In spite of extensive branding on all their websites, only seven of General Mills’ ten sites included a warning that the site may contain advertising.
Kellogg’s websites made extensive use of branded engagement techniques. For example, Kellogg’s sites frequently included interactive games that featured brand identifiers, such as spokes-characters, logos, packaging,
and the branded cereal itself. Kellogg’s websites did have some positive features. As discussed, they presented periodic physical activity messages, and the Frosted Flakes site stood out for its focus on physical activity, even though that message was embedded within the cereal’s promotion. Two of Kellogg’s three websites for child brands included a warning that the site contains advertising content.
Despite having only two sites, Post was the most aggressive at targeting children online. Postopia.com in particular stood apart with more than twice as many games as any other site and the highest number of brand identifiers per page. For instance, the Flintstones cartoon characters were featured on nearly all pages to promote Fruity and Cocoa Pebbles. Post also encouraged consumption, by requiring codes from cereal boxes to access special features of the sites. Postopia.com did indicate that the site contained advertising content.
Results
Ride with Apple Jacks “Cinnamon” and “Apple” characters
Ride the Fruity Cheerios bumper boats.
African American character on ReesesPuffs.com.
“Win Cash” promotion on SillyRabbit.com.

Cereal FACTS 44
Results
Table 14. Interactive content on child-targeted web pages as of March, 2008.29
Millsberry.com Thiswebsitestoodoutasthemostinteractive.ItwasthesolesitethatcreatedavirtualworldinwhichuserscoulddesignanavatarandexploretheMillsberry"city"online.Thesiteisdesignedtoproduceextremelylengthystaysinthisbrandedenvironment.Forexample,whentheuserplaysgamesonthesite,heorsheearns"Millsbucks"currencythatcanbeusedtobuybrandedgrocerystoreitems—includingGeneralMills'cereals—fortheuser'savatar.Thesitealsohadthemostcompletesetofbehavioraltargetingtechniques.Theseincludedpersonalinformationgathereduponsiteregistration,aswellastheencouragementforchildrentoasktheirfriendstoregistersotheycouldsendMillsberrymessagestooneanotheronthesite.Trix,LuckyCharmsandHoneyNutCheerioswereeachprominentlyfeaturedonthemajorityofpages,andReese’sPuffs,CocoaPuffsandCinnamonToastCrunchwereeachfeaturedon3to9%ofthepages.
Postopia.com Thissitehadthemostgames,83intotal,ofwhich68(82%)includedbrandedcontent.Moreover,mostofthesegamesencouragedchildrentoeattheproductbyrequiringacodefromtheproductpackagetogainextraadvantagesinthegames.ThesitewasalsothoroughlybrandedwithFlintstonescharacterspromotingcerealproductsonalmosteverypage.
LuckyCharms.com Thesitewaswellintegratedastheusercouldwatch“webisodes”tolearnaboutLuckyandhistrialsandtribulationsandthenusetheinformationtowingamesonotherpartsofthesite.
FrootLoops.com Thiswebsiteengagedusersthroughextensiveuseofinteractivetechniquessuchasgamesand“webisodes”.Thesitewasalsothoroughlybrandedthroughtheheavydisplayoflogosandspokes-characters.
FrostedMiniWheats.com ThesitemadeexaggeratedhealthclaimsaboutFrostedMini-Wheats'abilitytoimprovechildren'sattentiveness.TheseclaimscaughttheattentionoftheFTC,whichonApril20,2009,ruledthattheclaimswerefalseandillegal.
Sillyrabbit.com(Trix) Thisgraphic-intensivesiteincludedanarrayoftechniquestoengagechildren,suchasbrandedgamesandvideos.Thesitealsocontainedavarietyofmethodstofurthertargetitsusers,includingsweepstakesanda"Tellafriend"featurethatrequireduserstoinputtheirpersonalinformation.
AppleJacks.com Thesitehadahighlevelofintegration,tellingastoryaboutthetravelsoftheproduct'sspokes-charactersacrossmultiplepagesofthesite.Thisnarrativeconnectedthesedifferentpages,includingthroughvideosaboutthespokes-characters'travails.Thesitealsoincludedinteractivegames,thoughthesewerenotintegratedintothetravelstory.
Beeboy.com(Honeycomb) Thiswebsitewaswellintegrated,tellingastoryaboutitsbrandedspokes-characteracrossindividualwebpages.Thestoryseemedespeciallychild-targeted,asitwasaboutthecoming-of-ageofthe"Beeboy"spokes-character.
ReesesPuffs.com Thiswebsitedrewonthe"cool"cacheofthehip-hopgenretomarkettheproducttoyouth.Italsoallowedforahighlypersonalizedexperience,asuserscoulddesignandnameanavatar,andcreateasongtobedownloadedtohisorhercomputer.ThemajorityofanimatedcharactersonthiswebsiteappearedtobeAfricanAmerican.
CornPops.com Thissitewaslargedespitebeingonly1page,asthesinglepagecontainedaseriesofvideosthatunfoldedina"chooseyourownadventure"formatdesignedtomaintainchildren'sattentionforanextendedperiodoftime.
HoneyNutCheerios.com Whilethissiteincludedbrandedgamesandmaderegularuseofitsbrandedspokes-character"Buzz,"itwassmallandmodestwhencomparedtothelarger,moreinteractive,child-targetedcerealwebsites.
CuckooShow.com Thissitewasrelativelysimple,andlackedintegrationacrosswebpages.Itdidinclude,however,strategiesto(CocoaPuffs) engagechildren,suchasbrandedgames.
Chex.com Overall,thissitetargetedadults,butthechild-orientedsectionincludedanaggressivecross-promotionwithNASCAR,requiringchildrentoregisterforthesite,includingdivulgingtheirlocationandemailaddress—intimateinformationaboutitsyoungcustomers—beforetheywereallowedtovotefortheirfavoriteNASCARdriver.
CookieCrisp.com Thissmallsitedidcontainonebrandedgame,butwasfarlessengagingandinteractivethanthegameexperienceonothersites.
Cheerios.com Themajorityofthesitetargetedadults,Thechild-orientedsectionintroducedtheHoneyNutCheeriosspokes-character,Buzz.Thisintroductionwasstatic,includingpicturesandtext,andlackedinteractivefeaturessuchasagamesorvideos.
FrostedFlakes.com Whileclearlydedicatedtopromotingthebrandedproduct,thesitedidsobyfocusingonphysicalactivity,withlinkstonon-profityouthsportsorganizationssuchasPopWarnerfootball.

Cereal FACTS 45
Results
Banner advertising on third party websites
Definitions Banner advertising exposure*
Thirdpartywebsites Sitesthatpresentadvertisingfromothercompaniesontheirwebpages.
Banneradvertising Advertisingthatappearsonthirdpartywebsitesasrichmedia(SWFfiles)andtraditionalimage basedads(JPEGandGIFfiles).Banneradsusuallyappearinasidebaror“banner”onawebpage. Text,videoandhtml-basedadsarenotincluded.
Averagemonthly Averagenumberofuniqueviewersexposedtoabrand’sbanneradvertisementseachmonthfromuniqueviewers30 October2008throughMarch2009.
Averagenumberofads AveragenumberofbanneradvertisementsviewedeachmonthbyeachuniqueviewerfromOctoberviewedpermonth31 2008throughMarch2009.
Youthwebsites Entertainmentwebsitesforyouthages2to17years(asdefinedbycomScore)orwebsiteswitha percentageof2-to17-year-oldvisitorsthatexceedsthepercentageof2-to17-year-oldsonthetotal internet.
%adviewson Thepercentageofabrand’sbanneradvertisementsthatappearedonyouthwebsitesascomparedyouthwebsites toallwebsitesfromOctober2008throughMarch2009.
*Data retrieved from comScore Ad Metrix Advertiser Report
The volume of banner advertising for child brands from October 2008 through March 2009 confirms that cereal companies use advertising on third party websites extensively to drive traffic to their child-targeted websites. We found banner advertising promoting seven of the eight child-targeted websites for which we obtained exposure data, as well as for the three child brands promoted most extensively on Millsberry.com (Trix, Lucky Charms and Honey Nut Cheerios) (see Ranking Table 5).
General Mills placed by far the most banner ads to promote their child brands. In the average month examined, over 11 million viewers saw more than ten ads each for Millsberry.com;
more than 90% of these ads appeared on youth websites. Extensive advertising on youth websites for Lucky Charms, Trix and Honey Nut Cheerios also directed viewers to Millsberry.com; and over 4 million viewers saw nearly 14 ads each for Reese’s Puffs every month. Over 80% of banner ads for Kellogg Froot Loops also appeared on youth websites. In contrast, ads for Kellogg Apple Jacks, Corn Pops and Frosted
Table 15. Top 10 web publishers with advertising for child cereal brands
*Data retrieved from comScore Ad Metrix Advertiser Report (October 2008 - March 2009).
Average number of ads viewed per monthWebsites (000)
GorillaNationKidswebsites(IncludingMillsberry.comandKidzWorld.com) 61,725.4
ViacomDigitalwebsites(IncludingNeoPets.com,Nick.com,AddictingGames.com,andNickJr.com) 44,625.9
CartoonNetwork.com 40,418.4
DisneyOnlinewebsites 24,195.1
MiniClip.com 10,248.8
PearsonEducationwebsites(IncludingFunBrain.com) 2,163.3
BetawavePartnerswebsites-Partiallist(IncludingTagged.com) 1,711.8
KabooseFamilywebsites 904.1
4kidsEntertainmentwebsites(Including4Kids.TV) 506.5
StarWars.com 318.6
Trix advertising on Millsberry.com

Cereal FACTS 46
Flakes appeared predominately on non-youth websites. Overall, Post had very little banner advertising.
Table 15 lists the top ten web publishers in which these banner ads appeared. These websites accepted approximately 80% of all child cereal advertising, and three-fourths of all advertising appeared on websites from only four web publishers. Not only is Millsberry by far the most visited cereal website targeted to children, it also accepts the most third party advertising. In effect, children who visit Millsberry
are exposed to twice the amount of marketing, through the interactive content on the site as well as through banner advertising placed on the site. Websites for the top children’s media venues (Viacom, CartoonNetwork and Disney) rank second, third and fourth on the list of web publishers in which advertising for child cereals appears. Interestingly, Disney does not accept outside advertising on their television programming, yet they ranked fourth in placements of cereal banner advertising on the internet.
Results
Banner advertising content analysis
Definitions Banner advertising content analysis
Targetaudience Thetypeofviewertowhichtheadappealsmostdirectly,asindicatedbythetextand/orcreative content
Animatedcharacters Includesanimatedspokes-characters(e.g.,BuzztheBee),licensedcharacters(e.g.,Pebblesfrom theFlintstones)orothercartoonfigures
Cerealasmore Whencerealpiecesthemselvesbecomeaplay-thingorareusedtoportraysomethingotherthanthanfood consumption
Engagementtechniques IncludesFlashanimation,videooralinktovideo;out-of-borderdesign(i.e.,contentfromthe bannerademergesfromtheadontoanotherpartofthewebpage);gameintheadoralinktoa gameonanotherwebsite;pollorquizintheadoralinktoapollorquizonanotherwebsite; promotioninformation;and/orbehavioraltargetingdevices(i.e.,collectinginformationaboutthe viewer).
Mainpointofad Banneradswerecodedforoneofthreemainpoints:Game or game website whentheviewer playedagameontheadorisdirectedtoanothergamesite;giveaway or promotion whenthead promotedatoy,freesampleorothertypeofpromotion;orproduct claim,includingwhenthead promotedafeatureoftheproductitself,includingingredients,shapeortaste.
We coded a total of 29 unique banner advertisements for child cereals that appeared from October 2008 through March 2009. Of those ads, only three (75% of the Frosted Flakes ads) did not include content targeted to children.
In spite of their small size, the majority of cereal banner ads are highly creative and engaging with numerous devices to grab the attention of visitors to third party websites (see Table 16). Overall, 97% of ads targeted to a child audience used at least one engagement technique, and 40% included three or more engagement techniques in a single ad. For example, a General Mills Trix ad entices children to enter a “kids-only”
Trix world using vibrant colors and an abundance of flash animation. A rollercoaster car enters the ad from outside its borders onto a giant track made of Trix cereal. In another
Animated banner ad for SillyRabbit.com “Ad” identifier on Apple Jacks banner ad

Cereal FACTS 47
highly engaging ad, Kellogg Froot Loops cereal beckons children to play a game of “catch the treasure” within the ad itself. Cereal pieces shaped like golden pirate’s booty float across the ad and outside its borders as Toucan Sam and his nephews rush to catch them “before they’re gone”.
The main point of the majority (72%) of child-targeted banner ads was to engage the viewer in a game, either presenting
the game on the ad itself or sending the viewer directly to the brand’s advergame site. As found in the television advertising and website content analyses, banner ads for child brands also extensively represented the cereal as more than food, and the majority presented animated characters in the ads. Only banner ads for Kellogg Apple Jacks included a mention that it was an ad, but that mention appeared only as the word “ad” in small type in the upper right hand corner.
Results
Table 16. Content analysis of banner advertising for child brands (in order of amount of exposure)
Cereal as Average # of Target Animated more than engagement # of ads audience characters food techniques Main point of ads
GeneralMills Millsberry 5 Children 40% 0% 2.0 Game,gamewebsite
GeneralMills Reese’sPuffs 2 Children 50% 0% 2.5 Game
GeneralMills LuckyCharms 2 Children 100% 100% 2.5 Game
GeneralMills Trix 1 Children 100% 100% 2.0 Gamewebsite
GeneralMills HoneyNut 2 Children 100% 50% 3.5 Game Cheerios
Kellogg AppleJacks 4 Children 100% 75% 2.3 Game
Kellogg FrootLoops 2 Children 100% 100% 3.0 Cerealshape
Kellogg CornPops 3 Children 67% 33% 2.3 Game
Post Pebbles 1 Children 100% 100% 3.0 Productclaim (Postopia)
Post Honeycomb 2 Children 50% 50% 0.5 Giveaway,cerealshape (Postopia)
Kellogg FrostedFlakes 4 Children:25% 25% 0% 2.3 Childaudience:Game Parents:75% Parentaudience:Product claim
GeneralMills Cinnamon 1 Children 100% 100% 2.0 Cerealflavor ToastCrunch
Definitions Social media
Facebookfanpages Thesepagescanbecreatedonlybyan“authorizedrepresentativeofthesubjectofthepage”and, therefore,mustbesponsoredbythecerealcompanyorsomeonehiredbythecompany.
MySpaceprofiles Theseprofilesmaybeestablishedbyanymember,butareoftenusedtopromotebands,products, etc.Product-focusedprofilescontaincontentthatfocusesontheproductinquestion(e.g.,content was“written”byananthropomorphizedcerealorcerealmascotorfocusedonalikingorcravingfor thecereal)
Facebookand Thesegroupscanbecreatedbyanyindividualwithaspecificinterest.AlthoughthemajorityofMySpacegroups cerealgroupswerenotlikelyestablishedbythecerealcompany,theydoprovideanindicatorof interestintheproductandprovideviralmarketingforthecompany.
Twitter CompanieswithapresenceonTwitterpostupdatesbyarepresentativeofthecompany.
Social media
Finally, our search of Facebook and MySpace revealed that many of the child and family brands in our analysis had a significant social media presence. Table 17 lists all child
and family brands with at least one Facebook fan page: 22 in total. Facebook fan pages must be administered by an authorized representative of the product; therefore, these

Cereal FACTS 48
pages are likely intended as a marketing device. Kellogg Froot Loops had the highest social media presence, with five
fan pages totaling over 25,000 fans. Frosted Flakes followed with 3 fan pages totaling nearly 20,000 fans. Lucky Charms and Cocoa Puffs each had over 12,000 fans, and Cheerios, Trix, and Cap’n Crunch had over 5,000 fans. Interestingly, not all fan pages included links to corporate websites. In contrast, we found only 14 brands with a product-focused MySpace profile.
Although Facebook and MySpace groups are initiated and maintained by members, not the cereal companies directly, we found over 3,400 groups dedicated to child and family cereal brands. In fact, all child and family cereals, with the exception of General Mills Dora the Explorer and Kellogg's Hannah Montana and Cookie Crunch, had one or more Facebook groups. Golden Grahams and Lucky Charms had the largest presence, with an average of more than
Results
Frosted Flakes Facebook fan page
Table 17: Social media presence for child and family brands
Facebook Fan Pages Facebook Groups MySpace Groups
Company Brand # of pages Total Av’g # of Total # Av’g # of (with link to # of members of groups members company URL) # of Fans groups per group* per group*
Kellogg FrootLoops 5(1) 25,316 193 103 41 63
Kellogg FrostedFlakes 3(2) 19,739 114 28 77 47
GeneralMills LuckyCharms 5(1) 13,239 500+ 153 244 55
GeneralMills CocoaPuffs 1 12,433 108 30 72 21
GeneralMills Cheerios 4(2) 7,539 412 82 194 57
Quaker Cap’nCrunch 1(1) 5,347 138 62 34 18
GeneralMills Trix 4(1) 5,150 108 127 22 48
Post FruityorCocoaPebbles 2 3,474 136 39 72 22
GeneralMills HoneyNutCheerios 1 3,033 42 46 19 26
GeneralMills GoldenGrahams 2 1,573 74 124 6 0
GeneralMills CookieCrisp 1 1,449 42 23 21 16
GeneralMills Reese’sPuffs 2(1) 928 12 23 0 0
Kellogg AppleJacks 2(1) 925 33 40 33 15
Kellogg RiceKrispies 1 784 148 34 46 11
GeneralMills BooBerry 1(1) 484 23 38 16 82
Kellogg FrostedMini-Wheats 1(1) 481 24 36 10 11
Quaker Life 2 477 81 26 9 14
Post WaffleCrisp 1 292 11 31 2 0
GeneralMills CinnamonToastCrunch 3 262 129 65 35 42
Post Honeycomb 1 197 52 24 0 0
Post AlphaBits 1 59 6 25 0 0
Kellogg CornPops 1 37 67 41 19 29
*Forbrandswithmorethan20groups,includesresultsforthefirst20qualifiedgroupsreviewed

Cereal FACTS 49
150 members each in the groups examined. Cereal brands were less represented in MySpace groups; however Lucky Charms and Cheerios each had approximately 200 groups with an average of 50 members per group. We cannot determine how much of the cereal presence in these groups is promoted or sponsored by the cereal companies; however, they do represent a significant source of viral marketing for the cereal brands.
In contrast, cereal company presence on Twitter was small. Post had no discernable presence. The only user from Kellogg was identified as their United Kingdom press office, and a Foodservice Operator Specialist was the sole representative of General Mills. Quaker did have a regularly updated presence, with users identifying as the company’s PR team and company president.
Internet marketing overviewIn summary, the majority of brands that advertise directly to children on television also maintain an extensive child-targeted marketing presence on the internet. Millsberry.com and Postopia.com are among the largest youth-targeted websites on the internet and the average young visitor spends 60 and 30 minutes (respectively) interacting with branded content on these sites each month. Kellogg’s child-targeted websites (AppleJacks.com, FrootLoops.com, CornPops.com and FrostedFlakes.com) and the smaller General Mills websites (ReesesPuffs.com and CookieCrisp.com) have lower traffic and usage, but still generate enough visitors to appear among the most often viewed websites in comScore. Only three websites (FrostedMiniWheats.com, Cheerios.com and Chex.com) included child-targeted web pages that did not promote cereals with high sugar content. However, these pages were contained within an adult-targeted website and did not generate enough visitors to measure exposure in comScore.
All the brands marketed heavily to children on the internet had poor NPI scores of 46 or lower. Six of the ten brands marketed most heavily on the internet also appear on the top ten lists for brands with the most television advertising to children and the poorest nutrition scores: General Mills Trix, Lucky Charms, and Reese’s Puffs; Post Fruity and Cocoa Pebbles; and Kellogg Froot Loops and Corn Pops (see Figure 9).
The highly engaging and entertaining content that appears in these child-targeted cereal websites explains their popularity. Virtually all pages within the sites promote at least one child brand; therefore, these websites serve as powerful marketing devices. As found in television advertising, these sites represent cereal products primarily as toys or playthings and attempt to associate the featured products with fun and, in some cases, good health. Only one site (General Mills’ Choosebreakfast.com) provided accurate health or nutrition information to children.
General Mills and Kellogg also use banner advertising extensively to direct children to their child-targeted websites. These banner ads are highly engaging promotional devices designed to grab children’s attention. Even when children do not click through to the cereal website, banner ads provide another form of brand advertising to increase affinity and desire for the advertised cereals.32 Almost three-quarters of these banner ads appeared on only four web publishers’ sites: Gorilla Nation Kids (including Millsberry.com), Viacom (including Nick.com and Neopets.com), CartoonNetwork.com and Disney Online.
Reliable outside data sources are not yet available to track social media marketing; however, our survey of cereal presence on Facebook and MySpace demonstrates considerable viral marketing activity for many of these brands in social media, including company-sponsored pages such as Facebook fan pages.
In-store marketing
The supermarket environment also provides a powerful marketing tool for cereal companies to target young people. In 2006, they spent $14.3 million on packaging and in-store marketing to reach children and adolescents at the point of sale, or 6.0% of their youth-targeted marketing expenses (second only to television advertising).33 In addition, cereal companies spent $56.3 million, or 24.6% of their youth marketing budgets, on premiums and other traditional types of promotions (e.g., cross-licensing agreements with third parties and celebrity endorsements) that appear prominently on product packaging.
Results
Lowest Nutrition Scores: 34 Reese’s Puffs 36 Corn Pops 36 Lucky Charms36 GoldenGrahams37 Cap’nCrunch37 CinnamonToastCrunch 38 Fruity and Cocoa Pebbles38 Smorz38 Froot Loops 38 Trix
Most Television Advertising: 1 CinnamonToastCrunch 2 HoneyNutCheerios 3 Lucky Charms 4 CocoaPuffs 5 Trix 6 FrostedFlakes 7 Fruity and Cocoa Pebbles 8 Reese’s Puffs 9 Corn Pops 10 Froot Loops
Most Internet Marketing: 1 Trix 2 Lucky Charms 3 HoneyNutCheerios 4 Fruity and Cocoa Pebbles 5 Honeycomb 6 Reese’s Puffs 7 AppleJacks 8 Froot Loops 9 Corn Pops 10 FrostedFlakes
Figure 9. Brands scoring lowest in nutrition and marketed most to children on television and the internet

Cereal FACTS 50
In-store marketing also reaches parents at the crucial time they make their final purchase decision. Techniques such as price promotions, special displays and health messages on the box convey subtle cues that encourage impulsive purchase behaviors34 as well as influence the relative value of products as they choose between different alternatives.35, 36 We examined three of the most commonly used in-store marketing tools in our analysis: shelf space allocation and placement, in-store displays and promotions, and product packaging (including child engagement and health messages).
Supermarket shelf space allocation and placement
During our supermarket audits, coders recorded the number of facings and shelf placement for 277 cereals. Approximately 50% of the cereal aisle (including the main cereal and natural food aisles) was devoted to child and family brands. As found in the advertising spending analysis, the top four cereal companies (General Mills, Kellogg, Post and Quaker) also dominated the shelf, with 70% of all facings devoted to their brands. Store brands received 18% of the shelf, and less than 13% was allocated to all other companies combined. Kellogg had the highest share of shelf with over 28% of all supermarket cereal facings. The distribution of shelf space was even more skewed when examining child and family brands only, with 94% allocated to the top four companies. Cereals from these companies, as well as Kashi brands, were stocked in virtually all supermarkets, while the smaller brands were stocked in 70% of supermarkets or fewer. Ranking Table 6 presents shelf space allocation and ranking for all child and family brands.
A comparison of shelf space allocation to percent of total advertising spending by company for child and family brands reveals that General Mills outspent its competitors on advertising relative to its presence in the supermarket (see Figure 10). Advertising spending by General Mills was 58% of total spending for child and family brands, far more than its 43% share of the supermarket shelf for these brands.
Kellogg’s shares of spending and shelf space were both approximately one-third; whereas Quaker and Post spent far less on advertising relative to their share of the shelf. These numbers indicate that General Mills relies heavily on brand awareness and image to drive sales of its child and family brands in the supermarket.
The middle shelf is the most coveted location in the supermarket as products stocked here appear at eye-level for most adults, as well as for children sitting in a shopping cart. Sales are highest for products with the most shelf space
Results
Definitions Supermarket shelf space allocation
Facing Anypackagefrontfacingthe customer,includingboxes physicallytouchingtheshelfand anystackedontop.
Middleshelf Themostprominentlocationon thesupermarketshelf.Products placedonthemiddleshelf appearateye-levelformost shoppers,includingchildren sittingintheshoppingcart.
GeneralMills
Kellogg Quaker Post0%
10%
20%
30%
40%
50%
60%
■Share of Advertising Spending
■Share of Shelf Space
Figure 10. Relative share of advertising and shelf space for child and family brands
Supermarket shelf space allocation

Cereal FACTS 51
% of stores stocking Company Cereal on middle shelves** % of stores stocking Kellogg FrostedMini-WheatsMaple&BrownSugar 88.3% 79.3%Kellogg FrostedMini-WheatsStrawberryDelight 87.2% 93.8%Kellogg FrostedMini-WheatsBlueberryMuffin 86.6% 89.5%GeneralMills CookieCrisp 83.2% 93.8%
CascadianFarm PurelyO’s 81.3% 30.8%
Quaker CinnamonLife 80.0% 94.0%
Kellogg CookieCrunch 80.0% 32.5%
Kellogg FrostedMini-WheatsCinnamonStreusel 79.7% 71.5%
GeneralMills Reese’sPuffs 79.5% 93.0%
GeneralMills CocoaPuffsCombos 79.1% 71.8%
GeneralMills Trix 78.9% 94.0%
Kellogg Mini-WheatsLittleBitesChocolate 78.8% 79.5%
GeneralMills CocoaPuffs 78.7% 96.0%
Kellogg Mini-WheatsLittleBitesHoneyNut 77.9% 79.3%
Kellogg CocoaKrispies 77.7% 89.8%
GeneralMills CinnamonToastCrunch 77.1% 95.3%
Barbara’sBakery Puffins 76.9% 56.3%
*Rankingbasedoncerealsfoundinover25%ofstores**Percentagebasedonstoresthatstockedthecereal
Table 18. Cereals most often stocked on the middle shelves in the supermarket.*
and those that are stocked on the middle shelf, compared to those located on the lowest and highest shelves. Therefore, shelf location provides another in-store marketing strategy for companies to increase sales of their products. Table 18 lists all the top child and family brands found on the middle shelf of 50% or more of the stores in which they were stocked (including only products stocked in more than 25% of stores). Kellogg and General Mills dominate the middle
shelf. Eight Kellogg cereals were prominently featured on the middle shelf, including six Mini-Wheats cereals. General Mills featured six cereals prominently on the middle shelf, including five of their child brands (Reese’s Puffs, Cocoa Puffs, Cookie Crisp, Trix and Cinnamon Toast Crunch). Only one Quaker cereal (Life) and no Post cereals appeared prominently on the middle shelf.
Results
In-store displays and promotions
Definitions In-store displays and promotions
In-storedisplay Additionallocation(s)inastore,asidefromthecerealaisleshelves,wherecerealsarelocatedfor purchase;includesin-aisleandend-capdisplays.
In-storepromotion Anymarketingmaterial,asidefromproductpackaging,locatedwithinastore;includesshelfcoupon machines,specialpricesignage,andshelfdanglers(primarilyshort-termpricingpromotions).
Designed to generate a limited time sales boost, special promotions and displays for cereal products appeared frequently in the supermarket during the 4-week period of our audit (see Table 19). Nearly 100% of stores offered some
type of promotion for child, family and adult cereals; but child and family brands were more likely to appear in special displays. Kellogg used in-store marketing more often than other companies: 75% of stores had additional displays for

Cereal FACTS 52
Kellogg cereals and 100% had Kellogg promotions. General Mills was close behind with in-store displays in 68% of stores and promotions in 92%. The smaller cereal companies had the lowest in-store marketing presence.
Ranking Table 7 presents the ranking of in-store marketing programs by child and family brands. Kellogg used in-store marketing extensively for its child brands. Over the four weeks we examined, Frosted Flakes, Froot Loops, Corn Pops and Apple Jacks each had 3 to 4 promotions in over 75% of supermarkets and 2 displays each in 45% or more of supermarkets. Regular Cheerios was the only
General Mills child or family cereal with displays in over 50% of stores; however, Cinnamon Toast Crunch, Honey Nut Cheerios, Golden Grahams and Cocoa Puffs were featured in promotions in more than 65% of stores. In contrast, Kashi, Cascadian Farm, Barbara’s Bakery, Nature’s Path and Annie’s cereals had virtually no in-store displays and were featured in promotions in 25% or less of all stores.
Results
In-store end cap display
In-store promotion: Coupon machine
# of brands # of cereals Stores with in-store displays Stores with in-store promotions
By Cereal Target
ChildCereals 19 47 83.9% 100.0%
FamilyCereals 27 71 82.8% 97.7%
AdultCereals 69 159 70.1% 98.9%
By Company
Kellogg 25 70 74.7% 100.0%
GeneralMills 24 60 67.8% 92.0%
Post 12 39 40.2% 81.6%
Quaker 5 13 43.7% 78.2%
Kashi 15 23 21.8% 72.4%
CascadianFarm 10 13 10.3% 44.8%
Nature’sPath 10 19 9.2% 33.3%
Barbara’sBakery 6 14 5.7% 26.4%
Annie’s 1 5 0.0% 5.8%
Table 19. In-store marketing by child, family and adult brands and company.
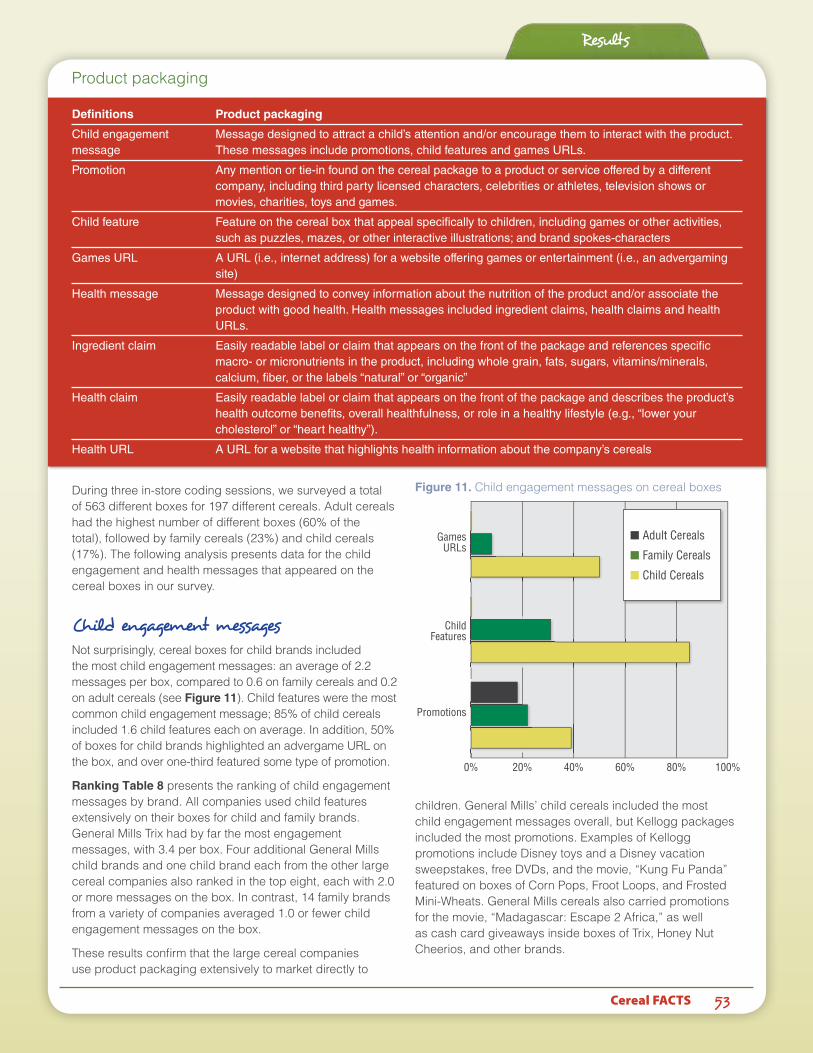
Cereal FACTS 53
Product packaging
Results
Definitions Product packaging
Childengagement Messagedesignedtoattractachild’sattentionand/orencouragethemtointeractwiththeproduct.message Thesemessagesincludepromotions,childfeaturesandgamesURLs.
Promotion Anymentionortie-infoundonthecerealpackagetoaproductorserviceofferedbyadifferent company,includingthirdpartylicensedcharacters,celebritiesorathletes,televisionshowsor movies,charities,toysandgames.
Childfeature Featureonthecerealboxthatappealspecificallytochildren,includinggamesorotheractivities, suchaspuzzles,mazes,orotherinteractiveillustrations;andbrandspokes-characters
GamesURL AURL(i.e.,internetaddress)forawebsiteofferinggamesorentertainment(i.e.,anadvergaming site)
Healthmessage Messagedesignedtoconveyinformationaboutthenutritionoftheproductand/orassociatethe productwithgoodhealth.Healthmessagesincludedingredientclaims,healthclaimsandhealth URLs.
Ingredientclaim Easilyreadablelabelorclaimthatappearsonthefrontofthepackageandreferencesspecific macro-ormicronutrientsintheproduct,includingwholegrain,fats,sugars,vitamins/minerals, calcium,fiber,orthelabels“natural”or“organic”
Healthclaim Easilyreadablelabelorclaimthatappearsonthefrontofthepackageanddescribestheproduct’s healthoutcomebenefits,overallhealthfulness,orroleinahealthylifestyle(e.g.,“loweryour cholesterol”or“hearthealthy”).
HealthURL AURLforawebsitethathighlightshealthinformationaboutthecompany’scereals
During three in-store coding sessions, we surveyed a total of 563 different boxes for 197 different cereals. Adult cereals had the highest number of different boxes (60% of the total), followed by family cereals (23%) and child cereals (17%). The following analysis presents data for the child engagement and health messages that appeared on the cereal boxes in our survey.
Child engagement messages
Not surprisingly, cereal boxes for child brands included the most child engagement messages: an average of 2.2 messages per box, compared to 0.6 on family cereals and 0.2 on adult cereals (see Figure 11). Child features were the most common child engagement message; 85% of child cereals included 1.6 child features each on average. In addition, 50% of boxes for child brands highlighted an advergame URL on the box, and over one-third featured some type of promotion.
Ranking Table 8 presents the ranking of child engagement messages by brand. All companies used child features extensively on their boxes for child and family brands. General Mills Trix had by far the most engagement messages, with 3.4 per box. Four additional General Mills child brands and one child brand each from the other large cereal companies also ranked in the top eight, each with 2.0 or more messages on the box. In contrast, 14 family brands from a variety of companies averaged 1.0 or fewer child engagement messages on the box.
These results confirm that the large cereal companies use product packaging extensively to market directly to
children. General Mills’ child cereals included the most child engagement messages overall, but Kellogg packages included the most promotions. Examples of Kellogg promotions include Disney toys and a Disney vacation sweepstakes, free DVDs, and the movie, “Kung Fu Panda” featured on boxes of Corn Pops, Froot Loops, and Frosted Mini-Wheats. General Mills cereals also carried promotions for the movie, “Madagascar: Escape 2 Africa,” as well as cash card giveaways inside boxes of Trix, Honey Nut Cheerios, and other brands.
GamesURLs
ChildFeatures
Promotions
0% 20% 40% 60% 80% 100%
■Adult Cereals
■Family Cereals
■Child Cereals
Figure 11. Child engagement messages on cereal boxes

Cereal FACTS 54
General Mills, Post and Quaker all promote their gaming websites extensively on packaging for child brands. The Postopia.com website URL appeared on 75% of Post boxes. Both General Mills and Quaker also featured a games URL on 40 to 50% of boxes; whereas Kellogg featured a games URL on only 12% of boxes, all for websites specific to the brand (e.g. AppleJacks.com on boxes of Apple Jacks).
Health messages
Health messages were also featured prominently on cereal boxes for child, family and adult brands. These messages appeared more often on family brands: on average, 2.4 messages per box for family brands, compared to 1.8 on child brands and 1.9 on adult brands (see Table 20). Ingredient claims made up the majority of health messages on the box, with an average of 2.0 claims appearing on two-thirds or more of all boxes. Approximately half of all boxes for child and family brands also included a health URL. Health
claims appeared on 15% of family and adult cereal boxes and only 7% of child cereal boxes.
Ranking Table 9 presents rankings of health messages by brand. Two natural food brands featured the most health messages on their boxes: Organic Wild Puffs from Barbara’s Bakery and Annie’s Bunnies had 5.0 and 4.2 claims each. Among the large cereal companies, boxes for General Mills’ child and family cereals were again the most crowded with health messages. Virtually all their boxes (98%) boasted two or more claims, and 89% included a health URL. All boxes for General Mills child cereals made ingredient claims, with an average of 2.1 per box, including “calcium and vitamin D” and “whole grain guaranteed”. Post and Quaker also featured ingredient claims on 42% to 50% of boxes, with an average of 2.2 and 1.6 claims each. Quaker boxes featured the most health claims, found on 39% of boxes.
General Mills’ child and family cereals do not score higher than brands from other large cereal companies in overall
Free camera and Disney vacation promotion
Movie promotion, ingredient and health claims
Win cash promotion and ingredient claims
Results
Ingredient claims Health claims Health URLs
% of boxes # per box % of boxes # per box % of boxes
Childcereals 64% 2.0 7% 1.3 46%
Familycereals 79% 2.3 15% 1.0 46%
Adultcereals 79% 2.0 15% 1.1 19%
Child and family cereals by company
GeneralMills 98% 2.1 17% 1.1 89%
Kellogg 28% 1.3 2% 1.0 28%
Post 42% 2.2 8% 1.0 8%
Quaker 50% 1.6 39% 1.0 0%
Others 98% 2.8 3% 1.0 0%
Table 20. Health messages on cereal boxes

Cereal FACTS 55
nutrition quality; however, the number of health claims on their boxes likely gives consumers that inaccurate impression. For instance, a box of General Mills’ Strawberry Chex featured ingredient claims for whole grain, low sugar, calcium, vitamins and minerals, and natural flavoring; in contrast, boxes of Quaker Life, which received a higher nutrition score, mentioned only whole grain, and Kellogg Frosted Flakes, with an identical nutrition score, featured no health messages at all.
In-store marketing overviewThese data confirm that the large cereal companies place considerable resources behind in-store marketing and packaging to drive purchase of their child and family cereals. Child and family cereals comprise approximately one-half of the shelf space in the cereal aisle; but they are more likely to be stocked on the prime middle shelf and are disproportionately marketed with special in-store displays and promotions. In addition, the cereal box is crowded
with child engagement and health messages to attract the attention of both children and parents. The average box of cereal from one of the large companies contains 1.4 child engagement and 2.0 health messages each.
The in-store marketing analysis also reveals significant differences in marketing strategies of the major cereal companies. Whereas General Mills spends a disproportionate amount on advertising its child and family brands on television and has developed a significant child-targeted presence on the internet, Kellogg stands out in the supermarket with the most special displays and promotions. All four large cereal companies use child engagement messages extensively (averaging between 1.2 and 2.0 per box), but General Mills appears to speak to parents directly on their boxes as well, with an average of 3.2 health messages per box, including on their least nutritious child brands. Kellogg also includes the most promotions on its cereal boxes and Post highlights its gaming website most extensively.
Results
Definitions FACTS Index
FACTSindex Providesonescorethatcombinesbothnutritionqualityandmarketingexposurescoreforeach brand.Scoresrangefrom0(worst)to100(best).
Marketingexposure Combinedscoreforexposuretocerealmarketing,includingyouthmarketingexposure(70%ofcomponent total),adultandothermediaexposure(15%)andin-storeexposure(15%).Thisscorerangesfrom0 (lowest)to100(highest).
Nutritionmultiplier Positiveornegativemeasureofoverallnutritionquality.DerivedfromtheNutritionProfilingIndex (NPI)scoreusingacut-offofover62toidentifyhealthyfoods.
Cereal FACTS Index
The Cereal FACTS Index consolidates the nutrition and marketing information presented in this report into one overall score for each child and family brand. This score provides a means to quantify and compare the overall nutrition quality and marketing practices for brands that promote their cereals to children and parents. In addition, it provides a measure to monitor and assess changes in cereal marketing practices and nutrition quality in the future.
Of the 43 child and family brands in our analysis, 19 had no advertising spending and low supermarket presence during the period we examined. Therefore, we could not assign a marketing score to these brands. They are listed on Table 21 in order of overall nutrition.
Ranking Table 10 provides the brand ranking by FACTS Index and lists the marketing exposure score and nutrition multiplier used to calculate the combined score. This ranking includes the 24 brands with advertising or a moderate to high supermarket presence.
Only Kellogg Mini-Wheats received a healthy nutrition rating; therefore, it is the only brand to receive a high combined score. Three additional brands received scores over 60
(Life, Chex and Cap’n Crunch). Although these brands had poor to good overall nutrition quality, they scored relatively high on the Index due to low marketing exposure numbers. These brands demonstrate that products of low nutritional quality can improve their overall scores by reducing marketing, especially to young people. The middle range of brands in the ranking achieved scores over 50 for one of two reasons: they had either somewhat better nutrition scores (e.g., Cheerios or Honeycomb) or somewhat lower marketing exposure numbers (e.g., Cookie Crisp or Apple Jacks).
The FACTS Index clearly highlights the ten worst offenders. These brands all market extensively to children and parents, and all have low nutrition scores. The six worst brands belong to General Mills: Lucky Charms, Cinnamon Toast Crunch, Honey Nut Cheerios, Trix, Reeses’s Puffs and Cocoa Puffs. Post follows with their Fruity and Cocoa Pebbles brand. Finally, Kellogg Frosted Flakes, Corn Pops and Froot Loops complete the worst offenders list. As demonstrated throughout this report, these least healthy cereals market directly to children in high volumes on television, the internet and in the supermarket.

Cereal FACTS 56
Table 21. Child and family cereals with no significant marketing activity
Results
Figure 12: Cereal FACTS worst offenders.
Nutrition Profiling Index(NPI) Score Company Cereal
58 Barbara'sBakery OrganicWildPuffs
56 Kashi MightyBites
56 Kashi HoneySunshine
54 CascadianFarm CliffordCrunch
54 Kellogg HannahMontanaCereal
53 GeneralMills Kix
51 Barbara'sBakery Puffins
51 Annie’s Bunnies
51 Nature'sPath EnviroKidzOrganic
50 GeneralMills DoratheExplorer
50 CascadianFarm CinnamonCrunch
48 Post RaisinBran
46 CascadianFarm PurelyO's
46 Post AlphaBits
46 Post GoldenCrisp
46 Kellogg HoneySmacks
44 Kellogg MINI-Swirlz
44 Post WaffleCrisp
44 CascadianFarm HoneyNutO's
42 Kellogg DisneyHighSchoolMusical
40 Kellogg CookieCrunch
38 GeneralMills CountChocula
38 Kellogg Smorz
36 GeneralMills GoldenGrahamsWorse
Better

Cereal FACTS 57
Discussion
The bottom-line finding of this report is not new; cereal companies aggressively market their least nutritious cereals directly to children.
Almost 40 years ago, Robert Choate, a self-described “citizen lobbyist,” testified at a 1970 hearing of a United States Senate Commerce Subcommittee that cereal companies deliberately use every tactic possible to sell cereals with no redeeming nutritional value to children.1 He concluded that most breakfast cereals were no healthier than “candy bars or gin.” Mr. Choate testified again in 1972 with research showing that many children’s breakfast cereals would not support life, even when supplemented with a "complete" vitamin and mineral mixture.2 These cereals included such still-popular varieties as Apple Jacks, Trix and Sugar Pops (now called Corn Pops). Mr. Choate also addressed the use of premiums, toy tie-ins, and hero testimonials in selling food to children. He concluded that food marketing to children is in no way based on the nutritional value of foods, and takes unfair advantage of child psychology and lack of nutritional knowledge.
The cereal industry responded by criticizing Mr. Choate and his methods and claiming that large amounts of sugar were required to tempt children to eat.3 Within three years, most children’s breakfast cereals had been reformulated to add vitamins and minerals while maintaining their high sugar content.4
What has changed today is the growing health crisis caused by alarming rates of overweight young people in the U.S. and around the world. Today more than one-third of children and adolescents in the United States are overweight or obese: triple the rates seen in 1970.5 As a result, they may be the first generation to live a shorter life than their parents.6 Health authorities have pointed to the extensive marketing for foods high in sugar, fat and sodium directed at youth as contributing to the crisis.7-9
The United States food industry has responded to these concerns with the Children’s Food and Beverage Advertising Initiative (CFBAI) through which companies have pledged to reduce the marketing of unhealthy products to children.10 The question is whether industry’s self-regulatory efforts such as the CFBAI are good faith efforts to create real change or a public relations tool meant to offset criticism and forestall government action.11
The purpose of this report is to provide an independent science-based evaluation of cereal company marketing to children and adolescents in 2008 and early 2009: the period just prior to and immediately following full implementation of cereal company CFBAI pledges. We openly present our methods, data and analysis and invite feedback to make the information as valid and accurate as possible. Our aim is to provide a tool to assess the impact of company pledges on actual marketing practices and evaluate future changes as they occur.
The following discussion summarizes our findings and provides recommendations for future actions to reduce the harm associated with the substantial amounts of marketing for cereal products of poor nutritional quality that young people encounter daily.
The better newsWe undertook this research to document both the good and bad of cereal company marketing practices, and we did find some positive news.
Nutrition quality
All cereal companies have healthier products in their portfolios that they could choose to market to children. Although Kellogg Mini-Wheats was the only family brand to score over 62 (i.e., the NPI cut-off score established in the United Kingdom to identify healthy foods that can be advertised to children), several child and family brands do have good overall NPI scores of 50 or higher. For example, many of General Mills’ varieties of Cheerios and Kix, as well as Quaker Life, all scored in the 50s for overall nutrition quality. Several of General Mills’ Cascadian Farm and Kellogg’s Kashi family cereals also received scores over 50, as well as the majority of cereals offered by smaller companies, including Barbara’s Bakery, Annie’s and Nature’s Path. These cereals could be reformulated to improve their nutrition score and meet the United Kingdom nutrient standard for advertising to children.
Unfortunately, the large cereal companies have chosen to market only their least healthy cereals to children directly. Child cereals (i.e., those marketed directly to children) scored an average 42 NPI score for overall nutrition quality, significantly lower than the 50 average score for family cereals and 58 for adult cereals. In addition, compared to adult cereals, child cereals contain 85% more sugar, 65% less fiber and 60% more sodium. Children rarely see marketing for the more nutritious cereals that companies promote to parents as good for children and/or families.
In another potentially positive development, we found that the large companies reformulated almost two-thirds of their child and family cereals from 2006 through May 31, 2009; but these reformulations improved overall nutrition scores by only 4 to 5% on average. The majority of changes involved reducing sugar content from previous levels of 13 to 15 g per serving down to 12 g (i.e., the limit set by most companies in their CFBAI pledges). The net effect of this change was to reduce sugar from 3 ½ tsp per serving to 3 tsp per serving; several child cereals continue to contain 12 g of sugar in one 28 g serving, or 43% of their total content. A few cereals did significantly increase their fiber content to improve scores by 14% or more (including Quaker Cap’n Crunch, Post Fruity and Cocoa Pebbles and, more recently, Kellogg Apple Jacks

Cereal FACTS 58
and Froot Loops). These cereals continue to score poorly, however, due to high sugar content.
Cereal companies might argue that they would alienate loyal customers by making abrupt changes to improve the nutrition quality of existing cereals. Therefore, we also examined the nutrition quality of new cereal introductions and other cereal branded products (e.g., cereal “straws” and bars) introduced after 2006. Here again, we did find some good news. The seven new cereals introduced by Quaker and the smaller companies averaged a good NPI score of 56. In contrast, the new products introduced by General Mills, Kellogg and Post all averaged lower NPI scores when compared to their existing cereals in 2006. These findings suggest that the large cereal companies have not taken meaningful steps to improve the overall nutrition quality of their cereal product portfolios.
Marketing practices
We found even fewer positive developments in cereal company marketing practices, and again, much of the better news is tempered by qualifications. For example, Quaker did not advertise its Cap’n Crunch brand at all in 2008 or early 2009; this is good news as Cap’n Crunch falls near the bottom of all cereals in nutrition quality and had been advertised heavily in the past. PepsiCo (the parent company of Quaker) can be applauded for making such a substantial move. However, in April 2009, Quaker launched a new highly interactive Cap’n Crunch website targeting children with advergames and other branded content at “Crunch Island” (www.capncrunch.com). The website is now promoted on Cap’n Crunch cereal boxes and includes features that must be “unlocked” by codes found on the boxes. A few additional brands with low nutrition scores that had been advertised to children in the past also had no advertising during the period we examined, including General Mills Count Chocula and Golden Grahams and Kellogg Honey Smacks and Smorz. These cereals continue to appear on shelves in the majority of supermarkets, however; and we documented in-store marketing for all of them.
General Mills in particular makes numerous ingredient and health claims for all of its cereals, including those of poor nutritional quality. Boxes of Reese’s Puffs (the brand with the worst nutrition score), Lucky Charms and Cookie Crisp, for example, contain an average of three to four claims each. General Mills has also invested considerable marketing resources behind its “whole grain guarantee” and, together with the “calcium and Vitamin D” banner that appears on most of its child cereals, may create an unwarranted healthy product impression. We believe that the other large cereal companies should be commended for restraining from this potentially misleading practice, although in June 2009, Kellogg introduced the claim that Rice and Cocoa Krispies help support children’s immunity due to the vitamins and
minerals they contain. Although their lawyers support the accuracy of this claim,12 it is an open question whether these messages accurately communicate the overall nutrition quality of these cereals.
The bad news Cereal companies continue to target children with products of poor nutritional quality. Not one brand marketed directly to children achieves an NPI score higher than 62, the score required to advertise to children on television in the United Kingdom, and more than one-third score 40 or below. In addition, sugar comprises one-third or more of the content of the average child cereal; only one child cereal (Cascadian Farm Clifford Crunch) has a sugar content below 22% and would be allowed to be included in the USDA WIC food package for low income mothers and children. Finally, 42% of child cereals contain artificial food dyes; these dyes have come under increasing scrutiny for possible links to hyperactivity in children.13 Truly nutritious foods, quite literally, pale in comparison.
Young people’s exposure to cereal marketing
Cereal companies also continue to aggressively market many of these nutritionally poor products to children. During the time period included in our exposure analyses (January 1, 2008 to March 31, 2009), only 14 of the 19 child cereals advertised their products, but they spent over $156 million in 2008 to do so. General Mills spent by far the most on its seven brands ($107 million in total), followed by Kellogg (with four brands) and Post (with two brands). Quaker spent the least (under $200,000). (See Figure 12)
The majority of this advertising occurred on television. The average child in the U.S. sees over 500 television ads for child cereals every year: almost 7,000 in total by the time they are 18 years old. It is hard to imagine that these persistent messages do not impact children’s attitudes and beliefs about nutrition and foods that are appropriate to eat for breakfast. It would be difficult to quantify the number of times a parent would have to say “no” in response to this advertising barrage if he or she did not wish to serve these cereals.
General Mills and Kellogg have pledged that they will not advertise during programming predominately viewed by preschoolers;14, 15 however, the average 2- to 5-year-old also viewed over 500 television ads for child cereals in 2008, 89% of them for General Mills and Kellogg products. In total, preschoolers viewed 642 ads for all types of cereals (including family, adult and company-level ads). We do not suggest that General Mills and Kellogg have not complied with their pledges. In fact, we know of no television programming that is predominately viewed by
Discussion

Cereal FACTS 59
preschoolers that would accept their advertising. However, this example clearly illustrates that it is not enough to refrain from advertising on preschool television shows; preschoolers are also exposed to advertising on the shows that older children watch. To protect these very young children, companies must use objective measures of actual exposure to advertising to guide their marketing practices.
This finding about high levels of exposure to cereal advertising by very young children is disturbing. Children of this age cannot comprehend the persuasive intent of advertising and, therefore, have no cognitive ability to defend against advertising messages.16, 17 In fact, both the American Psychological Association18 and the American Academy of Pediatrics19 have recommended bans on any form of advertising to children under the age of 7 or 8 years. These numbers also illustrate the importance that cereal companies have placed on reaching children as early as possible, before they are capable of critically evaluating the messages communicated in the advertising.
Finally, children’s exposure to marketing on the internet is extraordinary. At Millsberry.com alone, an average of 767,000 young people visited 2.8 times per month and stayed on the website for 23.7 minutes each time. As nearly all pages contained branded content for General Mills cereals (including Trix, Lucky Charms and Honey Nut Cheerios), this exposure is equivalent to more than 66 minutes of advertising, or 133 :30 second ads, per month. These numbers confirm fears of public health advocates that the internet provides a means for companies to market their products to children with virtually no restrictions.20, 21 Postopia.com, Post’s website that prominently features marketing for Fruity and Cocoa Pebbles and Honeycomb cereals, is also visited by 265,000
young people who spend over 30 minutes at the site each month. Smaller child-targeted websites for Apple Jacks, Froot Loops, Reese’s Puffs, Corn Pops, Frosted Flakes and Cookie Crisp also attract up to 80,000 young people each month with entertaining branded content.
Messages used in marketing for children’s cereals
In addition to documenting young people’s exposure to cereal marketing, we also quantified the messages commonly conveyed in cereal marketing. This message was surprisingly consistent across all brands that market to children directly and across all forms of marketing: these cereals are fun and entertaining. These themes have been documented in previous content analyses of children’s television food advertising;22-24 however, we demonstrate that the same message also predominates on cereal company websites, banner advertising that directs young people to these websites, and on the cereal boxes themselves. The average child cereal box contains 2.2 child engagement messages, including games and puzzles, brand spokes-characters, promotions and directions to an advergame URL.
Consumer behavior and psychology researchers have demonstrated how repeated associations between a product and positive emotions (e.g., fun and entertainment) transfers to positive feelings and attitudes about the product itself.25, 26 In addition, this research shows that attitudes formed through these types of implicit processes become extraordinarily difficult to override. Marketers have described these emotional appeals targeted to children as “brand imprinting,” or creating “product identities that penetrate our limbic brain.”27
Related to marketing appeals that associate child brands with positive emotions, we also document how brands typically represent their products in marketing to children. Marketing for child cereals consistently communicates that these products have very little in common with real food. On television and the internet, cereals have magical powers, transform into amusement park rides or game pieces, or become playmates in exciting adventures. Even advertising that promotes actual features of the product to children typically describes its fun shape or color, not its food-related characteristics. These messages further reinforce associations between children’s cereals and positive emotions that will remain through adolescence and beyond. It is therefore not surprising that Froot Loops, Frosted Flakes, Lucky Charms and Cocoa Puffs all have more than 10,000 fans on Facebook, a popular social media site for teens.
Parents and cereal company marketing
We hope that our research provides parents with useful information about the breakfast cereals their children ask
Discussion
Figure 12. Advertising spending on child brands in 2008
©The Nielsen Company
$0General Mills Kellogg Post Quaker
$20
$40
$60
$80
$100
$120

Cereal FACTS 60
for, as well as those they choose to purchase. This research highlights two key findings that we believe will be most important to parents. The first is the extraordinary efforts that cereal companies take to communicate directly to their children, often without parents’ knowledge. The second is the extent to which many cereal companies use nutrition and health claims as a marketing tool and how these claims often have no relationship to the actual nutrition quality of the products.
In 2008, we conducted a public opinion poll to ask parents about food marketing to children, and we found that parents were not aware of how much food marketing their children view.28 Parents did know that cereals are marketed to their children relatively more often than other types of foods. Cereal is the second most widely advertised food category to children (behind fast food);29, 30 and in our poll, parents believed that cereals placed third, behind fast food and soft drinks. However, parents were not aware of the overall volume of food advertising to which their children were exposed. For example, they believed that their children saw only one to three television advertisements per day for all types of foods; whereas children see almost two ads per day for cereals alone. This gap is not surprising as our research also shows that children view over five times as many ads for child cereals as do adults (including the time they spent viewing with their child).
Marketing that occurs on the internet appears to be the least well understood by parents. In our poll, parents believed that their children saw food advertising on the internet less than once per week. Similarly, another poll of parents and children showed that parents believed their children spent two hours per month online, whereas children reported spending 20 hours online per month.31 We too were surprised by the level of marketing that occurs on cereal company websites and the amount of advertising placed on other children’s websites (e.g., Nickelodeon.com, CartoonNetwork.com and DisneyOnline.com) to direct children to cereal websites. We hope these findings will help parents better understand how to protect their children against unwanted marketing influence.
In addition to marketing directly to children, cereal companies also market to parents on television and at the supermarket. We did find that the large cereal companies used different strategies to convince parents to buy child and family cereals. Kellogg and Quaker marketed to parents directly on television with emotional messages about family bonding (Rice and Cocoa Krispies and Life) and claims that the cereal will help their child do well in school (Mini-Wheats); however, none of the other brands advertised to parents directly with messages about feeding their children.
Child brands also invest considerable amounts of marketing to reach parents in the supermarket. Kellogg used special displays and in-store promotions somewhat more often than
other companies, averaging 33.3 promotions per store and 9.5 special displays over the 4-week period examined. In contrast, General Mills relied more on nutrition and health claims on the box to appeal to parents, averaging 3.0 claims per box on all their child and family cereals. Unfortunately, these claims had little relationship to the actual nutrition quality of these cereals: the most claims were found on their least healthy cereals (including 3.8 on Lucky Charms boxes, 3.5 on Golden Grahams, and 3.3. on Reese’s Puffs). In contrast, Quaker cereals had 1.2 claims per box, Post had 1.1 and Kellogg had 0.7.
It appears, then, that cereal company pledges to reduce unhealthy marketing to children have had little real impact on their actual marketing practices. General Mills, Kellogg and Post continue to aggressively market their least nutritious cereals directly to children on television, the internet and product packaging. In addition, health messages and promotions in the supermarket provide an added push to encourage parents to purchase the cereals that these companies persuade their children to ask for.
RecommendationsWe found no evidence that cereal companies were not in full compliance with their CFBAI pledges. And yet, we also found no evidence that cereal marketing to children or the nutrition quality of the cereals marketed has improved.
Cereals can provide a convenient, economical and nutritious breakfast option for children, and all the cereal companies do have healthier products that could be marketed to children. Unfortunately, the large cereal companies have instead chosen to market only their least nutritious products directly to children. These cereals all meet industry-defined “better-for-you” standards, and therefore, cereal companies comply with their CFBAI pledges while continuing to market to children with virtually no restrictions. Much stronger action is needed to protect young people from the unhealthy influence of cereal and other forms of food marketing.
An industry suffering from negative public relations and the specter of government intervention engages in a predictable set of responses, among them the launch of self-regulatory actions. Typically positioned as an effort to benefit the public good, industry argues that it can police itself and hence no government measures are necessary. There is a long history of this phenomenon in industries like alcohol and tobacco, and now food.32 The question is whether these will in fact benefit children or instead insure business as usual for the companies. There should be great concern with this possibility given the abject failure of self-regulation in other industries, particularly tobacco.33 This argues for establishing stricter criteria that industry must meet in order for self-regulation to be taken seriously, as described by Sharma and colleagues.34
Discussion

Cereal FACTS 61
First and foremost, foods marketed to children must meet objective nutrition standards that have children’s health as the aim. When industry is involved in developing their own nutrition standards, the resulting standards are unacceptable to the public.35 The list of unhealthy cereals marketed to children may be somewhat shorter than in the past, but the brands marketed directly to children on television and the internet are the same high sugar products that have been marketed to children for years. Although these cereals are better for you than a chocolate donut, they are not healthy choices for breakfast. The substantial marketing that cereal companies direct toward children makes parents’ efforts to encourage a healthy diet even more difficult. We do not object to marketing to children per se, but the foods that are marketed to them must be held to higher standards. They should be more, not less, nutritious than the foods marketed to adults; and the standards should be established by the government and nutrition experts with no ties to the food industry.
Similarly, the definition of marketing must incorporate all types of marketing to which children are exposed. The fact that preschoolers view nearly as many television ads for cereals as do older children, in spite of pledges by Kellogg and General Mills that they will not advertise to preschoolers directly, highlights a significant shortcoming of the CFBAI pledges. Similarly, all participating CFBAI companies have pledged that they will not advertise unhealthy products in programming “primarily directed to children under 12,” defined as media in which children under 12 years constitute more than 25 to 50% of the audience. However, over 50% of the television food advertising seen by children occurs during other types of programming where they are not the primary audience.36 Therefore, even companies who pledge that they will not advertise to children at all can continue to reach them through advertising placed in prime-time or other programming with large child audiences.
Finally, the pledges only apply to advertising that appears on television, radio, print and the internet; however, these types of marketing represent only 57% of food industry expenditures on marketing to children and adolescents.37 As shown in this report, cereal companies also market extensively to both children and parents in the supermarket and on the product package itself. Without limits on all forms of marketing, it is conceivable that even complete bans on food advertising to children, as defined in the CFBAI, could be offset by increased promotion at the point-of-sale or other unregulated types of marketing.
Practices vs. Performance: Avoiding a Trap
Another risk for the public health community and government is that regulations that dictate changes in industry practices
will not improve diet or could even worsen it. This can happen if industry complies with specific regulations, but continues to find other, perhaps even more effective, ways to market their products. We believe this should be the default assumption. If for instance, industry agrees, as it has, to remove some sugared beverages from schools, will it move its marketing efforts to other arenas such as internet marketing or point of purchase promotions in stores near schools? It is possible, perhaps likely, that some of these other marketing practices will be more effective than the ones sacrificed and that consumption of the products will actually increase.
In this report we highlight industry practices that we believe should be changed. Our hope is that legislative and regulatory authorities will take action so that these practices do change, but it is essential that negative consequences, some anticipated and some not, be avoided. How might this be done?
One approach is to anticipate industry reactions and to account for these in legislative and regulatory actions. However, this approach assumes that such reactions can be anticipated and that it is possible to foresee marketing advances such as changes in digital technology.
An alternative approach proposed by Sugarman is “performance-based regulation.”38, 39 He questions whether government is in the position to mandate the optimal industry actions or can anticipate how industry would work around regulations. With performance-based regulation, an outcome would be mandated and then industry would decide which practices to change. As an example, reduced consumption of highly sugared cereals by young people could be the outcome. Government could declare, and/or industry could just commit, that youth consumption of such cereals would decrease by 20% in each of the first three years of a law or agreement. Industry would change its marketing, packaging, pricing and other activities to accomplish this mandate. Cereal makers could instead promote their more nutritious cereals to children and parents and thus retain profitability.
We believe this approach should be taken seriously. Certainly it would be a more rapid way to create change, as the goal is change itself, not compliance with a set of practices that industry has established for itself. Given marketers’ skill in developing new and creative practices to sell their products, one can argue that performance-based regulations are the only way to generate real reductions in the harm to children’s health caused by food marketing. If the food industry wants to be a true partner in the fight against childhood obesity, food companies must also be responsible for the results of their actions.
Discussion

Cereal FACTS 62
Introduction1. Institute of Medicine (2006). Food Marketing to Children and
Youth: Threat or Opportunity? Washington, D.C.: National Academies Press.
2. World Health Organization (2006). Marketing of Food and Non-Alcoholic Beverages to Children. Geneva: World Health Organization.
3. Harris, J.L., Bargh, J.A., & Brownell, K.D. (2009). Priming effects of television food advertising on eating behavior. Health Psychology, 28, 404-13.
4. Robinson, T.N., Borzekowski, D.L., Matheson, D.M., & Kraemer, H.C. (2007). Effects of fast food branding on young children's taste preferences. Archives of Pediatric and Adolescent Medicine, 161, 792-7.
5. Powell, L.M., Szczypka, G., Chaloupka, F.J., & Braunschweig, C.L. (2007). Nutritional content of television food advertisements seen by children and adolescents in the United States. Pediatrics, 120, 576-83.
6. Grier, S.A. & Kumanyika, S.K. (2008). The context for choice: health implications of targeted food and beverage marketing to African Americans. American Journal of Public Health, 98, 1616-29.
7. Alvy, L.M. & Calvert, S.L. (2008). Food marketing on popular children's web sites: a content analysis. Journal of the American Dietetic Association, 108, 710-3.
8. Harris, J.L., Pomeranz, J.L., Lobstein, T. & Brownell, K.D. (2009). A crisis in the marketplace: how food marketing contributes to childhood obesity and what can be done. Annual Review of Public Health, 30, 211-25.
9. Hawkes, C. (2007). Regulating and litigating in the public interest: regulating food marketing to young people worldwide: trends and policy drivers. American Journal of Public Health, 97, 1962-73.
10. Swinburn, B., Sacks, G., Lobstein, T., et al. (2008). The 'Sydney Principles' for reducing the commercial promotion of foods and beverages to children. Public Health Nutrition, 11, 881-6.
11. Consumers International (2008). Recommendations for an International Code of Marketing of Foods and Non-Alcoholic Beverages to Children. http://www.consumersinternational.org/shared_asp_files/GFSR.asp?NodeID=97478
12. Consumers International (2009). Left Wanting More: Food Company Policies on Marketing to Children. http://www.junkfoodgeneration.org/documents/Left_wanting_more.pdf
13. Federal Trade Commission (2008). Marketing Food to Children and Adolescents: A Review of Industry Expenditures, Activities, and Self-Regulation. http://www.ftc.gov/os/2008/07/P064504foodmktingreport.pdf
14. Hawkes, C. (2008). Agro-food industry growth and obesity in China: what role for regulating food advertising and promotion and nutrition labelling? Obesity Review, 9(s1), 151-61.
15. Consumers International (2008). The Junk Food Trap: Marketing Unhealthy Food to Children in Asia Pacific. http://www.consumersinternational.org/files/98027/FileName/TheJunkFoodTrapwebversion.pdf
16. Sharma, L.L., Teret, S.P. & Brownell, K.D. (2009). The food industry and self-regulation: Standards to promote success and avoid public health failures. American Journal of Public Health, in press.
17. Finkelstein, E.A., Trogdon, J.G., Cohen, J.W. & Dietz, W. (2009). Annual Medical Spending Attributable To Obesity: Payer- And Service-Specific Estimates. Health Affairs, 28, 822-831.
18. Federal Trade Commission (2008).
19. Weinberg, M.E., Harris, J.L., Schwartz, M.B., Ross, C., Ostroff, J. & Brownell, K.D. (2009) Trends in television food advertising: Progress in reducing unhealthy marketing to young people? under review.
20. Ibid.
21. Schwartz, M., Ross, C., Harris, J.L., Siegel, M., Ostroff, J. & Brownell, K.D. (2009) Breakfast cereal industry pledges to self-regulate advertising to youth: Will they improve the marketing landscape? under review.
22. Ibid.
23. Alvy & Calvert (2008).
24. Schwartz, M.B., Vartanian, L.R., Wharton, C.M. & Brownell, K.D. (2008). Examining the nutritional quality of breakfast cereals marketed to children. Journal of the American Dietetic Association, 108, 702-5.
25. American Beverage Association (2006). School Beverage Guidelines. http://www.schoolbeverages.org/guidelines/guidelines-specifics/download.aspx?id=113
26. Sharma, Teret, & Brownell (2009).
27. American Beverage Association (2006).
28. Council of Better Business Bureaus (2007) Children’s Food and Beverage Advertising Initiative. http://www.bbb.org/us/children-food-beverage-advertising-initiative/
29. The Walt Disney Company (2006, October 16). The Walt Disney Company announces new food guidelines to promote healthier kids’ diets [Press Release]. http://corporate.disney.go.com/news/corporate/2006/2006_1016_food_guidelines.html
30. Zarghami, C. (2007, August 15) Letter from President of Nickelodeon to Chairman Markey of the U. S. House of Representatives Subcommittee on Telecommunications and the Internet, Committee on Energy and Commerce. http://markey.house.gov/docs/telecomm/Nickelodeon%20licensing.pdf
31. Smart Choices Program (2009) Smart Choices Program: Helping Guide Smart Food and Beverage Choices. http://smartchoicesprogram.com
32. Kolish, E.D. & Peeler, C.L. (2008). Changing the landscape of food and beverage advertising: The children's food and beverage advertising initiative in action. Council of Better Business Bureaus. http://www.bbb.org/us/storage/16/documents/CFBAI/ChildrenF&BInit_Sept21.pdf
33. Chester, J. (2007). Digital destiny: New media and the future of democracy. New York: New Press.
34. Harris, et al. (2009).
35. Chester (2007).
36. Esty, D.C. (2009). Green to Gold: How Smart Companies Use Environmental Strategy to Innovate, Create Value, and Build Competitive Advantage. Hoboken, N.J.: John Wiley & Sons.
37. Yale Center for Environmental Law & Policy CfIESINCU (2009). Environmental Performance Index. http://epi.yale.edu/Home
38. John, D.R. (1999). Consumer socialization of children: A retrospective look at twenty-five years of research. Journal of Consumer Research, 26, 183-213.
39. Kunkel, D., Wilcox, B.L., Cantor, J., Palmer, E., Linn, S., & Dowrick, P. (2004). Report of the APA task force on advertising and children. www.apa.org/releases/childrenads.pdf
40. Leslie, F.M., Levine, L.J., Loughlin, S.E. & Pechmann, C. (2009). Adolescents’ psychological and neurobiological development: Implications for digital marketing. Memo prepared for the second NPLAN/BMSG meeting on digital media and marketing to children. Berkeley Media Studies Group.
Endnotes

Cereal FACTS 63
41. Harris, J.H., Brownell, K.D. & Bargh, J.A. (2009). The food marketing defense model: Integrating psychological research to protect youth and inform public policy. Social Issues and Policy Review, in press.
42. Montgomery, K.C. & Chester, J. (2009). Interactive food and beverage marketing: Targeting adolescents in the digital age. Journal of Adolescent Health, in press.
43. Grier & Kumanyika (2008).
44. Ogden, C.L., Carroll, M.D., Curtin, L.R., McDowell, M.A., Tabak, C.J., & Flegal, K.M. (2006). Prevalence of overweight and obesity in the United States, 1999-2004. Journal of the American Medical Association, 295, 1549-1555.
Methods1. General Mills, Kellogg Company and Pepsico (Quaker) currently
participate in the CFBAI as of October 1, 2009.
2. Kolish, E.D. & Peeler, C.L. (2008). Changing the landscape of food and beverage advertising: The children’s food and beverage advertising initiative in action. Council of Better Business Bureaus. http://www.bbb.org/us/storage/16/documents/CFBAI/ChildrenF&BInit_Sept21.pdf
3. Food Standards Agency (2007). Nutrient profiling. http://www.food.gov.uk/healthiereating/advertisingtochildren/nutlab/
4. OFCOM (2007). Television advertising of food and drink products to children. Final statement. www.ofcom.org.uk/consult/condocs/foodads_new/statement/statement.pdf
5. Food Standards Australia New Zealand (2008). http://www.foodstandards.gov.au/foodmatters/healthnutritionandrelatedclaims/
6. Scarborough, P., Rayner, M., Stockley, L. & Black, A. (2007). Nutrition professionals’ perception of the “healthiness” of individual foods, Public Health Nutrition, 10, 346-353.
7. Jacobson, M.F. & Schardt, D. (1999). Diet, ADHD & behavior: A quarter-century review. Updated 2009. www.cspinet.org/new/pdf/dyesreschbk.pdf
8. Food and Nutrition Service, USDA (2007). WIC food packages. www.fns.usda.gov/wic/benefitsandservices/foodpkg.htm
9. OFCOM (2007)
10. CBBB (2009). BBB Children’s Food and Beverage Advertising Initiative: Food and beverage products that meet participants’ approved nutrition standards. http://www.bbb.org/us/storage/0/Shared%20Documents/Aug_Product_List_final1.pdf
11. Schwartz, M. B., Vartanian, L. R., Wharton, C. M. & Brownell, K. D. (2008). Examining the nutritional quality of breakfast cereals marketed to children. Journal of the American Dietetic Assocication, 108, 702-5.
12. Datamonitor (2009). http://www.productscan.com/
13. Federal Trade Commission [FTC] (2008). Marketing food to children and adolescents. A review of industry expenditures, activities and self-regulation. http://www.ftc.gov/os/2008/07/P064504foodmktingreport.pdf
14. The Nielsen Company (2009). Nielsen Monitor Plus AdViews. www.nielsenmedia.com
15. FTC (2007). Children’s exposure to TV advertising in 1977 and 2004. http://www.ftc.gov/os/2007/06/cabecolor.pdf
16. The Nielsen Company (2009)
17. TNS Media Intelligence (2009). Adscope. http://www.tns-mi.com/prodadscope.htm
18. Reece, B.B., Rifon, N.J. & Rodriguez, K. (1999). Selling food to children. Is fun part of a balanced breakfast? In L.C. Machlin & L. Carlson (Eds.), Advertising to children: Concepts and controversies (189-208). Thousand Oaks, CA: Sage Publications.
19. Warren, R., LeBlanc Wicks, J., Wicks, R.H., Fosu, I., & Chung, D. (2007). Food and Beverage Advertising to Children on U.S. Television: Did National Food Advertisers Respond? Journalism and Mass Communication Quarterly; 84(4); 795-810.
20. Warren, R., Wicks, R.H., LeBlanc Wicks, J., Fosu, I., & Chung, D. (2008). Food and Beverage Advertising on U.S. Television: A Comparison of Child-Targeted Versus General Audience Commercials. Journal of Broadcasting & Electronic Media; 52(2); 231-246.
21. comScore (2009). Media Metrix Suite. http://comscore.com/About_comScore/Methodology/Media_Metrix_360_Hybrid_Measurement
22. comScore (2009). U.S. Client Newsletter. http://www.comscore.com/Newsletter/2009/August/US_Client_Newsletter
23. The data used for average visits per month is comScore Media Metrix Key Measures Report’s data for the measure: Average Visits per Visitor.
24. Moore, E.S. (2006) It’s Child’s Play: Advergaming and the Online marketing of Food to Children. Kaiser Family Foundation.
25. Lingas, E.O., Dorfman, L., Bukofzer, E. (2009). Nutrition Content of Food and Beverage Products on Web Sites Popular With Children. American Journal of Public Health. 99(7):1-6.
26. Chester, J. & Montgomery, K. (2007). Interactive Food and Beverage Marketing: Targeting Children and Youth in the Digital Age. Berkeley Media Studies Group. www.digitalads.org
27. Lee, M., Choi, Y., Quilliam, E.T., Cole, R.T. (2009). Playing With Food: Content Analysis of Food Advergames. The Journal of Consumer Affairs. 43(1):129-154;
28. Moore, E.S. & Rideout, V.J. (2007) The Online Marketing of Food to Children: Is It Just Fun and Games? Journal of Public Policy and Marketing. 26(2)202-220.
29. comScore (2009). http://comscore.net/Products_Services/Product_Index/Ad_Metrix
30. The data used for monthly unique viewers is comScore Ad Metrix Advertiser Report’s data for the measure: Advertising Exposed Unique Visitors.
31. Montgomery, K.C. & Chester, J. (2009). Interactive Food and Beverage Marketing: Targeting Adolescents in the Digital Age. Journal of Adolescent Health, 45(3) S18-S29.
32. Nielsen Social Media QuickTake: May 2009. http://blog.nielsen.com/nielsenwire/wp-content/uploads/2009/06/nielsen_pr_090619.pdf
33. Facebook (2009). Facebook Pages Guidelines. http://www.facebook.com/terms_pages.php
34. Point-Of-Purchase Advertising International (2001). P-O-P Measures Up: Learnings from the supermarket class of trade.
35. The Nielsen Company (2009)
36. John, D.R. (1999). Consumer socialization of children: A retrospective look at twenty-five years of research. Journal of Consumer Research, 26, 183-213.
37. Kunkel, D., Wilcox, B.L., Cantor, J., Palmer, E., Linn, S., & Dowrick, P. (2004). Report of the APA task force on advertising and children. www.apa.org/releases/childrenads.pdf
38. John (1999)
Endnotes

Cereal FACTS 64
Endnotes
Results1. Dorset cereals had been included in the original list because
they were stocked in the local supermarket. Nestle cereals had been included because they were advertised in 2008.
2. Food and Nutrition Service, USDA (2007). WIC food packages. www.fns.usda.gov/wic/benefitsandservices/foodpkg.htm
3. Schwartz, M. B., Vartanian, L. R., Wharton, C. M. & Brownell, K. D. (2008). Examining the nutritional quality of breakfast cereals marketed to children. Journal of the American Dietetic Association, 108, 702-5.
4. Schwartz, M., Ross, C., Harris, J. L., Siegel, M., Ostroff, J. & Brownell, K. D. (2009) Breakfast cereal industry pledges to self-regulate advertising to youth: Will they improve the marketing landscape? under review.
5. CBBB (2009). BBB Children’s Food and Beverage Advertising Initiative: Food and Beverage products that meet Participants’ Approved Nutrition Standards. http://www.bbb.org/us/storage/0/Shared%20Documents/Aug_Product_List_final1.pdf
6. CBBB (2009)
7. Kolish, E.D. & Peeler, C.L. (2008). Changing the landscape of food and beverage advertising: The children’s food and beverage advertising initiative in action. Council of Better Business Bureaus. http://www.bbb.org/us/storage/16/documents/CFBAI/ChildrenF&BInit_Sept21.pdf
8. The Nielsen Company (2009). Ratings and other data contained herein are the copyrighted property of The Nielsen Company, Inc. Unauthorized use of this copyrighted material is expressly prohibited. Violators may be subject to criminal and civil penalties under Federal Law (17 USC 101 et seq.). All rights reserved.
9. The remainder was spent on company-level advertising.
10. Federal Trade Commission (2008). Marketing Food to Children and Adolescents: A Review of Industry Expenditures, Activities, and Self-Regulation. http://www.ftc.gov/os/2008/07/P064504foodmktingreport.pdf
11. The Nielsen Company (2009)
12. John, D.R. (1999). Consumer socialization of children: A retrospective look at twenty-five years of research. Journal of Consumer Research, 26, 183-213.
13. Kunkel, D., Wilcox, B.L., Cantor, J., Palmer, E., Linn, S. & Dowrick, P. (2004). Report of the APA task force on advertising and children. www.apa.org/releases/childrenads.pdf
14. BBB (2009). www.bbb.org/us/children-advertising-initiative/General-Mills
15. BBB (2009). www.bbb.org/us/children-advertising-initiative/Kellogg
16. The Nielsen Company (2009)
17. Powell, L. M., Szczypka, G., Chaloupka, F. J., & Braunschweig C.L. (2007). Nutritional content of television food advertisements seen by children and adolescents in the United States. Pediatrics, 120, 576-83.
18. Schwartz et al. (2009)
19. Reece, B.B., Rifon, N.J. & Rodriguez, K. (1999). Selling food to children. Is fun part of a balanced breakfast? In L.C. Machlin & L. Carlson (Eds.), Advertising to children: Concepts and controversies (189-208). Thousand Oaks, CA: Sage Publications.
20. Appiah, O. (2004). Effects of ethnic identification on web browsers’ attitudes toward and navigational patterns on race-targeted sites. Communication Research, 31, 312-337.
21. Speers, S., Harris, J., Goren, A., Schwartz, M. & Brownell, K. (2009). Public Perceptions of Food Marketing to Youth: Results of the Rudd Center Public Opinion Poll. www.yaleruddcenter.org
22. John, D.R. (1999). Consumer socialization of children: A retrospective look at twenty-five years of research. Journal of Consumer Research, 26, 183-213.
23. Kunkel, D., Wilcox, B.L., Cantor, J., Palmer, E., Linn, S., & Dowrick, P. (2004). Report of the APA task force on advertising and children. www.apa.org/releases/childrenads.pdf.
24. FTC (2008)
25. Moore, E.S., & Rideout V.J. (2007). The Online Marketing of Food to Children: Is It Just Fun and Games? Journal of Public Policy and Marketing. 2007;26(2)202-220.
26. Chester, J. & Montgomery, K. (2007). Interactive Food and Beverage Marketing: Targeting Children and Youth in the Digital Age. Berkeley Media Studies Group. www.digitalads.org
27. The data used for average visits per month is comScore Media Metrix Key Measures Report’s data for the measure: Average Visits per Visitor.
28. Kaiser Family Foundation (2005). Generation M: Media in the Lives of 8-18 Year Olds. www.kff.org/entmedia/7251.cfm
29. These summaries describe the child-targeted cereal websites as of March 31, 2009. Since that time, Quaker Cap’n Crunch has launched a new children’s gaming website, AppleJacks.com integrated their games into the travel story, and CornPops.com now has a multiple-page website.
30. The data used for monthly unique viewers is comScore Ad Metrix Advertiser Report’s data for the measure: Advertising Exposed Unique Visitors.
31. The data used for average number of ads viewed per month is comScore Ad Metrix Advertiser Report’s data for the measure: Average Frequency.
32. Moore & Rideout. (2007).
33. FTC (2008)
34. Underhill, P. (2008). Why we buy: The science of shopping. NY: Simon & Schuster.
35. Dijksterhuis, A., Smith, P.K., van Baaren, R.W. & Wigboldus, D.H.J. (2005). The unconscious consumer: Effects of environment on consumer behavior. Journal of Consumer Psychology, 15, 193-202.
36. Simonson, I. (2005). In defense of consciousness: The role of conscious and unconscious inputs in consumer choice. Journal of Consumer Psychology, 15, 211-217.
37. Peter, JP, Olson, JC & Grunet, KG. (1999). Consumer behaviour and marketing strategy: European edition. London: McGraw-Hill
Discussion1. Martin, D. (2009 May 13). R. B. Choate Jr., Food Lobbyist, Dies
at 84. The New York Times, p. A29
2. Council on Children, Media, and Merchandising. (1972). “Too Stuffed for Supper” – Testimony Before the Senate Commerce Committee, Subcommittee on the Consumer. Washington, D.C.; Choate. Retrieved June 15, 2009 from ERIC database.
3. Martin (2009).

Cereal FACTS 65
4. Congress of the U.S., Senate Select Committee on Nutrition and Human Needs. (1973). Hearings before the Select Committee on Nutrition and Human Needs of the United States Senate, Ninety-Third Congress, First Session. Nutrition Education - 1973. Parts 3,4 and 5 - TV advertising of food to children. Washington, D.C., March 5,6, and 12, 1973. Washington, D.C.: U.S. Government Printing Office.
5. Ogden, C.L., Carroll, M.D., Curtin, L.R., McDowell, M.A., Tabak, C.J. & Flegal, K.M. (2006). Prevalence of overweight and obesity in the United States, 1999-2004. JAMA, 295, 1549-1555.
6. Olshanksy, S.J., Passaro, D.J., Hershow, R.C., Layden, J., Carnes, B.A., Brody, J., Hayflick, L., Butler, R.N., Allison, D.B. & Ludwig, D.S. (2005). A potential decline in the life expectancy in the United States in the 21st century. The New England Journal of Medicine, 352, 1138-1145.
7. Harris, J.L., Pomeranz, J.L., Lobstein, T. & Brownell, K.D. (2009). A crisis in the marketplace: How food marketing contributes to childhood obesity and what can be done. Annual Review of Public Health, 30, 211-225.
8. Institute of Medicine [IOM] (2006). National Academy of Sciences, Committee on Food Marketing and the Diets of Children and Youth. Food marketing to children and youth: Threat or opportunity? Washington, DC: National Academies Press.
9. Hastings, G., Stead, M., McDermott, L., Forsyth, A., MacKintosh, A. et al. (2003). Review of Research on the Effects of Food Promotion to Children. Glasgow, JK: Center for Social Marketing, University of Strathclyde.
10. Kolish, E.D. & Peeler, C.L. (2008). Changing the landscape of food and beverage advertising: The children’s food and beverage advertising initiative in action. Council of Better Business Bureaus. www.bbb.org/us/storage/16/documents/CFBAI/ChildrenF&BInit_Sept21.pdf
11. Sharma, L.L., Teret, S.P. & Brownell, K.D. (2009). The food industry and self-regulation: Standards to promote success and avoid public health failures. American Journal of Public Health, in press.
12. Wang, S. (2009 July 29). Rice Krispies complete with snap, crackle and immunity. The Wall Street Journal, wsj.com.
13. Jacobson, M.F. & Schardt, D. (1999). Diet, ADHD & behavior: A quarter-century review. Updated 2009. www.cspi.org/new/pdf/dyereschbk.pdf
14. BBB (2009). www.bbb.org/us/children-advertising-initiative/General-Mills
15. BBB (2009). www.bbb.org/us/children-advertising-initiative/Kellogg
16. John, D.R. (1999). Consumer socialization of children: A retrospective look at twenty-five years of research. Journal of Consumer Research, 26, 183-213.
17. Kunkel, D., Wilcox, BL., Cantor, J., Palmer, E., Linn, S. & Dowrick, P. (2004). Report of the APA task force on advertising and children. www.apa.org/releases/childrenads.pdf
18. Ibid.
19. Shifrin, D. (2005). Remarks at Federal Trade Commission Workshop, “Perspectives on Marketing, Self-Regulation and Childhood Obesity,” July 14-15, 2005, Washington, DC. www.saap.org/advocacy/washing/dr_%20Shifrin_remarks.htm.
20. Moore, E.S. & Rideout, V.J. (2007). The online marketing of food to children: Is it just fun and games? Journal of Public Policy and Marketing, 26, 202-220.
21. Chester, J. & Montgomery, K. (2008). Interactive food and beverage marketing: Targeting children and youth in the digital age. www.digitalads.org
22. Reece, B.B., Rifon, N.J. & Rodriguez, K. (1999). Selling food to children. Is fun part of a balanced breakfast? In L.C. Machlin & L. Carlson (Eds.), Advertising to children: Concepts and controversies (189-208). Thousand Oaks, CA: Sage Publications.
23. Warren , R., LeBlanc Wicks J., Wicks, R.H., Fosu, I., & Chung, D. (2007). Food and beverage advertising to children on U.S. television. Did national food advertisers respond? Journalism and Mass Communication Quarterly, 84, 795-810.
24. Warren, R., Wicks, R.H., LeBlanc Wicks, J., Fosu, I., & Chung, D. (2008). Food and beverage advertising on U.S. television: A comparison of child-targeted versus general audience commercials. Journal of Broadcasting & Electronic Media, 52, 231-246.
25. Cohen, J.B., Pham, M.T. & Andrade, E.B. (2008). The nature and role of affect in consumer behavior. In C.P. Haugtvedt, P.M. Herr & F.R. Kardes (Eds.), Handbook of Consumer Psychology (pp. 297-348). NY: Lawrence Erlbaum Associates.
26. Harris, J.L., Brownell, K.B., & Bargh, J.A. (2009). The food marketing defense model: Psychological research to protect youth and inform public policy. Social Issues and Policy Review, in press.
27. Urbick, B. (2008). Making a big impression on kids. Brand Strategy, 224, 46-47.
28. Speers, S., Harris, J., Goren, A., Schwartz, M. & Brownell, K. (2009). Public Perceptions of Food Marketing to Youth: Results of the Rudd Center Public Opinion Poll, May 2008. www.yaleruddcenter.org
29. Federal Trade Commission [FTC] (2008). Marketing Food to Children and Adolescents: A review of industry expenditures, activities and self-regulation. www.ftc.gov.
30. Powell, L.M., Szczpka, G., Chaloupka, F.J., & Braunschweig, C.L. (2007). Nutritional content of television advertisements seen by children and adolescents. Pediatrics, 120, 576-583.
31. Symantec (2008). Norton Online Living Report. www.symantec.com
32. Sharma et al. (2009)
33. Brownell, K.D., & Warner, K.E. (2009). The perils of ignoring history: Big tobacco played dirty and millions died. How similar is big food? Milbank Quarterly, 87, 259-294.
34. Sharma et al. (2009)
35. Neuman, W. (2009 September 5). For your health, Froot Loops. The New York Times. www.nytimes.com
36. Federal Trade Commission (2007). Children’s Exposure to TV Advertising in 1977 and 2004. www.ftc.gov
37. FTC (2008)
38. Sugarman, S.D. (2009a). Salt, high blood pressure, and performance-based regulation. Regulation & Governance. 3, 84-102.
39. Sugarman, S.D. (2009b). No more business as usual: Enticing companies to sharply lower the public health and medical care costs of the products they sell. Public Health, 123, 275-279.
Endnotes

Cereal FACTS 66
Ranking Table 1
Brand Nutrition Ranking by overall nutrition profile
(Nutrition Profile Index [NPI] score)
Includes all child and family brands stocked in more than 5% of supermarkets in May 2009
RANK Company Brand Target # of NPI Sugar Food Varieties Score* Content Dyes
1 Kellogg Mini-Wheats Family 9 72.0 2-23% 44%
2 Barbara’sBakery OrganicWildPuffs Family 4 58.0 23% 0%
3 Kashi MightyBites Family 1 56.0 15% 0%
3(tie) Kashi HoneySunshine Family 1 56.0 20% 0%
5 CascadianFarm CliffordCrunch Child 1 54.0 20% 0%
5(tie) Kellogg HannahMontana Child 1 54.0 30% 0%
7 GeneralMills Kix Family 3 52.8 10-31% 33%
7 (tie) Quaker Life Family 3 52.8 19-25% 100%
9 GeneralMills Cheerios (excludingHoneyNut) Family 10 51.6 4-40% 10%
10 Barbara’sBakery Puffins Family 4 51.4 19-20% 0%
11 Annie’s Bunnies Family 5 50.8 7-30% 0%
11 (tie) Nature’sPath EnviroKidzOrganic Child 5 50.8 20-37% 0%
13 GeneralMills DoratheExplorer Child 1 50.0 22% 0%
13 (tie) CascadianFarm CinnamonCrunch Family 1 50.0 30% 0%
15 Post RaisinBran Family 1 48.0 32% 0%
16 Kellogg HoneySmacks Family 1 46.0 56% 0%
16(tie) CascadianFarm PurelyO’s Family 1 46.0 3% 0%
16(tie) Post AlphaBits Family 1 46.0 36% 0%
16(tie) Post GoldenCrisp Family 1 46.0 52% 0%
16(tie) Post Honeycomb Child 1 46.0 31% 100%
21 GeneralMills Chex Family 8 44.2 7-28% 25%
22 Kellogg Mini-Swirlz Family 1 44.0 40% 100%
22(tie) CascadianFarm HoneyNutO’s Family 1 44.0 27% 0%
22(tie) GeneralMills HoneyNutCheerios Child 1 44.0 32% 0%
22(tie) Post WaffleCrisp Family 1 44.0 40% 0%
26 Kellogg RiceorCocoaKrispies Family 7 43.6 12-40% 0%
27 Kellogg FrostedFlakes Child 3 42.6 26-37% 0%
28 Kellogg DisneyHighSchool Child 1 42.0 31% 100% Musical
29 Kellogg AppleJacks Child 1 40.0 43% 100%
29 (tie) Kellogg CookieCrunch Family 1 40.0 40% 100%
31 GeneralMills CookieCrisp Child 2 39.6 39-42% 0%
32 GeneralMills CocoaPuffs Child 2 38.6 41-44% 0%
continued
Best

Cereal FACTS 67
Ranking Table 1
Brand Nutrition continued
RANK Company Brand Target # of NPI Sugar Food Varieties Score* Content Dyes
33 GeneralMills CountChocula Family 1 38.0 44% 100%
33 (tie) GeneralMills Trix Child 1 38.0 38% 100%
33 (tie) Kellogg FrootLoops Child 6 38.0 31-53% 100%
33 (tie) Kellogg Smorz Family 1 38.0 43% 100%
33 (tie) Post FruityorCocoaPebblesChild 2 38.0 37% 50%
38 GeneralMills CinnamonToastCrunchChild 2 36.6 7-32% 0%
38(tie) Quaker Cap’nCrunch Child 3 36.6 33-46% 67%
40 GeneralMills LuckyCharms Child 2 36.0 41-43% 100%
40(tie) GeneralMills GoldenGrahams Family 1 36.0 35% 0%
42 Kellogg CornPops Child 2 35.8 37-41% 0%
43 GeneralMills Reese’sPuffs Child 1 34.0 41% 100%
Company Nutrition Ranking
1 Kashi 2 56.0 15-20% 0%
2 Barbara’sBakery 8 53.4 23% 0%
3 Kellogg 34 51.6 2-56% 41%
4 Annie’s 5 50.8 7-27% 0%
4(tie) Nature’sPath 5 50.8 20-37% 0%
6 CascadianFarm 4 47.4 20-30% 0%
7 Quaker 6 44.0 19-46% 83%
8 GeneralMills 35 43.4 4-44% 26%
8(tie) Post 7 43.4 30-52% 25%
*Analysisofnutritioncontenton5/31/09
Brandandcompanyscoresincludeanaverageofallcerealsinthebrandorcompany,weightedbyshareofshelf
Worst

Cereal FACTS 68
Ranking Table 2
Advertising Spending Ranking by total advertising spending*
Includes total spending in all measured media for child and family brands for the 15-month period from January 2008 through March 2009
RANK Company Brand Advertising spending (000)
1 GeneralMills Cheerios(excludingHoneyNut) $95,350.0
2 GeneralMills HoneyNutCheerios $74,714.2
3 Kellogg Mini-Wheats $59,232.0
4 Kellogg RiceorCocoaKrispies $37,791.2
5 Kellogg FrostedFlakes $26,102.1
6 GeneralMills CinnamonToastCrunch $16,134.7
7 GeneralMills LuckyCharms $12,189.6
8 Quaker Life $11,520.2
9 GeneralMills Chex $9,560.0
10 Kellogg CornPops $9,289.5
11 GeneralMills CocoaPuffs $8,836.2
12 Kellogg FrootLoops $8,605.9
13 GeneralMills Trix $7,836.1
14 Post FruityorCocoaPebbles $7,554.6
15 GeneralMills Reese’sPuffs $7,208.0
16 Kellogg AppleJacks $6,915.0
17 Post Honeycomb $4,674.8
18 GeneralMills CookieCrisp $4,489.1
19 Barbara’sBakery Puffins $944.7
20 Quaker Cap’nCrunch $278.1
21 Nature’sPath EnviroKidzOrganic $251.5
22 GeneralMills Kix $103.0
RANK Company Advertising spending (000)
1 GeneralMills $261,892.1
2 Kellogg $159,214.0
3 Quaker $13,187.2
4 Post $12,606.8
5 Nature’sPath $1,109.5
6 Barbara’sBakery $1,029.3
*Includesspendingin18differentmediaincludingtelevision,magazines,radio,newspapers,freestandinginsertcouponsandoutdoor
advertising
©TheNielsenCompany
Least
Most

Cereal FACTS 69
Ranking Table 3
Tele
vision
Adve
rtisin
g E
xpos
ure
Ran
kin
g b
y ad
s vi
ewed
for
child
ren
(ag
es 2
-11
year
s) c
om
bin
ed
Incl
ud
es a
vera
ge
nu
mb
er o
f ad
vert
isem
ents
vie
wed
for
child
an
d f
amily
bra
nd
s d
uri
ng
th
e 15
-mo
nth
per
iod
fro
m J
anu
ary
2008
th
rou
gh
Mar
ch 2
009
A
Ve
RA
ge
Nu
MB
eR
oF
AD
S V
Iew
eD
RA
NK
C
om
pan
y B
ran
d
Ch
ildre
n
Ch
ildre
n
Teen
s R
atio
of
child
R
atio
of
teen
2-
5 ye
ars
6-11
yea
rs
12-1
7 ye
ars
to a
du
lt v
iew
ers
to a
du
lt v
iew
ers
1
Gen
eral
Mill
sC
inna
mon
Toa
stC
runc
h75
82
39
4.
02.
0
2
G
ener
alM
ills
Hon
eyN
utC
heer
ios
73
80
43
2.4
1.4
3
Gen
eral
Mill
sLu
cky
Cha
rms
71
78
33
7.1
3.1
4
G
ener
alM
ills
Coc
oaP
uffs
63
68
29
7.
13.
1
5
Gen
eral
Mill
sTr
ix
55
58
25
7.0
3.0
6
K
ello
gg
Fros
ted
Fla
kes
53
58
28
3.7
1.9
7
Pos
tFr
uity
or
Coc
oaP
ebbl
es
46
54
23
7.0
3.2
8
G
ener
alM
ills
Com
pany
Ads
46
54
34
2.
41.
6
9
G
ener
alM
ills
Ree
se’s
Puf
fs
47
52
22
7.1
3.1
10
K
ello
gg
Cor
nP
ops
39
44
27
4.7
3.0
11
K
ello
gg
Froo
tLoo
ps
40
43
18
6.4
2.8
12
P
ost
Hon
eyco
mb
33
40
18
6.3
3.1
13
K
ello
gg
App
leJ
acks
32
35
15
6.
52.
9
14
G
ener
alM
ills
Coo
kie
Cris
p31
34
14
7.
13.
1
15
G
ener
alM
ills
Che
erio
s(e
xclu
ding
Hon
eyN
ut)
15
19
27
0.4
0.6
16
K
ello
gg
Com
pany
Ads
16
18
10
2.
41.
4
17
K
ello
gg
Min
i-Whe
ats
13
17
27
0.4
0.7
18
K
ello
gg
Ric
eor
Coc
oaK
rispi
es
11
13
20
0.4
0.7
19
Q
uake
rLi
fe
34
60.
50.
8
20
G
ener
alM
ills
Che
x0
11
0.3
0.5
21
Bar
bara
’sB
aker
yP
uffin
s<
1<
1<
10.
20.
3
A
Ve
RA
ge
Nu
MB
eR
oF
AD
S V
Iew
eD
RA
NK
C
om
pan
y C
hild
ren
C
hild
ren
Te
ens
Rat
io o
f ch
ild
Rat
io o
f te
en
2-
5 ye
ars
6-11
yea
rs
12-1
7 ye
ars
to a
du
lt v
iew
ers
to a
du
lt v
iew
ers
1
Gen
eral
Mill
s47
752
526
73.
21.
7
2
K
ello
gg
205
227
145
1.9
1.3
3
Pos
t79
94
41
6.
73.
2
4
Q
uake
r3
46
0.5
0.8
5
Bar
bara
’sB
aker
y<
1<
1<
10.
20.
3©
The
Nie
lsen
Com
pany
Leas
t
Mos
t

Cereal FACTS 70
Ranking Tables 4 and 5
Banner Advertising Exposure Ranking by total number of banner ads
viewed on youth websites*
Includes data for banner ads viewed for child brands from october 2008 through March 2009
RANK Company Brand Average Average % ad monthly number of views on unique ads viewed youth viewers per month websites (000)
1 GeneralMills Millsberry 11,720 10.4 91%
2 GeneralMills Reese’sPuffs 4,382 13.8 83%
3 GeneralMills LuckyCharms 7,369 3.9 87%
4 GeneralMills Trix 3,918 3.1 89%
5 GeneralMills HoneyNutCheerios 2,757 3.6 93%
6 Kellogg AppleJacks 6,508 2.9 46%
7 Kellogg FrootLoops 3,072 2.6 81%
8 Kellogg CornPops 4,641 2.6 36%
9 Post Postopia 775 2.9 34%
10 Kellogg FrostedFlakes 3,061 2.4 9%
*DataretrievedfromcomScoreAdMetrixAdvertiserReport*RankingbasedonTotalnumberofbanneradsviewedonyouthwebsitesascustomdefinedbyJenniferHarris(Averagemonthlyuniqueviewers*Averagenumberofadsviewedpermonth*%adviewsonyouthwebsites).
Child-Targeted Website Exposure Ranking by average total visits per
month by 2- to 17-year-olds*
Includes data for visits to websites with child-targeted content from January 2008 through March 2009 AVeRAge uNIque VISIToRS PeR MoNTH
RANK Company website 2-11 12-17 Average Average Years Years Visits per Minutes (000) (000) Month per Visit
1 GeneralMills Millsberry.com 386.8 380.2 2.8 23.7
2 Post Postopia.com 154.4 110.3 2.0 15.2
3 Kellogg AppleJacks.com 44.7 32.4 1.2 3.2
4 Kellogg FrootLoops.com 42.7 17.2 1.3 1.6
5 GeneralMills ReesesPuffs.com 27.0 17.7 1.1 3.6
6 Kellogg CornPops.com 21.4 11.1 1.1 2.2
7 Kellogg FrostedFlakes.com 12.1 5.2 1.2 3.1
8 GeneralMills Cheerios.com 14.7 9.4 1.2 1.8
9 GeneralMills CookieCrisp.com 11.8 8.0 1.2 1.3
10 GeneralMills Chex.com 5.9 11.3 1.2 2.6
*DataretrievedfromcomScoreMediaMetrixKeyMeasuresReport
Least
Least
Most
Most

Cereal FACTS 71
Ranking Table 6
Supermarket Shelf Space Ranking by overall share of total shelf facings*
Includes all child and family brands stocked in more than 5% of supermarkets in May 2009
Average % of Total % of Stores Facings RANK Company Brand Shelf Facings Stocking** Per Store
1 GeneralMills Cheerios(excludingHoneyNut) 5.51% 98% 24.3
2 Kellogg Mini-Wheats 3.90% 94% 19.3
3 Kellogg FrostedFlakes 2.56% 98% 12.5
4 Kellogg RiceorCocoaKrispies 2.50% 97% 15.0
5 GeneralMills Chex 2.24% 91% 13.3
6 Quaker Cap’nCrunch 2.17% 94% 8.9
7 Quaker Life 2.10% 96% 8.7
8 Kellogg FrootLoops 1.94% 96% 14.4
9 GeneralMills HoneyNutCheerios 1.93% 96% 7.5
10 Post FruityorCocoaPebbles 1.58% 98% 6.0
11 GeneralMills CinnamonToastCrunch 1.47% 95% 7.7
12 Kellogg CornPops 1.43% 97% 7.6
13 GeneralMills LuckyCharms 1.38% 97% 6.6
14 GeneralMills Kix 1.36% 95% 7.3
15 Kellogg AppleJacks 1.27% 96% 4.8
16 GeneralMills CocoaPuffs 1.22% 96% 5.2
17 GeneralMills Trix 0.97% 94% 3.8
18 GeneralMills CookieCrisp 0.84% 94% 4.8
19 GeneralMills GoldenGrahams 0.83% 92% 3.3
20 GeneralMills Reese’sPuffs 0.81% 93% 3.3
21 Post Honeycomb 0.69% 92% 2.7
22 Barbara’sBakery Puffins 0.64% 56% 4.2
23 Post RaisinBran 0.62% 80% 2.9
24 Nature’sPath EnviroKidzOrganic 0.61% 41% 7.3
25 Kellogg HoneySmacks 0.55% 85% 2.4
26 Annie’s Bunnies 0.25% 29% 6.6
26(tie) Post GoldenCrisp 0.25% 53% 1.7
28 Kashi HoneySunshine 0.23% 56% 1.5
29 CascadianFarm HoneyNutO’s 0.21% 49% 1.6
30 Post AlphaBits 0.19% 44% 1.6
31 Kellogg HannahMontana 0.18% 44% 1.5
32 CascadianFarm CinnamonCrunch 0.14% 35% 1.5
33 Kellogg CookieCrunch 0.13% 33% 1.5
34 Kellogg DisneyHighSchoolMusical 0.12% 31% 1.4
34 (tie) CascadianFarm PurelyO’s 0.12% 31% 1.4
continued
Most

Cereal FACTS 72
Ranking Table 6
Supermarket Shelf Space continued
Average % of Total % of Stores Facings RANK Company Brand Shelf Facings Stocking** Per Store
36 Barbara’sBakery OrganicWildPuffs 0.11% 14% 5.5
37 Kellogg Smorz 0.10% 16% 2.2
38 Post WaffleCrisp 0.08% 18% 1.6
39 CascadianFarm CliffordCrunch 0.06% 17% 1.4
39 (tie) GeneralMills DoratheExplorer 0.06% 12% 2.0
41 GeneralMills CountChocula 0.04% 11% 1.5
41 (tie) Kellogg Mini-Swirlz 0.04% 6% 2.7
43 Kashi MightyBites 0.03% 8% 1.6
Average % of Total % of Stores Facings RANK Company Shelf Facings Stocking** Per Store
1 GeneralMills 18.7% 100% 69.1
2 Kellogg 14.7% 100% 54.5
3 Quaker 4.3% 100% 15.8
4 Post 3.4% 100% 12.6
5 Barbara’sBakery 0.8% 62% 6.5
6 Nature’sPath 0.6% 62% 4.7
7 CascadianFarm 0.5% 71% 3.5
8 Kashi 0.3% 98% 1.7
9 Annie’s 0.3% 34% 3.1
*Fromasampleof400supermarketsin18majormarkets
**Forcerealbrandswithmorethanonevariety,thevarietystockedinthegreatestpercentofstoreswasused
Least

Cereal FACTS 73
Ranking Table 7
Supermarket In-Store Marketing Ranking by overall in-store
marketing (displays and promotions combined)*
Includes all child and family brands stocked in more than 5% of supermarkets from May to June 2009
Avg # Avg # % Stores Displays % Stores w/ Promotions RANK Company Brand w/ Display Per Store Promotion Per Store
1 Kellogg FrostedFlakes 55% 2.0 94% 4.0
2 Kellogg FrootLoops 57% 2.0 90% 3.8
3 Kellogg AppleJacks 52% 1.7 79% 3.3
4 Kellogg CornPops 45% 1.9 86% 3.1
5 GeneralMills Cheerios(excludingHoneyNut)56% 2.6 86% 9.1
6 Kellogg Mini-Wheats 28% 5.1 83% 15.6
7 Kellogg RiceorCocoaKrispies 45% 2.6 82% 5.8
8 GeneralMills CinnamonToastCrunch 33% 1.6 68% 3.0
9 GeneralMills HoneyNutCheerios 39% 1.7 70% 2.8
10 Quaker Cap’nCrunch 28% 4.3 68% 7.9
11 GeneralMills GoldenGrahams 33% 1.6 67% 2.6
12 GeneralMills CocoaPuffs 25% 2.5 66% 3.9
13 Quaker Life 32% 3.5 66% 8.1
14 GeneralMills CookieCrisp 23% 1.1 61% 2.9
15 Kellogg HoneySmacks 11% 1.3 62% 2.4
16 GeneralMills Trix 30% 1.9 60% 2.7
17 GeneralMills Chex 20% 3.0 60% 10.2
18 GeneralMills LuckyCharms 23% 1.6 60% 2.7
19 Post FruityorCocoaPebbles 21% 2.2 55% 5.3
20 GeneralMills Kix 15% 1.5 51% 4.1
21 Post RaisinBran 18% 2.0 47% 2.8
22 GeneralMills Reese’sPuffs 11% 1.1 45% 2.5
23 Post Honeycomb 18% 1.4 44% 2.6
24 Kashi HoneySunshine 0% 0.0 33% 2.7
25 Post GoldenCrisp 5% 1.0 28% 2.6
26 CascadianFarm HoneyNutO’s 5% 2.3 23% 3.3
27 Barbara’sBakery Puffins 5% 2.3 18% 2.9
28 Kellogg CookieCrunch 1% 3.0 16% 1.6
29 Nature’sPath EnviroKidzOrganic 6% 5.2 15% 2.8
30 Post AlphaBits 2% 1.0 15% 2.1
31 CascadianFarm CinnamonCrunch 1% 3.0 13% 2.6
32 Kellogg HannahMontana 2% 1.0 15% 2.5
33 Kellogg DisneyHighSchoolMusical 1% 1.0 14% 2.9
continued
Most

Cereal FACTS 74
Ranking Table 7
Supermarket In-Store Marketing continued
Avg # Avg # % Stores Displays % Stores w/ Promotions RANK Company Brand w/ Display Per Store Promotion Per Store
34 CascadianFarm PurelyO’s 2% 2.0 14% 2.8
35 Kellogg Smorz 1% 1.0 13% 2.1
36 Post WaffleCrisp 2% 1.0 10% 1.8
37 Barbara’sBakery OrganicWildPuffs 0% 0.0 10% 3.1
38 Annie’s Bunnies 0% 0.0 6% 4.2
39 CascadianFarm CliffordCrunch 0% 0.0 6% 2.4
39(tie) GeneralMills CountChocula 0% 0.0 6% 2.4
41 Kellogg Mini-Swirlz 0% 0.0 5% 1.3
42 GeneralMills DoratheExplorer 0% 0.0 3% 1.0
43 Kashi MightyBites 0% 0.0 3% 2.0
Avg. # Avg. # % Stores Displays % Stores w/ Promotions RANK Company w/ Display Per Store Promotion Per Store
1 Kellogg 71% 9.5 99% 33.3
2 GeneralMills 68% 9.0 92% 35.1
3 Quaker 41% 5.6 75% 14.2
4 Post 30% 3.9 62% 10.6
5 Kashi 0% 0.0 33% 2.9
6 Nature’sPath 6% 5.2 15% 2.8
7 CascadianFarm 5% 4.0 25% 6.5
8 Barbara’sBakery 5% 3.0 24% 5.8
9 Annie’s 0% 0.0 6% 4.2
*Fromasampleof87supermarketsin18majormarkets
Least

Cereal FACTS 75
Ranking Table 8
On-Package Child Engagement Features Ranking by number of child engagement features per box*
Includes packaging for all child and family brands found in the supermarket from october 2008 through March 2009
Average number of RANK Company Brand features per box
1 GeneralMills Trix 3.4
2 GeneralMills LuckyCharms 3.0
2 (tie) Post FruityorCocoaPebbles 3.0
4 GeneralMills CocoaPuffs 2.8
5 Quaker Cap’nCrunch 2.4
6 Kellogg FrootLoops 2.4
7 GeneralMills HoneyNutCheerios 2.4
8 GeneralMills CookieCrisp 2.3
9 CascadianFarm CliffordCrunch 2.0
9 (tie) CascadianFarm CinnamonCrunch 2.0
9 (tie) Kellogg CookieCrunch 2.0
9 (tie) Post Honeycomb 2.0
13 Kellogg FrostedFlakes 1.8
14 GeneralMills GoldenGrahams 1.8
15 Nature’sPath EnviroKidzOrganic 1.7
16 Kellogg AppleJacks 1.7
17 GeneralMills CinnamonToastCrunch 1.5
18 GeneralMills Reese’sPuffs 1.5
19 Kellogg RiceorCocoaKrispies 1.4
20 Kellogg CornPops 1.2
21 Barbara’sBakery OrganicWildPuffs 1.0
21 (tie) Kashi MightyBites 1.0
21 (tie) Kellogg HoneySmacks 1.0
24 Annie’s Bunnies 0.8
25 GeneralMills Kix 0.8
26 Kellogg Mini-Wheats 0.7
27 Barbara’sBakery Puffins 0.6
28 GeneralMills Cheerios(excludingHoneyNut) 0.6
29 GeneralMills Chex 0.1
30 Quaker Life 0.0
30 (tie) CascadianFarm HoneyNutO’s 0.0
30 (tie) CascadianFarm PurelyO’s 0.0
30 (tie) Kashi HoneySunshine 0.0
30 (tie) Post RaisinBran 0.0
*Childengagementfeaturesincludepuzzles,gamesandcartooncharactersonthebox,promotionsandadvergamesURLs
Average number of features RANK Company per box
1 Post 2.0
2 Nature’sPath 1.7
3 Kellogg 1.4
4 GeneralMills 1.4
5 Quaker 1.2
6 Annie’s 0.8
7 Kashi 0.7
8 Barbara’sBakery 0.6
9 CascadianFarm 0.4
Least
Most

Cereal FACTS 76
Ranking Table 9
On-Package Child Health and Ingredient Claims Ranking by average number of health and ingredient claims per box*
Includes packaging for all child and family brands found in the supermarket from october 2008 through March 2009
Average claims RANK Company Brand per box
1 Barbara’sBakery OrganicWildPuffs 5.0
2 Annie’s Bunnies 4.2
3 GeneralMills LuckyCharms 3.8
4 GeneralMills HoneyNutCheerios 3.7
5 GeneralMills GoldenGrahams 3.5
5 (tie) GeneralMills CinnamonToastCrunch 3.5
7 GeneralMills Cheerios(excludingHoneyNut) 3.3
8 GeneralMills Reese’sPuffs 3.3
9 GeneralMills CookieCrisp 3.0
10 GeneralMills Trix 2.9
10(tie) GeneralMills Kix 2.9
12 GeneralMills CocoaPuffs 2.8
13 GeneralMills Chex 2.6
14 Kashi MightyBites 2.5
14 (tie) Nature’sPath EnviroKidzOrganic 2.5
16 Quaker Life 2.3
16 (tie) Post RaisinBran 2.3
18 Barbara’sBakery Puffins 2.3
19 CascadianFarm CinnamonCrunch 2.0
19(tie) CascadianFarm PurelyO’s 2.0
19(tie) Kashi HoneySunshine 2.0
22 CascadianFarm HoneyNutO’s 1.7
23 Kellogg Mini-Wheats 1.1
24 CascadianFarm CliffordCrunch 1.0
25 Kellogg FrootLoops 0.9
26 Kellogg FrostedFlakes 0.7
27 Kellogg HoneySmacks 0.7
27 (tie) Post FruityorCocoaPebbles 0.7
27 (tie) Post Honeycomb 0.7
30 Kellogg RiceorCocoaKrispies 0.4
31 Kellogg AppleJacks 0.3
31(tie) Kellogg CornPops 0.3
33 Quaker Cap’nCrunch 0.0
33(tie) Kellogg CookieCrunch 0.0
*Includesingredientclaims,healthclaimsandhealth-relatedURLs
Average claims RANK Company per box
1 Annie’s 4.2
2 GeneralMills 3.2
3 Barbara’sBakery 2.6
4 Nature’sPath 2.5
5 Kashi 2.3
6 CascadianFarm 1.7
7 Quaker 1.2
8 Post 1.1
9 Kellogg 0.7
Least
Most

Cereal FACTS 77
Ranking Table 10
FACTS Index Ranking by combined nutrition quality and marketing exposure
FACTS Marketing Nutrition Index Company Brand exposure* Multiplier**
90 Kellogg Mini-Wheats 45 10
70 Quaker Life 17 -9
68 GeneralMills Chex 11 -18
67 Quaker Cap’nCrunch 9 -25
58 Post Honeycomb 33 -16
56 GeneralMills Cheerios(excludingHoneyNut) 56 -10
54 Kellogg RiceandCocoaKrispies 34 -18
54 GeneralMills CookieCrisp 28 -22
52 Kellogg AppleJacks 32 -22
43 Kellogg FrootLoops 41 -24
40 Kellogg CornPops 40 -26
38 Kellogg FrostedFlakes 57 -19
38 Post FruityandCocoaPebbles 47 -24
32 GeneralMills CocoaPuffs 55 -23
32 GeneralMills Reese’sPuffs 46 -28
19 GeneralMills Trix 69 -24
16 GeneralMills HoneyNutCheerios 99 -18
14 GeneralMills CinnamonToastCrunch 72 -26
0 GeneralMills LuckyCharms 87 -26
*MarketingExposureisacombinedmeasureofalltypesofexposuretocerealmarketing.Themeasurerangesfrom0(least)to100(most).
**NutritionMultiplierisameasureofoverallnutritionqualityderivedfromtheNutritionProfilingIndexscore.
Worst
Best

Cereal FACTS 78
Consumer groups and public health organisations have called for bans on the advertising of ‘unhealthy’ food to children for several decades. The definition of ‘unhealthy’ has been a topic of considerable argument. Food companies have resisted having any products described as ‘unhealthy’ but have gradually developed a number of different schemes which define products they believe are ‘healthy’ (or at least ‘healthier’) and appropriate for advertising to children. Health and consumer groups have called for a single scheme - or ‘nutrient profiling model’ - consistent with international recommendations for preventing chronic disease and with national food-based dietary guidelines. A simple system which could be applied to all products and with a clearly defined cut-off for defining which foods are not suitable for advertising to children would be ideal.
What sort of nutrient profiling model?There are a number of technical questions which need to be considered:
■ Which nutrients should be included?
■ Should the profiling criteria differ according to the type of food being profiled, or should all foods be assessed using the same criteria?
■ What is the reference amount: for example, should foods be compared per 100g, per 100 kcal or per portion or serving?
■ Should the final result be presented as a single figure or as a set of figures relating to different aspects of the nutritional quality of the food?
The answers to these questions depend on the purpose of the nutrient profiling model. If the requirement is simply to define the presence of ‘high’ or ‘low’ levels of nutrients, then the methodological questions are fairly easily answered, and indeed nutrient profiling in this sense has been widely accepted for national and international legislation. Codex Alimentarius and various other bodies have defined threshold values for making ‘high’ and ‘low’ claims for nutrients in food products, per unit of food, and include specific requirements for presenting information on which a nutrient-related claim is made. A similar approach is used for claims which make comparisons such as a ‘higher’ or ‘lower’ level of a nutrient relative to similar foods.
An extension of these principles is to combine several different nutrients into a single score which can be used to show that a product is nutritionally better than another, similar one. For example, a manufacturer or retailer may promote a ‘healthy eating’ range, or a government or public health body may endorse a labelling scheme to identify ‘better for you’ products. Several schemes to identify healthier options within classes of foods are already available, such as the US manufacturers’ Smart Choices programme (http://www.smartchoicesprogram.com/nutrition.html) and the Swedish Keyhole labelling scheme (http://www.slv.se/upload/nfa/documents/food_regulations/Keyhole_2005_9.pdf).
In 2007 a review of nutrient profiling models commissioned by the UK Food Standards Agency identified over 40 different schemes (http://www.food.gov.uk/healthiereating/advertisingtochildren/nutlab/nutprofilereview/nutprofilelitupdatedec07). More schemes have been developed since then. They vary considerably in the nutrients they consider (ranging from just a few to over 20) and whether they use different criteria according to the type of food being profiled or whether all foods are assessed using the same criteria. The Smart Choices scheme has different criteria for 19 different food categories, the Keyhole scheme has 26 food categories, and one scheme – used for the Australian Heart Foundation Tick Program (http://www.heartfoundation.org.au/sites/tick/Pages/default.aspx) has different criteria for more than 70 food categories. The schemes also vary in the reference amounts they are based upon, and in the measurement criteria they use to score the different aspects of nutritional quality.
For the purposes of defining foods suitable for advertising to children, the nutrient profiling model needs to be relatively simple to understand and to apply. An ideal model uses easily-available information, it should take into account ‘positive’ elements (e.g. micronutrients, fruit, vegetables and dietary fibre) and ‘negative’ elements (e.g. saturated fats, salt/sodium and added sugars) and it should provide a single answer which lies on a single scale that runs from ‘healthy’ to ‘unhealthy’.
The UK modelThe UK regulator for broadcast media is the Office of Communications, usually called Ofcom, and in anticipation of new regulations to control advertising to children, it requested advice on how to profile the nutrients in foods in
Appendix A
The UK Ofcom Nutrient Profiling (NP) Model Defining ‘healthy’ and ‘unhealthy’ foods and drinks for TV advertising to childrenMike Rayner, Peter Scarborough, British Heart Foundation Health Promotion Research Group, Department of Public Health, University of Oxford
Tim Lobstein, International Obesity Task Force, London

Cereal FACTS 79
order to judge their suitability for advertising to children. In response, the UK Food Standards Agency commissioned the British Heart Foundation Health Promotion Research Group at Oxford University to carry out a research programme to develop a nutrient profiling model. The development of the model has been well-documented elsewhere (http://www.food.gov.uk/foodlabelling/researchandreports/nutrientprofiles). The model was formally passed to Ofcom at the end of 2005 and has subsequently been incorporated into a regulation (http://www.ofcom.org.uk/consult/condocs/foodads_new/statement). This prohibits advertising of specified food and beverages during children’s programmes and programmes for which children under the age of 16 years form a disproportionate part of the audience.
In the development of the model, various prototypes were compared with each other and with a set of foods categorised for their compliance with healthy eating guidelines. This was first done relatively informally by a small ‘expert group’ consisting of academic nutritionists and representatives from industry, consumer organisations and public health bodies, but then more formally using an on-line survey of professional nutritionists in the UK. The survey asked the nutritionists to assess 40 foods for their ‘healthiness’. The 40 foods were randomly drawn from 120 different food products representative of the UK diet. The professionals’ ratings were compared with the ratings obtained from the prototype models (http://www.food.gov.uk/multimedia/pdfs/npreportsept05.pdf).
The best prototype model showed a close correlation with the professional ratings of r = 0.80 (95% CI 0.73-0.86). In this model, a single score based on a set of ‘negative’ indicators (energy, saturated fat, sugars and sodium) is counter-balanced by a score based on ‘positive’ indicators (protein, fibre and ‘fruit, vegetables and nuts’). The protein score was found to be a good indicator of a range of micronutrients that would otherwise merit inclusion in the model. All measurement criteria were per 100 grams. The final model included various refinements to allow for some anomalous foods: in particular, the protein score was disallowed if the score for ‘fruit, vegetables and nuts’ was too low.
The model generates a final single score which determines whether the food can be advertised to children. Two threshold levels were set: one threshold for all food products and another for beverages.
Note that the model uses a 100g measure rather than actual serving size. This is justified on the basis that the model is designed to measure the nutritional quality of the food regardless of the way it is eaten. Using a 'per serving' approach would have been possible but to do so introduces several difficulties, not least of which is the fact that serving sizes and consumption patterns are an individual matter and cannot be standardised, especially across different age groups.
Early prototypes of the model gave a score for added sugars (technically non-milk extrinsic sugars), but this was later replaced with a score for total sugar, a move which received substantial support from food manufacturers who said they faced technical difficulties in analysing added sugars and that information on total sugars is a requirement of UK (based on European) food labelling legislation. The contribution of foods high in natural sugars to a balanced diet is addressed through the inclusion of criteria for protein (in which dairy products usually score well) and for fruit and vegetables.
Early prototypes also gave scores for calcium, iron and n-3 poly-unsaturated fatty acids. These were later replaced with a score for protein, primarily to make scoring foods easier (protein levels are required by food labelling legislation but calcium, iron and n-3 polyunsaturated fatty acid levels are not) but also because prototype models which gave a score for protein rather than the other three nutrients gave similar results.
Subsequent to the adoption of the model the British Heart Foundation Health Promotion Research Group have further investigated the validity of the model - and in particular have shown that people in the UK who have less healthy diets consume more of their calories in the form of foods defined as less healthy by the model.
The model was developed for the regulation of food advertising in the UK, and was tested on a range of foods in UK national databases. For use outside the UK the model should be assessed using relevant national food databases, and for international use it should be assessed on a broad range of products from different national cuisines.
Added value and further applications of nutrient profilingA clear result of using nutrient profiling as a means of assessing eligibility for marketing is that the profiling scheme becomes a driver for product reformulation. Processed foods that fail to meet the criteria permitting their advertising to children might benefit from reformulation, enabling the manufacturer to continue to advertise them. For example, most breakfast cereals promoted on children’s television are high in sugar, and some are also high in salt. It is hoped that the controls in marketing may stimulate manufacturers to produce products that are lower in sugar and salt, thereby avoiding the advertising restrictions.
Although developed for restrictions on marketing through broadcast media, the model also has the potential to be used as the basis for developing regulations for non-broadcast advertising and promotion – for example for product placements in films or for internet advertising.
Appendix A

Cereal FACTS 80
Nutrient profiling models could clearly support a wide range of public health initiatives. They are already used extensively as the basis of food labelling schemes. Note however that the front-of-pack ‘traffic light’ labelling scheme recommended for use by the UK Food Standards Agency uses a different nutrient profiling scheme than the one that has been developed for restrictions on marketing of foods to children. The three ‘traffic light’ colours indicate high, medium and low levels, for each of four nutrients: fat, saturated fats, sugars and salt/sodium. Nutrient profiling could also be used to support labelling in catering outlets, where, for example, traffic light signalling could help customers select healthier items from menus in advance of ordering their food.
In order to prevent poor quality foods from being promoted with health claims on the basis of a single ‘good’ ingredient, nutrient profiling can be used to decide if a food is sufficiently ‘healthy’ to be allowed to carry a health claim. The government body responsible for health claims regulation in Australia and New Zealand (Food Standards Australia New Zealand) has adapted the UK Ofcom model for assessing whether foods should be allowed to carry health claims. Their site includes a calculator that returns a score from the model (http://www.foodstandards.gov.au/foodmatters/healthnutritionandrelatedclaims/nutrientprofilingcal3499.cfm). The European Commission is also in the process of developing a nutrient profiling scheme that would define which foods may carry a permitted nutrition or health claim.
The use of nutrient profiling can be extended to contractual relationships: for example the quality criteria for products supplied for school meal services and institutional catering in the workplace. The health sector, armed service, prisons and elderly care could include nutritional profiling standards, which in turn could be used for contract compliance and for health impact assessments of meal service policies.
Fiscal policies designed to benefit public health may, if they are considered appropriate, also benefit from using nutrient profiling as an assessment tool. One criticism made of the suggestion to impose a tax on foods such as soft drinks and snack foods is the difficulty of administering the tax because of the problem of defining what constitutes a soft drink, a snack food, etc. Nutrient profiling provides a method for categorising foods for taxation or subsidy. A taxation system based on nutrient profiling would also encourage manufacturers to reformulate their recipes and adjust their product portfolio.
The UK Ofcom nutrient profiling model in detailThe model provides a single score for any given food product, based on calculating the number of points for
‘negative’ nutrients which can be offset by points for ‘positive’ nutrients. Points are allocated on the basis of the nutritional content in 100g of a food or drink.
There are three steps to working out the overall score for the food or drink.
1. Calculate the total 'A' points A maximum of ten points can be awarded for each ingredient (energy, saturated fat, sugar and sodium). The total ‘A’ points are the sum of the points scored for each ingredient.
Total 'A' points = [points for energy] + [points for saturated fat] + [points for sugars] + [points for sodium]
If a food or drink scores 11 or more 'A' points then it cannot score points for protein unless it also scores 5 points for fruit, vegetables and nuts.
2. Calculate the total 'C' points A maximum of five points can be awarded for each ingredient. The total ‘C’ points are the sum of the points for each ingredient (note that you should choose one or other of the dietary fibre columns according to how the fibre content of the food or beverage was calculated).
Total 'C' points = [points for fruit, vegetables and nut content] + [points for fibre (either NSP or AOAC)] + [points for protein]
NB. Guidance on scoring fruit, vegetables and nut content is available from the Food Standards Agency (http://www.foodstandards.gov.uk/multimedia/pdfs/nutprofpguide.pdf).
Points Energy Sat Fat Total Sugar Sodium (kJ) (g) (g) (mg)
0 ≤335 ≤1 ≤4.5 ≤90
1 >335 >1 >4.5 >90
2 >670 >2 >9 >180
3 >1005 >3 >13.5 >270
4 >1340 >4 >18 >360
5 >1675 >5 >22.5 >450
6 >2010 >6 >27 >540
7 >2345 >7 >31 >630
8 >2680 >8 >36 >720
9 >3015 >9 >40 >810
10 >3350 >10 >45 >900
Appendix A

Cereal FACTS 81
3. Calculate the overall score If a food scores less than 11 'A' points then the overall score is calculated as follows:
Overall score = [total 'A' points] minus [total 'C' points].
If a food scores 11 or more 'A' points but scores 5 points for fruit, vegetables and nuts then the overall score is calculated as follows:
Overall score = [total 'A' points] minus [total 'C' points]
If a food scores 11 or more 'A' points but also scores less than 5 points for fruit, vegetables and nuts then the overall score is calculated without reference to the protein value, as follows:
Overall score = [total 'A' points] minus [fibre points + fruit, vegetables and nuts points only]
The model can be adjusted to take account of changes in public health nutritional policy. Within the model any threshold can be defined according to the judgment of the
policy makers and their scientific advisers. For the purposes of the advertising controls introduced in the United Kingdom:
a food is classified as 'less healthy' where it scores 4 points or more, and
a drink is classified as 'less healthy' where it scores 1 point or more.
Frequently asked questionsThere are a number of frequently asked questions about how to use the model to calculate scores for products. One of the most frequently asked questions is: ‘What counts as a food and what as a drink?’ For the purpose of the model a drink is defined as 'any liquid food, excluding oils, soups, condiments (vinegar, salad cream etc.) and dressings.'
Answers to other questions such as ‘Should scores be calculated for products as eaten or as sold?’, ‘How do you calculate the scores for foods where nutritional information is provided by volume rather than weight?’ and worked examples are available in technical advice provided by the Food Standards Agency (http://www.food.gov.uk/multimedia/pdfs/techguidenutprofiling.pdf).
The model can be adjusted so that points for foods and drinks fall on a scale from 1 to 100 where 1 is the least healthy and 100 is the most healthy product using a simple formula: NUTRITION PROFILING INDEX SCORE = (-2)*OLD SCORE + 70
The table below gives an indication of how the model categorises foods.
Points Fruit, Veg NSP Fibre or AOAC Protein & Nuts (%) (g) Fibre (g) (mg)
0 ≤40 ≤0.7 ≤0.9 ≤1.6
1 >40 >0.7 >0.9 >1.6
2 >60 >1.4 >1.9 >3.2
3 - >2.1 >2.8 >4.8
4 - >2.8 >3.7 >6.4
5 >80 >3.5 >4.7 >8.0
Examples of foods that can and cannot be advertised according to the UK Ofcom nutrient profiling model
Foods that can be advertised Foods that cannot be advertised (points <4 for foods; <1 for drinks) (score ≥4 for foods; score ≥1 for drinks)
Wholemealandwhitebread Potatocrispsincludinglowfat
Muesliandwheatbiscuitcerealwithnoaddedsugar Mostbreakfastcereals
Freshfruit Cheddarcheese,halfandfullfat
Mostnuts Butterandmargarine
Takeawaysaladswithnodressingorcroutons Mostsausagesandburgers
Mostbrandsofbakedbeans Raisinsandsultanas
Somebrandsofbakedovenchips Cookies
Somebrandsofchickennuggets Confectionary
Fishfingers Frenchfries
Chickenbreast Peanutbutter
Unsweetenedfruitjuice Mayonnaise,reducedandfullcalorie
Skimmed,semi-skimmedandwholemilk Mostpizzas
Dietcola Sweetenedmilkshakes
Colaandothercarbonatedsweeteneddrinks
Notethatsomeoftheseclassificationsdependontheparticularrecipefortheproduct.
Source:AnnexIIofRaynerM,ScarboroughP,BoxerA,StockleyL.Nutrientprofiles:Developmentoffinalmodel.London:FoodStandardsAgency,2005.(http://www.food.gov.uk/multimedia/pdfs/nutprofr.pdf)
Appendix A

Cereal FACTS 82
Annotated reading list about the UK Ofcom nutrient profile model
The history of the model.
These reports describe the development of the UK Ofcom nutrient profiling model. 1. Rayner M, Scarborough P, Stockley L. Nutrient Profiles:
Options for definitions for use in relation to food promotion and children’s diets. London: Food Standards Agency, 2004. http://www.food.gov.uk/multimedia/pdfs/nutrientprofilingfullreport.pdf
2. Stockley L. Report on a scientific workshop to assess the Food Standards Agency’s proposed approach to nutrient profiling. London: Food Standards Agency, 2005. http://www.food.gov.uk/multimedia/pdfs/nutprofworkshop250205.pdf
3. Rayner M, Scarborough P, Stockley L, Boxer A. Nutrient Profiles: Further refinement and testing of model SSCg3d. London: Food Standards Agency, 2005. http://www.food.gov.uk/multimedia/pdfs/npreportsept05.pdf
4. Rayner M, Scarborough P, Boxer A, Stockley L. Nutrient profiles: Development of final model. London: Food Standards Agency, 2005. http://www.food.gov.uk/multimedia/pdfs/nutprofr.pdf
The model was agreed at a board meeting of the UK Food Standards Agency held on 13th October 2005. See the minutes of this meeting. http://www.food.gov.uk/aboutus/ourboard/boardmeetings/boardmeetings2005/boardmeeting101305/boardminutes131005
Ofcom agreed to use the model in February 2007. See Office of communications. Television Advertising of Food and Drink Products to Children Final statement. London: Ofcom, 2007. http://www.ofcom.org.uk/consult/condocs/foodads_new/statement/statement.pdf
In 2007 the UK Food Standards Agency set up an Independent Review Panel to assess ‘the effectiveness of the nutrient profiling model at differentiating foods on the basis of their nutrient composition’. As part of that review the BHF Health Promotion Research Group was commissioned to carry out a review of nutrient profiling models. See:
5. Stockley L, Rayner M, Kaur A . Nutrient profiles for use in relation to food promotion and children’s diet: Update of 2004 literature review. London: Food Standards Agency, 2008. http://www.food.gov.uk/healthiereating/advertisingtochildren/nutlab/nutprofilereview/nutprofilelitupdatedec07
The Independent Review Panel finished its work in March 2009. See the report of their review for a board meeting of the UK Food Standards Agency of 25th March 2009. http://www.food.gov.uk/multimedia/pdfs/board/fsa090306v2.pdf
At this meeting the UK Food Standards Agency accepted the finding of the Independent Review Panel ‘that the nutrient profiling model was generally scientifically robust and fit for purpose’ and considered that there was no need to modify the model for the time being. See the minutes of this meeting. http://www.food.gov.uk/multimedia/pdfs/board/boardmins090325.pdf
Papers on the model published in peer-reviewed journals
Meanwhile the BHF Health Promotion Research Group has published a series of papers relating to the development of the model and its validation. These publications include the following:
6. Rayner M, Scarborough P, Williams C. The origin of Guideline Daily Amounts and the Food Standards Agency’s guidance on what counts as ‘a lot’ and ‘a little’. Public Heath Nutrition 2003: 7 (4); 549-556.
7. Scarborough P, Rayner M, Stockley L. Developing nutrient profile models: a systematic approach. Public Health Nutrition 2007: 10; 330-336.
8. Scarborough P, Rayner M, Stockley , Black A. Nutrition professionals’ perception of the ‘healthiness’ of individual foods, Public Health Nutrition 2007: 10; 346-353.
9. Scarborough P, Boxer A, Rayner M, Stockley L. Testing nutrient profile models using data from a survey of nutrition professionals, Public Health Nutrition 2007: 10; 337-345.
10. Arambepola C, Scarborough M, Rayner M. Validating a nutrient profile model, Public Health Nutrition 2008: 11; 371–378.
11. Arambepola C, Scarborough P, Boxer A, Rayner M. Defining ‘low in fat’ and ‘high in fat’ when applied to a food. Public Health Nutrition 2009: 12: 341-350.
And other papers have discussed the model including:
Azais-Braesco, V, Goffi, C, Labouze, E. Nutrient profiling: comparison and critical analysis of existing systems. Public Health Nutrition 2006; 9(5): 613–622.
Lobstein T, Davies S. Defining and labelling 'healthy' and 'unhealthy' food. Public Health Nutrition 2009: 12; 331-340.
Appendix A

Cereal FACTS 83
Calculation of Cereal FACTS IndexThe Cereal FACTS Index synthesizes the nutrition and marketing exposure information presented in this report to provide one overall score for each child and family brand.
Individual Components and MeasuresA. Nutrition Multiplier: NPI Score
B. In-store Marketing Exposure: % of Total Shelf Facings
C. Adult Marketing Exposure:
1. Advertising Spending Without TV*
2. TV GRPs 18-49 Years*
D. Youth Marketing Exposure:
1. TV GRPs 2-5 Years*
2. TV GRPs 6-11 Years*
3. TV GRPs 12-17 Years*
4. TV GRPs African American 2-17 Years*
5. TV GRPs Spanish Language 2-17 Years*
6. Website GRP Equivalent: 2-11 Years**
7. Website GRP Equivalent: 12-17 Years**
8. Website GRP Equivalent: African American 2-17 Years**
9. Third Party Advertising GRP Equivalent***
Procedure1. To award positive points for marketing cereals with good
overall nutrition quality and negative points for marketing cereals with poor nutrition quality, we subtracted 62 from the NPI score to produce a positive or negative Nutrition Multiplier.
A1 = NPI Score - 62
2. To combine the three marketing score components, we first standardized the results for the individual components.
a) For In-store Marketing Exposure, we calculated z scores for % of Total Shelf Facings:
B1 = z (% of Total Shelf Facings)
b) For Adult Marketing Exposure, we calculated separate z scores for both Advertising Spending Without TV and TV GRPs 18-49 Years. We then
calculated a weighted average according to total television advertising spending (90%) versus all other advertising spending (10%).
C1 = (0.1 * z(Advertising Spending Without TV) + (0.9 * z(TV GRPs 18-49 Years))
c) For Youth Marketing Exposure, we first multiplied the youth GRP measures by the appropriate age multipliers. We then summed all youth GRP measures. Finally, we calculated the z score for the resulting sum of GRPs.
D1 =
z {TV GRPs 2-5 Years * 5
+ TV GRPs 6-11 Years * 2
+ TV GRPs 12-17 Years
+ TV GRPs African American 12-17 Years
+ TV GRPs Spanish Language 2-17 Years
+ Website GRP Equivalents: 2-11 Years * 2
+ Website GRP Equivalents: 12-17 Years
+ Website GRP Equivalents: African American 2-17 Years
+ Third Party Advertising GRP Equivalents}
3. We then added the number required to bring the lowest resulting z score to zero in each of the above standardized marketing score components (B1, C1 and D1) to achieve a score that ranged from 0 and higher.
B2 = B1 + .89
C2 = C1 + .55
D2 = D1 + .63
4. We then calculated a weighted average Marketing Exposure score according to the assigned component weightings.
EWtd = (B2*.15) + (C2*.15) + (D2*.7)
5. We then multiplied the Nutrition Multiplier by the Marketing Exposure score to produce an overall nutrition and marketing score.
F = EWtd * A1
6. Finally, we indexed the resulting scores to produce an Index from 0 (worst overall combined nutrition/marketing score) to 100 (best overall score), with 75 equivalent to a neutral score of 0.
Index = 2*F + 75
Appendix B
* The Nielsen Company (2009) **comScore Media Metrix Key Measures Report ***comScore Ad Metrix Advertiser Report

Cereal FACTS 84
Calculating GRP EquivalentsTo combine comparable exposure numbers for television and the internet, we calculated GRP equivalents for young people’s exposure to cereal company websites and advertising on third party websites (i.e., % of young people exposed X number of times exposed X 100). To provide a comparable time period to the television exposure data, we calculated GRP equivalents over 15 months.
Website GRP Equivalent calculation
Measures from comScore Media Metrix Key Reports:
■ Total Unique Visitors to the website for each month (u_c)
■ Average Visits per Visitor for each month (v)
■ Average Minutes per Visit to the website for each month (m)
■ Total Number of Months for which data are available (n)
■ Total Unique Visitors to the Internet for each month (u_i)
1. We first divided the Total Unique Visitors to the website for each month by Total Unique Visitors to the Internet for the same month. We then multiplied this quotient by the Average Visits per Visitor to the website in the same month and multiplied the resulting number by 100. This number is the Reach X Visits for one month (RV).
RV = u_c*v*100/ u_i
2. We then calculated the Average Reach X Visits (ARV) for all available months and multiplied the average monthly number by 15 to create a 15-month total (TRV).
ARV = sum (RV)/n
TRV = 15*ARV
3. We then converted the Average Minutes per Visit to the website to :30 sec TV Ad Equivalents (TAE). For example, if the average visit to the website lasted 15 minutes, those 15 minutes spent on the website were equivalent to 30 :30 sec television ads. We then multiplied TRV by TV Ad Equivalents to create the final 15-month Website GRP Equivalent.
TAE = m*2
Website GRP Equivalent = TRV*TAE
4. Finally, for Millsberry.com and Postopia.com, we allocated the Website GRP Equivalents to individual brands according to the percentage of pages that mentioned the brand.
■ Allocations for Millsberry.com: Reeses Puffs (9.0%), Trix (82.0%), Lucky Charms (79.6%), Honey Nut Cheerios (79.0%) and Cinnamon Toast Crunch (7.2%)
■ Allocations for Postopia.com: Fruity and Cocoa Pebbles (100%) and Honeycomb (97.3%).
Third Party Advertising GRP Equivalent calculation
Measures from comScore Ad Metrix Advertising Report:
■ Total Number of Ad Views on youth websites for each month (ad_yw)
■ Total Number of Months for which data are available (n)
■ Average number of Unique Visitors to the Internet (avg_u_i)
1. We first calculated the total Number of Ad Views for each child cereal brand that appeared on youth websites, and created a monthly average according to the Number of Months that data that were available (AAV).
AAV = sum (ad_yw)/n
2. We then multiplied the monthly average times 15 to create a 15-month total (TAV).
TAV = 15*AAV
3. We then divided TAV by the Average number of Unique Visitors to the Internet, ages 2-11, for the 15-month time period and multiplied the quotient by 100 for the Third Party Advertising GRP Equivalent.
Third Party Advertising GRP Equivalent = TAV / avg_u_i
4. Finally, for Millsberry.com and Postopia.com, we allocated the Third Party Advertising GRP Equivalents to individual brands according to the percentage of pages that mentioned the brand.
Allocations for Millsberry.com: Reeses Puffs (9.0%), Trix (82.0%), Lucky Charms (79.6%), Honey Nut Cheerios (79.0%) and Cinnamon Toast Crunch (7.2%)
Allocations for Postopia.com: Fruity and Cocoa Pebbles (100%) and Honeycomb (97.3%).
Appendix B

Cereal FACTS 85
In-s
tore
A
dult
Yout
h
Nut
ritio
nM
arke
ting
Mar
ketin
gM
arke
ting
C
ompo
nent
E
xpos
ure
Exp
osur
eE
xpos
ure
A
dver
tisin
g
onth
ird
C
erea
lweb
site
spa
rty
Te
levi
sion
adv
ertis
ing*
fo
rch
ildre
n**
web
site
s***
W
ebsi
te
GR
P
Thi
rd
%o
fA
dver
tisin
g
T
VG
RP
sT
VG
RP
sW
ebsi
te
Web
site
E
quiv
alen
t:P
arty
To
tal
Spe
ndin
gT
VG
RP
sT
VG
RP
sT
VG
RP
sT
VG
RP
sA
fric
an
Spa
nish
-G
RP
G
RP
A
fric
an
Adv
ertis
ing
NP
IS
helf
With
out
18-4
92-
56-
11
12-1
7A
mer
ican
la
ngua
ge
Equ
ival
ent:
E
quiv
alen
t:
Am
eric
an
GR
PC
ompa
ny
Bra
nd
Sco
re
Faci
ngs
TV
Ye
ars
Year
sYe
ars
Year
s2-
17Y
ears
2-
17Y
ears
2-
11Y
ears
12
-17
Year
s2-
17Y
ears
E
quiv
alen
t
Gen
eral
Mill
sLu
cky
Cha
rms
36
1.38
%
2782
10
66
7110
78
28
3306
68
90
033
25
3175
86
71
9636
Gen
eral
Mill
sC
inna
mon
Toa
stC
runc
h37
1.
47%
19
59
1959
75
38
8169
39
45
7584
0
300
286
782
665
Gen
eral
Mill
sH
oney
Nut
Che
erio
s44
1.
93%
97
531
86
7343
79
92
4333
74
50
1182
33
00
3151
86
06
8066
Gen
eral
Mill
sTr
ix
38
0.97
%
567
814
5470
58
27
2471
51
61
034
25
3271
89
32
7597
Gen
eral
Mill
sR
eese
’sP
uffs
34
0.
81%
10
54
706
4748
51
68
2185
45
84
039
137
110
11
3399
Gen
eral
Mill
sC
ocoa
Puf
fs
39
1.22
%
74
927
6291
68
01
2868
60
50
00
00
0
Pos
tFr
uity
or
Coc
oaP
ebbl
es
38
1.58
%
319
722
4557
53
97
2309
47
96
087
237
366
110
4
Kel
logg
Fr
oste
dF
lake
s43
2.
56%
26
10
1493
52
88
5782
28
40
5669
48
88
319
66
Kel
logg
C
orn
Pop
s36
1.
43%
45
390
638
82
4441
26
68
4624
0
10
49
463
Kel
logg
Fr
ootL
oops
38
1.
94%
92
364
639
57
4271
18
07
3947
0
16
521
58
9
Kel
logg
A
pple
Jac
ks
40
1.27
%
1164
51
331
62
3471
14
74
3196
0
33
20
46
802
Gen
eral
Mill
sC
ooki
eC
risp
40
0.84
%
900
462
3099
33
89
1418
30
08
03
210
0
Kel
logg
R
ice
orC
ocoa
kris
pies
44
2.
50%
31
48
3031
11
35
1308
20
38
2347
0
66
40
Gen
eral
Mill
sC
heer
ios
(exc
ludi
ngH
oney
Nut
)52
5.
27%
44
21
4568
15
28
1873
26
77
2042
39
15
35
0
Pos
tH
oney
com
b46
0.
69%
28
358
732
97
4005
18
15
3513
0
849
363
643
101
Qua
ker
Cap
’nC
runc
h37
2.
17%
27
80
00
00
00
00
0
Gen
eral
Mill
sC
hex
44
2.24
%
2914
16
540
54
74
0
3
510
0
Qua
ker
Life
53
2.
10%
48
11
839
334
423
645
630
00
00
0
Gen
eral
Mill
sG
olde
nG
raha
ms
36
0.83
%
00
00
00
00
00
0
Gen
eral
Mill
sK
ix
53
1.36
%
103
00
00
00
00
00
Kel
logg
H
oney
Sm
acks
46
0.
55%
0
00
00
00
00
00
Pos
tR
aisi
nB
ran
48
0.62
%
00
00
00
00
00
0
Bar
bara
’sB
aker
yP
uffin
s52
0.
64%
72
23
4
56
00
00
00
Nat
ure’
sP
ath
Env
iroki
dzo
rgan
ic
51
0.61
%
251
00
00
00
00
00
Pos
tG
olde
nC
risp
46
0.25
%
00
00
00
00
00
0
Cas
cadi
anF
arm
H
oney
Nut
O’s
44
0.
21%
0
00
00
00
00
00
Ann
ie’s
B
unni
es
51
0.28
%
00
00
00
00
00
0
Pos
tA
lpha
Bits
46
0.
19%
0
00
00
00
00
00
Kel
logg
C
ooki
eC
runc
h40
0.
13%
0
00
00
00
00
00
Kel
logg
D
isne
yH
igh
Sch
oolM
usic
al
44
0.12
%
00
00
00
00
00
0
Kel
logg
S
mor
z38
0.
10%
0
00
00
00
00
00
Cas
cadi
anF
arm
P
urel
yO
’s
46
0.12
%
00
00
00
00
00
0
Appendix B
continued

Cereal FACTS 86
In-s
tore
A
dult
Yout
h
Nut
ritio
nM
arke
ting
Mar
ketin
gM
arke
ting
C
ompo
nent
E
xpos
ure
Exp
osur
eE
xpos
ure
A
dver
tisin
g
onth
ird
C
erea
lweb
site
spa
rty
Te
levi
sion
adv
ertis
ing*
fo
rch
ildre
n**
web
site
s***
W
ebsi
te
GR
P
Thi
rd
%o
fA
dver
tisin
g
T
VG
RP
sT
VG
RP
sW
ebsi
te
Web
site
E
quiv
alen
t:P
arty
To
tal
Spe
ndin
gT
VG
RP
sT
VG
RP
sT
VG
RP
sT
VG
RP
sA
fric
an
Spa
nish
-G
RP
G
RP
A
fric
an
Adv
ertis
ing
NP
IS
helf
With
out
18-4
92-
56-
11
12-1
7A
mer
ican
la
ngua
ge
Equ
ival
ent:
E
quiv
alen
t:
Am
eric
an
GR
PC
ompa
ny
Bra
nd
Sco
re
Faci
ngs
TV
Ye
ars
Year
sYe
ars
Year
s2-
17Y
ears
2-
17Y
ears
2-
11Y
ears
12
-17
Year
s2-
17Y
ears
E
quiv
alen
t
Cas
cadi
anF
arm
C
inna
mon
Cru
nch
50
0.14
%
00
00
00
00
00
0
Kas
hi
Hon
eyS
unsh
ine
56
0.23
%
00
00
00
00
00
0
Kel
logg
H
anna
hM
onta
na
54
0.18
%
00
00
00
00
00
0
Pos
tW
affle
Cris
p44
0.
08%
0
00
00
00
00
00
Bar
bara
’sB
aker
yO
rgan
icW
ildP
uffs
58
0.
11%
0
00
00
00
00
00
Gen
eral
Mill
sD
ora
the
Exp
lore
r50
0.
06%
0
00
00
00
00
00
Cas
cadi
anF
arm
C
liffo
rdC
runc
h54
0.
06%
0
00
00
00
00
00
Kas
hi
Mig
hty
bite
s56
0.
03%
0
00
00
00
00
00
Kel
logg
M
INI-
Sw
irlz
44
0.04
%
00
00
00
00
00
0
Gen
eral
Mill
sC
ount
Cho
cula
38
0.
04%
0
00
00
00
00
00
Kel
logg
M
ini-W
heat
s72
3.
21%
10
859
4006
12
70
1666
26
85
2964
0
00
00
Gen
eral
Mill
sM
illsb
erry
*
4175
39
87
1088
892
60
Pos
tP
osto
pia*
872
373
661
104
Not
es
Mill
sber
ryN
umbe
rsw
ere
allo
cate
dto
Ree
ses
Puf
fs(
9.0%
),T
rix(
82.0
%),
Luc
kyc
harm
s(7
9.6%
),H
oney
nut
che
erio
s(7
9.0%
)an
dC
inna
mon
Toa
stc
runc
h(7
.2%
)
Pos
topi
aN
umbe
rsw
ere
allo
cate
dto
Fru
ityo
rC
ocoa
Peb
bles
(10
0%)
and
Hon
eyco
mb
(97.
3%)
*©T
heN
iels
enC
ompa
ny
**C
alcu
late
dus
ing
data
from
com
Sco
reM
edia
Met
rixK
eyM
easu
res
Rep
ort
***C
alcu
late
dus
ing
data
from
com
Sco
reA
dM
etrix
Adv
ertis
ers
Rep
ort
Appendix B

Cereal FACTS 87
N
utr
itio
n In
form
atio
n
Ch
ang
e in
Nu
trit
ion
Qu
alit
y
% o
f
So
diu
m
Form
er
Ta
rget
S
tore
s A
pp
rove
d
NP
I Sco
re
Su
gar
Fi
ber
(
mg
per
A
rtifi
cial
Fo
od
N
PI S
core
C
han
ge
New
B
ran
dC
om
pan
y B
ran
d
Cer
eal
Mar
ket
Sto
ckin
g
by C
BB
B
(5/3
1/09
) (%
of
g)
(% o
f g
) 10
0 g
) S
wee
ten
ers
Dye
s (2
/1/0
6)
in S
core
C
erea
ls
Ext
ensi
on
s
Ann
ie's
B
unni
es
33.5
%
50
Ann
ie's
B
unni
es
Bun
nyL
ove
Fam
ily
10.5
%
58
6.
7%
10.0
%
600
No
No
Ann
ie's
B
unni
es
Cho
cola
tea
nd
Fam
ily
11.3
%
46
25
.0%
3.
1%
594
No
No
Van
illa
Bun
nies
Ann
ie's
B
unni
es
Cin
naB
unni
es
Fam
ily
15.0
%
46
26
.7%
3.
3%
600
No
No
Ann
ie's
B
unni
es
Frui
tyB
unni
es
Fam
ily
12.0
%
46
30
.0%
3.
3%
533
No
No
Ann
ie's
B
unni
es
Hon
eyB
unni
es
Fam
ily
29.0
%
54
21
.9%
6.
3%
500
No
No
Bar
bara
'sB
aker
y
61.8
%
60
.6
Bar
bara
'sB
aker
yO
rgan
icW
ildP
uffs
58
Bar
bara
'sB
aker
yO
rgan
icW
ildP
uffs
C
ocoa
Gra
ham
Fa
mily
3.
0%
58
23
.3%
10
.0%
26
7N
oN
o
Bar
bara
'sB
aker
yO
rgan
icW
ildP
uffs
C
runc
hyC
ocoa
Fa
mily
6.
0%
58
23
.3%
10
.0%
26
7N
oN
o
Bar
bara
'sB
aker
yO
rgan
icW
ildP
uffs
Fr
uitM
edle
yFa
mily
13
.5%
58
23.3
%
10.0
%
267
No
No
Bar
bara
'sB
aker
yO
rgan
icW
ildP
uffs
H
oney
Fa
mily
7.
8%
58
23
.3%
10
.0%
26
7N
oN
o
Bar
bara
'sB
aker
yP
uffin
s
56
.3%
68
Bar
bara
'sB
aker
yP
uffin
sC
inna
mon
Fa
mily
54
20
.0%
20
.0%
50
0N
oN
o
Bar
bara
'sB
aker
yP
uffin
sH
oney
Ric
eFa
mily
56
20
.0%
6.
7%
417
No
No
Bar
bara
'sB
aker
yP
uffin
sP
eanu
tBut
ter
Fam
ily
46
20.0
%
6.7%
76
7N
oN
o
Bar
bara
'sB
aker
yP
uffin
sO
rigin
al
Fam
ily
50
18.5
%
18.5
%
704
No
No
Bar
bara
'sB
aker
yS
hred
ded
Oat
s
47
.8%
50
Bar
bara
'sB
aker
yS
hred
ded
Oat
sC
inna
mon
Cru
nch
A
dult
50
27.3
%
7.3%
40
0N
oN
o
Bar
bara
'sB
aker
yS
hred
ded
Oat
sV
anill
aA
lmon
dA
dult
52
27.3
%
7.3%
38
2N
oN
o
Bar
bara
'sB
aker
yS
hred
ded
Oat
sO
rigin
al
Adu
lt
72
5.
2%
8.6%
44
8N
oN
o
Bar
bara
'sB
aker
yS
hred
ded
Spo
onfu
ls
Mul
tigra
in
Adu
lt45
.8%
54
15.6
%
12.5
%
625
No
No
Bar
bara
'sB
aker
yS
hred
ded
Whe
at
A
dult
34.5
%
82
0.
0%
12.5
%
0N
oN
o
Bar
bara
'sB
aker
yU
ltim
aO
rgan
ic
A
dult
29.8
%
66
Bar
bara
'sB
aker
yU
ltim
aO
rgan
ic
Fla
xan
dG
rano
la
Adu
lt
58
16
.4%
9.
1%
436
No
No
Bar
bara
'sB
aker
yU
ltim
aO
rgan
ic
Hig
hF
iber
A
dult
70
16.7
%
26.7
%
433
No
No
Cas
cadi
anF
arm
70.5
%
56
.34
37.6
Cas
cadi
anF
arm
C
inna
mon
Cru
nch
Fa
mily
35
.3%
50
29.6
%
11.1
%
389
No
No
50
Cas
cadi
anF
arm
C
liffo
rdC
runc
h
Chi
ld
17.0
%
54
20
.0%
16
.7%
53
3N
oN
o
Cas
cadi
anF
arm
F
iber
Rig
ht
Hon
eyC
lust
ers
Adu
lt34
.3%
58
22.6
%
17.0
%
255
No
No
Cas
cadi
anF
arm
G
rano
la
54.8
%
53
.34
Cas
cadi
anF
arm
G
rano
la
Cin
nam
onR
aisi
nA
dult
50
29.1
%
5.5%
36
4N
oN
o
Cas
cadi
anF
arm
G
rano
la
Frui
t&N
ut
Adu
lt
54
26
.9%
5.
8%
183
No
No
Cas
cadi
anF
arm
G
rano
la
Map
leB
row
nS
ugar
A
dult
54
25.5
%
5.5%
29
1N
oN
o
Cas
cadi
anF
arm
G
rano
la
Oat
s&
Hon
ey
Adu
lt
54
23
.6%
5.
5%
218
No
No
Cas
cadi
anF
arm
H
eart
yM
orni
ng
A
dult
30.8
%
48
Cas
cadi
anF
arm
H
oney
Nut
O's
Fam
ily
48.5
%
44
26
.7%
6.
7%
833
No
No
Cas
cadi
anF
arm
M
ulti-
Gra
inS
quar
es
A
dult
49.8
%
70
13
.3%
6.
7%
383
No
No
Appendix C
continued

Cereal FACTS 88
N
utr
itio
n In
form
atio
n
Ch
ang
e in
Nu
trit
ion
Qu
alit
y
% o
f
So
diu
m
Form
er
Ta
rget
S
tore
s A
pp
rove
d
NP
I Sco
re
Su
gar
Fi
ber
(
mg
per
A
rtifi
cial
Fo
od
N
PI S
core
C
han
ge
New
B
ran
dC
om
pan
y B
ran
d
Cer
eal
Mar
ket
Sto
ckin
g
by C
BB
B
(5/3
1/09
) (%
of
g)
(% o
f g
) 10
0 g
) S
wee
ten
ers
Dye
s (2
/1/0
6)
in S
core
C
erea
ls
Ext
ensi
on
s
Cas
cadi
anF
arm
P
urel
yO
's
Fa
mily
26
.8%
46
3.3%
10
.0%
93
3N
oN
o
Cas
cadi
anF
arm
R
aisi
nB
ran
A
dult
38.5
%
50
25
.5%
10
.9%
61
8N
oN
o
Cas
cadi
anF
arm
V
anill
aal
mon
dcr
unch
A
dult
26.3
%
48
31
.4%
5.
9%
412
No
No
Dor
setc
erea
ls
Dor
setc
erea
ls
4.3%
60
Dor
setc
erea
ls
Dor
setc
erea
ls
Ber
ries
&C
herr
ies
Adu
lt
54
41
.8%
5.
5%
9N
oN
o
Dor
setc
erea
ls
Dor
setc
erea
ls
Frui
tNut
&F
iber
A
dult
52
27.3
%
9.1%
36
N
oN
o
Dor
setc
erea
ls
Dor
setc
erea
ls
Sim
ply
Del
icio
us
Adu
lt
76
12
.7%
7.
3%
27
No
No
Mue
sli
Dor
setc
erea
ls
Dor
setc
erea
ls
Sup
erC
ranb
erry
A
dult
58
30.9
%
7.3%
16
4N
oN
o
C
herr
yA
lmon
d
Gen
eral
Mill
s
100.
0%
47
.24
46.2
2
Gen
eral
Mill
sB
asic
4
A
dult
81.5
%
50
25
.5%
5.
5%
582
No
No
50
0
Gen
eral
Mill
sB
ooB
erry
Fam
ily
0.8%
40
36.4
%
3.0%
57
6N
oYe
s34
6
Gen
eral
Mill
sC
heer
ios:
Hon
eyN
ut
C
hild
95
.5%
Ye
s44
32
.1%
7.
1%
679
No
No
44
0
Gen
eral
Mill
sC
heer
ios
46
Gen
eral
Mill
sC
heer
ios
App
leC
inna
mon
Fa
mily
81
.8%
44
40.0
%
3.3%
40
0N
oN
o40
4
Gen
eral
Mill
sC
heer
ios
Ban
ana
Nut
Fa
mily
91
.3%
42
32.1
%
3.6%
57
1N
oN
o
Gen
eral
Mill
sC
heer
ios
Ber
ryB
urst
Fa
mily
27
.3%
48
29.6
%
7.4%
63
0N
oN
o44
4
Gen
eral
Mill
sC
heer
ios
Fros
ted
Fa
mily
84
.0%
46
35.7
%
7.1%
60
7N
oN
o
Gen
eral
Mill
sC
heer
ios
Frui
ty
Fam
ily
77.5
%
48
33
.3%
7.
4%
500
No
Yes
Gen
eral
Mill
sC
heer
ios
Mul
tigra
in
Fam
ily
91.0
%
50
20
.7%
10
.3%
69
0N
oN
o50
0
Gen
eral
Mill
sC
heer
ios
Oat
Clu
ster
Cru
nch/
Fa
mily
80
.3%
50
29.6
%
7.4%
50
0N
oN
o
C
runc
h
Gen
eral
Mill
sC
heer
ios
(Reg
ular
)Fa
mily
98
.3%
58
3.6%
10
.7%
67
9N
oN
o58
0
Gen
eral
Mill
sC
heer
ios
Yo
gurt
Bur
st(
all)
54
.8%
Gen
eral
Mill
sC
heer
ios
Yo
gurt
Bur
st
Fam
ily
46
30.0
%
6.7%
60
0N
oN
o36
10
Str
awbe
rry
Gen
eral
Mill
sC
heer
ios
Yo
gurt
Bur
stV
anill
aFa
mily
46
30
.0%
6.
7%
600
No
No
36
10
Gen
eral
Mill
sC
hex
36
43.3
4
Gen
eral
Mill
sC
hex
Cho
cola
te
Fam
ily
60.3
%
46
25
.0%
3.
1%
750
No
No
Gen
eral
Mill
sC
hex
Cin
nam
on
Fam
ily
69.3
%
38
26
.7%
0.
0%
633
No
Yes
Gen
eral
Mill
sC
hex
Cor
nFa
mily
83
.8%
44
9.7%
3.
2%
935
No
No
44
0
Gen
eral
Mill
sC
hex
Hon
eyN
ut
Fam
ily
38.8
%
42
28
.1%
3.
1%
719
No
No
32
10
Gen
eral
Mill
sC
hex
Mul
ti-B
ran
Fam
ily
20.3
%
50
21
.3%
12
.8%
66
0N
oN
o50
0
Gen
eral
Mill
sC
hex
Ric
eFa
mily
91
.0%
42
7.4%
0.
0%
926
No
No
44
-2
Gen
eral
Mill
sC
hex
Str
awbe
rry
Fam
ily
33.8
%
42
25
.8%
3.
2%
645
No
Yes
Gen
eral
Mill
sC
hex
Whe
at
Fam
ily
84.3
%
52
10
.6%
10
.6%
72
3N
oN
o50
2
Appendix C
continued

Cereal FACTS 89
N
utr
itio
n In
form
atio
n
Ch
ang
e in
Nu
trit
ion
Qu
alit
y
% o
f
So
diu
m
Form
er
Ta
rget
S
tore
s A
pp
rove
d
NP
I Sco
re
Su
gar
Fi
ber
(
mg
per
A
rtifi
cial
Fo
od
N
PI S
core
C
han
ge
New
B
ran
dC
om
pan
y B
ran
d
Cer
eal
Mar
ket
Sto
ckin
g
by C
BB
B
(5/3
1/09
) (%
of
g)
(% o
f g
) 10
0 g
) S
wee
ten
ers
Dye
s (2
/1/0
6)
in S
core
C
erea
ls
Ext
ensi
on
s
Gen
eral
Mill
sC
inna
mon
Toa
st
Red
uced
Sug
ar
Chi
ld
6.3%
58
6.7%
10
.0%
56
7su
cral
ose
No
58
0
Cru
nch
Gen
eral
Mill
sC
inna
mon
Toa
st
(Reg
ular
)C
hild
95
.3%
Ye
s36
32
.3%
3.
2%
710
No
No
36
0
Cru
nch
Gen
eral
Mill
sC
ocoa
Puf
fs
44
Gen
eral
Mill
sC
ocoa
Puf
fs
com
bos
Chi
ld
71.8
%
Yes
40
40.7
%
3.7%
59
3N
oN
o
Gen
eral
Mill
sC
ocoa
Puf
fs
(Reg
ular
)C
hild
96
.0%
Ye
s38
44
.4%
3.
7%
556
No
No
36
2
Gen
eral
Mill
sC
ooki
eC
risp
Gen
eral
Mill
sC
ooki
eC
risp
Dou
ble
Cho
cola
te
Chi
ld
17.3
%
36
38
.7%
3.
2%
452
No
No
Gen
eral
Mill
sC
ooki
eC
risp
(Reg
ular
)C
hild
93
.8%
Ye
s40
42
.3%
3.
8%
577
No
No
36
4
Gen
eral
Mill
sC
ount
Cho
cula
Fam
ily
10.8
%
38
44
.4%
3.
7%
593
No
Yes
34
4
Gen
eral
Mill
sC
ount
ryC
ornfl
akes
Adu
lt2.
8%
44
9.
1%
3.0%
90
9N
oN
o46
-2
Gen
eral
Mill
sC
urve
s
3.
3%
53
.34
54
Gen
eral
Mill
sC
urve
sFr
uit&
Nut
Cru
nch
Adu
lt
54
20
.4%
10
.2%
49
0N
oN
o
Gen
eral
Mill
sC
urve
sH
oney
Cru
nch
Adu
lt
54
17
.0%
9.
4%
547
No
No
Gen
eral
Mill
sC
urve
sW
hole
Gra
inC
runc
hA
dult
52
14.8
%
7.4%
66
7N
oN
o
Gen
eral
Mill
sD
ora
the
Exp
lore
r
Chi
ld
11.8
%
50
22
.2%
11
.1%
66
7N
oN
o
Gen
eral
Mill
sF
iber
One
97
.0%
45.3
451
.76
Gen
eral
Mill
sF
iber
One
C
aram
elD
elig
ht
Adu
lt
34
20
.0%
18
.0%
52
0N
oN
o
Gen
eral
Mill
sF
iber
One
Fr
oste
dS
hred
ded
A
dult
74
20.0
%
15.0
%
317
Suc
ralo
se
No
Whe
at
Gen
eral
Mill
sF
iber
One
H
oney
Clu
ster
sA
dult
70
11.5
%
25.0
%
538
No
No
70
0
Gen
eral
Mill
sF
iber
One
O
rigin
al(
Bra
n)
Adu
lt
78
0.
0%
46.7
%
350
Asp
arta
me
No
78
0
Gen
eral
Mill
sF
iber
One
R
aisi
nB
ran
Clu
ster
sA
dult
54
23.6
%
20.0
%
473
No
No
Gen
eral
Mill
sFr
anke
nB
erry
Fam
ily
1.0%
54
36.4
%
3.0%
57
6N
oYe
s26
28
Gen
eral
Mill
sG
olde
nG
raha
ms
Fa
mily
92
.3%
36
35.5
%
3.2%
87
1N
oN
o32
4
24
Gen
eral
Mill
sK
aboo
m
Fa
mily
2.
5%
50
18
.8%
12
.5%
65
6N
oYe
s44
6
Gen
eral
Mill
sK
ix
50
Gen
eral
Mill
sK
ix
Ber
ryB
erry
Fa
mily
11
.0%
48
30.8
%
3.8%
69
2N
oYe
s44
4
Gen
eral
Mill
sK
ix
Hon
ey
Fam
ily
65.5
%
50
18
.2%
9.
1%
697
No
No
Gen
eral
Mill
sK
ix
(Reg
ular
)Fa
mily
95
.0%
54
10.0
%
10.0
%
700
No
No
46
8
Gen
eral
Mill
sLu
cky
Cha
rms
36
Gen
eral
Mill
sLu
cky
Cha
rms
Ber
ry
Chi
ld
2.0%
Ye
s36
41
.4%
3.
4%
655
38
-2
Gen
eral
Mill
sLu
cky
Cha
rms
(Reg
ular
)C
hild
97
.0%
Ye
s36
40
.7%
3.
7%
704
No
Yes
34
2
Gen
eral
Mill
sLu
cky
Cha
rms
Cho
cola
te
Chi
ld
12.3
%
Yes
36
42.9
%
3.6%
57
1N
oYe
s36
0
Gen
eral
Mill
sN
atur
eV
alle
y
54
40
.88
Gen
eral
Mill
sN
atur
eV
alle
yO
ats
&H
oney
A
dult
0.5%
52
27.6
%
6.9%
37
9N
oN
o
Gen
eral
Mill
sN
atur
eV
alle
yV
anill
aN
ut
Adu
lt0.
3%
54
30
.0%
6.
0%
360
No
No
Gen
eral
Mill
sO
atm
ealC
risp
67.3
%
Appendix C
continued

Cereal FACTS 90
N
utr
itio
n In
form
atio
n
Ch
ang
e in
Nu
trit
ion
Qu
alit
y
% o
f
So
diu
m
Form
er
Ta
rget
S
tore
s A
pp
rove
d
NP
I Sco
re
Su
gar
Fi
ber
(
mg
per
A
rtifi
cial
Fo
od
N
PI S
core
C
han
ge
New
B
ran
dC
om
pan
y B
ran
d
Cer
eal
Mar
ket
Sto
ckin
g
by C
BB
B
(5/3
1/09
) (%
of
g)
(% o
f g
) 10
0 g
) S
wee
ten
ers
Dye
s (2
/1/0
6)
in S
core
C
erea
ls
Ext
ensi
on
s
Gen
eral
Mill
sO
atm
ealC
risp
Cru
nchy
Alm
ond
Adu
lt
58
26
.7%
6.
7%
217
No
No
48
10
Gen
eral
Mill
sO
atm
ealC
risp
Hea
rty
Rai
sin
Adu
lt
56
32
.3%
6.
5%
218
No
No
50
6
Gen
eral
Mill
sR
aisi
nN
utB
ran
A
dult
79.0
%
48
28
.6%
10
.2%
46
9N
oN
o50
-2
Gen
eral
Mill
sR
eese
'sP
uffs
Chi
ld
93.0
%
Yes
34
41.4
%
3.4%
62
1N
oYe
s34
0
Gen
eral
Mill
sTo
tal
52.4
Gen
eral
Mill
sTo
tal
Cin
nam
onC
runc
h
Adu
lt84
.0%
58
17.6
%
7.8%
39
2N
oN
o
Gen
eral
Mill
sTo
tal
Cra
nber
ryC
runc
hA
dult
29.0
%
50
27
.6%
6.
9%
397
No
No
Gen
eral
Mill
sTo
tal
Hon
eyC
lust
ers
Adu
lt19
.0%
50
27.1
%
6.3%
47
9N
oN
o48
2
Gen
eral
Mill
sTo
tal
Rai
sin
Bra
nA
dult
83.5
%
52
32
.1%
9.
4%
434
No
No
52
0
Gen
eral
Mill
sTo
tal
Who
leG
rain
A
dult
95.5
%
52
16
.7%
10
.0%
63
3N
oN
o52
0
Gen
eral
Mill
sTr
ix
C
hild
94
.0%
Ye
s38
37
.5%
3.
1%
563
No
Yes
34
4
Gen
eral
Mill
sW
heat
ies
A
dult
90.5
%
52
14
.8%
11
.1%
70
4N
oN
o52
0
Kas
hi
98
.3%
56
.2
Kas
hi
Gra
nola
47
.3%
57
Kas
hi
Gra
nola
C
ocoa
Bea
ch
Adu
lt
54
20
.0%
10
.9%
21
8N
oN
o
Kas
hi
Gra
nola
M
ount
ain
Med
ley
Adu
lt
58
21
.8%
10
.9%
20
0N
oN
o
G
rano
la
Kas
hi
Gra
nola
O
rcha
rdS
pice
A
dult
58
20.0
%
10.9
%
236
No
No
Kas
hi
Gra
nola
S
umm
erB
erry
A
dult
70
16.4
%
10.9
%
236
No
No
Kas
hi
Shr
edde
dW
heat
Typ
e
53
.5%
76
Kas
hi
Shr
edde
dW
heat
Typ
eA
utum
nw
heat
A
dult
78
13.0
%
11.1
%
0N
oN
o
Kas
hi
Shr
edde
dW
heat
Typ
eC
inna
mon
Har
vest
A
dult
74
16.7
%
9.3%
0
No
No
Kas
hi
Shr
edde
dW
heat
Typ
eIs
land
Van
illa
Adu
lt
50
33
.3%
22
.2%
0
No
No
Kas
hi
Fla
kes
7W
hole
Gra
ins
Fla
kes
Adu
lt31
.0%
72
10.0
%
12.0
%
300
No
No
Kas
hi
GoL
ean
A
dult
80.0
%
78
11
.5%
19
.2%
16
3N
oN
o
49.6
Kas
hi
GoL
ean
Cru
nch!
87
.3%
Kas
hi
GoL
ean
Cru
nch!
H
oney
Alm
ond
Fla
xA
dult
58
22.6
%
15.1
%
264
No
No
Kas
hi
GoL
ean
Cru
nch!
O
rigin
al
Adu
lt
70
24
.5%
15
.1%
17
9N
oN
o
Kas
hi
Goo
dFr
iend
s
53
.5%
Kas
hi
Goo
dFr
iend
sC
inna
Rai
sin
Cru
nch
Adu
lt
58
26
.0%
16
.0%
21
0N
oN
o
Kas
hi
Goo
dFr
iend
sO
rigin
al
Adu
lt
72
17
.0%
22
.6%
24
5N
oN
o
Kas
hi
Hea
rtto
Hea
rt
89.0
%
64
61
Kas
hi
Hea
rtto
Hea
rt
Hon
eyT
oast
edO
at
Adu
lt
70
15
.2%
15
.2%
27
3N
oN
o
Kas
hi
Hea
rtto
Hea
rt
Oat
Fla
kes
&W
ild
Adu
lt
58
23
.6%
7.
3%
236
No
No
Blu
eber
ryC
lust
ers
Kas
hi
Hon
eyP
uffs
7
Who
leG
rain
s
Adu
lt44
.8%
74
20.0
%
6.7%
0
No
No
Hon
eyP
uffs
Kas
hi
Hon
eyS
unsh
ine
Fa
mily
56
.3%
56
20.0
%
20.0
%
450
No
No
56
Kas
hi
Mig
hty
bite
s
Fam
ily
8.3%
56
15.2
%
9.1%
48
5N
oN
o
Kas
hi
Nug
gets
7
Who
leG
rain
s
Adu
lt17
.5%
72
5.2%
12
.1%
44
8N
oN
o
N
ugge
ts
Appendix C
continued
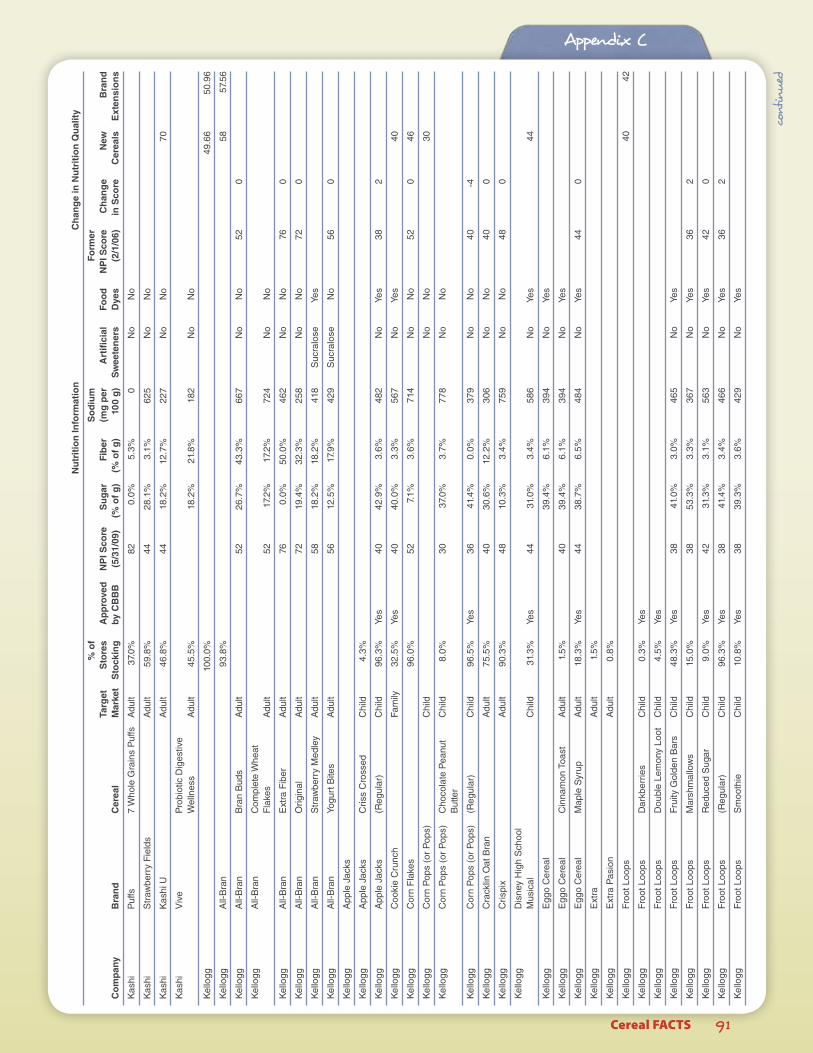
Cereal FACTS 91
N
utr
itio
n In
form
atio
n
Ch
ang
e in
Nu
trit
ion
Qu
alit
y
% o
f
So
diu
m
Form
er
Ta
rget
S
tore
s A
pp
rove
d
NP
I Sco
re
Su
gar
Fi
ber
(
mg
per
A
rtifi
cial
Fo
od
N
PI S
core
C
han
ge
New
B
ran
dC
om
pan
y B
ran
d
Cer
eal
Mar
ket
Sto
ckin
g
by C
BB
B
(5/3
1/09
) (%
of
g)
(% o
f g
) 10
0 g
) S
wee
ten
ers
Dye
s (2
/1/0
6)
in S
core
C
erea
ls
Ext
ensi
on
s
Kas
hi
Puf
fs
7W
hole
Gra
ins
Puf
fs
Adu
lt37
.0%
82
0.0%
5.
3%
0N
oN
o
Kas
hi
Str
awbe
rry
Fie
lds
A
dult
59.8
%
44
28
.1%
3.
1%
625
No
No
Kas
hi
Kas
hiU
Adu
lt46
.8%
44
18.2
%
12.7
%
227
No
No
70
Kas
hi
Viv
e
Pro
biot
icD
iges
tive
Wel
lnes
sA
dult
45.5
%
18.2
%
21.8
%
182
No
No
Kel
logg
100.
0%
49
.66
50.9
6
Kel
logg
A
ll-B
ran
93.8
%
58
57
.56
Kel
logg
A
ll-B
ran
Bra
nB
uds
Adu
lt
52
26
.7%
43
.3%
66
7N
oN
o52
0
Kel
logg
A
ll-B
ran
Com
plet
eW
heat
F
lake
sA
dult
52
17.2
%
17.2
%
724
No
No
Kel
logg
A
ll-B
ran
Ext
raF
iber
A
dult
76
0.0%
50
.0%
46
2N
oN
o76
0
Kel
logg
A
ll-B
ran
Orig
inal
A
dult
72
19.4
%
32.3
%
258
No
No
72
0
Kel
logg
A
ll-B
ran
Str
awbe
rry
Med
ley
Adu
lt
58
18
.2%
18
.2%
41
8S
ucra
lose
Ye
s
Kel
logg
A
ll-B
ran
Yogu
rtB
ites
Adu
lt
56
12
.5%
17
.9%
42
9S
ucra
lose
N
o56
0
Kel
logg
A
pple
Jac
ks
Kel
logg
A
pple
Jac
ks
Cris
sC
ross
ed
Chi
ld
4.3%
Kel
logg
A
pple
Jac
ks
(Reg
ular
)C
hild
96
.3%
Ye
s40
42
.9%
3.
6%
482
No
Yes
38
2
Kel
logg
C
ooki
eC
runc
h
Fam
ily
32.5
%
Yes
40
40.0
%
3.3%
56
7N
oYe
s
40
Kel
logg
C
orn
Fla
kes
96.0
%
52
7.
1%
3.6%
71
4N
oN
o52
0
46
Kel
logg
C
orn
Pop
s(o
rP
ops)
Chi
ld
No
No
30
Kel
logg
C
orn
Pop
s(o
rP
ops)
C
hoco
late
Pea
nut
Chi
ld
8.0%
30
37.0
%
3.7%
77
8N
oN
o
B
utte
r
Kel
logg
C
orn
Pop
s(o
rP
ops)
(R
egul
ar)
Chi
ld
96.5
%
Yes
36
41.4
%
0.0%
37
9N
oN
o40
-4
Kel
logg
C
rack
linO
atB
ran
A
dult
75.5
%
40
30
.6%
12
.2%
30
6N
oN
o40
0
Kel
logg
C
rispi
x
Adu
lt90
.3%
48
10.3
%
3.4%
75
9N
oN
o48
0
Kel
logg
D
isne
yH
igh
Sch
ool
M
usic
al
C
hild
31
.3%
Ye
s44
31
.0%
3.
4%
586
No
Yes
44
Kel
logg
E
ggo
Cer
eal
39
.4%
6.
1%
394
No
Yes
Kel
logg
E
ggo
Cer
eal
Cin
nam
onT
oast
A
dult
1.5%
40
39.4
%
6.1%
39
4N
oYe
s
Kel
logg
E
ggo
Cer
eal
Map
leS
yrup
A
dult
18.3
%
Yes
44
38.7
%
6.5%
48
4N
oYe
s44
0
Kel
logg
E
xtra
Adu
lt1.
5%
Kel
logg
E
xtra
Pas
ion
A
dult
0.8%
Kel
logg
Fr
ootL
oops
40
42
Kel
logg
Fr
ootL
oops
D
arkb
errie
sC
hild
0.
3%
Yes
Kel
logg
Fr
ootL
oops
D
oubl
eLe
mon
yLo
ot
Chi
ld
4.5%
Ye
s
Kel
logg
Fr
ootL
oops
Fr
uity
Gol
den
Bar
sC
hild
48
.3%
Ye
s38
41
.0%
3.
0%
465
No
Yes
Kel
logg
Fr
ootL
oops
M
arsh
mal
low
sC
hild
15
.0%
38
53.3
%
3.3%
36
7N
oYe
s36
2
Kel
logg
Fr
ootL
oops
R
educ
edS
ugar
C
hild
9.
0%
Yes
42
31.3
%
3.1%
56
3N
oYe
s42
0
Kel
logg
Fr
ootL
oops
(R
egul
ar)
Chi
ld
96.3
%
Yes
38
41.4
%
3.4%
46
6N
oYe
s36
2
Kel
logg
Fr
ootL
oops
S
moo
thie
C
hild
10
.8%
Ye
s38
39
.3%
3.
6%
429
No
Yes
Appendix C
continued

Cereal FACTS 92
N
utr
itio
n In
form
atio
n
Ch
ang
e in
Nu
trit
ion
Qu
alit
y
% o
f
So
diu
m
Form
er
Ta
rget
S
tore
s A
pp
rove
d
NP
I Sco
re
Su
gar
Fi
ber
(
mg
per
A
rtifi
cial
Fo
od
N
PI S
core
C
han
ge
New
B
ran
dC
om
pan
y B
ran
d
Cer
eal
Mar
ket
Sto
ckin
g
by C
BB
B
(5/3
1/09
) (%
of
g)
(% o
f g
) 10
0 g
) S
wee
ten
ers
Dye
s (2
/1/0
6)
in S
core
C
erea
ls
Ext
ensi
on
s
Kel
logg
Fr
ootL
oops
S
tarb
errie
sC
hild
1.
0%
Yes
38
Kel
logg
Fr
oste
dF
lake
s
46
Kel
logg
Fr
oste
dF
lake
sG
old
Chi
ld
44.3
%
Yes
46
32.3
%
9.7%
61
3N
oN
o
Kel
logg
Fr
oste
dF
lake
sR
educ
edS
ugar
C
hild
23
.8%
Ye
s46
25
.8%
3.
2%
581
No
No
46
0
Kel
logg
Fr
oste
dF
lake
s(R
egul
ar)
Chi
ld
98.3
%
Yes
42
36.7
%
3.3%
46
7N
oN
o42
0
Kel
logg
H
anna
hM
onta
na
C
hild
43
.5%
Ye
s54
30
.0%
3.
3%
133
No
No
Kel
logg
H
oney
Sm
acks
Fam
ily
85.3
%
46
55
.6%
3.
7%
185
No
No
44
2
Kel
logg
Lo
wF
atG
rano
la
Kel
logg
Lo
wF
atG
rano
la
With
Rai
sins
A
dult
17.8
%
54
30
.0%
5.
0%
250
No
No
54
0
Kel
logg
Lo
wF
atG
rano
la
With
outR
aisi
ns
Adu
lt13
.5%
54
28.6
%
6.1%
22
4N
oN
o54
0
Kel
logg
M
INI-
Sw
irlz
Fa
mily
5.
5%
Yes
44
40.0
%
3.3%
38
3N
oYe
s42
2
Kel
logg
M
ini-W
heat
s
66
.5
Kel
logg
M
ini-W
heat
sFr
oste
d/B
igB
ite
Fam
ily
52.8
%
Yes
74
19.6
%
9.8%
10
N
oN
o
Kel
logg
M
ini-W
heat
sFr
oste
d/B
iteS
ize
Fam
ily
92.0
%
Yes
74
20.3
%
10.2
%
8N
oN
o74
0
Kel
logg
M
ini-W
heat
sFr
oste
d/B
lueb
erry
Fa
mily
89
.5%
Ye
s70
23
.1%
9.
6%
0S
orbi
tol
Yes
Muf
fin
Kel
logg
M
ini-W
heat
sFr
oste
d/C
inna
mon
Fa
mily
71
.5%
Ye
s70
23
.1%
9.
6%
0N
oYe
s
S
treu
sel
Kel
logg
M
ini-W
heat
sFr
oste
d/M
aple
&
Fam
ily
79.3
%
70
25
.0%
9.
6%
0S
orbi
tol
No
Bro
wn
Sug
ar
Kel
logg
M
ini-W
heat
sFr
oste
d/S
traw
berr
y
Fam
ily
93.8
%
Yes
70
23.1
%
9.6%
0
Sor
bito
lYe
s
D
elig
ht
Kel
logg
M
ini-W
heat
sU
nfro
sted
/Bite
Siz
eFa
mily
15
.8%
Ye
s82
1.
7%
10.2
%
17
No
No
Kel
logg
M
ini-W
heat
s
Littl
eB
ites:
Cho
cola
te
Fam
ily
79.5
%
Yes
56
21.8
%
10.9
%
491
Sor
bito
lN
o
Kel
logg
M
ini-W
heat
sLi
ttle
Bite
s:H
oney
Nut
Fam
ily
79.3
%
Yes
70
21.8
%
10.9
%
364
Sor
bito
lYe
s
Kel
logg
M
uesl
ix
A
dult
30.8
%
54
30
.9%
7.
3%
309
No
No
54
0
Kel
logg
P
rodu
ct1
9
Adu
lt53
.8%
50
13.3
%
3.3%
70
0N
oN
o50
0
Kel
logg
R
aisi
nB
ran
46
Kel
logg
R
aisi
nB
ran
Cru
nch
A
dult
93.0
%
48
37
.7%
7.
5%
396
No
No
48
0
Kel
logg
R
aisi
nB
ran
Ext
ra
Adu
lt66
.0%
46
23.2
%
12.5
%
625
No
No
Kel
logg
R
aisi
nB
ran
(Reg
ular
)A
dult
97.8
%
46
32
.2%
11
.9%
59
3N
oN
o46
0
Kel
logg
R
ice
orC
ocoa
Kris
pies
56
30
Kel
logg
R
ice
orC
ocoa
C
ocoa
Kris
pies
(A
ll)
Fam
ily
42
K
rispi
es
Kel
logg
R
ice
orC
ocoa
C
ocoa
Kris
pies
Fa
mily
14
.5%
34
40.0
%
0.0%
53
3N
oN
o
Kris
pies
C
hoco
nilla
Kel
logg
R
ice
orC
ocoa
C
ocoa
Kris
pies
Fa
mily
89
.8%
Ye
s40
38
.7%
3.
2%
516
No
No
34
6
Kris
pies
(R
egul
ar)
Kel
logg
R
ice
orC
ocoa
R
ice
Kris
pies
Fa
mily
7.
3%
Yes
32
40.0
%
0.0%
43
3N
oN
o
Kris
pies
Fr
oste
d
Kel
logg
R
ice
orC
ocoa
R
ice
Kris
pies
Jum
bo
Fam
ily
50.3
%
Yes
56
29.6
%
11.1
%
630
No
No
K
rispi
es
Mul
ti-G
rain
Appendix C
continued

Cereal FACTS 93
N
utr
itio
n In
form
atio
n
Ch
ang
e in
Nu
trit
ion
Qu
alit
y
% o
f
So
diu
m
Form
er
Ta
rget
S
tore
s A
pp
rove
d
NP
I Sco
re
Su
gar
Fi
ber
(
mg
per
A
rtifi
cial
Fo
od
N
PI S
core
C
han
ge
New
B
ran
dC
om
pan
y B
ran
d
Cer
eal
Mar
ket
Sto
ckin
g
by C
BB
B
(5/3
1/09
) (%
of
g)
(% o
f g
) 10
0 g
) S
wee
ten
ers
Dye
s (2
/1/0
6)
in S
core
C
erea
ls
Ext
ensi
on
s
Kel
logg
R
ice
orC
ocoa
R
ice
Kris
pies
Tre
ats
Fam
ily
6.5%
Ye
s38
30
.0%
0.
0%
567
No
No
36
2
Kris
pies
Kel
logg
R
ice
orC
ocoa
R
ice
Kris
pies
Fa
mily
97
.0%
Ye
s44
12
.1%
0.
0%
667
No
No
38
6
Kris
pies
(R
egul
ar)
Kel
logg
R
ice
orC
ocoa
R
ice
Kris
pies
Fa
mily
5.
8%
Yes
40
30.0
%
0.0%
50
0N
oN
o
Kris
pies
S
traw
berr
ies
Kel
logg
S
mar
tSta
rt
87.8
%
65
Kel
logg
S
mar
tSta
rt
Cin
nam
onR
aisi
nA
dult
56
29.4
%
7.8%
22
5N
oN
o
Kel
logg
S
mar
tSta
rt
Map
le&
Bro
wn
Sug
ar
Adu
lt
56
28
.3%
8.
3%
233
No
No
56
0
Kel
logg
S
mar
tSta
rt
Orig
inal
Ant
ioxi
dant
sA
dult
48
28.0
%
6.0%
56
0N
oYe
s48
0
Kel
logg
S
mar
tSta
rt
Str
awbe
rry
Oat
Bite
sA
dult
74
12.7
%
10.9
%
236
Suc
ralo
se
Yes
Kel
logg
S
mar
tSta
rt
Toas
ted
Oat
A
dult
56
28.3
%
8.3%
23
3N
oN
o56
0
Kel
logg
S
mor
z
Fam
ily
16.3
%
38
43
.3%
3.
3%
467
No
Yes
38
0
Kel
logg
S
peci
alK
42
49
.38
Kel
logg
S
peci
alK
B
lueb
erry
A
dult
90.5
%
48
25
.9%
3.
7%
630
No
Yes
Kel
logg
S
peci
alK
C
hoco
late
yD
elig
ht
Adu
lt84
.0%
32
29.0
%
3.2%
58
1N
oN
o
Kel
logg
S
peci
alK
C
inna
mon
Pec
an
Adu
lt90
.0%
46
23.3
%
3.3%
60
0N
oN
o
Kel
logg
S
peci
alK
Fr
uit+
Yog
urt
Adu
lt92
.8%
44
34.4
%
3.1%
42
2N
oYe
s44
0
Kel
logg
S
peci
alK
P
rote
inP
lus
Adu
lt75
.0%
70
24.1
%
17.2
%
379
Suc
ralo
se
No
72
-2
Kel
logg
S
peci
alK
R
edB
errie
sA
dult
97.3
%
40
29
.0%
3.
2%
710
No
No
40
0
Kel
logg
S
peci
alK
(R
egul
ar)
Adu
lt99
.3%
50
12.9
%
3.2%
71
0N
oN
o50
0
Kel
logg
S
peci
alK
V
anill
aA
lmon
dA
dult
90.8
%
46
30
.0%
3.
3%
533
No
No
46
0
Nes
tle
Fitn
ess
Hon
ey&
Alm
ond
Adu
lt1.
3%
38
28
.7%
8.
7%
833
No
No
New
man
'sO
wn
Sw
eetE
noug
h
16
.5%
New
man
'sO
wn
Sw
eetE
noug
hF
lake
nS
traw
berr
yA
dult
54
26.6
%
6.7%
43
3N
oN
o
New
man
'sO
wn
Sw
eetE
noug
hH
oney
Fla
xF
lake
sA
dult
58
26.6
%
13.3
%
267
No
No
New
man
'sO
wn
Sw
eetE
noug
hH
oney
Nut
Os
Adu
lt
50
23
.3%
6.
7%
567
No
No
New
man
'sO
wn
Sw
eetE
noug
hW
heat
Puf
fs
Adu
lt
56
29
.6%
3.
7%
167
No
No
Nat
ure'
sP
ath
61
.8%
56.7
447
Nat
ure'
sP
ath
Env
iroK
idz
Org
anic
54
47
Nat
ure'
sP
ath
Env
iroK
idz
Org
anic
A
maz
onF
rost
ed
Chi
ld
14.8
%
56
20
.0%
6.
7%
383
No
No
Fla
kes
Nat
ure'
sP
ath
Env
iroK
idz
Org
anic
G
orill
aM
unch
C
hild
41
.0%
54
26.7
%
6.7%
36
7N
oN
o
Nat
ure'
sP
ath
Env
iroK
idz
Org
anic
K
oala
Cris
pC
hild
35
.3%
44
36.7
%
6.7%
33
3N
oN
o
Nat
ure'
sP
ath
Env
iroK
idz
Org
anic
Le
apin
Lem
urs
Chi
ld
20.3
%
54
26
.7%
6.
7%
383
No
No
Nat
ure'
sP
ath
Env
iroK
idz
Org
anic
P
eanu
tBut
ter
Pan
da
Chi
ld
32.8
%
50
23
.3%
6.
7%
433
No
No
Puf
fs
Nat
ure'
sP
ath
Env
iroK
idz
Org
anic
P
engu
inP
uffs
C
hild
3.
8%
54
26
.7%
6.
7%
450
No
No
Nat
ure'
sP
ath
Fla
xP
lus
56
Nat
ure'
sP
ath
Fla
xP
lus
Mul
tibra
nA
dult
58
13.3
%
16.7
%
450
No
No
Nat
ure'
sP
ath
Fla
xP
lus
Red
Ber
ryC
runc
hA
dult
58
18.2
%
12.7
%
309
No
No
Appendix C
continued

Cereal FACTS 94
N
utr
itio
n In
form
atio
n
Ch
ang
e in
Nu
trit
ion
Qu
alit
y
% o
f
So
diu
m
Form
er
Ta
rget
S
tore
s A
pp
rove
d
NP
I Sco
re
Su
gar
Fi
ber
(
mg
per
A
rtifi
cial
Fo
od
N
PI S
core
C
han
ge
New
B
ran
dC
om
pan
y B
ran
d
Cer
eal
Mar
ket
Sto
ckin
g
by C
BB
B
(5/3
1/09
) (%
of
g)
(% o
f g
) 10
0 g
) S
wee
ten
ers
Dye
s (2
/1/0
6)
in S
core
C
erea
ls
Ext
ensi
on
s
Nat
ure'
sP
ath
Her
itage
Hei
rloom
W
hole
Gra
ins
Adu
lt
70
13
.3%
16
.7%
43
3N
oN
o
Nat
ure'
sP
ath
Hon
ey'd
Cor
nF
lake
s
Adu
lt
58
13
.3%
6.
7%
467
No
No
Nat
ure'
sP
ath
Opt
imum
Nat
ure'
sP
ath
Opt
imum
B
lueb
erry
Cin
nam
on
Adu
lt
70
16
.4%
9.
1%
418
No
No
Nat
ure'
sP
ath
Opt
imum
P
ower
Bre
akfa
st
Adu
lt
56
21
.8%
18
.2%
38
2N
oN
o
Nat
ure'
sP
ath
Opt
imum
R
ebou
nd-
Ban
ana
A
dult
70
16.4
%
9.1%
25
5N
oN
o
F
lax
Alm
ond
Nat
ure'
sP
ath
Opt
imum
S
lim
Adu
lt
56
12
.7%
16
.4%
52
7N
oN
o
Nat
ure'
sP
ath
Org
anic
Cor
nF
lake
s
Adu
lt
56
10
.0%
6.
7%
550
No
No
Nat
ure'
sP
ath
Pum
pkin
Fla
xP
lus
Adu
lt
58
18
.2%
9.
1%
82
No
No
G
rano
la
Nat
ure'
sP
ath
Pum
pkin
Rai
sin
Adu
lt
58
23
.6%
12
.7%
27
3N
oN
o
Cru
nch
Nat
ure'
sP
ath
Sm
artB
ran
A
dult
58
20.0
%
43.3
%
433
No
No
58
Nat
ure'
sP
ath
Syn
ergy
8W
hole
Adu
lt
78
13
.3%
16
.7%
0
No
No
G
rain
s
Pos
t
10
0.0%
53.6
6
Pos
t
Alp
haB
its
Fa
mily
43
.5%
46
35.7
%
7.1%
57
1N
oN
o70
-2
446
Pos
t
Bra
nF
lake
s
Adu
lt25
.0%
50
16.7
%
16.7
%
733
No
No
50
0
Pos
t
Gol
den
Cris
p
Fam
ily
52.5
%
46
51
.9%
3.
7%
93
No
No
44
2
Pos
t
Gra
peN
uts
92.0
%
Pos
t
Gra
peN
uts
Fla
kes
Adu
lt
58
13
.8%
10
.3%
37
9N
oN
o58
0
Pos
t
Gra
peN
uts
(Reg
ular
)A
dult
70
6.9%
12
.1%
50
0N
oN
o70
0
Pos
t
Gra
peN
uts
Trai
lMix
Cru
nch
Adu
lt
Pos
t
Hon
eyB
unch
es
54
ofO
ats
Pos
t
Hon
eyB
unch
es
Hon
eyR
oast
ed
Adu
lt96
.3%
54
20.0
%
6.7%
50
0N
oN
o50
4
of
Oat
s
Pos
t
Hon
eyB
unch
es
with
Alm
onds
A
dult
93.8
%
52
18
.8%
6.
3%
469
No
No
52
0
ofO
ats
Pos
t
Hon
eyB
unch
es
with
Cin
nam
on
Adu
lt62
.8%
54
20.0
%
6.7%
50
0N
oN
o
ofO
ats
Clu
ster
s
Pos
t
Hon
eyB
unch
es
with
Rea
lCho
cola
te
Adu
lt41
.5%
52
23.3
%
6.7%
50
0N
oN
o
ofO
ats
Clu
ster
s
Pos
t
Hon
eyB
unch
es
with
Rea
lPea
ches
A
dult
57.0
%
54
25
.8%
6.
5%
435
No
No
50
4
ofO
ats
Pos
t
Hon
eyB
unch
es
with
Rea
lA
dult
69.5
%
52
25
.8%
6.
5%
452
No
No
48
4
ofO
ats
Str
awbe
rrie
s
Pos
t
Hon
eyB
unch
es
with
Van
illla
Clu
ster
sA
dult
39.0
%
54
19
.6%
7.
1%
304
No
No
of
Oat
s
Pos
t
Hon
eyB
unch
es
Just
Bun
ches
(al
l)A
dult
66.3
%
ofO
ats
Appendix C
continued

Cereal FACTS 95
N
utr
itio
n In
form
atio
n
Ch
ang
e in
Nu
trit
ion
Qu
alit
y
% o
f
So
diu
m
Form
er
Ta
rget
S
tore
s A
pp
rove
d
NP
I Sco
re
Su
gar
Fi
ber
(
mg
per
A
rtifi
cial
Fo
od
N
PI S
core
C
han
ge
New
B
ran
dC
om
pan
y B
ran
d
Cer
eal
Mar
ket
Sto
ckin
g
by C
BB
B
(5/3
1/09
) (%
of
g)
(% o
f g
) 10
0 g
) S
wee
ten
ers
Dye
s (2
/1/0
6)
in S
core
C
erea
ls
Ext
ensi
on
s
Pos
t
Hon
eyB
unch
es
Just
Bun
ches
A
dult
56
24.6
%
7.0%
15
8N
oN
o
ofO
ats
Car
amel
Pos
t
Hon
eyB
unch
es
Hon
eyR
oast
ed
Adu
lt
58
24
.6%
7.
0%
140
No
No
of
Oat
s
Pos
t
Hon
eyC
omb
51
Pos
t
Hon
eyC
omb
Cho
cola
te
Chi
ld
3.5%
48
30.0
%
6.7%
36
7N
oN
o
Pos
t
Hon
eyC
omb
(Reg
ular
)C
hild
92
.3%
46
31.3
%
6.3%
56
3N
oYe
s36
10
Pos
t
Frui
tyo
rC
ocoa
Peb
bles
Pos
t
Frui
tyo
rC
ocoa
B
amB
amB
erry
C
hild
1.
5%
44
26
.7%
6.
7%
600
P
ebbl
es
Pos
t
Frui
tyo
rC
ocoa
C
ocoa
C
hild
94
.8%
38
36.7
%
10.0
%
600
No
No
24
14
Peb
bles
Pos
t
Frui
tyo
rC
ocoa
D
ino
Sm
ores
C
hild
3.
3%
Peb
bles
Pos
t
Frui
tyo
rC
ocoa
Fr
uity
C
hild
98
.0%
38
36.7
%
10.0
%
600
No
Yes
24
14
Peb
bles
Pos
t
Rai
sin
Bra
n
Fam
ily
80.0
%
48
32
.2%
13
.6%
50
8N
oN
o48
0
Pos
t
Sel
ects
Gre
atG
rain
s
90
.5%
56.6
6
Pos
t
Sel
ects
Gre
atG
rain
sA
pple
Car
amel
A
dult
56
18.9
%
9.4%
41
5N
oN
o
P
ecan
Cru
nch
Pos
t
Sel
ects
Gre
atG
rain
sB
anan
aN
utC
runc
hA
dult
54
20.3
%
6.8%
39
0N
oN
o54
0
Pos
t
Sel
ects
Gre
atG
rain
sB
lueb
erry
Mor
ning
A
dult
46
29.1
%
3.6%
50
9N
oN
o54
-8
Pos
t
Sel
ects
Gre
atG
rain
sC
ranb
erry
Alm
ond
A
dult
58
25.5
%
5.9%
22
5N
oN
o56
2
Cru
nch
Pos
t
Sel
ects
Gre
atG
rain
sC
runc
hyP
ecan
sA
dult
58
17.3
%
7.7%
28
8N
oN
o54
4
Pos
t
Sel
ects
Gre
atG
rain
sM
aple
Pec
anC
runc
hA
dult
48
25.0
%
5.8%
28
8N
oN
o50
-2
Pos
t
Sel
ects
Gre
atG
rain
sR
aisi
nD
ate
Pec
an
Adu
lt
58
25
.9%
7.
4%
241
No
No
56
2
Pos
t
Shr
edde
dW
heat
Pos
t
Shr
edde
dW
heat
O
rigin
al
Adu
lt80
.8%
82
0.0%
12
.8%
0
No
No
82
0
Pos
t
Shr
edde
dW
heat
S
poon
Siz
e:F
rost
ed
Adu
lt40
.3%
70
23.1
%
9.6%
0
No
No
70
0
Pos
t
Shr
edde
dW
heat
S
poon
Siz
e:H
oney
Nut
Adu
lt55
.0%
68
23.1
%
9.6%
13
5N
oN
o70
-2
Pos
t
Shr
edde
dW
heat
S
poon
Siz
e:O
rigin
al
Adu
lt59
.8%
82
0.0%
12
.2%
0
No
No
82
0
Pos
t
Shr
edde
dW
heat
S
poon
Siz
e:R
eal
Str
awbe
rrie
sA
dult
3.3%
Pos
t
Shr
edde
dW
heat
S
poon
Siz
e:W
heat
A
dult
67.3
%
82
1.
7%
13.6
%
0N
oN
o82
0
'nB
ran
Pos
t
Trai
lMix
cru
nch
59.5
%
56
Pos
t
Trai
lMix
cru
nch
Cra
nber
ryV
anill
aA
dult
56
25.0
%
8.3%
28
1N
oN
o
Pos
t
Trai
lMix
cru
nch
Map
len
uta
nd
Adu
lt
54
18
.8%
8.
3%
458
No
No
Bro
wn
Sug
ar
Pos
t
Trai
lMix
cru
nch
Rai
sin
and
Alm
ond
Adu
lt
56
20
.8%
10
.4%
43
8N
oN
o
Pos
t
Waf
fleC
risp
Fa
mily
18
.0%
44
40.0
%
3.3%
38
3N
oN
o42
2
Appendix C
continued

Cereal FACTS 96
N
utr
itio
n In
form
atio
n
Ch
ang
e in
Nu
trit
ion
Qu
alit
y
% o
f
So
diu
m
Form
er
Ta
rget
S
tore
s A
pp
rove
d
NP
I Sco
re
Su
gar
Fi
ber
(
mg
per
A
rtifi
cial
Fo
od
N
PI S
core
C
han
ge
New
B
ran
dC
om
pan
y B
ran
d
Cer
eal
Mar
ket
Sto
ckin
g
by C
BB
B
(5/3
1/09
) (%
of
g)
(% o
f g
) 10
0 g
) S
wee
ten
ers
Dye
s (2
/1/0
6)
in S
core
C
erea
ls
Ext
ensi
on
s
Pea
cec
erea
lP
eace
cer
eal
20.8
%
60
Pea
cec
erea
lP
eace
cer
eal
Fren
chV
anill
aG
rano
laA
dult
56
27.3
%
5.5%
12
7N
oN
o
Pea
cec
erea
lP
eace
cer
eal
Gin
ger
Hem
pG
rano
laA
dult
70
16.4
%
7.3%
19
1N
oN
o
Pea
cec
erea
lP
eace
cer
eal
Gol
den
Hon
eyG
rano
laA
dult
76
18.2
%
7.3%
21
8N
oN
o
Pea
cec
erea
lP
eace
cer
eal
Man
goP
assi
on
Adu
lt
46
18
.2%
3.
6%
582
No
No
Pea
cec
erea
lP
eace
cer
eal
Map
leP
ecan
A
dult
54
20.0
%
5.5%
40
0N
oN
o
Pea
cec
erea
lP
eace
cer
eal
Ras
pber
ryG
inge
rA
dult
54
21.8
%
5.5%
40
0N
oN
o
Pea
cec
erea
lP
eace
cer
eal
Van
illa
Alm
ond
Adu
lt
52
16
.3%
3.
6%
727
No
No
Pea
cec
erea
lP
eace
cer
eal
Wild
Ber
ryC
risp
Adu
lt
40
21
.8%
1.
8%
127
No
No
Qua
ker
100.
0%
56
56
.9
Qua
ker
C
ap'n
Cru
nch
Qua
ker
C
ap'n
Cru
nch
Cho
coC
runc
hC
hild
2.
0%
44
37
.0%
11
.1%
50
0
Qua
ker
C
ap'n
Cru
nch
Pea
nutB
utte
rC
runc
hC
hild
82
.3%
32
33.3
%
3.7%
74
1N
oN
o40
-8
Qua
ker
C
ap'n
Cru
nch
with
Cru
nchb
errie
sC
hild
90
.8%
Ye
s30
46
.2%
3.
8%
692
No
Yes
30
0
Qua
ker
C
ap'n
Cru
nch
(Reg
ular
)C
hild
94
.3%
Ye
s44
44
.4%
3.
7%
741
No
Yes
26
18
Qua
ker
Li
fe
56
Qua
ker
Li
fe
Cin
nam
on
Fam
ily
94.0
%
52
25
.0%
6.
3%
469
No
Yes
52
0
Qua
ker
Li
fe
Map
le&
Bro
wn
Sug
ar
Fam
ily
73.5
%
52
25
.0%
6.
3%
469
No
Yes
Qua
ker
Li
fe
(Reg
ular
)Fa
mily
96
.0%
54
18.8
%
6.3%
50
0N
oYe
s54
0
Qua
ker
N
atur
alG
rano
la
68.8
%
50
Qua
ker
N
atur
alG
rano
la
Oat
s&
Hon
ey
Adu
lt
46
25
.0%
6.
3%
52
No
No
44
2
Qua
ker
N
atur
alG
rano
la
Oat
s&
Hon
ey&
A
dult
46
29.4
%
5.9%
49
N
oN
o46
0
Rai
sins
Qua
ker
O
atB
ran
Col
dC
erea
l
Adu
lt23
.8%
58
15.8
%
10.5
%
368
No
No
Qua
ker
O
atm
ealS
quar
es
86.8
%
56
Qua
ker
O
atm
ealS
quar
es
Bro
wn
Sug
ar
Adu
lt
54
18
.2%
9.
1%
455
No
Yes
54
0
Qua
ker
O
atm
ealS
quar
es
Cin
nam
on
Adu
lt
56
21
.7%
8.
3%
433
No
No
54
2
Qua
ker
O
atm
ealS
quar
es
Gol
den
Map
le
Adu
lt
56
21
.4%
7.
1%
429
No
Yes
Unc
leS
am
Unc
leS
am
A
dult
48.0
%
78
1.
8%
18.2
%
245
No
No
Wee
tabi
xA
lpen
S
wis
sM
uesl
iA
dult
18.5
%
74
20
.0%
7.
3%
54
No
No
Wee
tabi
xW
eeta
bix
A
dult
39.8
%
74
5.
7%
11.4
%
371
No
No
"Not
es:D
ata
are
liste
dat
eith
erth
eco
mpa
ny,b
rand
or
cere
alle
vel.
""I
fno
bran
dor
cer
eali
sin
clud
edin
the
row
,dat
aap
ply
toth
eco
mpa
nyle
vel.
""I
fno
cere
alis
incl
uded
inth
ero
w,d
ata
appl
yto
the
bran
dle
vel.
"A
llot
her
data
app
lyto
the
cere
alle
vel
Appendix C

Cereal FACTS 97
Appendix D
Ad
vert
isin
g, T
elev
isio
n a
nd
Inte
rnet
Mar
keti
ng
Dat
a
Ad
vert
isin
g
Ad
vert
isin
g
o
n t
hir
d
on
th
ird
Tele
visi
on
Te
levi
sio
n
Co
mp
any
Ch
ild-t
arg
eted
p
arty
p
arty
adve
rtis
ing
: ad
vert
isin
g:
web
site
: w
ebsi
te:
web
site
s:
web
site
s:
Co
mp
any
Bra
nd
C
erea
l A
dve
rtis
ing
E
xpo
sure
C
on
ten
t E
xpo
sure
C
on
ten
t E
xpo
sure
C
on
ten
t S
oci
al
spen
din
g
dat
a an
alys
is
dat
a an
alys
is
dat
a an
alys
is
Med
ia
Ann
ie's
B
unni
es
Bar
bara
'sB
aker
yO
rgan
icW
ildP
uffs
Bar
bara
'sB
aker
yP
uffin
s
X
X
X
Bar
bara
'sB
aker
yS
hred
ded
Oat
s
X
Bar
bara
'sB
aker
yS
hred
ded
Whe
at
X
Bar
bara
'sB
aker
yU
ltim
aO
rgan
ic
X
Cas
cadi
anF
arm
C
inna
mon
Cru
nch
Cas
cadi
anF
arm
C
liffo
rdC
runc
h
Cas
cadi
anF
arm
G
rano
la
Cin
nam
onR
aisi
nX
Cas
cadi
anF
arm
G
rano
la
Frui
t&N
ut
X
X
Cas
cadi
anF
arm
H
oney
Nut
O's
Cas
cadi
anF
arm
P
urel
yO
's
Gen
eral
Mill
sC
ompa
ny
X
X
X
X
Gen
eral
Mill
sB
ooB
erry
X
Gen
eral
Mill
sH
oney
Nut
Che
erio
s
X
X
X
X
X
X
X
Gen
eral
Mill
sC
heer
ios
X
X
X
X
Gen
eral
Mill
sC
heer
ios
Frui
ty
X
Gen
eral
Mill
sC
heer
ios
Mul
tigra
in
X
X
X
Gen
eral
Mill
sC
heer
ios
Oat
Clu
ster
Cru
nch
X
X
X
Gen
eral
Mill
sC
heer
ios
(Reg
ular
)X
X
X
X
X
Gen
eral
Mill
sC
hex
X
X
X
X
X
X
X
Gen
eral
Mill
sC
hex
Cho
cola
te
X
Gen
eral
Mill
sC
hex
Cin
nam
on
X
Gen
eral
Mill
sC
hex
Cor
nX
Gen
eral
Mill
sC
hex
Str
awbe
rry
X
Gen
eral
Mill
sC
inna
mon
Toa
stC
runc
h(R
egul
ar)
X
X
X
X
Gen
eral
Mill
sC
ocoa
Puf
fs
com
bos
X
X
X
Gen
eral
Mill
sC
ocoa
Puf
fs
(Reg
ular
)X
X
X
X
X
Gen
eral
Mill
sC
ooki
eC
risp
X
X
Gen
eral
Mill
sC
ooki
eC
risp
(Reg
ular
)X
X
X
X
Gen
eral
Mill
sC
ount
Cho
cula
X
Gen
eral
Mill
sC
urve
s
X
Gen
eral
Mill
sC
urve
sH
oney
Cru
nch
X
X
X
Gen
eral
Mill
sC
urve
sW
hole
Gra
inC
runc
hX
Gen
eral
Mill
sD
ora
the
Exp
lore
r
Gen
eral
Mill
sF
iber
One
X
X
X
continued

Cereal FACTS 98
Ad
vert
isin
g
Ad
vert
isin
g
o
n t
hir
d
on
th
ird
Tele
visi
on
Te
levi
sio
n
Co
mp
any
Ch
ild-t
arg
eted
p
arty
p
arty
adve
rtis
ing
: ad
vert
isin
g:
web
site
: w
ebsi
te:
web
site
s:
web
site
s:
Co
mp
any
Bra
nd
C
erea
l A
dve
rtis
ing
E
xpo
sure
C
on
ten
t E
xpo
sure
C
on
ten
t E
xpo
sure
C
on
ten
t S
oci
al
spen
din
g
dat
a an
alys
is
dat
a an
alys
is
dat
a an
alys
is
Med
ia
Gen
eral
Mill
sF
iber
One
C
aram
elD
elig
ht
X
Gen
eral
Mill
sF
iber
One
Fr
oste
dS
hred
ded
Whe
at
X
X
X
Gen
eral
Mill
sF
iber
One
H
oney
Clu
ster
sX
X
X
Gen
eral
Mill
sF
iber
One
O
rigin
al(
bran
)X
X
Gen
eral
Mill
sFr
anke
nB
erry
X
Gen
eral
Mill
sG
olde
nG
raha
ms
X
Gen
eral
Mill
sK
aboo
m
Gen
eral
Mill
sK
ix
Hon
ey
X
Gen
eral
Mill
sK
ix
(Reg
ular
)X
Gen
eral
Mill
sLu
cky
Cha
rms
(Reg
ular
)X
X
X
X
X
X
X
Gen
eral
Mill
sN
atur
eV
alle
y
X
X
Gen
eral
Mill
sO
atm
ealC
risp
X
Gen
eral
Mill
sO
atm
ealC
risp
Hea
rty
Rai
sin
X
X
X
Gen
eral
Mill
sR
eese
'sP
uffs
X
X
X
X
X
X
X
X
Gen
eral
Mill
sTo
tal
X
X
X
X
X
X
Gen
eral
Mill
sTo
tal
Cin
nam
onC
runc
h
X
X
X
Gen
eral
Mill
sTo
tal
Cra
nber
ryC
runc
hX
X
X
Gen
eral
Mill
sTo
tal
Who
leG
rain
X
Gen
eral
Mill
sTr
ix
X
X
X
X
X
X
X
Gen
eral
Mill
sW
heat
ies
X
X
X
Gen
eral
Mill
sM
illsb
erry
X
X
X
Kas
hi
Com
pany
X
X
X
X
X
X
Kas
hi
Gra
nola
C
ocoa
Bea
ch
X
Kas
hi
Gra
nola
M
tMed
ley
X
X
X
Kas
hi
GoL
ean
X
Kas
hi
GoL
ean
Cru
nch!
X
X
Kas
hi
Hon
eyS
unsh
ine
Kas
hi
Mig
hty
Bite
s
Kel
logg
C
ompa
ny
X
X
X
X
X
Kel
logg
A
ll-B
ran
X
X
X
Kel
logg
A
ll-B
ran
Ext
raF
iber
X
X
Kel
logg
A
ll-B
ran
Orig
inal
X
X
Kel
logg
A
ll-B
ran
Str
awbe
rry
Med
ley
X
X
X
Kel
logg
A
pple
Jac
ks
Cris
sC
ross
ed
X
X
X
Kel
logg
A
pple
Jac
ks
(Reg
ular
)X
X
X
X
X
X
X
X
Kel
logg
C
ocoa
and
Ric
eK
rispi
es
Coc
oaK
rispi
es
X
X
X
X
X
Kel
logg
C
ocoa
and
Ric
eK
rispi
es
Jum
boM
ulti-
Gra
in
X
X
X
Appendix D
continued

Cereal FACTS 99
Ad
vert
isin
g
Ad
vert
isin
g
o
n t
hir
d
on
th
ird
Tele
visi
on
Te
levi
sio
n
Co
mp
any
Ch
ild-t
arg
eted
p
arty
p
arty
adve
rtis
ing
: ad
vert
isin
g:
web
site
: w
ebsi
te:
web
site
s:
web
site
s:
Co
mp
any
Bra
nd
C
erea
l A
dve
rtis
ing
E
xpo
sure
C
on
ten
t E
xpo
sure
C
on
ten
t E
xpo
sure
C
on
ten
t S
oci
al
spen
din
g
dat
a an
alys
is
dat
a an
alys
is
dat
a an
alys
is
Med
ia
Kel
logg
C
ocoa
and
Ric
eK
rispi
es
Ric
eK
rispi
esT
reat
sX
Kel
logg
C
ocoa
and
Ric
eK
rispi
es
(Reg
ular
)X
X
X
X
X
X
Kel
logg
C
ocoa
and
Ric
eK
rispi
es
Str
awbe
rrie
sX
X
X
Kel
logg
C
ooki
eC
runc
h
Kel
logg
C
orn
Fla
kes
X
X
Kel
logg
C
orn
Pop
s(R
egul
ar)
X
X
X
X
X
X
X
X
Kel
logg
C
rispi
x
Kel
logg
D
isne
yH
igh
Sch
oolM
usic
al
Kel
logg
E
ggo
Cer
eal
Kel
logg
E
xtra
X
X
Kel
logg
E
xtra
Pas
ion
X
X
Kel
logg
Fr
ootL
oops
D
arkb
errie
sX
X
X
Kel
logg
Fr
ootL
oops
D
oubl
eLe
mon
yLo
ot
X
X
X
Kel
logg
Fr
ootL
oops
Fr
uity
Gol
den
Bar
sX
X
X
Kel
logg
Fr
ootL
oops
(R
egul
ar)
X
X
X
X
X
X
X
Kel
logg
Fr
ootL
oops
S
moo
thie
X
Kel
logg
Fr
oste
dF
lake
sG
old
X
X
X
Kel
logg
Fr
oste
dF
lake
s(R
egul
ar)
X
X
X
X
X
X
X
X
Kel
logg
H
anna
hM
onta
na
Kel
logg
H
oney
Sm
acks
Kel
logg
M
INI-
Sw
irlz
Kel
logg
M
ini-W
heat
sFr
oste
d/B
iteS
ize
X
X
X
X
X
X
X
Kel
logg
M
ini-W
heat
sFr
oste
d/B
lueb
erry
Muf
fin
X
Kel
logg
M
ini-W
heat
sFr
oste
d/C
inna
mon
Str
euse
lX
Kel
logg
M
ini-W
heat
sFr
oste
d/M
aple
&B
row
nS
ugar
X
X
Kel
logg
M
ini-W
heat
sFr
oste
d/S
traw
berr
yD
elig
ht
X
Kel
logg
M
ini-W
heat
sLi
ttle
Bite
sX
X
X
Kel
logg
R
aisi
nB
ran
Cru
nch
X
X
X
Kel
logg
R
aisi
nB
ran
Ext
ra
X
X
X
Kel
logg
R
aisi
nB
ran
(Reg
ular
)X
X
X
X
Kel
logg
S
mar
tSta
rt
Map
le&
Bro
wn
Sug
ar
X
X
X
Kel
logg
S
mar
tSta
rt
Orig
inal
Ant
ioxi
dant
sX
X
X
X
X
Kel
logg
S
mar
tSta
rt
Str
awbe
rry
Oat
Bite
sX
X
X
Kel
logg
S
mor
z
Kel
logg
S
peci
alK
B
lueb
erry
X
X
X
Kel
logg
S
peci
alK
C
hoco
late
yD
elig
ht
X
X
X
Kel
logg
S
peci
alK
C
inna
mon
Pec
an
X
X
X
Appendix D
continued

Cereal FACTS 100
Ad
vert
isin
g
Ad
vert
isin
g
o
n t
hir
d
on
th
ird
Tele
visi
on
Te
levi
sio
n
Co
mp
any
Ch
ild-t
arg
eted
p
arty
p
arty
adve
rtis
ing
: ad
vert
isin
g:
web
site
: w
ebsi
te:
web
site
s:
web
site
s:
Co
mp
any
Bra
nd
C
erea
l A
dve
rtis
ing
E
xpo
sure
C
on
ten
t E
xpo
sure
C
on
ten
t E
xpo
sure
C
on
ten
t S
oci
al
spen
din
g
dat
a an
alys
is
dat
a an
alys
is
dat
a an
alys
is
Med
ia
Kel
logg
S
peci
alK
R
edB
errie
sX
Kel
logg
S
peci
alK
(R
egul
ar)
X
X
X
X
X
X
Kel
logg
S
peci
alK
V
anill
aA
lmon
dX
Nes
tle
Fitn
ess
X
X
New
man
'sO
wn
Sw
eetE
noug
h
X
Nat
ure'
sP
ath
Com
pany
X
X
X
Nat
ure'
sP
ath
Env
iroki
dzo
rgan
ic
X
Nat
ure'
sP
ath
Fla
xP
lus
X
Nat
ure'
sP
ath
Her
itage
Hei
rloom
who
leg
rain
s
X
Nat
ure'
sP
ath
Opt
imum
X
Nat
ure'
sP
ath
Opt
imum
P
ower
Bre
akfa
st
X
Nat
ure'
sP
ath
Pum
pkin
Fla
xP
lus
Gra
nola
X
Nat
ure'
sP
ath
Pum
pkin
Rai
sin
Cru
nch
X
Nat
ure'
sP
ath
Sm
artB
ran
X
Pos
tC
ompa
ny
X
X
Pos
tA
lpha
Bits
X
Pos
tG
olde
nC
risp
Pos
tG
rape
Nut
s(R
egul
ar)
X
X
Pos
tG
rape
Nut
sTr
ailM
ixC
runc
hX
X
Pos
tH
oney
Bun
ches
ofO
ats
Hon
eyR
oast
ed
X
X
X
X
X
Pos
tH
oney
Bun
ches
ofO
ats
with
Rea
lCho
cola
teC
lust
ers
X
Pos
tH
oney
Bun
ches
ofO
ats
Just
Bun
ches
X
X
X
X
Pos
tH
oney
com
bC
hoco
late
X
X
X
Pos
tH
oney
com
b(R
egul
ar)
X
X
X
X
X
X
Pos
tP
ebbl
es
Coc
oa
X
X
X
X
X
Pos
tP
ebbl
es
Frui
ty
X
X
X
Pos
tR
aisi
nB
ran
X
X
Pos
tS
elec
tsG
reat
Gra
ins
X
Pos
tS
elec
tsG
reat
Gra
ins
App
leC
aram
elP
ecan
Cru
nch
X
Pos
tS
hred
ded
Whe
at
X
Pos
tS
hred
ded
Whe
at
Orig
inal
X
Pos
tS
hred
ded
Whe
at
Spo
onS
ize:
Fro
sted
X
Pos
tS
hred
ded
Whe
at
Spo
onS
ize:
Hon
eyN
ut
X
Pos
tS
hred
ded
Whe
at
Spo
onS
ize:
Orig
inal
X
Pos
tS
hred
ded
Whe
at
Spo
onS
ize:
Rea
lStr
awbe
rrie
sX
Pos
tTr
ailM
ixc
runc
h
X
X
X
Appendix D
continued

Cereal FACTS 101
Ad
vert
isin
g
Ad
vert
isin
g
o
n t
hir
d
on
th
ird
Tele
visi
on
Te
levi
sio
n
Co
mp
any
Ch
ild-t
arg
eted
p
arty
p
arty
adve
rtis
ing
: ad
vert
isin
g:
web
site
: w
ebsi
te:
web
site
s:
web
site
s:
Co
mp
any
Bra
nd
C
erea
l A
dve
rtis
ing
E
xpo
sure
C
on
ten
t E
xpo
sure
C
on
ten
t E
xpo
sure
C
on
ten
t S
oci
al
spen
din
g
dat
a an
alys
is
dat
a an
alys
is
dat
a an
alys
is
Med
ia
Pos
tW
affle
Cris
p
X
Pos
tP
osto
pia
X
X
X
Qua
ker
Com
pany
X
X
X
Qua
ker
Cap
'nC
runc
h(R
egul
ar)
X
X
Qua
ker
Life
C
inna
mon
X
Qua
ker
Life
M
aple
&B
row
nS
ugar
X
Qua
ker
Life
(R
egul
ar)
X
X
X
X
Qua
ker
Oat
mea
lSqu
ares
X
X
Appendix D