evaluating the operation of pfi in roads and hospitals · evaluating the operation of pfi in roads...
TRANSCRIPT

evaluating the operation of PFIin roads and hospitalsRESEARCH REPORT NO. 84

Evaluating the operation of PFI in roads and hospitals
Pam Edwards
Professor of Accounting
Manchester Business School, University of Manchester
Jean Shaoul
Reader
Manchester Business School, University of Manchester
Anne Stafford
Lecturer
Manchester Business School, University of Manchester
Lorna Arblaster
Research Assistant
Manchester Business School, University of Manchester
Certified Accountants Educational Trust, London, 2004

PAGE 4
The Council of the Association of Chartered Certified Accountants consider this study to be a worthwhile contribution
to discussion but do not necessarily share the views expressed, which are those of the authors alone. No responsibility
for loss occasioned to any person acting or refraining from acting as a result of any material in this publication can be
accepted by the authors or publisher. Published by Certified Accountants Educational Trust for the Association of
Chartered Certified Accountants, 29 Lincoln’s Inn Fields, London WC2A 3EE.
ACCA AND RESEARCH
Technological developments, globalisation, the knowledge economy . . . the environment in which we operate continues
to evolve and with it the finance function. More than perhaps ever before, there is a need to invest in accounting and
business research to extend the evidence and knowledge base that underpins and helps develop the profession. ACCA
is proud to be a leader in this development and has a firm commitment to initiating and funding research into some of
the most important issues facing the accountancy profession globally. As the largest and fastest-growing global
professional accountancy body, with headquarters in London and an extensive network of over 70 offices and other
centres around the world, ACCA is well placed to do this. This global perspective, together with a focus on current and
practical matters, gives ACCA’s research programme the edge to shape agendas and policy. Accordingly, ACCA’s
position is influential and its voice powerful: in the profession, in business and in the corridors of power. Results of
ACCA’s research are reported frequently in the professional and international press. Additionally, details of the ACCA
research programme, together with published reports for download, are available at www.accaglobal.com/research
ACKNOWLEDGEMENTS
Acknowledgements are due to Patrick Stanley, Susan Mabbett, research assistants based at the School of Accounting
and Finance University of Manchester, and Iqbal Khadaroo, doctoral student based at School of Management and
Economics, Queen’s University Belfast.
© The Association of Chartered Certified Accountants, 2004

PAGE 5
Acronyms 6
Executive summary 7
1. Introduction 15
2. The post-implementation control process 27
3. Process issues in the evaluation of PFI 41
4. Examining the potential determinants of value for money (VFM) 57
5. Design, build, finance and operate (DBFO) and roads 71
6. A roads case 107
7. PFI and hospitals 133
8. An NHS trust case 175
9. Discussion and conclusions 205
References 225
Contents

PAGE 6
ASB Accounting Standards Board
CBI Confederation of British Industry
CCT Compulsory competitive tendering
DBFO Design, build, finance and operate
DETR Department for the Environment, Transport
and the Regions
DoT Department of Transport
EDB Early design and build
EDS Electronic Data Systems Ltd (a company)
FBC Full business case
FM Facilities Management
FRS 5 Financial Reporting Standard No. 5
Reporting the Substance of Transactions
GAO General Accounting Office (US)
HA Highways Agency
IPO Initial Public Offering
LEA Local Education Authority
LU London Underground
MCG Major Contractor Group
NAO National Audit Office
NHS National Health Service
NIRS2 National Insurance Recording System 2
NPC Net present cost
NPV Net present value
OGC Office of Government Commerce
PAC Public Accounts Committee
PCT Primary care trust
PDC Public dividend capital
PFI Private Finance Initiative
PIR Post-implementation review
PPP Public private partnership
PUK Partnerships UK
SPV Special purpose vehicle
SSAP 21 Statement of Standard Accounting Practice
No. 21 Accounting for Leases and Hire
Purchase
TUPE Transfer of Undertakings Protection of
Employment
UK GAAP UK Generally Accepted Accounting
Principles
VFM Value for money
WIMS Works Information Management System
Acronyms
PAGE 7
Executive summary
Partnerships are one of the keystones of the
Government’s reform of the public services. They have
both macro-level and micro-level objectives. At the
macro level, the intention is to lever in the private
finance that the Government cannot afford. In some
sectors such as roads, a parallel macro objective has
been to create private sector capability. At the micro
level, partnership objectives embrace value for money
(VFM), a concept that includes the transfer to the
private sector of risk and the associated costs that
would otherwise be borne by the public sector and the
greater expertise, efficiency and innovation that the
private sector is assumed to possess.
The introduction of partnership working, known as the
Private Finance Initiative (PFI), was heralded with
much enthusiasm by the then Conservative
Government in the early 1990s and was later adopted
with similar enthusiasm as a cornerstone of the
incoming Labour Government’s policy for improving
infrastructure and public services. The Labour
Government re-branded the policy as public private
partnerships (PPP), widened it to include several
different forms of which the PFI is but one, and has,
confusingly, used the terms PPP and PFI
interchangeably. Under the PFI, the public sector
procures a capital asset and non-core services from the
private sector on a long-term contract, typically at least
30 years, in return for an annual payment.
Subsequently ministers, government officials and others
with financial interests in the PFI policy have claimed
much success for projects. However, numerous IT PFI
projects have failed. Several PFI/PPP projects have had
to be bailed out, some have been scrapped and others
have been the subject of widespread criticism. The
National Audit Office (NAO), the Public Accounts
Committee (PAC), the Audit Commission and Accounts
Commission have been circumspect about the levels of
success, and identified various lessons to be learned.
Despite the welcome investment in public services, the
policy remains unpopular with the public at large and
the relevant trade unions.
So far, most research has focused on the decision-
making processes that led up to the signing of a
partnership contract or has examined the benefits and
costs from an a priori perspective. The NAO’s studies of
some of the early roads projects report that the
payment mechanism created additional risks for the
public sector that raise questions about the value of
risk actually transferred to the private sector (National
Audit Office 1998, 1999). In the context of hospitals, a
considerable body of evidence challenges both the
macro- and the microeconomic arguments (Pollock et
al. 2002), raising questions about service provision
and the conflict between policy promotion and
regulation (Froud and Shaoul 2001). Several studies
have examined the business cases supporting the use
of private finance for new hospital builds, and
questioned the ability of the methodology to measure
VFM in an unbiased way, the degree to which the
business cases demonstrate VFM and the higher cost of
PFI over conventional procurement (Gaffney and
Pollock 1999; Price et al. 1999; Pollock et al. 2000;
Froud and Shaoul 2001; Shaoul 2005). Their evidence
shows that the VFM case rests upon risk transfer. The
credit ratings agency, Standard and Poor’s, in its report
for the capital markets (Standard and Poor’s 2003),
states that the PFI companies carry little effective risk.
Other work shows that the high costs of PFI projects
lead to affordability problems, an issue that the
emphasis on VFM downplays, and lead to hospital
downsizing in order to bridge the affordability gap
(Hodges and Mellett 1999; Gaffney and Pollock 1999;
1999b; Gaffney et al. 1999a; 1999b; 1999c; Pollock
et al. 1999).
By way of contrast, this research study focuses on the
actual performance in two sectors, roads and hospitals,
which have substantial commitments to partnership
financing and projects that have been in place for some

PAGE 8
years. In roads, where PFI projects are known as
design, build, finance and operate (DBFO), the eight
projects signed in 1996 represented about 35% of all
new construction in the roads sector between 1996
and 2001 (DTI 2002). In the Government’s 10-year
national plan, 25% of the £21 billion allocated for the
strategic highway network will involve private finance
(DETR 2000). In the health sector, there has been a
continuous expansion of private finance since the first
health contract was signed in 1997 and by 4 April
2003 some 117 schemes had been approved by the
Department of Health with a value of £3.2 billion (HM
Treasury 2003c). These two sectors offer contrasting
environments, in terms of the relationship between
central government and the procuring entity, and
previous experience of contracting with the private
sector.
Our report is in three parts. First, we examine the
advice from official bodies about how PFI should be
evaluated. We examine the literature as it relates to the
available evidence about the nature of post-
implementation reviews of PFI projects and the
methodology and process issues that constrain such
evaluative research.
Secondly, we identify the origins, development, nature
and scale of PFI in roads and hospitals. Our study
focuses on the first eight DBFO projects in England
managed by the Highways Agency and the first 13 PFI
hospitals (12 in England and one in Scotland). We then
analyse the reported financial performance of both the
public and the private sector partners using information
obtained directly from the Highways Agency and the
hospital trusts, and Companies House respectively.
Thus we have focused on information that is in the
public domain, supplemented by contextual information
provided by staff at headquarters level in both sectors.
We also examine the costs and affordability of these
PFI projects in terms of their impact on the budget of
the relevant procurer. Our emphasis is on costs to the
public sector, returns to the private sector, the effective
cost of private finance and its affordability to the public
purse.
Our concern is with the extent to which the financial
reporting by all the parties involved in PFI provides
accountability to the public. The concept of
accountability in the context of public expenditure on
essential public services implies first that citizens, or at
least their political representatives, the media, trade
unions, academics, etc, can see how society’s
resources are being used and, secondly, that no
members of that society are seen to have an explicitly
sanctioned unfair advantage over others in relation to
how those resources are used.
Thirdly, as well as a sectoral analysis of roads and
hospitals, we examine two projects in greater detail,
one each from the road and hospital sectors. We chose
projects that had been implemented for at least three
years and in which the construction phase was
complete so that, unlike previous work, our focus is on
the operation and maintenance phase. We used semi-
structured interviews with a range of personnel from
various parties to the projects. Given that PFI
emphasises the nature of the long-term service
agreements, we describe and evaluate the systems that
were put in place to monitor the operational phase of
projects, ensure that risk transfer operates in the way
expected by the contract and thereby obtain VFM.
The research findings may be summarised under three
interrelated headings: partnership and managing the
contract; VFM and risk transfer; and financial reporting
and accountability.
PARTNERSHIP AND MANAGING THE CONTRACT
• Partnership is an ideal to be aspired to rather than a
description of the actual working relationship
between public and private contracting parties and
has implications for monitoring and accountability
relationships.
Executive summary

PAGE 9
• Planning of the performance monitoring systems is
poor and leads to an increased workload in the
management of the projects.
• Self-monitoring systems require high levels of trust,
which is not always present, and public sector
partners are conducting more monitoring activities
than expected.
• Outcomes that are subjective in nature, eg hospital
cleaning, are difficult to write in contractually
effective ways and cause monitoring difficulties.
• While contingency plans should be prepared at least
in outline for all major PFIs against the possibility of
default by the private sector, none are evident.
VALUE FOR MONEY AND RISK TRANSFER
• Soft project objectives may not be evaluated and
user opinions about service are not always sought.
• It is impossible to compare the actual costs of PFI
and thus VFM (one of the justifications for PFI)
against the original public sector comparator (PSC)
as the PSC quickly becomes out of date.
• Additional monitoring costs have increased the
public sector’s costs and thus reduced VFM
compared with the original expectations.
• Where risk is shared between partners its allocation
may be unclear and therefore its transfer – so central
to PFI – is uncertain.
In relation to roads, we have made a number of
findings.
• Demand risk is held by the private sector but this
may create a new source of risk because the private
sector cannot manage this demand.
• The Government guarantees the Highways Agency’s
payments to the DBFO companies, which reduces
the risk to the private sector.
• We calculate that the Highways Agency paid a
premium of some 25% of construction cost on the
first four DBFO roads to ensure the project was built
on time and to budget.
• In just three years the Highways Agency paid £618 m
for the first eight projects, more than the initial
capital cost of £590 m, which refutes one of the
Government’s justifications for DBFO. This means
that the remaining payments on the 30-year
contracts (worth about £6 billion) are for risk
transfer, operation and maintenance.
• Because the full business cases are not in the public
domain, there has been little external financial
scrutiny of the deals and post implementation it is
unclear how the actual cost of DBFO compares with
the expected costs. Our evidence suggests that
DBFO has turned out to be more expensive than
expected. But how this affects the Highways
Agency’s ability to fund other maintenance projects
is unclear.
• The special purpose vehicles (SPVs) report an
operating profit before interest and tax of about two
thirds of their receipts from the Highways Agency
and this is after subcontracting to sister companies.
This operating profit (less tax) is the effective cost of
capital.
• About 35% of the SPVs’ income from the Highways
Agency is paid to their operations and maintenance
subcontractors, typically sister companies, including
an unidentifiable profit element for the
subcontractor. Given that the contracts are still in
their early years, the payments to the subcontractors
are likely to represent operations rather than
maintenance.
Executive summary
PAGE 10
• Subcontracting in this way means that it is difficult
to isolate the costs of operations and maintenance in
DBFO contracts since the subcontractor may have
multiple contracts elsewhere. The absence of such
information makes it difficult for the public sector to
benchmark costs when it comes to amending the
contracts and negotiating new ones.
• Although the amount of tax payable by the SPVs
over the whole period was only 7% of operating
profits, even this overstates the actual tax paid since
this includes an element of deferred tax. This low tax
rate, in the early years at least, challenges an
important part of the Treasury’s new appraisal
methodology for PFI, which assumes that tax
payable will be about 22%, which will in turn distort
the VFM analysis in favour of PFI.
• The SPVs’ interest rate of 11% in 2001 and 9% in
2002 and the high level of debt, which is greater
than the construction costs, means that the DBFO
contracts are considerably more expensive than the
cost of conventional procurement using Treasury
gilts at the current rate of 4.5%.
• The seven SPVs’ post-tax returns on shareholders’
funds are high and higher than elsewhere in the
industry.
• The seven SPVs’ total effective cost of capital was
about 11% in 2002. While the NAO believes that
this additional cost of private finance (six percentage
points above Treasury stock) represents the cost of
risk transfer (about £56 m), it is difficult to see what
risks the companies actually bore since their
payments were guaranteed by the Government and
based on shadow tolls. In the context of rising
traffic, this means that they were insulated from
downside risk at the Highways Agency’s expense.
• In practice, the shadow tolls have led to a front
loading of the payment flows to cover the future cost
of maintenance, and hence the SPVs’ profits.
• In the absence of arrangements to ring-fence the
post-tax profits, should the DBFOs fail for whatever
reason later in the contract, the Highways Agency
could find that it has to bear the remaining and
higher cost of private capital and the maintenance
costs that it thought it had already paid for.
In conclusion, the road projects appear to be costing
more than expected as reflected in net present costs
that are higher than those identified by the Highways
Agency (Haynes and Roden 1999), owing to rising
traffic and contract changes. It is, however, impossible
to know at this point whether or not VFM has been or
is indeed likely to be achieved because the expensive
element of the service contract relates to maintenance
that generally will not be required for many years.
In relation to hospitals, we note the following points:
• The annual cost of capital for trusts rises with PFI by
at least £45 m over and above the cost of a new
hospital financed under the Government’s capital
charging regime, even though the hospitals are
considerably smaller than the ones they replace.
This underestimates the additional cost of PFI, since
the construction costs of PFI include an amount of
up to 30% to cover the cost of private finance,
transaction costs, etc.
• Conservatively estimated, the trusts appear to be
paying a risk premium of about 30% of the total
construction costs, just to get the hospitals built on
time and to budget, a sum that considerably exceeds
the evidence about past cost overruns. Nine of the
trusts report off balance sheet schemes, as the
Treasury had originally intended, implying that most
of the ownership risks have been transferred to their
Executive summary

PAGE 11
private sector partners. But as none of the
corresponding SPVs report their hospitals on balance
sheet either, this creates uncertainty as to who has
ultimate responsibility.
• Within a few years of financial close, PFI charges
are in some cases much higher than anticipated.
This raises questions about the reliability and
validity of the VFM case that was used to justify the
decision to use private finance.
• The high cost of PFI means that about 26% of the
increase in income in between 2000 and 2003 is
going to pay for PFI charges for new hospitals.
• About half the income that the SPVs receive from
the trusts relates to the cost of capital.
• About half the income the SPVs receive from the
trusts is paid to the SPVs’ subcontractors (typically
sister companies) for construction, maintenance and
services. Subcontracting in this way makes it
difficult to isolate the cost of services in PFI
contracts since subcontractors are likely to have
multiple sources of income. This puts the public
sector at a disadvantage when it tests the market
some years into the contract.
• The SPVs were paying an effective cost of capital of
10% in 2002, about five points higher than the
public sector’s cost of borrowing. The SPVs’ high
effective cost of capital means that PFI contracts are
considerably more expensive than the conventional
procurement.
• The SPVs made a post-tax return on shareholders’
funds of more than 100% in each of the three years
2000–02, higher than elsewhere in the industry and
which, in the case of the Meridian Hospital
Company Plc, was more than expected.
• This financial analysis is likely to underestimate the
total returns to the parent companies because the
SPVs subcontract to their sister companies and
some of these subcontractors benefit from additional
income via user charges for car parks, canteen
charges, etc.
• £123 m or 51% of the private sector’s receipts from
the trusts are attributable to the cost of capital.
Since this is about five percentage points above the
cost of Treasury debt, then the extra cost of private
finance constitutes the cost of transferring risk, the
risk premium. The risk premium was approximately
£62 m in 2002. It is unclear whether this is money
well spent.
• Six out of the 13 trusts we analysed are in deficit,
and four of the nine trusts with off balance sheet PFI
projects had significant net deficits after paying for
the cost of capital.
• Assuming that the financial performance of trusts is
a proxy for affordability, then the fact that hospitals
with PFI contracts were more likely to be in deficit
than the national average in the period 2002–03
suggests that PFI is not affordable. This has
potentially serious implications for service provision
and access to healthcare.
• As well as the cost to the trusts, PFI creates
additional costs at Treasury level since the capital
charges that would normally be recycled within the
healthcare economy ‘leak’ out of the system. We
estimate conservatively that this is costing about
£125 m a year.
Taken together, this financial analysis shows first, that
in some cases PFI has turned out to be less economical
than expected, and secondly, since these are all long-
term projects, it is impossible to know whether they
will deliver VFM over the full term of the contract. In so
Executive summary

PAGE 12
far as they are costing more than expected, this has an
impact on the individual trusts and the wider NHS
budget that must affect both staff and patients.
FINANCIAL REPORTING AND ACCOUNTABILITY
• Despite annual costs in each sector of about £210 m
for just these initial projects, there is little
information available to the public as taxpayers and
users.
• Financial information about PFI is opaque, partly
because of Government-imposed confidentiality. In
the roads sector in particular, this restricts access to
the Highways Agency’s full business cases used to
support the case for using private finance. The lack
of information in the public domain makes it difficult
to estimate the exact extent of the commitments
incurred by the Highways Agency and the
Department of Transport (DoT) and therefore
provides little accountability to the public. In the
NHS, disclosure is generally better than in central or
local government.
• Private sector organisations use complex structures
that involve close company status.1 Therefore related
party transactions are not disclosed. The result is
that returns on PFI projects are spread between
these various entities and thus are disguised.
• Not only is there a lack of explanation for the
treatment of PFI assets/liabilities and income/
expenditure in both sectors, but neither the
treatments nor the amounts match across the public
and private sectors. Some PFI projects are
accounted for on balance sheet but others are off
balance sheet and there has been a change in
accounting policy in relation to some projects.
The net result of all this is that while risk transfer is the
central element in justifying VFM and thus PFI, our
analysis shows that risk does not appear to have been
transferred to the party best able to manage it. Indeed,
rather than transferring risk to the private sector, in the
case of roads DBFO has created additional costs and
risks to the public agency, and to the public sector as a
whole, through tax concessions that must increase
costs to the taxpayer and/or reduce service provision. In
the case of hospitals, PFI has generated extra costs to
hospital users, both staff and patients, and to the
Treasury through the leakage of the capital charge
element in the NHS budget. In both roads and
hospitals these costs and risks are neither transparent
nor quantifiable. This means that it is impossible to
demonstrate whether or not VFM has been, or indeed
can be, achieved in these or any other projects.
While the Government’s case rests upon value for
money, including the cost of transferring risk, our
research suggests that PFI may lead to a loss of
benefits in kind and a redistribution of income, from the
public to the corporate sector. It has boosted the
construction industry, many of whose PFI subsidiaries
are now the most profitable parts of their enterprises,
and led to a significant expansion of the facilities
management sector. But the main beneficiaries are
likely to be the financial institutions whose loans are
effectively underwritten by the taxpayers, as evidenced
by the renegotiation of the Royal Armouries PFI (NAO
2001a).
Executive summary
1 A close company, subject to certain exceptions, is broadly a
company:
• which is under the control of
– five or fewer participators, or
– any number of participators if those participators are
directors,
or
• more than half the assets of which would be distributed to
five or fewer participators, or to participators who are
directors, in the event of the winding up of the company.
(Inland Revenue 2004).

PAGE 13
Our study has identified a number of areas for future
research including longitudinal case studies that track
the long-term relationships between contracting parties;
an investigation into the technical accounting issues
that surround accounting for the assets involved in PFI;
a comparison of the financial performance of trust
hospitals with PFIs against those without PFIs; and an
examination both of the impact on public expenditure
and the financial performance and viability of both
public and private sector partners.
In conclusion, as we state above, our concept of
accountability in the context of public expenditure on
essential public services implies first that citizens, or at
least their political representatives, the media, trade
unions, academics, etc, can see how society’s
resources are being used and, secondly, that no
members of that society are seen to have an explicitly
sanctioned unfair advantage over others in relation to
how those resources are used. With respect to the first
point, the difficulties experienced by the research team
in obtaining and interpreting the financial statements of
the relevant parties do not generate much hope that
patients, road users, taxpayers and other citizens can
see how society’s resources are being used. It is
significant that more information is made available both
by the companies and the Government to the capital
markets than to the public at large. Within the financial
statements there is little information about the impact
of PFI contracts on the performance of the procurer,
and there is a build-up of commitments and implicit
guarantees within very long-term contracts about which
there is little transparency. With respect to the second
point, our analysis suggests that PFI is an expensive
way of financing and delivering public services that
may, where public expenditure is constrained, lead to
cuts in public services and/or tax rises, that is, it
represents a cut in the social wage. In contrast, we
suggest that the chief beneficiaries are the providers of
finance and some of, but not necessarily all the private
sector service providers, rather than the public sector.
Executive summary

PAGE 14
Executive summary

PAGE 15
1. Introduction
Let me say at the outset thatpartnerships between the publicand the private sector are acornerstone of the Government’smodernisation programme forBritain. They are central to ourdrive to modernise our key publicservices. Such partnerships arehere and they are here to stay.(Alan Milburn, Secretary of State for Health, 2000)
Background to the study of the Private Finance Initiative 17
Aims of the project 21
Research methods 23

PAGE 16
Introduction
PAGE 17
BACKGROUND TO THE STUDY OF THE PRIVATE
FINANCE INITIATIVE
The Private Finance Initiative (PFI) began life as
Conservative Government policy aimed at reforming the
delivery of state activities that could not be privatised
for financial or political reasons. In 1997, the incoming
Labour Government embraced the policy wholeheartedly,
renaming it public private partnerships (PPP). Since
then PPP/PFI has become one of its key policies.
Let me say at the outset that partnerships between the
public and the private sector are a cornerstone of the
Government’s modernisation programme for Britain.
They are central to our drive to modernise our key
public services. Such partnerships are here and they
are here to stay. (Alan Milburn, Secretary of State for
Health, 2000)
Public private partnerships is an umbrella term that
encompasses a range of financial and organisational
forms: joint ventures between the public and private
sectors, partial privatisations, sale and lease-back
arrangements, as well as the Private Finance Initiative.
The policy operates using a range of measures but the
general principle is that the public sector procures the
delivery of support services and, with increasing
frequency, ‘core’ professional services from the private
sector. Thus the Government and its agencies in effect
become the procurers and regulators of services rather
than the providers. The rhetoric, especially of the
Labour Government, has been that the relationship
between the two contracting parties should be that of
partnership, and Kernaghan (1993, p. 61) argues that
partnerships may be classified into four different
categories:
• collaborative: pooling of equal resources and
relinquishing of autonomy in pursuit of shared goals
• operational: sharing of work but not of decision-
making authority
• contributory: sharing of finances but not of
operational involvement
• consultative: where advice is solicited by the public
sector from various sources.
The public agency procures the services by means of a
contract with a private sector provider organised in the
form of a consortium or ‘special purpose vehicle’ (SPV),
which usually includes a construction company, a
facilities manager and a financier. The initial stages of
the tendering process normally focus on the ‘design,
build and operate’ elements, whereas financing is
considered at a later stage once the preferred bidder is
chosen (Spackman 2002).
Like many policies, its rationale has changed so much
over time that even its proponents have described it as
‘an ideological morass’ (IPPR 2001). Originally justified
in terms of providing the finance for investment that the
public sector could not afford, the macroeconomic
argument, it is now increasingly justified in terms of
delivering value for money (VFM), in the form of lower
discounted financial costs over the life of the project
compared with the cost of conventional procurement as
measured by a public sector comparator (PSC). This is
the microeconomic argument. In general terms its
proponents argue that the private sector is able to
provide services more efficiently and effectively than
the bureaucratic public sector. For example, Osborne
and Gaebler (1993) suggest that the private sector is
better than the public sector at performing complex
economic or technical tasks, innovating or replicating
successful experiments and adapting to rapid change,
including the ability to abandon unsuccessful or
obsolete activities.
The achievement of VFM includes the transfer to the
private sector of risk and associated costs that would
otherwise be borne by the public sector. This is
qualified, however, by the fact that risks associated
with all aspects of the contract should be carried by the
Introduction

PAGE 18
party most able to manage that risk. Thus risks
associated with the design, construction, finance,
maintenance and operation of the building need to be
identified; and for each, probabilities must be assigned
and outcomes valued so that the financial value to the
procurer of transferring risk can be measured and
incorporated into the options appraisal. As risk is
transferred, other things being equal, the PSC becomes
relatively more expensive than a privately financed
alternative.
The costs associated with risk are not straightforward.
First, the inclusion of risk is limited by the ability of
managers to anticipate, define and attach probabilities
and values to a range of outcomes. Secondly, there is
no requirement to measure the extent to which PFI may
create extra risks, such as those that may arise as a
consequence of being locked into a long-term contract
where changes must be negotiated. Thirdly, there is the
problem of how risk affects the accounting treatment of
the assets and liabilities. According to the ASB (1998)
if the public sector body holds the demand and residual
risk, then the assets and related liabilities should be
shown on the balance sheet. The Treasury prefers that
PFI assets should be off balance sheet, however,
because – it is believed – this acts to reduce public
debt, a key measure of the European Union’s Growth
and Stability Pact. Therefore, in order to comply with
both the Treasury and FRS 5, the public sector needs
to demonstrate that sufficient additional risk has been
transferred to the private sector to compensate for the
demand and residual risk that it still holds. Hence, the
public sector is under pressure to transfer risk. What
constitutes sufficient risk from the perspective of
FRS 5 is a matter of judgement.
It is becoming clear that transfer of risk from the public
to the private sector is an essential element of a PFI
deal, for two reasons.
First, many projects only achieve VFM at the decision-
making stage, because of the risk transfer contribution.
We will explore this further in Chapter 4, together with
evidence that suggests that risk may not always
transfer as expected.
Secondly, because of accounting regulations it is
necessary to show that risk transfer has taken place if
the scheme is to remain off balance sheet in the public
sector.
Consequently, there is some concern that risk might be
transferred out of the public sector, whether or not the
private sector is able to manage it most efficiently.
Therefore the nature of risk transfer is a critical feature
of many PFI projects.
The Government has put in place procedures designed
to ensure that approval is given only to PFI projects
that are likely to deliver VFM to the public agency over
the life of the project. In essence these procedures
require the preparation of a business case that lists the
costs, benefits, risks, uncertainties and affordability of
various options. Bids will be sought based upon a
detailed specification of required outcomes. A
comparison of these competing bids, and the
calculated cost of a simulated public sector route to
fulfil the same project, is made using discounted cash
flows to determine the net present cost. Costs of risk
associated with the project are included in this
analysis.
Several points follow from this. Value for money (VFM)
is the key rationalising motif for partnerships. Although
value for money is a colloquial term that has intuitive
appeal, its substantive meaning is ambiguous. It is
usually associated with the three Es: economy,
efficiency and effectiveness. In practice, for a variety of
conceptual and practical reasons, VFM audits, as
carried out by the National Audit Office, have focused
on economy rather than efficiency and effectiveness. Its
meaning in the context of PFI is no more precise and is
similarly based upon economy as reflected in the use of
discounted cash flows over the lifetime of the project.
Introduction
PAGE 19
The procurement process, by relying upon market
forces and giving a greater role to the private sector in
designing the services to be provided, should create a
competitive tension and lead to innovative solutions
that will help to deliver a more economical service.
But none of this should obscure a number of important
issues.
The VFM case is necessarily based on estimates of
future costs and operates only at the point of
procurement.
Risk transfer is the crucial element in demonstrating
the expected whole-life economy, since under PFI the
financial costs of private sector borrowing, transactions
costs and the requirements for profits necessarily
generate higher costs than conventional public
procurement. The more risk is transferred, the more
expensive the PSC becomes relative to the PFI option.
As the evidence from the new hospitals to be built
under PFI shows, conventional public procurement
provides greater VFM until risk transfer is factored in,
and even then the margin of difference is small
(Pollock, Shaoul and Vickers 2002).
Although the PFI option therefore has extra costs, this
is countered by the fact that the private sector is
assumed to be operationally more economic and carries
risks that are not usually quantified.
The scope of the risk analysis is narrow and focuses on
VFM within the agency concerned, despite the fact that
these public bodies deliver ‘public’ goods and services.
There is no guarantee that the contract is enforceable in
practice or will actually transfer risk in the way the PSC
anticipates, as failed PFI IT projects have demonstrated
(Edwards and Shaoul 2003).
PPP/PFI has now become an important source of new
infrastructure, involving significant commitment of
future Government funds. For example, between 1999
and 2003, the capital value of signed PFI/PPP deals
was about £3–4 billion per year, making a total of 563
deals worth £35.5 billion of which £32.1 billion were
signed after the Labour Government came to power. In
2003, the Treasury estimated that the capital value of
all signed PFI projects would be about £9.841 billion
for 2003/4 (HM Treasury 2003b). There is
considerable variation, however, in the use of PFI
across Government departments both in absolute and
relative terms, with the Departments of Transport and
Defence having the largest number of projects by value,
although the Departments of Defence and Health rely
much more heavily on PFI as a source of investment
finance than do other Departments (HM Treasury
2003c). In total it was believed to constitute about
18% of gross public sponsored investment in 2001
(IFS 2002) and about 15% in 2002 (HM Treasury
2003c), although such calculations are beset with
definitional problems.
Annual payments for the signed deals alone were
expected to be £2.9 billion in 2000/1, rising to
£6 billion in 2007 (HM Treasury 2003c) or £105 billion
over the life of the contracts (NAO 2003h). Since these
payments relate largely to new deals, rather than to the
replacement of existing outsourcing arrangements, the
money available to pay for them is what remains of
public expenditure after welfare payments and the
purchase of external goods and services – the public
sector wage budget. Annual payments will therefore
divert about 6–7% of the current wage bill, which has
declined from 72% of public expenditure (after the
welfare payments and external purchases) in 1977 to
38% in 1999, and this is set to increase as new deals
are signed (Pollock et al. 2001).
Despite the welcome investment programme in public
services, the policy has proved unpopular with the
public at large and generated a heated debate about
the aims, appraisal methods and processes, and
outcomes of both the policy and specific projects.
Introduction

PAGE 20
Numerous IT PFI projects have failed in terms of their
original objectives, cost and time overruns, with costs
to the procuring agency, the public sector as a whole
and the public as users. At least three PFI/PPP
schemes have had to be bailed out: the Channel Tunnel
Rail Link, the Royal Armouries Museum and National
Air Traffic Services, while others have been scrapped.
Front line public services such as health and education
have required and/or been accompanied by extensive
closures and rationalisations that have proved
unpopular. Lastly, the refinancing of PFI projects after
construction has generated extra profits that have led to
widespread fears that the private sector is profiteering
at the expense of cash-strapped services.
The policy is particularly important since an increasing
proportion of public sector expenditure is committed to
long-term service contracts, which are legally binding
and therefore have the effect of committing a
subsequent government to expenditure under
conditions where there may be considerable uncertainty
about the kind of services that may be required in the
future. The introduction of PFI therefore raises
numerous questions and issues for study and it is
clearly important that these contracts should be
evaluated.
To date there has been extensive analysis of the
financial and accountability issues arising from PFI,
both from a theoretical perspective and on a case study
basis, which investigates the decision-making
processes, the VFM and the viability of projects prior to
the signing of contracts, that is, analysis that focuses
on the appraisal process. As yet there has been little
assessment of whether – or how – lower costs, risk
transfer and thus value for money have been achieved
in practice after project implementation, or what
impacts PFI has on public accountability; that is,
assessment that focuses on the evaluation of such
projects. In part at least, this is because the policy is
still new and projects have only recently become
operational.
Although the National Audit Office (NAO) has examined
a number of high-profile PFI failures which have had
widespread economic, social and political implications
that raise questions about their justification, cost and
risk transfer, as well as wider issues of regulation,
accountability and control, its investigations have
usually been restricted to ‘what went wrong’ and
‘lessons to be learned’. Although the NAO noted that
post-contractual changes that transferred risk back to
the state had taken place, it did not consider how such
changes affected VFM or the relationship between the
reduced risk transfer and the risk premium contained in
the cost of finance. Neither did the investigations
consider how PFI coped with failure, the extent to
which the partnership policy itself may have affected
failure, and the wider implications for the policy as a
whole. Indeed, the lack of financial evaluation from
such organisations as the NAO and the Audit
Commission is quite striking and suggests that such
evaluation may not be straightforward.
Reports by the Audit Commission (2003) and Accounts
Commission (2002) have been somewhat more critical
of PFI, and other reviewers present a mixed impression
of success and failure. For example, following his
review of PFI deals, Spackman (2002) concludes that
PFIs have brought costs and benefits but that the
balance of advantage is often unclear and, according to
Sussex (2003), in aggregate the cost advantages
claimed for NHS PFI schemes are small. Hence the
jury is still out over the issue of whether PFI offers
better VFM than traditional procurement routes. In its
report The Operational Performance of Prisons the
NAO sums it up as follows (2003g, para. 14):
The use of the PFI is neither a guarantee of success
nor the cause of inevitable failure. Like other forms of
providing public services, there are successes and
failures and they cannot be ascribed to a single factor
. . . . A relatively new procurement method such as
the PFI is associated with encouraging and
Introduction

PAGE 21
disappointing results and that performance will
improve over time. But a general verdict that the PFI
is either good or bad in the case of prisons, or more
generally, cannot be justified.
Spackman (2002) argues that the UK experience is
similar to Rosenau’s (2000) comments about the US:
that not much is known about the success and failures
of these projects, partly because there is a resistance to
conducting systematic policy evaluation. The available
assessments do suggest that more evidence is urgently
required. Both the Treasury and the NAO have
recognised the need for and improvement of post-
implementation review (HM Treasury 1997a, 2003a,
NAO 1999c). Similarly, the Public Accounts Committee
(PAC) has concluded from a review of a number of NAO
reports that better evaluation of PFI projects in progress
is needed (PAC 2002a). The new Green Book (HM
Treasury 2003a) now requires all new projects to
undergo a comprehensive evaluation after completion
of the construction phase or at some later stage in the
project while significant continuing programmes should
be subject to retrospective evaluation.
In this report we seek to add to the relatively small
body of evidence about the post-implementation
evaluation of PFI projects and the study is therefore
important because there has been very little
independent work in this area. However, the purpose of
evaluation may be variously defined. One clear purpose
emanating from Government sources is that lessons
should be learned so that the quality of future decision
making can be improved, implying some official
concern that mistakes have been made. To help public
procurers, there is official advice on methodologies and
techniques to be applied, although much of this
focuses on the financial aspects of the project. As the
NAO (2002b) has acknowledged, however, cost is only
one of the strategic factors that influence the choice of
procurement. More recently, the Treasury has
introduced additional criteria: equality and employment
issues, and stated that VFM should not be achieved at
the expense of workers’ terms and conditions (HM
Treasury 2003d, para. 1.12).
Public sector projects normally have multiple objectives
and one purpose of evaluation may be to assess
whether the original objectives, as set out in the
business case, have been met. Objectives may be
difficult to assess because they involve long-term
strategic policies, for example, the establishment of a
private sector capability in the particular industry, or
because they are difficult to quantify. In addition, for
example, Nathan and Whitfield (2000) state that
issues of equality and employment should also form
part of the evaluation process, but conclude that the
Treasury and the NAO have ignored these. These
authors cite, as an example, the issue of who owns,
runs and works in prisons, police stations and court
complexes and who has access to sensitive information
about a vulnerable and increasingly large section of the
population. They argue that this is less about balance
sheet accounting methods and more about how a
civilised society operates. Similarly, Grimshaw, Vincent
and Willmott (2002) indicate their concern that
employment issues may not be adequately evaluated
and note that human resources expertise was thought
to be missing in private sector partners. Thus there is a
tension between project and policy evaluation and
between different policies.
AIMS OF THE PROJECT
Although it is possible to evaluate the outcomes of
policies and projects from a number of different
perspectives, this study seeks to contribute to the
evaluation of the implementation of PFI by exploring
the financial issues: first, those issues that lie at the
heart of the policy’s objectives: VFM and risk transfer,
and secondly, their impact on affordability and
accountability. Developing the axioms set out by
Sinfield (2000, p. 160), the concept of accountability
Introduction

PAGE 22
in the context of public expenditure on essential public
services implies that, first, citizens – or at least their
political representatives, the media, trade unions,
academics, etc – can see how society’s resources are
being used and, secondly, that no members of that
society are seen to have an explicitly sanctioned unfair
advantage over others in relation to how those
resources are used.
This study seeks to examine the external reporting of
and accountability for PFI as well as the detailed
procedures and systems that surround the
implementation of a monitoring and control system for
particular PFI projects. Our approach is to:
• examine the post-implementation control processes
that the Government has put in place
• identify the most important issues associated with
evaluation after implementation, drawing on
previous academic literature, National Audit Office,
Public Accounts Committee, Audit Commission, HM
Treasury, departmental and other official reports
• provide sector-specific analysis for roads and
hospitals using public domain information, and
• investigate the ways in which monitoring and
evaluation processes operate in practice, using a
case study approach, since this enables an in-depth
understanding of the issues.
Specifically the research seeks to examine:
• the reporting of these projects after their
implementation
• the costs of the PFI and its impact on affordability
• the extent to which the actual costs and therefore
VFM match the expectations at the decision-making
stage
• the mechanisms and procedures for managing the
contract during operation
• the mechanisms for ensuring that risk is transferred
to the private sector in the ways that were
anticipated
• the contingency planning procedures in the event of
project failure and
• the accountability for these projects after their
implementation.
Since this study seeks to identify those characteristics
that promote or limit the success of PFI, we focus on
two very different sectors, roads and health. We
consider first PFI in roads, where it is usually known as
design, build, finance and operate (DBFO) and
involves, in England, the Highways Agency – an
executive agency of the Department of Transport (DoT) –
commissioning the construction of a new road or
extension of an existing one and its operation and
maintenance for 30 years. Secondly, we consider the
use of PFI by the acute NHS hospital trusts to procure
new builds, non-clinical hospital services and estate
maintenance. Since these sectors differ in numerous
ways – their relationship to central government, the
nature of the projects, the proportion of service to the
construction element, the nature of the services so
provided, their perceived ‘success’ and political
visibility, etc – this should make it easier to identify
those characteristics that promote or limit VFM, risk
transfer and accountability.
We explore the origins, development, nature and scale
of PFI in each sector and consider the broad objectives
of the policy. Since PFI involves both macro and micro
objectives our empirical evidence is gathered at both
the sectoral level and from a case study from each
sector. Using financial statements of both the public
and private sector partners, we analyse the costs to the
public sector and the returns to the private sector of
Introduction
PAGE 23
involvement in PFI for the two sectors, roads and
hospitals. Using interviews with personnel from both
partners in a road and a hospital project, we analyse
the contract management procedures. Since both these
projects reached financial close a few years ago and the
construction phase is complete, both projects are now
in the operation and maintenance phase of their life
cycle. Therefore this presents an opportunity to
evaluate PFI projects in a phase that has received
much less attention in the literature.
The use of both a sector-wide financial analysis and a
case study of the contract management procedures
permit, first, a greater understanding of how PFI
operates in practice, the financial costs and rewards,
and the relationship between the two and, secondly, an
evaluation of PFI at both project and programme level
in different contexts. Since many projects are in the
early years of what are normally long-term contractual
relationships, and consequently total life-cycle costs
and benefits are not yet known, it is too early to make
definitive assessments of many of the issues involved,
especially the VFM issues. Instead, our aim is to
present evidence that is indicative of the nature of PFI.
RESEARCH METHODS
Since the objectives of PFI involve obtaining VFM and
introducing more innovation on individual projects, as
well as macro-level objectives such as creating private
sector capability and introducing market testing, we
have chosen a two-pronged approach to our research.
First, a financial analysis of the two sectors, drawing on
the financial statements of the Highways Agency, 13
hospital trusts that have operational PFI projects in
place, explanations given to us by headquarters-level
staff in both sectors, and the published statements of
the private sector companies, typically organised as a
consortium or Special Purpose Vehicle (SPV) to manage
the project. Since typically these organisations operate
in conjunction with related subcontracting companies
we have used the ‘Financial Analysis Made Easy’
(FAME) Database to identify the company, its parent
and related companies. We obtained the
concessionaires’ accounts since inception from
Companies House.
Thus we use secondary data sources including financial
statements to build a picture of the origins,
development nature and scale of PFI activity in these
two sectors and to gain an understanding of the way
PFI operates in roads and hospitals, its costs, VFM, risk
transfer and accountability. This work has been
somewhat constrained by the secrecy that surrounds
the contracting documents and even the business cases
associated with PFI, which is said to be due to
commercial confidentiality concerns. Chapters 5 and 7
present our findings using those sources that are in the
public domain. It is worth noting, however, that the
research team had to make frequent requests to some
hospital trusts, although not to the hospital that is the
subject of our case study, simply to obtain copies of
their earlier annual accounts that are supposedly in the
public domain. This is important since a recent survey
found that the NHS makes more information available
than many other public bodies (IPPR 2004).
Secondly, we use a case study from each sector
enabling a detailed understanding of the issues
involved. The first is a roads project procured by the
Highways Agency (HA), which initially chose to
implement PFI by issuing contracts for eight projects in
two tranches within a relatively short time. The second
is a new build and services contract procured by an
NHS trust hospital, and although other hospitals are
similarly involved in PFI, this is the first experience of
PFI for most public sector staff.
At both sites the PFI projects have been in operation for
sufficient time for monitoring and evaluation systems to
become well established within the public sector
procurer. Interviews were used, first, to clarify issues
arising from our analysis of the secondary data sources,
Introduction
PAGE 24
and in areas where no public domain information is
available interviewees provided insights, based on their
own experiences, of issues that surround risk transfer
and VFM. Secondly, members of staff at the Highways
Agency and the hospital trust provided information
about the internal systems for managing, controlling
and monitoring PFI projects within the public agencies,
and their perceptions, experiences and understandings
of the systems that have been implemented to ensure
that risk transfer operates as expected in the contract,
and VFM is achieved. We were able to interview staff
who are operationally close to both projects as well as
staff at headquarters level. We also interviewed
representatives of the SPVs in order to obtain their
views about the PFI projects and to identify alternative
perspectives. We have anonymised the two cases for
reasons of commercial sensitivity and in order to
protect the confidentiality of interviewees, all of whom
were very generous in sharing their time and their
perspectives. These interviews allowed the researchers
to report on and gain insight into the implementation
and operation of this new form of procurement.
Interviews were conducted between April and
November 2003, and most lasted between one and
two hours. The interview format was semi-structured,
and the interview programme was informed and
developed against the background of academic
literature, our understandings of the relevant sectors
based on our review of secondary sources, and
discussions with relevant staff in the case
organisations. Flexibility is one of the key advantages of
the semi-structured interview approach and the
interview schedule was varied to accommodate the
different circumstances of these two cases and to
enable the interviewers to pursue issues emerging from
research subjects’ accounts. Interviews were tape
recorded and later transcribed, and material was
analysed and interpreted during the period August to
November 2003. The information from the interviews
is reported in Chapters 6 and 8. We sought and have
received feedback about these chapters from all the
organisations in order to check their clarity and
accuracy.
Although both the roads and hospitals sectors have
significant commitments to PFI projects, they offer
contrasting structural relationships with the relevant
central government department. In addition, whereas
the Highways Agency had considerable previous
experience of dealing with the private sector in
contractual relationships, this is rather less true of the
health sector. From our sectoral analysis, we seek to
draw some conclusions about the wider policy
implications of the Government ’s strategic choice of
PFI as a mechanism for financing and providing
infrastructure and public services. In relation to the
trust hospitals, however, PFIs are tied up with mergers,
restructuring and rationalisation exercises so that the
effects of PFI are less easy to isolate.
Thus the research is grounded in two quite different
sectors and in a case study from each sector. The case
studies constitute an interpretative study of internal
information about the construction of new roles, tasks
and information systems within the public sector and of
relevant information in the public domain. Although
recognising the limitations of the case study method,
and especially the limitations imposed by studying just
two cases, we try to draw some conclusions of a
general nature about the operation of the PFI policy in
practice. The research as a whole seeks to understand
the consequences, some of which may have been
unintended, of introducing a PFI project.
The remainder of this report is organised as follows. In
Chapter 2 we present an overview of the governmental
control process relating to PFI. In Chapters 3 and 4 we
review the literature that focuses on the available
evidence about the nature of post-implementation
evaluations of PFI projects and the methodology and
process issues that constrain such evaluative research.
In Chapters 5 to 8 we present our empirical evidence.
Chapters 5 and 6 offer an analysis of PFI in roads,
Introduction

PAGE 25
where it is known as design, build, finance and operate
(DBFO), and the insights gained from our interviewees
at the Highways Agency and the private sector
contractor. In Chapters 7 and 8 there is an analysis of
the use of PFI for hospital new builds and the insights
gained from our interviewees at our trust case and the
related special purpose vehicle. Chapter 9 presents a
discussion, our conclusions and suggestions for further
research.
Introduction

PAGE 26
Introduction

PAGE 27
2. The post-implementation control process
THE PFI CONTROL PROCESS IN GOVERNMENT 29
OFFICIAL ADVICE ON POST-IMPLEMENTATION REVIEW 33
THE GATEWAY PROCESS 36
THE CONTROL PROCESS IN TRANSPORT AND HEALTH 39
CONCLUSION 40
The OGC’s role is both to champion and tocontrol the PFI process and is indicative ofthe conflict between policy promotion andpolicy control noted elsewhere.

PAGE 28
The post-implementation control process

PAGE 29
Since the inception of PFI successive governments have
produced documentation relating to the procedures and
accounting methodologies for procurement decision
making under PFI. There was, however, comparatively
little in the way of a post-implementation control
process to ensure the delivery of the anticipated VFM.
Indeed, although the Treasury called for post-
implementation evaluation as a way of improving future
decision making, it provided little detailed or specific
guidance as to how such evaluations should be carried
out (HM Treasury 1997a, 1997b, 1998).
Recently, there has been a reorganisation of the
government departments concerned with overseeing
procurement, the establishment of the Office of
Government Commerce (OGC) in April 2000, and a
series of measures and documents, notably the revised
Green Book (HM Treasury 2003a) and the Gateway
Review process outlining the evaluative procedures to
be followed. In this chapter, first we examine where the
PFI control process is located in government, then how
the post-implementation control process has developed
within central government, and how it is supposed to
operate, in order to understand where the functional
Departments in our study, Transport and Health, are
positioned in the overall control process.
THE PFI CONTROL PROCESS IN GOVERNMENT
The organisational systems that control PFI are located
within the Directorate of Financial Regulation and
Industry (FRI), one of six Treasury Directorates, which
works to: ‘improve the way the public sector deals with
the private sector through the Private Finance Initiative
(PFI) and Partnerships UK (PUK); the Public Enterprise
Partnership (PEP) team; and the Office of Government
Commerce (OGC)’ (HM Treasury 2000, pp. 7–8).
In 1992, the Conservative Government established the
Private Finance Panel and the Private Finance
Executive to act as a focal point for all PFI-type
activities across government departments. In 1997,
one of the first tasks of the incoming Labour
Government was to set up a review, known as the
Bates Review, of the way the PFI process was
managed.
From the perspective of this study, however, what is
striking about the Bates Review’s 29
recommendations, although perhaps not surprising
given that its remit was to identify obstacles to the use
of PFI, is that although there are suggestions for
improving the decision-making processes prior to
contract signing, there is almost no reference to the
monitoring and control of implemented projects. The
only recommendation that suggests post-
implementation issues is number 21, which states:
‘The recent recommendations of the National Audit
Office in their reports on the Skye Bridge and the
Contract to Develop and Operate the Replacement
National Insurance Recording System, should be noted
carefully by Departments’ (Bates Review, 1997).
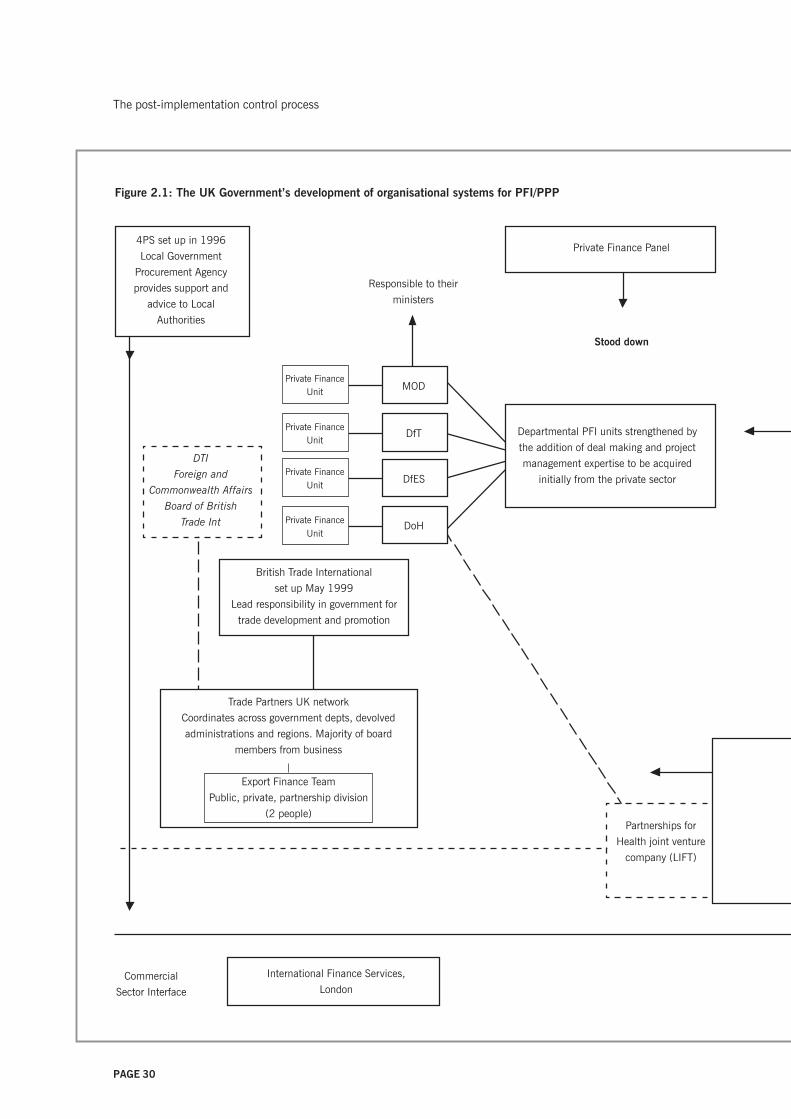
The Bates Review, of which all recommendations were
accepted, was instrumental in establishing the current
organisational systems, shown in diagrammatic form in
Figure 2.1 (see pages 30–31). It replaced the Private
Finance Panel and the Private Finance Executive with the
Treasury Task Force (TTF) in a bid to streamline the PFI
and reduce the number of institutional players on the
public sector side. Although the TTF would sign off the
commercial viability of all significant projects, with
decentralised government procurement, the
departments and agencies were ultimately responsible
for their own procurement decisions.
Two separate arms grew from the TTF, as well as
initiatives to strengthen departmental contracting and
project management expertise in Transport, Health,
Education and Defence. The first arm, the Policy
Division, established on a permanent basis, was
responsible for rules and best practice, leading to the
establishment in April 2000 of the Office of
Government Commerce within the Treasury. An
The post-implementation control process
PAGE 30
Private FinanceUnit
Private FinanceUnit
Private FinanceUnit
Private FinanceUnit MOD
DfT
DfES
DoH
Responsible to their
ministers
Partnerships for
Health joint venture
company (LIFT)
DTI
Foreign and
Commonwealth Affairs
Board of British
Trade Int
Trade Partners UK network
Coordinates across government depts, devolved
administrations and regions. Majority of board
members from business
Export Finance Team
Public, private, partnership division
(2 people)
British Trade International
set up May 1999
Lead responsibility in government for
trade development and promotion
Commercial
Sector Interface
Departmental PFI units strengthened by
the addition of deal making and project
management expertise to be acquired
initially from the private sector
4PS set up in 1996
Local Government
Procurement Agency
provides support and
advice to Local
Authorities
International Finance Services,
London
Private Finance Panel
Stood down
Figure 2.1: The UK Government’s development of organisational systems for PFI/PPP
The post-implementation control process

PAGE 31
Membership included private sector managers to
encourage line ministries, provide case-specific advice,
and produce general guidance documents on PFI
The International Project
Finance Association (IPFA)
April 2003 OGC
became part of the
Treasury
PUBLIC
ENTERPRISE
PARTNERSHIP
TEAM
Provides PPP
advice to
remaining state-
owned businesses
PAYMASTER
GENERAL
Cabinet Office
ONS/NAO to provide
accounting guidance by
September 1997
Private Finance Executive
1 July 1997
Treasury Task Force set up
Focal point for all PFI activities
across government
BATES REVIEW
June 1997
Training for civil
servants
PFI Library
Policy arm (permanent)
responsible for rules and
best practice
TREASURY
Financial Regulation
and Industry
Directorate
Projects arm
(2 year life), headed by Chief Executive
of Projects (CEP) and 8 middle ranking
executives from private sector hired by
Treasury
not seconded
Responsible for
regulating and
monitoring
OGC set up April 2000
Office of Government Commerce works with government to
improve procurement and project/programme management.
Works with suppliers to make the government marketplace
more efficient and attractive to business, responsible for
guidance notes on PFI
Independent office of the Treasury reporting to the Chief
Secretary of the Treasury
Refinancing Task Force
Partnerships UK (PUK) set up 2000
Aims for better, quicker and stronger value for
money PFI deals
Company limited by guarantee
Government 49% shareholding,
51% private sector institutions. Helps with
difficult and innovative PFIs and covers its costs
from fees and sometimes by equity holdings
Reporting to
The post-implementation control process

PAGE 32
independent Office of the Treasury, it reports to the
Chief Secretary, and has three main responsibilities
(OGC 2004):
• improving the efficiency and effectiveness of central
civil government procurement
• developing and promoting private sector involvement
across the public sector
• assisting departments to set up project and
programme management centres of excellence.
Thus, the OGC’s role is both to champion and to
control the PFI process and this is indicative of the
conflict between policy promotion and policy control
noted elsewhere (Freedland 1998, Edwards and Shaoul
2003). The OGC has taken responsibility for post-
implementation reviews and the Treasury commented
that, ‘OGC agrees on the importance of Post
Implementation Reviews both as a learning tool for
departments and to identify systemic issues’ (HM
Treasury 2002). This observation follows PAC’s
recommendation 5 on Managing the Relationship to
Secure a Successful Partnership in PFI Projects:
Post-implementation reviews are particularly
important for projects where perceived value for
money has declined since contract letting.
Departments need to identify whether such a decline
reflects errors of judgement by the authority when
letting the contract, the contractor failing to deliver
the service as promised, short term problems during
the early period of the service delivery, or other factors
such as high charges for additional services. (PAC
2002a)
The second arm, the Projects division, was initially
established with a two-year life, largely with staff on
secondment from the private sector. In June 2000 this
was reconstituted as a public private partnership,
Partnerships UK (PUK), whose mission was to help the
public sector deliver: fast and efficient development and
procurement of PPPs; strong PPPs that build stable
relationships with the private sector; savings in
development costs; and better value for money
(Partnerships UK 2003). These aims are achieved,
according to PUK’s website, by ‘standing shoulder to
shoulder with public bodies’ and putting the interests of
its public sector clients first. Therefore, it can act as a
‘bridge’ between the public and private sectors (HM
Treasury 2003c).
The ownership and governance structures for a body
with these aims are perhaps unexpected. PUK is a
company limited by guarantee, in which HM Treasury
and the Scottish Ministers together control 49%. The
majority shareholding of 51%, however, is held by
private sector institutions, including financial services
companies that have been involved in the financing of
PFI projects, and organisations such as Group 4, Falck
Joint Ventures Ltd and Jarvis plc, which have PFI
contracts. Furthermore, the majority of the board
members come from the private sector, with the public
sector represented by only two non-executive directors
and the public interest represented through an Advisory
Council. Thus there is the potential for a conflict of
interest between public and private interests, which is
recognised within government. In a speech to the
Global Summit in Cape Town in 2001, Stephen Timms
admitted that: ‘Partnerships UK is not entirely
conventional and we respect our public sector mission
through our relationship with the Advisory Council . . . .
It reports to Government and whilst it can cry ‘foul’, it
can’t directly tell us what to do’.
During the same speech Timms argued:
Part of Partnerships UK’s challenge is to gain the trust
and confidence of the public sector whilst being in a
real sense a private sector body. And as a private
sector body we have to balance the public sector
interest with the need to earn an appropriate and
sustainable return on our shareholders investments.
The post-implementation control process
PAGE 33
You can, I am sure, immediately see the sensitivities
and the trade offs required. (Timms 2001)
Although the structure, ownership and control of PUK
is not directly relevant to post-implementation review, it
is important because it sets the PFI agenda and is
indicative of the conflict between policy promotion and
policy control noted earlier in relation to the OGC.
OFFICIAL ADVICE ON POST-IMPLEMENTATION
REVIEW
Official advice has come from various sources – the
National Audit Office (NAO), Public Accounts
Committee (PAC), Audit Commission (AC) and the
Treasury – and has developed in an ad hoc way to
meet a number of potentially conflicting requirements.
This section considers each of these sources.
The National Audit Office has investigated the
performance of some PFI projects under its VFM remit.
It has tended to focus on some of the problems that
have arisen after financial close that clearly impinge on
VFM, although its analysis was not concerned directly
with VFM itself. This may be illustrated by a number of
examples. When it examined the sequence of events
that led up to members of the public going in person
and queuing for hours to obtain their passports, the
focus was on the Passport Agency’s service delivery
(NAO 1999d), not VFM. Similarly, in relation to the
refinancing by the private sector partner of the
Fazakerley prison deal, it focused on the lower cost of
financing, the profit-sharing arrangements and the
changes to the deal’s risk profile (NAO 2000b), but not
directly on the VFM of the original or refinanced deal.
In its reports on the Royal Armouries deal (NAO
2001a), the extension of the NIRS2 contract with
Andersen Consulting (NAO 2001d), and the Channel
Tunnel Rail Link PFI deal (NAO 2001c), it focused on
the relationship between the public and private sector
partners, and on the renegotiations that took place
when a private sector partner failed to deliver on the
original contract. Thus, the NAO passed up the
opportunity to examine the extent to which the projects
provided VFM as set out in the financial appraisal or
how the outcomes differed from conventional
procurement. Without such a comparison, it is difficult
to justify the claim that PFI procurement actually
transfers risk and thus in practice delivers value for
money.
In each case the NAO carefully explained the chain of
events that led up to the project failure and sought to
draw lessons for the negotiation of future PFI deals, but
it did not draw out the implications for VFM, consider
the outcomes in relation to the project’s objectives and/
or its original financial appraisal, or evaluate the extent
to which the contract did or indeed could transfer risk
as anticipated. It carried out a survey to examine how
the contractual relationship was being managed,
managers’ views about their project’s value for money
and the issues involved in managing partnership
relationships, rather than a systematic comparison of
expected and actual outcomes or even a study of
project outcomes (NAO 2001e).
As the National Audit Office noted, although the
Treasury was encouraging departments to make
evaluation a more prominent feature of policy making,
departments required evaluations to be more practical
(NAO 2001b). This is problematic as the NAO
concluded that there is no one best way of establishing
VFM and that individual procurers needed to establish
their own methodologies for assessing their projects’
VFM. Such methodologies should include ways of
assessing performance, pricing and feedback from
users, as well as a continual monitoring of risks so that
these can be managed (NAO 2001e). To assist auditors
reviewing VFM appraisals and those involved in
negotiating PFI deals, the NAO produced some
recommendations, and from the perspective of this
study it is interesting that attention is drawn to the
importance of the contract as opposed to the business
case, despite the fact that it was the business case that
The post-implementation control process

PAGE 34
authorised the project and generated the expectations
that justified the project (NAO 1999c).
A successful partnership often depends upon decisions
made early in the procurement process, implying that
the nature of governance arrangements should be
considered early and be well documented (NAO
2001e), so that their impact on project management
can be assessed. There should be recognition that the
contracting parties have different objectives that need
to be reconciled. For example, where there are multiple
public sector parties to the project, there may be
conflicting objectives that create problems; the pressing
needs of some may lead to inadequately tested pilot
projects being accepted at the expense of the other
public sector partners (NAO 2002b). Especially in
situations where there is a lack of committed bidders
there needs to be an agreed process to manage the
contract in a non-competitive environment. For
example, the Airwave project uses a ‘should cost’
model, an internally generated model of expected costs.
If such approaches are to assist decision making and
subsequent monitoring of performance, however, there
needs to be recognition that the building of credible
alternative options may require substantial resources
and the cooperation of the bidders (NAO 2002b).
In considering the NAO’s reports, the Public Accounts
Committee was particularly concerned that one in five
of the authorities surveyed considered that the VFM
from their contracts had diminished; that the
contractors charged high prices for additional services;
that the bail out of the Royal Armouries Museum and
the Channel Tunnel Rail Link undermined the
commercial discipline of the risk of failure; that there
was little information on the financial returns to the
private sector; and that 58% of authorities with a
performance review process had made deductions from
payments to contractors, suggesting inadequate levels
of service. Crucially, it noted that risk transfer did not
absolve the public agency from the responsibility for
service delivery, and that therefore the agency had to
manage this ultimately untransferable business risk.
The PAC concluded that better evaluation was needed
of PFI projects in progress (PAC 2002a).
Although both the NAO and the PAC have
recommended that adequate review systems should be
put in place at an early stage of contract provision, the
public sector has been slow to implement this advice.
For example, in 2002, the PAC recommended that the
Channel Tunnel Rail Link needed to improve its
monitoring systems (PAC 2002b, Recommendation 7).
The NAO made similar calls regarding the Laganside
Courts PFI, where performance monitoring was not
fully operational from the start and so for an initial
period measurement of performance against service
standards was limited (NAO 2003f, para. 5). In its
wide-ranging report Managing the Relationship to
Secure a Successful Partnership in PFI Projects, the
PAC called for better evaluation of PFI projects in
progress, in particular with regard to quality of
customer service and VFM (PAC 2002a,
Recommendation 1). Also, it was very concerned that
despite the fact that more than one in five of the
authorities surveyed considered that their PFI contracts’
VFM had diminished, only around half had put in place
appropriate mechanisms (benchmarking, market
testing, open book accounting) to ensure VFM over the
project lifetime. Little consideration appears to have
been given, however, to whether the public sector has
either the resources or the expertise to do this, or to
how this additional cost would affect the anticipated
VFM of PFI. The PAC went on to suggest that the OGC
should monitor how projects were evaluated and review
contractors’ returns on PFI projects. This is now done
within the Gateway Process, which we discuss in the
next section.
The Audit Commission management paper Aiming to
Improve the Principles of Performance Measurement
(Audit Commission 2000a), although not mentioning
PFI specifically, sets out the key issues for an effective
performance measurement system to improve public
The post-implementation control process
PAGE 35
services. It provides a practical overview to enable
policy-setting managers to design a robust system of
performance measurement. Its twin management paper
On Target: The Practice of Performance Indicators
(Audit Commission 2000b) sets out the Audit
Commission’s experience of developing and using
performance indicators to help public sector managers
develop their own set of balanced and focused
indicators. Both papers provided practical examples of
performance measurement.
Some information about PFI performance is now
beginning to be produced. For example, the NAO
(2003b) presented statistics on the extent to which PFI
projects were being delivered on time and to budget. It
called upon the OGC to collect updates of these, stating
‘the data are relatively easy to collect and provide a
valuable insight into how well projects are being
delivered under the PFI’.
More recently, the Treasury’s revised Green Book
(2003a) states that after completion of the construction
phase, a project should undergo a comprehensive
evaluation to examine the outcome against what was
expected. Chapter 2 of the Green Book, however, offers
apparently conflicting advice about who should conduct
this evaluation. In paragraph 2.17, it argues that
‘carrying out assessments should never be regarded as
a specialist activity’. Nonetheless, in the next
paragraph, 2.18, it encourages departments and
agencies to consider ‘establishing formal evaluation or
assessment units, or other centres of technical
expertise’. The NAO, on the other hand, suggests that it
is necessary, especially for complex projects, to
‘assemble a skilled team that [understands] the
technical environment and how user requirements
would be met’ (NAO 2002b), and to train public sector
staff to enable them to monitor projects effectively.
Therefore this implies an approach to evaluation based
on a specialist team.
The Treasury (2003a) urged project managers to follow
the same analytical techniques for evaluation as those
used for decision-making appraisal:
• cost–benefit/effectiveness analysis
• discounted cash flow analysis
• multi-criteria analysis and
• other statistical analysis, such as analysis of
performance indicators.
This list also tends to suggest some level of specialist
expertise. In either case, the evaluation is: ‘designed to
ensure that the lessons learned are fed back into the
decision-making process. This ensures government
action is continually refined to reflect what best
achieves objectives and promotes the public interest’
(para. 7.2). However, this contradicts the NAO’s advice
to focus on the contract rather than the business case
(NAO 1999c).
The Treasury urges project managers to follow a five-
point sequence, identified in paragraph 7.5 of the
Green Book (2003a), which includes requirements to:
• establish how past outcomes can be measured
• choose alternative management decisions as
counterfactuals
• compare actual and target outcomes and compare
these with the chosen alternative management
decisions
• present results and recommendations, and
• disseminate these.
The post-implementation control process
PAGE 36
The post-implementation control process
HM Treasury states that the evaluation process should
identify and measure not only the direct but also the
indirect benefits of the project, and include:
• an assessment of what happened
• a comparison of outcome with target
• a comparison with one or more counterfactuals
• a comparison against a ‘what if’ benchmark, ie as if
the activity had not been undertaken
• an evaluation of the success of the project in
meeting its objectives and how it has contributed to
wider outcomes.
The Treasury Green Book also provides an 11-point list
of generic issues to be considered during the evaluation
(paragraph 2.25). These issues include items as
diverse as strategic impacts, financial arrangements,
environmental impacts, rural issues and equality. In
Chapter 7, the Treasury states that the evaluation
should be a robust analysis with a focus on conducting
a cost–benefit analysis using actual rather than forecast
information. The results of an evaluation should include
recommendations for the future, which might involve
changes to procurement practice or changes to or
replacement of the project under review. More
importantly, the results should also provide feedback
for wider policy debate and future programme
management. Although these recommendations are
admirable and wide ranging, the Green Book provides
little in the way of procedures or methodologies to
ensure that these recommendations are carried out in
practice.
However, although data collection may be improving,
evidence from reports indicates that there is scope for
sharing good practice more widely across government
departments. Apparent fragmentation among and
isolation of PFI project managers seems common. So
for example, in the case in Redevelopment of MOD
Main Building (NAO 2002c), the NAO recommends
that the project team should summarise the lessons
that it learnt and make them available to other
departments. These lessons include the importance of
senior officials’ commitment to the success of the
project and the negotiation of objective performance
standards for the availability of all types of serviced
accommodation.
Given the complexity of the advice from these different
sources, a very significant burden falls on each
individual team evaluating a project to operationalise
this evaluation process. Variations in interpretation of
the guidance are to be expected, but more significantly
the extensive lists of purposes to be served and
documentation needed suggests that this process will
be expensive and/or will be incomplete in practice.
THE GATEWAY PROCESS
The Office of Government Commerce has responded in
a number of ways to calls for better monitoring, with
the setting up of a Successful Delivery Skills
programme, the launch of the PFI network and the
issue of best practice documents (HM Treasury 2002).
The primary mechanism developed for monitoring and
managing procurement is the OGC’s Gateway Process.
Two reports were instrumental in initiating the Gateway
Process. First, the Gershon Review (Gershon 1999) on
government procurement recommends the
implementation of a common process for the strategic
management of large, complex or novel projects based
on the phases of project life cycles. Secondly, the
Cabinet Office report Successful IT: Modernising
Government in Action (2000) requires the OGC to
prioritise the implementation of the Gateway Process.
The Gateway Process applies to all new procurement
projects over £1 m in civil central government. The
NHS agreed to implement Gateway in 2003 (OGC
2003c).
PAGE 37
The post-implementation control process
According to Timms (2001), the role of the OGC is to
work alongside Departments to spread best practice so
that each Department may draw upon the experience of
others and avoid the reinvention of the wheel or the
repetition of avoidable mistakes. In its performance
review of 2002/3, the OGC lists its key achievements,
including Gateway Reviews of over 250 procurement
projects, believed to deliver £500 m value for money
savings per year (OGC 2003c). Timms therefore sees
the Gateway Process, whose purpose is to ‘provide an
independent authoritative review mechanism to
improve the management of large, complex projects’,
as central to improving performance delivery of large
government projects.
The OGC offers extensive guidance to users through its
Successful Delivery Toolkit publications. These include
guidance on the post-implementation review (PIR),
which is carried out on construction, development and
procurement projects when there has been time to
demonstrate the business benefits of a new service or
building (OGC 2003a). The OGC views the PIR as
essential to the process of ensuring that improvements
result from changes made in a project or programme.
The Successful Delivery Toolkit publications also
include a series on Achieving Excellence in
Construction, with Achieving Excellence Guide 8:
Improving Performance (OGC 2003b) explaining the
principles and practice of performance evaluation so
that the planned improvements are achieved.
The Successful Delivery Toolkit publications also
provide guidance from the OGC on the Gateway
Process. It is based on successful project management
techniques in the private sector and seeks to ensure
improvements in the successful delivery of large public
sector procurement projects. Since the PAC (2003d)
and the Treasury response to the PAC (HM Treasury
2003e) agree that PFI is just one of three
recommended procurement methods (the other two
being design and build, and prime contracting), OGC
guidance on best procurement practice given through
the Successful Delivery Toolkit refers to all three
methods. HM Treasury states that PFI ‘should only be
used when it represents the best possible procurement
route for the project concerned, based on a thorough
assessment of value for money’ (HM Treasury 2003e).
Six critical periods, numbered 0 to 5 in the
development of a project, have been identified as
opportunities for a Gateway Review. Four of these
relate to the period before contract award, while two
look at service implementation and confirmation of the
operational benefits, once the project is up and
running. Gateway Reviews are carried out by review
teams whose membership depends on the level of risk
associated with the project, as determined by the
project owner or senior responsible owner. High-risk
projects are reviewed by a team leader appointed by
OGC with a team independent of the department.
Medium-risk projects are reviewed by a team leader
appointed by OGC with a team drawn from independent
departmental staff. Low-risk projects have team leaders
appointed by the department with team members from
within the department. Typically there are from three to
five people within each team, with a review lasting
around three to five days. The team presents its report
to the project owner/senior responsible owner before
leaving the site, and gives a copy to the OGC to identify
and disseminate generic lessons learned.
Of particular relevance to our study, Gateway 5 Review
covers post-implementation benefit evaluation and may
be repeated as required throughout the life of the
project. For PFI projects, where the project starts life as
a construction project and then becomes a long-term
service contract, OGC indicates that there should be a
Gateway 5 Review every three years (OGC 2001, p. 1).
A nine-point list of purposes of the Gateway 5 Review
includes:
• an assessment of whether the business case was
realistic and the expected benefits are being
delivered

PAGE 38
• the business case
• the post-implementation review findings and
• a summary of contract changes.
In addition, the OGC has provided guidance on areas to
probe with suggested questions and examples of the
kinds of evidence that should be sought during the
conduct of the Gateway 5 Review. In the introductory
section, however, it warns that because projects are
unique these questions cannot provide a checklist,
rather they should be used only for guidance, and the
OGC provides Web-based links to other sources of best
practice. The Gateway 5 Review does not replace the
post-implementation review, as it takes place after such
a review has been carried out, and makes use of the
findings from that review (OGC 2001, p. 1).
It should be noted that the focus of the Gateway 5
Review is very much narrower than the more strategic
review recommended by the Green Book. Like the ‘light
touch’ inspection regimes elsewhere in the public
sector, it emphasises the documentation and processes
rather than a substantive evaluation of the direct and
indirect costs and benefits. In other words, it is unclear
that there is any requirement for any financial
evaluation or indeed any examination of the private
sector’s financial and physical performance against
expectations. Despite the centrality of risk transfer to
VFM, this issue is hardly touched upon. Furthermore,
although the Green Book stresses that best practice
should be disseminated throughout the public sector,
none of the Gateway reports is a matter of public
record. Gateway reports are confidential, made
available to a project’s senior responsible owner and to
OGC alone. The senior official is then accountable for
the implementation of recommendations (HM Treasury
2003c). From April 2003, the Gateway Process is
being piloted in local government PFI projects by the
public private partnerships programme (4Ps).
The post-implementation control process
• a confirmation of continuity of key personnel and
necessary resources to manage the contract
• an assessment of the continuing ability of the
contract to meet business needs and, where change
is necessary, to ensure that it does not compromise
the original procurement
• a confirmation that there is contract development to
improve VFM
• a confirmation of the existence of plans to manage
the contract to conclusion, and an exit strategy.
The timing of these reviews depends upon the nature of
the contract but should be conducted after the
organisation has held a post-implementation review, or
similar significant internal review, so that findings from
that internal review can be used. For contracts without
a service agreement, this review would take place 6–
12 months after the construction phase of the project,
because evidence of in-service benefits ought to be
available by that time. In the case of long-term
contracts, reviews should be conducted every three
years, once the project is operational. The review
should include an assessment of organisational
learning, but need not include a full review of plans for
the future.
The OGC suggests that the following should be
included to inform this review process:
• an assessment of benefits delivered
• the plans for contract and service improvement
• the personnel plans showing how the contract will
be managed
• a report on stakeholder issues
• the plans for asset disposal at contract end
PAGE 39
Notwithstanding such confidentiality, the OGC asserts
that: ‘This approach promotes an open and honest
exchange between the project and review teams
delivering maximum added value’. (OGC 2003d)
Owing to this lack of publicly available specific
evidence on post-implementation evaluation, very little
is known about how well these Gateway Reviews are
carried out, let alone the actual performance of these
projects. Therefore it is not known whether these
projects can or do deliver VFM and it is very difficult if
not impossible for an external observer to verify any
claims about VFM. Thus secrecy limits the evaluative
function of the Gateway Review process and its
potential role in the wider public scrutiny and
accountability process.
THE CONTROL PROCESS IN TRANSPORT AND
HEALTH
Figure 2.1 (see pages 30–31) shows how spending
departments have been actively involved in PFI. We
have chosen two of these departments, Transport and
Health, to examine in depth, in part because the status
of each of the procuring bodies differs in its relationship
to the government. Since the Highways Agency, as the
purchaser of PFI services in roads, is an executive
agency within the DoT, it is central government that is
commissioning services directly from the private sector
and thus guarantees the contract. The NHS hospital
trusts, as the purchasers of hospital services, are
legally independent entities within the NHS, which is
itself a public corporation responsible to the
Department of Health. As such, the Secretary of State
for Health does not guarantee the payment of contracts
that the trusts enter into. It is to be expected that these
different structural relationships will have implications
for the way in which PFI projects are managed and
reviewed after implementation.
Certainly Standard and Poor’s, the credit ratings agency
that examines the security of cash flows available to
support PFI payments, sees the relationship of the
procurer to central government as one of the significant
factors when considering assessments about the ability
to finance and refinance projects. The Highways
Agency’s credit rating is deemed to be of excellent
quality, since the government directly guarantees its
debt servicing obligations. By way of contrast, Standard
and Poor’s does not view NHS trusts as ‘AAA’ rated UK
government guaranteed risks, even though it
acknowledges that these involve high levels of both
direct and indirect government support and control,
and that therefore in practice a trust’s credit quality is
unlikely to constrain a PFI project’s rating (Standard
and Poor’s 2003).
The DoT, as a civil central government department,
must follow the post-implementation control process as
previously described. Since most of the PFI road
projects were signed and constructed before the post-
implementation review or the Gateway 5 review
process came into existence, however, the Highways
Agency has not implemented those processes. The
publicly available documentation reviewing road
projects includes NAO reports (NAO 1998a, 1999a)
and a case study of the first eight DBFO projects,
produced by the Highways Agency, which we will
discuss in some detail later.
Although the hospital trusts do not fall under the
umbrella of OGC, in 2003 the NHS undertook to
implement the Gateway Review process. Prior to
adopting the Gateway Process, the Department of
Health had an established process of post-project
evaluation. The Capital Investment Manual (NHS
Executive 1994) includes a section on ‘Post-project
evaluation’, in order to encourage more evaluation. It
became mandatory for projects in excess of £1 million.
This advice was superseded by new guidance Learning
Lessons from Post-project Evaluation (DoH 2002a),
which gives extensive practical, evidence-based
guidance on the evaluation requirements, with
mandatory requirements for reports on projects in
The post-implementation control process

PAGE 40
excess of £20 m to be submitted to the DoH. In
addition, Improving PFI Procurement (DoH 2002b)
requires all NHS trusts to have ‘sound’ evaluation
arrangements in place prior to project approval.
Thus, the first wave PFI trusts fall between two stools.
Since the first wave of hospital PFI projects that are the
subject of our study were signed in 1997 and started to
come on stream in 2000/1, there was then no
requirement to carry out the Gateway Review process.
As with the DoT therefore, these hospitals have not
implemented the process. However, we have obtained
a copy of one evaluation report carried out under the
DoH system that consists of several user surveys into
outcomes and impacts (indeed rather more surveys
than the DoH required), information about the
management of the project and generic lessons for
future commissioning of PFI projects (Queen Elizabeth
Hospital NHS Trust 2003). It is unclear, however,
whom these reports are written for or sent to, what the
response has been, who uses them, how they are
disseminated (if at all), and whether these reports are
in the public domain, although we believe that they are
not.
As is also the case with much of the benchmarking of
costs within the NHS, any evaluative information is
likely to be held in restricted access areas of the DoH
website, such as the Knowledge and Information Portal
(KIP) and the NHS Executive area, and thus
inaccessible to the public. For example, the NHS
Estates classes the current NHS development of a
database to provide performance and benchmarking
information (NHS Estates Data Collection & Analysis
System – NEDCAS) as confidential to the NHS and
other authorised key stakeholders, in order to avoid
commercial use by non-NHS organisations and because
of the sensitivity of some information (NHS Estates
2003b). Once again, therefore, little specific post-
implementation evaluation evidence of PFI in NHS
trusts is, or is likely to become, publicly available.
CONCLUSION
The control process in the public sector has been less
than practically helpful and what has existed has been
subject to continual change as the number and scope
of PFI projects has grown, and as the role of the
Treasury has altered over the years since the inception
of PFI. There have been continual calls from the NAO
and PAC for improvement in the post-implementation
review process that have been met by extensive
guidance from the Treasury and most recently from the
OGC. Even in a recent summary report the NAO made a
basic recommendation regarding the use by departments
of user surveys as part of their post-contract evaluation
(NAO 2003b, Recommendation 4). However, it is
difficult to find any significant evidence of actual
improvements in monitoring that have taken place.
From the perspective of this study, however, it is
significant that the Treasury, the National Audit Office
and the Office of Government Commerce have not
called for project evaluations from the perspective of
ensuring that the projects deliver their expected VFM or
for evidence of risk transfer. Despite the Green Book’s
call (HM Treasury 2003a) for a wide-ranging
evaluation, the actual procedures and methodologies
rest with the OGC, whose remit involves a conflict of
interest: policy promotion and control. Its main review
process guidance focuses on a very narrow technical
approach. Furthermore, since the results of much of the
new tranche of government requirements is and will be
kept confidential, there is a lack of publicly available
evidence about the performance of the PFI contracts,
making it impossible to validate or refute their claims
about VFM. This raises a series of further questions
about public scrutiny of and accountability for an
increasingly important amount of government expenditure.
This means that irrespective of the value of the
evaluation methodology and reporting procedures for
the government department, public accountability is
not an explicit objective of the evaluation process.
The post-implementation control process

PAGE 41
MEASUREMENT SYSTEMS 43
BENCHMARKING 45
IN-HOUSE EXPERTISE 49
CONFIDENTIALITY 50
POWER 51
CONFLICTS WITHIN CONTRACTS 53
CONCLUSION 55
3. Process issues in the evaluation of PFI
. . . a rational-technical approach to capitalinvestment appraisal is urged.

PAGE 42
Process issues in the evaluation of PFI
PAGE 43
Official documents advise procuring bodies to design
methodologies to monitor performance, direct and
indirect benefits, prices, risks and feedback from users
so that outturns may be compared with expectations,
and the results and lessons so learned may be
disseminated to improve future decision making. In
short, a rational-technical approach to capital
investment appraisal is urged.
A review of the literature shows that there have been
no post-implementation reviews of PFI projects from
the perspective of VFM, even by the National Audit
Office, implying that such an evaluation is not
straightforward, has not been commissioned or has not
been funded. The research literature implies that
although this type of evaluation incurs substantial
monitoring costs, its ability to generate the desired
benefits in practice is less assured, for three reasons.
First, there are a series of interrelated practical
problems of inappropriate measurement systems and
inaccurate or unreliable data; lack of comparable
benchmarks against which to assess performance; and
lack of in-house expertise to monitor projects. Secondly,
there are issues surrounding confidentiality and the
power relationships between the parties to the contract,
and thirdly, there appear to be inherent conflicts within
contracts that impede monitoring and evaluation. We
discuss each of these in turn.
MEASUREMENT SYSTEMS
The monitoring and evaluation of PFI contracts
generates new tasks that the public sector has not
traditionally carried out. Initially at least, this has
created practical difficulties and highlighted the need
for systems change. For example, Kirkpatrick and Lucio
(1996) argue that traditional local authority
management accounting is input-oriented with an
almost exclusive concern for the control of inputs,
whereas this new accounting/contracting nexus involves
first incorporating standards relating to the quantity and
quality of outputs into contracts, and secondly
monitoring procedures in ways previously considered
impossible or inappropriate (Seal 1999). Consequently,
systems for measuring outputs have only recently been
introduced in the delivery of public services, initially for
managerial and latterly for public accountability
purposes. As their usefulness is still unproven (Cutler
and Waine 1997), their extension to contractual and
regulatory management may be premature.
Several commentators have argued either implicitly or
explicitly that traditional ways of disseminating
information are inappropriate for monitoring contract
outcomes and that substantial informational
asymmetries exist between contracting parties that may
generate conflicts of interest (Arruñada 2000). The
National Audit Office found that some projects lacked
appropriate performance measurement structures and
recommended the improvement of performance
measurement regimes (eg NAO 2002a). Similarly, the
Audit Commission concluded that project resources
were consistently underestimated by health and local
government schemes, and that the implementation of
performance management structures had had mixed
results (Audit Commission 2001).
These difficulties are compounded by problems in
obtaining data and observing effort and performance
during the life of the contract (Ricketts 1994). Also,
PFI has introduced a range of new tasks for which
data, especially comparative data of a historical nature,
may not be available. For example, although PFI
implies a need for both sides to assess their risk, there
is a lack of good quality data to assess probability and
risk exposure (Akintoye et al. 1998). Ball, Heafey and
King (2003a) found a lack of an evidence-based
approach to risk assessment in the schools sector in
Scotland, and in particular note that historical data did
not appear to be used in risk analysis. In their
observation of risk workshops, they found that the risk
assessment was in some cases carried out solely on the
basis of subjective judgement. They report that one
representative, at a meeting of school PFI project
Process issues in the evaluation of PFI

PAGE 44
representatives in Scotland, stated that historical
evidence had been used in one risk workshop and this
had led to a much lower estimate of risk transfer than
that of other comparable local authority projects in
other geographical areas. Such experiences matched
the findings of Boyne et al. (2002), who analysed 127
best value performance plans from Welsh local
authorities, prepared over a two-year period. Having
identified data required for accountability, the authors
found that very few of the plans contained the relevant
material and concluded that performance plans were
currently making little contribution to the accountability
of public organisations. Heald (1997) also highlights
the problem of the scarcity of hard data in relation to
financing costs:
The Treasury cannot or will not quantify the additional
finance costs consequent upon financing . . . by
private finance rather than by government borrowing,
or quantify the interest rate differential . . . . Given
the confidentiality which attaches to loan
arrangements, systematic evidence about the
additional cost of private finance can only be
produced by the Treasury or, with a considerable time
lag by the National Audit Office.
Case studies of PFI contracts show a more basic data
problem, however, relating to standard accounting
procedures, which is difficult to explain since it is not
associated with new tasks. For example, Grimshaw et
al. (2002) reported the difficulties encountered by a
hospital trust in checking the payments for work done.
This involved matching detailed invoices from providers
against details specified in the relevant contract
documents, where the costing of each job task was
detailed through time and motion studies. The collation
of all the information required to process the payment
claims was time consuming and the trust found that
invoices often provided incomplete information.
Similarly, Whorley (2001) found that, in social service
provision in Ontario, the contract arrangements for
paying out-of-pocket expenses were not followed and
that consequently $1.4 m was paid to private sector
contractors without the necessary supporting
documentation. As the contract required such
documentation, Whorley notes with some surprise that
a senior public sector staff member seemed to be
unable to recognise that the private sector was
responsible for providing the required documentation.
Whorley also reports that the provincial auditors
expressed concerns about their access to documents,
lost documents and the consequent impact on the cost
of the audit, which was three times as much as
expected. The processes involved in these two
examples appeared to be of a routine accounting nature
where there was a failure of basic data, and suggests
that such processes should be examined in other PFI
projects.
PFI has also created a change in terms of control over
data sources. Under the contractual arrangements, Ball
et al. (2003a) notes that any changes to PFI projects
make it more difficult for the public agency to quantify
the extra costs involved than under traditional
procurement practices since the agency did not have
the necessary detailed information, ‘such as bills and
rates, bills of quantities for all the elements of the job’
(Ball et al. 2003a, p. 288). Without this, it was
difficult to challenge the PFI contractor’s figures.
Akintoye et al. (1998) argue that PFI is about self-
monitoring and reporting by the private sector
contractor, implying that the public sector must be able
to use this information to monitor and control projects.
So, for example, private sector contractors on roads
projects are responsible for measuring traffic volumes,
which form the basis of their remuneration. This is not
always straightforward. Deakin and Walsh (1996)
provide an example of an IT project, where the public
sector purchaser was dependent on the private sector
contractor for the measurement of output and therefore
information became a battleground in service
management. They also raise concerns about the
quality of self-monitoring by private sector companies
involved in prison service PFI contracts. Other studies
Process issues in the evaluation of PFI
PAGE 45
confirm these findings. For example, there was a lack
of accurate reporting of private sector performance at
Altcourse Prison (Centre for Public Services 2002), and
some evidence of misreporting of performance and
falsification of records in other prison services contracts
to avoid penalty payments (Taylor and Cooper 2002).
The literature provides some evidence that public sector
organisations are changing their accounting systems
and controls to meet the needs of this new operating
environment as a result of these problems, although
little or no evidence is provided about the availability of
staff expertise or the cost of such changes, which must
be considerable. First, in Grimshaw et al.’s (2002)
study of a government IT project, regular inter-
organisational meetings were held to improve the
cooperative nature of the agreement. The signed
contract committed both sides to attend regular
meetings of board level management staff. At lower
levels there were regular reviews, from which issues
were fed into the higher-level meetings.
Secondly, Whorley (2001) also reports that when the
Ontario Ministry had to take corrective action in relation
to its PFI project, it introduced tighter financial
management controls, especially around the attribution
of costs and benefits and on the management of
procurement. An internal audit team from the ministry
was appointed and due diligence work was performed
on a constant basis. The project’s steering committee
was overhauled and included greater public sector
representation, with a senior financial officer becoming
custodian of the project. It is striking that Whorley
believed that the remedy involved, in effect, the re-
introduction of traditional public administration
approaches such as bureaucratic approval procedures
and oversight committees to protect the public interest.
If such instances are repeated elsewhere then it may
well be that the civil servant who responded to the risk
survey of Akintoye et al. (1998) is not alone. This
respondent claimed that there is a need to monitor
service delivery closely, even though such close
monitoring is against the spirit of PFI, which
emphasises self-monitoring and reporting by the
consortium. Finally, the NAO praises the Prison Service
for designing what are described as its comprehensive
measurement systems, which have increased the
transparency of the prison estate’s performance (NAO
2003g, Recommendation a). The Prison Service now
uses key performance targets to assess performance via
a weighted scorecard. The NAO believes that this good
practice should be shared with public prisons as well
as other government departments. The Audit
Commission (2001, Section 4, paras 78–79) also
identifies examples of good practice in terms of
achieving continuous service improvement through the
use of challenging performance targets.
BENCHMARKING
One important method of evaluation is to benchmark
actual performance against an appropriate standard.
Available standards include the original contract, the
public sector comparator (PSC), costs and quality
performance data at other similar facilities procured by
conventional means, and cost and quality performance
data from private sector competitors of the contracting
private partner. Although all these methods have been
implemented, they are all problematical.
Benchmarking against the original contract
Several problems arise in the literature relating to
benchmarking against the original contract. First, if the
public agency is to manage service provision at a
distance by monitoring actual standards against
contract specifications then it is essential that outputs
can be clearly specified and observed (Deakin and
Walsh 1996). However, since the nature of public
services is such that it is usually difficult to specify
them in any detail, contracts are usually written in very
general terms. Edwards and Shaoul (2003) show how
this created problems in the case of two failing IT
projects. Secondly, Grimshaw et al. (2002) found in
Process issues in the evaluation of PFI
PAGE 46
their study of a government IT project that there was a
lack of prior measures of productivity or performance, a
feature thought to underpin many of the subsequent
difficulties in managing the contract, which also made
evaluation difficult. Thirdly, Deakin and Walsh (1996)
argue that contracts dealt poorly with ambiguity and
failed to capture custom and practice, leading to
additional costs and potential problems in monitoring
performance. Further, since contracts were long term,
the service element, usually facilities management, had
to be described and monitored over periods of
(typically) up to 30 years, during which time changes
in requirements could be expected. Fourthly, Grimshaw
et al. (2002) found that in both their cases, of a
government IT and a hospital trust project, there were
difficulties in ensuring equivalence between the
specification of tasks in the formal contract and the
actual tasks undertaken as part of services provided.
Lastly, McWilliam (1997), drawing on his own
experiences at the Avery Hill Student Village, argues
that the private sector does not understand clearly the
importance of good quality performance and notes that,
over time, the service performance will have to satisfy
the requirements of ever-more-demanding students.
Benchmarking against the PSC
At the initial stage of a PFI deal a PSC is prepared, which
costs the project using conventional public procurement,
and at the business case stage private sector bids are
then compared with the PSC, which itself should be
updated in line with any changes to the facilities and
services being procured. Referring to Treasury Taskforce
Technical Note No. 5 (1999b), Ball et al. (2003a) note
that the format of the PSC should include an overview
of the project, basic procurement costs (both capital
and revenue), approaches taken in relation to third
party revenues, approaches taken on asset values and
transfer, and a risk matrix. As the Government’s cost of
finance is lower than that of the private sector, this
should help to establish a robust VFM assessment.
McKendrick and McCabe (1997) evidently believe that
there can be some benefit in using the PSC, since they
report that in the Stonehaven Community Hospital PFI
deal, ‘there appears to have been no PSC produced for
this project, which makes it difficult to ascertain just
how operationally efficient the winning bid is’. Similarly,
the Public Accounts Committee criticises Airwave PPP
for not preparing a PSC until the decision to use PFI
had already been made, making it doubtful that the use
of a comparator added anything significant to the
decision-making process (PAC 2002c), although it
notes that it was used later for evaluation purposes.
There have been a number of concerns raised about the
use of the PSC for decision-making purposes, which in
turn raise questions about its suitability for
benchmarking and evaluation purposes. For example,
the Government’s emphasis on PFI as the most
important, if not the only, procurement route has meant
that public agencies have spent time refining the
financial comparison calculations in a way that has not
always been appropriate, given the impossibility of
accurate estimates for costs over the long term. Both
the NAO and PAC have stated that departments ‘should
be wary of spurious precision’ when evaluating value
for money through both the PSC (NAO 1998a; PAC
2003a) and realistic alternative options (NAO 1997).
Examples of this have been the PFI contract for
Fazakerley Prison (PAC 1998c, Recommendation 2),
the PFI contract for the redevelopment of the West
Middlesex University Hospital (NAO 2002f) and the
redevelopment of the main MOD building (NAO 2002c).
Regarding the latter, the NAO commented that, ‘Given
the uncertainties in the comparison, a more reasonable
conclusion in that situation may be that the cost
comparison shows there is little to choose between PFI
and conventional procurement in cost terms’. Similarly,
in its appraisal of the London Underground PPP, the
NAO advised against relying on one criterion that was
dependent upon the financial modelling of costs that
were fraught with difficulties (NAO 2000e).
Process issues in the evaluation of PFI
PAGE 47
Despite the effort expended by the procurer on creating
a spuriously precise PSC, there is evidence that PSCs
have not always been well prepared. We cite but three
examples, although several others exist. First, in the
case of the PRIME (Private Sector Resource Initiative
for the Management of the Estate) project, the PAC
commented that, since past performance in relation to
the property being transferred had been unacceptably
poor, it was important that the preparation of PSCs
should not assume that future performance would be
the same. Instead, reasonable assumptions should be
made about the public sector’s ability to improve the
efficiency of its estate management (PAC 1999b,
Recommendation 8). The Treasury Minute responding
to this recommendation noted that the PSC was
prepared by benchmarking costs and then judging the
likely savings that would have arisen if the DSS had
rationalised procurement and driven out inefficiencies
in estate management practices. Such action was
consistent with the guidance given in Treasury
Taskforce Technical Note No. 5, How to Construct a
Public Sector Comparator (1999b).
Secondly, in the PFI contract for the new Dartford and
Gravesham Hospital, the PAC noted that significant
errors in the PSC were not detected by the trust (PAC
2000c). This meant that some £12 m less in savings
should be expected, making PFI savings marginal when
compared with the PSC. The PAC recommended that
VFM comparisons should be rigorously checked (PAC
2000c, Recommendation 2). In addition
(Recommendations 11, 12) the PAC wanted to see a
sensitivity analysis relating to changing usage levels,
along with more rechecking of assumptions.
Thirdly, in the case of the London Underground PPP, a
number of adjustments amounting to £2.5 billion were
made to the PSC (Deloitte and Touche 2001). The first
and largest, £1.17 billion, represented the expected
failure of LU to meet the performance requirements.
This risk of failure was shown as an economic cost to
passengers, not to London Underground. In other
words, the costs of the PSCs were inflated by including
costs to others, although this was not the procedure set
out by the Treasury’s Green Book (1997a). The costs to
passengers are entirely separate from financial costs to
London Underground and the two should not have
been confused. Furthermore, Deloitte and Touche find
that many of the underlying assumptions are subjective
and arbitrary. As the negotiations proceeded, there was
considerable ‘descoping’ of the project and changes to
the contractual arrangements that were not reflected in
a similar downgrading of the PSCs’ costs. Some of the
numerous revisions to the PSCs involved performance
adjustments that were extremely volatile and there was
considerable scope for double counting. Although the
costs had been subject to extensive simulations and
sensitivity analyses, the expected value or mean of
each distribution was chosen even where the
distribution was skewed, leading to a value
considerably higher than the most likely value.
Such problems therefore make it unlikely that the PSC
will provide a good benchmark, especially if there are
no resources available to update it to fit the prevailing
contract conditions. Pilling (2002) provides an example
of this in his study of the process of contracting for a
radiology department’s picture archiving and
communications system. He argues that although the
PSC is considered to be relatively straightforward to
construct, it needs to take technology refreshment into
account. This aspect does not normally form part of a
purchase contract, and the cost of the technology
refreshment is unpredictable.
Comparisons with conventional procurement
Taylor and Cooper (2002) quote the findings of the US
General Accounting Office (GAO) which, after
investigating a number of methodologies used to
compare operational costs and/or the quality of service
of comparable private and public prisons, concluded
that the best approach for evaluating operational costs
was to study existing comparable facilities, not
hypothetical facilities. In other words, the GAO rejected
Process issues in the evaluation of PFI

PAGE 48
the use of the PSC for benchmarking purposes. In
practice often this means trying to compare the
performance of new PFI facilities with older publicly
procured ones, which may not represent a like-for-like
comparison. Commenting on the justice system, the
Centre for Public Services (2002), argues that cost
comparisons between new and old prisons do not make
sense because there are different security and working
arrangements, which might not form part of the
evaluation process, and different pay and pensions for
staff in the two sectors, whose impact on service
quality is difficult to ascertain.
Comparisons with private sector performance
A government IT project had intended to use regular
benchmarking of costs and performance levels obtained
from private sector competitors of the contractor
(Grimshaw et al. 2002). They found that it was
impossible to exploit market pressures, however,
because of the extraordinary difficulty in benchmarking
the costs of IT services. Consequently, the government
department expected to be able to benchmark only half
of its outsourced activities because of the difficulty of
obtaining cost/quality information and the non-
comparability of some areas of IT provision. Thus
Grimshaw et al. (2002, p. 491) argue that the
apparent benefits to be gained from ‘market-cost
discipline’ were limited in practice by the impossibility
of enforcing spot market contracting. They conclude
that the public sector partner incurred most of the risks
associated with the IT contract, rather than benefiting
from the downward cost pressures of market competition.
The NAO has found also that when contract bidding
was non-competitive, benchmarking is difficult to do
and departments have failed to provide adequate
comparisons. In the case of the Radiocommunications
Agency Joint Venture with CMG (UK) Ltd, the NAO
recommended that existing service levels should be
established in order to enable comparisons of
subsequent changes in performance (NAO 2000d).
This has been a recurring theme ever since the PAC
recommended that the Inland Revenue set clear targets
against which actual efficiency improvements could be
measured in the Newcastle Estate Development Project
(PAC 2000a). In the Inland Revenue/EDS Strategic
Partnership, however, the PAC noted that the Inland
Revenue found it difficult to benchmark successfully
owing to difficulties associated with identifying suitable
comparators and obtaining commercially sensitive
information (PAC 2000e).
The use of should-cost models, as demonstrated by the
PPP Airwave, is deemed to be good practice if full
competitive tendering is impossible or fails (PAC
2002c). In its report on the Libra project, the NAO
recommended that in order to avoid jeopardising VFM,
the development of a should-cost model could help
assess the reasonableness of a bid (NAO 2003a) and
act as a standard against which to measure
performance.
This inability to examine current market prices is
critical in situations where historical costs are not an
appropriate basis for comparison, because PFI projects
may introduce a new system of working that is
substantially different from the pre-existing system or
alternatively needs and consequently costs change over
time. In hospital projects, investigated by Grimshaw et
al. (2002) and McKendrick and McCabe (1997), the
PFI involved the closure of one site and the
concentration of services at another, making it difficult
to compare previous performance with the operational
efficiency and the gains or losses resulting from the PFI
project. IT projects are another area in which the effect
of variables other than the PFI project itself makes the
evaluation of PFI difficult. In such projects, rapid
changes in the skills and knowledge that underpin
working practices make it difficult to judge the cost-
effectiveness and quality of the outputs against those of
previous methods. More generally, Sussex (2003) notes
that measuring cost and time overruns is difficult. Many
claims of large cost increases under conventional public
sector procurement were based on comparing the
Process issues in the evaluation of PFI
PAGE 49
outrun cost with initial estimates made many years
previously, not with the price agreed at financial close.
General price inflation and the costs of subsequent
modifications to the scheme prior to tender influence
cost. Drawing on previous work, (Sussex 2001) Sussex
concludes that if the same approach were used to
evaluate PFI projects, then they too would appear to
overrun greatly on cost and time.
IN-HOUSE EXPERTISE
The outsourcing of services entails the purchaser’s
surrender of a significant level of expertise, ostensibly
to exploit the benefits of the private sector’s greater
specialisation. Without strong expertise in service
delivery, however, it is difficult for the purchaser either
to manage effectively the monitoring of service delivery
or to specify new work. Staff turnover in contract
management presents an additional and significant
problem in replacing expertise. In their evaluations of
the initial contract negotiations, a number of authors
have noted that the public sector may therefore have
underestimated the probable costs of contracting and in
particular the need to have a credible team of
negotiators dedicated to the project. For example,
Grimshaw et al. (2002) note a significant difference
between the public and private sectors in relation to the
resources and expertise available for negotiating and
fine-tuning the contract.
As projects become operational, similar evidence is
beginning to accumulate about the costs associated
with monitoring performance, and in some instances it
has been argued that there is or has been a shortage of
public sector expertise to enable effective monitoring
and project evaluation. Grimshaw et al. (2002)
recommend that the public sector organisation should
invest additional resources in the specification,
monitoring and measurement of contracted services.
They note that the separating out of particular services
for tender, the specification of tasks to be included, and
the design of monitoring and measurement methods all
present an institutional problem (as well as imposing
additional transaction costs) which places additional
demands on management in areas of accounting
systems, human resource management and operations.
Indeed, the Treasury Green Book (2003a) admits that
conducting an assessment can be resource-intensive.
Whorley (2001) argues that public sector organisations
have been weakened by the downsizing agenda and
have tended to enter partnerships in a subordinate role,
which has hampered both effectiveness and
accountability. He notes particularly that senior
members of staff have left and that early retirement
programmes have created ‘churn’ among public sector
staff, leading to a loss of expertise in effective oversight.
Grimshaw et al. (2002) make similar points. They
report that once one contract had been signed, the
trust’s senior PFI project staff left, leaving behind a
dearth of knowledge about the concession agreement.
Owing to financial restrictions that affected pay and
training, the NHS had difficulty retaining staff and
consequently the private sector trained the NHS
monitoring team to ‘see things how the private sector
team saw them’.
Whorley (2001) argues that there is a major flaw in the
monitoring of high-tech projects, where the private
sector’s task is to develop systems past the point that
could be achieved by the public sector. If such a
position were reached then it is likely that the public
sector would lack the skills to monitor these enhanced
systems. He argues that the state should not become
so hollow (Rhodes 1994) as to be unable to direct,
control and evaluate contracted goods and services and
that the effects of the downsizing agenda need to be
addressed so that the public sector retains the
necessary skills to engage fully with partners. He found
that in practice, however, most of the knowledge
resided with the private company, which then enjoyed a
privileged position for any continuing work that could
entail long-run costs to the Government. Any
subsequent attempt by the Government to take on the
Process issues in the evaluation of PFI
PAGE 50
work directly would involve significant costs to transfer
knowledge from the consultants back to the
Government. This line of argument is supported by
Grimshaw et al. (2002). They argue that even where
an ‘in-house’ team of staff with specialist skills is
retained and initially maintains a relatively strong
bargaining leverage, over time this source of bargaining
strength is likely to diminish as the private sector
develops new IT systems in areas where government
staff have little experience.
Furthermore, the lack of public sector expertise to
assess risk is a feature of several papers. For example,
Hood and McGarvey (2002) report evidence that some
local authority staff do not feel that they have sufficient
expertise, often because they lack sufficient skills,
especially those staff involved in the ‘non-insurance’
aspects of risk management, such as Monte Carlo
simulations. Those whose involvement is restricted to
insurance advice are more confident. Public sector staff
perceive an imbalance in skills between private and
public sector staff in risk assessment and although
respondents believed that the local authorities’ own
team should be used, many local authorities’ risk
managers lack the necessary skills to do this effectively.
Nevertheless, there is some recent evidence that the
need for resources to support the maintenance of in-
house expertise is being recognised at an individual
project level. For example, in their study of a Scottish
high school project, Ball, Heafey and King (2003b)
conclude that the local authority project team had
operated very effectively because the Council had
decided to resource fully its development of the PFI
project by compensating departments for the time they
spent on their PFI work. This process also helped to
minimise the use of consultants, which meant a keener
focus on the Council’s needs and interests. However,
the use of resources for such purposes is not
necessarily viewed agreeably by all parties and, for
example, Ball et al. also report some concern at school
level about the costs involved. For example, a deputy
head teacher indicated that he was now required to
spend quite a large proportion of his time liaising with
the PFI operators. More generally, the Audit Commission
(2001), in a larger study of ten completed schemes in
local government and health in England and Wales,
echoed this concern. It states that the length and
complexity of the PFI procurement process could have
adverse effects on other services owing to the amount
of senior management time spent on PFI issues.
CONFIDENTIALITY
One of the issues that numerous commentators have
mentioned is the desire of the private sector contractor
that contractual information should be treated as
confidential, and this creates conflicts with the public
agency’s need to account to taxpayers and service
users. Hood and McGarvey (2002) conclude that:
The contentious political nature of PFI and the secrecy
surrounding the, supposed, commercially sensitive
aspects of its operation has resulted in major
difficulties in post-implementation evaluation.
Their conclusion is important not only because of the
degree of difficulty that they report but also because of
its impact on evaluation. Similarly, the Centre for Public
Services (2002) notes that public discussion tends to
focus on net present values (NPVs) and discounted
costs, although cash costs have been kept secret and
business cases are not always in the public domain.
Unison has claimed that it has had difficulty extracting
contract documentation or information on the number,
sex and grade of staff affected by PFI projects.
What is surprising is that authors report that not only
the private sector, but also the public sector sought to
maintain confidentiality over information. For example,
the NAO reported that it was the Government that had
required the financial details of the Highways Agency’s
contracts with the private sector to design, build,
finance and operate (DBFO) to be kept confidential
Process issues in the evaluation of PFI

PAGE 51
(NAO 1998a). In specific instances, Unison’s problems
were attributed to the lack of information disclosure by
all organisations within the Criminal Justice System,
not only the private contractors, and Whorley (2001)
claims that Government representatives had agreed to
demands that details of contracts remained
confidential. He quotes Boase (2000) as saying that: ‘It
is striking how government representatives have
acquiesced to demands by their private partners that
the details of their contracts remain confidential, thus
blurring the lines of accountability’.
Furthermore, it is unclear that the Freedom of
Information Act, due to come into force in 2005, will
remedy this lack of information. Thus, despite the
exhortation, made without any caveats about the
impact on commercial sensitivity in Chapter 7 of the
White Paper (Cabinet Office 1997), that evaluation
reports should not only be disseminated, but also
published, it appears that the practice is closer to
paragraph 7.18, which says that security or
commercial confidentiality may be good reason for not
publishing evaluation reports. This means that, in
practice, the Government’s apparent desire to learn
lessons to improve the quality of future decisions seems
to be restricted.
POWER
The issue of confidentiality and the Government’s
willingness to acquiesce to the wishes of the private
sector suggests that it is worth examining the nature of
power relationships between the contracting parties. An
unequal relationship may affect VFM via the (in)ability
to enforce contract provisions, renegotiate and/or
terminate the contract.
The incoming Labour Government of 1997 instituted a
change in the rhetoric surrounding PFI when it began to
use the terminology of ‘public private partnership’ to
describe the intended relationship between the two
contracting bodies. However, as Whorley (2001)
observes, partnerships imply a relationship of equality,
whereas according to Mulgan (2000) accountability
implies an unequal relationship of superior and
subordinate in which the latter is required to take
directions from the former and to accept sanctions, if
necessary, for unsatisfactory performance. Thus for
Whorley (2001), partnership arrangements impeded
accountability by weakening the authority rights of the
procurers.
In practice, the power relationships may be of a
different nature again. In Grimshaw et al.’s view
(2002), the private sector is likely to have greater
experience than the public sector in managing service
delivery to meet contractual requirements. Thus the
move to a market-based contracting arrangement
should deliver a comparative advantage to private
sector partner organisations relative to the public
sector. The private sector is likely to have a greater
ability to negotiate a better deal. For example,
Grimshaw et al.’s study shows an imbalance of power
between public and private sector partners, which
could lead to an imbalance of bargaining strength and
an inequitable distribution of the gains and the losses.
Whorley (2001) notes that during the course of the
Ontario PFI Business Transformation Project, traditional
public service concerns for process, control and public
oversight were displaced in the interests of the private
firm. Similarly, Hastings (1999) reports that in
Scotland, the views of private sector staff, when re-
interviewed after a year, remained unchanged whereas
the views of the other parties had shifted towards the
private sector perspective. She concluds that an
imbalance of organisational power implies the
probability of dominance and therefore, unidirectional
change that could be detrimental to the public sector.
The nature of power relations can be observed by
examining both payment deductions for poor
performance and any attempts by procurers to facilitate
good performance rather than enforcing non-payment
clauses. There is evidence that, where actual
Process issues in the evaluation of PFI

PAGE 52
performance has fallen below the required level,
performance deductions from payments have been
made. For example, the PAC Report Managing the
Relationship to Secure a Successful Partnership in PFI
Projects (2002a) noted that 58% of authorities with a
performance review process had made performance
deductions, but despite this the PAC remained
concerned that public agencies might not do enough to
ensure that ‘persistent under-performance’ did not take
place. In addition, the NAO has reported that the
performance of PFI prisons against contract has been
mixed (2003g, para. 5). Out of seven operational
prisons only Forest Bank had not incurred financial
deductions. With the others, financial deductions were
generally highest in the first year of operation, reducing
greatly in subsequent years. The PFI contractor
servicing Ashfield prison, however, had increasing
financial deductions and faced the prospect of contract
termination unless improvements were sustained.
There is also a concern that in some contracts the cap
on deductions may have been set at an inappropriate
level. The PAC commented (1998c) that Securicor’s
penalties for non-compliance with performance
measures at Bridgend prison were limited to 5% of the
annual contract price. The Laganside Courts PFI
contract limited the total abatement for unavailability to
44% of the total amount due, even if the entire building
was out of action (NAO 2003f, para. 6).
Another problem is that the public sector does not
always have systems in place to enforce the payment
deductions. The NAO (1999d) noted that the Passport
Agency did not have monitoring systems for some
standards and consequently was unable to claim
service credits to which it appeared to be entitled.
Reporting on the passport delays of summer 1999, the
NAO recommended that:
Public bodies should have adequate systems for
recording performance, and ensure that they are in a
position to claim any compensation due from
contractors for failure to meet agreed performance
standards, subject to appropriate risk-sharing within
the partnership. (NAO 1999d, Recommendation 10).
However, even when systems are in place deductions
may not be made. For example, Whorley (2001, p. 331)
states that even though benefits were running behind
costs, a situation contrary to the contract, Andersens
were paid, and Ball et al. (2003a) report that the
Benefits Agency and Post Office Counters Ltd did not
demand damages when their project began to slip.
Sussex (2003) notes that writing penalty clauses into a
contract did not guarantee that cost overruns, delays in
delivery or other performance shortfalls would not be
borne by the NHS. In his view there was still plenty of
room for dispute over the cause of the problem and
who should pay.
Edwards and Shaoul (2003) note the problems inherent
in enforcing penalty clauses. In the case of the NIRS2
contract, the Benefits Agency accepted compensation
that did not cover the Agency’s costs, because, as the
Treasury Minister Dawn Primarola admitted, the
Government would not demand compensation for the
troubled NIRS2 National Insurance Records contract
‘for fear of damaging future relationships’, even though
the contract allowed for compensation. Similarly, the
Passport Agency waived service credits worth some
£275,000 in the interest of good working relationships
over the 10-year life of the project. This project also
highlighted a contractual defect in that there was no
available redress for consequential loss arising from the
contractor’s failure to deliver on time.
Implicit in these cases was also the Government’s fear
that enforcement of the penalty clauses would
jeopardise the success of a policy to which it was
heavily committed. In other words, there were wider
political considerations that precluded enforcing the
contract. More generally, this means that since
contractual arrangements crucially depend upon their
political context, they may create a power imbalance
Process issues in the evaluation of PFI

PAGE 53
that militates against the public agency enforcing the
contract.
CONFLICTS WITHIN CONTRACTS
PFI contracts are long term in nature, multi-faceted and
multi-phased, and may have multiple stakeholders and
complex objectives. This may create tensions and
conflicts between different stakeholders at different
times that affect the ability to monitor, control and
evaluate the project.
First, PFI projects normally involve the integration of
the design, build and finance of a capital asset and a
long-term service contract to operate facilities such as
cleaning, catering, repair and maintenance, and
laundry, etc. However, Akintoye et al. (1998) argue
that in practice, rather than integration, there is a
conflict of interest between capital and service
obligations, because various commercial interests have
varying influences at different stages of the project.
Citing the case of a contract for a student hall of
residence, McWilliam (1997) concurs with this finding.
He argues that from early on in the negotiation phase it
became clear that the initial bidders relished the
construction work but paid scant attention to the
facilities management and risk transfer aspects. At that
time, pre-1997, the contractors simply thought they
were constructing a building and the lenders thought
they were lending to the university. Consequently, he
argues that the private sector did not clearly
understand the importance of the service element that
was to form the basis of the long-term relationship.
Similar concerns have been raised elsewhere. For
example, in its report Privatising Justice, the Centre for
Public Services (2002) cites the Director General of the
Prison Service as saying that the private sector should
do the design and build while the public sector should
run the prison. Although Debande (2002)
acknowledges that there has been a lack of evidence
about performance in the operational phase, in relation
to transport, he concludes that the gains from PFI were
essentially in the design and construction phases. He
highlights the issue of the quality of road operations
after construction by comparing the components of four
competing bids on a road project. The two projects
with the best VFM were those projects with the highest
road construction costs and the lowest operation and
maintenance costs. He argues that over time the
private sector may behave opportunistically, especially
where there was no substitute for infrastructure or the
project was part of a network.
The nature of accounting for PFI means that the service
element is critical to achieving the Government’s
preferred accounting outcome, which keeps the asset
and liability off balance sheet. Hodges and Mellett
(2002) explain that the Treasury bases its accounting
on the premise that PFI projects are contracts for
services and therefore PFI contracts are not lease
transactions. Payments for services are only due when
the service is delivered. The effect of this premise is
that the regulations of SSAP 21 and FRS 5, which
might see PFI projects accounted for on balance sheet,
are avoided. In essence PFI contracts can remain off
balance sheet provided that ‘the contract was drafted
to avoid the separation of asset and service payments
and the making of material payments or deposits in
advance of service provision’ (Hodges and Mellett
2002, p. 134). That is, there is an accounting rationale
for ensuring that each PFI contains a service element
that is integral to the project. Thus the Government’s
requirements to include a service element may conflict
with the needs of the agency, which might be better
served by a capital-asset-only arrangement. This may
lead to further tensions and problems.
Different stakeholders may be involved at different
times in multi-phased projects. Since projects tend to
have a dual risk profile, the first being the high-risk
construction phase and the last a low-risk utility phase,
when lenders are more likely to buy into PFI schemes,
Debande (2002) concludes that not all stakeholders
Process issues in the evaluation of PFI
PAGE 54
are involved directly in each phase, implying the
possibility of divergent and changing interests over
time. This implies a need for monitoring and control
systems to be reviewed as the project moves through
its various phases. However, the different timescales
involved in many projects may add to the monitoring
difficulties. Debande (2002), using the Skye Bridge as
an example, notes that the contractor had to provide a
bond to cover any dispute over the standard of
maintenance. The bridge was designed to last for 120
years but the tolls, which provide an income stream,
would run out in 27 years. The road surface had to last
40 years and the financing was for 25 years. Thus the
lifetime of PFI projects and the associated
infrastructure were independent, but such timing issues
might signal changes in the contract that represent new
phases with different monitoring impacts. For example,
from the perspective of the public sector, the state of
the assets at the end of the contract life would become
critical because there might be a disincentive on the
part of the private sector to maintain assets towards
the end of the PFI contract. Hence, the distribution of
risk would vary between different phases of the project.
Although Sussex (2003) argues that maintenance
might now receive greater consideration because of the
long-term nature of contracts, this may not have been
the case in earlier projects. This means that project
evaluation must distinguish between the different
phases of the projects and pay particular attention to
the operating element of the PFI.
PFI projects in schools especially highlight the
problems associated with multiple stakeholders
because the public sector responsibilities are divided
between different entities. Although the local education
authority (LEA) is the contracting party, the decisions
that it takes affect the school’s budget, for which the
school has responsibility, as well as the quality of the
teaching environment. Edwards and Shaoul (2003)
found that the LEA may act as champion for a PFI project
even when the interests of the LEA and the school differ.
In addition, they argued that although it was usually the
school’s responsibility to monitor on-site PFI
performance, it was the LEA that had enforcement
powers. So, should a school or classroom(s) become
unavailable it would be the school and pupils who
suffer, but the school might be unable to implement
contractual performance clauses in practice and have
no legal redress against the LEA if it proved unwilling or
unable, owing to lack of resources, to enforce the
contract standards. In this situation effective
monitoring, control and evaluation are needed to assess
the project at both the LEA and school level.
A quite different source of conflict between stakeholders
has arisen, particularly, in relation to the prisons. The
NAO’s post-implementation evaluation assessments
have focused on the financial aspects of performance.
Notably absent is any consideration of the views of
prisoners, their families or advocates, criminologists,
prison reform organisations, trade unions or the
probation services (Centre for Public Services 2002, p.
26). These authors argue that there was an absence
of social, economic and environmental audit or
analysis that could provide additional evidence to
support claims about the relative financial benefits of
PFI compared with the PSC. In particular, they draw
attention to the lack of evidence about monitoring of
issues such as equity, for example, work force rights,
including those associated with Transfer of
Undertakings Protection of Employment (TUPE), and
access rights to facilities that are being centralised at
out-of-town greenfield sites. Nathan and Whitfield
(2000) concur, arguing that proving or disproving VFM
was only one part of the equation, and that Treasury
and NAO criteria for VFM assessment ignored equality
and employment issues.
At a policy level, Taylor and Cooper (2002) report that
there is a lack of evidence that the private sector can
deliver wider public policy objectives such as poverty
reduction, social inclusion, equity and prisoner
rehabilitation. There appears, particularly within
prisons, to be a fundamental conflict between the
Process issues in the evaluation of PFI

PAGE 55
needs of the private sector provider and society.
Society’s strategic aims of challenging offending
behaviour and promoting rehabilitation are at risk
under PFI, because commercial companies have a
vested interest in keeping people locked up. There is a
clear conflict of interest between society’s desire for
prisoners to be rehabilitated and for fewer prisoners, on
the one hand, and the corporations whose profits are
best served by increasing prisoner numbers, on the
other. Taylor and Cooper (2002, p. 24) concluded;
‘There is a fundamental conflict between operating to
contract and running a prison which delivers effective
strategies for dealing with offending behaviour’.
CONCLUSION
In the private sector it has long been recognised that
the post-audit of investment decisions is a very difficult
task, which may be viewed with disfavour because it
discourages initiative and leads to excessive caution.
Nevertheless, empirical evidence indicates that most
large companies have been conducting some form of
post-completion audit for many years. The literature
outlined above indicates some issues that have
occurred in public sector monitoring and evaluation of
PFIs, at least some of which indicate that, given time,
evaluation is capable of improvement. If monitoring and
evaluation are to be effective, the control mechanisms
and accountability systems that were not designed for
either the decision-making or control roles envisioned in
the new accounting and contracting models (Seal
1999) may need to be changed to reflect this new role.
Thus, appraising, monitoring and evaluation, at least in
those case studies that have been made publicly
available, have proved difficult.
• There have been practical problems associated with
a lack of in-house expertise, data collection and
measurement systems and availability of suitable
benchmarks against which to judge performance.
• Consequently, the costs of monitoring appear to
have been greater than was anticipated and in time
this is likely to increase the public sector’s costs and
thereby reduce VFM.
• Although some of these problems may be explained
by the fact that such tasks are new to the public
sector, it is likely that these are long-term problems.
• Monitoring, evaluation and scrutiny are made more
difficult by the requirement of both the Government
and the private corporations for confidentiality.
• Unequal power relations between the relatively small
and poorly resourced public agency and the large
corporation may make contract enforcement difficult
if not impossible in practice.
• PFI projects typically give rise to different conflicts of
interests within and between the two main parties to
the contract.
• Public agencies may also have conflicting objectives,
including equity and social inclusion, whereas
private companies tend to be more narrowly focused
on profit-related tasks, differences which may
generate conflicts.
A full assessment of a PFI project therefore needs to
consider the outcomes from the perspective of the
various stakeholders, who may change over the life of
the project, and its social impacts, rather than just
taking a narrow technical approach, which is the
emphasis of current advice from the OGC. Although
there have been repeated statements in the press by
Government and ex-Government ministers about the
public’s right to know how hospitals are performing,
this right does not appear to extend to how the PFI
projects are performing. Finally, although the
Government claims to be in favour of evaluation, its
insistence on hiding behind commercial confidentiality
limits the ability of independent parties to carry out
Process issues in the evaluation of PFI

PAGE 56
such studies and raises questions about who is
demanding confidentiality, why this is necessary and
what there is to hide.
Process issues in the evaluation of PFI

PAGE 57
4. Examining the potential determinants of value for money (VFM)
Crucially . . . the literature suggeststhat values placed on the benefit ofrisk transfer are fundamental toVFM at the decision-making stage.
IMPLEMENTATION EVIDENCE 59
COMPETITION AND MARKET FORCES 61
CONTRACT MANAGEMENT 62
INNOVATION 64
TRANSACTIONS COSTS 64
RISK TRANSFER 65
CONCLUSION 68

PAGE 58
Examining the potential determinants of VFM
PAGE 59
Given that VFM is the Government’s rationalising motif
for PFI, we consider here the evidence as it relates to
the sources of VFM and their ability to deliver VFM in
practice. VFM in PFI projects has come to mean lower
whole-life costs, which are assumed to flow from the
greater operating efficiency and innovatory practices of
the private sector. These could be achieved as a result
of several factors, including market forces that
encourage efficient working, good contract
management, and innovation in technology and
methods of working. Conversely, VFM may be adversely
affected by higher transactions costs, including higher
financing costs and monitoring costs. Crucially,
however, the literature suggests that values placed on
the benefit of risk transfer are fundamental to VFM at
the decision-making stage. We review first the limited
publicly available post-implementation evidence from
official bodies, such as the official watchdogs and the
Treasury, and then available evidence on each of these
possible sources of VFM.
IMPLEMENTATION EVIDENCE
Scotland’s Accounts Commission was one of the first to
report on PFI procurement, after the completion of the
construction phase of six schools projects (Accounts
Commission 2002). It was scathing about the local
authorities’ unquestioning approach to PFI. Funding
considerations (the availability of some funding under
PFI and none under conventional public procurement)
and ‘the presumption of better VFM under PFI had
driven the choice of PFI’ [emphasis added]. The
Accounts Commission was concerned that decisions
were made on the basis of stereotypes of poorly
performing public sector options rather than evidence
of demonstrable benefits from private finance.
Furthermore, the emphasis on PFI would mean that in
future it would be difficult to get up-to-date evidence
about the outcomes and effectiveness of traditional
procurement, thereby biasing decision making even
further in favour of PFI.
The evidence on construction showed that the projects
had largely been built to time and budget, but as yet
there was little information about the operational phase
of the contracts. It warned that although the contracts
should provide incentives for the PFI providers, success
was not assured, and the councils needed to have a
clear strategy for managing underperformance.
Likewise, the PFI process does not guarantee that the
councils will achieve the most cost effective risk
transfer. Although it believed that PFI was likely to
provide benefits in the schools’ maintenance, there was
either no evidence that operational gains could be made
through PFI or there was evidence that they could have
been achieved through other procurement mechanisms.
The Accounts Commission was concerned about the
emphasis on VFM at the expense of affordability. First,
the transaction and financing costs were high, adding
to the high cost of PFI contracts. Since PFI schemes
covered only part of the councils’ schools estate, they
could create affordability problems in the future that
would be borne by those schools not included in the
PFI contracts or by other council services. For example,
the largest PFI scheme, the Glasgow schools project,
accounted for 24% of the council’s entire non-staff
education expenditure in 2000/1. Secondly, the value
of the public sector comparator was limited since it was
not well costed and assumed up-front funding rather than
financing through Treasury gilts, which is how such
projects would typically be funded by the public sector.
Given the lack of public funding, the schools refurbishment
would not go ahead unless PFI was shown to have
lower whole-life costs. The margin of difference
between public and private finance after risk transfer
was small and there was no analysis of why the PFI
solution was more economic. This implied that since
the PSC was unreliable, the projects were unlikely to be
more economical over the whole life of the contracts.
Although the Audit Commission’s review of schools
projects in England was more limited in scope than the
Accounts Commission’s, it too was critical of PFI and
Examining the potential determinants of VFM

PAGE 60
the outcomes to date, saying, ‘PFI has not yet delivered
some of the most important benefits expected of it’
(Audit Commission 2003, p. 39). The quality of
refurbishment and new build under PFI was poorer
than under traditional procurement. There was little
evidence that the construction methods would lead to
lower whole-life costs. The average cost of cleaning and
catering was higher than in non-PFI schools. Although
this meant that the standard was higher, it came at the
expense of the non-PFI schools. There were few
deductions for poor performance. Standards were not
enforced because, owing to problems with the
information systems, there was no information upon
which to base an assessment of performance and
hence make deductions where appropriate. In any
event, it was unclear that the size of the penalty either
constituted a deterrent to poor performance or
adequately compensated the schools.
On the question of the anticipated VFM, risk transfer
and affordability, the Audit Commission acknowledged
many of the points made by the Accounts Commission
(2002) and called for a revision of the methodology in
order to give PFI more credibility in the eyes of the
public. It was particularly concerned that the affordability
gap would surface later in the life of the contract.
Interestingly, from the perspective of this study, it was
concerned about ‘information asymmetry’. There was no
open book accounting under PFI, thus local education
authorities had no information on actual construction,
operational and maintenance costs, and this would
make it difficult to negotiate a realistic price for contract
amendments or to prepare future PSCs. This inequality
would mean that, increasingly, PFI companies would be
able to dictate terms to the public sector. Among its
recommendations was the call for the Government to
develop an evaluation template for retrospectively
assessing the success of PFI schemes along with other
large-scale investments in schools.
The NAO (2003b) and PAC (2003d) have reported on
the construction performance of all projects completed
by summer 2002. The NAO report focused on three
key areas of construction: price certainty for
departments; timing of construction delivery; and the
quality of design and construction. It found that
generally the aims of PFI were being met. As it did not
carry out a user survey as part of its methodology,
however, the value of such findings may be limited as
user consultation has been identified as an important
part of performance review (Audit Commission 2001).
Experts consulted confirmed that generally the
theoretical PFI incentives were working in practice,
with improvements in built assets through the better
integration of design, construction and maintenance,
leading to better management of construction cost
risks. Assets were now being delivered early, or at least
on time.
HM Treasury, which has been the key player in
promoting PFI, recently published a report, PFI:
Meeting the Investment Challenge (Treasury 2003c),
which provides some indication of how PFI is working
in practice. First, the report acknowledged that small
schemes below £20 m might not be appropriate for
PFI, given the lengthy procurement process and high
transaction costs. Secondly, the Treasury was forced to
admit that IT projects had not been very successful,
with only 22% delivering 80–100% of defined
programme benefits. Furthermore, they had failed to
achieve the level of risk transfer that provided the
original justification for proceeding with PFI. The
Treasury provided no financial information that showed
the extent of the failure to achieve VFM. This lack of
success, it argued, was due to the speed of change, the
difficulty of delineating responsibilities between parties
given the high degree of integration between an IT PFI
project and other non-PFI activities, the low capital
costs relative to operational costs, the relatively short
length of the contracts (typically 10 years) and the lack
of third-party finance that ensures appropriate and
effective risk transfer. In future, therefore, the Treasury
would ‘presume against PFI for IT projects’.
Examining the potential determinants of VFM

PAGE 61
Thirdly, its survey of a sample of large non-IT PFI
projects found that 88% of the new assets had been
built to time, specification and budget. Where there
had been cost overruns this had been due to changes
in the design required by the public sector client.
Fourthly, the Treasury was satisfied that the projects
had attracted on average four bids per project. This
must mean, however, that some projects attracted
fewer bidders, not all of whom would have met the
non-financial selection criteria, leaving little effective
competitive pressure. Fifthly, its survey of managers’
opinions about the extent to which the operational
performance was meeting initial expectations was quite
striking. Despite the fact that such a question was
unlikely to elicit very useful information since managers
might have had low expectations and/or have a vested
interest in saying that PFI was working well, 31% said
that the private sector partner was not living up to
expectations.
HM Treasury’s general conclusion was that since the
projects had been delivered to time and budget, PFI
had generally been successful and should continue,
which implies that it has downgraded its rationale for
PFI to the achievement of time and budget delivery and
now considers that this constitutes VFM.
COMPETITION AND MARKET FORCES
In relation to competition a number of issues may be
identified. First, although PFI provides the opportunity
for competitive bidding the reality has been that public
sector purchasers typically faced a limited choice of
providers during the bidding stage (Grimshaw et al.
2002). Over the long term, however, a more serious
issue may arise. Grimshaw et al. (2002) note that
partnerships may become insulated from external
competition and reputation effects, because there may
be no other realistic alternative supplier – owing to high
costs of entry or the need for specific technical know-
how – and this may undermine the ability of the public
sector to obtain VFM. Similarly, Edwards and Shaoul
(2003) report that procurers became locked into
relationships with suppliers because the costs of closing
down a project were too high, especially where this had
an impact on a wider system or network of services. A
similar problem was identified by Whorley (2001),
when the Ontario Social Services Ministry chose the
highest of three bids, from the incumbent supplier, for a
related but separate part of the existing PFI project.
Some authors have also reported the difficulties faced
by the procurer in controlling costs that have a
tendency to spiral upwards. For example, in Grimshaw
et al.’s study (2002), hospital managers suspected that
the private sector partners were less concerned with
delivering ‘100 percent performance’ than with
maximising the number of extra-contractual claims for
maintenance work. In Canada, Whorley (2001)
reported that the public sector found that it could not
prevent the contractor increasing average hourly rates
for staff time by 63% within a year.
Second, the ownership structure of the typically very
large organisations that bid for PFI contracts is relevant
to the role of competitive forces in this area. One
potential advantage of a PFI project is that it integrates
the various elements of the capital asset and its
operation, as the same contractor constructs and
operates the infrastructure (Debande 2002). In the
private sector, however, company restructuring is not
uncommon owing to mergers and acquisitions, or
indeed bankruptcy. For example, Taylor and Cooper
(2002) relate the case of Wackenhut, which owned
PPS and which had the contract for a UK prison. There
was a takeover just three years after the award of a 25-
year contract to run the prison, raising issues about the
ability of the new organisation to capitalise on the
benefits of integration. In this case the takeover
represented a market concentration, so that competition
was reduced. The authors argued that ‘the ownership
structures of companies involved in prison privatisation
are often complex, leading to difficulties in establishing
exact lines of demarcation’ (Taylor and Cooper 2002).
Examining the potential determinants of VFM
PAGE 62
Third, the use of subcontractors, also a common
practice, creates additional control problems. The PAC
stated that in the case of the Immigration and
Nationality Directorate Casework Programme:
The problems were made worse by the apparent lack
of an agreed approach between the primary contractor
and a subcontractor regarding the type of software to
be used. Although the technical details of proposed
solutions should be something for contractors to
organise in privately financed projects, it is crucial
that departments keep a very close eye on progress.
(PAC 2000b, Recommendation 3).
In its response, the Treasury stated that:
. . . because of the ‘arm’s length’ relationship implicit
in most PFI IT contracts – where the deliverable is a
service rather than a system as such – the details of
the product to be provided by a subcontractor to a
supplier providing the service to a client will invariably
be a more closed book. (HM Treasury Minute relating
to PAC 2000b)
In the light of all the negative evidence relating to
government IT projects, such a laissez-faire attitude
demonstrates the inability of the Government to
advocate a whole-business approach on PFI contracts.
Early projects, for example NIRS, had a narrow
definition of responsibilities, which led to a failure to
work in partnership (PAC 1999a, para. 105).
Finally, one area where the impact of market forces
may be seen to have reduced costs is in relation to
labour costs. According to Grimshaw et al. (2002), a
large part of the savings in their hospital study came
from lower labour costs: market competition provided
an opportunity to secure staff redundancies, and
although the private sector service providers were
responsible for the redundancy procedure, it was the
hospital trust that paid the redundancy compensation.
In addition, the Centre for Public Services (2002) note
a hidden cost of PFI, which falls on the tax payer,
because a number of low-paid private prison officers in
Scotland have received Working Families Tax Credit to
supplement their wages. Thus, market forces can work
in several ways, not all of which are capable of
delivering VFM to the public sector.
CONTRACT MANAGEMENT
Indirect evidence of inadequate contract management
and hence potentially poor VFM is provided in the
recommendations of official reports. Both the NAO and
the PAC have commented on the quality of contract
management and emphasised its importance in
generating VFM. They have recognised that the
introduction of PFI has required radical changes in the
way that public sector project managers work. The PAC
has found that working in partnership with the private
sector, which has delivered the benefits of encouraging
good performance, transparency and dispute
minimisation, has led to improvements in performance
(NAO 2001e, PAC 2002a).
Even when projects are apparently performing well,
however, departmental inexperience in agreeing levels
of incentives can lead to higher costs when projects are
completed ahead of schedule. This was the case for the
contract to complete and operate the A74(M)/M74,
where construction was completed more quickly than
the Scottish Office considered was possible (NAO
1999a). In relation to the PRIME project, the PAC
recommended that the public sector must manage the
contract robustly to secure VFM, noting that the
contractor’s actual performance fell short of the
required standard, despite the achievement of a claw-
back on excess profits (PAC 1999b, Recommendations
3, 10). Further, the PAC has commented, in relation to
the passport delays of 1999, that the Home Office
targets in relation to passport delivery times were ‘a
poor reflection of the public’s reasonable expectations
for this service’ (PAC 2000d, para. 10).
Examining the potential determinants of VFM

PAGE 63
Consequently, the PAC has made a number of
recommendations to improve contract management.
First, it has called for more public sector staff training,
particularly in two areas: building a successful
partnership with the private sector (PAC 2002a,
recommendations 4 and 13) and understanding the
issues involved in refinancing PFI projects (PAC
2003b). In the case of the refinancing of the Fazakerley
PFI prison contract, the PAC has noted that the
consortium gained considerable advantages, through
refinancing, that should have been shared more
equitably with the Prison Service (PAC 2001b).
Secondly, the NAO has found that even relatively small
contracts, such as the MOD Joint Services Command
and Staff College (NAO 2002a), identified a number of
wider lessons for other departments on the management
of PFI projects, including the following points.
• The Department has built flexibility into the contract.
For example it can vary its use of the college
buildings in future years.
• Poor contractor performance has been rectified
without recourse to financial penalties to the
advantage of the relationship between the
Department and the contractor.
• The College has identified that it needs to increase
its resources for managing the contract.
• The College is seeking greater control of utilities and
other items purchased on its behalf by the
contractor.
• Departments need to show leadership and, where
possible, maintain continuity within the project
team.
Thirdly, it is necessary to have a whole-business
approach between the public and private sectors in
order to have successful contract management. The
NAO has emphasised this in its latest report on the
National Savings and Investment contract four years on
(NAO 2003e), stating:
The public and private sector partners should not
enter a customer/supplier relationship, but need to
take a whole business approach, if they are to achieve
current and future strategic objectives. Such a
relationship is evidenced by the public sector partner:
i) recognising its requirements may lead to its private
sector partner not adopting the most appropriate
method of delivery that is best for the business;
ii) recognising its actions can have an unwarranted
impact on its private sector partner’s costs; and
iii) having access to the private sector partner’s
income and expenditure forecasts and not just
actuals.
And by the public and private sector partners:
iv) challenging the actions of each other to establish
that proposals are in the best interest of the whole
business; and
v) demonstrating their willingness to change the
contract as it is a dynamic document and their
interaction through governance procedures.
In short, numerous concerns about the quality of
contract management and monitoring have led to
recommendations to improve public sector skills in
these areas, suggesting that contract management may
not be adequate. Their implicit fear is that poorly
managed contracts have not delivered or will not deliver
the promised VFM. This represents an interesting
contrast to earlier PFI proposals that emphasised the
need for and benefit of, private sector innovation and
management techniques that were intended to provide
efficiency benefits to the public sector.
Examining the potential determinants of VFM

PAGE 64
INNOVATION
One of the claimed benefits of PFI was that the private
sector would be more innovative than was possible
under traditional procurement. Some purchasing
agencies have claimed success in this area. For
example, the Highways Agency have stated that almost
200 amendments were made to design standards
during construction of the Yorkshire Link project, one of
a second tranche of four PFI road projects, and that
these delivered benefits to this project. The PAC
acknowledged that the PRIME project, transferring the
Department of Social Security Estate to the private
sector, was indeed innovative and incorporated a
‘welcome degree of benefit sharing and risk transfer’
(PAC 1999b, Recommendation 2).
In a number of sectors, however, research has found
that this has not occurred. For example, the Centre for
Public Services (2002) concludes that
The claim that PFI brings additional innovation to that
which can be achieved by the public sector remains
unsubstantiated, in particular, there is little evidence
of innovation in the design of PFI buildings.
The National Audit Office’s report of the first four DBFO
(design, build, finance and operate) roads (1998a) has
found that there was little innovation because most of
the schemes had already passed the planning stage.
Likewise, the practice of designing a hospital under the
PFI process is similar to that of traditional
procurement, in that professional medical staff discuss
with externally appointed architects, surveyors and
engineers how much of what size and type of facility to
put where (Sussex 2003). Ball et al. (2003b) consider
that much of the design innovation in their Scottish
case came from the original project brief provided by
the local authority, rather than from the private sector.
Ball et al. (2003b) report, however, that although there
was considerable innovation in the financial package,
this may have benefited the contractor but added risk
to the public sector. The preferred bidder for the High
School project used a funding package that included
only 1% equity funding, which reduced the annual
unitary charge to the PFI Consortium by approximately
£50,000. This option involved additional risk for the
Council, which had to ensure that the senior lender was
fully compensated under all situations. This liability
would normally be fully covered in the form of a
guarantee from the parent company (ie the construction
company) and provision of latent defect insurance
bonds. Nevertheless, in exceptional circumstances,
particularly if a construction fault with a high cost of
rectification occurred and the contractor’s guarantee
was inadequate, the cost could fall on the Council.
Consequently, the low equity contribution from the
sponsor reduced the risk transferred.
Grimshaw et al. (2002) suggest that, in fact, the
private sector provider may be reluctant to innovate to
meet certain objectives, for example that of ‘joined up
government thinking’. Innovations that reduce the size
or complexity of tasks were unlikely to be seen as
attractive by the service provider since this might allow
the purchaser to bargain down the projected costs of
the contract. Taken together, therefore, the evidence as
it relates to innovation as a potential source of VFM is
limited.
TRANSACTIONS COSTS
A number of authors have drawn attention to the
transactions costs associated with the tendering
processes of PFI, which are likely to be greater for both
parties than for conventional procurements (Spackman
2002), and may be as high as £0.5 m per project
(Travers 1996). According to Hewitt (1997) PFI
provides new tasks for lawyers, such as the preparation
of scored risk analysis, which add cost. In the NHS
project Grimshaw et al. (2002) suggest that there had
been excessive transaction costs in the bidding stage
because bidders were required to submit very detailed
Examining the potential determinants of VFM

PAGE 65
plans for the project, including detailed financial and
legal arrangements, which led to the trust spending
large sums of money on advisers to help them verify
and compare competing bids.
Sussex (2001) confirms their findings, citing the Health
Select Committee (2000) to show that an average of
nearly £3 m was spent per project on external legal,
financial and other professional advice during the
procurement process by the NHS trusts involved in the
first 18 large PFI hospital schemes to be signed off. He
also notes that the high costs involved in the bidding
process were only partly related to contract price and
that concerns had been raised that these costs were
not falling as experience increased.
Hood and McGarvey’s 2002 study reinforce concerns
about the public sector’s additional costs for consultancy
fees, particularly in relation to risk. They examined nine
local authorities that were either proceeding with a PFI
or in the process of deciding to proceed and found that
they all used risk management consultants, since none
of the respondents believed that the in-house team
could adequately provide the necessary expertise.
Despite the additional costs, the authors questioned
whether the nature of the advice was appropriate. One
authority used an insurance company, one authority
used a management consultancy and seven used
insurance brokers. In two thirds of cases, these
consultants were used in addition to the in-house risk
management function to provide predominantly
insurance-related advice. There was no evidence that
they were giving advice on the more complex elements
of risk identification, evaluation and transfer.
This situation is not restricted to the UK, since Whorley
(2001) reports that in Canada much reliance was
placed on the private sector for advice in the Ontario
Government’s PFI deal to provide management for the
welfare benefit system. The issues not only involved
cash costs, but also responsibility and accountability.
He has found that the reliance on private sector advice
meant that Ontario’s Community and Social Services
Department subsequently found itself poorly positioned
to answer for the project.
Sussex (2003) reports that the time taken for selection,
bidding and contract negotiation processes may be
months, or even years, longer than for Exchequer-
financed schemes, introducing delay and extra costs to
the procurement process. The PAC has confirmed this,
criticising the lengthy procurement process and the
excessive procurement costs for both public and private
sectors in the PRIME project (PAC 1999b).
Finally, Howard (2002) makes an important point: that
the high costs incurred by private contractors in
unsuccessful bids have to be recovered later from
successful bids. Thus successful bids incorporate the
costs of past failures. Grimshaw et al. (2002) develop
this. They suggest that the private sector regards the
work and huge costs involved in successful bids as
constituting a barrier to entry, which means that in the
long run new competitors will be unable to enter the
market. If this is widespread (and recent press evidence
suggests that this may indeed be the case, with some
projects failing to attract more than a couple of bids)
then this will serve to reduce the competitive pressures
that are believed to constitute a major source of VFM
and hence to increase the cost of PFI contracts. The
clear implication is that the additional high transaction
costs in both the public and the private sectors need to
be balanced by additional savings elsewhere before
there can be an increase in VFM.
RISK TRANSFER
Issues associated with risk and its transfer from the
public to the private sector are critical to justifying VFM
and therefore an understanding of the processes that
surround risk transfer is essential for evaluating PFIs.
Post-implementation it is important to determine
whether or not risk transfer has been achieved in the
ways that the contract intended in order to decide
Examining the potential determinants of VFM

PAGE 66
whether or not VFM has been achieved. According to
Grimsey and Lewis (2002), there is little empirical
evidence to support or refute assertions that ‘risk
allocation would seem to have been achieved’.
There is, however, evidence to show that the
Government has not always succeeded in transferring
risk to the private sector, thus incurring extra costs for
the public sector when the private sector contractor has
failed to deliver the services as specified in the
contract. First, in the case of the passport delays of
summer 1999, the PAC stated:
Although the Agency transferred the risk associated
with design and delivery of the new computer system
to their private sector partners, Siemens, the
significant risk associated with ensuring continuity
and quality of service remained with the Agency. As a
result, the Agency incurred additional costs of £12.6
million in an effort to maintain services, and only
some of that sum will be recouped through the extra-
contractual payment of £2.45 million which Siemens
have agreed to pay over a number of years. The
Agency needed to be more aware of the risks they
carried, and to have prepared better contingency
plans to ensure that operating capacity was not
impaired to the extent it was. Had that been done,
this considerable extra expense could have been
avoided. (PAC 2000d, Recommendation 2)
Several interrelated points should be noted here. The
public sector bears responsibility for service delivery if
the private contractor fails for whatever reason, as the
NAO has insisted (NAO 1999d). This means that the
public sector must previously have appropriate
contingency plans in place. Such capacity may no
longer exist, and indeed some contracts preclude the
retention of such expertise, which in any event would
be an additional expense. Furthermore, penalties may
be insufficient to meet the additional costs.
In the case of the Passport Agency, the additional costs
of the project that stemmed from the failure of the
private sector contractor to deliver the service on time
fell on the public as individuals, since the Agency is
required to recover its costs via the passport fee.
Furthermore, in order to reduce waiting times,
shortcuts were implemented, which reduced security
checks and secretly transferred risk to the public. The
fact that these shortcuts were rescinded once they
became publicly known suggests that there was never
any belief that the public was prepared to accept this
risk. In both cases, the risks were transferred not from
the public sector to the private sector but to the public
as individuals, a travesty of risk transfer (Edwards and
Shaoul 2003). Other well publicised cases of IT project
failure have resulted in risk and thus costs being
transferred to the users, the public at large, the
purchasing agency and/or other public bodies.
The public sector’s contingency plans have been
inadequate. As well as the Passport Agency’s well
publicised failure, the PAC criticised the Benefits
Agency for its lack of contingency plans to cover the
risk of delay in delivery in the event that its NIRS2
project failed, despite early indications that it was
behind schedule (PAC 1998b, Recommendations 2
and 12). As in the case of the Passport Agency, the
costs were borne by the Agency, service users and
other public sector agencies, illustrating that risk
transfer did not operate as anticipated. The PAC also
criticised the Benefits Card Payment project:
The various parties identified many of the risks at
various stages, but did not always share this
information. Risks were ‘cleared’ without justification,
and ‘cleared’ risks were not well monitored and so re-
emerged. (PAC 2001a, para. 24)
Other project failures have resulted in extra costs to the
public sector, suggesting that risk transfer is not easy to
accomplish. For example, the Royal Armouries PFI
project transferred demand risk to the private sector
operator but when visitor numbers were lower than
Examining the potential determinants of VFM

PAGE 67
anticipated, the Government was forced to step in and
bail out the contractor (NAO 2001a). Such bail-outs of
PFI/PPP (others include the Channel Tunnel Rail Link
and the National Air Traffic Services PPPs), raise
questions about who really bears the risk when
essential projects fail, despite the introduction of
procedures for managing risk (HM Treasury Minute in
relation to PAC 2001a).
At least in part, these failures may be caused by the
difficulty associated with assessing the impacts of risk
transfer in practice. Akintoye et al. (1998) list the main
techniques used for risk analysis and assessment in
construction PFI projects as: risk premium, risk
adjusted discount rate, subjective probability, decision
tree analysis, Monte Carlo simulation and intuition. The
public sector may, however, lack skills and knowledge
not only of appraisal and evaluation techniques
generally, but also of risk analysis techniques. For
example, Hood and McGarvey (2002) have found that
Scottish local authorities are ill prepared to manage the
risk process inherent in PFI for a number of reasons,
including the limited involvement of risk managers in
the early stages of the PFI contracting process,
although their involvement did increase after the initial
approval of projects. They have therefore lacked the
coordinated approach to risk assessment and the more
holistic, corporate approach to risk management that
might be expected to be found in the private sector.
In this context, it is interesting to note the finding of
Akintoye et al. (1998), who have explored perceptions
of risk burdens and risk analysis and management of
PFI projects by clients (government departments),
construction contractors and lending/financial
institutions. They found that the different parties
adopted different methods and techniques in dealing
with risk assessment of PFI schemes. Hood and
McGarvey (2002) believe that the low involvement of
the risk manager/risk management function at the
decision-making stage reflect a lack of expertise, and/or
the fact that in many local authorities risk management
has been narrowly focused and interpreted as insurance
management. Therefore, given that commercial
operators have a substantial advantage over Scottish
local government in the negotiation of risk transfer, risk
transfer is likely to be poorly estimated, thereby
rendering the VFM comparisons invalid. Recently,
however, Sussex (2003) has commented that PFI has
arguably made NHS managers more aware of risk
management and better at it than previously.
There is a further point that is relevant to the control
and transfer of risk. The NAO has made clear that the
public sector must carry the ultimate responsibility for
service provision and that this is not a risk that can be
transferred. A number of authors have provided specific
instances of cases where the public has blamed the
public sector, not the contractor, for poor performance.
For example, Edwards and Shaoul (2003) show that in
the case of the Passport Agency the private sector
escaped criticism and Grimshaw et al. (2002)
comments that patients are likely to blame the trust not
the private sector provider for poor performance. The
Highways Agency recognised that there are risks arising
from public-private sector working, including risks of
damage to the Agency’s reputation from joint working.
This was highlighted in the failure of one of its
contractors to grit the roads, leading to a traffic snarl
up that left some motorists stranded in their cars for up
to 20 hours (Transport Select Committee 2003).
Since these kinds of failure have led to increased costs
for the public sector, the NAO has recommended that
public and private sector partners should consider other
actions which preserve the original allocation of risk,
but which still help the private sector partner to
improve a loss-making position (NAO 2003e).
However, the kinds of actions that would ensure such
an admirable outcome are not specified. The NAO
stressed that any additional work provided by the
public sector to the private sector should be properly
benchmarked and decisions made fully auditable, and
that public sector partners should have in place
Examining the potential determinants of VFM

PAGE 68
contingency plans in case of private sector default. The
PAC made it clear in its report Managing the
Relationship to Secure a Successful Partnership in PFI
Projects that contractors should expect to lose their
investment in PFI projects when things go wrong:
If contractors successfully manage the risks that have
been allocated to them and deliver the required
services then they will expect to earn rewards
commensurate with the level of risk they have borne.
But if they fail to manage the risks they have taken on
then they should expect that part or all of their equity
investment in the project may be lost. It will
undermine an essential commercial discipline if
contractors generally are given the impression that the
Government will always bail them out, as has occurred
in some individual cases, such as the Royal Armouries
Museum or the Channel Tunnel Rail Link. (PAC
2002a, Recommendation 3).
Although the above examples of project failure illustrate
how risk transfer is effected in practice, even some
apparently successful projects may demonstrate how
risk transfer may be changed as a result of extra-
contractual processes. The refinancing of Fazakerley
prison after the completion of the construction phase,
which most believe to be the most risky part of the
project, provides an illustration of this (PAC 2001b). In
this case, the private sector did share some of the
benefits of refinancing its debt with the Prison Service,
although the PAC noted that these could have been
shared more equitably. More importantly from the
perspective of risk transfer, the private sector’s debt
repayment profile was restructured, leaving the public
sector exposed to additional termination liabilities,
should the contract be terminated for any reason. This
increased exposure would occur when the private
sector had received most of the benefits and would be
facing additional costs associated with long-term
maintenance, thereby tempting the private sector in
adverse circumstances to ‘cut and run’. In other words,
the refinancing served to increase public sector risk and
by implication lessen that of the private sector. This is
important because refinancing of the SPV’s debt after
construction completion has now become
commonplace. The NAO (2002e) has noted that,
following extensive work by the OGC, refinancing gains
arising from both early and new PFI contracts will be
shared in a more equitable manner in future, so that
the private sector does not receive rewards that are not
commensurate with the level of risk borne.
CONCLUSION
Potentially there are a number of sources of VFM, but
the evidence outlined above about their ability to
deliver actual improvements in VFM is mixed. In
particular a number of problems may be identified.
• Competition may not be an effective source of VFM
because procurers become locked in to projects.
• The partnership between the public and private
sectors may not deliver good contract management.
• Innovation in the design of buildings has been
limited.
• PFI generates transactions costs that need to be
covered before PFI can hope to deliver improved
VFM.
• The public sector ultimately carries responsibility for
service delivery and so risk transfer may not always
occur in the ways in which the contract intended.
The literature indicates that PFIs may bring both costs
and benefits compared with publicly financed
alternatives but the evidence is finely balanced (Sussex
2003) or often unclear (Spackman 2002). The PAC
drew the following main conclusions from its summary
analysis of PFI projects Delivering better Value for
Money from the PFI (PAC 2003e).
Examining the potential determinants of VFM

PAGE 69
• There are potential advantages as well as potential
drawbacks to using PFI.
• Although there are examples of good practice, many
departments need to get better at procuring and
managing contracts.
• Although PFI is an addition, not an alternative, to
the public sector capital programme, too often it is
seen as the only option.
• Departments are too willing to bail out PFI
contractors who get into trouble.
Taken together, these findings show that the
measurement and actual achievement of VFM has
proved more difficult than PFI’s proponents expected. It
is not clear that there is a useful way of measuring a
concept as ambiguous as VFM, and the Government’s
methodologies are likely to have only limited value. It
appears that additional evidence should be sought
about projects’ outcomes.
Examining the potential determinants of VFM

PAGE 70
Examining the potential determinants of VFM
PAGE 71
5. DBFO and roads
Such evidence as exists, showsthat private finance is notunproblematic in areas that are ofinterest to this study: cost,accountability and transparency.
HISTORY AND DEVELOPMENT 73
OBJECTIVES 75
THE EVALUATION LITERATURE 78
FINANCIAL ANALYSIS OF DBFOS IN ROADS 92

PAGE 72
DBFO and roads

PAGE 73
This chapter presents an analysis of the use of the
Private Finance Initiative in roads, where it is known as
DBFO. It has several sections. The first explains the
origins, development, nature and scale of DBFO. The
second considers the objectives of the policy. A third
section reviews the official reports on DBFO in roads,
the research literature and other commentaries as they
relate to such projects and the Highways Agency’s
response. The fourth section presents an analysis of
DBFO. Although DBFO contracts may take various
forms, the first tranche of projects signed by the
Highways Agency are all roads projects and these first
eight are the subject of our investigation. We present a
financial analysis of how DBFO operates in roads, its
costs, VFM, risk transfer and accountability. It is based
upon the Highways Agency’s financial statements, with
some additional input from the Agency, and the private
sector’s annual reports and accounts.
HISTORY AND DEVELOPMENT
The use of private finance in public infrastructure in
Britain since the 1980s has to be seen in the context of
the then Conservative Government’s wider policy of
reconstituting government as the procurer and regulator
rather than the provider of services. In the field of
transport, numerous measures were taken to liberalise
transport, reduce regulation, remove the barriers that
prevented the private sector from entering public
transport, including air, sea ferries, coach, bus and rail,
and to create a market for transport.
The use of private finance, which began in the 1970s
and 1980s in the international arena, had by the
1990s gained some momentum in the transport, power
and water sectors. The UK was one of the first
countries to turn to private finance, with the DoT being
the first department to use it to any significant degree.
By 1994, the UK had made more use of private
finance in transport, by far the largest sector, than any
other country apart from China (Levy 1996). Early
transport projects included: the Channel Tunnel (signed
in 1985 and opened in 1993), the Queen Elizabeth II
toll bridge over the Thames at Dartford (signed in 1987
and opened in 1991), the second Severn Bridge
(signed in 1990 and opened in 1996), the Skye Bridge
(signed in 1991 and opened in 1995), the Birmingham
North Relief Road, Britain’s first ever privately owned
inland toll motorway (signed in 1992 and opened in
2003), the Channel Tunnel Rail Link (signed in 1996)
and the Croydon Tramlink (signed in 1996 and opened
in 2000). All these were to be new builds, usually
privately owned, and were to be privately managed
with user charges. Other recent projects included
several light rail systems, usually municipally owned.
The 1990 New Roads and Street Works Act had given
the Secretary of State for Transport, ie central rather
than local government, the power to initiate new roads
and bridges and to charge users directly for new, but
not existing, roads and bridges. This represented a
significant change at the time because although a
handful of bridges and tunnels owned by local
authorities were tolled, those run by central government
were free.
However, the Labour Government has taken these
developments a step further. It has introduced
legislation that allows local authorities to charge road
users directly for existing roads through the use of a
congestion charge. It has signed large-scale projects
that include the National Air Traffic Services and
London Underground PPPs, both of which
organisations already charged for their services, and
rescued the privately financed Channel Tunnel Rail Link
with a loan guarantee. By early 2003, the capital value
of signed contracts in the UK transport sector, including
both central and local government, was £30 billion, far
exceeding any other functional area (PPP Forum
2003c).
In the context of roads, prior to the early 1980s when
public investment had fallen to about £4 billion from its
peak in 1975 of about £6.5 billion (in 1995 prices)
following the 1976 cuts (DoT 2003), the DoT carried
DBFO and roads

PAGE 74
out much but not all infrastructure design,
commissioning the construction or enhancements from
the private sector. Trunk roads and motorways were
operated and maintained by the local authorities as the
Department’s agents, which in turn used their own
Direct Labour Organisations (DLOs) to carry out such
work. From the early 1980s, the design work
increasingly went to private consultant engineers.
Under the 1981 Direct Labour Organisations Act, local
authorities were required to subject their operations
and maintenance to compulsory competitive tendering
(CCT) and outsource the work to private contractors
when their prices were lower than the DLO’s, in line
with the Government’s wider policy of ‘rolling back the
state’. Thus, by the mid-1990s, the design,
construction, operation and maintenance, but not the
management or financing of the main network, were
carried out by the private sector. In 1997, the number
of agency areas was reduced to 24 and management
too was outsourced. Local authorities ceased to act as
the Highways Agency’s agents and the management of
road operation and maintenance in the 24 areas was
put out to private contractors on seven-year contracts
with incentive schemes. Since then the number of
maintenance areas has been reduced to 20 and was
expected to be reduced to 14 once an operational
review was put into effect (Rowsell 2001).
Although the early private finance transport projects
were for new builds, the Conservative Government
wanted to extend this to improving and maintaining
existing roads. It outlined its proposals to use a form of
PFI in its Green Paper ‘Paying for Better Motorways’
(DoT 1993) and ‘Design, Build, Finance and Operate
Concessions for Trunk Roads and Motorways’ (DoT
1994). Under such DBFO concessions, the private
sector would be invited to extend or enhance a road to
the Department’s requirements, operate and maintain it
and a further stretch of road for a 30-year period. The
30-year period was chosen because the payment
mechanism had to enable the debt finance, which
typically has a repayment period of 20 years, to be
repaid and ensure a return to the equity investors. Road
users would not pay directly for the use of the roads.
Instead, the Government would pay the contractor on
the basis of a shadow toll. The system of shadow tolls
was designed by the Government’s advisers, Price
Waterhouse, to allay the private sector’s fears that
direct tolls would arouse political opposition, making
DBFO unviable. Payments would be based on the
number of vehicle kilometres travelled by short vehicles
(cars) and long vehicles (heavy goods vehicles), in a
series of bands, which would be capped at a certain
level. The Government saw the system of shadow tolls
as a precursor for tolling the motorways as set out in its
1993 Green Paper. Indeed the contracts have
significant provisions in them related to the transition to
user paid tolls (Abadie and Larocca 2003).
The DBFO roads projects were selected from a list of
completed design projects that had already obtained
planning permission and had been languishing on the
shelf because of lack of public funding. They were
chosen as a way of exploring different approaches to
DBFO road concessions, and were not necessarily the
most appropriate for private finance. Of the ten
proposed DBFOs announced in 1994, eight went
ahead, albeit some in a slightly different form than
originally announced. Another 11 road DBFOs planned
for 1995 and 1996 were held over. According to Levy
(1996), one of the main accounting firms accused the
Government of trying to offload too much risk onto the
private sector thereby reducing enthusiasm for many of
these projects, although the NAO (1998a) reported
considerable enthusiasm on the part of the larger
consortia despite misgivings about the cost of bidding.
The procurement process for the first eight DBFOs took
place over a protracted period between 1993 and 1996,
with a further one in Scotland, making a total of nine
DBFO projects signed by the Conservative Government.
In the meantime, in 1994 the DoT established the
Highways Agency, which would manage the 6,500
miles of motorway and trunk network, including the
DBFO and roads

PAGE 75
DBFO concessions for trunk roads, as part of the DoT’s
policy of establishing executive agencies responsible for
the implementation of Government policy. The Scottish,
Welsh and Northern Ireland Offices would manage any
concessions in their regions. The Secretary of State for
Transport retained responsibility for deciding which
large schemes would go ahead, the policy on road user
charging and the development of the use of private
finance for roads, and the methodology to be used in
the appraisal of road improvement schemes (Highways
Agency 1999a, 1999b).
As Table 5.1 (see page 76) shows, although DBFO
largely came to a halt after the Labour Government
came to power in 1997, pending a wider-ranging review
of transport policy, a further five projects have reached
financial close, including three now managed by local
authorities and the Welsh Office. Table 5.2 (see page 77)
shows the value of all maintenance and construction
projects (DBFO and non-DBFO) signed by the Highways
Agency between 1992 and 2001 (ie for trunk roads in
England only, excluding local authorities and the
regions). The construction value of the eight DBFO
projects signed by the Agency in 1996 accounted for
about 35% of all new construction projects between
1996 and 2001. Thus DBFO was by no means the
only form of finance for construction projects. The
Government’s national 10-year transport plan, Transport
2010 (DETR 2000) has allocated £21 billion to the
strategic highway network, 25% of which will involve
private finance. According to Highways Agency
personnel, this investment is likely to focus on
motorway widening contracts rather than further road
construction or maintenance, with three important
motorway expansion schemes, each worth about £1.5
billion, under consideration for DBFO or some other
form of private finance. Taken together, although
successive governments have been keen to expand
DBFO in roads, a policy that has attracted little political
opposition or even attention, it is significant that there
has not been such marked continual expansion in other
areas such as health.
OBJECTIVES
The Highways Agency identified the five most
important objectives for the DBFO projects (NAO
1998a):
• to maximise value for money by allocating risks
appropriately between the public and private sectors
• to ensure that the new roads would be constructed,
operated and maintained with minimal adverse
impact on the environment, maximum benefit to
road users and minimal financial contribution from
the public sector
• to promote innovation in technical, operational,
financial and commercial arrangements
• to test the enthusiasm of the market for DBFO roads
contracts across a range of different roads projects
• to develop a private sector road operating industry.
Thus the Government conceived DBFO contracts,
together with its proposals on motorways, as part of a
wider policy of introducing road pricing and creating a
market for roads and a private road operating industry.
These were objectives that had the potential, at least,
to conflict with the desire to achieve better VFM than
under conventional procurement.
Given that there is a direct relationship between the
way a road is designed and constructed and its whole-
life operational costs, the Government expected that the
private sector would consider its obligations over the
30-year life of the contract, together with the
contractual requirement to return the road to the public
sector with a specified life expectancy at the end of that
period. Compared with the previous system of letting
contracts for the separate tasks that are needed to
create, operate and maintain a road, it was expected
that this integrated approach would result in lower
DBFO and roads

PAGE 76
Table 5.1: DBFO schemes
Contract Capital Length (km) andScheme award DBFO company cost (£m) summary description
Highway Agency schemes
Tranche 1
A69 Newcastle– 01/96 Road Link Ltd 9 84kmCarlisle Construct 3.5km by-pass
A1(M) Alconbury– 02/96 Road Management 128 21kmPeterborough Services (Peterborough) Ltd Motorway widening
A417/A419 Swindon– Road Management 52kmGloucester 02/96 Services (Gloucester) Ltd 49 Three new sections of road
M1–A1 Motorway Link 03/96 Yorkshire Link Ltd 214 30kmNew motorway, motorwaywidening and new interchange
Tranche 1A
A50/A564 Stoke– 05/96 Connect (A50) Ltd 21 57kmDerby Link Construct 5.2km by-pass
A30/A35 Exeter– 07/96 Connect Ltd 75 102kmBere Regis Construct two new sections
and 9km by-pass
M40 Denham– 10/96 UK Highways (M40) Ltd 65 122kmWarwick Motorway widening
A168/19 Dishforth– 10/96 Autolink 29 118kmTyne Tunnel Concessionaires (A19) Ltd Online widening
Tranche 2
A13 Thames Gateway* 04/00 Road Management 146 24kmServices (A13) Ltd Online upgrade and
improvement schemes
A1 Darrington– 09/02 Road Management 210 22kmDishforth Services (Darrington) Ltd Construct two new sections of
motorway and communications
Scottish Office schemes
M6/A74 12/96 Autolink 96 90kmConcessionaires (M6) Ltd Construct new sections of
motorway and trunk road
Welsh Office schemes
A55 Llandegai–Holyhead 12/98 UK Highways (A55) Ltd 120 50kmConstruct section of trunk road
Local Authority schemes
A130 (A12–A127) 10/99 County Route 75 15kmConstruct section of trunk road
Newport Southern 06/02 Morgan Vinci Ltd 50 9.3kmDistributor Road New river crossing
Total 1,300 796.3km
Source: Department of Trade and Industry (2002).
* in July 2000, project responsibility passed from the Highways Agency to Transport for London.
DBFO and roads
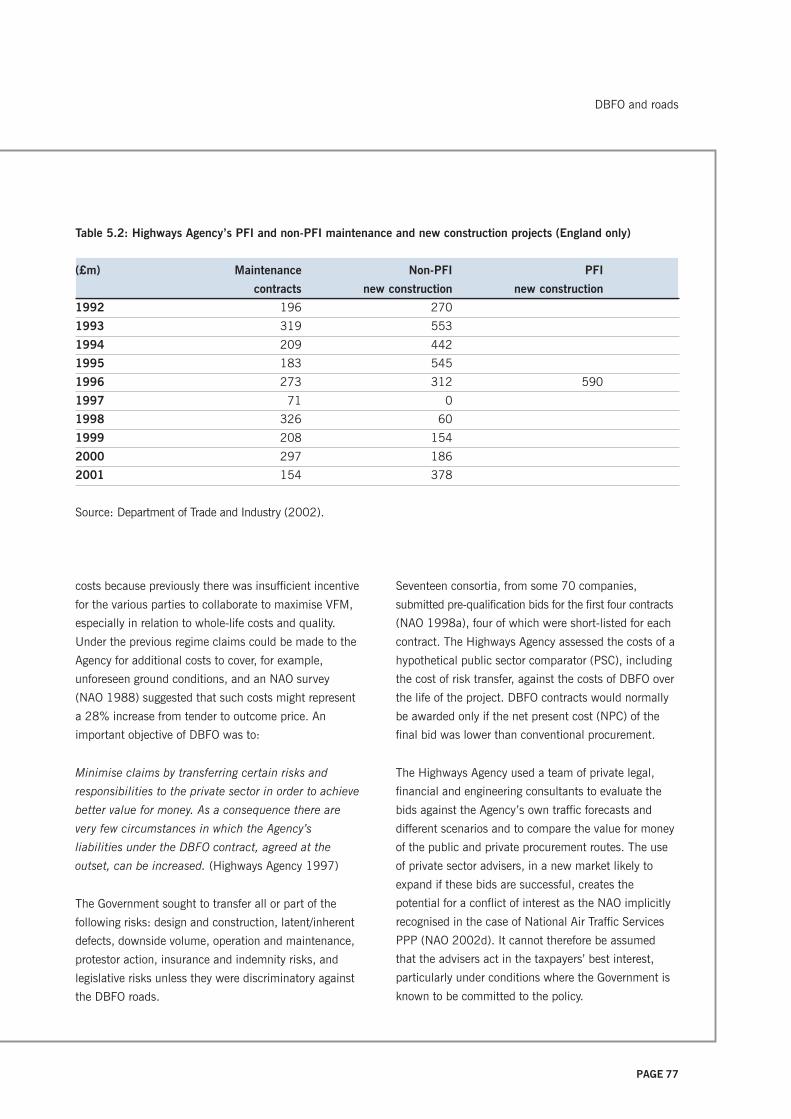
PAGE 77
Table 5.2: Highways Agency’s PFI and non-PFI maintenance and new construction projects (England only)
(£m) Maintenance Non-PFI PFI
contracts new construction new construction
1992 196 270
1993 319 553
1994 209 442
1995 183 545
1996 273 312 590
1997 71 0
1998 326 60
1999 208 154
2000 297 186
2001 154 378
Source: Department of Trade and Industry (2002).
costs because previously there was insufficient incentive
for the various parties to collaborate to maximise VFM,
especially in relation to whole-life costs and quality.
Under the previous regime claims could be made to the
Agency for additional costs to cover, for example,
unforeseen ground conditions, and an NAO survey
(NAO 1988) suggested that such costs might represent
a 28% increase from tender to outcome price. An
important objective of DBFO was to:
Minimise claims by transferring certain risks and
responsibilities to the private sector in order to achieve
better value for money. As a consequence there are
very few circumstances in which the Agency’s
liabilities under the DBFO contract, agreed at the
outset, can be increased. (Highways Agency 1997)
The Government sought to transfer all or part of the
following risks: design and construction, latent/inherent
defects, downside volume, operation and maintenance,
protestor action, insurance and indemnity risks, and
legislative risks unless they were discriminatory against
the DBFO roads.
Seventeen consortia, from some 70 companies,
submitted pre-qualification bids for the first four contracts
(NAO 1998a), four of which were short-listed for each
contract. The Highways Agency assessed the costs of a
hypothetical public sector comparator (PSC), including
the cost of risk transfer, against the costs of DBFO over
the life of the project. DBFO contracts would normally
be awarded only if the net present cost (NPC) of the
final bid was lower than conventional procurement.
The Highways Agency used a team of private legal,
financial and engineering consultants to evaluate the
bids against the Agency’s own traffic forecasts and
different scenarios and to compare the value for money
of the public and private procurement routes. The use
of private sector advisers, in a new market likely to
expand if these bids are successful, creates the
potential for a conflict of interest as the NAO implicitly
recognised in the case of National Air Traffic Services
PPP (NAO 2002d). It cannot therefore be assumed
that the advisers act in the taxpayers’ best interest,
particularly under conditions where the Government is
known to be committed to the policy.
DBFO and roads

PAGE 78
DBFOs in roads have generally had a low public
visibility and have been accompanied by little public
discussion. Unlike the full business cases for hospitals
and schools, those for DBFOs that establish the VFM
case and show whether the schemes are economically
sound and affordable are not in the public domain,
even after financial close. Neither are the terms of the
contract, including the incentives and penalties for
failing to operate and maintain the network. According
to the NAO (1998a), it was the Government that
required the private sector to refrain from publishing
the financial details, which raises questions about
public accountability and scrutiny. It is therefore
impossible to make an independent assessment of the
expected VFM case and reliance must be placed upon
the NAO’s studies, generic research on the financing of
transport projects and any case studies made with
access to detailed information.
THE EVALUATION LITERATURE
The literature relating to DBFOs and their evaluation
derives from several sources: academic research
papers, official reports and commercial reports
produced for investors. We consider each in turn,
including the Highways Agency’s response to some of
the issues highlighted by the official reports, which
provides indirect evidence of the VFM implications of
the early projects.
Research papers
Although there are books, papers and articles about
private financing of infrastructure in general and roads
in particular, most of these simply describe the policy,
its objectives, the procurement process and particular
projects, often in very glowing terms, and sometimes
point out actual or potential problems (see for example,
Miquel and Condron 1991, World Bank 1994, Levy
1996, Ridley 1997, Glaister 1999, Debande 2002,
Grimsey and Lewis 2002). A few of these were
commissioned or published by institutions that have
played an active role in promoting these policies, such
as the World Bank and OECD, and their view is that
private finance can play a very positive role in
infrastructure provision. There are few studies, however,
that provide a soundly based theoretical justification or
sufficient detailed financial evidence to make a
judgement about the value of private funding of
transport infrastructure or DBFOs to the procurer, either
before or after implementation. Indeed, the literature is
characterised by little evidence about either the
financial plans and outcomes or the performance of the
contracts.
In part, at least, this is because of the lack of
information in the public domain, owing to Government
restrictions and commercial sensitivity. But Mackie and
Preston (1998) argue that appraisal of transport
projects in general is far from straightforward and
caution that critical judgement is required at all stages.
They identified twenty-one sources of error and bias
with evidence from the UK experience of cost–benefit
appraisal of transport projects for implementation.
Some of the most important were the prior
commitment of the politicians and/or scheme
promoters and the tendency to overestimate the
benefits and underestimate the costs.
The empirical studies which do exist do not provide
conclusive evidence of the superiority of private finance.
In their international survey of large-scale transport
projects, Flyvbjerg et al. (2003) found that cost and
time overruns were by no means confined to the
publicly funded projects. The projects’ promoters
underestimated the costs and overestimated revenues,
they underestimated the environmental impacts and
overestimated the wider economic and social benefits.
The authors deduce that these were not mistakes but
deliberate attempts to get the projects off the ground,
and that all the interested parties colluded in the
process: the sponsors, their commercial consultants,
the financiers, the public sector bodies and
governments. In so doing, the promoters spawned
projects that were enormously risky and whose risks
DBFO and roads

PAGE 79
and costs were concealed from those who ultimately
bore the cost, either directly or indirectly. If the
outcomes had been known, the projects would not
have been undertaken, or would have been done
differently, or other projects would have been carried
out in their place. The authors point to the lack of
accountability throughout the project life cycle, not the
lack of technical skills or sound data, important though
these were, as the cause of the problem.
Mills (1991) makes a critical appraisal of the practical
implementation of two Australian cases, the Sydney
Harbour Tunnel and the new facilities at two
corporatised airports, Darwin and Alice Springs. Mills’
description of the Sydney Harbour Tunnel, built and
managed by a private company, although not strictly a
PFI/PPP arrived at by competition between bidders, is
of interest. In essence, the company acted as an agent
for the New South Wales Government, which bore most
of the risks and in the end paid all the costs. The
commercial arrangements failed to improve the
standards of economic appraisal, making it easier to go
ahead with projects irrespective of whether they were
economically viable since they were paid for via a
stream of annual payments rather than up-front and
financed by government debt. These limitations were
exacerbated by the lack of public scrutiny, fostered by
the Government’s presentation of the project as a fait
accompli and complex, not to say abstruse,
documentation. Mills concluded that although there are
difficulties in ensuring adequate arrangements for
private ownership and control of such projects, there
was a stronger case for the private management of
construction.
Silva (2000), reporting for the World Bank, which has
vigorously promoted the turn to the private sector for
construction, management and maintenance of toll
roads, was very supportive of the approach. She notes
that although shadow tolling had been used in some
industrial countries such as Greece, Portugal and the
UK, it had not been tried in developing countries. Her
report analyses the main trends in private participation
in toll roads in developing countries. She notes, without
citing sources or providing details, that the majority of
projects have been successful and that only a minority
of projects have had problems. Of the 279 projects
awarded during the 1990s, 21 projects in Hungary,
Mexico, Indonesia and Thailand – accounting for $9.5
billion, approximately 10% by value – had to be taken
over by the government. In other (unspecified) cases,
performance had been poor and contracts had had to
be renegotiated. Factors contributing to the lack of
success included: overestimation of traffic, inflexible
contracts that constrained the private sector’s ability to
manage market and construction risks, inadequate
strategic network planning, the private sector’s
preference for construction rather than operation, and
voters’ dislike of toll charges. In other words, the
contracts had failed because they were, for various
reasons, simply not profitable enough for the private
sector and/or the public, which was opposed to them,
and the government was forced to close them down.
Despite this, she concludes that governments need to
address why these projects have failed and to ensure
that the projects are made more attractive to the
private sector and the electorate. In effect, governments
have somehow to overcome the financial constraints of
the sector that have meant that roads have never, in
the modern era, been run for private profit.
Estache, Romero and Strong (2000) have written
extensively for the World Bank, outlining the benefits of
private finance in roads and the regulatory, economic
and financial conditions that enable private finance to
work well, implicitly acknowledging that not all projects
have been successful. Freeman (2004) reports that the
World Bank has not undertaken formally a complete
evaluation of the road sector, although there have been
individual highway evaluations and specific Bank
studies of tolls roads. It has evaluated 75 roads and
highways projects and of these 64, or 83%, were rated
satisfactory, although no evidence or sources are cited.
DBFO and roads
PAGE 80
In contrast to much of the literature, some of which is
written, commissioned or published by interested
parties and is supportive of the use of private finance
but provides little systematic evidence, the Australian
academic accountants, Walker and Con Walker (2000),
have compiled evidence from a range of secondary
sources on the use of private finance in infrastructure
projects. They are not persuaded that the huge cost of
‘take or pay’ contracts or Build, Own, Operate, Transfer
(BOOT) schemes outweighed the benefits. Under a
‘take or pay’ scheme, the government paid a minimum
payment to the private sector for constructing the
infrastructure asset irrespective of usage, in effect
guaranteeing the cash flow to service the debt. Under a
BOOT scheme, the private sector builds, owns and
operates the asset in return for all or part of the
associated revenue stream for a defined period, after
which it transfers the asset back to the public sector.
Walker and Con Walker observe that since these
schemes involved off budget financing, their
arrangements were not only very popular with the
private sector but also served to conceal the full scope
and scale of the government’s financial dealings with
the private sector from both the taxpayers and financial
markets.
They note that evidence of the private sector’s profits
from such schemes – and hence some indication of the
financing costs to government of ‘privatising’
operational responsibility for infrastructure development
– was hard to come by. Such evidence as existed was
typically ‘snippets’ in the financial press, which included:
• 1998 Australian press reports that the private sector
acknowledged a net return of 11–13% on BOOT
projects, which the authors think could be
conservative
• the Melbourne City Link project’s prospectus, which
anticipated that initial investors would get a real
post-tax return over the life of the project of 17.5%
• according to NSW’s Auditor-General, investors in
Sydney’s M2 motorway would get a pre-tax return of
24.4% per annum if traffic forecasts were valid.
They cite an analysis by one of the authors of the
feasibility study for Sydney Airport Link, which
suggested a ‘real’ internal rate of return of 21% per
annum over the 30-year project life. Although the
subsequent deal was negotiated several points below
first estimates of 21%, this was nevertheless a very high
cost of finance for the state government. The authors
also raise the point that the consortium made additional
profits through its acquisition of land for development
near the sites of the new rail stations – the classic way
that railways have generated profits. Walker and Con
Walker report that the period of BOOT schemes has
been getting longer, with standard clauses to extend the
contract if the operator have not enjoyed a cumulative
minimum rate of return.
As well as collating information about the financial
returns to the private sector, Walker and Con Walker
also report that the NSW Auditor-General has raised
concerns about the lack of ‘auditable controls and
guidelines’ for these schemes. This could lead to a
rapid over-investment in toll roads simply because they
produced a stream of cash flows – little different in
essence from the securitisation of receivables – at the
expense of other potentially more socially useful
schemes that could not generate such cash flows. Such
a deal-driven process could, they argue, distort the
planning process.
They are also concerned that it is difficult to find out
the extent of such off-budget deals, in part at least
because it is difficult to measure what governments do
not wish to disclose. In the absence of reporting by
government, reliance must be placed on a wide range
of sources, including reports by the central bank, state
auditor generals and other public agencies. Walker and
Con Walker are particularly concerned about the lack of
transparency and accountability as off budget financing
DBFO and roads

PAGE 81
means that the scale of public liabilities – 20% of
NSW’s gross liabilities in 1993 – is hidden from public
view. The private sector has resisted publication of the
contractual arrangements, arguing that the
arrangements were commercially sensitive and/or
contained significant intellectual property, despite the
fact that such schemes used public assets and may
have had a government-controlled natural monopoly.
Such projects have typically by-passed traditional
public scrutiny because they did not involve budgeted
expenditure and governments had colluded in this in
order to prevent the public from realising just how
profitable these schemes were. In Victoria, for example,
the Freedom of Information Act was explicitly amended
to exclude one such deal. In the absence of public
scrutiny, these projects may burden governments with
hidden subsidies, diversion of revenue streams and
loan guarantees whose impact on public finance may
not become apparent for many years.
In short, although there are numerous studies
supportive of the use of private finance in roads, there
is very little in the way of detailed evidence about either
its ex ante financial appraisal or ex post financial
evaluation in the literature or about the operation of the
post-implementation phase of road tolls. Such evidence
as exists shows that it is not unproblematic in areas
that are of interest to this study: cost, accountability
and transparency.
Official reports
The first publicly available evaluation in the UK
emanates from the NAO (1998a) which carried out a
review of the first four DBFOs shortly after financial
close, describing the pre-tendering process, the level of
competition, method of ranking and selecting the
bidders, the bidding process and the bids themselves.
It noted that the short-listed bids were not necessarily
the cheapest but the ones that were most likely to be
financially sound and thus likely to be deliverable and
that, compared with traditional procurement, the
process was time consuming and very costly. The DoT
and Highways Agency spent £8.2 m on legal and
financial fees that would not normally have been
incurred, although the successful bidders spent
typically more than £3 m per contract, with the 12
short-listed bidders spending up to £2 m. This and the
high cost of private finance, which the NAO did not
detail, meant that the VFM case rested upon risk
transfer, innovation and efficiency gains. The nature of
the projects chosen and the fact that they had already
received planning permission meant, however, that the
projects were less risky than might otherwise have
been the case and there was little possibility for
innovation.
Although the NAO considered that most of the risks
were allocated to the party best able to manage them,
it criticised the payment mechanism, shadow tolls. This
transfers the risk of falling demand (lower traffic
volume) to the private sector, which has no means of
influencing the volume of traffic using the roads,
although their revenues and costs depend upon it.
Conversely, if volumes rose more than anticipated, the
government could face higher than expected charges
This is important because traffic flow forecasting is not
an exact science, making it difficult to forecast
revenues over the life of the contract. Thus it is the
government that bears the upside demand risk in the
context of rising traffic. The NAO reports that the DoT
has not been very successful in its predictions of traffic
flows for road construction projects. The DoT is
‘reasonably satisfied’ if the original traffic flow forecast
for the first year of operation is within 20% of the
actual flow for that year (NAO 1988, p. 2). Out of 41
road schemes analysed, 22 were within this limit. The
19 schemes for which there was a much wider
variation contained examples where differences
between forecast and actual flows ranged from –50 to
+105%. Where traffic volumes have been significantly
lower than expected, these are often because they are
new road schemes that are inherently harder to predict
and/or depend upon other developments. For example,
in the case of the Humber Bridge – a new road scheme
DBFO and roads

PAGE 82
– where traffic flows were only 25% of those forecast in
the opening year, this was the result of a change in the
regional economy and feeder roads that were never
built. Flyvbjerg et al.’s study (2003) shows that actual
traffic forecasts were on average 9% higher than
forecast, in the context of rising traffic.
In Britain, traffic on motorways and main trunk roads
rose by 36% and 24% respectively between 1992 and
2002, with some regional variation (Department of
Transport 2003). Thus since the DBFO schemes were
to widen or improve existing important trunk roads and
motorways, or connect a main road and motorway, the
private operators faced little downside risk. Conversely,
it means that a contract whose payments are based on
the Highways Agency’s estimates of traffic flows could
turn out to be very costly for the Agency, both because
of poor estimation and rising traffic volumes. This
suggests that transferring demand risk is inappropriate
since volume is determined by external factors over
which the private operators have no control. Thus, as
the NAO explained, shadow tolls introduce a new risk
that increases costs, offsetting other possible gains.
Low volumes, resulting from, say, high petrol prices or
policies aimed at encouraging public transport, would
undermine the financial viability of the project, lead to
financial collapse and the need to bail out the
concessionaire and/or its bankers, and conversely, high
volumes could create affordability problems for the
Highways Agency. Furthermore, although the private
operators have a commercial interest in volumes rising,
this may conflict with wider transport and
environmental policies.
The NAO found that the Highways Agency had
overstated the benefits of using DBFO since it had used
an 8% discount rate to compare the bids, the rate
traditionally used in the DoT for comparing transport
projects for road versus rail decisions. Since the
decision was whether to use public or private finance,
the 6% discount rate should have been used to
compare the cost of the public and privately financed
options as required by the Green Book (HM Treasury
1991). Since discounting in general favours a stream of
payments spread over 30 years rather than large up-
front expenditure with subsequent small payments for
operations and maintenance, the higher the discount
rate, the greater the advantage to the scheme, with
payments spread evenly throughout the lifespan of the
project. The higher discount rate therefore increases the
apparent advantage of the privately financed option
relative to the public alternative.
Table 5.3 presents the NAO’s data comparing the
DBFO contracts with the PSCs. A comparison of lines 9
and 12 of Table 5.3 shows that at the 6% rate
recommended in the Green Book for investment
appraisal (HM Treasury 1991), only two met the VFM
criteria, the M1–A1 and the A1(M), while the A419/
A417 and A69 projects did not. In other words, under
the Government’s own financial criteria, if not the
DoT’s, which was changed in 1997 to 6%, only two of
the projects should have been allowed to proceed.
When the composition of costs is examined more
closely (line 15 of Table 5.3), it is clear that two
projects, the A419/A417 and the A69 have low capital
costs in both absolute terms and relative to total project
costs. A comparison of lines 9 and 10 shows that
conventional procurement was cheaper than DBFO for
each project. It was only after risk transfer (line 11)
was factored into the PSC (line 12), that two of the
four projects had a lower NPC than conventional
procurement. Line 13 shows that risk transfer was the
balancing factor, accounting for 31% of the largest
project’s PSC (the M1–A1) and 12% of the smallest
(the A69). Even after factoring in risk transfer, however,
two of the projects were still more expensive than
conventional procurement. Only the two largest
projects, the M1–A1 and A1(M), the costs of which
were predominantly construction costs (76% and 67%
respectively), were VFM (see line 15). This could be
expected since the discounting methodology favours
projects where costs arise later rather than sooner. In
DBFO and roads

PAGE 83
other words, under DBFO, the high capital costs are
spread over 30 years, compared with the need to pay
them upfront with conventional financing.
The NAO did not explain either the basis of the risk
assessment methodology or the relative weighting of
different elements of the risk assessment. It did note
that the majority of risk transfer relates to the
construction phase of the projects, without apportioning
the risk between the construction and operational
phases. This is contradicted, however, by line 16 of
Table 5.3, which shows that the discounted value of
the risk transfer (at 6%) as a percentage of the DBFO’s
construction costs varied from 85% to 31% of
construction costs. The A69 project, the one with the
lowest proportion of new build, had the highest amount
of risk relative to its capital cost (85%), something that
the NAO did not explain. Neither did the NAO explain
why the projects with the largest absolute risk transfer
(line 11) were better VFM, rather than simply more
costly. The somewhat subjective nature of risk transfer
methodology may be inferred from the fact that the
NAO noted that if the Highways Agency had informed
the bidders that a 6% discount rate was to be used, the
bids might have been constructed differently.
Nonetheless, if the main risk is indeed construction
risk, then this means that the Highways Agency is
paying a significant premium over and above the
construction cost to ensure that the project is built to
time and budget.
Finally, the NAO concluded that there were such large
uncertainties inherent in quantifying the costs of the
public sector comparator that it was very difficult to
Table 5.3: Value for money and risk transfer for the first four DBFOs
Line (£m) M1–A1 A1(M) A419/A417 A69 Total
Using 8% discount rate
1 NPC of shadow toll (DBFO) 232 154 112 62 560
2 NPC of traditional procurement 238 167 96 50 551
3 NPC of PSC risk transfer 106 37 27 7 177
4 NPC of total PSC 344 204 123 57 728
5 NPC risk as % PSC 31% 18% 28% 22% 24%
6 Capital cost (cash) 214 128 49 9 400
7 Capital cost as % DBFO 92% 83% 43% 15% 71%
8 NPC risk as % of capital cost 50% 29% 55% 74% 44%
Using 6% discount rate
9 NPC of shadow toll (DBFO) 282 192 140 78 692
10 NPC of PSC without risk transfer 257 182 106 58 603
11 NPC of PSC risk transfer 115 40 31 8 194
12 NPC of total PSC 372 222 137 66 797
13 NPC risk as % PSC 31% 18% 23% 12% 24%
14 Capital cost (cash) 214 128 49 9 400
15 Capital cost as % DBFO 76% 67% 33% 12% 64%
16 NPC risk as % of capital cost 54% 31% 63% 85% 49%
Source: National Audit Office (1998a).
DBFO and roads

PAGE 84
rely on it. The implication is that most of the ‘large
uncertainties’ lie with forecasting the cost of risk
transfer rather than with construction, operational and
maintenance costs. Although the report focused on the
expected costs, such reservations do raise questions as
to whether the DBFO projects were more economical
than public procurement and would in practice be
cheaper over the life of the project.
The NAO reported that the construction phases of the
projects were complete and that they had been built to
time and budget in contrast to conventional
procurement, which had a history of cost and time
overruns, although these were not quantified or
evidenced. It then examined the arrangements for
monitoring the contracts and noted that the Highways
Agency was dependent upon the contractors’ own
quality assurance systems and had not, at the time of
financial close, developed its own plans for auditing
them. It noted that the accuracy of the shadow
payments depended not only on the estimates of traffic
volumes that would need verifying but also on the
reconciliation with the estimates paid in the previous
year, which would need indexing. Thus, there was a
need for careful audit of the payment mechanism.
The NAO reported on a number of features of the
contract relating to the allocation of risks between the
Highways Agency and other parties to the contract.
First, there were specific clauses built into each
contract to prevent roads being handed back in a poor
condition and to ensure that the NPV of net cash flow
remained unaltered should changes be required that
would lead to adjustment of toll levels. Secondly, there
was a system of penalty points so that, if contract
performance fell below that specified, an accumulation
of such penalty points could lead to the banks stepping
in and replacing the contractor, subject to the approval
of the Highways Agency. Failure to appoint a
satisfactory replacement could lead to the Highways
Agency terminating the contract. Thirdly, should the
private sector default on its loans for whatever reason,
the banks would have to take operational control and
appoint a replacement contractor, subject to the
approval of the Highways Agency. It is unclear,
however, how this and any subsequent renegotiation of
the contractual terms would affect the Agency’s costs
and risk allocation.
In the case of the East Lothian schools contract where
the SPV’s parent construction company became
insolvent during the construction phase of the project, it
was claimed that: ‘ . . . the contract structure together
with the commitment of the interested parties to the
project ensured that the public sector was insulated
from the resultant cost increases and this stands
favourable comparison with traditionally procured
projects faced with the same scenario’ (Methven 2004,
p. 45). However, a close examination of the changes in
the risk allocation contradicts this assertion and the
education authority’s insistence that no increases in
cost or changes in risk allocation would be allowed
(Methven 2004). Although costs rose, it is unclear who
bore them.
Lastly, the Government guarantees the Highways
Agency’s payments to the DBFO companies, in effect
underwriting their debt and reducing their risks. This
raises questions about who is really bearing the risk of
default.
In short, the NAO report provides very limited financial
information about the schemes. In general it describes,
rather than analysing or criticising, the evidence it does
present and then fails to bring out the significance of its
findings, particularly in relation to the payment
guarantees and demand and default risk. Although the
NAO believed that it was difficult to compare the costs
of the alternatives methods of financing the schemes,
given all the measurement uncertainties, it did not
explicitly reject the methodology. Although it noted that
two of the projects were not VFM at the 6% rate, it
seemed to excuse the absence of VFM on the basis that
the Highways Agency was charged with developing the
DBFO and roads
PAGE 85
private sector’s ability to provide these services.
Arguably, this comes very close to using PFI/DBFO as
an explicit subsidy to the private sector. Finally,
although the NAO believed that shadow tolls and
private finance introduce extra costs, risk and therefore
costs that offset other risks, it did not draw the
conclusion that therefore all these schemes were not, in
terms of the Government’s own methodology, VFM. In
other words, it stopped short at the very point at which
it could most usefully fulfil its remit to evaluate value
for money.
The Public Accounts Committee (PAC), in reviewing the
NAO report, was more explicit:
By failing to select the best qualified bidders to tender
for two of the four projects, the Agency was on
dangerous ground. They risked giving the message
that they were more interested in spreading the
contracts around than encouraging the innovative and
keenly priced bids which are necessary if PFI is to
deliver good value for money. (PAC 1998d,
Recommendation 1)
However, it failed to follow through the implications of
both this and other limitations identified by the NAO.
In its report on the contract on the A74(M)/M74
Motorway in Scotland DBFO, now known as the M6
extension, the NAO reiterated many of the same points
(NAO 1999a). The report presented very little useful
financial information and showed how the present
value of the DBFO option changed through the bidding
process and after, given that the private partner
completed construction ahead of schedule, thereby
adding to the shadow tolls. The use of numerous DBFO
values makes it difficult to present a consistent analysis
of the relative costs of the two options.
The present value of the DBFO option at the DoT’s final
assessment was £193 m compared with a PSC of
£210 m (at the 6% discount rate). Financing charges
accounted for 16% of the total discounted cost and
were higher than under conventional procurement. The
NAO’s view was that, provided the finance was raised
competitively, this extra cost should reflect the risk
transfer. On the key issue of risk transfer, whose costs
were not presented, the NAO was concerned that the
use of shadow tolls created a risk that the private
sector could not manage and which therefore could be
expected to increase the cost of the contract to the
Department. Furthermore, since the contract provided
an incentive for the contractor, Autolink, to complete
the construction phase as soon as possible, this
increased the cost of the road by £10 m because of
extra shadow tolls as a result of early opening, thereby
reducing the margin between the expected price and
the PSC. This, and the possibility that the Department
had overstated the cost of the public sector comparator
by £10 m, eliminated the DBFO’s margin of superiority.
Despite this and its belief that it was ‘not realistic to
expect a very high degree of precision and accuracy in
such forecasts’, the NAO’s contradictory conclusion
was that, while not clearly demonstrating VFM, it was
likely to remain VFM. In other words, it drew
conclusions that were not justified by the evidence.
The NAO’s evidence from these two reports, if not its
conclusions, is important because it shows that the
Highways Agency was unable to demonstrate (even
using the Government’s methodology, which favours
private finance over public finance) that these DBFO
schemes had lower whole-life costs than conventional
procurement. Since the discounting methodology serves
to reduce the apparent cost of the DBFO option, this
means that the cash cost of DBFO must be very much
more than a publicly funded option and that DBFO is a
very expensive way of constructing, operating and
maintaining roads. This in turn means that DBFO
comes at the expense of other roads and/or other public
services.
There is little information about how these DBFO
contracts are working in practice. A recent report,
DBFO and roads

PAGE 86
however, by the Transport Select Committee (2003)
lends an interesting perspective to the Highways
Agency’s management of its maintenance contracts,
which is not dissimilar to the operational phase of
DBFO contracts. The failure of one of the Agency’s
contractors, Carillion URS, to grit the roads before an
expected snowfall in January 2003 led to the M11 and
surrounding roads in Essex and Cambridgeshire being
blocked. Hundreds of thousands of commuters were
stranded overnight in freezing conditions for up to 20
hours in their cars, unable to move. Police described
the M11 as ‘effectively a car park’, which in turn
affected traffic flow in the surrounding area. The
resulting gridlock made for good aerial shots, ensuring
that it got maximum television time and column inches.
Although the contractors are responsible for all the
decisions relating to winter maintenance, the Transport
Select Committee blamed the Highways Agency for
failing to coordinate the maintenance activities, saying
that their ‘arrangements manifestly did not work’.
Carillion’s radio communications had not been working
for four days. Neither did its mobile telephone network
function. Although repairs had been requested, Carillion
had taken no action and even more importantly, the
Highways Agency was not informed. The Committee
found it ‘utterly astounding’ that repair procedures were
so slack and was ‘dismayed that the Highways Agency
should have been unaware of this’. It expected the
Agency to be aware of such problems.
The Committee attached even more importance to the
fact that the Highways Agency could take no financial
action against the contractor: according to the contract,
penalty points were not awarded for poor performance
alone but only for failure to respond to problems.
Furthermore, no penalties were awarded because the
Highways Agency believed that the contractor had
acted promptly to address the problems raised by the
review of the incident. The Committee said:
It is intolerable that the Highways Agency has no
immediate financial sanction available where a
contractor fails to keep the motorway and trunk roads
system free of ice and open. The Agency’s stated
desire to work in positive partnership with its
contractors is admirable. This cannot substitute
however for appropriate contractual sanctions to
enforce high maintenance standards. While these
standards are not upheld, as happened on 30 and 31
January, it is the travelling public who pay an
unacceptably heavy price. The Agency must review its
contractual arrangements with maintenance agents
urgently. (Transport Select Committee 2003)
Furthermore, the Highways Agency was unable to
provide the Committee with information about its
contracts at the hearing. The Committee complained
that the Agency took an unprecedented 11 weeks to
provide the required information, which was not
complex. The Committee’s report of contract failure is
important because it provides crucial information about
the nature of the Highways Agency’s contracts, its
monitoring and penalty system, and attitude to contract
enforcement, which is not otherwise publicly available.
There is no reason to believe that the DBFO contracts
are substantially different.
Despite the problems raised by the NAO, the Highways
Agency publicly proclaims that the DBFO contracts
have been successful, stating:
The DBFO roads programme is a success story that
needs to be told. One of the principal messages is that
the use of PFI for road procurement has delivered
contracts representing real value for money. This means
that the public will receive a high standard of service
on DBFO roads at lower cost. (Highways Agency 2003)
This is based on the Highways Agency’s own review,
Value in Roads (Highways Agency 1997), which
relates to the expected VFM case and subsequently
formed the basis of a paper by Highways Agency
DBFO and roads

PAGE 87
personnel, including the chief executive, in an
academic journal (Haynes and Roden 1999). Their
work concluded that:
These projects were delivering new and improved road
construction and maintenance, providing better
services to users of the country’s strategic road
network and achieving significant value for money
savings for taxpayers. (Haynes and Roden 1999, p. 1)
Since the paper is largely descriptive, however, and
provides little additional financial information or
evidence to substantiate its claims over and above that
contained in the NAO reports reviewed above, it is
difficult to give much credence to the claims. The
Highways Agency itself links value for money in DBFO
closely with the transfer of risk from the public to the
private sector, as demonstrated by the following
statement.
Under each DBFO contract the private sector assumes
substantial risks, including those relating to designing,
building and operating the road. The private sector is
reasonably expected to be able to manage these risks
better than the public sector under traditional
methods of procurement. The placing of risk
appropriately in this way is likely to provide better
value for money than placing risks with those not well
able to manage them. The fact that the procurement
process for each scheme was highly competitive gives
assurance that the terms obtained were the best
obtainable from the market for deals of this type at
this time. (Highways Agency 2003)
But Haynes and Roden argue, without referring to the
problems and issues cited above, that VFM (as
reflected in the difference between the public sector
comparators and the shadow tolls) had been delivered.
Using the 8% discount rate, the first four projects had
saved a total of £168 m and the first eight a total of
£314 m, equal to an average saving of 22%. Using
HM Treasury’s 6% discount rate, the savings on the
eight DBFOs were estimated at about £230 million or
13%, ie in aggregate VFM was delivered.
Haynes and Roden have also produced disaggregated
data (see Table 5.4 on page 88) that present a rather
different story. Table 5.4 shows that two of the eight
projects were either almost identical to or more
expensive than the PSC at the 8% discount rate: the
A69 project previously identified by the NAO as more
costly than the PSC, and the A30/A35 project from the
second tranche of the eight DBFOs that the NAO did
not examine. Although they do not show comparative
data at the 6% discount rate, this must mean that at
the 6% rate at least three of the eight failed to
demonstrate VFM, since the NAO report had shown
that two of the first four schemes were not VFM at the
6% rate and Haynes and Roden’s work suggests that
the A30/A35 was not VFM. Thus the schemes were
only VFM in the aggregate, not in each case. Haynes
and Roden do not comment on this, or on the fact that
at the 8% rate the A30/A35 was only marginal, nor do
they explain why the VFM rule had been breached at
the 8% rate in the case of the A69 project.
The three schemes (the A69, A419/A417 and the A30/
A35) that were either marginal or not VFM were small
schemes and had a small construction element relative
to operations and maintenance. One interpretation of
this is that DBFO is appropriate only for relatively large
projects with a significant construction element.
Another, and related explanation, is that the large
schemes appear to offer VFM because the discounting
methodology favours large, privately financed
construction schemes that are paid for through a
stream of broadly equal payments for 30 years, rather
than a large initial outlay with limited future costs.
The Highways Agency (1997) also claims success in
relation to innovation, the transfer of risk in relation to
protestor action and latent defects, and the
development of a road operating industry, without
presenting any evidence. In fact it is too early to assess
DBFO and roads
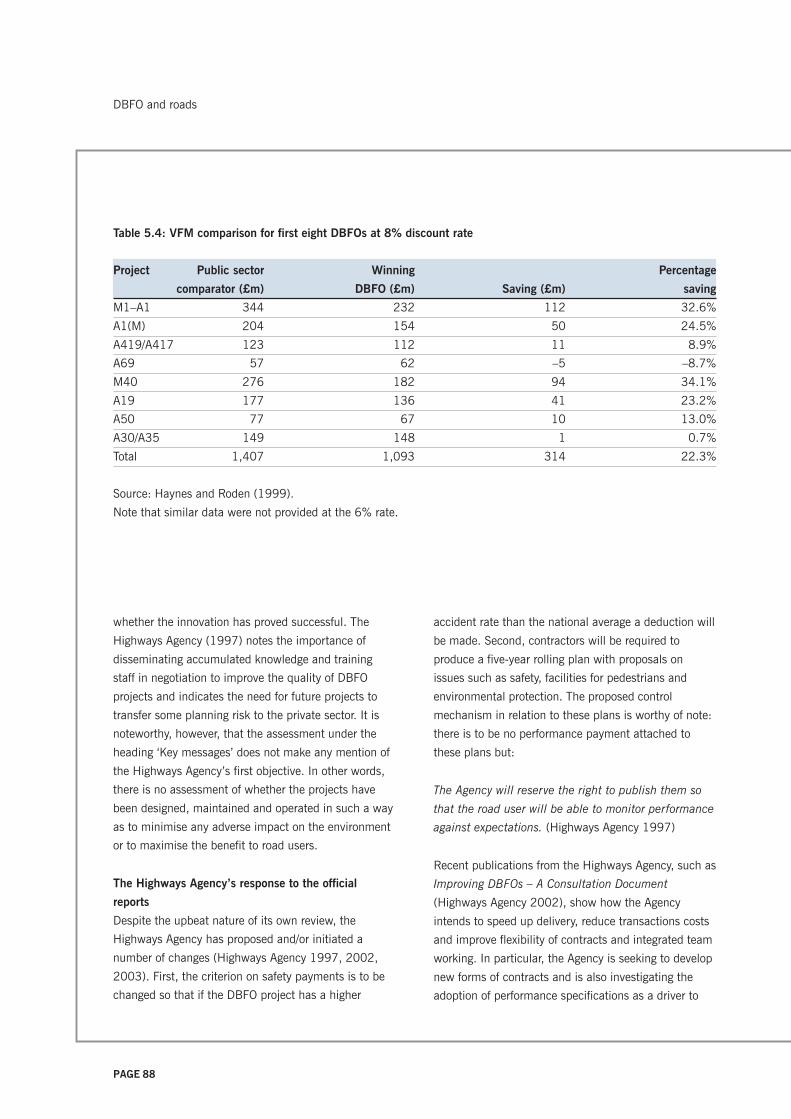
PAGE 88
whether the innovation has proved successful. The
Highways Agency (1997) notes the importance of
disseminating accumulated knowledge and training
staff in negotiation to improve the quality of DBFO
projects and indicates the need for future projects to
transfer some planning risk to the private sector. It is
noteworthy, however, that the assessment under the
heading ‘Key messages’ does not make any mention of
the Highways Agency’s first objective. In other words,
there is no assessment of whether the projects have
been designed, maintained and operated in such a way
as to minimise any adverse impact on the environment
or to maximise the benefit to road users.
The Highways Agency’s response to the official
reports
Despite the upbeat nature of its own review, the
Highways Agency has proposed and/or initiated a
number of changes (Highways Agency 1997, 2002,
2003). First, the criterion on safety payments is to be
changed so that if the DBFO project has a higher
accident rate than the national average a deduction will
be made. Second, contractors will be required to
produce a five-year rolling plan with proposals on
issues such as safety, facilities for pedestrians and
environmental protection. The proposed control
mechanism in relation to these plans is worthy of note:
there is to be no performance payment attached to
these plans but:
The Agency will reserve the right to publish them so
that the road user will be able to monitor performance
against expectations. (Highways Agency 1997)
Recent publications from the Highways Agency, such as
Improving DBFOs – A Consultation Document
(Highways Agency 2002), show how the Agency
intends to speed up delivery, reduce transactions costs
and improve flexibility of contracts and integrated team
working. In particular, the Agency is seeking to develop
new forms of contracts and is also investigating the
adoption of performance specifications as a driver to
Table 5.4: VFM comparison for first eight DBFOs at 8% discount rate
Project Public sector Winning Percentage
comparator (£m) DBFO (£m) Saving (£m) saving
M1–A1 344 232 112 32.6%
A1(M) 204 154 50 24.5%
A419/A417 123 112 11 8.9%
A69 57 62 –5 –8.7%
M40 276 182 94 34.1%
A19 177 136 41 23.2%
A50 77 67 10 13.0%
A30/A35 149 148 1 0.7%
Total 1,407 1,093 314 22.3%
Source: Haynes and Roden (1999).
Note that similar data were not provided at the 6% rate.
DBFO and roads

PAGE 89
innovate more cost-effective methods of work, reduce
administration costs and increase efficiency (Highways
Agency 2003).
As a result of criticisms of the use of shadow tolls in
roads, including the criticism that it can incur higher
charges for the public sector (NAO 1999a, PAC
1998d), and the use of tolls for the Skye Bridge paid
by users (PAC 1998a), the Agency has sought
alternatives (2003). The Highways Agency, as
purchaser for the urban A13 Thames Gateway DBFO
Project, has used a new mechanism, called the
Availability Payment Mechanism, which incorporates
refinements on availability, HGV/Bus shadow tolls and
bus journey reliability times, in addition to safety. The
A1 Darrington to Dishforth and A429 Stockbury to
Sheerness projects will use another new payment
mechanism, the Active Management Payment
Mechanism, whereby congestion management together
with a safety performance adjustment form the basis of
the payment (Highways Agency 2003).
The Government chose a 30-year contract period
because the payment mechanism had to allow for a
reduced payment stream in the initial construction
phase and a buffer period after repayment of the debt –
assumed to be 20 years – in case cash flows were less
than, or occurred later than, expected. The Government
also believed that this was long enough to encourage
the DBFO company to consider the whole-life costs of
the project. With a more mature PFI debt market,
however, debt may be repaid over a longer period than
originally anticipated and the Government therefore
believes that a longer contract may encourage further
cost savings. The Agency therefore plans to allow
bidders for future contracts to provide variant bids
based on their preferred contract period.
Commercial reports to investors
Although the Department of Transport and the
Highways Agency make little information available to
the public either as taxpayers or end users, stock
exchange regulations and investor demand mean that
some financial information must be made available to
the capital markets. Although, in principle, the offer
documents (IPOs) accompanying bond issues could
provide a useful source of information, since most PFI
bonds are insurance wrapped, they contain little useful
financial information when viewed from the perspective
of this study.
The credit ratings agencies, Fitch Ratings and Standard
and Poor’s, nonetheless provide an important source of
information about PFI in general and the DBFO road
projects in particular and lend an interesting perspective
to the evaluation of DBFO in roads (Fitch Ratings 2003,
Standard and Poor’s 2002, 2003). Standard and
Poor’s makes the point that while experience as yet is
limited, the private sector is being required to assume
more risk in the most recent PFI projects than in the
earlier projects. The clear implication is that the early
projects were a safe investment for bondholders. Fitch
Ratings is more explicit. It notes that there have been
few significant problems in more than 200 projects
even in the construction phase and although the
Government wants to transfer more risk to the private
sector, there has been ‘significant government support’
to offset the additional risk. This implies that the
Government has been willing to pay for this additional
cost in one way or another. Fitch Ratings cites the
example of insurance risk: whereas the early projects
required the private sector to shoulder the full cost,
now the Government shares the risk by taking the
‘insurer of last resort’ role. Fitch Ratings concludes its
report (2003) by saying that it expects the PPP sector
to remain as investment grade and to ‘continue to offer
a comparatively safe haven in times of economic
downturn’.
Standard and Poor’s notes that the DBFO road projects
have a number of strong credit features, including a
contract signed and payments guaranteed by the
department head, contractually stable income stream,
little or no volume risk to debt holders and relatively
DBFO and roads

PAGE 90
low operational risk. Its report points out that the
construction phase represents the largest single risk to
a PFI project, although this is less in shadow toll
projects. In some cases the construction risk has been
structurally removed. Once the building phase has been
completed, it has been possible for the consortium to
take advantage of lower interest rates and a reduction
in project risk to refinance its debt, as in the case of
Autolink Concessionaires (M6)’s contract for the M6–
A74(M)/M74 link. In general, Standard and Poor’s
believe that PFI construction risk is low compared with
other infrastructure projects, being low tech, using tried
and tested building techniques, design and materials,
and employing experienced contractors. This statement
to the capital markets, combined with that of the
NAO’s cited earlier, provides an interesting contrast to
the Government’s rhetoric that private sector innovation
in PFI contracts provides one of the three main sources
of VFM. Standard and Poor’s note that the consortia
had sought to reduce their risk by turnkey, date and
price-specific contracts that pass risks down to the
subcontractors.
Although most PFI projects have little volume and
demand risk, DBFOs, based on shadow tolls, do. In
practice this has not been a problem owing to ever-
rising traffic volumes. A significant downturn in the
economy and a fuel shortage could affect traffic levels.
Standard and Poor’s report notes that the payment
streams are subject to performance regimes that are
complex – in some cases too complex to be applied
effectively, an issue we will develop later – and
subjective, which could lead to disputes. It notes,
nonetheless, that there have been few payment
reductions in practice.
Standard and Poor’s report includes a summary of the
risks of several individual projects.
The M6–A74 link contract was awarded to Autolink
Concessionaires (M6) in 1996. The report notes that
the successful completion of the construction phase
had removed a major risk and enabled a refinancing of
the debt. Autolink had operated and maintained the
road without incurring any penalty points. Although the
company was exposed to traffic risk if traffic volumes
declined, and indeed traffic growth had been less than
expected, this had not been a problem since vehicle
use had exceeded the base case traffic forecast by
7.9%. It identifies the following strengths: relatively
stable revenue flows; less than budgeted expenditure
on maintenance and operations, in part owing to less-
than-expected traffic growth; the nature of the contract,
which would make it difficult for the Government to
terminate without compensation; and comfortable
financial margins ensuring adequate senior debt
coverage even without traffic growth.
The A1(M) Peterborough to Alconbury and A417/A419
Swindon–Gloucester contracts were awarded to Road
Management Services Ltd in 1996 and financed by a
single bond. Again, the construction phase has been
successfully completed and the company have incurred
no penalty points on the operational phase. Although
car volumes have been lower than expected on the
A1(M), this has been partially offset by higher than
expected car volumes on the A417/A419. As with the
M6 project, expenditure on operations and
maintenance have turned out to be lower than
expected. The report notes that senior debt repayment
is assured ‘even in downside stress scenarios’, owing to
profit margins that have held up well despite lower-
than-expected traffic volumes.
The A1 Darrington–Dishforth contract was awarded in
2002 to Road Management Services Ltd, the largest
DBFO contract to date. The risks are offset by the
Government’s commitment to DBFO, a tried and tested
contract structure, ‘limited scope for payment
deductions despite onerous traffic operations and
maintenance stresses’, contractors’ experience, the
financing structure, robust revenues and ample
headroom in the project for the different phases of the
contract. Although it was concerned that the new
DBFO and roads

PAGE 91
payment mechanism – the gross congestion
management payment – exposed lenders to the risk of
congestion occurring outside set parameters, it believed
this was ‘partly mitigated by the Highways Agency’s
commitment to making this new arrangement work
effectively’. In other words, the Agency would not
interpret the agreement rigidly.
Taken together, the credit ratings reports show that the
combination of secure revenue streams, performance
regimes that are not particularly onerous and lower
than expected costs (by the SPV) means that DBFOs
are highly profitable both for their investors and
bondholders. This raises questions about the value of
the PSCs used to evaluate DBFO deals and their actual
VFM, including risk transfer, since profits held up well
despite lower than expected traffic growth. More
fundamentally, it refutes the Government’s justification
for refusing to disclose information about the DBFO
projects on the grounds of commercial confidentiality,
since the capital markets themselves require this
information to be available to potential investors. In so
far as some of the information is in the public domain,
albeit unknown to a wider audience, this suggests that
the Government and the private sector are only
reluctant to disclose the information to the public at
large.
There are several implications of this literature review
for the present study.
• Although numerous studies have supported the use
of private finance in roads, few provide much in the
way of supporting evidence either for the ex ante
appraisal or the ex post facto evaluation.
• The international evidence shows that although most
of the projects have been successful, not all have
been trouble free and some have had to be taken
into public ownership or renegotiated.
• Some academic research has raised concerns about
the cost, accountability and transparency of such deals.
• The UK Government has not published the projects’
full business cases that were used to support its
decision to use private finance in roads.
• The NAO’s reports show that risk transfer has been
crucial to the VFM case and criticise the use of
shadow tolls that have created additional risks for
the public sector that were not reflected in the
appraisal methodology. The high cost of using
private finance, the – at best – weak VFM case and
the affordability problems raise questions as to
whether and how VFM will be achieved in practice.
• Most of the risk transfer relates to the construction
phase, which has generally been successful in
delivering the new roads on time and to budget.
Although the system of incentives has worked, it has
come at a cost and it is unclear why similar
objectives could not be achieved by appropriately
designed construction contracts.
• Given the early stage of the policy, little is known
about whether the system of incentives and
penalties can and will deliver what is required in the
operations and maintenance phase.
DBFO and roads
PAGE 92
FINANCIAL ANALYSIS OF DBFOs IN ROADS
The subject of our analysis here is the first eight DBFO
contracts in England managed by the Highways
Agency. We chose these because they constitute the
majority of the 14 projects (see Table 5.1 on page 76),
and they have been going the longest, and most of the
Government’s publicly available data relate to these
projects. We examine the Highways Agency’s
expenditure on DBFOs and how this is reported, the
structure of the deals, the DBFO companies’ income,
costs, including the cost of capital, and returns to the
parent companies, to provide evidence about the actual
VFM, risk transfer and how PFI projects are reported
and accounted for.
Highways Agency’s expenditure on DBFOs
It is believed that the capital costs of the eight projects
listed in Table 5.1 (see page 76) totalled £590 m and
the total discounted cost over the life of the contracts
was £1,093 m (Haynes and Roden 1999). It is
impossible to get consistent information about either
the capital or the total costs of all the projects as
various official sources cite different figures. Although in
part this may be due to definitional reasons – eg capital
value as opposed to construction costs that may or may
not exclude financing costs, cash versus discounted
values and/or changes in the discount rate – it does not
make for clarity, transparency or accountability. Neither
the Department of Transport nor the Agency has
published information setting out the expected annual
cash payments to the DBFO companies for these
projects, despite the fact that the Government
guarantees the Highways Agency’s payments on the
contracts.
The Highways Agency, as an executive agency,
publishes an annual report and accounts, produced as
hard copy and also posted on the Agency’s website,
which could be expected to provide information about
the annual payments. It applies the regulations laid
down by the Treasury Taskforce (1999a) in its
amended Technical Note No. 1, which, following
disagreement with the Accounting Standards Board
(ASB), gave the Government’s interpretation of the
guidance given by the ASB (1998).
The accounts for 1999/2000 state that contract risk
has been independently analysed according to the
guidance laid down. For 1999/2000 it was considered
that sufficient risk had been transferred to the operator
and so seven out of the eight contracts were not shown
on the Highways Agency’s balance sheet, although
intangible assets representing the reversionary interests
were recognised. One unnamed contract was shown on
balance sheet. In 2000/1 the accounting treatment
changed, however, to show all eight contracts as on
balance sheet assets. No information regarding this
change in accounting policy is given, but we presume
that this followed a reassessment of risk by its auditors,
the National Audit Office. Maintenance expenditure was
recognised in the operating cost statement while
construction costs associated with the DBFO contracts
came on balance sheet, together with the associated
long-term and short-term creditors.
Table 5.5 (line 4) (see page 96) shows the annual
payments made by the Highways Agency in respect of
these DBFO contracts in England, currently running at
about £210 m per annum. The first point to note is
that these payments are shown only as a note in the
accounts, not as an explicit programme cost, and are
far from clear. The Agency does not explicitly state to
which contracts the payments relate nor does it break
the payments down by contract. Thus it is impossible
to track individual project costs. Since the Agency’s
ninth contract was not signed until 2002, the
payments relate only to the first eight contracts.
Secondly, since the Agency did not, prior to the year
ending March 2000, produce accrual or cash accounts
that showed the payments to the DBFO consortia, there
is no publicly available record of any payments to the
DBFO consortia in the years ending March 1997,
1998 and 1999. Although this is surprising from an
DBFO and roads

PAGE 93
accountability perspective, it is by no means unique. In
their study of NHS PFI contracts, Hodges and Mellett
(1999) show that information about costs was not
disclosed without a specific regulation requiring it.
Thirdly, despite the designation of the payment
mechanism as ‘shadow tolls’, payments are recorded in
three forms:
• as interest on the DBFO finance lease for the capital
element of the projects
• as shadow tolls for the operating element of the
contracts and
• as finance leases.
Although the interest is declining on a year-on-year
basis as the lease obligation reduces, the finance lease
capital payment will increase. The shadow tolls vary
from year to year. These payments are estimated in
advance and in the following year an adjustment is
made based on actual traffic flows. Recording
payments in this form provides further evidence that
these DBFOs are non-separable service contracts and
are therefore to be accounted for as finance leases on
the Highways Agency’s balance sheet, together with an
accompanying service charge report in the profit and
loss account.
These three payments are not the full cost to the
Highways Agency of the roads under DBFO contracts.
Since the roads remain the Agency’s property, they
appear on its balance sheet. As such, they are subject,
as are all the Agency’s assets, to a 6% capital charge,
soon to be reduced to 3.5%, assumed to be the cost of
past capital and payable in the form of a dividend on
the Government’s Public Dividend Capital – the
equivalent of the Government’s equity stake – to the
Government as owner. Table 5.5 (see page 96) shows
that after including capital charges on the assets,
assumed to be worth the value recorded in the DBFOs’
accounts, since the Highways Agency does not identify
them separately, the eight roads accounted for 5–6% of
total programme costs. However, this underestimates
the total cost because the depreciation charge, which
could not be identified, has not been included.
Figure 5.1: Payment profile diagram
Source: Highways Agency (1997).
(80% offull
payment)
Time
0 A B C 30 years
Pay
men
t (£
)
DBFO and roads

PAGE 94
Figure 5.2: Relationships between the Highways Agency, the SPV, the parent companies and subcontractors
Laing
Infrastructure
Hyder
Investments Ltd
Carillion Private
Finance Ltd
CDC Ixis SA
WW30 Ltd
Laing
Investments Ltd
Transroute
International SA
Carillion
Construction
Ltd
Carillion Private
Finance Ltd
UK Highways
M40 Holdings
Ltd
UK Highways
Services Ltd
UK Highways
A55 Holdings
Ltd
UK Highways
M40 Ltd
Majormaintenancecontract
£4.6 m to CarillionConstruction Ltd
£6.8 m routingoperations and
maintanence contract
Laing
Investments Ltd
John Laing
Plc
Carillion
Plc
John Laing
Plc
45
%5
%5
0%
25
%2
5%
25
%2
5%
£22.2 m
Highways
Agency
UK Highways
M55 Ltd
DBFO and roads
Source: Annual report and accounts of UK Highways M40 Ltd.
Note: Payments (in millions) relate to the year end 31 December 2002.
PAGE 95
It is impossible to comment on how this compares with
the expected payments since such information is not in
the public domain. Although it is known in general that
traffic volumes have risen and in a number of cases
risen more than the companies expected, thereby
increasing the payments to the private sector, it is
unknown how these compare with the Agency’s own
estimates of expected traffic flows, since these too were
never released.
Although the accounts also show the discounted value
of the payments due over the remaining period of the
contract, they do not show the expected annual cash
payments. This is important as the Highways Agency’s
Value in Roads – a DBFO Case Study (1997) shows
that there are step increases in the annual payments at
two points, which appear to be around years four and
seven, points A and B respectively in Figure 5.1 (see
page 93), which is reproduced from the Agency’s
website. However, although the graph does not identify
the scale of the axes and there is no other publicly
available information on this, it does show that up to
year B, payments are only 80% of the full payments.
The significance of this is that the payments can be
expected to rise by about 25% since the year ending
March 2002 is only the sixth year of the contracts.
However, the Agency was not able to clarify the point
for our study.
Thus, in just three years (1999/2000 to 2001/2) for
which financial information is available, the Highways
Agency has recorded payments of £618 m. Given that
payments are known to have started in 1997, this
means that in just six years the Agency has paid very
much more than the initial capital costs of £590 m. At
the very least, it refutes one of the justifications for
using private finance – that the Government does not
have the money to finance infrastructure investment –
and raises questions about its actual VFM.
Assuming £200 m costs per year over 30 years
(although as we have shown this is higher and set to
rise), then the total cash cost of the contracts is
approximately £6 billion. This means that the
remaining £4.8 billion due over the life of the contracts
(since we assume that £600 m was paid in the years
1997–2000 as well as the £600 m paid in 2000–2)
represents the premium paid for risk transfer and the
cost of operatiing and maintaining the roads. The
£6 billion whole-life costs imply a present value of
about £2.2 to £2.5 billion, depending upon whether
the 8% or 6% discount rate is used. Although clearly
these assumptions can be varied even more
conservatively, it is difficult to reduce this below
£2 billion, a figure almost twice the net present cost of
£1.093 billion cited by Haynes and Roden (1999). The
reasons for this are unclear. One interpretation is that
payments have been higher than expected.
Several further points follow from this. First, it seems
that the contracts have turned out to be very much
more expensive than implied by the NPC provided by
the Highways Agency’s most senior personnel (Haynes
and Roden 1999). This, plus the fact that evidently
less risk was transferred than expected since the
schemes are on balance sheet, makes it unlikely that
the contracts can or will deliver the anticipated VFM.
Secondly, the estimated capital and interest payments
of about £1.723 billion2 mean that the finance element
of DBFO is about three times the initial construction
costs and nearly one third of the total cash costs of the
project. Thirdly, most commentators argue that most of
the estimated risk transfer relates to construction risk
(NAO 1998a, Standard and Poor’s 2003) and the NPC
of risk transfer for the first four projects was £177 m at
the 8% discount rate (the sum of line 3 in Table 5.3 on
page 83). Then a conservative guess is that up to
£100 m of this £177 m risk (56%) is attributable to
construction risk. This means that the Agency was
paying a £100 m premium on £400 m of construction
DBFO and roads
2 Schedule of payments provided by the Highways Agency to
the research team.

PAGE 96
Table 5.5: DBFO payments made by the Highways Agency
(£m) March March March
2000 2001 2002
Interest on DBFO finance lease 59 58 57
DBFO shadow tolls 119 142 130
Finance leases (due within 1 year) estimated 17 18 19
Total DBFO payments 195 218 205
Capital charges (6%) payable on DBFO assets 53 53 58
Total DBFO costs (DBFO payments + share of capital charges) 248 271 244
Total DBFO costs as % Highways Agency’s total programme costs 6% 6% 5%
Amount payable under DBFO contract within next year 18 19 20
Amount payable under DBFO contract after one year
(capitalised value of road improvements) 965 947 911
Commitment to shadow tolls under DBFO next year 184 210 209
Sources: Highways Agency accounts (several years) and information provided by the Highways Agency.
Notes
1. Although the Highways Agency did not produce accruals accounts for 2000, the 2000/01 accounts showed the
information for the previous year.
2. 2000 figures have been restated to be consistent with accounting policies of later years, using information provided
by the Highways Agency.
costs (the sum of the four schemes shown in line 6 of
Table 5.3 on page 83) equivalent to 25% of
construction costs to get the roads built to time and
budget. Again, although this ‘guestimate’ can be
varied, it does suggest that risk transfer does not come
cheap. Fourthly, since these annual payments must be
met out of a limited budget, this is likely to give rise to
affordability problems: in other words the cost of these
eight schemes can be met only at the expense of other
capital and maintenance projects.
Although, in 2001/2, the HA overspent its net
resources budget by £456 m, this was because
expenditure budgeted as capital in the Agency’s
business plan had to be accounted for as resource
expenditure following the introduction of Resource
Accounting, and because the Agency under-budgeted
for non-cash costs, eg depreciation, presumably
including the depreciation for the DBFO assets now on
balance sheet. Although DBFO accounts for about
5–6% of total programme costs without the
depreciation charge for the assets that had been
brought back on balance sheet it is, however, unclear
how DBFO affects the Agency’s budget, owing to its
being subsumed within a larger resource envelope and
thus the degree to which it contributed to the deficit.
The DBFO companies’ financial performance
The Highways Agency makes payments to its DBFO
partner or concessionaire, which is typically a
consortium or Special Purpose Vehicle (SPV) with a
number of related companies, some of which have
similar names. We used the FAME (Financial Analysis
Made Easy) companies’ accounts database to identify
DBFO and roads

PAGE 97
the company, its parent and related companies, and
then obtained the concessionaires’ accounts, since their
inception, from Companies House. However, we were
unable to obtain a full set of accounts for 2002 for one
of the companies, Autolink Concessionaires (A19) Ltd,
as its parent company, Amey Plc, was involved in
considerable restructuring, including the disposal of
substantial equity stakes in its PFI projects during this
period. This makes our financial data for 2001/02
incomplete.
The consortium is made up of a bank or finance house
and a construction company that typically invests
3–7% of the capital required from its own funds as
equity in the new company. The consortium has no
recourse to its parent companies but raises the rest of
its finance as debt from the banks, its parent finance
house or more typically the bond market. Although a
high level of gearing generally yields little in the way of
return for shareholders, in practice, as we have shown,
under conditions where there is little downside risk the
cash flows that remain after debt service potentially
provide a high rate of return to the parent companies
on their small equity stakes.
It was clear from their accounts that in nearly every
case, the SPV is a shell company whose only activities
and income relate to its DBFO contract. It has no
employees but serves as a conduit to channel the
payments received from the Highways Agency to its
subcontractors, which are typically subsidiaries of the
SPV’s parent companies. This arrangement creates the
possibility for transfer pricing, with profit being
recorded in related parties rather than the SPV. This
means that the parent companies may profit from the
DBFO in several ways: their equity stake in both the
SPV and the subsidiaries that carry out work for the
SPV, and interest on any loans to the SPV.
Since the SPVs operate as close companies,3 they are
not required to disclose the size of the payments made
to related parties. Only one of the 10 consortia’s
accounts that we examined disclosed this: UK
Highways M40 Ltd. Figure 5.2 (see page 94) shows
the structure of this consortium, which is typical of the
other SPVs, and the financial flows of this corporate
group. This complex structure and elongated chain of
command could, however, lead to communications
problems, extra monitoring costs and disputes as
evidenced by the experience of the privatised rail
infrastructure company (Shaoul 2004a). Furthermore,
should the contract with the SPV be terminated for
whatever reason, the Highways Agency would not only
have to honour its debts, but could also find itself
locked into long-term contracts with the subsidiaries of
the SPV’s parent companies. La Trobe Regional
Hospital in Victoria Australia, for example, found itself
locked into long-term contracts when it was forced to
take back the privately financed and operated hospital
into public ownership.4
Before presenting the SPVs’ income from their DBFO
contracts, it is useful to outline the accounting treatment.
The shadow toll payment from the Agency is split into
two parts. Current income is shown in the profit and
loss statement, although for some companies any amount
in excess of operating costs is shown as deferred
income in the balance sheet until completion of road
DBFO and roads
3 A close company, subject to certain exceptions, is broadly a
company:
• which is under the control of
– five or fewer participators, or
– any number of participators if those participators are
directors,
or
• more than half the assets of which would be distributed
to five or fewer participators, or to participators who are
directors, in the event of the winding up of the
company.
(Inland Revenue 2004)
4 Interview with the finance director of La Trobe Regional
Hospital.

PAGE 98
improvements, when it will be amortised over the life of
the concession. This means that in the early years,
turnover may not reflect total income received and the
companies varied in their revenue recognition policy.
All the SPVs concerned show the contract asset as a
depreciating tangible fixed asset on their balance sheet.
Taken together with the income treatment, this means
that the SPVs consider sufficient risk, especially the
demand risk, to have passed from the Agency to the
private sector. The fact that the Agency now also shows
all eight contracts on balance sheet in its own financial
statements shows that such a determination of risk
transfer is not straightforward. Clearly the Agency’s
auditors consider that the public sector still retains a
large element of risk in relation to the contract,
requiring the full assets to be kept on balance sheet
together with the related financial obligations. As there
is no requirement in the accounting standards or
Treasury guidance for the public or private sector to
disclose details of their risk assessment it is not
possible to follow how such conclusions on accounting
treatment have been reached by either party to the
contract. This means that the substantive question –
the judgement as to how the risk is being allocated –
must be finely balanced for the different parties to
arrive at asymmetric accounting treatments.
Table 5.6 shows the turnover recorded by each of the
eight SPVs for the years 1997 to 2002. The first point
to note is that, despite the absence of such information
from their own accounts, the Highways Agency was
making payments from 1997. Although the SPVs
record an income of £241 m over the first three years,
this underestimates the total received by about 10%,
since some is shown as deferred income. Secondly,
most of the projects appear to have become fully
operational by 1999 when income stabilised. Thirdly,
Table 5.6: DBFO companies’ income from the eight contracts
(£m) 1997 1998 1999 2000 2001 2002 Total
Autolink/A19 8 13 20 20 16 N/A 77
UK Highways/M40 16 17 21 21 22 22 119
Connect A30/A35 11 12 12 11 26 29 101
Connect A50 2 8 7 6 9 10 42
Yorkshire Link A1–M1 0 0 17 35 47 46 145
RMS Gloucester A417/419 2 13 15 16 16 17 79
RMS Peterborough A1 1 4 22 23 23 24 97
Roadlink A669 4 7 8 8 8 8 43
Total 8 Companies 43 74 124 141 168 155 707
Payments made by
Highways Agency N/A N/A N/A 195 218 205 N/A
Payments made by
Highways Agency ex-VAT
on shadow tolls N/A N/A N/A 174 183 182 N/A
Sources: annual reports and accounts of DBFO companies (various years) and Highways Agency.
N/A = not available.
DBFO and roads
PAGE 99
although the ranking of their income largely followed
that of the capital cost of the contracts, in one case,
the A1(M) Peterborough–Alconbury contract had an
income considerably lower than the capital cost of the
project would have suggested. This may be due to the
fact that, as Standard and Poor’s noted, traffic volumes
were less than the SPV expected. Alternatively, it may
be because the SPV recorded some of its income in
2000 and 2001 as deferred income. Fourthly, the eight
SPVs’ income has risen continuously from £43 m in
1997 to £168 m in 2001, the last year for which we
have complete information, in part at least because
traffic volumes have increased. By 2002, the SPVs had
received from the Agency more than the £590 m
capital cost of the projects.
One perhaps surprising point that emerges from Table
5.6 is that the SPVs’ income does not match the
Highways Agency’s total DBFO payments shown in
Table 5.5 (on page 96) and reproduced at the bottom
of Table 5.6. It is about 30% lower than the Agency’s
payments. There are several possible reasons for this.
First, the SPVs and the Agency have different year ends.
Secondly, some of the SPVs changed their year end in
2000 and so Table 5.6 shows an estimated value for
2000 based on pro-rating the monthly averages.
Thirdly, the 2002 accounts for one of the companies
were not available. Fourthly, three of the SPVs record
some of their income as deferred income, but this is
small and in the early years of the contracts. Lastly,
depending upon whether the Agency’s activities are
zero-rated or exempt from VAT, its payments include
VAT, whereas the SPVs’ turnover is reported net of VAT.
However, even assuming that all the shadow toll
payments include VAT, the SPVs’ income from the
contracts is still 15–20% less than the Agency’s
payments, which relate only to the eight contracts in
this period. This is something we are not able to explain.
Table 5.7 (see page 100) shows the total profits before
interest and tax, and the profit margins for the eight
SPVs over the life of the contract. These were generally
rising and by 1999, when the projects became fully
operational, profit margins averaged a very high 54% of
income. By 2002, profits had risen to £106 m (from
£6 m in 1997) and profit margins had risen from 13%
to 68%. Since the SPVs had no employees, almost all
their operating expenses, except depreciation and a
management fee to their parent companies, must
represent payments to their subcontractors. These were
typically about £50 m a year. Since operating profits
have risen more than turnover and payments to
subcontractors, it seems likely that the SPVs arranged
fixed price contracts with their subcontractors for
operating the roads and have earned more from the
Highways Agency than expected owing to higher traffic
flows. Thus the SPVs benefited in the short term at
least at the expense of their subcontractors who carried
out the operational services. The high volumes must in
turn lead to higher maintenance costs later.
Table 5.7 (see page 100) shows that the amount of
corporation tax payable was very small, rising from zero
in 1997 to £9 m on profits of £106 m (about 8%) in
2002. The total amount of tax payable by the companies
over the period was £25 m. This constitutes an
effective tax rate on operating profit of 7% on total
operating profits of £384 m for the period, despite the
fact that the current rate of corporation tax is 30%,
largely because of tax relief on net interest paid. Even
this is an over estimate of actual tax paid, however,
since most of it is deferred tax. We would expect the
tax payable to increase in the next few years. This
finding is important because it challenges a crucial part
of the VFM methodology set out in the revised Green
Book (HM Treasury 2003a) and based on guidance
provided by KPMG, a key player in the PFI market. The
new methodology assumes that corporate tax receipts
will increase under PFI and that therefore the PSC
should be adjusted by 22% to reflect this. This is in
contrast to the earlier versions of the Green Book (HM
Treasury 1991, 1997a) that assumed a tax
contribution of one per cent or less. Our evidence
shows that this key assumption, which will distort the
DBFO and roads
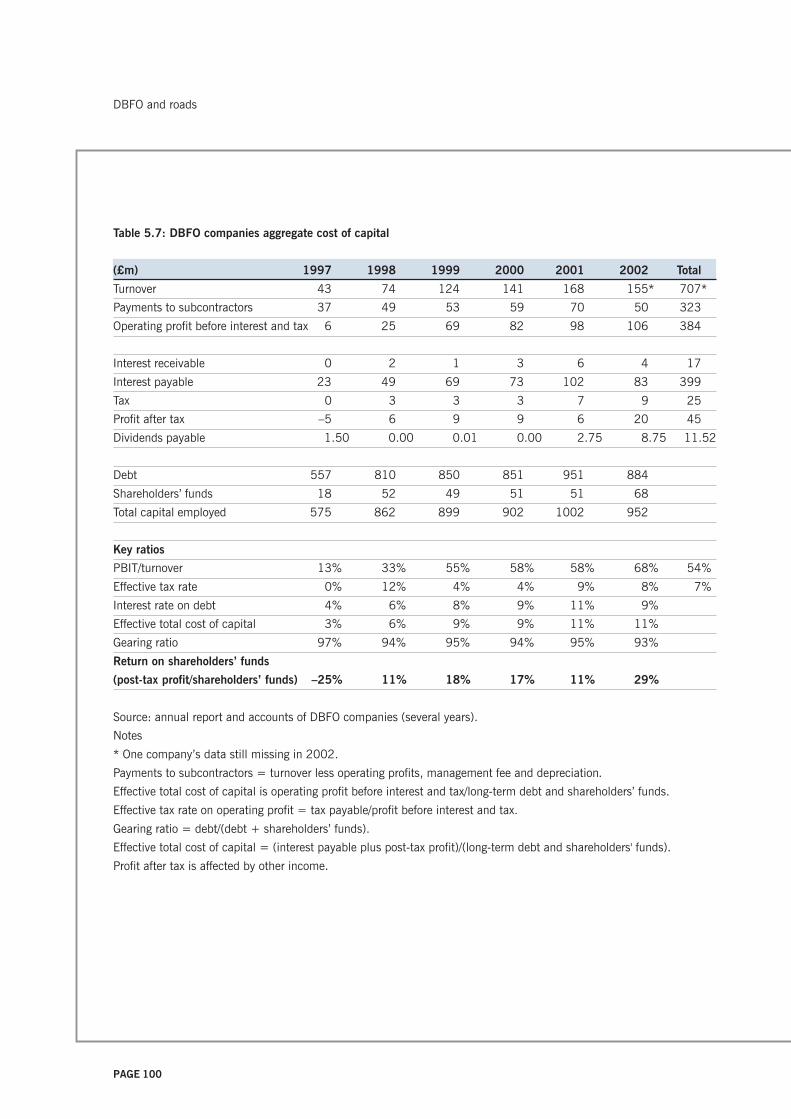
PAGE 100
Table 5.7: DBFO companies aggregate cost of capital
(£m) 1997 1998 1999 2000 2001 2002 Total
Turnover 43 74 124 141 168 155* 707*
Payments to subcontractors 37 49 53 59 70 50 323
Operating profit before interest and tax 6 25 69 82 98 106 384
Interest receivable 0 2 1 3 6 4 17
Interest payable 23 49 69 73 102 83 399
Tax 0 3 3 3 7 9 25
Profit after tax –5 6 9 9 6 20 45
Dividends payable 1.50 0.00 0.01 0.00 2.75 8.75 11.52
Debt 557 810 850 851 951 884
Shareholders’ funds 18 52 49 51 51 68
Total capital employed 575 862 899 902 1002 952
Key ratios
PBIT/turnover 13% 33% 55% 58% 58% 68% 54%
Effective tax rate 0% 12% 4% 4% 9% 8% 7%
Interest rate on debt 4% 6% 8% 9% 11% 9%
Effective total cost of capital 3% 6% 9% 9% 11% 11%
Gearing ratio 97% 94% 95% 94% 95% 93%
Return on shareholders’ funds
(post-tax profit/shareholders’ funds) –25% 11% 18% 17% 11% 29%
Source: annual report and accounts of DBFO companies (several years).
Notes
* One company’s data still missing in 2002.
Payments to subcontractors = turnover less operating profits, management fee and depreciation.
Effective total cost of capital is operating profit before interest and tax/long-term debt and shareholders’ funds.
Effective tax rate on operating profit = tax payable/profit before interest and tax.
Gearing ratio = debt/(debt + shareholders’ funds).
Effective total cost of capital = (interest payable plus post-tax profit)/(long-term debt and shareholders' funds).
Profit after tax is affected by other income.
DBFO and roads
PAGE 101
VFM analysis in favour of private finance, is
inappropriate, certainly for the early years.
High operating profits are necessary to cover the cost of
capital: interest payments on debt and returns on
shareholders’ funds to the parent companies. They
therefore provide an estimate of the SPVs’ total cost of
capital and thus serve as a proxy for the Highways
Agency’s cost of using private finance.
First, Table 5.7 shows that debt had risen from
£557 m in 1997 to £951 m in 2001, the last year for
which complete information was available. This was
considerably higher than the £590 m construction
costs which, as the NAO reported, had resulted from
the additional costs of private finance, the high
transaction costs and risk transfer (NAO 1998a).
Interest payments on debt had increased over the
period from £23 m in 1997 to £83 m in 2002 and, by
2002, the seven SPVs were paying an effective interest
rate of about 9%, considerably higher than the cost of
Treasury stock, currently about 4.5%. Secondly, the
table shows that shareholders’ funds rose from £18 m
in 1997 to £51 m in 2001 and £68 m in 2002, in
part because of retained profits. The parent companies’
post-tax profits rose from a loss of £5 m in 1997 to a
profit of £6 m in 2001 and £20 m in 2002, equal to a
rate of return on shareholders’ funds of 11% in 2001
and 29% in 2002.
This means that in 2002 the SPVs’ total effective cost
of capital for seven of the eight contracts was about
£103 m (interest payable plus post-tax profit) or 11%,
several points above either the cost of Treasury gilts or
the Government’s 6% cost of capital implicit in its 6%
capital charging regime and test discount rate. This
additional cost must represent, as the NAO explained
(1998a), the cost of risk transfer. This implies a risk
premium of about six percentage points, equal to about
£56 m. However, there is no yardstick against which to
evaluate whether this cost constitutes VFM.
Considering next the SPVs’ rate of return on
shareholders’ funds, we use, by way of a benchmark,
the evidence given on ‘normal’ rates of return on PFI
projects by the National Audit Office to the PAC, citing
the Office of Government Commerce (PAC 2003d,
Figure 2). The ‘normal’ rate of return (post-tax) on the
construction companies’ investments (not defined) in
PFI companies was 8–15% for 2001. Thus our
companies have exceeded the ‘normal’ rate of return.
Our analysis is confirmed by the industry itself, which
uses a variety of different and undefined measures of
returns to shareholders, therefore making precise
comparison difficult. According to a report in The
Guardian (8 September 2003), the Major Contractors
Group (MCG), which represents PFI contractors such as
Carillion, Costain and Amec, said that they expected to
make between three and ten times as much on their
stakes in PFI as their traditional contracts with equity
returns in the region of 10–20%. A segmental analysis
of their main business areas as revealed in their annual
report and accounts and carried out as part of the
present study confirms that this is indeed the case. The
chief executive of Mowlem, another MCG member,
justified the higher returns on the basis of the substantial
risks associated with PFI. In other words, it is more
beneficial in terms of capital employed (although not
necessarily in absolute terms) to have stakes in the SPV
than actually to carry out the construction or even the
service provision. Confirmation of MCG’s viewpoint is
shown by John Laing’s sale of its construction company
in order to buy up equity stakes in PFI contracts.
This analysis of the SPVs’ total effective cost of capital
as a proxy for the Highways Agency’s cost of private
finance tells only part of the story. First, as explained
earlier, the SPVs typically subcontract some of the
operations and maintenance work to subsidiaries of
their parent companies (Figure 5.2 on page 94). In
only one case, UK Highways M40 Ltd, did the SPV
disclose sufficient information in its accounts to enable
an analysis of the subsidiary’s financial performance. In
2002, UK Highways M40 Ltd was paying about
DBFO and roads
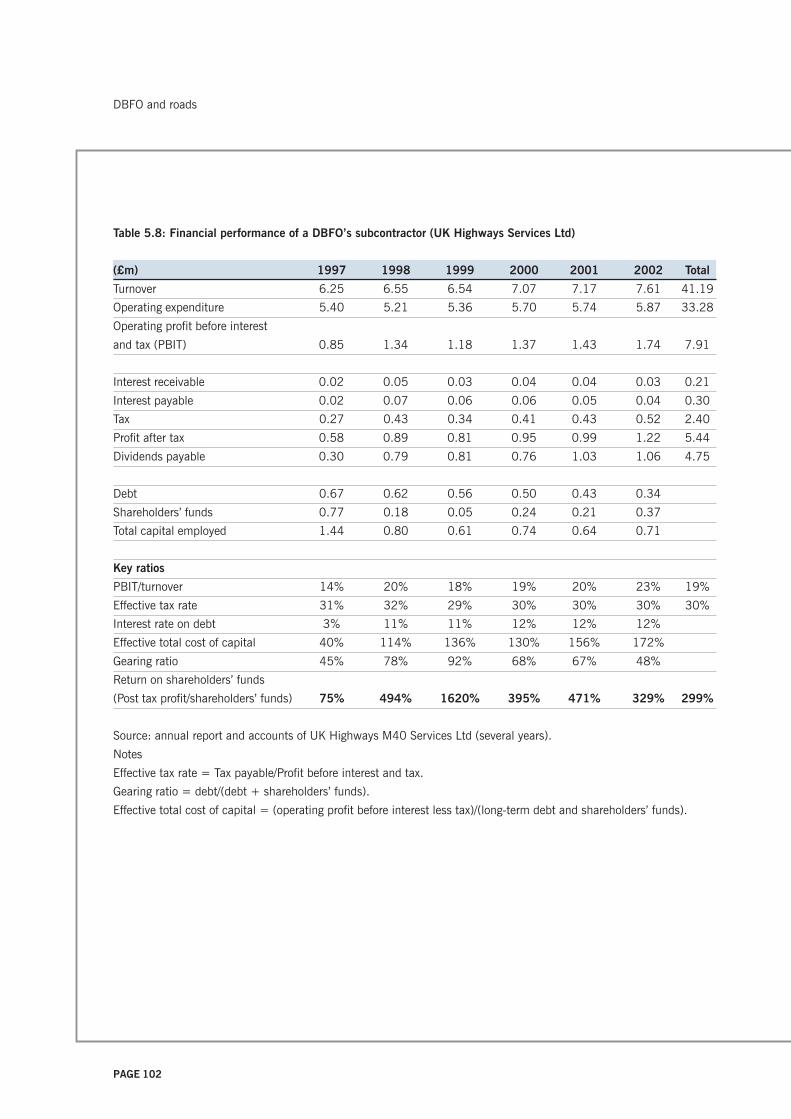
PAGE 102
DBFO and roads
Table 5.8: Financial performance of a DBFO’s subcontractor (UK Highways Services Ltd)
(£m) 1997 1998 1999 2000 2001 2002 Total
Turnover 6.25 6.55 6.54 7.07 7.17 7.61 41.19
Operating expenditure 5.40 5.21 5.36 5.70 5.74 5.87 33.28
Operating profit before interest
and tax (PBIT) 0.85 1.34 1.18 1.37 1.43 1.74 7.91
Interest receivable 0.02 0.05 0.03 0.04 0.04 0.03 0.21
Interest payable 0.02 0.07 0.06 0.06 0.05 0.04 0.30
Tax 0.27 0.43 0.34 0.41 0.43 0.52 2.40
Profit after tax 0.58 0.89 0.81 0.95 0.99 1.22 5.44
Dividends payable 0.30 0.79 0.81 0.76 1.03 1.06 4.75
Debt 0.67 0.62 0.56 0.50 0.43 0.34
Shareholders’ funds 0.77 0.18 0.05 0.24 0.21 0.37
Total capital employed 1.44 0.80 0.61 0.74 0.64 0.71
Key ratios
PBIT/turnover 14% 20% 18% 19% 20% 23% 19%
Effective tax rate 31% 32% 29% 30% 30% 30% 30%
Interest rate on debt 3% 11% 11% 12% 12% 12%
Effective total cost of capital 40% 114% 136% 130% 156% 172%
Gearing ratio 45% 78% 92% 68% 67% 48%
Return on shareholders’ funds
(Post tax profit/shareholders’ funds) 75% 494% 1620% 395% 471% 329% 299%
Source: annual report and accounts of UK Highways M40 Services Ltd (several years).
Notes
Effective tax rate = Tax payable/Profit before interest and tax.
Gearing ratio = debt/(debt + shareholders’ funds).
Effective total cost of capital = (operating profit before interest less tax)/(long-term debt and shareholders’ funds).

PAGE 103
£6.8 m or 34% of its income to its sister company, UK
Highways Services Ltd. With operating profits
accounting for a further 35% of its income, this means
that UK Highways M40 Ltd paid 31% to other
(unknown) subcontractors and suppliers.
Table 5.8 (see page 102) shows UK Highways Services
Ltd’s income from this and another DBFO contract, its
profit margin and return on shareholders’ funds.
Turnover rose from £6.25 m in 1997 to £7.61 m in
2002, with nearly all its income (£6.8 m out of £7.61
m) in 2002 coming from the M40 contract. Profit
margins rose from 14% in 1997 to 23% in 2002 and
were typically 19% of income over the period. The
effective rate of interest payable on debt rose from 3%
in 1997 to 12% in 2002 on debt that fell from
£670,000 to £340,000 over the same period. After
paying about 12% interest on its debt in 2002 and
corporation tax at 30% of operating profits most years,
it generated a post-tax return on shareholders’ funds of
75% in 1997, rising to 329% in 2002. This was
considerably higher than that of the SPV. Therefore, if
these results are typical, the total returns to the parent
companies on DBFO contracts are much more than
simply the SPVs’ returns.
Secondly, as the PAC (2003d) supplementary
memorandum explained, the total returns to the SPVs’
parent companies also would need to include the
interest paid to the parent companies’ finance
subsidiaries, the benefit of any refinancings during the
contract period – and at least one of the SPVs, Autolink
A19 Concessionaires, has refinanced its debt – realised
gains on the disposal of any investments in the SPV
and any unrealised gains from increases in the value of
such investments.
Thirdly, the notes to the SPVs’ accounts provide
interesting examples of how the parent companies
benefit in other ways. To cite but one example (and
there are others), Yorkshire Link (Holdings) Ltd, the
SPV’s parent, has made two interest-free loans totalling
£36 m of unstated duration to its parents, Balfour
Beatty Plc and Macquarie Infrastructure (UK) Ltd,
which thereby improve the parents’ cash flow position
at no extra cost to them. The holding company was
able to do this because the SPV took out a loan, which
among other things financed the holding company’s
upstream loan. Not only does this provide benefits to
the private sector, it also creates additional risk for the
Highways Agency, since should the parents go under,
for whatever reason, the SPV will no longer have the
cash to carry out the expensive maintenance work
required later on in the contract, for which the
Highways Agency has already paid through the front
loading of the payment mechanism. There appears to
be no ring-fencing of the SPVs’ finances.
Thus the 68% profit margin on income received from
the Highways Agency in 2002 (Table 5.7 on page 100),
adjusted to 63% when £9 m corporation tax payable is
taken into account, is attributable to the SPVs’ cost of
capital, which we suggested could be used as a proxy for
the Highways Agency’s cost of capital, and considerably
under-represents the total cost. For as well as including
the SPVs’ interest payments on debt and returns to
shareholders, any estimate of the total cost should
include the profits of the parent companies’
construction subsidiaries and the interest and profits of
their finance subsidiaries, the tax revenue lost through
deferred tax, profits on refinancing, etc. Little of this
information is available in a way that makes it possible
to assess the total cost of using private finance.
All this means that considerably less than half the
payments made by the Highways Agency are actually
spent on the construction, operation and maintenance
of the roads. This raises questions about the DBFOs’
actual VFM. In principle it should at least be possible to
assess the actual VFM by comparing the Highways
Agency’s costs and the SPVs’ returns against the
financial models submitted as part of the bidding
process. However, the bidders’ financial models are not
in the public domain. The results of such a comparison
DBFO and roads

PAGE 104
have not been published, neither is it known whether
the Agency has indeed carried out such an analysis.
More importantly, it also raises questions about
affordability, the implications for the rest of the
Highways Agency’s expenditure, and the extent to
which the use of private finance is a good use of the
taxpayers’ money. At the very least, the experience of
DBFOs does not sit comfortably with the general aim of
controlling public expenditure.
In conclusion, the literature has shown that:
• despite general support for DBFO, there has been
little empirical ex ante or ex post financial research
into the use of private finance in roads in general
and DBFOs in particular; such financial evidence as
exists consists of snippets from diverse sources
• there is almost no information in the public domain
about either the business cases or the contracts
• there is little evidence as to how the operational
phase is working
• more information appears to be made available to
the capital markets than to the public at large,
despite their interests as taxpayers and users
• such financial information as is available suggests
that the risk transfer on construction costs and
delays provides much of the financial justification for
DBFOs
• given the high cost of risk transfer, this suggests that
the Highways Agency paid a high premium to
ensure that the roads were built to budget and on
time
• the National Audit Office does not yet appear to
have exercised its ‘right to roam’ through the books
of the complex web of DBFO road companies.
The financial analysis in relation to the Highways
Agency has shown that:
• the Agency’s financial reporting of its DBFO
contracts is limited and opaque
• despite an annual cost of about £210 m and the
Government’s payment guarantees of contracts
worth £6 billion in total, there is little information
available to the public as taxpayers and users.
• this cost appears to be more than expected at
financial close since the NPC of such payments is
about twice that of the NPC in the public domain
• in the three years for which figures are available, the
Highways Agency has paid out more than the
construction costs of the projects, refuting one of the
justifications for DBFO
• since the full business cases are not in the public
domain, there has been little external financial
scrutiny of the deals and it is unclear post-
implementation how the actual cost of DBFO
compares with the expected costs; our evidence
suggests that it has turned out to be more expensive
than expected; how this affects the Highways
Agency’s ability to fund other maintenance projects
is unclear
• given the high cost of risk transfer as reflected in the
risk premium (approximately 7 percentage points),
the Highways Agency seems to have paid a high
price to get the roads built to time and budget
• the lack of information in the public domain makes
it difficult to estimate the exact extent of the
commitments incurred by the Highways Agency and
the DoT and therefore provides little accountability
to the public.
DBFO and roads

PAGE 105
In relation to the private sector partners, the analysis
has revealed a number of factors.
• The SPVs operate in a complex and opaque web of
contracting that increases the costs and makes it
impossible to assess their returns and thus the total
cost of private finance to the public purse.
• Current regulation permits a lack of disclosure of
related party transactions.
• The seven SPVs report an operating profit before
interest and tax of 68% of their receipts from the
Highways Agency, and this is after subcontracting to
sister companies. This operating profit (less tax) is in
effect the cost of capital.
• About 35% of the SPVs’ income from the Highways
Agency is paid to their operations and maintenance
subcontractors, typically sister companies, including
an unidentifiable profit element for the
subcontractor. Given that this is still early in the
contract, this is likely to be the cost of operations
rather than maintenance.
• Subcontracting in this way means that it is difficult
to isolate the costs of operations and maintenance in
DBFO contracts since the subcontractor may have
multiple contracts elsewhere.
• The absence of such information makes it difficult
for the public sector when it comes to amending the
contracts and negotiating new ones.
• Although the amount of tax payable by the seven
SPVs over the whole period is only 7% of operating
profits, even this overstates the actual tax paid since
it includes an element of deferred tax.
• This low tax rate in the early years at least
challenges an important part of the Treasury’s new
appraisal methodology for PFI, which assumes that
DBFO and roads
tax payable will be about 22%, which in turn will
distort the VFM analysis in favour of PFI.
• The seven SPVs’ interest rate of 9% in 2002 and
the high level of debt, which is greater than
construction costs, mean that the DBFO contracts
are considerably more expensive than the cost of
conventional procurement using Treasury gilts at the
current rate of 4.5%.
• The SPVs’ post-tax returns on shareholders’ funds
are high and higher than elsewhere in the industry.
• The SPVs’ total effective cost of capital was about
11% in 2002. Although the NAO believed that this
additional cost of private finance (6 percentage
points above Treasury stock) represented the cost of
risk transfer (£56 m), it was difficult to see what
risks the companies actually bore since their
payments were guaranteed by the Government and
based on shadow tolls, which in the context of rising
traffic meant that they were insulated from downside
risk at the Highways Agency’s expense.
• In practice, the shadow tolls have led to a front-
loading of the payment flows and the SPVs’ profits.
• Without arrangements to ring-fence the post-tax
profits, should the DBFOs fail for whatever reason
later in the contract – despite front loading the
payment stream to cover the future cost of
maintenance – the Highways Agency could find that
it has to bear the remaining and higher cost of
private capital and the maintenance costs that it
thought it had already paid for.

PAGE 106
DBFO and roads

PAGE 107
6: A roads case
Although this contract and DBFOin general are perceived as‘successful’, this operationalsuccess is viewed independently ofthe financial costs.
The DBFO project 109
Performance against the original project and policy objectives 111
Procedures for managing the contract 114
Risk transfer 124
The financial costs 127
Summary and conclusions 129

PAGE 108
A roads case

PAGE 109
This chapter considers how one of the Highways
Agency’s first tranche of DBFO projects is operating.
Since there is a lack of ‘hard information’ available for
use in the public domain, owing to reasons of
commercial and Government sensitivity, the evidence
presented here is based mainly on interviews. We
interviewed people at the Highways Agency who are
currently closely associated with the project, including,
at the regional office, the Agency's departmental
representative who is responsible for this first tranche
project on a day-to-day basis and his line manager, the
Agency's departmental manager. We also interviewed
Highway Agency staff from head office in London. The
Special Purpose Vehicle (SPV) preferred that its
respondent should be of very senior managerial status,
and although he was closely associated with the
construction phase of this project, his involvement in
the operations phase is less direct.
After outlining the key features of our case project, this
chapter presents the perceptions of our interviewees
about three issues that have become important in the
assessment of PFI. As explained in Chapter 1, the
interviews followed a semi-structured format and the
questions asked – and hence the perceptions reported –
were initially guided by our review of academic
literature and of secondary sources specific to the
sector and the case, but there was also opportunity for
interviewees to provide additional information and for
the researchers to pursue issues arising at interview.
Our initial review suggests that three issues are
important for the assessment of PFI. The first of these
is whether the project has achieved the objectives set
for it; the second is the procedures (and their
usefulness) that have been established for ensuring that
the project delivers VFM over its life and for managing
risk transfer (the key assumption upon which VFM is
based); the third is whether the financial arrangements
are working in practice.
In terms of the project’s objectives, the Highways
Agency is of the firm belief that the construction phase
has been successful, and this is in line with the
experience of other construction projects in this and in
other sectors. Since the Highways Agency had used the
services of private companies to construct roads for
many years it was not a surprise that this project was
completed successfully. Therefore our interviews
focused on those issues that changed apparently
because of PFI, for example, that the road had come in
under budget and on time, and since one rationale for
DBFO is that integration of all aspects of the project will
enable long-term planning and cost reduction we also
focused on the project’s softer objectives, such as the
use of innovative techniques. In practice, the most
important change introduced by PFI is the long-term
operational and maintenance provision by the private
sector, which requires monitoring by the public procurer
in order for payments to be approved. Since this was a
new area of activity, much of our interview discussion
related to how this worked in practice. In this area we
were alerted to and report a number of problems or
issues that lack clarity. Interviews necessarily focused
on only some aspects of a complex project and,
although whenever possible we have used direct quotes
from the interviewees to report their perceptions fully,
the choice of questions around which discussions took
place was driven by the researchers and the academic
literature. Much of the rest of this chapter raises
concerns based on our interpretation of the interview
material, but in essence it should be made clear that
those with close oversight of the project fundamentally
view it as a successful road.
THE DBFO PROJECT
Our case study is one of the first and largest of the
eight roads DBFO projects intended to further the
Government’s Targeted Programme of Improvements.
Like the other roads projects, although the Secretary of
State for Transport was the signatory to the contract
with the SPV, the Agency has executive responsibility
for the administration of the contract, which is the
A roads case

PAGE 110
principal legal relationship between the private sector
and the Agency, with the Secretary of State retaining
overall responsibility (Highways Agency 2003).
The ownership and operations of the contract are
complex and have been subject to change. The SPV is
owned by a holding company whose ultimate owner is
a consortium of two organisations, Companies A and B.
The SPV is a shell company that has no employees,
and it entered into a joint venture with Company SA, a
subsidiary of one of its parent companies, and
Company C to provide the construction phase of the
project. It has also subcontracted the operations and
maintenance parts of the contracts to subsidiaries of its
parent companies. With about 30 similar projects
around the world, the DBFO company has considerable
experience in this type of operation.
In essence, this project has three phases: construction,
operations and finally handover to the Agency. The
statutory procedures in relation to planning were
complete by the time this scheme went out to tender.
The new construction and improvement elements,
which include over 150 structures along the route,
were completed about three years after financial close,
some months ahead of schedule. During the operations
phase the private sector will maintain the road for 30
years, including a schedule of planned structural and
replacement work, which to some extent at least will
depend upon traffic volumes. At the end of the
contract, the road and related structures will returned
to the Highways Agency with an expected agreed
residual lifetime.
The project is currently in the operations phase and so
the main point of contact on a day-to-day basis
between the public and private sectors occurs between
the DBFO’s general manager, who has responsibility for
overseeing the operational phase of the project, and the
Agency’s departmental representative, who is charged
with monitoring the service provision. As explained in
the previous chapter, the public sector already had
considerable experience of contracting with the private
sector for both the construction and maintenance of
roads. One important consequence was that the Agency
had already developed a three-volume Trunk Road
Maintenance Manual (TRMM), which sets out the
expected procedures for the care and maintenance of
roads and provides the basis for the standards expected
during the operational phase of the project.
Unlike PFI projects in other sectors, the payment
mechanism is based on shadow tolls linked to volume,
which means that the private sector carries demand
risk. Shadow tolls, based on a payment per vehicle
using a kilometre of the project road, differ from real
tolls that are paid by the user in that they are paid by
the Agency on the users’ behalf. Tolls increase over
time according to an indexation formula, but are
profiled so that eventually they will fall after the third-
party debt has been fully repaid – believed to be after
20 years – reflecting the fact that any excess of revenue
over costs represents return on equity. The Agency
needs to predict expected payments and to submit its
claims to the DoT four years in advance for finance to
cover actual payments to the DBFO companies.
Recently, this process has become more complex with
the transfer from cash to accruals accounting. It
requires an estimate of traffic volumes to be made
using a spreadsheet model provided by an independent
adviser, which are reviewed on a six monthly basis.
According to an interviewee, these estimates are generally
accurate to within three per cent of the actual flows.
Two forms of incentive system operate. First, the
Agency may award a bonus payment or impose a
financial penalty. For example, bonus payments are used
to encourage good safety performance and as a means
of avoiding traffic congestion by basing payment on the
relationship between traffic volume and speed of flow.
Financial penalties, which cannot be regained by the
contractor, may be imposed for events such as lane
closures. Secondly, the Agency can also award penalty
points to the DBFO company or its contractors, which
A roads case

PAGE 111
have a finite life, for example for failure to administer
the contract properly during the operations phase.
Beyond a certain level, these penalty points trigger
action that could lead ultimately to contract
termination. The contractual arrangements also include
the requirement that the Agency notify the DBFO’s
leading bank, in the event of any formal notices on the
contract, including penalties. This contrasts starkly with
the fact that the taxpayers have no similar right of
access to contractual and financial information.
PERFORMANCE AGAINST THE ORIGINAL PROJECT
AND POLICY OBJECTIVES
One important way of assessing a project is to consider
whether it has achieved its original objectives. These
included the requirements to construct a strategic route
for traffic, bypassing a major city and easing
congestion, by an agreed date; to construct new
carriageway; to widen and upgrade existing roads; to
construct a new interchange and new road links; to
operate and maintain the route for 30 years; and to
remove traffic from some local roads. To the extent that
the road was designed and built to meet these
objectives, it may be assumed that these objectives
were met, and this was confirmed by the Agency
interviewees, who indicated that the new construction
and improvements were achieved ahead of the
contractual schedule and were approved by the Agency.
Although the final cost of this element is not in the
public domain, it was said to be very close to target,
which is likewise unknown. Other project objectives
included: enabling innovative construction and
maintenance practices and the softer objectives of
safeguarding the environment and providing safer travel
conditions and better information to road users, and
delivering all these objectives in partnership with
industry. Although the relative weight of these
objectives in relation to the construction and logistical
objectives is unclear, our interviewees raised a number
of interesting points on these issues, which we consider
in turn.
Innovation
Proponents of PFI have argued that the private sector
would be more innovative than the public sector. Since
the design, build and maintain elements of the project
were controlled by one company there would be an
incentive to design the road in order to minimise whole-
life costs. Contractors would be allowed to use
alternative approaches to both construction and
maintenance as long as they delivered equivalent levels
of service and durability. To consider innovation in
construction first, the Department of the Environment,
Transport and the Regions (DETR), in a review of all
the first tranche projects, claimed that the use of DBFO
. . . provided opportunities to use innovative technical
solutions and new materials to reduce the whole life
cost of the road by reducing maintenance
requirements and minimising disruption to road users.
(DETR cited in NAO 2000c)
It argued that many amendments to design standards
took place during construction of this case project and
that these have delivered benefits to the project.
However, the evidence is not clear cut. The Agency
(Highways Agency 1997) has a different view, arguing:
‘Although, in theory the DBFO Co could propose
alternatives to the Agency’s existing design, few bidders
exploited the opportunity’.
Specifically with regard to our case, one Agency
interviewee indicated that DBFO had led to some
innovation during the construction phase in relation to
the use of new materials and earth-moving techniques.
Without the long-term savings to be gained on the
operations contract, he argued that there would have
been no reason for the private sector to carry the risk
associated with innovative techniques of construction:
‘Maybe if they built it in the ordinary way there
wouldn’t be the incentive to take that risk’.
The contractor needs to seek approval to use innovative
techniques and this interviewee argued that DBFO
A roads case
PAGE 112
provided the incentive to do that.
They need a departure from standard agreement and
they’ve more incentive to seek departures from standard
than perhaps the standard designer . . . they’ve got an
incentive, a cash incentive, to do it quicker, a lot more
quickly, in which case we get our benefit quicker.
This implies that in part such innovation was
introduced for faster completion rather than lower
maintenance costs. However, in contrast an SPV
interviewee argued: ‘I think the big issue on the DBFOs
is that, in our experience anyway, as soon as we tried
to vary the scheme that the Highways Agency had
designed they vetoed it’.
This is possibly because the Agency’s consultants had
to approve all drawings and:
In our specific case the Highway Agency’s adviser was
the consultant they’d used when they prepared the
scheme, and so when our designer came along with
something that we felt was an improvement, it was
two sets of designers arguing against each other. So
I’m not saying we didn’t get some things through but
nothing like as many as we would have liked. (SPV
interviewee)
An Agency interviewee argued that the Agency would
refuse a particular construction type only if it believed
there to be very strong safety reasons against it,
because the Agency had no other reason to do so.
Since the life expectancy of the road is greater than the
contract period of 30 years, and provided that the road
is returned in the condition expected by the contract,
the use of new technologies should not have any
adverse effects on the Agency.
Nevertheless, the Agency has acknowledged the
validity of the SPV’s general point by indicating that
bidders must become involved in the outline design of
underlying assets if greater innovation is to occur
(Highways Agency 2003). It recognises that the first
tranche of DBFO schemes included specifications that
prescribed how the service was to be delivered, rather
than focusing on outputs, and this undermined the
ability to introduce innovation.
In relation to maintenance, the Agency departmental
representative argued that innovation was not very
evident and a second interviewee agreed. The SPV
perspective, especially in relation to maintenance work,
is that the Agency will not allow divergence from the
Agency standard maintenance manual. This
interviewee recognised, however, that views differed
within the Agency. He indicated that:
I think it is fair to say that the Highways Agency has a
number of people, especially in their divisional
offices, who would be quite keen to see work done in
a different way, but the headquarters groups are
somewhat remote and not in the real world, and they
have their way of doing things and it’s quite difficult
to get them to change. (SPV interviewee)
Pressing for change is perceived as a time-consuming
activity for which ultimately there is limited resource
available. In another project with which the company
was involved the organisation was different, so that the
SPV was nominated as the technical improvement
authority. Consequently it had considerable involvement
in approving the design as well as drawing it, and found
that ‘this gave us a lot more freedom to change things’.
This analysis shows that, first, there are two aspects to
innovation: construction and maintenance; secondly,
despite the Agency’s claim, it appears that there has
been less innovation than expected or possible; and
thirdly, the purpose of construction innovation –
implemented or proposed – was partly faster
completion and partly lower life-cycle costs. One final
point is that the evaluation of innovative techniques is a
long-term issue, and as yet it is too early to assess
whether those innovative techniques that were adopted
A roads case

PAGE 113
will deliver benefits over the whole life of the project.
Softer objectives
The Agency has environmental protection objectives
and a key objective of reducing accidents on trunk
roads, which apply to all projects, including DBFOs. In
the context of DBFOs it argues that, in principle at
least, these objectives are a potentially significant VFM
consideration, although they may not be quantifiable
and hence may not be included in the comparison
between the PSC and DBFO options (Highways Agency
2003). Some environmental requirements were built
into our case contract, and the perception within the
industry is that serious efforts were made to protect the
environment. One interviewee argued:
I think the DBFOs that I’ve been involved with –
there’s a lot of intention to protect the environment –
what we would consider to be inordinate amounts of
money have been spent in preserving it. On [this case
road] we had to protect this plant. I’ve forgotten what
this damn plant is but whatever it is has spread all
over the place. So whatever conditions suit it there’s
more of it now than there was before.
This interviewee proved additional examples in relation
to tree planting, collection of reeds and crayfish for
preservation and the moving of a heath, all of which he
argued might not have happened previously without,
however, suggesting that this was connected to the use
of DBFO as opposed to traditional sources of finance.
In our case project, safety payments may be made as
bonus payments, which are intended to encourage the
SPV to address safety issues. The SPV is concerned
about the use of payments based on safety
performance indicators because it perceives that it was
refused permission to design the road in the way it
believed would be safest, although it recognised that
this was not a precise science. Consequently it is
reluctant to accept responsibility for something over
which it has no control.
Until very recently the Highways Agency would not
have concrete barriers down the centre of a road –
they insist on having a particular design of steel
barrier – now most sensible people would say if you
have a concrete wall down the middle of the road it’ll
stop traffic crossing over and that’s where you get the
worst accidents. So you know, different people have
different ideas about what is safe and what is not
safe.
The Agency has suggested that for future DBFOs there
should be a five-year rolling operational plan that would
include issues such as safety, facilities for pedestrians
and environmental protection. In addition, payment
criteria are to be strengthened so that the safety
payment will be both a bonus and a deterrent.
Performance will be tied into a comparison between
national and local accident rates on the relevant stretch
of road. Accidents are not a risk that this SPV wishes to
carry, however, especially over relatively short stretches
of road.
You’ve seen what drivers get up to on the roads – it’s
the luck of the draw. People have the most
unbelievable driving habits and you’re asking a
company to take that sort of risk – I don’t think that’s
a particularly clever idea. Part of the difficulty at the
moment is that these DBFOs are relatively small
stretches of road. I think a much more preferable
situation would be to have much bigger stretches of
road that would allow the concession company to be
judged fairly.
There is an absence of quantitative information or
evaluation of the achievement of these softer objectives
at the Agency and no comparison of the relative
performance between DBFO and conventional forms of
contracting. However, these perceptions – taken at face
value – imply that these factors can be addressed if
there is a specific allocation in the contract and
presumably, therefore, in the bid price. Despite the
Agency’s desire to use the DBFO payment mechanism
A roads case

PAGE 114
to reduce accidents and thereby increase safety, this
may not be a simple matter to achieve. Given that the
evaluation of environmental and safety objectives is a
long-term issue, as yet it is too early to assess whether
these practices will deliver benefits over the whole life
of the project.
Partnership and/or private road operators
One objective of the first tranche of DBFOs was to
create a private road industry, so that companies can
develop their expertise and bid for future projects both
in the UK and overseas. The Agency does not appear to
have evaluated whether DBFO has contributed to the
achievement of this objective and its relative
importance is unclear. Furthermore, in the previous
chapter we found that there have been few new DBFOs
after the first eight, thereby inhibiting the growth of
expertise in the UK, although our case SPV has
experience of bidding and winning contracts abroad.
A second objective of DBFO was to deliver the wider
objectives of the Agency’s mission in partnership with
the private sector. Although the relationship between
public and private sectors has been characterised as
one of partnership, the interviewees were not clear that
a partnership had been achieved on this project. An
interviewee from the Agency said:
Not totally partnership. I think we try and bring them
along with us – obviously we do have differences of
opinion. I think the advantage of saying you’re working
in partnership is you both try to do it, but sometimes
we might feel we’re not getting the support or they
seem to be intransigent about certain things. I think
you have to respect that they have a different point of
view, and I hope they do the same about me.
In summary, this analysis of the policy’s success in
relation to the Agency’s softer objectives suggests that
it has been limited. The very different views of the two
sectors about innovation and safety suggest that the
issues will not be easy to overcome. Whether the DBFO
in roads policy has created a sustainable private sector
road industry can be judged only in the longer term,
but in the foreseeable future it appears that there is
work yet to be done in establishing stable partnership
relationships between contractors and the Agency.
PROCEDURES FOR MANAGING THE CONTRACT
We consider the payment mechanism in some detail
since this is crucial to understanding the contract
monitoring regime. We then examine: the reporting and
monitoring procedures that surround it; the sanctions
that are available to the Agency to discipline the SPV;
and the procedures for contract amendments and the
end-of-project handover for their effect on VFM, since
these are critical to an understanding of how VFM is to
be delivered.
Payment mechanism
Although the payment is based on a shadow toll
dependent on volume of traffic, it actually involves
three criteria: availability of service; usage/demand;
and performance, which includes safety performance
and lane closure elements. First, availability of service
payments begins on new constructions once the Permit
to Use is issued for the road to open to traffic, and
payments amount to 80% of the full level of traffic
payment. 100% payments begin once the construction
works are complete and the Agency issues the
Completion Certificate.
Secondly, payments for usage are based on shadow
tolls that represent a payment per vehicle using a
kilometre of the project road within different traffic
bands. Bidders were required to establish the
parameters of traffic levels for a maximum of four and a
minimum of two bands, based on their own
assessments of traffic levels. Although the top band
must have a toll set at zero so that the maximum
liability under the contract is capped, there is no
minimum safety net for the contractor. So, for example,
incidents such as a fuel crisis or foot-and-mouth
A roads case

PAGE 115
disease, which resulted in a significant dip in volume,
represent risk to the SPV. Inside each band there are
two rates: one for long and one for short vehicles.
Vehicle length is used as a proxy for the more
significant effect of weight, because there is no
available method for differentiating between vehicle
weights. It is also possible for the SPV to gain bonus
payments, related to traffic speed, as an incentive to
avoid congestion, for example, by ensuring a
reasonable snow gritting policy. The payment
mechanism is based on a flow/speed relationship, with
speed linked to the relevant volume of flow.
Thirdly, performance has two key elements. The first
relates to the Agency’s key objective to reduce accident
levels and it therefore encourages contractors to seek
approval for safety improvement schemes. The SPV
pays for these schemes but is compensated by a
payment equal to 25% of the economic cost of
personal injury accidents avoided in the following five-
year period. This compensation is measured by
comparing accident statistics for three years prior to the
implementation of the scheme. In relation to the
second element, a deduction is made from the toll
payment when lanes are closed for reasons within the
control of the SPV. Lane closure thus attracts a
financial penalty, and the level of the deduction
depends upon the number of lanes closed, the duration
of the closure and, in order to provide incentives for
closure at off-peak times, the expected traffic volume at
the time of closure. Despite the first performance
measure, however, it is assumed that closure by the
police after accidents is not within the control of the
contractor and is therefore not subject to penalties.
The Agency makes monthly payments of a constant
value for a 12-month period to the SPV. It makes an
estimate, based on the previous year’s volume, to establish
the size of the monthly payments for the year. ‘At the
beginning of each year the Highways Agency works out
how much they paid us the year before, divides it by
twelve and pays us that on a monthly basis’.
At the end of the year in March or April, an annual
reconciliation is performed and adjustments are made
for actual traffic volumes less any charges. In this
contract there are sculpting factors to be applied so
that the payment for an individual year may be higher
than the norm to reflect the need for extensive planned
maintenance in that year.
The reconciliation between estimate and actual usually
results in a higher payment being required, because
traffic volumes have outpaced predictions. Final
payments for each year are based on a reconciliation
report provided by the contractor, which is verified by
the Agency using both manual calculations and a
spreadsheet model provided by their advisers, so that
the figures can be checked independently. This
reconciliation has not always been agreed at the first
attempt. ‘There’s been a change of personnel on their
side, of the people who actually do the annual
reconciliation, and we have to send it back, and then
we’ve agreed the figures’ (Highways Agency interviewee).
Data collection and reporting
The Agency makes the monthly payments on receipt of
the SPV’s report, which sets out information on traffic
volumes, lane closures and a self-assessment of
performance as specified by the contract. In addition to
collecting and reporting data that feed directly into the
payment mechanism, the SPV also has to collect and
report on other aspects of its operational performance
that are important for the Agency’s work and yet do not
appear to be included in the payment mechanism. For
example, the SPV perceives the Agency as being very
keen on the availability of emergency telephones, and
measures this even though there is no availability
payment for telephones. The most significant element is
the traffic volumes, which need to be counted with
great accuracy, given the nature of the payment
mechanism.
The initial responsibility for counting traffic volume lies
with the SPV and the data are then monitored by the
A roads case

PAGE 116
Agency. The SPV counts the traffic using loop
technology under the road and ‘most people wouldn’t
even know that their car is being monitored’. Traffic is
measured at a number of points along the road on a
continuous basis, and these raw traffic data are
reported monthly.
There is a verification process, performed four times
each year, during which a video is made of traffic flow
at the same locations at which the counting equipment
operates, so that this equipment can be checked
visually. This is a time-consuming activity and its
contribution to accuracy is unknown. An Agency
interviewee indicated that the Agency was currently
attempting to establish contact with a company in
London to check these verifications because having
people sitting watching a video was likely to be
problematic. A similar argument was made by the SPV.
The loop technology is about ten times more accurate
than we expected it to be, so you know we are within
half a percent of actual, and the visual verification is
a bit problematic – people are staring at a camera for
a long time. I would personally take the loops as being
a better measurement than the video, but the
Highways Agency insist.
This insistence is based on a perceived need to ensure
integrity of the process, although as an interviewee at
the SPV argued: ‘I suppose there is an opportunity for
us to fix the data but I mean that’s just something we
wouldn’t contemplate. It’d be too difficult anyway’.
The Agency believes that manipulation is in fact
feasible even though the traffic counting is
subcontracted to a separate company, which is not paid
on volume. This means there would have to be
collusion between one or more companies in order to
manipulate traffic volume data.
I’m sure if you wanted to do it you could manipulate
the technology. Basically you have to go back to the
binary file which is something inside the machine
itself, and that would need the collusion of the people
who actually do the traffic counting.
The Agency believes that the verification processes
prevent manipulation and retains the data for a number
of years so that audits can be conducted.
Self-assessment of performance includes evaluations of
road availability based on times and durations of lane
closures, response times in relation both to necessary
repairs and to dealing with complaints from the public.
There is a booking system for recording the notification
of problems and the triggering of a response, so that it
seems that the time taken to respond to problems is
the crucial performance indicator, rather than
performance itself. Yet, at least in the early phase of the
contract, some difficulties were encountered.
When we started off we did have one or two hiccups.
It’s fairly onerous, depending on the grade of defect. If
it’s the worst type of defect you have to repair it within
so many hours, and I mean, we’ve only got so many
people. So if you’ve got too many of these you will
have difficulty.
In general, while in the early stages of the project, the
Agency was evidently unhappy with the information
provided by the SPV and requested changes in its
reporting system, the SPV believes this is now
satisfactory.
It’s fair to say that for six or nine months they were
looking for a number of changes . . . so there was a
certain amount of to-ing and fro-ing and there were
certainly a number of things that took some time to tie
up, which they weren’t happy about, but I think now
all are reasonably content with the way we report.
The nature of this reporting is critical, given the way in
which the Agency monitors performance, a point which
we take up in the next section.
A roads case
PAGE 117
Monitoring by the Highways Agency
With PFI the public agency moves from providing to
procuring services and thus acquires new tasks and
roles, the chief of which is monitoring, because it must
ensure that it is receiving the services for which it is
paying. Essentially, this monitoring function consists of
auditing the SPV’s reporting methodology, processes
and systems and ensuring that it complies with its
systems, rather than checking actual performance. That
is, to use the language of financial auditing, monitoring
is based on compliance assessment rather than
substantive testing.
The Agency appoints representatives to monitor the
contracts and ensure that the DBFO companies comply
with their contractual obligations. An Agency interviewee
whose role had changed because of DBFO said:
This is hands off. I would not query the work they are
doing, you know, ask them to do less. You’ve got to let
them use their expertise – you can ask them why they
are doing something, but you can’t say you won’t do
that or you will do this. That’s a sort of fundamental
change.
This project uses internal monitors, but in addition
monitoring may be subcontracted to an external
consultant, with oversight from the Agency. According
to the departmental representative: ‘Basically they [the
senior managers] decided they needed external staff –
we were short of civil servants so they brought in
consultants to help us. Then they suddenly decided
they didn’t need the consultants any more’.
The NAO had criticised the Agency’s monitoring
procedures on the first four DBFOs, and an interviewee
suggested that the underlying problem was a failure by
the Highways Agency to train staff. As a consequence,
the Agency introduced more formalised monitoring
procedures, including a departmental representative’s
guide or manual on monitoring, staff training in
negotiation and audit skills, and regular meetings of
managers every two or three months to share best
practice. This training included within it a focus on
partnership relationships: ‘We send staff on audit
training straight away. Also we do negotiations. We try
and generate a partnership approach’. The Agency staff
can also draw on consultants’ advice, especially ‘if
things get very technical on the financial side’.
The Agency espouses a desire to follow a ‘hands off’
approach to monitoring. A monitor reported that ‘We’ve
been told to keep a light hand on it – let them do the
work.’ In practical terms this means that the data from
the contractors are monitored on a monthly basis with
a formal auditing process three or four times a year. In
addition to these checks by the Agency’s internal
auditors, an NAO team visited frequently, and perhaps
more so on this PFI than for other projects (probably
because of the size of the scheme) focusing on
procedures and project management. ‘They’re checking
our procedures and our documentation, and the way
we manage the project.’
Despite earlier criticism by the NAO, especially in
relation to maintaining a paper trail, more recently
feedback was described as good because: ‘In earlier
audits they suggested that we perhaps should show
that we’ve done things – as time has gone on we’ve
improved . . . I mean we have a system now with our
annual reconciliation and it’s checked against theirs
[the SPV’s].’
However, one consequence is that administrative cost
savings may not have been realised. The Agency’s
departmental representative, speaking of the
monitoring learning curve said,
I think what we’ve learned is that you have to show
that you’ve done something . . . . It’s not that you’ve
done it, it’s a case of putting something on file saying,
‘Route run completed and reported problems x, y, z,’
just showing that you’ve done it. We’re not brilliant
but we’re much better.
A roads case

PAGE 118
The purpose of the Agency’s formal audit is to focus on
the SPV’s quality plan. This plan includes details of
some 25 procedures, and appropriate sub-procedures,
for all aspects of their role including, for example,
issues such as winter maintenance, liaison and
emergency procedures, emergencies in tunnels, etc.
The Agency checks compliance with these procedures
on a rolling basis, covering about four of these per year.
The objective of the audit is to ensure that the SPV or
its subcontractor is carrying out its activities in
accordance with this written plan and the Agency’s
maintenance manual (TRRM). Although it would be
possible for the Agency to monitor on a random basis
without prior notification, the normal process is to
agree a schedule of procedures.
We don’t just descend on someone and say we want to
look at this that and the other. We don’t do that
because I think what we try to do is work in
partnership with these people. And if we did do that, I
think we’d antagonise them because it’s going to
disrupt their day.
The lack of random checks in the formal audit
processes is recognised by the SPV: ‘I’m not sure if they
[the Agency] do random monitoring. I’m not aware of
them ever attempting to do that.’
In order for the Agency to monitor the SPV’s monthly
reports, a number of procedures are adopted. Traffic
volume data are received in two formats: raw and
processed data. These data are input to a spreadsheet
of a traffic model that compares the data against the
previous month’s and the previous year’s. The monitors
will identify any blank periods in the data, when the
loops have not been counting, since the SPV is entitled
to insert estimated traffic flows during these periods to
generate the processed data. Traffic counter availability
is perceived as being better on this project than on
other projects nearby and: ‘Generally, yes, the counter
availability has been there . . . . But recently we had a
problem with one of the loops and it took a long time to
put it back in’.
In the event of non-availability, data are estimated from
other counters on the road.
Basically we patch the data . . . we’ve got three
counters, one, two, three, so if number 2 goes down
you look at the two weeks before and the two weeks
after [non-availability] then you look at the first
counter and the third counter and then at all three
counters so the missing data is patched through by a
method that’s been agreed.
In order to be able to monitor other monthly data, the
Agency operates a system of day-to-day checks, the
purpose of which is to monitor specific details. An
Agency interviewee indicated that there is a route run
on a monthly basis checking for lane closures, whether
work is taking place at peak or off-peak times, and
maintenance issues. This checking was described as
‘random’. In addition, members of the public and the
police are also potential sources of ‘random’ information
about the road. Most contacts from the public are
reported to be requests for information, however,
especially in relation to an interchange junction, and
the police have only ever provided information about
road subsidence, which is related to a geographical
feature of this road. These checks notwithstanding, the
process is essentially based on trust in the SPV’s
report. Speaking about lane closures, an interviewee at
the Agency said: ‘To tell the truth we trust them on that
one because usually all the lane closures go on
overnight. I would expect if there’d been a problem I
would get complaints. I’ve not had any complaints’.
Potentially there is one source of check data available
to the Agency in relation to lane closures. In order to
close a road the SPV must seek prior approval, through
a temporary road traffic order, from the Agency, which
approves times and locations for the closure.
A roads case

PAGE 119
Consequently, although there may be reasons for
variations, the Agency could check these approvals
against the contractor’s report data. However, this is
not done at present. ‘I haven’t checked one against the
other, the notice against the report, because the report
comes in later. We assume they use the closure
because they need it to do the work’. In this case, the
SPV indicated that lane closures normally occur at
night when no penalty is payable because traffic is light.
At the end of each monthly reporting cycle a meeting is
held between the Agency and the SPV’s staff and a
summary is prepared. At the end of each quarter there
is a final agreement on the traffic flow figures for the
previous three months. The SPV has a general
manager, based on site, who was described as having
day-to-day interaction with the Agency at the beginning
of the project. More recently as ‘things have settled
down’, however, the monthly meetings at the end of the
reporting cycle are the more usual form of contact.
Additionally contacts may be made between the
Agency’s representative and the SPV’s managers and
engineers and, on occasion, with technicians. The
Agency’s representative indicated that it is rare that he
has contact with anyone of director status from the
SPV. The SPV indicated that a head office
representative was closely involved with the Agency
during construction, but this degree of contact is now
significantly reduced and normally takes place only if
there is to be a variation to the contract.
Respondents from both sectors indicated that there was
trust in the quality of the contractor’s reporting. A
private sector interviewee with experience of non-road
PFIs that involved a cleaning contract said:
I don’t think, at least in my experience, there’s ever
been any suggestion that we weren’t reporting
anything other than the truth. It’s not quite like, well
you know, whether there is dust on the table, and how
many specks of dust – it’s much more factual, so we
don’t have those sorts of problems.
To a large extent, this trust is likely to be a
consequence of the objective nature of decisions. For
example, a road’s skid resistance fades over time and
needs to be renewed. Because there is a regime under
the Agency operating procedures that must be followed,
it is relatively clear when a repair must be effected.
That is, there is a technologically determined measure
by which decisions can be justified.
Nevertheless there are some situations in which
judgement is required and in these cases there is scope
for differences between the organisations. Two
examples were provided relating to the quality of the
network, which is heavily dependent on the standard of
maintenance. Interpretation of that standard now lies
with the SPV. First, an example was given of a part of
the road that runs over an opencast mining area.
We have had some problem with settlement in the
road, and when that happens you get a slight wavy
thing in the road and then it’s a matter of judgement
as to when it needs to be repaired, and we’ve had
some differences of opinion.
The SPV indicated that normally, if the Agency
becomes concerned about an issue, it is already under
review by the contractor, but it could take some time to
organise a response.
I’d have to say I’m not aware of any time when there’s
been a complaint when we haven’t been in the middle
of doing something about it, so the criticism might be
that we haven’t done it quickly enough . . . . But we
have to go through a procedure of inviting tenders to
do the work and it might take a month to six weeks to
get that sort of work set up.
A second example of differences of opinion was given in
relation to the timing of gritting to maintain traffic flow
in the event of a snowfall. Network availability and
quality are important to the Agency since it is
responsible to the public for service delivery and is
A roads case

PAGE 120
perceived to be responsible if roads are not gritted,
although under PFI, this responsibility no longer comes
under its direct control. Issues such as the timing of
gritting, never an easy set of decisions, have now
become entangled with the SPV’s trade-off between the
loss of revenue if traffic flow ceases versus the cost of
the gritting operation, giving rise to potential disputes
between the Agency and the SPV.
Despite these differences of opinion, however, the
Agency’s representative’s impression is that generally:
‘It’s a very tidy road actually. We find very few things
wrong with it’. In other words, in his opinion, after
some initial changes to the reporting and monitoring
systems these now work well to deliver the required
standard of service, in this case.
Sanctions to deter poor performance: penalty points
The terms of the contract include a penalty system
whereby the Agency can award penalty points for
failure by the concessionaire to perform during both the
construction and operational phases. It appears both
from discussions with the Agency and from recent
evidence about the Agency’s maintenance contracts
(PAC 2003c) that the penalties relate to the response
time to rectify problems rather than actual poor
performance. The allocation of points above a threshold
allows the Secretary of State to take remedial action
which would take the form of triggering increased
monitoring by the Agency, the cost of which would fall
on the concessionaire. In the event that non-
performance continues, the Agency eventually has the
right to terminate the contract. In practice, penalty
points are issued only after a warning: ‘You don’t just
impose them the first time something goes amiss. You
ask them why it’s amiss and it depends how important
the transgression is – if that’s the right word’.
Normally the intention to issue a penalty point triggers
high-level negotiations: ‘If you give penalty points
directors suddenly talk to directors’. An excessive
accumulation of penalty points could ‘be linked to us
taking over the contract’.
The Agency has issued very few penalty points on this
contract and the SPV indicated that they had found
them ‘pretty easy to avoid’. During the construction
phase, a limited number of penalty points were
awarded to the subcontractor but not to the
concessionaire, with one interviewee indicating that
there had been some reluctance within the Agency to
issue penalties: ‘I felt inclined during construction – but
I wasn’t allowed – partnership.’
Penalty points can be awarded also during the
operations phase for failure to administer the contract
properly, but an SPV interviewee said: ‘We haven’t had
one penalty point during the operations phase’. He said
that there had been very few penalties relative to the
contractual targets that could trigger contract
termination.
The number of points that you had to get to terminate
the contract was so great that we never got anywhere
near that. You have to have something like three
hundred penalty points within twelve months. I don’t
think we ever got above 25 or 30.
A further ‘incentive’ to perform is provided by the
requirement for the Agency to notify the syndicate’s
lead bank directly when it issues penalty points.
Perhaps not surprisingly, the control exercised by the
syndicate’s bankers is a tougher target than that in the
contract and both the Agency and the SPV perceived
that the banks attach considerable importance to this
issue. An Agency interviewee said: ‘It’s the banks that
are worried about their investment – so contractors
don’t like getting penalty points – so they are a good
incentive for them to do what they’re required to do’.
The SPV confirmed this:
It was quite amusing really because they [penalty
points] were the only thing the banks ever did get
A roads case

PAGE 121
worked up about. In the planning agreement with the
banks we got into severe difficulty if we got say 200
points. Even with those 20 or 30 points we got more
enquiries about what was going on than anything else
at all – it was totally out of all proportion.
Although the Agency representative acknowledged that
another local SPV was less satisfactory, having incurred
penalty points, he seemed to sum up the Agency’s
belief that the system seemed to be working well in this
project, saying: ‘I’ve never given a penalty point yet –
they seem to do all right’.
Sanctions to deter poor performance: terminating a
contract
As outlined earlier, the SPV is a shell company that
works through a complex web of contractual relations:
the SPV subcontracts work to a main contractor, who
will appoint further subcontractors; it also appoints
subcontractors for grass cutting, maintenance of the
counting equipment, and for communications and
electrical aspects. Consequently, the SPV must
coordinate all its activities if it is to operate effectively
and deliver the required level of service. This means
that, where service delivery is unsatisfactory, it must be
possible for the Agency to terminate the SPV’s contract
and for the SPV company to terminate the main
contractor’s and subcontractors’ contracts.
Although in this project the SPV and its subcontractors
have attracted few penalties, an SPV interviewee
indicated, in response to a question asking whether it
was possible to terminate the contract of any one
provider, that its ability to do so is variable.
I would say it’s to all intents and purposes impossible
to get rid of the main contractor unless you’re right at
the beginning or right at the end. It’s certainly
possible to go to the main contractor and get him to
get rid of one of his subcontractors, and certainly that,
in my experience, has happened during the operations
phase. The grass cutting is for three years – I don’t
think there would be any difficulty in terminating that
contract. We’d find it quite difficult to terminate the
civil, the communications and the electrical, unless
we were sort of doing it amicably.
In effect, termination of the main contract is
problematic because it would leave the SPV, a shell
company, responsible for the road and it would take
time to organise a replacement contractor. Furthermore,
although it could dismiss its own and the contractor’s
subcontractors, this is subject to the constraints of the
industry itself. For example, the SPV is subject to a
monopolistic supplier in relation to the specialist
counting equipment.
The counting equipment is a nightmare because that’s
proprietary equipment and we are absolutely stuck
with the people that supplied that equipment. This is
one part of the industry that nobody’s particularly
happy with. There are only two or three people who do
this sort of thing, in fact we may be down to two now,
and they’ve got us over a barrel and they know it.
Similarly, it would be difficult for the Agency to
terminate a contract for poor performance, because
they would need to maintain the road until a
replacement contractor was found. On this project,
however, it was thought most unlikely that such an
eventuality would arise because, if high levels of
penalty points were reached: ‘I would think not only we
would be doing something, but their directors would be
doing something.’
Because the current project has so few penalty points
and consequently is a long way from such serious
action, the Agency believed that it did not need a
contingency plan in place to manage such an
eventuality, but an interviewee said: ‘We would get
MAC [combination of the maintaining agent and the
regional maintenance contractor roles that preceded
DBFO] to take it over – the road is not very long’.
A roads case

PAGE 122
In summary therefore, it appears that the penalty
points system does have the potential to deter poor
performance by the SPV, especially because of the role
of the financial institutions. Nonetheless, contract
termination is perceived as a difficult if not impossible
event and it is doubtful, therefore, whether it can serve
as an effective sanction.
Contract amendments
PFI involves signing long-term contracts for the
provision of services, typically for 30 years. Obviously,
changes to the contractual specifications are going to
be required for various reasons, including new legal
requirements, especially in relation to health and
safety; improving facilities; change of use of the
infrastructure; and new technologies. The NAO
(2003b) has warned that contract amendments offer
the opportunity for the private sector to earn substantial
additional revenue, with a consequent impact on the
project’s VFM. Indeed, the Agency became involved in
a considerable amount of change very soon after
implementation of this project.
The Agency described contract changes as ‘one of the
most difficult situations’. Although the contract
documentation, when written in the mid 1990s, was
described as very good, subsequently standards and
requirements may change. The impact of any change
has to be costed not only in terms of the immediate
outlay, but also in terms of the annual cost over the
contract lifetime. The Agency gave this example of an
improvement.
We’ve put a new sign up – a big new electric sign –
we pay for the improvement, the sign goes up, and
then we’ve to negotiate with them and agree how
many times that sign will need to be replaced in 30
years and I’ll say five and he’ll say three. They have to
say how much cleaning it’ll need, they might say, well,
it’ll get knocked down three times by motorists, we’ll
say well yes, but you’ll get it on the insurance –
although you have to catch them because they’ll drive
away. So it’ll wear out three times, get knocked down
twice and we won’t catch them, then we negotiate a
figure for the change.
A second example was given in relation to standard
response times, which were set out in the contract for
serious maintenance problems but which then proved
inadequate. Consequently, these were reduced from a
60-minute to a 30-minute response time in some
circumstances, but this resulted in an additional cost to
the Agency. This interviewee at the Agency stressed
that ‘the actual introduction of work’s not difficult’, but
it was the consequences, or ‘settlement of account’ that
causes the difficulties. Clearly, the outcome of these
negotiations affects the project’s VFM and, since there
is no realistic alternative to using the SPV, the latter has
a strong bargaining hand. Nevertheless, and by way of
contrast with the trust case described later, the Agency
interviewee believed that a reasonable outcome was
likely since these negotiations occurred as between
equals, ‘they are chartered engineers and we are’.
Another example of contract amendment arose out of a
regulatory change relating to discontinuing the use of
concrete as a road surface. An interviewee at the
Highways Agency said:
We’ve got this thing where the Government decide to
resurface all the concrete sections of our road, and
that’ll be one of the biggest jobs. I wasn’t aware that
we would compare that with the public sector
comparator – not for a Government initiative. I don’t see
it as part of my job to keep that up to date. If someone
tells me it is I will – but I’ll need a lot of training.
At the time of construction, concrete roads were
permissible and met the statutory terms of the contract;
however, the same interviewee continued:
We weren’t very happy, but you know, they’ve met
their requirements of the public enquiry and
everything else – but now we’ve to pay for it being
A roads case

PAGE 123
resurfaced and that’ll absolutely tear apart their [the
private sector contractor’s] maintenance strategy for the
future – the concrete was there forever. Now we put
some blacktop on top of that, which needs replacing
every . . . we’ll say ten years and they’ll say seven – and
there goes the negotiation.
In the case of regulatory change, therefore, the
Highways Agency bears the cost.
The road is also subject to a regional initiative for a
driver information system, the capital cost of which is
not part of the DBFO but which may have an impact on
the maintenance of the road.
That’s a contract that’s been regionally let, but some
of the works are going onto my road. The cost is not
borne by myself – it’s somebody else’s budget, the
only thing we’re paying for is the maintenance.
(Agency’s departmental representative)
This change has not been input to the PSC and
therefore over time the base case will lose its value as a
comparator, reducing the usefulness of the PSC as a
benchmark against which to measure VFM. The further
into the contract the change takes place, however, the
less difficult it becomes to cost change, because
predictions of future cost have to be made for a
reduced period of time.
When pricing amendments during the construction
phase, the calculations were kept separate from the
main contract, so that a price was agreed that did not
affect the traffic parameters and the bands on which
the shadow toll is calculated. It was argued, ‘this would
be a bit of a nightmare’. Such payments are an
additional cost over and above the shadow toll. An SPV
interviewee said that some likely future amendments
might involve renegotiation of the toll but ‘it’s not a nice
thing to have to do’. Such a fundamental change to the
pricing of the entire project could have a significant
impact on VFM.
The end-of-project handover
The actual lifetime of the road after the PFI contract is
important because it will affect the eventual VFM
obtained over the whole life of this project. According
to the terms of the contract, towards the end of the 30-
year contract, the Agency can withhold payments
against the performance of necessary works, which will
be agreed following a survey some five years before the
contract ends. The Agency’s acceptance of the road’s
return depends upon a final inspection of its condition.
At this early stage in the project’s life there is no clear
plan as to how that process should be managed,
although the Agency does maintain a risk register that
records the relevant risks on each of its roads, which
ought to provide information to guide the end-of-
contract inspection. For example, a Highways Agency
interviewee said:
We’ve got a culvert and there’s aggressive ground
there. You’ve got concrete, you’ve got steel and if
you’ve got excessive sulphates in the soil it’ll corrode
the steel. So we’ve put in some electrical stuff that
will repel the ions. Now that’s one of the risks that will
obviously affect the life of the structure. So hopefully
the risk register would include that in the inspection.
The manager for this contract noted that: ‘that will be
an interesting time, when we come to negotiate the
residual life, but there are conditions in the contract’.
This is likely to be a complex process since the road
and the various supporting structures may have
different residual lives attached to them by the contract
at the point of handover.
The Agency representative said: ‘Before the road is
handed back there’s going to be an inspection, so I
presume we’re all hanging our hats on that inspection’.
In other words, although there will be an inspection
prior to handover it is not clear that robust procedures
have been put in place to ensure that the road is
returned in good condition. Since staff involved in either
A roads case

PAGE 124
the original contract negotiations or in the current
phase in both the Agency and the SPV will no longer be
employed at the point of handover, the wording of the
contract is likely to be critical to the outcome.
Conclusion
In this section we have discussed some of the
procedures for controlling and managing this contract.
The nature of PFI is that many decisions have been
transferred to the private sector and thus within the
public sector the emphasis is on monitoring. At
present, the focus is on the data collection and
monitoring that surrounds traffic volumes, since these
are a major driver of cost to the Agency and income to
the SPV. In this area it is relatively straightforward to
design an audit trail that is capable of detailed
monitoring. Accurate traffic volume counting depends
upon the accuracy of the loop counters and their
availability, however, and changes to the monitoring of
the loop-counting data are still being investigated
several years after the opening of the road. Since much
of this road is ‘new build’, currently there are relatively
few issues surrounding repairs and (consequently) lane
closure. Nonetheless, the interviewees indicated that
where judgements need to be made about the timing of
repairs or the gritting of roads there is scope for
conflict, which is not easy to manage within the
monitoring system. Thus the extent to which
maintenance risk has been transferred is unclear. Since
the contract is perceived to be operating well there is
limited contingency planning in place.
RISK TRANSFER
With risk transfer being crucial to the VFM case, the
Government sought, via DBFO contracts, to transfer a
number of risks, including statutory procedures,
protestor action, latent/inherent defects; design,
construction, operation and maintenance problems;
downside traffic volume; insurance and indemnity risks;
and non-discriminatory legislative risk. This project has
a risk register that sets out the probable risks at each
stage of the contract and this was used to determine
which risks should be transferred.
In relation to the first risk, statutory risk, this project –
like most of the first tranche projects – had planning
permission before the contract reached financial close,
and therefore the private sector did not carry any risk in
relation to statutory procedures. On a later project,
however, one SPV did take the project through these
procedures. A number of our interviewees in both
public and private sectors reported that their
understanding from the sector grapevine was that this
company would not do so again because uncertainty
about the outcome represents too great a risk, and
there may be a lack of expertise. An Agency
interviewee also expressed his own opinion that this
type of risk is probably too great for the private sector:
‘Trying to get it through a public enquiry and ending up
with nothing at the end of the day – you might get
objections – you get protestor action – or maybe there
is a delay and you have to look at an alternative route –
it’s too hard.’
Nevertheless, the Agency remains committed to the
private sector’s taking some of this statutory risk if the
concept of construction design and innovation on the
part of the private partner is to have any substantive
meaning. It recognises that bidders would be unwilling
to accept risk associated with large schemes at an early
stage in the statutory process (Highways Agency
2003).
In relation to the second risk, protestor action, one
aspect of private sector efficiency may be its ability to
respond robustly to certain kinds of public activity. A
story from an SPV interviewee illustrates this point.
When we were building [this project] a chap parked a
caravan on our land, and he made an illegal
connection into the local grid and ditto to the water.
The Highways Agency asked us to build around him.
Our attitude was, ‘He’s parked illegally, let’s get him
A roads case

PAGE 125
towed away’. In the end some kind of compromise was
reached. We moved the road slightly, because there
was plenty of land to do it, but I mean the whole thing
was ridiculous – the chap had no right to be there, he
was stealing electricity and water, and here they were
sort of standing back. I mean it was just crazy.
Our raconteur indicated that the SPV would be happy
to take much more of a ‘hard nosed’ attitude towards
this kind of behaviour. An Agency interviewee disputed
the feasibility of taking a more forceful attitude:
I don’t see how they can. I mean the Highways Agency
does get people down from trees or has dug them up
from the ground. Usually we get another firm in to
actually do that work. Also the DBFO will have the
Highways Agency on their back to make sure they are
seen to be fair, just and things like that.
This interviewee argued that SPVs are better at dealing
with bricks and mortar than the interpersonal aspects
of road development, and in effect acknowledged the
Agency’s continued role in such incidents, owing to
reputational risk.
Initially, the Agency was unclear about whether private
sector bidders would be prepared to accept the third
type of risk, latent defects associated with existing
stretches of road that the SPV would become
responsible for maintaining. Consequently bidders were
asked to present prices for each of three potential
scenarios in which these risks were transferred, shared
or retained by the Agency. Agency interviewees believed
that bidders were generally very willing to accept latent
defect risk, because of their previous experience of
dealing with the Agency, and it is therefore likely that
bidders will be expected to carry this risk in full, as
opposed to sharing it, in future contracts.
This contract clearly transferred risks associated with
the fourth set of risks, design, construction, operation
and maintenance, so that the perspective of the
Agency’s departmental representative is that: ‘We don’t
have problems where we have to, say, renew a bridge
in, say, 15 years.’
Unlike many projects in other sectors, the Highways
Agency does seek to transfer the fifth risk, demand risk,
to the private sector, and in our case this was
particularly attractive to the SPV: ‘Our shareholders are
interested in taking volume risk. So, for example, we
don’t have investments in hospitals or school buildings
and so on because it doesn’t provide the sort of risk
share that we’re interested in.’
The DBFO consortium is experienced in carrying
volume risk on projects it invests in around the world
and consequently: ‘We think we have some
understanding of how traffic grows in different
circumstances and the risk is, we feel, one we
understand so we’re prepared to take’. This is
tantamount to admitting that since traffic volumes are
rising, particularly in Britain, there is little or no
downside risk. The SPV uses industry-recognised
models to estimate traffic volumes in order to make a
bid, since the Agency does not make its own
predictions known to bidders. In this project, which
involved new build, the volume risk was greater than
for widening or improving existing roads and for which
existing volume levels are known. Since the bidders
had to estimate new traffic rather than just growth
rates in this case: ‘It’s quite possible that the various
bidders had quite different traffic figures, which were
probably different again from the Highways Agency’.
In Chapter 5, we presented information about the
percentage of risk as a proportion of the total project
cost. In relation to this project, an SPV interviewee
indicated that the figures seemed improbable because
the SPV had passed all the risk to the contractor.
In the [SPV] company there was no risk money at all.
When I say there was no risk money I mean there was
no contingency in risk. The contractor had a risk element
A roads case

PAGE 126
because he was taking basically all the risk in completing
the project on time, but I really doubt if his risk would
be more than about ten per cent of his price.
Given that our figures are drawn from public domain
information this is an interesting perspective, which we
pursue further in our discussion chapter.
Although the transfer of traffic volume risk is crucial to
the VFM case it is not yet clear how the costs to the
Agency and the costs and income of the SPV will work
through in the long run. The payment mechanism
ensures that the greater the usage the greater the cost
to the Agency, although the mechanism does set an
upper limit on the volume-related payment. At present,
traffic volumes are running ahead of expectations, but
have not reached the upper limit cap. To the extent that
design decisions and maintenance costs are volume
related there is no reason why this mechanism should
not be capable of delivering VFM. To the extent that
costs are fixed and volume is greater than expected but
not capped, however, the project might not achieve
VFM. If volumes rise above the level of the cap then the
implication for the SPV is that it receives no additional
income but is likely to face higher maintenance costs,
since these are correlated with volume. In this latter
scenario the model is capable of producing VFM for the
public sector. If this scenario causes maintenance costs
to become so large in relation to income that the SPV
becomes loss making or fails to carry out maintenance,
then risk could revert to the Agency and the
Government. Consequently although apparently
demand risk has been transferred to the private sector,
uncertainty over traffic volumes implies that some risk
may remain with the public sector.
In relation to other types of risk there is a lack of clarity
about whether risk has been transferred in fact. The
Agency gave two examples, the first relating to a
possible serious accident.
If the contractor does what it says in the TRRM
manual, the road should operate safely. If he doesn’t
do that then obviously we would see that the
contractor was liable. But if he does do that then the
duty lies with the Highways Agency. I’m not quite
certain where we lie. I mean we’re their [the victims’]
first port of call, and we would have to see what the
contract says . . . . We’ll either have to apportion
blame and say you were deficient in this and therefore
you need to reimburse us – for the sake of argument.
The second example relates to an actual incident at a
place where the road is too high relative to the bridge.
It has caused serious problems for high-sided vehicles
that have led to legal action and raises issues about the
additional risks posed by PFI. ‘I mean, the design was
down to the DBFO company, so we expect them to pay
everything, but we’re sort of joint defendants for some
reason. Instead of going for the person who designed it
they’ve gone for us as well because we are the
statutory body’.
This highlights the fact that, although under PFI the
SPV is responsible for service provision, the public
agency is responsible for service delivery, a point which
was also made by the NAO (2000a) in relation to
problems that occurred at the Public Health Laboratory.
When there are problems, the general public believes
the Agency is responsible and directs any complaint or
claim against it. In other words, as the NAO (1999d)
noted in relation to the delays at the Passport Agency,
the public agency cannot avoid political or reputational
risk, and PFI may actually increase this. For example,
in relation to neighbours affected by a DBFO road,
complaints ought to be directed to the contractor.
However, although the Agency interviewee indicated
that the contractor was good at dealing with
complaints, his experience was that: ‘People who have
a complaint – the [SPV] are very good. They do take it
very very seriously, but people who live alongside the
roads still feel sometimes they have to come to us
A roads case

PAGE 127
because they are not getting the required response –
and we have to be involved’. Such involvement clearly
adds cost to the Agency.
In summary, this project involves a number of different
risks. For some of these the impacts are well known
and therefore the likely outcomes are capable of
prediction, while for others the impacts are as yet
unclear. It will be especially important, from a public
accountability perspective, to monitor the impact of
rising traffic volumes on costs. This will deliver
evidence as to the affordability to the public sector of
this and other projects with similar payment
mechanisms, taking the related maintenance costs and
performance of the private sector into account.
THE FINANCIAL COSTS
The financial arrangements that surround DBFO
contracts introduce a number of new aspects to the
provision of a roads service. First, there is an impact on
the way that the Agency’s budget is allocated. At
present this project is experiencing more demand than
was expected by the Agency but has not reached the
level at which it is capped. Therefore the payment
mechanism means that the Agency’s costs and the
SPV’s revenues are running ahead of expectations.
Irrespective of whether the project turns out to be VFM,
to the extent that this is costing more than expected, it
must affect the Agency’s budget as a whole, limiting
the cash available for other work. On the other hand, to
the extent that higher volumes must lead to higher
maintenance costs, one important aspect of PFI
contracts is that these monies are ring-fenced and must
be paid, thereby ensuring that the maintenance will be
carried out. As the SPV interviewee explained:
The difference is, we maintain it properly, and the
Highways Agency very rarely does. It’s a sweeping
statement but the Highways Agency, I’m afraid, suffers
from not having money. Every time there’s a problem
with the Treasury the first place to go is the Highways
Agency. You find we take over bits of the Highways
Agency’s road and it simply hasn’t been maintained in
the way that it should have been. One of the
advantages of DBFOs is that the Government owes us
so much money, and you know what it is used for. This
is a big plus because the roads do get maintained
properly, which in the long run has to be a good thing.
Secondly, although public sector procurement
processes are normally intended to achieve purchase at
the lowest bid price, which ought to ensure
affordability, under conventional procurement this
ignored the reality that it was normally possible to
renegotiate the price upwards after closure.
I would argue that one of the biggest problems in
government procurement is that they go for the lowest
price, and they put people on the bid list that
shouldn’t be there . . . but the chairman knows the
minister. Then because they’ve put in the cheapest bid
they have to give them the job. Then a year or two
later they’re giving them 30% more. I think the PFI
system is better. The contractual structure makes it
much more difficult for a successful bidder to
increase his price.
Although the reasons for such price inflation may be
disputed, that contract price inflation occurs is not. The
NAO has indicated that additional costs after financial
close under traditional procurement may add on
average 28% to the final cost (NAO 1988). The nature
of PFI contracts, by way of contrast, is that there will
be no price increases after financial close other than
those specified by the contract, eg inflation, volume,
and amendments to contract. Although the final costs
of our case project were said to be close to the bid
price, the bid price necessarily included an element for
unforeseen contingencies, as the SPV interviewee
acknowledged:
A roads case

PAGE 128
We really didn’t have any inflation of the price. Now
it’s certainly true that the contractor [to the SPV]
included in his bid some amounts for contingency – it
certainly would not have been 25%. I’m absolutely
certain of that. It might have been 10%. So I would
have said at the very least there is a saving there.
One such contingency relates to the risk that the
project may be delayed, which under PFI is likely to
have serious effects on the contractor: ‘In my experience of
PFI you don’t get delays because the penalties on the
contractor are so great, so it’s probably true that the
initial price is somewhat higher’ (SPV Interviewee).
This raises important financial issues since it is difficult
to quantify the benefit of finishing on time and to
assess this against the increase in price that the
contractor demands in order to carry the risk of timely
completion. Also, there appears to be no reason why
similar contractual arrangements could not be used for
conventionally financed projects.
Third, the view of the SPV lends another interesting
perspective to the question of whether these deals are
cheaper than conventional procurement and constitute
VFM. An SPV interviewee argued that the private
sector’s interest costs and legal fees are significant and
likely to be greater than if the government borrowed the
money directly:
I’d have to say the comparisons that I’ve seen are not
very clever, and they don’t look in too much detail at
what the concession company’s costs are, and how
they’re built up. It’s something that could be
improved, but it’s certainly true that the cost of doing
something via a PFI is going to be significantly more
expensive than it is if the government did it, if the
government could do it as efficiently as the private
sector, which usually they can’t. But if they could, it
would be much cheaper for the government because
the government can borrow money at whatever the
long-term loan rate is. Whereas these days we are
paying at least three maybe four per cent over . . . .
On some debt we were paying seven or eight per cent
over. Then [there are] the legal fees which [on this
project] were a significant sum of money.
Clearly, such fees add to the cost of PFI and since these
are now well recognised within the contracting industry,
future contracts are likely to be less affordable as
companies seek to cover these fees in the contract
price. Also, there may be contracting costs associated
with contract cancellation. Since the first round of projects
in 1996–7, there has been relatively little interest in
DBFOs, as evidenced by the number of contracts
signed or under consideration, and a number of projects
for which companies were in the process of tendering
bids were cancelled. The SPV interviewee said that this
caused much concern in the industry in Scotland,
because companies were not reimbursed for costs
already incurred. ‘Everybody spent a lot of money and
then they got cancelled. Some people got more upset
than others, particularly as we got no compensation, so I
mean we just refused to bid in Scotland after that’.
The Scottish experience was in contrast to the situation
in England.
We were in the middle of bidding for jobs. However,
they did agree before we bid that in the event the
government changed and the whole bidding process
was cancelled that they would reimburse people for
their bidding costs and to give them their due they did
actually do that.
This interviewee described the more recent projects
available for tender as ‘glorified leasing deals’ that
downgraded volume-based payments in which his
company had no interest. Nonetheless, the costs
associated with these outcomes imply first that the
supply of competing bids may be reduced in the future,
and secondly that the reimbursed costs for failed bids
provide no VFM and need to be considered in a holistic
evaluation of the PFI policy.
A roads case

PAGE 129
A fourth area of interest surrounds maintenance costs
that the NAO and PAC have investigated (NAO 2003c,
PAC 2003c). The PAC (2003c, para. 13) noted that
unit costs of maintenance work of all the Highways
Agency’s roads that are maintained by the private
sector on long-term contracts have risen substantially in
recent years, from £34 per square metre in 1997/8 to
£42 per square metre in 2000/1, an increase of 24%
in real terms. This is contrary to the notion that private
sector efficiency would reduce costs, but the Highways
Agency told the PAC that it had contracted for quality
not cost. The SPV interviewee was unfamiliar with this
report but argued that this is likely to be a consequence
of conducting maintenance properly, because:
‘Ultimately maintenance comes back to haunt you if
you don’t do it and you know the reason the
infrastructure in this country is in such a mess is
because this sort of money hasn’t been spent in the
past’.
Similarly, the Agency representative on this project was
not able to relate to the £42 cost per square metre for
maintenance quoted by PAC, because the payment he
authorises represents a combined payment to cover
capital and maintenance costs: ‘I can’t relate to a cost
per square metre. We’re paying tolls and they’re also
paying off the capital costs. We have an idea what it
costs to maintain the road, but we don’t split the
payment . . . . I’m sure it can be done’.
In response to a question about the split between
contract costs for construction and operation, another
Agency interviewee indicated that in the contract the
Agency had agreed not to release any commercially
confidential information, and that it would not separate
out the different contracts: ‘That’s one of the promises
we made . . . . If we did give figures it would be a
package’. This commercial and political sensitivity
makes it difficult for external interests to form an
opinion on VFM, but may also have an impact on the
ability of government agencies such as the NAO to
report publicly on specific areas of concern. An
interviewee indicated that the Agency does check the
accounts of the SPV each year and a short report is
made available on these to the Agency representative,
but admitted ‘Whether it [the SPV] is making a profit or
not doesn’t really affect us – well, I mean it will affect
us ultimately’.
This appears to be the crux of the regional Agency’s
assessment of this project. Providing the SPV maintains
the road to the contractual standards and in
accordance with the TRRM, the project is perceived as
successful. Any costs or indeed benefits associated with
the payment mechanism fall on the remainder of the
Agency’s budget. In other words, ‘success’ at an
operational level is viewed independently of the
financial costs.
The representative in the Highways Agency’s head
office was very satisfied with the way that DBFOs were
working and the efficiencies that had been achieved.
Although he believed that, under DBFO, expenditure is
predictable and largely in line with expectations, he
opined that if a financial review were undertaken, it
was very likely that DBFO would turn out to be a more
expensive way of doing things. He acknowledged that
the reduction in the Treasury’s test discount rate from
8% to 6% in 1997 made it more difficult to
demonstrate that DBFOs delivered VFM (HM Treasury
2003a). This has now been exacerbated by the further
reduction to 3.5%.
SUMMARY AND CONCLUSIONS
The Highways Agency awarded four projects during the
first quarter of 1996 and an additional four projects
between May and October of the same year, and we
have examined one of those projects as our case project.
In terms of the policy and project objectives, the road
was built to budget and slightly ahead of schedule.
Since the contract included heavy penalties for late
delivery of the road, it is not a surprise that it was
A roads case

PAGE 130
delivered on time. Although there was some innovation
during the construction phase, this was only to ensure
faster completion not to reduce future maintenance
costs. Its efficacy can only be assessed later in the
project. There was little evidence of innovation in
operation and maintenance. In relation to the other
softer objectives, there is a lack of quantifiable
information, or they have not been evaluated, or it is
too soon to know whether they have been achieved.
We found that although this system is described as
operating effectively, it is not without problems. For
example, the vehicle-counting equipment is not always
functional and there is very limited random monitoring.
The standard of service, about which there are
currently generally favourable reports, relates to a
project which involves substantial new construction in
an environment where there are agreed and well
recognised and understood industry standards. Any
issues of conflict reported to us refer to instances where
judgement may vary between the relevant negotiators,
and such situations may be expected to increase as the
road ages. In addition, performance measurement is
sometimes measured in terms of response time to solve
problems, rather than directly in relation to the
underlying quality of performance. Such an approach
generates the possibility of reputational risk to the
Agency. Both these issues suggest the need for future
research. The Highways Agency is reluctant to make
deductions for poor performance and few penalties
have been incurred. The SPV’s bank arguably has a
more crucial role in enforcing service standards, since it
must be informed of any penalties incurred. Taken
together, it is unclear how the payment mechanism
provides incentives for the SPV.
Good quality procedures for enabling amendments to
contracts are essential in an industry where technical
specifications and standards are continually improving
and changing. The financial settlements that surround
such changes have been described as difficult in
practice and in future should such changes involve
amendments to the toll, as agreed in the original
contract, the complications are likely to increase.
Similarly, it appears that it would be very difficult in
practice for the Highways Agency to terminate its
contract with the SPV or its contractors, or indeed for
the SPV to terminate its contract with its main
contractors.
Despite the fact that the project is perceived as an
operational success, it is perhaps surprising that there
is no clear contingency plan in the event that the
private sector organisations should fail. Similarly,
although it is still in the distant future, there appears to
be limited understanding of how the handover phase
will be controlled and it is unclear that robust
procedures are in place.
Projects in this sector differ from many other sectors in
that the intention is to transfer demand risk to the
private sector, with the payment mechanism closely
linked to demand. Since traffic flows have increased,
payments based on shadow tolls have risen and have
not yet reached their cap. Thus, the payment
mechanism, far from transferring risks, has created
additional costs for the Highways Agency. In relation to
other risks that the Agency had sought to transfer, the
effects of some of them are known or quantifiable but
others are unclear.
Several further points should be made about the cost of
DBFO. Although this contract and DBFO in general are
perceived as ‘successful’, this operational success is
viewed independently of the financial costs. The SPV
acknowledges that financing costs are typically three to
eight percentage points more than public sector
borrowing costs. How all these additional costs affect
the Highways Agency’s budget and its other activities is
unclear.
Finally, although it is too early to determine the whole-
life costs of this project, PFI has introduced some
predictability into project costing in relation to the
A roads case

PAGE 131
design and construction phases, but there is no reason
why similar incentives could not operate under
traditional procurement routes. Under PFI, the payment
mechanism means that road maintenance is assured.
This means that more money may be spent on the
maintenance of PFI roads than non-PFI roads, thereby
distorting national priorities. It is important to recognise
also that there are additional costs within the system,
in both the public and private sectors, that would not
occur under conventional funding routes.
A roads case

PAGE 132
PAGE 133
7. PFI and hospitals
Our analysis of the cost of PFIsuggests that the emphasis onexpected VFM may be misplaced.. . . At the very least, theexperience of PFI does not sitcomfortably with the general aim ofcontrolling public expenditure.
History and development of PFI in hospitals 135
PFI: Financial performance 148
The trusts’ expenditure on PFI 150
PFI companies 160

PAGE 134
PFI and hospitals
PAGE 135
This chapter presents a sectoral analysis of PFI for new
builds in the acute hospital sector. It is organised in
several sections. The first explains the origins,
development, scope and objectives of PFI in the context
of hospitals. The second section reviews the research
literature, official reports and other commentaries as
they relate to the evaluation of PFI in hospitals, and the
NHS’s response. The third section presents the publicly
available financial information as it relates to the way
PFI operates in hospitals, its costs, VFM, risk transfer
and accountability, based on official publications and
the trusts’ and the private sector’s annual reports and
accounts.
HISTORY AND DEVELOPMENT OF PFI IN
HOSPITALS
The use of private finance in hospitals marked a
complete change in hospital financing. Since the
inception of the NHS in 1948, hospital building had
been financed by central government grants and funded
out of general taxation and national insurance
contributions, occasionally supplemented by private
endowments and fund raising for specialist facilities
such as children’s services and equipment. There was
little hospital building until the 1960s as investment in
public services focused on housing and education. Only
one third of the 1962 hospital plan for 224 schemes
was implemented before public investment was
curtailed in 1976. Between 1980 and 1997, only
seven public schemes costing more than £25 m were
completed (House of Commons 1997), leaving the
NHS with an outmoded and worn-out estate, a
significant part of which predated the First World War,
and a backlog of maintenance. However, it should be
noted that although hospitals were built with public
finance, after 1973 regional health authorities were
allowed for the first time to use the proceeds from land
sales for investment, and land sales became an
increasingly important source of capital funding,
masking the decline in new funding for investment
(Meara 1991). In other words, NHS capital expenditure
was, to some extent at least, self-financed.
The first hospital to be built with a significant private
contribution in recent times was the Guy’s Hospital
Phase III Development. The private partners were not
the commercial sector but charities and other public
sector agencies that would use the facilities. When the
scheme was signed in 1986, the intention was that the
non-NHS partners would provide 45% (£16 m) of the
total £35.5 m costs. However, costs soared to £152 m.
This was due to the failure to freeze the design and
significant subsequent design changes, changes in
statutory requirements and building regulations, a new
liability for VAT, inflation, delays to the building works,
a large number of disputes and claims associated with
the construction works, changes to the design team’s
fee rates, and the insolvency of works package
contractors (NAO 1998b). The partners failed to
maintain their contributions in line with the overall
escalation in costs and the NHS was forced to foot the
bill. Ironically, the cost escalation in this innovatory
scheme was used to criticise the NHS’s cost
containment and justify the turn to private finance in
health.
With the introduction of PFI in 1992, the newly
established hospital trusts were required to find a
commercial partner to design, build, finance and
operate the non-clinical services, if they wished to
replace or enhance their buildings and equipment.
Although there are many similarities with DBFO in
roads, one of the first private finance programmes to
get off the ground, there are also some differences. In
effect, instead of commissioning their own hospital, the
trusts would lease their new or refurbished facilities for
30 years. In return, they would pay a two-part annual
fee to the private company, usually a consortium made
up of finance, construction and facilities management
companies and known as a special purpose vehicle
(SPV), which provides the hospital and non-clinical
services. First, there would be an availability fee for the
capital element or rental charge and secondly, a service
PFI and hospitals

PAGE 136
charge for the facilities management. The charges
would be linked to performance to provide incentives
for the SPV. Should some services become
unavailable or fall below the level stipulated in the
contract, then the payment would be reduced,
although usually not below the level needed to service
the SPV’s debt. Although the capital element was
new, the service element of PFI represented an
extension of the compulsory contracting out of manual
services to a wider range of clinical and, in some
cases, non-clinical-related services, and thus could be
construed as an operating lease. Hence, PFI functions
as both a finance and an operating lease. At the end
of the 30-year contract period, the hospital would
either revert to the trust or the contract could be
renewed.
The move to PFI followed a change in the hospitals’
financial regime. Under the 1990 Health and
Community Care Act, the trusts were required to pay
for the cost of capital by means of what became
known as the capital charging regime. It became a
statutory obligation for the trusts to make a surplus of
their income over expenditure, including a charge for
depreciation, equal to a 6% return on their assets,
valued at current replacement cost. The 6% on past
capital was repayable to the government in the form
of Public Dividend Capital (PDC), equivalent to the
government’s equity stake and interest-bearing debt.
This meant that trusts had an incentive to move to
leasing, since this moved assets off the balance sheet
and hence reduced capital charges, and provided, all
other things being equal, a revenue stream for the
availability fee.
Although the Conservative Government was keen to
extend the use of private finance to the health sector,
PFI proved slow to take hold, in part at least because
it was not clear that the NHS hospital trusts had the
legal power to enter into such contracts. Furthermore,
whereas for roads the purchaser was central
government, the trusts did not have a proven financial
track record. Indeed, within a few years of moving from
being directly managed by the NHS, many had
financial deficits (Shaoul 1998). In 1997, the incoming
Labour Government resuscitated the policy and got PFI
hospital projects off the ground by removing the
requirement for universal testing of all capital projects
for their ‘PFI-ability’ and by prioritising projects. The
NHS (Private Finance) Act 1997 helped to persuade
potential bidders and the financial backers that NHS
trusts not only had the power to enter into such
contracts, but that the payments to the consortia were
in effect underwritten in the event of a financial crisis
within the trust. Additional funds were provided in
some cases to make the plans affordable. Ten PFI
schemes in the first round were awarded subsidies
totalling £7.3 m for the first year, under a smoothing
mechanism intended to reconcile the different pattern
of costs that emerge from a contract period of 30 years
under a PFI deal (during which the private sector
expected to recover its costs) and the normal
accounting life of an NHS hospital of 60 years (Gaffney
and Pollock 1997).
Following these measures, the Labour Government
approved several waves of large hospital projects under
PFI. It signed the first health PFI contract in 1997 and
the first PFI hospitals were completed in autumn 2000.
By May 2001 six projects with a capital value of £423 m
were in operation and a further 17 schemes with a
value of £1.6 billion were under construction (Audit
Commission 2001). Since 1997, some 85% of the
NHS capital investment projects have been financed
under the PFI, with a focus on larger new-build
investments (Sussex 2003). The National Audit Office
(NAO 2003d) reported that in the year ending March
2002, there were 102 NHS trusts in England with PFI
schemes including community, mental health and
ambulance trusts as well as acute and specialist
hospital trusts. Ninety-five NHS trusts reported off
balance sheet schemes with an estimated capital value
of £3.6 billion, while seven trusts reported on balance
sheet schemes with a capital value of £185 m (NAO
PFI and hospitals

PAGE 137
2003d). By December 2002, 25 large hospital
schemes had reached financial close. By November
2003, there were 49 signed hospital PFI schemes in
England with an individual cost of more than £15 m,
the total cost of which was some £3.4 billion (PPP
Forum 2003c). The PFI hospital programme is now
routinely described as ‘the largest building programme
in the history of the NHS’.
If this is confusing it is because collecting data on
Department of Health annual capital expenditure, both
for PFI and for non-PFI projects, is not straightforward.
Data are provided for England not the UK. There is no
longer a clear statement setting out the annual capital
expenditure. Instead, it is aggregated in ways that
make a clear summary of capital spend on a consistent
12-monthly basis impossible to compile. HM Treasury’s
list of PFI projects shows a complete listing, noting the
date of financial close and the capital value, without
recording any construction dates. The Department of
Health shows a running total of major projects, both
PFI and publicly funded (see Table 7.1), but again it is
not possible to disaggregate this on the basis of annual
spend. More helpfully, the DTI Construction Statistics
and its predecessors show live construction projects
over a number of years (Table 7.2 on page 138),
although there is some overlap in the figures from year
to year as some large projects may take more than one
year to complete. Over the years, the amounts shown
for specific major PFI projects vary, owing to changes in
the contract value, again making it difficult to draw
sensible conclusions about the total capital spend.
Table 7.1: Capital schemes (over £10 m) approved – May 1997 to December 2003
Capital value Capital value
Number (£m) as % of total
PFI schemes
PFI schemes which are complete and operational 21 1,527
PFI schemes in negotiation but not yet reached
financial close:
2nd wave schemes prioritised 3 1,692
3rd wave schemes prioritised 4 682
4th, 5th and 6th wave schemes which have
placed OJEC adverts 18 2,957
4th, 5th and 6th wave schemes which have
not yet placed OJEC adverts 12 2,758
Total PFI 64 11,008 84%
Non-PFI schemes
Publicly funded schemes which are complete 3 132
Publicly funded schemes with work started on site 1 50
Total non-PFI 4 182 16%
Total capital investment given go ahead 68 11,190
Source: DoH (2004).
PFI and hospitals

PAGE 138
In short, although it is difficult to get precise figures on
the total spend on PFI in hospitals, it is clear that
significantly more than half of all capital expenditure on
schemes with a value greater than £2.5 m is being
financed under PFI and this is increasing. Secondly, PFI
is also being widely used in other parts of the NHS: in
primary care, community and mental health hospitals
and ambulance trusts.
The evaluative literature
We first review briefly the main findings of the appraisal
literature in the health sector as it relates to the
anticipated VFM, since it provides pointers to the kinds
of issues relevant to evaluation. We then consider such
literature as exists on the implementation phase, VFM,
risk transfer or the procedures for managing risk
transfer and accountability. The literature relating to PFI
in hospitals and its evaluation derives from several
sources: official reports, research papers and
commercial consultants. We consider each in turn.
Appraisal literature
Prior to the new builds for hospitals, the full business
cases (FBCs) to support PFI projects were not placed in
the public domain. Indeed, it has been only in the case
of health and education that the FBCs have entered the
Table 7.2: Department of Health PFI and non-PFI building construction projects
Live schemes of capital value ————— PFI ————— ———— Non-PFI ————
Year Number Capital Number Capital
value £m value £m
Nov 1995 > £1 m 16 723 108 765
schemes published
in OJEC
June 1996 > £1 m 150 2,188 69 496
schemes between
OBC and FBC
June 1997 > £1 m 98 2,028 37 515
schemes between
OBC and FBC
March 1999 > £1 m 26 1,080 34 560
March 2000 > £2.5 m 31 1,542 33 534
March 2001 > £2.5 m 43 1,812 46 489
March 2002 > £2.5 m 48 1,982 50 667
March 2003 > £2.5 m 31 1,604 72 1,126
Sources:
DoE (1995, 1996, 1997); DETR (1998, 1999, 2000); DTI (2001, 2002).
Notes
1. 1995–97 data relate to all schemes in progress.
2. From 1999 onwards, data relate only to projects in the course of construction and therefore some projects will
appear in several years.
PFI and hospitals

PAGE 139
public domain, and even then only in particular
instances and after financial close. This information is
limited, however, by the fact that other supporting
information and the contracts are not released. These
limitations notwithstanding, PFI hospitals were
particularly important because the publication of their
FBCs made it possible for the first time for researchers to
examine systematically the financial case and wider
issues raised by PFI. In other words, the policy has
been subject to detailed scrutiny only after deals were
signed, rather than before, and in the context of
specific projects rather than that of the policy or
programme for the country as a whole.
Following the release of the FBCs, there have been a
number of empirical studies examining the anticipated
VFM in specific hospital projects (Gaffney and Pollock
1999a; Price et al. 1999; Pollock et al. 2000) and in
the health service (Hodges and Mellett 1999; Gaffney
and Pollock 1999b; Gaffney et al. 1999a, 1999b,
1999c; Sussex 2001). For three PFI new hospital
schemes for which information about the cash costs
were available (Gaffney and Pollock 1999a; Price et al.
1999; Pollock et al. 2000), the cost of raising finance
averaged 30% of construction costs.
These financing costs are costs that conventional public
procurement does not incur, or at least not to the same
degree, for several reasons. First, there is the higher
cost of private finance that is likely to be four or five
percentage points higher than the rate for public
finance under Treasury gilts. Secondly, the amount of
capital to be raised through loans or equity under PFI is
inflated by financing charges that include the not
inconsiderable professional fees and the ‘rolled up
interest’ derived from the construction period before the
trusts begin their payments. Finally, there are the
transaction costs associated with preparing the bid and
contract negotiations, typically running into millions.
Pollock et al. (2002) show that, in every case, the Net
Present Cost (NPC) of a publicly funded hospital was
lower than a PFI one before risk transfer was included
in the VFM analysis. It was only after including risk
transfer that the NPC of PFI hospitals was lower than
the PSC. In other words, the VFM case rested upon risk
transfer. The advantage, however, was only marginal.
Although most projects seemed to value risk transfer at
around 30–35% of construction costs, there was a
wide variation in the discounted value of the risk
transfer, ranging from 17% to nearly 70% of
construction costs. Given that most risk is construction
risk and the projects all involved new hospital builds, it
was difficult to see why they should vary so much
unless the high-risk hospitals were taking on very
different, costly and inappropriate risks, such as
demand and political risks. At the very least, this
suggested that the risk assessment methodology was
somewhat arbitrary. It was difficult to avoid the
conclusion that the value of the risk transfer had been
deliberately calculated in such a way as to close the
gap between the PSC and PFI. From the perspective of
a study concerned with VFM in the operational period,
this means that the VFM case rests upon evidence of
actual risk transfer. The absence of real risk transfer in
practice would mean that the trusts have paid a higher
price to little effect.
These studies question the economic case for PFI and
whether the projects demonstrated VFM compared with
conventional procurement, and raise other issues of
concern, particularly their affordability. The latter issue
has largely been ignored both in the appraisal process
and in the wider public debate. They noted that the
high cost of PFI meant that the first wave of PFI
hospitals were smaller than the ones they replaced as
trusts adjusted their plans downwards. The affordability
gap was further reduced by subsidies from the
Department of Health, land sales, a shift of resources
from within the local healthcare economy to the PFI
hospital, and ‘challenging performance targets’ for the
trusts’ reduced staff complement. Thus, PFI also comes
at the expense of capacity and access to healthcare
treatment. Froud and Shaoul (2001) question both the
PFI and hospitals

PAGE 140
process of appraisal and the interpretation of the full
business cases used to support the VFM case for the
procurement of new hospitals under PFI. Shaoul
(2005) raises questions about the validity of the VFM
methodology and shows empirically that it is a far from
neutral technique: it serves as a mechanism for
legitimising the higher cost of PFI. All this suggests that
the emphasis on relative VFM may be misplaced. This,
plus the increasing emphasis on PFI in health, makes it
all the more important to assess whether the operation
of PFI can or does deliver VFM.
Official reports
Of the 20 or so reports produced by the National Audit
Office on the anticipated VFM case, two have
considered specific hospital projects, the Dartford and
Gravesham and the West Middlesex University
hospitals (NAO 1999b, 2002f).
In relation to the Dartford and Gravesham Hospital, the
NAO (1999b) found that the estimated non-financial
benefits were likely to be greater than under traditional
procurement, but there was uncertainty as to the level
of savings. Indeed, there might be no savings, as a
miscalculation in the PSC had overstated estimated
savings by £12.1 m and sensitivity analysis indicated
that a 10% reduction in costs in real terms would lead
to PFI being more expensive than traditional public
procurement. The NAO reported that despite the extra
financial support of £4 m a year required to pay for the
scheme, the Health Authority and the NHS Executive
were satisfied that the scheme still remained good
VFM. The NAO did not comment on their optimism or
itself explicitly draw any conclusions about the overall
VFM of the project based upon its own work. The PAC,
on the other hand, was rather more critical than the
NAO and said in relation to the affordability issue that
it was ‘not convinced’ that the use of public finance
had been considered as a serious option for Dartford
and Gravesham (PAC 2000c). The NAO recommended
that the following issues should be better addressed:
flexibility in long-term service planning; the
consideration of affordability of schemes within the
context of the overall local healthcare strategy; and the
rigorous review of calculations and procedures to
reduce bidding costs. Subsequently, the NHS Executive
and the Treasury amended their guidance relating to
PFI and a new standard PFI contract was developed.
Three years later the NAO (2002f) examined the
redevelopment of the West Middlesex University
Hospital in the context of reporting on how the findings
from Dartford and Gravesham had been applied and
how VFM was established in this case. It found that the
trust had run an effective procurement, using the new
guidance including the new standard contract. The
bidding competition had been effective and included a
faster bidding process. Once again the financial
comparison was ‘not clear-cut’, however, with the size
of the risk adjustment in the PSC being crucial. In the
end the trust lengthened the contract to 35 years in
order to keep the annual cost down to an affordable
level. The trust went ahead with the deal on the
grounds that the unquantifiable benefits (price
certainty, incentives for service delivery and transfer of
responsibility for assets) of doing the project as a PFI
outweighed the disadvantages. The NAO recommended
that this broader approach to VFM should be taken in
all PFI cases. In other words, the Government’s
criterion for establishing the superiority of PFI versus
the PSC was not sustainable and should be replaced.
The NAO did not draw out the implications of this for
the policy as a whole. It concluded that the deal was
affordable provided that running cost savings were
achieved.
The West Middlesex report also identified some points
relevant to post-project evaluation. The payment
mechanism incorporated incentives to ensure that
Bywest, the SPV, provided services as agreed in the
contract. For example, if an operating theatre were
unavailable for 24 hours on a weekday there would be
a deduction of approximately £1,400 (NAO 2002f,
p. 20). The contract also contained safeguards to
PFI and hospitals

PAGE 141
control the rate of return Bywest could make in relation
to contract variations. In addition, net savings of £1.6 m
from the running costs of the trust were required,
arising from the increased efficiency of the new building
design and a reduction in the duplication of
administration created by a fragmented site layout. The
range of these issues demonstrates the level of
complexity in evaluating PFI projects as it is very
difficult to obtain the necessary figures to assess what
cost savings are being achieved.
The NAO’s and PAC’s reports on the construction
performance of all projects completed by summer
2002, including 11 NHS hospitals (NAO 2003b, PAC
2003d), showed that hospitals, along with other assets
such as roads and prisons, were now being delivered
early or at least on time, to budget and specification.
They did not, however, carry out a survey of users’
opinions of the buildings, something that the Audit
Commission (2001) had highlighted as an important
aspect of a performance review. Certainly, in that
respect, the NAO’s report does not sit well with a study
in which staff and patients at nine PFI hospitals were
interviewed (Lister 2003). That survey noted that the
hospitals were riddled with structural and design faults.
There were criticisms about the poorly designed fire
doors, the lack of space and ventilation at several of
these hospitals, one where corridors are too narrow for
more than one trolley, and another where the plumbing
was so bad that the pathology laboratory was flooded
with raw sewage (Lister 2003).
It is important when considering the speed of project
implementation to consider evidence about the total
delivery time. The performance measures above
suggesting a PFI success story measure the time only
from financial close to implementation. This needs to be
linked to the time taken for the PFI selection/bidding
and contract negotiation process, which takes months,
or even years – longer than that for Exchequer-financed
schemes. Meara (1997) argues that for each of five
major London hospital PFI schemes the PFI procurement
procedures added two years to the process.
Significantly, the NAO (2003b) indicated that it was
not able to judge whether these projects could have
achieved these results using a different procurement
route. Indeed, Sussex (2003) quotes a memorandum
from the NHS Executive to the PAC about
improvements in performance of conventionally funded
NHS projects:
The overall performance of the NHS [on major capital
projects] has shown a long-term improvement. The
three-year moving average for 1988–91 showed a
time over-run of 14 per cent and a cost overrun of 13
per cent. The figures have steadily declined to about 8
percent and 7 per cent respectively. (Public Accounts
Committee 1999c)
He went on to argue that certain risks, such as those
related to construction time overruns and availability,
could in principle be transferred under a publicly
financed design, build and operate contract.
There is, however, another perspective on the success
of the construction phase and the emphasis on building
to time and budget. The Commission for Architecture
and the Built Environment has argued that the design
standard of the first wave of PFI hospitals does not
match the high aspirations of the building programme
(letter to the Financial Times 26 November 2003).
Although the design quality in the second wave was
improving, this was still problematic. The Commission
believed that many designs failed to consider the long-
term implications of better environments on healthcare
needs. There was an over-emphasis on construction
time and budget at the expense of design quality,
despite the evidence that good design aids patient
recovery and saves on hospital operational costs across
their building lifespans. Similarly, the Building Futures
Group (Worthington 2002) argues that the 70-plus
PFI and hospitals

PAGE 142
hospitals being built under the PFI could become
obsolete long before the contracts expire, yet the NHS
would have to continue paying for them. More
immediately, if there were medical or technological
advances or shifts in demand/need, changes in the
infrastructure and service provision would be required.
A recent review of the Government’s health policy over
the last five years makes a similar point when it
concludes that the Government: ‘has rushed into a
massive building programme without any collective or
central reflection as to precisely what type of facilities it
ought to be investing in’ (Appleby and Coote 2002).
As noted in Chapter 5, the VFM case largely rests upon
risk transfer, the main component being the cost and
time overrun on construction. The NAO and PAC
reports raised two issues in relation to risk transfer.
First, the PAC was concerned that construction
companies may be earning over twice the rate of profit
for construction services compared with what they earn
on conventional projects, and called for more thought
to be given to the most appropriate measures for
monitoring returns of private sector participants in PFI
projects (PAC 2003d). The available information on the
level of rewards to construction companies from PFI
work is limited and rather mixed (NAO 2003b), leaving
unanswered questions about whether VFM really exists,
ie whether the cost of building to time and budget is
worth the additional cost.
There is no legal requirement to disclose information on
separate contracts in published financial statements, so
construction companies typically supply very little. The
PAC (2003d) Supplementary memorandum supplied
by the NAO) asked the NAO if it was possible to
identify the amount of capital employed by building
contractors and their rates of return. The NAO was able
to supply detailed figures only for Balfour Beatty, which
appeared to show ‘a substantially higher profit margin
on PFI work compared to all business carried out (in
2002 an operating profit margin of PFI business of
50% compared to 4.3% on all business)’.
Secondly, the PAC was particularly concerned that the
inevitable changes to the service element of the
contract in future years would not yield the VFM
achieved under the initial competitive pressure. The
PAC noted that the public sector frequently makes
changes or additions to facilities within a few years of
letting the PFI contract, with the NAO stating that one
in five public authorities do this. As the work relating to
these changes and additions may be given to the
existing service providers, there is a risk that VFM may
be lessened, unless market testing or benchmarking is
carried out. The NAO estimated that benchmarking had
taken place in fewer than half the cases it examined
(NAO 2003b, para. 7). The Audit Commission (2001)
reported, however, that market testing was common
and the OGC’s 2002 guidance does require
benchmarking of any additional works.
Hospitals must monitor the operational services in
order to ensure that the service stipulated in the
contract is being provided. The NAO has not yet
reported on operational performance of PFI in hospitals
for, as noted earlier, the first schemes have not been
operational for long enough to make a worthwhile
study. Evidence on monitoring of performance therefore
exists only as snippets across a wide range of sources.
Trusts have criticised the performance of some
contractors. For example, at the Queen Elizabeth
Hospital, Woolwich, there were teething problems with
catering and portering, and a need for more initial
training (PPP Forum 2003a). Carlisle reported teething
problems with cleaning and: ‘some weaknesses in the
Contract particularly in relation to the Payment
Mechanism, service performance penalties and
operational costs that affect all parties.’ (Health
Committee 2002, Appendix 6).
South Manchester reported continuing problems with
support services not delivering agreed quality standards
(Health Committee, 2002, Memorandum PS 52). This
memorandum further argued that management had
found it hard to apply the concession agreement to
PFI and hospitals
PAGE 143
ensure that problems were put right and significant
management time, contrary to expectation, was still
being still spent on monitoring performance.
The Audit Commission (2001) reviewed ten completed
schemes in local government and health. Although it
neither endorsed the PFI nor examined the underlying
fundamental assumptions, it made some useful points.
First, there was the excessive amount of senior
management time spent on the PFI procurement
process because of its complexity, leading to adverse
but largely uncosted effects on existing services, with
‘client-side’ resources consistently underestimated.
Secondly, the specification of long-term service
requirements was found to be problematic, particularly
in relation to the operation of long-lived assets. The
lack of certainty regarding delivery of health and social
services made planning particularly difficult. Thirdly, it
found that good practice to ensure continuing VFM
allowed for a review of ‘soft’ services such as cleaning,
catering, etc and one-off contractual amendments.
Fourthly, although there were some good examples of
continuous service improvement through the use of
challenging performance targets, there was not enough
sharing of experience and learning from early schemes
among project managers. In addition, for these early
schemes, external audit was used in the scheme
review, but some project managers had a poor
perception of the quality of such external audit. The
report found that local government, with its established
Best Value reviews, was ahead of the NHS in terms of
performance management.
Research literature
As yet there is very little systematic research evidence
in the UK relating to post-implementation experience in
hospitals from sources other than the National Audit
Office and Select Committees of the House of
Commons. Such research that is available is
inconclusive and notes both the difficulty in isolating
the effects of PFI from other simultaneous changes and
the lack of appropriate comparative data.
Sussex (2003) reviews the literature to compare the
costs and benefits of PFI and conventional public
financing in the public hospital sector. He finds that PFI
may or may not offer design improvements and lower
construction costs; probably does not lead to more
cost-effective support services; may involve higher
costs of borrowing, even after accounting for risk; and
will probably lead to more projects being completed on
time and better maintained hospitals. He concludes
that the overall advantage of PFI procurement is
unclear.
In their case study of a PFI hospital, Grimshaw et al.
(2002) show that it is difficult to disentangle PFI cost
savings from savings associated with the simultaneous
closure of one of the hospitals that is part of the trust.
The absence of prior measures of productivity and
performance, difficulties in ensuring equivalence
between the specification of tasks in the formal
contract and the actual tasks undertaken, and
incomplete provision of information on the invoices
presented for payment make evaluation difficult if not
impossible. They argue that a large part of the savings
have come from reductions in labour costs. Similarly
McKendrick and McCabe (1997), in their study of a
Community Hospital in Scotland, note that there had
been no PSC against which to compare the expected
benefits of PFI. They question whether the alleged
operational efficiency of the PFI project came from the
concentration of services on one site, an option which
had not been available to the public sector, rather than
the use of the PFI. In addition, Pilling (2002) found it
difficult to construct the PSC to take account of
technology refreshment, the cost of which is
unpredictable.
Broadbent et al. (2003) has studied eight post-project
evaluation systems in trusts and reports that they
concentrated on the design and working of the facilities
management (FM) systems, which in the case of
Dartford and Gravesham accounted for only 43% of the
transferred risk. Such systems are silent on the
PFI and hospitals
PAGE 144
remaining 57% of risks. Fifty per cent of these related
to design and construction, where typically there were
difficulties over handover arrangements and signing off,
situations occurring before the FM systems commence.
The FM systems focus on the performance of ‘soft’
facilities, and do not monitor shared non-quantified
risks such as contract renewal, the likelihood of SPV
corruption or hospital obsolescence. They conclude that
post-project evaluation systems are very limited in
scope and it is ‘extraordinarily difficult’ for a trust to
make availability deductions; rather, the trusts use the
systems more as ‘symbolic threats’. They recommend
that post-project evaluations should be largely proactive
in nature, should incorporate non-financial as well as
financial aspects, and should relate to PFI issues only.
Although the evidence from the UK is limited, Australia
embarked upon the private management of hospitals
somewhat earlier than the UK and can provide some
insights. Again, as in the UK, there is no systematic
evidence across the sector and such as there is largely
derives from official reports, which have been critical.
Indeed, Australia’s experience with the private
management of public hospitals has been so fraught
with problems that a Committee of the Australian
Parliament recommended that: ‘No further privatisation
of public hospitals should occur until a thorough
national investigation is conducted and that some
advantage for patients can be demonstrated for this
mode of delivery of services’ (Senate Community Affairs
References Committee 2000).
The state of Victoria, Australia, was one of the first
public agencies to consider the use of a form of PFI for
new hospital building. Its experience is instructive. The
first hospital, La Trobe Regional Hospital, had to be
taken into public ownership at substantial cost within a
few years of opening, after the company made huge
losses largely due to incorrect cost estimates. The
second, Mildura Hospital, required increased annual
payments to prevent the private operator from making
losses. As a result of these experiences, Victoria
abandoned the attempt to seek a private operator for a
third project, the Mercy Hospital in Melbourne.
Similarly, in South Australia, the state Government was
forced to amend its contract for Modbury Hospital so as
to increase its payments to Healthscope Ltd, the
contractor, and ensure that the company could continue
the contract. Despite these additional payments, the
Australian Nurses Federation expressed concern about
the level of services provided, as emergency services
had been reduced to save money (Senate Community
Affairs References Committee 2000).
In 1997, the Western Australian Auditor General, in its
report on a contract between the state government and
a private company to manage the Joondalup Public
Hospital, found serious limitations in the quality
standards employed within the contract (Auditor
General Western Australia 1997). Not only might the
contract not deliver the required quality of services, the
private company could limit the quantity of services
provided if it was in its commercial interests to do so,
discharge patients early to minimise operational costs,
and increase its own payments from the state
government by ‘coding up’ the treatments. In relation to
risk transfer, the Auditor General believed that far from
transferring risk to the private sector, the contract had
created extra risks, including limited financial control
over the quality of services; financial incentives for the
company to influence admission, treatment and
discharge patterns; and potential overpayments
because of incorrect coding of treatments.
In New South Wales, the State Auditor General was
highly critical of the BOO (build, operate and own)
contract to run the Port Macquarie Base Hospital,
questioning the capacity of government to negotiate
acceptably balanced deals with the private sector. His
report criticised the financial arrangements that ensured
that the state paid for the cost of capital construction
twice over through an annual availability fee and the
set fee for service payments, thereby paying A$143.6
m through this service charge (New South Wales
PFI and hospitals
PAGE 145
Auditor General 1996). Collyer (2001) cites a newspaper
report based on figures published by the Department of
Health that showed that it was costing 30% more to
run Port Macquarie than its own public hospitals.
In short, there is very little evidence in the academic
literature about the post-implementation phase of
hospital projects in the UK and such as exists is
inconclusive. In Australia, where similar arrangements
to PFI exist, these have proved problematic. Although
there may be more positive experience in Australia to
report, this has not come to our attention.
Commercial reports
There are two additional sources of reports on PFI, the
credit ratings agencies and the PFI corporate press. We
consider each in turn.
The credit ratings agency, Standard and Poor’s (2003),
provides a useful assessment of PFI in general and
hospital PFI projects in particular. It has rated and
assessed more than 30 PFI projects, including eight
hospital projects, from the standpoint of investors and
the capital markets. Its key ratings factors include
credit rating of the public body, construction risk,
contractual and revenue structure, operating risk,
financial structure and legal issues.
First, it notes that since NHS trusts are independent
bodies, the Secretary of State for Health, unlike the
Secretary of State for Transport, will not guarantee the
performance of the contracts, and hence NHS trusts
are not AAA rated government-guaranteed debt.
Although the underlying projects have been rated at
BBB+, they have received AAA ratings on the basis of
insurance wrapping. This is because, as Standard and
Poor’s recognises, high levels of direct and indirect
government support and control mean that the trusts’
poor creditworthiness is not a problem in practice.
Secondly, although in general PFI construction risk is
low compared with other infrastructure projects,
hospitals tend to be more complex than office
accommodation projects. Nevertheless, all rated PFI
projects have been built to time or early and within
budget. Indeed, the Carlisle project finished six weeks
ahead of schedule.
Thirdly, hospital PFI projects lack volume and market
risk, with PFI revenue largely based on the asset being
available for use. Standard and Poor’s notes that
availability income has been very stable thus far.
Although Carlisle PFI hospital has suffered three
unavailability incidents, only one led to a deduction and
that was less than £100. Other rated projects have not
suffered any deductions.
Fourthly, in the context of performance risk during the
operational phase when payment streams are
dependent on performance reaching agreed service
levels, a risk held by the service provider, Standard and
Poor’s notes that the performance monitoring regimes
are generally complex and untested. Many are too
complex to be applied effectively and their subjectivity
could lead to disputes. Consequently, the reality has
been that there have been few deductions thus far.
Standard and Poor’s reports that even in the case of
Carlisle Hospital (where there have been well
publicised difficulties), despite disagreements in 2000
over catering services creating difficulties for the SPV,
there were no deductions for poor service, as there was
a ramp-up period before the penalty regime took effect.
In areas of soft-cost risk such as cleaning and catering,
benchmarking around years five to seven is likely to
lead to an increase in the service element of the PFI
tariff, thereby cushioning the SPV and mitigating risk.
The most important risks are likely to be in the hard
services, such as maintenance, that will be necessary
half way through the contract, since this element of the
tariff is fixed. Only then will it be clear whether in fact
the original estimates and reserves were accurate.
Standard and Poor’s believes that the PFI market will
grow and undergo further innovation, including a
PFI and hospitals

PAGE 146
greater operational role in core services and a
corresponding increase in risk. This is likely to be
mitigated in ways that ensure that most projects
remain investment grade, because if ratings were to fall
below investment grade, this would push up finances
charges and thus the cost to the public purse.
Standard and Poor’s therefore concludes that PFI
projects provide a relatively stable income stream and
limited operational risks. The above-mentioned factors
plus the ability of the SPVs to structure the deal in
ways that push risk down to the subcontractors mean
in effect that the SPVs carry little risk. Nevertheless,
the high levels of debt, low debt service coverage and
the single asset nature of PFI projects mean that most
PFI projects fall within the low investment grade of
BBB+, unless they are insurance wrapped. They warn
against projects with increasingly risky services,
especially those that are highly geared and over-reliant
on poor subcontractors, volatile income streams and
onerous performance regimes. As will be seen,
however, hospital projects contain many of these
characteristics.
The second source of information about the
performance of PFI hospitals is derived from the PFI
corporate press. PPF Focus: Health reported that
although the design and construction of three PFI
hospitals, the Norfolk and Norwich, Barnet and Chase,
and Calderdale were good, the trusts suffered from a
shortage of capacity that adversely affected their
performance (PPF 2001). All the hospitals were
operating at above desirable capacity levels, normally
believed to be about 85%. This has several interrelated
implications: first, service levels fall, waiting lists
lengthen and income falls as the primary care trusts
send patients elsewhere; and costs rise sharply because
of additional PFI payments when activity rises above
the contractual ‘normal’ level. Calderdale has had to
refurbish some of its old estate that it had hoped to
close. Barnet and Chase failed to achieve a single star
in the star rating system, with the local PCT being
reported as saying it was considering avoiding it
altogether, while Norfolk and Norwich actually dropped
a star. Thus PFI has the potential to destabilise the
trusts financially.
There are several implications of this literature review
for the present study.
• Numerous studies question the economic case for
PFI, the appraisal methodology, interpretation of the
projects’ full business cases, the high cost of using
private finance and the implications for affordability
and service provision, suggesting that the emphasis
on VFM may be misplaced.
• Most of the risk transfer relates to the construction
phase, which has been successful in delivering new
hospitals on time and to budget. Although the
system of incentives has worked, it has come at a
cost and it is unclear why similar objectives could
not be achieved by appropriately designed
construction contracts.
• Not all the hospitals have been trouble free and
concerns have been raised about their conception
and design.
• The operations phase is believed to be more
problematic. Given the early stage of the policy, little
is known about whether the system of incentives
and penalties can and will deliver in the operations
and maintenance phase.
• Similar hospital projects in Australia have turned out
to be more expensive than expected and in one case
had to be taken back into public ownership.
The NHS’s response to the official reports
Although the NHS has provided guidance on PFI
procurement issues since inception (NHS Executive
1994, 1999a, 1999b), it provided limited guidance on
project evaluation as the emphasis in the early years for
PFI and hospitals

PAGE 147
PFI was rather on the forecast procurement
requirements. We noted above that there was patchy
provision of systems of performance monitoring and
benchmarking in the NHS, making it difficult to assess
whether the trusts achieved VFM.
In recent years the NHS has introduced a number of
procedures designed to improve performance
monitoring and review across the board, for both
procurement and operational performance. It has
addressed the more general capital procurement issues
with the development of the ProCure21 initiative (NHS
2003) described as a ‘dynamic benchmarking and
performance management system’. ProCure 21,
launched in April 2000, has brought together the
recommendations of a number of government reports,
including the adoption of partnering arrangements in
accordance with the Achieving Excellence in
Construction initiative launched by the Treasury in
1999, and the use of benchmarking and performance
management to raise standards in response to the Egan
Report Rethinking Construction (1998) and the report
Sold on Health (DoH 2000). The aim of these
requirements was to save the cost of legal advice and
tendering time. This appears to have been very
successful as the NHS Estates Annual Report and
Accounts 2002/03 (NHS Estates 2003c) states that it
reached its target procurement time of four years for
£300 m worth of projects in just six months.
In 2002, the Department of Health issued new
practical and evidence-based guidance to improve post-
project evaluation with its Learning Lessons from Post-
project Evaluation (DoH 2002a) which replaced the
guidance given in the Capital Investment Manual (NHS
Executive 1994). As the reports emanating from this
process are not in the public domain, it is impossible to
draw any conclusions about post-implementation
performance of NHS PFI projects or even to find out
whether such reviews have been carried out. Broadbent
et al. (2003) criticise this guidance because it applies
to all NHS capital projects, irrespective of whether they
are PFI or not, and therefore does not address the
features specific to PFI evaluation.
Only some of the 13 trusts in our study have carried
out a post-project evaluation. We have obtained a copy
of the post-project evaluation for one trust (Queen
Elizabeth Hospital 2003). The fieldwork for this was
carried out in mid-2002, with the report finally being
issued in December 2003, thus demonstrating the long
time lag with such reports. Although it followed the
DoH’s Learning Lessons from Post-project Evaluation it
made two significant changes, thereby highlighting
potential shortcomings of this guidance. First, following
the suggestions of the trust’s director of modernisation,
it surveyed all trust staff rather than the 100
recommended by the guidance and it held significantly
more workshops and meetings. Secondly, the
consultants who compiled the report changed the
format of the standard contents and headings to
produce what they thought was a more readable report.
A significant portion of the report concentrates on
issues prior to the service phase, where the lack of
guidance and previous PFI experience caused problems
in the procurement, contract negotiation, construction
and equipping phases, with the trust having to commit
a greater level of resources than anticipated.
With regard to the services phase, there were criticisms
of many aspects of the facilities management services
provided by the private sector partners, including
portering, catering, cleaning, security, car parking and
estates management. The report states:
Although it is acknowledged that day-to-day
relationships have been good there are many
significant contractual and practical dimensions of the
facilities service provision that attract vociferous
criticism and considerable frustration amongst trust
staff that there is insufficient resources or staffing to
fulfil the FM function to a satisfactory standard.
(Queen Elizabeth Hospital NHS Trust 2003,
para. 4.7.1)
PFI and hospitals

PAGE 148
There is clearly a need for post-implementation review
to be carried out on a regular basis over the life of the
PFI contract. The NHS has addressed this by adopting
the Gateway Process in 2003 (outlined in Chapter 2),
although, given the time lag experienced on the above
post-project evaluation case, it is too early as yet to see
any evidence of its implementation.
Regarding the sharing of operational performance
experience, NHS Estates have developed a database
system for the electronic collection and provision of
information and benchmarking in line with
e-government principles (NHS Estates 2003a, 2003b).
Its purpose is to enable information to be shared across
NHS trusts, so that service and maintenance costs may
be compared, and hence allow an evaluation as to
whether VFM is being achieved. However, as yet there is
no publicly available evidence relating to the usefulness
of this system.
In summary, in recent years the NHS has expanded
and standardised its systems of performance evaluation
for both capital procurement and operational activities.
The use of database systems accessible by all trusts
suggests enhanced opportunities for benchmarking and
comparative performance evaluation, while the greater
standardisation and increased requirements for post-
project evaluation mean that more analysis should be
taking place that would also aid cross-project learning.
From the public perspective, as very little information is
in the public domain, it is not possible to assess in any
way whether VFM is being achieved. Official reports do
no more than comment in very general terms on
aggregated performance. The veil drawn across all
detailed performance outcomes necessarily means that
any analysis is limited to the much less detailed
published financial statements of the NHS acute
hospital trusts.
PFI: FINANCIAL PERFORMANCE
Table 7.2 (see page 138) shows the number of PFI
projects that have reached financial close or are in
progress. Of these, while 21 PFI hospitals were open
by December 2003, only 13 were operational during
the financial year 2002/3, as reflected in the trusts’
accounts. The subject of our analysis is therefore the
first 12 PFI hospitals in England and one in Scotland
that are now operational. We examine the 13 trusts’
expenditure on PFI and how this is reported, the
structure of the deals, the PFI companies’ income,
costs, including the cost of capital and returns to
shareholders, to provide evidence about the actual
VFM, risk transfer and how PFI projects are reported
and accounted for.
For our evidence base, we use the trusts’ annual report
and accounts for the years up to 2003, not the
summaries shown on their websites. In the case of
North Durham, however, we use only the accounts up
to 2002. This is because the trust merged with South
Durham Healthcare Trust in October 2002 and we
were able to obtain only the 2003 accounts for the six
months October 2002–March 2003, not the full year.
It must be said that it required considerable persistence
to obtain the full set of accounts from some trusts. In
one case, we were even asked to pay for the accounts,
something that is allowed by the NHS Trust Manual of
Accounts (NHS Executive 1999c, para. 4.2).
In the case of the PFI companies, after identifying the
consortia from information provided by the trusts, we
used the FAME database of company accounts to
identify the company, its parent and related companies,
and then obtained all the PFI companies’ accounts
from inception up to their most recent filing from
Companies House. Since as private companies the
SPVs are not required to file their accounts for up to
eighteen months after financial close, the most recent
accounts relate to 2001/2. This means we have fewer
financial data for the SPVs than for the trusts.
PFI and hospitals

PAGE 149
Table 7.3: First 13 new build hospital PFI projects to reach completion
Total cash Constructioncost over Contract completion
Capital contract length Sign /fullyHospital cost (£m) period (£m) (years) Project details date operationalBarnet and Chase 54 448 Implies Redevelopment of Barnet 02/99 Completion
31–35 General Hospital late 2002Bromley 155 559 30 Rationalisation of several 11/98 Part opened
on balance sites, two-phase project 03/00, andsheet scheme including (i) mental health complete 12/02
and (ii) acute hospital, plusservices at another threehospitals (maintaining fourhospitals in total)
Calderdale 76 474 30 Centralisation of acute 07/98 03/01 and fullrefinanced hospital services at new services 06/01
hospital, merged withHuddersfield Acute Trust
Carlisle 67 366 45 Rationalise three sites, 09/97 Operational duringoriginally refurbish and new build of year ending 12/00
stated as 30 acute hospital services atnew site, trust merger
Dartford 133 450 67 New general hospital 07/97 07/00refinanced originally replacing three old
stated as 60 hospitalsEdinburgh Not stated 30 Reconfiguration of acute 08/98 07/07 provision of
but approx services from four sites onto services 10/01200 one new greenfield site phase 1 new build.
on balance 07/02 services atsheet scheme medical school.
09/03 projectcompletion
Greenwich 94 523 60 Rationalisation, new 07/98 Hospitaloriginally build and some completed 03/01
stated as 30 refurbishmentHereford 65 310 30 New district general 04/99 Completion 04/02
hospital replacing threeolder hospitals
North Durham 92 380 30 New district hospital at 03/98 Completion 04/01Dryburn. N and S DurhamHealthcare Trusts merge toform Co Durham andDarlington Acute HospitalsTrust with a PFI project atS Durham (later)
Norfolk and Norwich 229 1,163 60 Rationalisation and new 01/98 Main hospitalhospital on one site, 07/00 complete 08/01.two phases/contracts Extension 10/02
South Manchester 67 450 35 New build and centralisation 12/98 Phased completionof acute and mental health and fullyservices at suburban site plus operational bymaintenance of all services 08/01
South Bucks 38 328 30 Site rationalisation and new 12/97 Phased completionon balance wings at two sites 03/00 and 11/00
sheet schemeWorcester 106 517 30 New district general hospital 03/99 12/01
on greenfield site, replacingthree sites
Sources: annual reports and accounts (various years); PPP Forum.Note: capital value financed by private sector, excluding NHS contribution.
PFI and hospitals

PAGE 150
THE TRUSTS’ EXPENDITURE ON PFI
Estimating the value of PFI hospital projects
The 13 PFI hospitals that are the subject of our study
are listed in Table 7.3 (see page 149). As the first PFI
deals, signed between 1997 and 1999, they have
been at least partly operational since April 2001. As
noted earlier, it is difficult to get consistent information
about the projects as various sources cite different
figures. First, there are different estimates of the capital
costs of the new builds. Although this may reflect
different definitions, eg the private sector’s contribution
as opposed to the total capital cost, which may have
included a contribution from the NHS, land sales, etc,
it makes accuracy, transparency or accountability
somewhat problematic. Secondly, even the length of
the contract period does not appear to be fixed. Not
only did the various sources show different contract
periods, but the trusts themselves are also reporting
different contract lengths. For example, three trusts
(Carlisle, Dartford and Greenwich) reported a longer
contract period in 2003 than they did in earlier years
(Table 7.3 on page 149), without providing an
explanation for this change.
There is a further indication of the confusion and lack
of clarity that surrounds the reporting of PFI. According
to the DoH, as reported by the Health Select
Committee (2000), the total expected cash cost of the
Hereford PFI project was about £310 m at 1996/7
prices (Table 7.4 opposite). This implies a Net Present
Cost of about half that, assuming a 6% discount rate,
over the expected 30-year life of the contract. Yet the
DoH reported an NPC of £685 m – more than the
presumed cash cost (£620 m) over the project, shown
as having a life of 60 years. The DoH claims that this is
slightly lower than the PSC, raising questions about the
accuracy of the data it provided to the Health Select
Committee and whether the projects were indeed VFM.
According to the trusts’ accounts, the capital costs of
these 13 PFI hospital projects in England and Scotland
were £1,376 m (column 1 of Table 7.4, see page
151). Thus, the first wave of 12 PFI hospital projects
in England accounted for only £1.2 billion of the £3.7
billion PFI projects in the NHS (NAO 2002f), implying
that the more recent contracts are much bigger and
that some of the PFI projects relate to community and
mental health hospital trusts. The projects involved
some element of new build, often rationalising facilities
on several sites in one location, either as an additional
hospital on an existing location or on a greenfield site.
Most of the schemes were not particularly large as
reflected in construction costs, with only five hospitals
costing more than £100 m. When the total costs of
operations and maintenance over the contract life are
considered, however, it can be seen from Table 7.4 that
the 13 trusts are committed to a total expenditure of
nearly £6 billion (at 1997 price levels) and annual
payments of about £208 m, as reported by the DoH to
the Health Select Committee (2000).
In the absence of specific information on these projects
about the value of risk transferred to the private sector,
we have assumed conservatively that the discounted
value of risk transfer was equal to about 30% of
construction cost based on evidence submitted to the
Health Select Committee (HSC 2000). This implies
that about £420 m (30% of the total £1,376 m
construction costs) relates to risk transfer. Since most of
the risk relates to construction risk, which occurs in the
first few years of the project, the discounted value of
the risk may not be very much less than the cash value
of the risk. This means that the trusts have paid the
best part of £420 m to get the hospitals built to time
and budget. The evidence shows, however, that the
average increase in cost over approved tender sums for
NHS capital projects has been between 6.3% and
8.4% in the 1990s (NAO 1998b). Assuming that the
capital costs under conventional procurement are
£1,376 m less the cost of risk transfer at £420 m, ie
£956 m, then one might expect a total cost overrun of
£76 m (8% of £956 m for the 13 hospitals). Although
one can vary the assumptions, this does suggest that
PFI and hospitals

PAGE 151
Table 7.4: PFI project costs
Expected Expected Expected Total
total total Expected annual Expected Expected
service availability total availability annual annual
Capital charge for charge for cost for fee in service fee cost in
value contract contract contract 2002/3 in 2002/3 2002/3
Hospital (£m) (£m) (£m) (£m) (£m) (£m) (£m)
Col 1 Col 2 Col 3 Col 4 Col 5 Col 6 Col 7
Off balance sheet
projects
Dartford 133 150 300 450 12 6 18
Greenwich 94 174 349 522 12 5 17
Hereford 65 138 172 310 6 5 11
Norfolk and Norwich 229 329 834 1,163 28 11 39
South Manchester 67 225 225 450 8 8 15
Worcester 106 300 217 517 8 10 18
Off balance sheet
projects – trust mergers
Calderdale 76 200 274 474 10 7 16
Carlisle 67 159 207 366 7 5 12
North Durham 92 159 221 380 8 6 14
On balance sheet
projects
Barnet and Chase 54 310 138 448 5 10 15
Bromley 155 241 318 559 4 2 6*
South Bucks 38 186 141 327 5 6 11
Edinburgh 200 177 550 727 12 4 16*
Total 1,376 2,571 3,396 5,966 125 85 208
Sources:
Hospital accounts for capital values in col 1.
Health Select Committee Memorandum (2000) for expected charges for hospitals in England (cols 2–7).
Royal Edinburgh Infirmary full business case for expected charges for Edinburgh (cols 2–7).
Note
* Expected annual cost in 2002/3 is not necessarily steady state cost, particularly for Bromley and Edinburgh, which
were not fully operational.
On balance sheet schemes: payments include payments as stated in Note 25 to the accounts plus imputed interest on
finance lease.
Sums may not add up owing to rounding.
PFI and hospitals

PAGE 152
the trusts are paying a very high cost of risk transfer to
get the hospitals built to time and budget.
In three cases, PFI was accompanied by trust mergers
and corporate restructuring. In most cases, there was
extensive reprovisioning of healthcare facilities within
the local healthcare economy. PFI was usually
accompanied by asset sales (or transfers) of land and
buildings, sometimes to the PFI company or related
parties. The replacement facilities (old and new)
typically resulted in smaller hospitals with fewer beds
and less capacity than those they replaced, with
implications for revenue and costs. The significance of
all these concurrent changes is that it necessarily makes it
difficult to isolate the impact of PFI on the trusts.
Accounting for PFI
In order to analyse the cost of PFI to the trusts, we
consider its accounting treatment since this determines
how the substance of the transaction is reported. This
requires an analysis of the relevant risks and rewards
which each party will bear, in order to determine which
assets and liabilities will or will not be recognised in the
relevant financial statements. ASB (1999) sets out
guidance as to how such an analysis should be carried
out. The general rule is that if demand risk is borne by
the trust, key operational features are determined by
the trust, there is little or no opportunity for financial
penalty and the trust bears the cost of obsolescence,
then the hospital will be regarded as on balance sheet.
In other words, it is necessary to show that risk transfer
has taken place if schemes are to be recorded as off
balance sheet. This in turn would have seen many PFIs
remain on balance sheet, contrary to the wishes of the
Government. Broadbent and Laughlin (2002) have
analysed the technical and political trade-offs that took
place with regard to acceptable accounting treatment
for PFI assets. This resulted in the publication of an
addendum to the main reporting standard (ASB 1998)
and a revision to the Treasury guidance (Treasury
Taskforce 1999a).
The effect of this accounting regulation was to increase
pressure to transfer risk into the private sector despite
the fact that the contracting party best able to manage
it ought to hold the risk. Indeed, Standard and Poor’s
(2002) confirm that the private sector has been asked
to take more risk in more recent schemes than in
earlier projects and imply that the Government has
been willing to pay for this.
If it is determined that the hospital is an asset of the
trust, then it is treated under the rules for a finance
lease as laid down by SSAP 21 Accounting for leases
and hire purchase contracts (Accounting Standards
Committee 1984). It should be recognised in the trust’s
balance sheet at fair value when it becomes
operational, and depreciated over its expected useful
life. A liability for the corresponding obligation should
also be shown. The unitary payment should be split
between a capital repayment of the obligation, a related
finance charge (based on a property-specific rate) and a
service charge, which is recorded as an operating cost.
As the asset is on the trust’s balance sheet, it will incur
capital charges under the NHS’s capital charging
regime.
If it is determined that the trust does not recognise the
hospital as an asset, then the unitary payment should
be recorded as an operating expense. Some assets and
liabilities may still need to be recorded, as in many
cases the trust has contributed some assets to the
scheme. In addition, the trust will have an interest in
the residual value, because at the end of the contract
term the asset will be returned to the trust.
Since conformity with FRS 5 would require the assets
to be on balance sheet unless sufficient operational risk
has been transferred, the fact that four of the 13 trusts
now show the contracts on balance sheet indicates that
the determination of risk transfer is not straightforward.
These four trusts evidently consider that they still retain
a large element of risk in relation to the contract and
therefore under the accounting regulations they must
PFI and hospitals
PAGE 153
keep the full assets on balance sheet together with the
related financial obligations. As there is no requirement
in the accounting standards or Treasury guidance for
the public or the private sector to disclose details of
their risk assessment it is impossible to understand the
basis for their decisions.
Although the different accounting treatments create
budgetary uncertainty for the trusts, their significance
for analysis purposes is limited. Higher asset values are
recorded for on balance sheet schemes and offset by
the corresponding financial obligation. Over time, the
assets will be reduced by the accumulating
depreciation and the finance obligation will reduce
owing to increasing capital repayments (there will be a
timing difference between straight-line depreciation
charges and increasing capital repayments). In the
profit and loss account, off balance sheet schemes will
record the full charge under operating costs. On
balance sheet schemes split the charge in the profit
and loss account between the service element
(operating costs) and the imputed finance charge. An
additional depreciation cost is charged against
operating costs. These three elements should be
roughly equivalent to the total unitary charge of the off
balance sheet schemes (although as noted there will be
timing differences). As a result of both the different
accounting treatments and the trusts mergers, there are
three groups of hospitals which we will treat separately
for analytical purposes: the six off balance sheet
hospital schemes, the three off balance sheet merged
trusts and the four on balance sheet schemes.
Reporting PFI payments
The visibility and transparency of the information about
PFI is very poor. The trusts do not normally provide
financial information about their PFI payments in their
annual reports and summary accounts, produced for
the wider public and available on the trusts’ websites.
The information relating to PFI is given in two notes to
the accounts. First, and most importantly, Note 25
gives details, usually very brief, of the PFI scheme in
accordance with the disclosure requirements of FRS 5.
It reports the full sum paid in relation to the PFI
contract for the off balance sheet contracts and
expected payment in the following year (which may
differ considerably from the actual payment as shown
in Note 25 to the accounts in the following year), future
payments, the capital value and contract period. For
the on balance sheet schemes, additional disclosure is
given in the notes in accordance with the disclosure
requirements of SSAP 21 in relation to finance leases.
The second potential source of information is Note 5 to
the accounts. This provides a somewhat limited
breakdown of operating expenses, in accordance with
NHS guidelines. Since there is no explicit heading for
PFI payments under operating expenses, however,
trusts simply allocate their payments between the
various headings. An examination of the trend of
operating costs indicates that elements of the PFI
service charge are generally included within the
headings of ‘premises’ and ‘clinical supplies/services’,
with the availability fee usually allocated to the ‘other’
heading. This varies from trust to trust, with some
trusts merely allocating the whole payment to ‘other’
with no further breakdown. In only two cases is it
possible to calculate or see the split between the
availability fee and the service charge and that is
because extra information is provided as an addendum
to Note 5.
It is unclear whether this lack of clarity is deliberate
obfuscation or occurs simply because the NHS trust
standard templates for the preparation of accounts do
not permit the information to be shown in any more
distinct way. The reporting of PFI payments in annual
accounts is still relatively new and it may be that
individual trusts do not yet realise that more
information about the split of PFI payments is
necessary to permit an informed analysis in relation to
VFM and accountability to be carried out. Furthermore,
an examination of the contents of Note 25 indicates
that there is some confusion as to what the NHS
PFI and hospitals
PAGE 154
requires the trusts to provide. As it stands, therefore, it
is impossible to carry out very much financial analysis.
At the very least, in the interest of clarity and
accountability, the notes to the accounts should show
the split between the availability fee and service
charge, how the payments are allocated between the
various expenditure categories in Note 5, performance
deductions on each element of the payment
mechanism, and should explain the reasons for the
difference between the previous year’s expected
payment and the amount actually paid.
PFI charges
Table 7.5 (see page 155) shows the payments made
by each of the trusts to the SPVs since 2000, when the
projects became operational. In the early years,
payments were small as projects were phased in, with
the consortium taking responsibility for services of
existing facilities before each new hospital was
completed. Payments increased as the new buildings
were completed. In most cases, the projects appear to
have become fully operational by 2002/3 since the
expected payments in the next and future years were of
the same order. The chief exception to this is the Royal
Infirmary at Edinburgh (RIE), where the new hospital
was not expected to be fully operational until October
2003, half way through the financial year 2003/4.
According to Table 7.3 (see page 149) , it is likely that
a further three schemes (Norfolk and Norwich, Barnet
and Chase, and Bromley) became fully operational only
later in the financial year 2002/3 and thus their
payments may rise in 2003/4 to reflect this.
Table 7.5 also presents the expected payments at
1996/7 price levels as set out in the trusts’ full
business cases (Health Select Committee 2000).
Considering the off balance sheet schemes first, it can
be seen that the pattern of payments has not been
exactly as expected. First, payments started earlier than
expected, probably because the SPV took over service
provision at the existing hospitals before completion of
the new facilities and/or the construction element of the
project was completed ahead of schedule. Secondly,
once the projects were up and running, some hospitals
seem to have been paying more than expected. For
example, in 2002/3 Greenwich paid 36%, South
Manchester paid 34%, Carlisle paid 5%, and
Calderdale and Worcester paid 4% more than expected.
Such increases could be due to price inflation as set out
in the contract, volume increases, contract changes and
unexpected increases due to failure to identify and/or
specify requirements in sufficient detail in the contract.
In two cases, Dartford and North Durham, payments
seem to be slightly less than expected. In principle, this
could be due to penalty deductions for poor
performance. None of the trusts, however, sets out
expected payments as per the FBC and/or explains why
outcomes have varied. Neither do they explain why the
payments turned out to be different from their
estimates made only the year before. Considering next
the level of payments in 2003/4, four expect to pay
significantly more than they paid in 2002/3, again
without any explanation of why this may be.
Considering next the on balance sheet schemes, it can
be seen from Table 7.5 that these also seem to have
become operational – at least in relation to the service
element – earlier than expected. One scheme, Edinburgh,
was costing more than expected at financial close, even
though it was not fully operational, but the other three
schemes were costing slightly less than expected at
financial close. This is likely to be because they were
not fully operational in 2002/3. Considering next future
payments, Barnet and Chase and Bromley do expect to
pay slightly more in 2003/4 than anticipated in their FBC.
Their imputed interest will decline in the future, however,
in theory reducing their actual payments. Edinburgh,
on the other hand, does look set to pay significantly
more than expected in the FBC. Thus, although the
picture is, to some extent at least, confused, as PFI is
still new and payments have not settled down, at least
one of the off balance sheet schemes is also likely to
pay more than expected at financial close.
PFI and hospitals
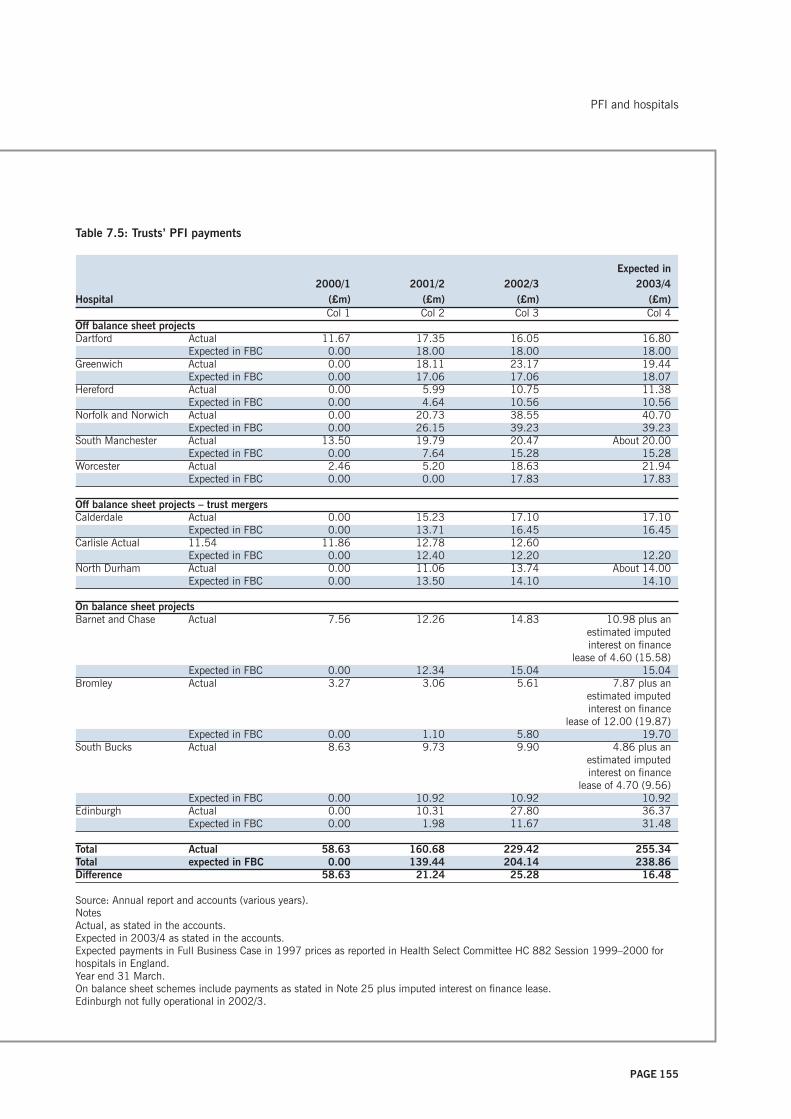
PAGE 155
Table 7.5: Trusts’ PFI payments
Expected in2000/1 2001/2 2002/3 2003/4
Hospital (£m) (£m) (£m) (£m)Col 1 Col 2 Col 3 Col 4
Off balance sheet projectsDartford Actual 11.67 17.35 16.05 16.80
Expected in FBC 0.00 18.00 18.00 18.00Greenwich Actual 0.00 18.11 23.17 19.44
Expected in FBC 0.00 17.06 17.06 18.07Hereford Actual 0.00 5.99 10.75 11.38
Expected in FBC 0.00 4.64 10.56 10.56Norfolk and Norwich Actual 0.00 20.73 38.55 40.70
Expected in FBC 0.00 26.15 39.23 39.23South Manchester Actual 13.50 19.79 20.47 About 20.00
Expected in FBC 0.00 7.64 15.28 15.28Worcester Actual 2.46 5.20 18.63 21.94
Expected in FBC 0.00 0.00 17.83 17.83
Off balance sheet projects – trust mergersCalderdale Actual 0.00 15.23 17.10 17.10
Expected in FBC 0.00 13.71 16.45 16.45Carlisle Actual 11.54 11.86 12.78 12.60
Expected in FBC 0.00 12.40 12.20 12.20North Durham Actual 0.00 11.06 13.74 About 14.00
Expected in FBC 0.00 13.50 14.10 14.10
On balance sheet projectsBarnet and Chase Actual 7.56 12.26 14.83 10.98 plus an
estimated imputedinterest on finance
lease of 4.60 (15.58)Expected in FBC 0.00 12.34 15.04 15.04
Bromley Actual 3.27 3.06 5.61 7.87 plus anestimated imputedinterest on finance
lease of 12.00 (19.87)Expected in FBC 0.00 1.10 5.80 19.70
South Bucks Actual 8.63 9.73 9.90 4.86 plus anestimated imputedinterest on finance
lease of 4.70 (9.56)Expected in FBC 0.00 10.92 10.92 10.92
Edinburgh Actual 0.00 10.31 27.80 36.37Expected in FBC 0.00 1.98 11.67 31.48
Total Actual 58.63 160.68 229.42 255.34Total expected in FBC 0.00 139.44 204.14 238.86Difference 58.63 21.24 25.28 16.48
Source: Annual report and accounts (various years).NotesActual, as stated in the accounts.Expected in 2003/4 as stated in the accounts.Expected payments in Full Business Case in 1997 prices as reported in Health Select Committee HC 882 Session 1999–2000 forhospitals in England.Year end 31 March.On balance sheet schemes include payments as stated in Note 25 plus imputed interest on finance lease.Edinburgh not fully operational in 2002/3.
PFI and hospitals
PAGE 156
Taken together, this means that the PFI contracts
turned out, in some cases at least, to be more
expensive than expected and that therefore the total
costs of the projects over their 30-year lifetime are
likely to be much more than that expected at financial
close (£6 billion). The reasons for this are developed
with our case hospital in the next chapter, and illustrate
that the nature of the contracts means that the PFI
payments determined at financial close may change.
The trusts’ financial performance
To understand the impact of PFI and the new facilities
on the trusts’ financial position, it is necessary to
consider the trusts’ asset base, since this determines
the charges payable on their Public Dividend Capital
(PDC) to the Treasury, as well as the PFI payments.
Table 7.6 (see page 157) shows first that most (an
exception is Worcester) of the off balance sheet PFI
schemes resulted in estates of lower or at least similar
value, because trusts sold or rationalised their estate as
their new PFI build came on stream. Secondly, some of
the trusts, as a result of mergers, reconfigurations and
rationalisations, saw a significant increase in – in some
cases a tripling of – their asset base. Thirdly, the on
balance sheet schemes resulted in a significant
increase in the value of the trusts’ estate, up to
threefold in the case of Bromley, because the projects
involved a new hospital costing more than the previous
value of the asset base, plus the retention of some of
their existing facilities. Considering the trusts as a
whole, their asset values rose from £892 m in 2000 to
£1,434 m in 2003, an increase of 61%.
Although any new hospital will necessarily have a
higher book value than the heavily depreciated one it
replaced, irrespective of how the new hospital is
financed and who is the owner, this higher capital value
carries the penalty of higher capital charges (dividends
to the Treasury on Public Dividend Capital and
depreciation), currently 6%. This can be demonstrated
by comparing the dividends on the PDC of the old
estate in 2000 with an estimate of the PDC for the new
estate in 2003, calculated for simplicity as 6% of fixed
assets (which is slightly higher than the average
relevant net assets actually used). Column 3 of Table
7.6 shows that the estimated capital charge (dividend
payable on the PDC) for the new hospitals and the
retained estate for 2003 is indeed considerably higher
than for the old estate as it existed in 2000. The cost
of capital more than doubled (£145.73 m in 2003
compared with £57.94 m in 2000). The size of the
increase varied considerably depending on the net
increase in the value of the estate. In fact this
underestimates the impact of the new hospital on
capital charges since, as the appraisal literature
reviewed earlier showed, the cost of the new hospitals
upon which the capital charges are based was up to
30% higher under PFI than it would have been under
conventional procurement.
The availability fee for the new facilities under PFI is
higher than the Government’s 6% dividend on the PDC
as it must cover several extra costs: the cost of private
finance – both debt and equity – that is necessarily
more expensive than public finance; the high
transactions costs involved in the bidding process; the
cost of risk transfer (approximately £420 m as we have
earlier estimated); and an element for premises and
maintenance, previously an operational expense for the
trusts if carried out at all, although as a new hospital
this is unlikely to be significant until later in the
contract. This means that the trusts will face an even
greater increase in the cost of capital for the new estate
under PFI. Column 4 demonstrates this by comparing
the cost of capital (dividends on the PDC and the
availability fee) in 2000 and 2003, before and after
PFI became operational. It shows that there was on
average a threefold rise in the cost of capital after PFI
(£190.28 m in 2003 compared with £57.94 m in
2000). This rise was larger for the off balance sheet
schemes than the on balance sheet ones, although this
was to some extent because the latter were not all fully
operational throughout 2002/3.
PFI and hospitals

PAGE 157
Table 7.6: Trusts’ capital charges and PFI payments
Estimated Actual Actual Actualcapital charge capital capital capital
Capital on old and charge charges plus charges plusTotal value of new hospitals plus PFI depreciation depreciationFixed new under capital availability and PFI and PFI
assets hospital charging fee availability Income availability
Trust (£m) (£m) (£m) (£m) (£m) (£m) /incomeCol 1 Col 2 Col 3 Col 4 Col 5 Col 6 Col 7
Off balance sheet projectsDartford 2000 25 3.57 3.57 4.63 61 5.01%
2003 6 133 9.50 13.52 14.50 84 17.31%Greenwich 2000 47 2.83 2.83 4.78 96 4.71%
2003 38 94 8.10 14.66 15.42 126 12.27%Hereford 2000 14 1.24 1.24 3.39 53 5.05%
2003 14 65 4.63 6.68 8.07 68 11.82%Norfolk and 2000 14 0.95 0.95 4.52 145 3.08%Norwich 2003 32 229 15.49 29.98 34.40 217 15.83%South 2000 118 8.57 8.57 16.92 178 7.99%Manchester 2003 116 67 10.13 13.75 19.46 194 9.99%Worcester 2001 75 5.64 5.64 9.70 160 3.59%
2003 94 106 11.07 12.19 16.56 182 9.08%Off balance sheet projects – trust mergersCalderdale 2000 32 2.25 2.25 4.36 89 4.68%
2003 97 76 11.18 16.14 21.16 197 10.74%Carlisle 2000 9 1.22 1.22 3.04 58 4.21%
2003 51 67 6.75 9.63 12.79 146 8.74%North Durham 2000 19 1.70 1.70 4.22 90 4.47%
2002 35 92 7.13 7.60 12.21 114 10.69%On balance sheet projectsBarnet 2000 179 11.61 11.61 16.52 146 11.29%and Chase 2003 235 54 18.23 19.67 25.69 198 13.00%Bromley 2000 67 4.67 4.67 7.92 123 5.41%
2003 189 155 14.08 12.27 17.95 118 15.21%South Bucks 2000 88 4.53 4.53 8.27 93 8.79%
2003 100 38 5.64 12.57 15.97 96 16.64%Edinburgh 2000 205 9.16 9.16 21.37 319 6.69%
2003 427 200 23.80 21.62 35.27 416 8.47%
Total 2000 892 57.94 57.94 109.64 1,611 6.81%2003 1,434 1,376 145.73 190.28 249.45 2,156 11.57%
Difference attributable tonew hospital andrestructuring of assets 132.34 139.81
Sources:Annual report and accounts (various years).Capital value of new hospitals as stated in accounts.Health Select Committee for estimates of availability fee (see also Table 7.4 on page 151, column 5).Royal Infirmary of Edinburgh full business case for estimate of availability fee.NotesIncome has been adjusted downwards where appropriate to take into account the additional income received to compensate for fixed asset impairment.Capital charges include payments on Public Dividend Capital and interest on public debt (largely phased out by 2000) as stated in accounts.Estimated capital charge at 6% of assets, ie assuming conventional procurement at the then prevailing 6% capital charge rate.Edinburgh not fully operational in 2002/3.
PFI and hospitals

PAGE 158
In order to compare like with like, since PFI usually
resulted in lower depreciation charges – although not
for those trusts that merged or had on balance sheet
schemes – column 5 of figures in Table 7.6 (see page
157) shows the total cost of capital, including
depreciation, before and after PFI. It shows that the
average increase was two and a half, rather than three
fold (£249.45 m in 2003 compared with £109.64 m
in 2000).
In other words, as a comparison of the totals for
columns 3 and 4 in 2003 shows, PFI is costing at least
£45 m a year more for these 13 hospitals than
conventional procurement, albeit including an
allocation for maintenance in later years. Furthermore,
this is set to rise because not all the projects are fully
operational. This must have an impact on the trusts’
budgets. In column 6, we show the trusts’ income
before and after PFI, adjusted downwards where
appropriate to take into account the extra (nominal)
income received to compensate for fixed asset
impairment, and, in column 7, the total charge for
capital as a proportion of income. It can be seen that
taken as a whole, the capital/income ratio almost
doubled. It rose from 6.8% of income in 2000 to
11.6% in 2003, with some considerable variation
between the trusts. In the case of the off balance sheet
schemes, it rose from about 3% of income pre-PFI to at
least 9% of income post-PFI, rising to 12% of income
at Greenwich, 16% at Norfolk and Norwich and 17%
at Dartford. In the case of the merged trusts, the cost of
capital rose from 4% to 9–10% of income, as
rationalisation provided some cushion against PFI. For
on balance sheet schemes, the picture is more
confused as these schemes are not yet fully
operational. In the case of Barnet and Chase, the total
cost of capital rose from 11% to 13%, whereas for
Bromley and South Bucks it trebled and doubled
respectively. Edinburgh’s total cost of capital has
already risen from 6% to 8% and can be expected to
rise much further.
Thus, although trust income as a whole rose by
£545 m or 34% between 2000 and 2003 to meet
new Government initiatives, fund salary increases, and
compensate for lost income from car parking, canteen,
patients’ telephone and televisions, etc in 2003, 26%
of that increase went on the extra capital costs
(£139.81 m as shown in the bottom line of column 5
of Table 7.6 on page 157) for new hospitals that were
smaller than the ones they replaced, rather than for
front line services. This was generally higher in the off
balance sheet schemes and lower in the merged trusts
and on balance sheet schemes, although the latter is
likely to rise as the hospitals become operational. Some
of this increase quite explicitly recognised the extra
costs of PFI. For example, although the trusts must pay
the 6% capital charges on its deferred assets, the
Treasury had agreed with the Department of Health
that first wave PFIs would be reimbursed for this. Thus,
to cite but one example, Greenwich Hospital Trust’s
income for 2001/2 contains £1.5 m to offset its PDC
dividends.5
This higher cost of capital, both in absolute terms and
relative to income, necessarily has implications for
patients’ access to healthcare and affordability for the
trusts: four of the nine trusts with off balance schemes
and two of the trusts with on balance sheet schemes
had net deficits of more than £500,000 after paying
for the cost of capital (column 4 in Table 7.7 on page
159). Six out of 13 trusts (54%) have a net deficit in
2002/3, and this is a much higher proportion of all
trusts (including community, mental health and
ambulance trusts) than the national average. The NAO
(2004) reported that 50 trusts (18%) had a deficit in
2002/3. According to recent press reports (Observer
14 March 2004), the number of financial deficits
among PFI trusts has increased. Although it is unclear
why the trusts were in deficit, and therefore further
5 Letter from Greenwich’s finance director to John Austin MP.
PFI and hospitals
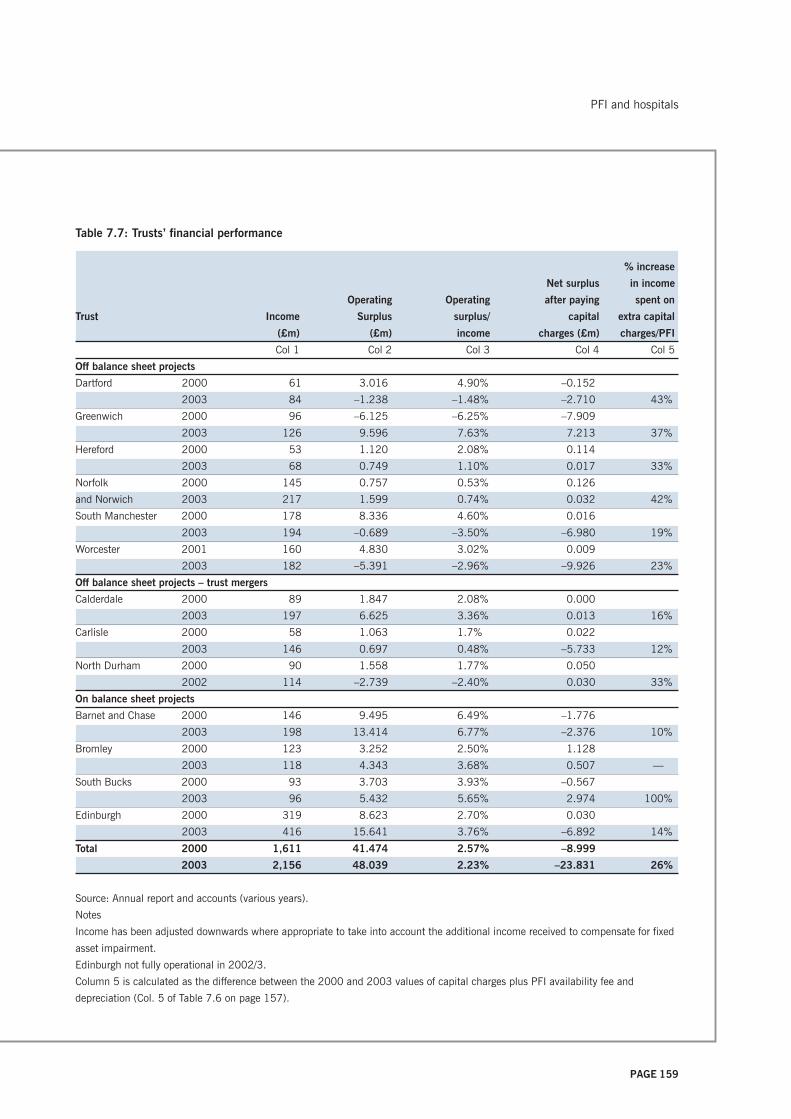
PAGE 159
Table 7.7: Trusts’ financial performance
% increase
Net surplus in income
Operating Operating after paying spent on
Trust Income Surplus surplus/ capital extra capital
(£m) (£m) income charges (£m) charges/PFI
Col 1 Col 2 Col 3 Col 4 Col 5
Off balance sheet projects
Dartford 2000 61 3.016 4.90% –0.152
2003 84 –1.238 –1.48% –2.710 43%
Greenwich 2000 96 –6.125 –6.25% –7.909
2003 126 9.596 7.63% 7.213 37%
Hereford 2000 53 1.120 2.08% 0.114
2003 68 0.749 1.10% 0.017 33%
Norfolk 2000 145 0.757 0.53% 0.126
and Norwich 2003 217 1.599 0.74% 0.032 42%
South Manchester 2000 178 8.336 4.60% 0.016
2003 194 –0.689 –3.50% –6.980 19%
Worcester 2001 160 4.830 3.02% 0.009
2003 182 –5.391 –2.96% –9.926 23%
Off balance sheet projects – trust mergers
Calderdale 2000 89 1.847 2.08% 0.000
2003 197 6.625 3.36% 0.013 16%
Carlisle 2000 58 1.063 1.7% 0.022
2003 146 0.697 0.48% –5.733 12%
North Durham 2000 90 1.558 1.77% 0.050
2002 114 –2.739 –2.40% 0.030 33%
On balance sheet projects
Barnet and Chase 2000 146 9.495 6.49% –1.776
2003 198 13.414 6.77% –2.376 10%
Bromley 2000 123 3.252 2.50% 1.128
2003 118 4.343 3.68% 0.507 —
South Bucks 2000 93 3.703 3.93% –0.567
2003 96 5.432 5.65% 2.974 100%
Edinburgh 2000 319 8.623 2.70% 0.030
2003 416 15.641 3.76% –6.892 14%
Total 2000 1,611 41.474 2.57% –8.999
2003 2,156 48.039 2.23% –23.831 26%
Source: Annual report and accounts (various years).
Notes
Income has been adjusted downwards where appropriate to take into account the additional income received to compensate for fixed
asset impairment.
Edinburgh not fully operational in 2002/3.
Column 5 is calculated as the difference between the 2000 and 2003 values of capital charges plus PFI availability fee and
depreciation (Col. 5 of Table 7.6 on page 157).
PFI and hospitals
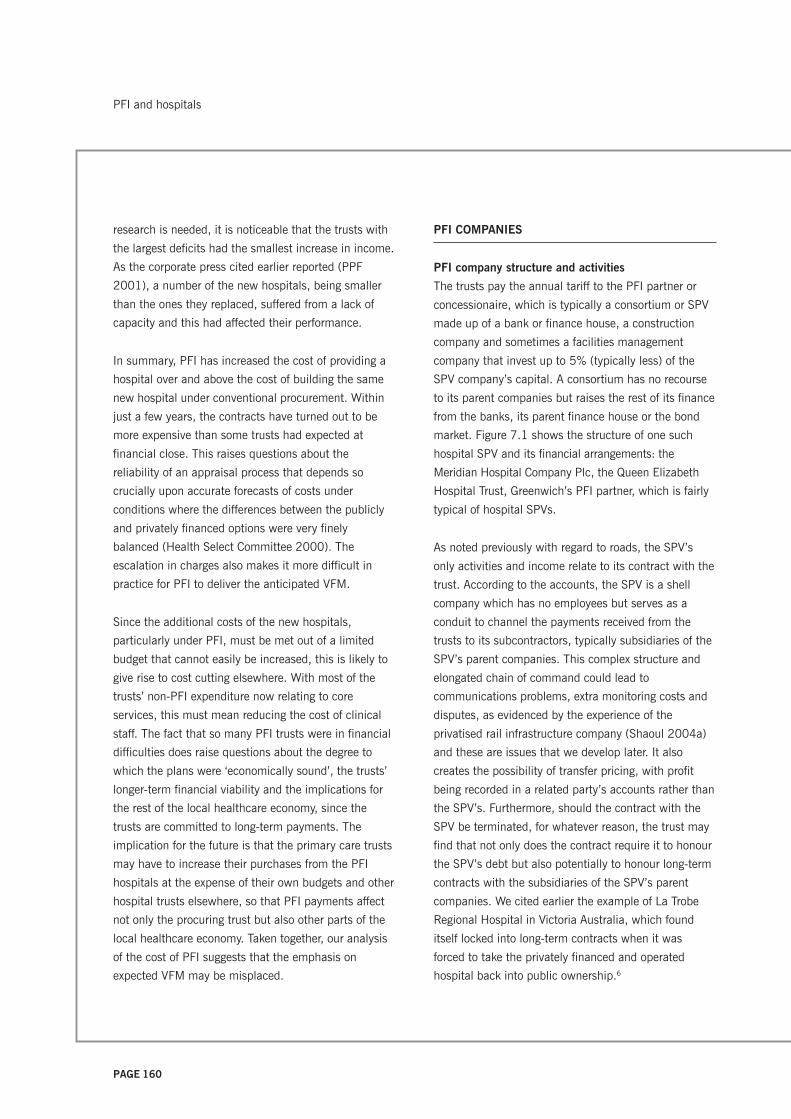
PAGE 160
research is needed, it is noticeable that the trusts with
the largest deficits had the smallest increase in income.
As the corporate press cited earlier reported (PPF
2001), a number of the new hospitals, being smaller
than the ones they replaced, suffered from a lack of
capacity and this had affected their performance.
In summary, PFI has increased the cost of providing a
hospital over and above the cost of building the same
new hospital under conventional procurement. Within
just a few years, the contracts have turned out to be
more expensive than some trusts had expected at
financial close. This raises questions about the
reliability of an appraisal process that depends so
crucially upon accurate forecasts of costs under
conditions where the differences between the publicly
and privately financed options were very finely
balanced (Health Select Committee 2000). The
escalation in charges also makes it more difficult in
practice for PFI to deliver the anticipated VFM.
Since the additional costs of the new hospitals,
particularly under PFI, must be met out of a limited
budget that cannot easily be increased, this is likely to
give rise to cost cutting elsewhere. With most of the
trusts’ non-PFI expenditure now relating to core
services, this must mean reducing the cost of clinical
staff. The fact that so many PFI trusts were in financial
difficulties does raise questions about the degree to
which the plans were ‘economically sound’, the trusts’
longer-term financial viability and the implications for
the rest of the local healthcare economy, since the
trusts are committed to long-term payments. The
implication for the future is that the primary care trusts
may have to increase their purchases from the PFI
hospitals at the expense of their own budgets and other
hospital trusts elsewhere, so that PFI payments affect
not only the procuring trust but also other parts of the
local healthcare economy. Taken together, our analysis
of the cost of PFI suggests that the emphasis on
expected VFM may be misplaced.
PFI COMPANIES
PFI company structure and activities
The trusts pay the annual tariff to the PFI partner or
concessionaire, which is typically a consortium or SPV
made up of a bank or finance house, a construction
company and sometimes a facilities management
company that invest up to 5% (typically less) of the
SPV company’s capital. A consortium has no recourse
to its parent companies but raises the rest of its finance
from the banks, its parent finance house or the bond
market. Figure 7.1 shows the structure of one such
hospital SPV and its financial arrangements: the
Meridian Hospital Company Plc, the Queen Elizabeth
Hospital Trust, Greenwich’s PFI partner, which is fairly
typical of hospital SPVs.
As noted previously with regard to roads, the SPV’s
only activities and income relate to its contract with the
trust. According to the accounts, the SPV is a shell
company which has no employees but serves as a
conduit to channel the payments received from the
trusts to its subcontractors, typically subsidiaries of the
SPV’s parent companies. This complex structure and
elongated chain of command could lead to
communications problems, extra monitoring costs and
disputes, as evidenced by the experience of the
privatised rail infrastructure company (Shaoul 2004a)
and these are issues that we develop later. It also
creates the possibility of transfer pricing, with profit
being recorded in a related party’s accounts rather than
the SPV’s. Furthermore, should the contract with the
SPV be terminated, for whatever reason, the trust may
find that not only does the contract require it to honour
the SPV’s debt but also potentially to honour long-term
contracts with the subsidiaries of the SPV’s parent
companies. We cited earlier the example of La Trobe
Regional Hospital in Victoria Australia, which found
itself locked into long-term contracts when it was
forced to take the privately financed and operated
hospital back into public ownership.6
PFI and hospitals

PAGE 161
Figure 7.1: The anatomy of a PFI hospital project: Meridian Hospital Company Plc
Queen Elizabeth Hospital,
Woolwich
(Book value: £102.887 m)
Greenwich Healthcare
Trust
Meridian Hospital
Company Plc
Meridian Hospital
Company (Holdings)
Ltd
Kvaerner Investments Innisfree Partners Ltd
Purchasing
agreement
healthcare
services
FM contracts
hotel services £4.07 m pa
Two ‘surplus sites’
£16.2 m tariff*
Kvaerner Plc Innisfree PFI fund
Kvaerner Construction
Kvaerner RW Ltd
ISS Mediclean Ltd
Bexley and Greenwich
health authorities
Maintenance contract
£4.986 m pa + £1.572 m pa
* Tariff comprises:
Availability payment = £12.596 m in the first full
contract year
Service fee = £ 5.1 m in 2000/1.
Source: Barclays Capital (1998).
Project finance
£000
Shareholders’ equity 50.0
Shareholders’ subordinated loan stocks 10,089.2
Trust contributions 13,590.0
Bonds 91,200.0
109,929.2
50%50%
Bond issue
PFI and hospitals
Clinical services

PAGE 162
In contrast with roads contracts, there are other
potential sources of income from the PFI hospital
contracts: receipts from the trusts’ visitors and patients,
eg car parking charges, catering sales, patients’
television and telephone charges, retail concessions,
etc. It seems unlikely, however, that these payments
will be recorded in the SPVs’ accounts as opposed to
those of their subcontractors. Similarly, it is unclear to
which party any land sales are made, although it is
known in the case of the Royal Infirmary at Edinburgh
(RIE), for example, that the land was sold to a related
party of the SPV. The chief executive of the RIE said
that the land, from three surplus sites which the
hospital plans showed were about 70 acres (RIE
1997), were sold for £12 m to the construction arm of
one of the SPV’s parent companies, although he
sought, somewhat disingenuously, to give the
impression that the two were not related (Owens
1999). This was about one third of the then-prevailing
rate for residential land in less desirable areas. Thus,
the parent companies may profit from the PFI contract
in several ways: their equity stake in both the SPV and
in subsidiaries that carry out work for the SPV, interest
on any loans to the SPV, income received directly via
the payment mechanism and user charges to the
public, and the proceeds from land sales.
Operating as close companies, the SPVs are not
required to disclose the amount of payments made to
related parties. None of the consortia’s accounts that
we examined disclosed the size of such payments. Only
in the case of Meridian Hospital Company Plc, the
consortium supplying Queen Elizabeth Hospital Trust,
Greenwich, was it possible to establish the network of
relationships and the expected flow of funds, shown in
Figure 7.1 on page 161, since Meridian disclosed this
in its bond offer document (Barclays Capital 1998).
The fact that our most recent accounts for the hospital
SPVs are for financial year 2001/2 (compared with
2002/3 for the trusts) has some significance for this
study. Whereas the roads projects had been in steady
state since 1999, the hospitals were only just coming
on stream and were in different stages of
implementation. This means the SPVs are less
homogeneous as a group, making the interpretation of
the financial data, particularly when aggregated, more
difficult. For example, in the case of tax, those SPVs
with losses for the year, typically during the
construction phase, generally did not record tax relief,
while those SPVs that recorded profits also recorded tax
charges. From the perspective of trying to understand
their financial position, it would be useful to continue
this study for a few more years, by which time all the
SPVs will be in steady state.
Accounting treatment for PFI
Before presenting the SPVs’ income from their PFI
contracts, it is useful to consider the accounting
treatment for PFI transactions, since this determines
what should be classified as income from the trusts
and sheds light on the issue of risk transfer. FRS 5
(ASB) 5 and its related amendment (ASB 1998) on
PFIs require consideration of who bears the risk,
typically the demand risk, in order to establish the
appropriate accounting treatment. The party that bears
the risk will be deemed to have control of the fixed
asset and to show them on their financial statements.
Where the SPV does not bear the demand risk, then it
is deemed to have entered into a financing
arrangement, and is acting as a financier to the trust.
For hospitals, schools and prisons, since the SPV is
unlikely to bear demand risk, the asset becomes a
finance debtor on the SPV’s balance sheet. This means
that the trust’s payment to the SPV must be split
between a capital payment – reducing the SPV’s
finance debtor – an interest payment on that finance
PFI and hospitals
6 Personal communication from the finance director of La
Trobe Regional Hospital.
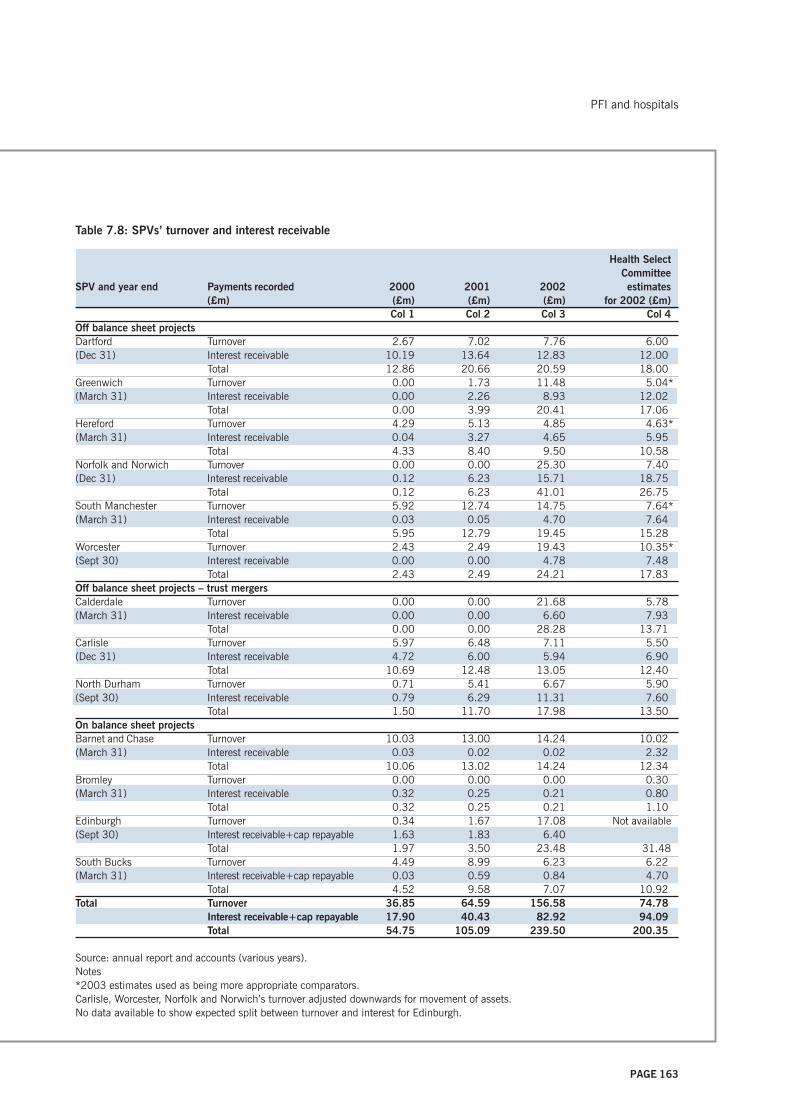
PAGE 163
Table 7.8: SPVs’ turnover and interest receivable
Health SelectCommittee
SPV and year end Payments recorded 2000 2001 2002 estimates(£m) (£m) (£m) (£m) for 2002 (£m)
Col 1 Col 2 Col 3 Col 4Off balance sheet projectsDartford Turnover 2.67 7.02 7.76 6.00(Dec 31) Interest receivable 10.19 13.64 12.83 12.00
Total 12.86 20.66 20.59 18.00Greenwich Turnover 0.00 1.73 11.48 5.04*(March 31) Interest receivable 0.00 2.26 8.93 12.02
Total 0.00 3.99 20.41 17.06Hereford Turnover 4.29 5.13 4.85 4.63*(March 31) Interest receivable 0.04 3.27 4.65 5.95
Total 4.33 8.40 9.50 10.58Norfolk and Norwich Turnover 0.00 0.00 25.30 7.40(Dec 31) Interest receivable 0.12 6.23 15.71 18.75
Total 0.12 6.23 41.01 26.75South Manchester Turnover 5.92 12.74 14.75 7.64*(March 31) Interest receivable 0.03 0.05 4.70 7.64
Total 5.95 12.79 19.45 15.28Worcester Turnover 2.43 2.49 19.43 10.35*(Sept 30) Interest receivable 0.00 0.00 4.78 7.48
Total 2.43 2.49 24.21 17.83Off balance sheet projects – trust mergersCalderdale Turnover 0.00 0.00 21.68 5.78(March 31) Interest receivable 0.00 0.00 6.60 7.93
Total 0.00 0.00 28.28 13.71Carlisle Turnover 5.97 6.48 7.11 5.50(Dec 31) Interest receivable 4.72 6.00 5.94 6.90
Total 10.69 12.48 13.05 12.40North Durham Turnover 0.71 5.41 6.67 5.90(Sept 30) Interest receivable 0.79 6.29 11.31 7.60
Total 1.50 11.70 17.98 13.50On balance sheet projectsBarnet and Chase Turnover 10.03 13.00 14.24 10.02(March 31) Interest receivable 0.03 0.02 0.02 2.32
Total 10.06 13.02 14.24 12.34Bromley Turnover 0.00 0.00 0.00 0.30(March 31) Interest receivable 0.32 0.25 0.21 0.80
Total 0.32 0.25 0.21 1.10Edinburgh Turnover 0.34 1.67 17.08 Not available(Sept 30) Interest receivable+cap repayable 1.63 1.83 6.40
Total 1.97 3.50 23.48 31.48South Bucks Turnover 4.49 8.99 6.23 6.22(March 31) Interest receivable+cap repayable 0.03 0.59 0.84 4.70
Total 4.52 9.58 7.07 10.92Total Turnover 36.85 64.59 156.58 74.78
Interest receivable+cap repayable 17.90 40.43 82.92 94.09Total 54.75 105.09 239.50 200.35
Source: annual report and accounts (various years).Notes*2003 estimates used as being more appropriate comparators.Carlisle, Worcester, Norfolk and Norwich’s turnover adjusted downwards for movement of assets.No data available to show expected split between turnover and interest for Edinburgh.
PFI and hospitals

PAGE 164
debtor, and a payment for services. In practice, because
the schemes are still young, there are almost no capital
payments; the availability fee is recorded as interest
receivable and the service fee is recorded as turnover.
Treating the asset as a finance debtor means that the
SPVs consider that relatively little risk has passed from
the trusts to the private sector. It also means that in the
case of the trusts’ off balance sheet schemes, the
assets are not shown as tangible fixed assets on either
the public or the private sector’s balance sheet, in
contrast to roads, which are on both. Indeed, Catalyst
Healthcare (Worcester) Holdings Ltd (2002) explains
its accounting treatment thus: ‘Applying the guidance
within the Application Note indicates that the project’s
principal agreements transfer substantially all the risks
and rewards of ownership to the Worcestershire Acute
Hospitals NHS Trust’.
This provides an interesting contrast to the
Government’s justification for PFI, particularly as the
trust also treats the project as being off balance sheet.
Such treatment raises concerns as to whether the nine
off balance sheet trusts are recording fairly the
substance of the transaction and hence their future
obligations.
Again, as with the roads projects, we are unable to
answer the substantive question, the degree to which
risk has actually been transferred, as it must be finely
balanced for the different parties to arrive at
asymmetric accounting treatments.
PFI receipts and financial performance
Table 7.8 (see page 163) shows these two sources of
income, as represented by turnover and interest
receivable in their accounts, for each of the SPVs for
the years 2000 to 2002, the latest year for which their
accounts were available. Thus, without taking interest
receivable into account, the use of the turnover figure
alone would seriously underestimate the amount of
income received. Generally, income rose as most of the
hospitals became operational, rising from £55 m in
2000 to £240 m in 2002. The last column of Table
7.8 shows the PFI tariff as set out in the trusts’ full
business cases (Health Select Committee 2000) for
2002 for all the trusts except the Royal Infirmary at
Edinburgh, for which such detailed information was not
available. In a few cases, we have used the expected
payments in 2003 as being more appropriate. A
comparison of the bottom line of columns 3 and 4 of
Table 7.8 shows that actual income was greater than
expected. In seven out of 13 cases, their income for
2002 was substantially greater than the business cases
had expected, although in a few cases their income
was less.
Table 7.9 compares the accounts of the trusts and
SPVs. The final two rows of the table show that in
every year, the trusts appear to be paying less than the
SPVs record as having received, which is in contrast to
roads where the Highways Agency appeared to be
paying more than the SPVs received. For example, in
2002, the trusts were paying a total of £160.7 m while
the SPVs were receiving £239.5 m. The difference may
be partly because they took responsibility for the soft
services before construction was complete and partly
because of timing differences, as in six cases the SPV’s
year end was not the same as the trust’s. Although in those
cases it may be more appropriate to compare the SPV’s
income in any given year with the trust’s payment in
the following year, there are still some differences that
we are not able to explain. These differences
notwithstanding, under UK GAAP, symmetry between
the two sets of accounts is not required because both
entities have to make their own decisions.
Table 7.10 (see page167) shows their aggregate
financial performance, including their turnover,
interest receivable, total income, profits before
interest, surplus, and tax and profit margins over the
life of the contracts thus far. Turnover rose from £3 m
in 1998 to £157 m in 2002 as the projects became
operational, transforming a deficit of £3 m in 1998
PFI and hospitals

PAGE 165
Table 7.9: Comparison of trusts’ payments and SPVs’ receipts from PFI
Hospital 1999/2000 2000/1 2001/2 2002/3(£m) (£m) (£m) (£m)Col 1 Col 2 Col 3 Col 4
Dartford 0.00 11.67 17.35 16.05SPV (Dec 31) 12.86 20.66 20.59Greenwich 0.00 0.00 18.11 23.17SPV (Mar 31) 0.00 6.20 20.41Hereford 0.00 5.99 10.75SPV (Mar 31) 4.33 8.40 9.50Norfolk and Norwich 0.00 0.00 20.73 38.55SPV (Dec 31) 0.12 6.23 41.01South Manchester 6.90 13.50 19.79 20.47SPV (Mar 31) 5.95 12.79 19.45Worcester 0.00 2.46 5.20 18.63SPV (Sep 30) 2.43 2.49 24.21
Off balance sheet projects – trust mergersCalderdale 0.00 0.00 15.23 17.10SPV (Mar 31) 0.00 0.00 28.28Carlisle 0.00 11.54 11.86 12.78SPV (Dec 31) 10.69 12.48 13.05North Durham 0.00 0.00 11.06 13.74SPV (Sep 30) 1.50 11.70 17.98
On balance sheet projectsBarnet and Chase N/A 7.56 12.26 14.83SPV (Mar 31) 10.06 13.02 14.26Bromley 0.00 3.27 3.08 5.61SPV (Mar 31) 0.32 0.25 0.21Edinburgh 0.00 0.00 10.31 27.80SPV (Sep 30) 1.97 3.50 23.48South Bucks 0.00 8.63 9.73 9.90SPV (Mar 31) 4.52 9.58 7.07
Total trusts 6.90 58.63 160.70 229.95SPVs 54.75 107.30 239.50
Source: Annual reports and accounts (various years).NotesN/A = Not availableSPV year end is same as trust’s unless stated.Final column shows payments expected for 2003/4 in 2002/3 accounts.
PFI and hospitals

PAGE 166
into an operating profit of £27 m in 2002, by which
time the profit margin was 13%. Since total income
from the trusts includes interest receivable as well as
turnover, however, a more useful way of understanding
the SPVs’ costs and financial performance is to
examine their total income and operating surplus.
Total income rose from £11 m in 1998 to £240 m in
2002. The surplus before interest payable and tax
rose from £5 m in 1998 to £104 m in 2002.
Although their surplus to income ratio varied from
year to year, it was 43% in 2002, the average for the
whole period. Thus, it is apparent that while the
trusts’ position has deteriorated, that of the private
sector has improved.
Since the SPVs have no employees, almost all their
operating expenses, except depreciation and a
management fee to their parent companies, represent
payments to their subcontractors, often related parties.
This rose from £6 m in 1998 to £136 m in 2002. This
means that in 2002 when most of the projects became
operational, just over half the income (57%) received
from the trusts was paid to their subcontractors,
typically subsidiaries of their parent companies.
The cost of private finance
A surplus of income over expenditure is necessary to
cover corporation tax on profits and the cost of capital,
made up of interest payments on debt and returns on
shareholders’ funds to the parent companies.
We consider first their tax position. The SPVs’
corporation tax payable increased over the period from
zero in 1998 to £11 m in 2002. This represented an
effective corporation tax rate of about 41% on £21 m
in 2002 and 61% on £28 m of operating profits for the
whole period, compared with the current tax rate of
30%. On a technical note, since there are also some
non-trading activities, the post-tax profits do not
necessarily equate to operating profit before interest
and tax, less interest and tax, and in any case are non-
material from the perspective of this particular analysis.
This apparent high rate of taxation is largely the result
of aggregating SPVs whose construction is at different
stages of completion when these accounts were
prepared, and combining profit-making and loss-
making enterprises. SPVs with losses for the year,
typically during the construction phase, generally did
not record tax relief, while those SPVs that recorded
profits also recorded tax charges. In the terms of the
calculations, therefore, the figure for tax used as the
numerator includes only tax charges while the
denominator includes profits less losses. Thus
compared with roads, it is still too early to know what
their real rate of tax is because the SPVs have not
reached steady state, although we can expect the
effective rate of tax to decline. It does not, therefore,
undermine our earlier point in relation to roads, where
the SPVs were paying a low effective rate that
challenged the Treasury’s assumption of a 22% tax rate
for calculating the PSC (HM Treasury 2003c).
We turn next to the cost of capital: debt and equity.
Table 7.10 shows that debt had risen from £197 m in
1998 to £1,212 m in 2002, compared with the
£1,376 m capital costs shown in Table 7.4 (see page
151), although this is likely to rise as construction is
completed. Total interest payable on their loans,
including capitalised net interest,7 rose from £11 m in
1998 to £96 m in 2002, equivalent to an 8% interest
rate on their long-term debt, several points higher than
the cost of Treasury stock, currently about 4.5%.
With respect to equity finance, Table 7.10 on page 167
shows that after two years of losses, the companies
were reporting post-tax profits of £9 m in 2000 rising
to £27 m in 2002. The surplus that remains after
servicing debt is available, in principle at least, as
PFI and hospitals
7 Companies have capitalised interest during the construction
phase of the projects as permitted by accounting regulations.
This has declined as the buildings come on stream.

PAGE 167
Table 7.10: Aggregate financial performance of 13 SPVs
(£m) 1998 1999 2000 2001 2002 TotalTurnover 3 11 37 67 157 274Interest receivable 8 9 18 40 83 158Total income from trusts 11 20 55 107 240 432
Payments to subcontractors 6 14 36 54 136 246Operating profitbefore interest and tax –3 –3 1 12 21 28Operating surplusincluding interest receivable 5 6 19 52 104 186
Interest payable 8 11 22 39 77 157Capitalised net interest 3 20 40 49 19 131Total interest payable 11 31 62 88 96 288
Operating profitafter interest payable –3 –5 –3 13 27 28
Tax payable 0 1 1 4 11 17Profit after tax –1 –1 9 25 27 59Dividends payable 0 1 0 0 0 1
Debt 197 631 945 1,158 1,212Shareholders funds –2 –6 8 5 26Total capital 195 625 953 1,163 1,238
Key ratiosProfit/turnover –118% –23% 2% 17% 13% 10%Operating surplus/total income 45% 30% 35% 49% 43% 43%Total interest rate on debt 6% 5% 7% 8% 8%Effective tax rate 0% –20% –33% 31% 41% 61%Gearing ratio 100% 100% 100% 100% 100%Post-tax profit/shareholders funds — — 113% 500% 104%Total effective cost of capital 5% 5% 7% 10% 10%
Source: Annual reports and accounts (various years).NotesPayments to subcontractors = total income less operating surplus, management fee and depreciation.Effective tax rate = tax payable/operating profit after interest (calculated as operating surplus including interestreceivable less interest payable).Gearing ratio = debt/(debt + shareholders’ funds).Effective total cost of capital = (total interest payable plus post-tax profit)/(long-term debt and shareholders' funds).Profit after tax is affected by other income.
PFI and hospitals

PAGE 168
risk premium is slightly more than five percentage
points (the difference between the effective cost of
capital and the cost of sovereign debt). This translates
into £62 m a year cost for the risk premium and £1.86
billion over 30 years, if this were to continue. There is,
however, no yardstick against which to evaluate
whether this cost constitutes VFM.
Returning to the issue of the SPVs’ rate of return on
shareholders’ funds, the only evidence we have against
which to benchmark this is that given on ‘normal’ post-
tax return on PFI projects by the National Audit Office
to the PAC, citing the Office of Government Commerce
(PAC 2003d, Figure 2). The normal rate of return
(post-tax) on the construction companies’ investments
(not defined) in PFI companies was 8–15% for 2001.
Thus our data very clearly show that the actual returns
on shareholders’ funds from these projects are higher
than ‘normal’.
Although the hospital SPVs’ financial models,
submitted as part of the tendering process, are not in
the public domain, their bond offer documents to the
capital markets provide a means of comparing their
actual performance with expectations. Meridian, the
private sector partner to Greenwich Hospital, was one
of the few hospital SPVs to issue a bond that was not
insurance wrapped and thus showed their expected
cash flows from the project (Barclays Capital 1998). It
noted that investors were partly protected by a ‘letter of
support’ from the Health Secretary, which provided
bondholders with ‘additional comfort’ (Barclays Capital
1998) and the bond was rated a BBB+, two notches
above the investment grade threshold.
From an original value of £100 m, the 30-year bond
yielded £91 m. In other words, the fees associated
with launching the bond cost £9 m (Barclays Capital
1998). Table 7.11 (see page 170) shows the expected
revenues and costs based on 3.5% inflation per year.
Of the £20 m annual fee income from Greenwich,
Meridian expected that after paying operating costs,
dividends to be paid to the parent companies.
Dividends were paid once in 1999. After negative
shareholders’ funds in the early years due to losses,
shareholders’ funds, which include both the original
equity stake and accumulated profits, rose to £26 m in
2002. This means that after negative returns in the
early years, they earned a post-tax return of 113% in
2000, 500% in 2001 and 104% in 2002.
The cost of debt and equity therefore provides a way of
understanding and estimating the SPVs’ total cost of
capital and hence the cost to the public purse of private
finance and the price paid for risk transfer – the risk
premium. That is, it serves as a proxy for the trusts’
cost of finance under PFI. This gives figures of total
interest payable in 2002 of £96 m plus post-tax profits
of £27 m, totalling £123 m, the public sector’s cost of
capital under PFI, equivalent to 51% of income
received from the trusts. The total effective cost of
capital employed (the bottom line of Table 7.10 on
page 167) rose from 5% in 1998 to 10% in 2002. If
the experience of DBFO in roads is relevant, this will
probably increase. That said, however, it may not rise
as much as in roads (11% cost of capital and 68%
surplus on income), in part at least because of the need
for higher maintenance expenditure and because the
level of risk, including demand risk (the justification for
higher profit rates, although there is in fact little
downside risk as we have shown) is higher in roads.
Two further points should be made. First, in the three
most recent years when the schemes were largely
operational, this is higher than the average return on
capital employed implicit in the Government’s 6%
capital charging regime and the use of its 6% test
discount rate used in the financial appraisal of the
public and private finance options and even higher than
the new rate of 3.5%. Secondly, since the difference
between the actual cost of capital and the cost of
sovereign debt is attributable to the cost of risk borne
by the project companies (NAO 1999a), this must
represent the cost of risk transfer and suggests that the
PFI and hospitals

PAGE 169
there would be £10–11 m a year to support debt
servicing, dividends and future growth. Debt servicing
was scheduled to rise annually, taking an increasing
proportion of the free cash flow. Nevertheless, the
project would be able to generate a post-tax profit of
£273,000 in 2007 for the first time and, potentially at
least, pay dividends to the parent companies. This was
set to increase to £807,000 the following year and to
continue rising as debt servicing declined (Barclays
Capital 1998).
The interest on the 30-year bond, at 4.19%, is similar
to Treasury stock (then about 4%) but lower than the
6% discount rate used in the NPC analysis that was
assumed to be the marginal opportunity cost of capital.
Debt servicing, including the cost of the bond and the
shareholders’ subordinated loan stock, would account
for more than 30% of revenues. The free cash available
for dividends and other forms of investment was
expected to be about 12–15% of revenue, or about half
that for debt finance, despite the fact that equity capital
was £100,000, although the accounting profit
necessarily will be lower than the free cash. Post-tax
profit was estimated at £273,000 in 2007, rising to
£2.3 m in 2011, £6.9 m in 2020, and
£13.3 m in 2029. The Meridian analysis is important
because the bond, at BBB+, is only a few points above
investment grade, and Standard and Poor’s (2003)
believes that this is representative of the underlying risk
for all PFI projects, nearly all of which are insurance
wrapped and rated as AAA. Thus in 2003, 46% of
Meridian’s estimated income represented financing and
other charges that would not have been incurred under
conventional procurement, a sum equal to at least 7%
of Greenwich hospital’s actual annual income in that
year, raising questions about the implications for
affordability.
In the event, as Table 7.12 (see page 171) shows,
Meridian’s total income rose from nothing to £3.99 m
in 2001 to £20.41 m in 2002. After paying its
subcontractors about £9 m a year once the hospital
was fully operational, considerably more than the
estimated £7.5 m for 2002, its operating surplus rose
to £11.18 m, compared with an expected £10 m, in
2002. In 2002, it made a post-tax profit of £2.47 m,
ie five years earlier and ten times the amount expected,
and followed in 2003 by a small post-tax loss. In every
year, the income, costs and the operating surplus were
higher than expected. As the trust explained,8 it is likely
that, since the trust’s payment had increased in line
with volume, the SPV had arranged a fixed-price
contract with its subcontractor and was thus able to
keep the additional revenue from the trust without
passing it on to the facilities management company. In
other words, the SPV has gained at the expense of its
subcontractors. This is important because in the
absence of information showing how much the SPVs
are paying their subcontractors for each of the various
services, the SPVs, after market testing in year five,
could increase their charges to the trusts because of
increases in their subcontractors’ costs, thereby
maintaining their own profit margins.
Although it is possible that the SPVs have gained at the
expense of some of their subcontractors, the reverse is
also possible. Indeed, this analysis of the SPVs’
finances as a proxy for the trusts’ cost of using private
finance tells only part of the story. As Figure 7.1 shows
(see page 161), the SPVs typically subcontract all the
facilities management, construction and maintenance
work to subsidiaries of their parent companies. As close
companies, there is no requirement for the SPVs to
disclose the value of such transactions and not one of
the SPVs in our study chose to do so. Even then, it is
possible to make a meaningful analysis of the
profitability of such a contract only if the company
concerned is servicing only one project. As a result we
were unable to examine the other potential sources of
income for the SPVs’ parent companies, including
8 Interview with the finance director of the trust.
PFI and hospitals
PAGE 170
Table 7.11: Meridian’s projected revenues from Greenwich Trust
March March March March March March
2002 2003 2004 2005 2006 2007
£000 £000 £000 £000 £000 £000
Cash flows
Availability fee 12,169 12,596 13,036 13,492 13,964 14,454
Service fee 5,125 6,020 6,231 6,449 6,674 7,169
Other income 291 301 312 323 334 346
Total revenue 17,585 18,917 19,579 20,264 20,972 21,969
Less operating andmaintenance costs 7,546 8,677 9,087 9,502 9,611 10,250
Operating cashflow 10,039 10,240 10,492 10,762 11,361 11,718
Net interest, fees andrepayments 4,664 5,756 6,106 6,302 7,706 8,063
Net cashflow 5,375 4,484 4,386 4,460 3,655 3,655
Profits
Operating profit 6,967 7,266 7,388 7,690 8,520 9,159
Net profit after tax –2,780 –1,077 –1,233 –791 –203 273
Debt 97 99 100 101 100 100
Shareholders’ funds 6 1 –3 –6 –6 –6
Source: Meridian Hospital Company Plc Offering Circular for Bond Issue (Barclays Capital 1998).
Note: Costs and revenues assume 3.5% inflation per year.
PFI and hospitals

PAGE 171
Table 7.12: Meridian’s income from Greenwich Trust
(£m) 1999 2000 2001 2002 2003
Turnover 1.73 11.48 12.17
Interest receivable 2.26 8.93 N/A
Total income 3.99 20.41 N/A
Expected revenue (Bond IPO) 2.30 17.59 18.92
Payments to subcontractors 0.25 9.23 9.94
Expected payments to subcontractors 7,546.00 8,677.00
Operating profit before interest and tax 0.31 2.25 2.23
Expected operating profit (Bond IPO) 0.06 0.14 1.75 6.97 7.27
Operating surplus 3.74 11.18 N/A
Expected surplus 10.04 10.24
Interest receivable 2.26 8.93 Not shown
Capitalised net interest 0.98 3.10 6.00 0.00
Interest payable 1.85 8.11 10.74
Total interest payable 0.98 3.10 7.85 8.11
Tax payable 0.00 0.00 0.19 0.59 0.40
Profit after tax 0.53 2.47 –0.13
Dividends payable 0.00 0.00 0.00
Debt 88.00 100.00 115.00 98.00 95.00
Shareholders’ funds 0.05 0.05 0.05 3.05 2.92
Total Capital 88.05 100.05 102.05 101.05 97.92
Key ratios
Profit/turnover 18% 20% 18%
Surplus/income 94% 55% N/A
Effective tax rate 61% 26% 18%
Interest rate on debt 1% 3% 7% 8% 11%
Gearing ratio 100% 100% 100% 97% 97%
Post-tax profit/shareholders’ funds 1060% 81% -4%
Total effective cost of capital 5% 5% 8% 8% 11%
Sources
Annual report and accounts (1999–2002).
FAME database for 2003.
Meridian Hospital Company Offering Circular for Bond Issue (Barclays Capital 1998) that assumes 3.5% inflation in costs and
revenues per year.
Notes
Payments to subcontractors = total income less operating surplus, management fee and depreciation.
Effective tax rate = tax payable/profit before interest and tax.
Gearing ratio = debt/(debt + shareholders’ funds).
Effective total cost of capital = (operating profit less tax)/(long-term debt and shareholders' funds).
PFI and hospitals

PAGE 172
refinancing, land sales and gains from the disposal of
their equity stakes in the SPVs, or to discover the value
of direct user charges for catering services, car parking,
and patients’ telephones and televisions to the
subcontractors. It is worth noting in this context that
Catalyst, the Calderdale Hospital SPV, the first hospital
consortium to seek refinancing, made a gain of £12 m
(16% on a £76 m hospital), of which it awarded £3.6 m
to the trust (PPF 2001). This provides evidence that
construction risk is indeed the main source of risk and
that the trust has paid dearly to get the hospital built to
time and budget.
As well as the cost to the trusts, it is important to
consider the cost to the public purse as a whole. Under
conventional public sector procurement and the capital
charging regime, the cost of capital is in effect recycled
back into the healthcare economy. Under private
finance, a sum equivalent to the PFI availability
payments to the SPVs ‘leaks’ out of the healthcare
budget, requiring additional inputs to the healthcare
budget at Treasury level every year. (Although we
estimated earlier that the cost of the new hospitals
added an extra £139 m to the trusts’ costs in 2003
compared with the cost of the old hospitals in 2000
and that that took 26% of the increase in income over
the three years since 2000, that was a different
calculation and underestimates the annual cost to the
Exchequer.) In the context of the capital charging regime,
HM Treasury will have to find a sum equivalent to the
trusts’ annual payments to the SPVs for the cost of
capital (ie the availability fee) every year if the hospitals
are to deliver the same level of service. Although at
financial close the trusts had expected that this would
cost £125 m in 2003 (bottom of column 5 in Table
7.4 on page 151), PFI payments have risen as we have
shown and the exact amount due to any increase in the
availability fee is unknown since the trusts do not show
the split between the capital and service elements of
their PFI payments. At the very least, therefore, the
Treasury must input an extra £125 m a year (the
expected availability fee) just to keep the system in
steady state. Thus the net result is that the cost of PFI
has an impact at both trust and Treasury levels.
The next step is to consider the implications of all this
for using the private sector as a financial intermediary.
The £123 m cost of capital attributable to the interest
payments on debt and returns to shareholders after tax
payable, equivalent to 51% of the income received
from the trusts, plus the profits of the parent
companies’ construction, facilities management and
finance subsidiaries, profits on refinancing, etc, means
that less than half the payment made by the trusts
actually goes on the construction, operation and
maintenance of the hospitals. However, we were unable
to identify these additional costs of private finance. It
should be recalled, moreover, that since these PFI
hospitals are up to 30% smaller than the ones they
replace, in part because of the high cost of private
finance (Gaffney et al. 1999a), their high cost is not
the result of greater capacity. At the very least, this
difference between the public and private cost of
capital constitutes a drain on public resources that
could have been spent on front line service.
In summary, this raises questions, first, about VFM
under PFI. At least in principle it should be possible to
assess the actual VFM by comparing the costs and
SPVs’ returns against the financial models submitted as
part of the bidding process. However, the bidders’
financial models are not in the public domain. The
results of such a comparison have not been published,
neither is it known whether the NHS has indeed carried
out such an analysis. A second, interrelated and more
concrete point that our analysis raises relates to
affordability, the implications for the rest of NHS
expenditure, and the extent to which the use of private
finance is a good use of the taxpayers’ money. At the
very least, the experience of PFI does not sit
comfortably with the general aim of controlling public
expenditure.
PFI and hospitals

PAGE 173
In summary, our analysis of the literature relating to PFI
in hospitals has shown that:
• there has been little empirical financial research into
the cost and effectiveness of private finance in
hospitals after implementation
• there is a lack of consistent and useful data about
the extent of private finance in health, making it
difficult to analyse the use of private finance and
estimate the exact extent of the liabilities being
incurred by various parts of the public sector
• more information appears to be made available to
the capital markets than to the public at large,
despite their interests as both taxpayers and users
• although the NAO is generally satisfied with the
construction phase of the hospital projects, this
conflicts with professional and press reports of
problems with design and construction in a few
hospitals
• as yet there is little evidence about the operational
phase of PFI contracts
• the National Audit Office does not as yet appear to
have exercised its ‘right to roam’ through the books
of the complex web of PFI hospital companies to
ascertain the full cost to the public of the use of
private finance.
Our financial analysis was complicated by the fact that,
first, it was carried out at a very early stage in the
operation of PFI in hospitals, before they were in steady
state, and secondly, numerous other changes have
taken place making it difficult to isolate the impact of
PFI. Despite these limitations, this study of the trusts
has shown that:
• the trusts’ financial reporting of their PFI contracts is
limited and opaque
• despite annual payments of about £205 m by the
hospital trusts, there is little information in the
public domain
• given the cost of risk transfer, largely for construction
risk, the trusts paid a high premium to ensure that
the hospitals were built to budget and on time and
much more than the average cost overruns in the
1990s
• nine of the trusts report off balance sheet schemes,
as the Treasury had originally intended, implying
that most of the ownership risks have been
transferred to their private sector partners, but as
none of the corresponding SPVs reports its hospitals
on balance sheet either, this creates uncertainty as
to who has ultimate responsibility
• within just a few years of financial close, some of
the trusts have reported significantly higher
payments than expected at financial close without
any explanation; this raises questions about the
reliability and validity of the VFM case that was
used to justify the decision to use private finance
• from 2003, PFI has added about £45 m a year to
the cost of new hospitals, smaller than those they
replaced, over and above the cost of such hospitals
when conventionally financed; this £45 m is an
underestimate since the capital value of the new
hospitals incorporates an additional amount for
private finance (25% of the total value)
• the extra capital cost of the new hospitals has taken
26% of the increase in the trusts’ budget in 2003,
compared with 2000
• six of the PFI hospital trusts are in deficit, which has
implications far beyond the trusts for the provision of
and access to healthcare. Although it is impossible
to attribute causality, the percentage of trusts in
deficit is higher than the national average.
PFI and hospitals

PAGE 174
Our analysis of the private sector partners has shown
that:
• the SPVs operate in a complex and opaque web of
contracting that increases the costs and makes it
impossible to assess their returns and thus the cost
of private finance to the public purse
• there is a lack of disclosure of related party
transactions
• about half the income received from the trusts is
paid to the SPVs’ subcontractors (typically sister
companies) for construction, maintenance and services
• subcontracting in this way makes it difficult to
isolate the cost of services in PFI contracts since
subcontractors are likely to have multiple sources of
income, putting the public sector at a disadvantage
when market testing some years into the contract
• the SPVs are paying an effective cost of capital of
10%, about five points higher than the public
sector’s cost of borrowing
• the SPVs’ high effective cost of capital means that
PFI contracts are expensive and considerably more
so than the cost of conventional procurement
• the SPVs made a post-tax return on shareholders’
funds of more than 100% in each of the three years
2000 to 2002; this is higher than elsewhere in the
industry and in the case of Meridian was more than
expected
• this financial analysis is likely to underestimate the
total returns to the parent companies because the
SPVs subcontract to their sister companies and
some of these subcontractors benefit from additional
income via user charges, eg for car parks, canteen
charges, etc
• £123 m or 51% of the income received from the
trusts relates to the cost of capital
• since the SPVs are paying five percentage points
above Treasury stock for the cost of capital, this
reflects the cost of risk transfer or the risk premium,
approximately £62 m in 2002; it is unclear whether
this is money well spent
• the cost of PFI creates affordability problems not
only for the trusts and potentially for the local
healthcare economy, but also for the Treasury since
the PFI payments for the hospitals ‘leak’ out of the
system of capital charges that are recycled back to
the Treasury; a conservative estimate suggests that
at least £125 m a year has to be put into the NHS
budget to keep it in steady state in relation to the
capital charging regime
• this analysis is consistent with the research literature
that suggests that the emphasis in appraisal on VFM
at the expense of affordability is misplaced.
PFI and hospitals
PAGE 175
There are some huge holes in [the concessionagreement] – things that weren't covered –some are very silly, but the concessionaireswork to the contract. So, you know, we forgotto put in marmalade, so patients don't getmarmalade for breakfast, so we have to payextra for that. Same with litter, we have to payextra for litter, because nobody actuallystated litter collection.
8. An NHS trust case
Background to the trust and its PFI 177
The achievement of original project objectives 179
Value for money 181
Planning of services management prior to PFI implementation 184
Organisational structures 185
Monitoring processes 188
Refinancing 195
Risk transfer 196
Affordability 199
Discussion and conclusion 202

PAGE 176
An NHS trust case

PAGE 177
In this chapter we present our NHS trust case. As with
roads, the private sector had been building hospitals for
many years, and in general terms our initial
investigations showed that the perception was that the
PFI’s hard objectives, in terms of constructing a
hospital on time and close to budget had been met.
Therefore, as with roads our focus is on those aspects
of the project that differ between PFI and traditional
procurement. As in Chapter 6, we examine here the
original project objectives, focusing again on the softer
elements. In particular, our discussions with
interviewees focus on the monitoring and payment
approval systems associated with the provision of
services. Thus, our focus is on the post-implementation
phase of the PFI contract.
Our material is based on the perceptions and
experiences of interviewees, who include trust and
private sector employees. It is important to recognise
that our interviews were conducted with people
currently associated with the project, many of whom
have seen a change in their role following
implementation. These are not necessarily the same
people as those who negotiated the contract, because
only a relatively small number of people were closely
involved with negotiations and there has been
considerable staff turnover, a common feature of
hospital trust PFI projects. Consequently, the prior
expectations of many of the people we spoke to were
formed without any close association or familiarity with
the contracting process, and in the early stages of the
post-implementation phase many trust employees
lacked detailed knowledge of the concession
agreement. Similarly, there have been staff changes
and new appointments made within the private sector
organisations. All the information has been modified to
preserve anonymity. All our interviewees are referred to
in the masculine gender to protect the confidentiality of
individuals and the trust and for reasons of commercial
and clinical sensitivity.
The rest of the chapter is organised as follows. In the
next section we provide background information about
the PFI and the organisational structures of the trust.
We then examine interviewee perceptions about the
post-implementation phase of this PFI by focusing our
questions and our presentation here on the four criteria
identified in our review of the literature on PFI:
• achievement of original objectives
• VFM
• risk transfer, and
• affordability.
As we noted in Chapter 6, the questions asked and
responses given were driven by the researchers’ review
of the academic literature, although interviewees were
offered the opportunity to provide any additional
information they wished. Again, our presentation
examines only some aspects of a complex project, and
we have quoted directly from the interviewees in order
to present the information given to us accurately. The
concerns we raise come from our interpretation of that
information, nevertheless, we should be clear that
although opinions given to us were more mixed than
was the case at the Highways Agency, in essence many
interviewees were certainly content that this PFI
provided new facilities that operated much as intended.
Although VFM, risk transfer and affordability are
interrelated aspects of PFI, we examine each of these
in a separate section. The chapter ends with a
summary and conclusions.
BACKGROUND TO THE TRUST AND ITS PFI
This project started life in the 1990s as a traditionally
funded scheme to amalgamate and rationalise hospital
services on two existing sites into one. During this
process, however, it was suggested that the scheme
should become a PFI project. When the incoming
An NHS trust case
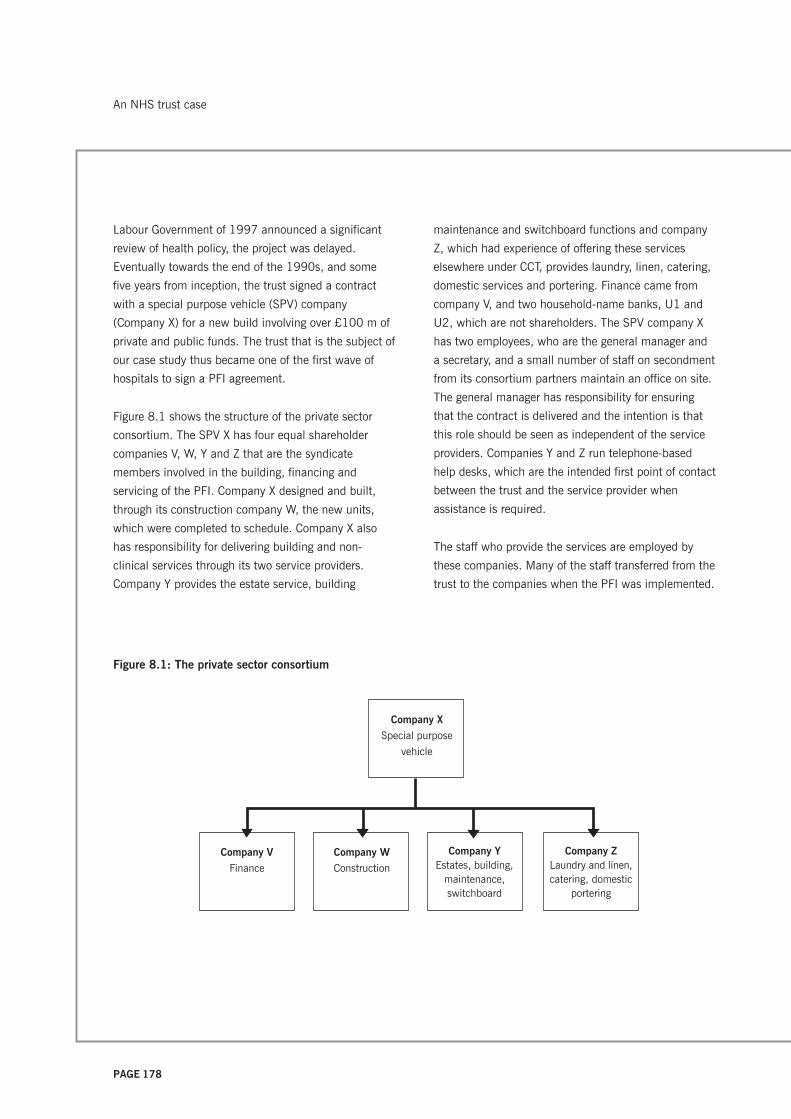
PAGE 178
Labour Government of 1997 announced a significant
review of health policy, the project was delayed.
Eventually towards the end of the 1990s, and some
five years from inception, the trust signed a contract
with a special purpose vehicle (SPV) company
(Company X) for a new build involving over £100 m of
private and public funds. The trust that is the subject of
our case study thus became one of the first wave of
hospitals to sign a PFI agreement.
Figure 8.1 shows the structure of the private sector
consortium. The SPV X has four equal shareholder
companies V, W, Y and Z that are the syndicate
members involved in the building, financing and
servicing of the PFI. Company X designed and built,
through its construction company W, the new units,
which were completed to schedule. Company X also
has responsibility for delivering building and non-
clinical services through its two service providers.
Company Y provides the estate service, building
maintenance and switchboard functions and company
Z, which had experience of offering these services
elsewhere under CCT, provides laundry, linen, catering,
domestic services and portering. Finance came from
company V, and two household-name banks, U1 and
U2, which are not shareholders. The SPV company X
has two employees, who are the general manager and
a secretary, and a small number of staff on secondment
from its consortium partners maintain an office on site.
The general manager has responsibility for ensuring
that the contract is delivered and the intention is that
this role should be seen as independent of the service
providers. Companies Y and Z run telephone-based
help desks, which are the intended first point of contact
between the trust and the service provider when
assistance is required.
The staff who provide the services are employed by
these companies. Many of the staff transferred from the
trust to the companies when the PFI was implemented.
Figure 8.1: The private sector consortium
Company W
Construction
Company V
Finance
Company YEstates, building,
maintenance,switchboard
Company ZLaundry and linen,catering, domestic
portering
Company X
Special purpose
vehicle
An NHS trust case
PAGE 179
Although, since then, there has been a considerable
turnover in areas such as domestic services, in others
such as portering many of these employees are still
covered by Transfer of Undertakings (Protection of
Employment) Regulations (TUPE).
This trust is a large teaching hospital with geographical
dispersion of its facilities, many of which were old, so
there was an urgent need for new buildings and
rationalisation, compelling reasons why the project
should receive approval to proceed. The trust had no
previous experience of outsourcing services under CCT,
which perhaps makes it an unusual choice for the
location of a first-wave project. Its organisational
structure reflects its size and it is currently managed in
six divisions, one of which is the corporate division,
described as holding ‘very big budgets’. The corporate
division has responsibility for therapy services, recently
transferred from the clinical support area, as well as a
range of management functions, including human
resources, finance, and estates and facilities. The
estates and facilities division holds the budget for the
whole of the PFI tariff and it provides the monitoring
managers who monitor the work of the PFI contractors.
The new director of estates, who took up his role during
our research, is responsible for site strategy and
planning, PFI, facilities and ‘the things that go with
having land as opposed to having a team of workmen
doing repairs’. This post was described as having been
reinstated after the trust realised that it had downsized
too much following the initial implementation of PFI.
The trust intends to integrate the management of areas
that had previously been the responsibility of three
separate managers who ‘were all working a bit with
their own agenda’. These areas included capital
projects, which are the responsibility of a project
manager, estates strategy, land, incineration, health
and safety, backlog maintenance, facilities and hotel
services, residential accommodation, security,
transport, car parking and anything on site ‘that was a
problem really’.
The trust has recently seen a number of changes in its
organisational structures and although these have led
to some frustration among administrators, the view
from within the finance area was that, as a
consequence of these changes, ‘hopefully we’ll get a bit
better communication between the parties in the PFI’
and ‘it’s in some ways indicative of the fact that the
trust needs better management of PFI.’
THE ACHIEVEMENT OF ORIGINAL PROJECT
OBJECTIVES
One important way of assessing the outcomes of a
project is to determine whether it has met its original
objectives. The trust was involved in planning this
project under both traditional procurement and PFI over
a long period. During that time various trust staff
gained perceptions about what was to be delivered.
Ultimately, however, not all these expectations formed
part of the PFI contract. A member of the finance team
indicated that the trust had probably failed to
communicate adequately the final objectives of the PFI
to managers who were not closely involved in the
contract negotiations, so that different perceptions
about objectives were possible. The contract involved a
number of building-related objectives as well as a
number of other business case objectives, described as
‘soft objectives,’ as follows:
• two new units for clinical care
• rationalisation to reduce duplication of facilities
• a reduction in beds, in line with a planned reduction
in case load, of about 18%.
• the provision of a critical mass for research and
medical training accreditation
• a reduction in junior doctors’ hours
An NHS trust case

PAGE 180
• attention to the quality issues associated with dual
approaches to clinical practice
• more effective management of emergency care
• improvement in relationships with neighbouring
hospitals, community units and general practitioners
• the provision of estates and ancillary services for 35
years, not only in the new PFI buildings but also in
pre-existing buildings.
The rationalisation and reduction in case load was
intended to save about £20 m per year, updated for
inflation. This was because reorganisation and
rationalisation within the region meant that the trust
had expected to lose about £27 m of its annual income
to other hospitals, but in the event it lost only about
£11 m. The Estates department estimates that the
trust had a maintenance backlog of some £20 m when
the PFI reached financial close. After financial close, a
number of variations to the new building were agreed.
Later a large variation, to provide an additional 12-bed
facility, was agreed. Further contract variations have
been made in respect of the provision of estates and
other services.
Considering first the building – although this research
study did not independently confirm the perceptions of
users – trust interviewees agreed that the new building
was delivered on time and broadly speaking operates
as expected.
We know the facilities are good, we know that just
walking around them, you can see there’s appropriate
privacy and dignity and the rooms feel large enough.
You can get a bed round the corners; you can get a
bed through the door. These are silly things but some
PFIs were criticised for not being able to do that. We
know from the feedback and from conversations with
the staff that the facilities work generally very well.
In addition, the design and build phase came in at just
less than one per cent over cost. Consequently the
perception of the project manager is that ‘the hard
objectives, the project management objectives were
achieved very well.’ In relation to the softer objectives
the following information has been provided. Junior
doctors’ hours have been reduced in line with legislative
requirements. The reduction of two sites to one has
eradicated some duplication and has helped to create
the critical mass needed for research and education:
‘There’s a critical mass of services to promote
specialism[s] and to encourage independence of clinical
specialties – so improved clinical effectiveness, I would
say has been achieved – I couldn’t put a percentage or
numbers on that’.
Although the improvement in clinical effectiveness may
be unproven, relocation to one site has helped to
remove some of the dual approaches to clinical practice
previously in evidence. In relation to the effective
management of emergency care, perceptions are that
this has improved: ‘We’ve gone from two A and E’s and
the staff being spread between them, down to one in a
state-of-the-art new department.’
Although some of the strategic plans for re-allocating
case load between this trust and other local hospitals
have been implemented, there has been additional
stress on bed provision, since the case load reduction
was less than planned. The failure to reduce case load
was attributable in part to new initiatives that carried
additional case load. A project coordinator in the
hospital’s Estates department also attributed this to the
failure of the primary care trust (PCT) to persuade local
GPs to change their traditional pattern of referral.
Nevertheless, an interviewee argued that the trust had
seized the opportunity to avoid duplicating expensive
provision both at this trust and at other neighbouring
hospitals. In relation to the rationalisation of the
provision at two sites, the expectations about savings
proved optimistic, not only because of the failure to
An NHS trust case

PAGE 181
reduce case load, but also because of unrealistic
assumptions about the trust’s ability to reduce patients’
lengths of stay: ‘Some of the lengths of stay and the
throughput with the case load that we were retaining
were very heroic assumptions’.
Since the initial public consultations about the plans to
co-locate on one site, there have been changes to
guarantees that were given to residents about the
nature of provision at one site, which was to be kept
open as a community hospital. In fact, part of the site
is to be closed down and the community hospital has
been described to us as ‘more like a treatment and
diagnostic centre’.
The PFI also had objectives relating to the provision of
the outsourced support services, but there are mixed
perceptions about the achievement. Although trust staff
have expressed concern about the quality of domestic
services and there have been issues associated with
estates, portering and switchboard, broadly they
perceive them as functioning adequately. Linen was
described as a success story:
Prior to the transfer of the linen service the trust had
literally let the linen just run down. We had
threadbare sheets – it was awful. Company Z came
along and there was a massive injection of linen. So
almost overnight new linen was into the system, stocks
were up and of course it was a success story.
In general terms, therefore the PFI has provided the
much-needed investment for buildings and linen.
VALUE FOR MONEY
One underlying rationale for PFI is a belief that the
private sector can provide services more effectively and
efficiently than the public sector, which is perceived as
unduly bureaucratic and therefore expensive.
Consequently VFM would be achieved because the
same service could be provided at less cost, or a better
service would result for the same cash outlay. In
general terms, Government advice is that VFM may be
measured against a number of proxies, including the
business case, the public sector comparator (PSC) and
by benchmarking costs.
To measure whether or not VFM has been achieved
implies a comparison of cost and quality before and
after PFI implementation. It has proved impossible,
however, to obtain this kind of evidence for this
individual case. Interviewees from both the public and
private sectors agreed that there is a lack of
information, in a suitable form, about quality of
performance before the implementation of the PFI
against which to measure the quality of the service
now. From the private sector’s perspective, this is
unfortunate:
I think there is a level of expectation that wasn’t there
before. I think you can look back through rose-
coloured spectacles and think that the service was
better before. I think there has been an
acknowledgement – not from the people who ran the
service before – but an acknowledgement that the
issues that came up before are the same issues that
come up now.
Comparing costing information before and after the PFI
is further complicated by the fact that this project
involved two separate hospital sites with two budgets.
In addition, a member of the finance team indicated
that because there were many changes in the period
from inception of the PFI to service handover, they
would have had to freeze the budgets and then to
follow every number through the system to make a
reasonable comparison. This was not practicable.
A representative from the finance area indicated that
the trust had never compared actual VFM with the
business case. Furthermore, our literature review has
suggested that the use of the PSC is problematic either
because a PSC is not always produced, or because
An NHS trust case

PAGE 182
sufficient resources may not have been allocated to
working through the assumptions and calculations to
ensure that the PSC is a reasonable base for
comparison, in terms of accuracy and sufficiency of
detail. In addition, the original contract and hence the
PSC may quickly become out of date, unless they are
revised as changes to the contract are negotiated. The
initial evidence on operational services indicates that
many contracts are subject to additions or
improvements within the first few years (NAO 2003b),
and PAC (2003d, para. 14) notes that this gives the
PFI contractors the potential to earn significant
additional money over a long period.
Indeed, although our trust became involved in a
considerable amount of contractual change very soon
after project implementation, these changes have not
resulted in review of or amendment to the PSC.
Changes broadly fall into one of two categories. First,
additional new services, such as the new 12-bed
facility, were not costed in the original PSC. Secondly,
changes resulted from omissions in the service
specification, which has proved inadequate, in some
respects, despite its complexity:
There are some huge holes in it [the concession
agreement] – things that weren’t covered – some are
very silly, but the concessionaires work to the
contract. So, you know, we forgot to put in
marmalade, so patients don’t get marmalade for
breakfast, so we have to pay extra for that. Same with
litter, we have to pay extra for litter, because nobody
actually stated litter collection.
Inadequacies, such as failure to specify marmalade and
litter collection, represent errors that have arisen owing
to a lack of experience in drawing up contracts. This is
an interesting example of the procurer attempting to
specify inputs (marmalade) rather than outputs (the
nutritional requirements of breakfast). This interviewee
believed that these types of problem may have been
resolved in later contracts by using a template for a
basic contract. In a later section, under ‘affordability’,
we discuss changes to service specification that
became necessary after the contract was signed
because the original specification omitted services that
later proved essential. It has been put to the
researchers that these omissions may have occured to
ensure affordability, and to the extent that this is the
case, a standard contract would not resolve the issue.
Owing to staff turnover in both the public and private
sectors, the distinction between error and omission is
unclear, but the failures inherent in this contract have
added to the cost and hence affect the actual VFM
compared with the expected VFM.
Thus, the PSC has lost its value as a comparator across
the total project. Also, the value of such a comparison
is questioned since although it would consume
resources, the knowledge gained from such a
comparison would not necessarily lead to action: ‘we
wouldn’t know what to do with the answer’.
Nevertheless, the PSC may still be used to benchmark
costs on individual elements of the project. For
example, the project director indicated that the original
contract documentation acted as a benchmark against
which to assess the price of contract amendments in
relation to a significant variation to the contract – to
provide a new 12-bed facility. This interviewee
indicated that such benchmarking was relatively easy,
and that ‘it gives you ammunition to make a case’.
However, there appears to be much less certainty about
the ability to use the PSC to benchmark soft services.
In some cases interviewees indicated that
benchmarking is not possible and in some of these
instances public sector employees indicated their
concern about whether amendments to contract had
represented good VFM. At our trust, changes to the
specified contract have to be agreed by a procedure
that involves issuing a change notice. Then new
payment rates are applied to the new specification and
these must be approved by the trust. This can be a
time-consuming process and since inception there have
been more than 160 change notices. Consequently,
An NHS trust case

PAGE 183
change requires the goodwill of the contractors, who
have been prepared to change the provision of some
services before the approval process is complete. This
goodwill, however, might also undermine the ability of
the trust to negotiate on the cost of changes to services
that they are actually receiving and perceive as essential.
Another way of measuring VFM is to benchmark
services against the unit cost of similar services at
other hospitals. At our case trust it was recognised that
benchmarking could be done by using the costs at
other PFI trusts, but it appears that there is no formal
method for doing this. Trust interviewees have contacts
with staff at other PFI trusts on an individual basis but
indicated that the trust is not part of a formal
benchmarking group and does not get involved in
formal benchmarking comparisons. The reason given
was lack of time and resources. An interviewee from
the Estates-monitoring team argued that benchmarking
is possible at a financial but not at an operational level.
However, it is also the case that detailed cost
comparisons are difficult. Although it is possible to
identify the unit cost of providing some services, such
as domestic, when the nature of the task is fairly
routine, this is not possible for tasks such as portering.
This is because in order to understand the costs of
more complex services, the trust would need to track
the time spent by porters on a multitude of different
tasks, along the lines of a time-and-motion study, but
there are no plans to do that. An interviewee from the
financial area indicated that it would be helpful if the
NHS provided data on a reasonable range of prices for
common tasks. One example was the desire for
standard rates per square foot to clean different types
of accommodation space. In this context it is interesting
to note that the NHS is currently devising a system that
will enable comparison between hospitals. NHS Estates
has developed the Estates Return Information
Collection database (ERIC) (NHS Estates 2003a),
which, together with the NHS Estates Data Collection
Analysis System (NEDCAS) (NHS Estates 2003b),
collects data from trusts and provides performance
benchmarking information to users in NHS trusts and
PCTs on a real-time basis.
The OGC has devised the post-implementation review
and the Gateway Process, which we discussed in
Chapter 2, to help procurers introduce best practice
and hence ensure good-quality project management.
We also discussed the separate initiative relating to
post-project evaluation introduced by the Department
of Health in 1994 and updated in 2002. Although
representatives from the finance area at the trust were
not familiar with the detailed process of a Gateway
Review they did recognise the concept and its
importance, but indicated that no such evaluation had
occurred. The project manager, who has responsibility
for the new building, said that he had deliberately not
conducted a post-implementation project evaluation
because he believed that it was too soon after
implementation and some issues still required time to
settle. He indicated that no timescale had been set for
any review. Also, there has been no formal review of the
PFI’s softer objectives. Nevertheless, informal reviews of
activities do take place, and information about lessons
learned is disseminated through a number of national
forums. In addition, the trust has played host to
international representatives from China, Canada and
South Africa. An interviewee from the finance area said
that the trust had a lot of experience of the financial
issues surrounding PFI, especially relating to the
monitoring and approval of payments, which
nonetheless had not been passed onto other trusts.
The measurement problems highlighted above mean
that it is difficult to assess in an objective fashion
whether VFM has been achieved. Therefore, in the next
sections we present some perceptions from
interviewees about the effects of a lack of pre-
implementation planning, complex organisational
structures and the subsequent growth in bureaucratic
structures and monitoring processes, and the potential
for refinancing that are relevant to the assessment of
VFM in this PFI.
An NHS trust case

PAGE 184
PLANNING OF SERVICES MANAGEMENT PRIOR TO
PFI IMPLEMENTATION
Our trust was a first-wave health sector PFI and
consequently there was little expertise available either
within the trust or in the sector about the ways in
which the trust would need to plan for the
implementation and future management of the PFI. In
particular, the trust now recognises the lack of planning
about how the relationship with service providers
should be managed. One of the difficulties appears to
have been that, at the time of signing the agreements,
the priority was the new hospital building. Speaking
about the service element of the contract, an
interviewee at the trust said:
It was never planned properly . . . . You know we
planned the concession, we spent two or three years
writing it to come up with that nice legal document –
really planned the building, but we never planned how
the services would work, we didn’t do it and neither
did they (the private sector), so we’re all at fault, and
we should have put loads of time into it.
To resolve this control issue, interviewees from the trust
indicated a need for better planning and especially the
need to take a strategic position in order to manage the
PFI in the future.
I suppose that’s one thing which we need to take on
board, which is the long-term strategy, you know,
exactly what’s going to happen later on in your PFI
project . . . . There’s so many variations as to how a
PFI can deliver . . . . You never know what it is you’re
looking for them to achieve, whether it meets your
needs.
Nationally, there are now forums at which project
directors are able to share experiences, specifically in
relation to planning: ‘There’s a lot of feedback in the
industry. I would have thought there was a better
awareness of the need to look at all aspects’. This
interviewee expressed the view that as an early PFI
they were bound to make mistakes and, in relation to
managing the delivery of the new building, he argued:
‘Some of it you’ll get right, some of it you’ll get wrong,
you’ll learn and you can pass on the benefit of your
mistakes and your achievements. So I think it is
changing quite a lot now, there’s more cross-
fertilisation involved than there ever has been’.
A monitoring manager also acknowledged that mistakes
had been made in relation to planning the transfer of
services and the ways in which they would be
monitored thereafter. Owing to the unexpected retention
of some responsibilities and an unplanned retention of
risk, which we discuss in more detail later in this
chapter, monitoring was more complex than had been
understood initially: ‘My simplistic role was to monitor
the PFI for estates, but it grew far more complex
because of the risk element’.
The knock-on effect is that this monitor finds himself
dealing with estate service provision issues, rather than
simply monitoring the services provided by the private
sector. Another monitoring manager explained that at
the beginning of PFI his staff transferred to the private
sector contracting company, and he was given a
manual several inches thick and the title of monitor but
no training. This manual contains some 20
performance indicators for which he has responsibility.
The line manager for these monitors confirmed this lack
of training, saying that the need for such training had
not been recognised.
The staff were service heads up until the Friday, they
came back in on the Monday and they’re all monitors.
It was a very awkward transition for the team and they
took quite a while to settle down. I honestly believe
they [the trust management] didn’t feel there was a
need for training, we’ve got [company X] responsible
for the service providers because our contract is with
[company X]. Their [company X’s] contract is with
[companies Y and Z] – ours isn’t. I’m sure when the
An NHS trust case
PAGE 185
agreement was typed up it was – ‘we’ve got all our
bases covered’. You know we’re one of the first-wave
PFIs so I think it’s probably down to naivety [of senior
staff] rather than neglect.
Nevertheless, in the period since implementation of the
PFI, the trust has moved to introduce structures and
procedures aimed at managing the PFI, and in
particular to try to manage the relationship with the
various members of the private sector consortium.
Ironically, given the perceptions that initial planning
was lacking, some interviewees now perceive these
procedures to be bureaucratic in nature. We examine
these perceptions in the next section.
ORGANISATIONAL STRUCTURES
It is commonly believed that the public sector is
inefficient because it creates bureaucratic structures
which consume resources. It is also believed that the
private sector does not do this. This case shows,
however, that substantial bureaucratic structures also
surround the implementation and operation of PFI. One
member of the monitoring team argued:
Contracting something out, when someone else has
the expertise, and can spend the capital, is not
something I’ve fundamentally got a problem with. I do
have a problem with the bureaucracy that’s created by
a concessionary agreement . . . . It needs to be less
convoluted, less difficult, less need for interpretation
all the time. We need to have the freedom to
understand what needs doing here.
The nature of a PFI project, however, is that it is
written as a formal legal contract and consequently
there is a need for formalised structures to manage and
control it, and these have increased over time. The
formal structures associated with PFI are evident in
both the private and public sectors, imposing costs on
both. We consider each sector in turn.
Private sector
The ownership structures of the private sector
contracting parties outlined earlier add to the
bureaucracy of PFI. Typically, as in this trust, private
sector ownership structures involve an SPV which signs
the contract, and other entities that provide the various
elements of the contract. This means that the legal
contract is between the trust and company X, but the
building and the services are the subject of further
contracts between the SPV and its contractors,
companies W, Y and Z. Therefore, there is an indirect
relationship between the trust and its providers. A
number of operational issues arise from this. First, after
the building was complete the SPV appointed a general
manager, with previous knowledge of the trust, which
from the SPV’s perspective was: ‘Quite important in
terms of understanding trust language and the NHS
perspective, knowing what the issues are and helpful in
terms of the dialogue’.
Secondly, meetings are required on a regular basis in a
forum with representatives from the service providers,
the SPV and the trust, and on an individual basis
between managers from the trust and the individual
service providers. There is also regular and informal
contact, ‘on an informal basis there is an almost
continuous contact, it’s almost daily’. Thirdly, although
interviewees from both the private sector and the trust
indicated that their working relationship was based on
the principle of partnership, trust interviewees indicated
that problems might arise and costs follow, because of
the lack of direct relationship between the provider and
the trust: ‘There’s a cost, and that cost is the
bureaucracy required to make the PFI work – the fact
that you’re using service providers who aren’t directly
answerable to you’.
An interviewee from company X acknowledged this.
‘The problem for the trust is that they don’t have the
level of control they would have had if they were
delivering the service in-house. Whereas I think they
feel they come through one organisation to go to
An NHS trust case

PAGE 186
another and that becomes more of a bureaucratic
process’.
Fourthly, if problems are encountered in an area of
overlap between the two service providers then there
may be a lack of clarity about where responsibility lies:
‘There’s that many people involved in these sorts of
agreements, nobody would take any responsibility for it,
if they would pick up the cost’.
This lack of clarity may be exacerbated if a problem
continues for some time. The trust normally deals
directly with the service providers but if a problem
persists then trust managers have begun to approach
the SPV, since this is where the contractual relationship
legally lies. From the perspective of the SPV, however,
this circumvents the systems that are in place and may
actually undermine the performance measurement
system. The PFI has thus created more complexity than
previously existed: ‘We’ve created a bureaucracy; we’ve
created a functionality that only exists because of the
contractual agreement’ (trust interviewee).
The contracting process, the bureaucracy that
surrounds it and the working mentality of the private
sector has represented a big cultural shock for trust
staff, who perceive the private sector as expensive.
Partly as a result of the loss of staff closely associated
with the original negotiation of the contract and partly
because of the legalistic nature of the contracts, trust
staff quickly realised that they lacked an understanding
of what the contract actually meant. There was some
surprise and much concern about the need to have
legal advice to interpret the contract, which they
perceived as wasteful of a scarce resource. Here a
cultural clash has been described by trust staff,
surprised at the contractors’ approach to contract
outcomes, which they perceive to be oriented towards
performances that are measured so as to ensure
payment. Trust staff have developed negative
impressions about the contractors and their lack of
flexibility: ‘They only do what they are contracted to do
and they’re very cut and dried . . . and it’s quite
frustrating really’ (trust interviewee).
From a service provider perspective, working to
contract and providing agreed services have a positive
value. A private sector interviewee pointed out that
there is an agreed procedure, through contract
changes, to obtain additional services, and that these
can be provided within a partnership arrangement.
Nevertheless, trust staff distinguish between this
performance-for-payment orientation and their own
approach, which they perceive as service oriented and
focusing on patient and staff needs. Some trust
interviewees perceive that this has led to a loss of team
spirit, although in some cases they recognise that
attempts are being made to revive that culture: ‘The
ownership and the teamwork don’t exist because the
staff work for [company X or Z]. . . . It was a different
culture then [before PFI]. Different wards or
departments will try and look to develop ownership and
team working, but it isn’t like that throughout the trust’.
Some interviewees also expressed surprise and concern
about the profit motive that PFI has introduced to the
health sector.
It’s my belief that the companies, not necessarily the
individual managers, but the service provider
companies, are basically here to make money and
therefore it’s very much in their interest to make sure
they meet the performance indicators. That is a focus
that shifts attention away from other things that we
want doing, and doing properly, and doing in a
particular way, and that takes nothing away from the
commitments and professionalism of the individual
managers on the ground.
Trust interviewees believed that the contractors were
more experienced at working to contract than they
were, and consequently the trust was disadvantaged:
‘We have to have surgeries, regular surgeries, wih our
lawyers, asking for interpretations and opinions and to
An NHS trust case

PAGE 187
try and steer us through it, and we’ve been doing this
now for four years and we still have to have these
meetings to try and help us along’.
Public sector
Bureaucratic structures are also in evidence in the
public sector. The nature of PFI is that it changes the
public sector organisation from a providing to a
procuring entity, and this introduces new tasks and new
roles associated with those tasks. One important new
task is monitoring the service providers’ performance in
order to approve the payment under the contract, and
to discharge the trust’s retained responsibilities in
relation to some health and safety and legislative
matters. Prior to PFI, there was no formal monitoring of
services by the trust. Trust managers were responsible
for ensuring that their services were performing within
budget and for providing supervision. Problems or
complaints from users were dealt with by direct contact
between the user or manager and the appropriate
supervisor. Under the PFI, problem solving involves a
longer chain, through a help-line, to register a request
for assistance with the service provider, who is then
responsible for contacting the relevant supervisor.
Consequently the ‘concept of monitoring was never
there’, and ‘so I suppose the trust didn’t know what it
wanted from monitoring . . . because we’d never sat
down and thought about it’. The need for monitoring
has resulted in substantial changes to employees’ job
descriptions. One interviewee, referring to facilities
management, said ‘it’s one of those posts which have
grown arms and legs’.
Both public and private sector interviewees agree that
the methodology surrounding the implementation of the
performance indicators has proved difficult to put into
practice, and within the trust there is some concern
about the content of the indicators. Consequently, this
new task has proved complex and has been made more
so because the trust retains some performance-related
risk, especially associated with the statutory aspects of
health and safety.
There was nothing definitive when we were drafted
into these posts. I mean all we had were those
performance indicators and it’s up to you how you
want to monitor it. How does the trust know that
[company Y] is performing on legionella, so I have to
devise an audit process – we’re not auditors – I’m a
professional engineer.
Prior to PFI, this same interviewee held responsibility
for the trust’s legionella programme, but now the task
was not to control the programme, but to monitor the
contractor’s programme: ‘We did have a regime in
place prior to that [PFI] but it’s a dynamic thing – it
needs to be ongoing – the legislation’s changing. So
you need an audit process to be able to ask them the
relevant questions – show me the information – have
you got a current certificate?’
Unless the trust is able to use a ‘light touch’ approach
to monitoring programmes such as this, effective
monitoring requires the same detailed knowledge of the
legislation and technical issues as was previously
required to establish the programme. Here there is an
issue of confidence and trust, especially because the
trust carries the risk of failure and:
At the moment I don’t have the confidence to be able
to have a light touch, the way it stands at the moment
it needs an in-depth look . . . . You need to dig and
hassle them to make sure or to feel confident that
they’re doing what they should be doing. Once you
gain the confidence then I suppose you could back off
a little bit, and just spot check them, but now I am
quite closely involved with them. I do talk to them on
a daily basis.
Despite the length of time that the contract has been in
place, gaining familiarity with these new tasks and
roles continues to be a heavy burden for trust staff. Two
issues are important. First, the transfer of many trust
staff to the contractor affects the role of the monitors,
who previously controlled them.
An NHS trust case

PAGE 188
It’s like I’m sort of a middle man. You end up trying to
resolve people’s problems, but you do get sucked in to
the everyday environment, and they are – they were –
my staff anyway. And it’s funny really because I think
a lot of them still have trust hats on. They still feel as
though they are part of the trust.
The monitor now has no control over those who
actually provide the services, since these staff are now
employed by company Y or Z. Since the trust
employees who use these services may not appreciate
this distinction, the monitor becomes involved in
service provision issues rather than acting as a monitor
at a distance.
Secondly, monitors have struggled with information that
is not always available in an accessible format.
We have struggled trying to audit [company Y]. We
ask the questions, they don’t always have the answers,
or they can show you in some sort of difficult format.
You could spend all day there with them trying to get
what you’re after out of them. I don’t think there’s
anything that they are trying to hide, it’s just that they
don’t have it in an easy-to-look-at format.
However, this interviewee indicated that there had been
improvement over time on some aspects of information
provision, for example, monitoring of hours worked and
jobs attended as shown on labour dockets had become
easier.
This presents another example of the procurer’s interest
in inputs as opposed to outputs, arguably because the
input is easier to measure.
In summary, there has been a learning process about
the nature of the PFI arrangements, which has changed
the perceptions of public sector staff. Expectations that
the whole responsibility for services could be handed
over were soon dispelled and it was recognised that, as
their involvement was to be much greater than
planned, new systems and processes for working
together with the contractor would be needed. In
Chapter 6 we saw how, over time, the Highways
Agency had introduced more formalised monitoring
systems. At the trust this process of achieving more
formalised monitoring processes has been more
complex and consequently it merits some detailed
explanation.
MONITORING PROCESSES
Monitoring is an accountability procedure intended to
ensure that the public sector agency discharges its
responsibilities in relation to the procurement and
availability of services and that payment is made
properly in line with the contract. Payment is made for
each service, for example domestic and estates, life
cycle and finance costs and a management fee.
Monitoring is intended to focus on service provision
outcomes for which the public sector has responsibility,
and not on inputs or methods of service provision, since
these are intended to be the private sector contractor’s
domain. Thus, as we have noted in Chapter 3 above,
although outputs need to be clearly specified in the
contract if they are to be effectively monitored, the
literature suggests that this has been problematic. The
Audit Commission (2001), in its examination of the
nature of contract specification, concluded that output
specification should be a key feature of PFI schemes.
Instead it found that input specification was a feature
of the first wave of hospitals (paras 62–64), and
indeed our trust contract has been described by
interviewees as an unhelpful mixture of input and
output specifications.
The payment tariff includes three elements: availability
at two sites, performance over all services, and volume
for catering and laundry. Each of these elements ought
to be subject to monitoring. Nevertheless, although the
trust currently pays a monthly sum of just under
An NHS trust case
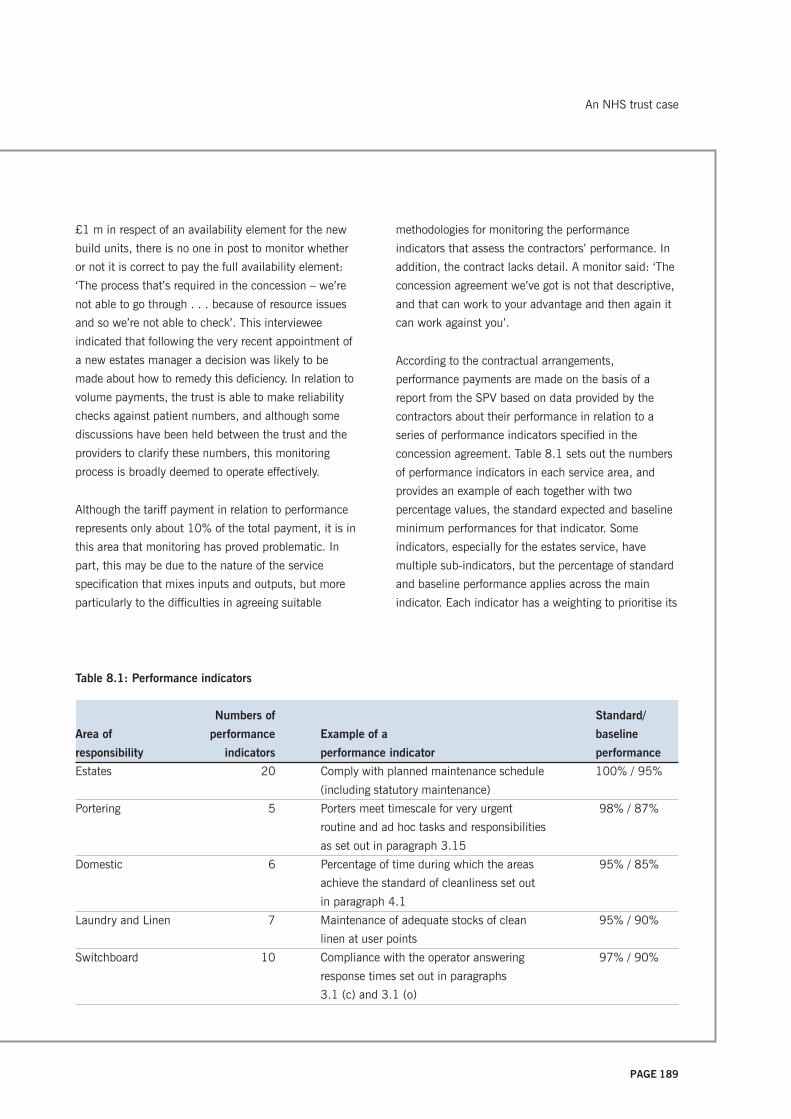
PAGE 189
£1 m in respect of an availability element for the new
build units, there is no one in post to monitor whether
or not it is correct to pay the full availability element:
‘The process that’s required in the concession – we’re
not able to go through . . . because of resource issues
and so we’re not able to check’. This interviewee
indicated that following the very recent appointment of
a new estates manager a decision was likely to be
made about how to remedy this deficiency. In relation to
volume payments, the trust is able to make reliability
checks against patient numbers, and although some
discussions have been held between the trust and the
providers to clarify these numbers, this monitoring
process is broadly deemed to operate effectively.
Although the tariff payment in relation to performance
represents only about 10% of the total payment, it is in
this area that monitoring has proved problematic. In
part, this may be due to the nature of the service
specification that mixes inputs and outputs, but more
particularly to the difficulties in agreeing suitable
methodologies for monitoring the performance
indicators that assess the contractors’ performance. In
addition, the contract lacks detail. A monitor said: ‘The
concession agreement we’ve got is not that descriptive,
and that can work to your advantage and then again it
can work against you’.
According to the contractual arrangements,
performance payments are made on the basis of a
report from the SPV based on data provided by the
contractors about their performance in relation to a
series of performance indicators specified in the
concession agreement. Table 8.1 sets out the numbers
of performance indicators in each service area, and
provides an example of each together with two
percentage values, the standard expected and baseline
minimum performances for that indicator. Some
indicators, especially for the estates service, have
multiple sub-indicators, but the percentage of standard
and baseline performance applies across the main
indicator. Each indicator has a weighting to prioritise its
Table 8.1: Performance indicators
Numbers of Standard/
Area of performance Example of a baseline
responsibility indicators performance indicator performance
Estates 20 Comply with planned maintenance schedule 100% / 95%
(including statutory maintenance)
Portering 5 Porters meet timescale for very urgent 98% / 87%
routine and ad hoc tasks and responsibilities
as set out in paragraph 3.15
Domestic 6 Percentage of time during which the areas 95% / 85%
achieve the standard of cleanliness set out
in paragraph 4.1
Laundry and Linen 7 Maintenance of adequate stocks of clean 95% / 90%
linen at user points
Switchboard 10 Compliance with the operator answering 97% / 90%
response times set out in paragraphs
3.1 (c) and 3.1 (o)
An NHS trust case

PAGE 190
contribution to the overall performance of that service,
so that the service score is calculated as the score on
each indicator multiplied by its weighting. Therefore, it
is possible that over-performance on one indicator can
compensate for under-performance on another. More
detailed information is provided in the paragraphs of
the output specification document, which also forms
part of the concession agreement. So, for example, at
paragraph 3.15, in relation to portering services, there
is a requirement that very urgent tasks should have a
maximum response time of five minutes. Six very
urgent tasks are identified, for example, responding to
violent visitors or patients. Payment is made on a
rolling six-month average score for the service, and
separate deductions may be made for failure in three
consecutive months, or in four out of six months, to
achieve the baseline for a specific performance
indicator.
The performance reports are generated from a
combination of data. For example, in relation to the
domestic indicator in Table 8.1 (see page 189),
performance measurement is based on monitoring
samples of the cleaning service. For indicators that
involve a response time element, a comparison is made
between the time a request is made for assistance to
the telephone help desks, recorded automatically on a
computer system, and the time the service was
provided, as recorded on dockets filled out by the
contractors’ staff. The result is either a pass or fail
against the standard time for the relevant priority. Items
such as planned preventative maintenance are also
subject to report, but in these cases the comparison of
actual work done is against a schedule of maintenance
provided in the contract.
Monitoring by the trust involves checking this process,
including auditing the relevant documentation. In
relation to estates indicators, monitoring also requires
an assessment of whether the time taken to perform
the job matches expectations of a reasonable work rate,
set out in standard times for common tasks: ‘There’s a
certain amount of scope and flexibility which could be
detrimental to the trust, if they didn’t play it with a
straight bat . . . so we have to look at that closely and
it’s quite detailed really, but that’s a big issue’.
To control this there is a labour time-management
system, the Works Information Management System
(WIMS), which is a series of databases described as
being ‘like a work study package’. This system allows
sufficient flexibility to cope with unusual jobs for which
a standard time is not readily available, but also
permits control because at least 75% of labour time
must be measured, thereby ensuring efficient working.
At the end of the month the contractor needs to achieve
a pre-determined number of passes in order to qualify
for the performance payment. If the percentages fall
below the contract indicator, then there is provision for
the trust to make deductions based on a formula. This
has been a rare occurrence on estates but has
happened on a number of occasions with the soft
services. If a contractor fails to meet satisfactory
performance targets, then the concession agreement
requires the contractor to implement a service
rectification plan. Such a plan has been required of one
of the trust’s contractors.
An important feature of the PFI, as intended when the
concession agreement was signed, is that payments
should be made on the basis that the private sector
monitors its own work. Within our trust, this is referred
to as ‘lone monitoring’. The principle behind the trust’s
monitoring is simply to ensure that self-monitoring by
the providers has integrity and in particular is based
upon a large enough sample to reflect reality. However,
experience has shown this process is unsatisfactory
from the trust’s perspective: ‘Once we got into it [lone
monitoring] it gave us some problems – it sounded
brilliant on paper, we had the ability to monitor their
monitoring but it was they [the providers] who had all
the work in monitoring’. The trust became unhappy
about the quality of some work, particularly in relation
An NHS trust case

PAGE 191
to cleaning services, and therefore became much more
involved in checking than expected: ‘They’re [company
Z] very good at putting things on paper, so we learnt a
very valuable lesson. No matter what the paper says –
where’s the evidence – we need to see what is going on
behind that’.
This led to an examination of the service provider’s
data collection process and a number of trust
interviewees believed that in the earlier stages of the
PFI the provider had not planned the data collection
adequately. In essence, they argued that the sample
size may not have been large enough to cover a wide
diversity of tasks: ‘We’ve probably got something like
sixty four thousand tasks for domestics in any one week
– is a thousand tasks being monitored reflective of
reality? Because there isn’t any detail about sample size
or anything like that, that’s been a real issue for us’.
Further difficulties arose from this dual independent
checking by provider and trust because the results
differed and therefore were disputed. Two important
points need to be recognised here. First, since the
hospital environment is a dynamic one, it is plausible
that different results may be obtained with integrity at
different times. Secondly, concern about the quality of
cleanliness in hospitals is not restricted to PFI
contracts, but may become more visible with PFI.
Output specifications are difficult because:
A dynamic hospital is never going to be 100% clean
100% of the time. Output specifications should look
at frequencies in terms of tasks and you need to have
an agreement with the trust about what is acceptable
and what is not acceptable. You need a line drawing
about the level of expectation.
In this case, the disputed results caused discussions
between the parties to become focused on very small
details, which was time consuming for all parties,
without resolving the overall issue. An example was
provided:
If you come in this room and said, ‘Is it clean?’ – Well
the floor’s clean but the window sill’s dirty – well, is it
clean or is it dirty? So are you monitoring a room, or
do you end up monitoring six things within a room?
And if you get four out of six right, is it clean? You
know, it sounds very easy, but it isn’t. You get into ‘the
bath’s clean but the taps are dirty’ – it just creates a
load of aggravation, that sort of argument.
These kinds of discussion continued for months and
interviewees from both the public and private sectors
indicated that an adversarial atmosphere had begun to
prevail. A trust interviewee said: ‘The trust was into,
what can we sting them for this time, and Company Z
were in defensive mode – getting as few bruises as
possible this month’. This conflicts with the view held
by both the public and private sector interviewees that
the relationship ought to be one of partnership. A trust
monitor argued:
If you’ve got a good relationship then you can steer
through your problems . . . but it’s when you don’t
agree that you then start to look for evidence to
support your case . . . and this particular concession
agreement is very light on detail in a number of areas,
and it causes conflict because if they don’t agree with
what we want, then the next person you talk to is your
lawyer and then you know it’s expensive going to
lawyers.
An interviewee from the SPV said: ‘We are here to work
in partnership in terms of services, to ensure we can
deliver a service to the trust and ultimately to the patient.’
The disagreement became so heated that the trust
sought legal advice about the possibility of going into
formal dispute resolution. It became clear that this was
not a practicable option since the service provider had
significantly more performance-related data than the
trust, and consequently more trust resources would
have had to be dedicated to data collection. This was
deemed inappropriate and an alternative was sought.
An NHS trust case

PAGE 192
Eventually, these unhelpful discussions were halted by
an initiative that came out of an ‘awayday’ meeting
between the contracting parties. It was agreed that the
trust would carry out no monitoring for six months. At
the end of six months, a single joint monitoring activity
would decide whether the performance payment was to
be paid for the entire period. From the perspective of
the trust, the intention of the monitoring moratorium
was to ‘step back from the contractual straitjacket’ and
allow the private sector contractor a period of time to
focus on improving the underlying service rather than
expending management time defending it. The trust
would use the time to establish an improved monitoring
process. From the perspective of the SPV, this
moratorium offered the opportunity to get to ‘the nub of
the issues – issues around training or recruitment and
vacancies and all of those kinds of things that make a
difference to the service’.
With the benefit of hindsight, it became clear to an
interviewee from the trust’s finance area that what was
needed was a precise method of monitoring, including
a process that distinguished between items that are
essential to the trust, such as cleanliness of wards, and
those such as the cleanliness of office spaces, that are
much less critical, so that a strategy for monitoring
could be devised to allow a rolling programme of
random monitoring based on priorities. Implementing
such a strategy has not been easy however because:
‘We’re now trying to change the wheel on a vehicle
that’s moving as opposed to doing it before the vehicle
started’. Nevertheless, progress is now evident and an
interviewee indicated that the trust is: ‘gradually
developing joint monitoring and protocols of
monitoring, which with hindsight should have all been
done before we ever started’.
A different interviewee indicated that the need for
producing an agreed service delivery plan and
monitoring methodology had been recognised by the
time the switchboard services were to be transferred
and consequently that the trust and service provider Y
had worked together to develop: ‘a very rigorous
monitoring protocol that we were happy with, and that
complied with (company Y’s) responsibilities within the
concession, and that was a very good example, very close
partnership, in getting something to work’.
Joint monitoring is intended ‘to develop and promote
the partnership ethos’, and involves the trust’s
monitoring manager and a representative from
company X, the SPV, conducting checks together. The
intention is that the monitoring protocols will establish
a ‘robust way of monitoring’ with a monitoring plan that
involves prioritisation. An interviewee from company X
indicated that joint monitoring places the company in a
somewhat difficult position, because it is forced to act
as a semi-independent arbitrator between its client (the
trust) and the service provider with which it has a
subcontracting arrangement.
Because there have been disputes around monitoring
we have joined in – [company X] has joined in, very much
as an arbitrator. But my board was saying this is a very
difficult position to put the SPV in, because one of the
things that is important is that we retain independence,
but relationships were such on either side that unless
you had an arbitrator, who was seen as being
independent, then the dispute would just continue.
Nevertheless, this interviewee indicated that from
company X’s perspective, joint monitoring was
achieving its aim. From the trust’s perspective, joint
monitoring should also involve random monitoring,
because: ‘Until the trust is allowed to random sample,
that is, to ring [company Z] now and say we’d like to
monitor in five minutes and we’re going to the burns
unit, we won’t be confident.’ The concession does not
provide for this and company Z has not agreed. An
interviewee from company X expressed sympathy for
both parties:
My view is that it [random monitoring] should be
acceptable – from the relationship point of view, and
An NHS trust case

PAGE 193
from the point of view of ensuring that the service is
consistent. I think there is a reluctance from the
service provider, which I can be sympathetic towards,
that they are being asked to fulfil lots of different
things and they need to pull back a bit – to focus on
what is in the contract. The other thing I have to say is
that the approach taken by the trust – because the
relationship has broken down in a way – is extremely
adversarial, so if they [company Z] commit to doing
something outside the contract the service provider
could be forgiven for thinking that is another stick to
beat them with.
Therefore there is a monitoring schedule whereby six or
seven areas are visited on a particular day. This has led
to a perception among trust staff that the service
providers operate to schedule:
There are issues with joint monitoring because our
feeling is that it’s following a specific schedule. On a
weekly, bi-weekly, or bi-monthly basis the service
provider knows when it’s going to be monitored . . .
I’ve got a domestic monitor, who’s been a domestic
services manager for over 20 years who gets extremely
frustrated because she’ll go onto the ward and the
sister will say, ‘Oh, I thought you were going to
monitor, we’ve had an influx of [cleaning] staff’.
Now the focus has shifted from trying to penalise the
provider to ensuring that the service is actually
provided, a number of trust interviewees argued that :
‘It isn’t about penalties and money, because that
doesn’t stop patients getting infections or complaints
coming in from the public’.
Consequently the concept of rectification has been
introduced. From the trust’s perspective, this is
intended as a way of increasing the incentive for the
private sector contractor to improve the service rather
than defending it to ensure performance payments are
made. Previously the trust believed that the contractor
had an incentive to deny there was a problem, because
problems led automatically to the loss of income: ‘I
think they perceive there is a problem, but if they admit
there’s a problem they don’t get a payment’. The
concept of rectification now means that income can be
safeguarded by the contractor:
If something’s dirty, but they put it right in an hour
then they can re-monitor and count the new score and
that’s good for them because they get a better score
and it’s good for us because we get the place cleaned.
Having proved it’s dirty with joint monitoring and
rectification, they can get the points back and
therefore their money back.
Although the most severe problems have been
experienced in cleaning services, the concept of joint
monitoring and established protocols is being used or
being established for all services. Hence, although the
performance element represents only a small proportion
of the total payment, it has acted as a trigger to seek a
remedy to agreed problems. This process is not
straightforward, however, and there are a number of
issues worthy of consideration. First, the quality of
cleaning services is still the subject of concern and
although the contractors were paid their performance
money at the end of the monitoring moratorium, it was
suggested that their performance was temporarily
enhanced by increasing the numbers of cleaners
immediately prior to the important monitoring date:
‘The disappointing thing about it is that when we got to
the month of total joint monitoring, [company Z]
flooded this site with staff and management because
their focus was on performance, not on service’.
Another interviewee with the same perception said:
‘Check the security passes. We issued a lot of new
security passes to domestic staff in that period’.
One interviewee suggested that they had come full
circle, having achieved little in the year that the service
had been subject to intense negotiation. In contrast, the
perspective of an interviewee from the SPV is that
progress was made:
An NHS trust case

PAGE 194
Because there was a dispute over the monitoring
figures at the time, we had a period when [company
X] joined in and I think both [company Z] and the trust
have said that if we had not done that it would not
have gone anywhere. So what we reached was a score
that was between baseline and standard, which I think
all agreed was where we were in terms of actuality.
Furthermore, this interviewee suggested that
expectations about how much might be achieved in a
six-month period may have been too high because of a
need for cultural changes that take more time.
Consequently the six-month period was helpful but: ‘It
has been difficult to sustain. Can we change something
that has got systemic problems in six months?
Organisationally, it is not a long period of time for
somebody to change structure and be able to deliver in
terms of sustained performance’.
In support of this perspective, the service provider
subsequently took external consultancy advice and
implemented a new scheme for improving domestic
services. In addition, the SPV is currently
commissioning an audit that is to focus on domestic
services, and is intended to identify any barriers to
partnership working in this area.
A second issue worthy of consideration is that although
the trust knows what it is paying to each service
provider, it does not know whether there has been a
change in the application of resources to service
provision following PFI, because control over inputs
rests with the provider. Thirdly, there has been, at least
in some parts of the trust, a change in the nature of
expectations about the ability of PFI to deliver change:
[Company Z] had a history of CCT so they know about
tendering, but this trust hasn’t and we were possibly
sold stories like, ‘you can penalise them if they get it
wrong’, but of course it’s the same staff, and the
hospital was never, like, shiny bright before, so why
did we suddenly expect it to be different when the
staff work for someone else?
This same issue was raised by an interviewee from
company X, who acknowledged that there had been
some problems in relation to key supervisory staff: ‘A
lot of supervisors were people who transferred under
TUPE so there are some historic problems, that have
been transferred from the trust to [company Z], and it
is very difficult for a company to take over problems
and then turn them around’.
Finally, in relation to estates, there is concern within
the trust that although the contractor is adequately
measuring the performance indicators in the contract,
the content of these performance indicators may not be
what is actually required. An interviewee provided an
illustration in relation to the monitoring sheets used for
maintenance of a statutory nature, such as technical
guidance surrounding the maintenance of hospital
plant: ‘We’re four years on and I’m still arguing and
negotiating with them about the content of the
performance indicators.’
An SPV interviewee argued that there was a lack of
understanding about what was behind the performance
indicators because, owing to staff turnover at both the
trust and the service providers, the people who actually
agreed the indicators had moved on. The present
position, from the perspective of the SPV, is that the
performance indicators were agreed before the contract
was signed and that issues surrounding the
methodology for measuring these ought to be resolved
before there are discussions about changing their
content.
They [performance indicators] were agreed by everyone
at the beginning of the contract . . . but we have had
difficulties about how the data is produced and we are
currently running through with our service providers
the methodology surrounding the performance
An NHS trust case
PAGE 195
indicators. There may be problems with them but we
need to get to a situation where we’ve made them as
effective as possible, before we look to change them,
because if we change them, then that would affect the
ways that the service providers look to provide the
service. It affects their payment mechanism. If they
provide a different service then they would deliver
that – at an additional cost, I would say.
REFINANCING
As indicated in Chapter 3, after the initial design and
build phase, the risk of PFI projects has been perceived
to decline, opening the way for a refinancing at lower
capital costs. Early PFIs did not include any contractual
arrangements for the public sector to recoup part of this
benefit. Later PFI contracts have tended to share the
benefits between the public and private sectors, and
the contract at our trust provides for 10% of the benefit
to go to the trust. Since June 2001, three quarters of
PFI contracts have shared benefits on a 50/50 basis
(NAO 2002e). The Refinancing Taskforce was
established with responsibility for facilitating and
implementing a Code of Practice for early PFI deals to
try to ensure that the public sector receives a share of
refinancing gains at least equal to 30% on most
projects. Although this Code of Conduct is voluntary,
since it seeks to change the terms of signed contracts,
the CBI has welcomed it and is encouraging the private
sector to honour it. Furthermore, the NAO has indicated
that it expects public sector organisations to apply the
Code and that it will review some refinancings.
Consequently, following advice from the OGC (2002b),
the trust may receive 30% of any gain from
refinancing.
Refinancings can be very complex and difficult to
identify unless the private sector partners reveal their
intentions. Our trust knows that the SPV is seeking to
refinance its loans and ‘there is a dance around what
information will be available to the trust’. Any benefit
received above 10% would improve the VFM as
compared with the original business case. However, the
various parties involved in a refinancing may have
different interests and the overall impact was not clear-
cut.
One interviewee believed that there might be an impact
on the trust’s ability to enforce standards. Refinancing
will be possible only if the banks are satisfied that the
contract is working adequately, and although this
could, in principle, create pressure on providers to
improve their service, the interviewee perceived that an
alternative scenario was possible. He argued that
because of the benefits achievable from re-financing, it
was important for all members of the private syndicate
to be perceived as performing and therefore less likely
that the SPV, company X, would be prepared to
terminate its contract with any one of the service
providers. There is therefore a possibility that
refinancing could reduce the risk to the trust, but may
also complicate its relationship with the service
providers. A second interviewee argued that some trust
managers were concerned to press for better service in
this context whereas others were more concerned to
maximise the financial benefit. It is possible that the
refinancing will involve an increase in the length of the
repayment period as well as a reduction in interest
costs. The profile of payments reflects the repayment of
the finance and this change in repayment profile could
benefit the trust, however, since the Government
requires that any refinancing benefit be taken over the
lifetime of the project, the annual effect is limited.
In these sections we have highlighted the difficulty in
determining objectively whether the contract represents
VFM, and the perceived need for pre-implementation
planning, the establishment of new roles to fulfil the
new tasks associated with PFI, and robust monitoring
processes in order to control a PFI project. Thus the
complexities of the contract and the subjectivity
involved in assessing performance indicators have
generated a formalised method of working, which
consumes resources in terms of management time.
An NHS trust case

PAGE 196
Given that our trust was an early PFI, it is perhaps not
surprising that there is a perception of need for better
planning and management to ensure VFM. What is
perhaps a cause for concern is the length of time it has
taken to work through the detail of the PFI contract and
to establish the necessary role holders and systems.
The fact that contract-related negotiations are still
taking place so long after service transfer suggests that
the related costs must have an impact on the VFM of
this project and on the returns to the private sector.
Consequently, it appears that the potential for obtaining
VFM by increasing the efficiency of delivery is, at least
in part, undermined by the costs associated with
controlling and monitoring the performance of the
contract. This is occurring for two reasons. First, the
trust cannot, in common with many other public sector
bodies, delegate all responsibility for the quality of the
service. Secondly, because public money is involved,
trust staff feel a responsibility to ensure the trust gets
what it pays for. In the next section we examine the
nature of risk transfer in more detail.
RISK TRANSFER
We have argued above, in Chapter 4, that risk transfer
is critical to the financial justification of many PFI
projects, since traditional procurement is less expensive
before the costs of retaining risks are added to the PSC.
Our review of the literature showed that risk transfer
may be problematic in practice. In this section we
explore some of the perceptions about risk transfer in
this project.
Under the terms of the concession, the SPV carries
responsibility for a number of clearly defined risks,
especially those associated with the design and build of
the new units. The SPV has responsibility for
maintaining the two new build units and returning
these to the trust at the end of the contract in good
condition. Thus an SPV interviewee indicated that the
SPV held a heavy burden in relation to ‘life cycle’ risk
for these units.
We have got some heavy risks, without doubt, out
there. The heaviest risk for us as an SPV is in terms of
life cycle, because at the end of this contract we
present back to the trust a building in the same
condition, and there are a lot of things that can
happen to a new building over that period of time. We
have to ensure that there is an appropriate level of
maintenance done by our service providers.
Two issues were raised in this connection. First, the
nature of building use has life cycle costs that fall on
the SPV, but the main user is the trust, and a trust
interviewee indicated that they had not fully grasped
the implications of this. For example, the trust changed
its use of one area to create a new surgical assessment
unit without notifying the SPV, even though company X
needs to be informed because of the life cycle
implications. Secondly, especially in connection with
the provision of estates and the ancillary services,
responsibility for life cycle costs is shared, and
therefore it may be uncertain where the responsibility
rests. An example was given by an interviewee from
company X:
Doors come to be renewed, in, say, five years time but
if the door needs to be replaced before that time, then
we carry that risk, unless we can show that it is
through lack of maintenance, or a latent defect, or it’s
through use, and the reason that is our highest risk is
that, without a shadow of a doubt, that will get harder
to prove.
Thus the SPV finds itself carrying risks associated with
the use of the building but does not have direct control
over the users of the building, including the employees
of other syndicate members, trust staff, patients and
the general public. One outcome of this is that when
repairs are required, especially those associated with
damage to the fabric of the building, there may be
negotiations about where responsibility lies. One trust
interviewee provided an example about damage to a
wall:
An NHS trust case

PAGE 197
There are examples of [company Y] retaining risk, but
they don’t just say ‘Oh, it’s our risk – fine’. They will
fight and argue that somewhere along the line there’s
some culpability . . . . We get into all sorts of issues –
if there’s a damaged wall – who did it? Was it one of
the other service providers in which case they’d be
looking to bill [company Z]? Was it one of the trust
employees? In which case they’d be looking to bill us.
An interviewee from the private sector indicated the
need for these kinds of issue surrounding the duty of
care when using facilities to be resolved through a
partnership mechanism, in which there ought to be a
sharing of responsibilities: ‘There are issues we need to
deal with, and the issue is one of partnership really. It
is not always as clear-cut as users or design, but if
there is a health and safety issue, I’ve very much put
forward that it would be in all our interests to resolve
this’.
The SPV interviewee argued that the trust employees
did not always act as responsible tenants, thereby
increasing the cost of maintenance to the SPV: ‘There is
a lack of responsibility out there about taking care of
the building . . . . I think there has to be an
acknowledgement by the trust of their responsibilities
. . . and essentially there is a need to move on and to
move forward with the partnership’.
One way in which company X has sought to move on is
by establishing a reporting mechanism to capture
information about damage to buildings, but that has
not been fully implemented by the trust. Since this
contract is only a few years old, relatively few life cycle
issues have been raised, although company X has
signalled its need to plan for these in the immediate
future: ‘It [life cycle] is something that we will need to
concentrate on over the next years in terms of our
strategy and business plan. It is a new build so the life
cycle issues are not happening yet, but you can see
that they will in the future. So we need to plan
proactively’.
This planning will build upon regular life cycle reports,
the first one of which, apart from the inaugural one,
was due when the contract had run for five years.
The situation in relation to the provision of services in
the pre-existing buildings is more complex. An early
difficulty arose because the actual contract differed
from the expectations of trust managers working in the
finance and operational areas about the risks to be
transferred under the PFI. In particular, they had
expected that risk transfer in relation to services in pre-
existing non-PFI buildings was to be the same for the
new PFI units. After taking legal advice, however, it
emerged that the contract had not transferred risk
associated with the pre-existing building, and so: ‘In
terms of whether something is safe, whether something
is adequate, whether something is doing what it should
from a plant and estates point of view, all that risk
stays with us [the trust].’
In particular it appears that this mismatch between
perceptions and the contract was not restricted to those
in middle-ranking managerial positions, but was
evident at very senior levels, among executives who are
no longer with the trust.
Now to give you a feel for just how much we didn’t
understand – the chief, not the present one,
corresponded with me in such a way that led me to
believe that they’d totally misunderstood. . . . And I
didn’t really get it at the time either. I took some
advice and it suddenly dawned on me just exactly
what we were dealing with, and in fact we’ve had
practical examples of suffering from that risk. We
have been set upon by the Health and Safety
Executive with regard to a risk assessment.
The reason for this mismatch was put down to naivety
by another interviewee: ‘So I think in the trust’s naivety
they thought that they would have no further problems
with all the services that transferred, but what transpired
An NHS trust case

PAGE 198
was that although the staff transferred and the service
transferred, the risk didn’t.’
Whether those who negotiated the contract on behalf of
the trust shared this misunderstanding is not known, so
it is not possible to determine whether there is a
consequential impact on the actual, as opposed to the
expected, VFM of the project. However, it appears that
this mismatch between expectations and the contract
did not exist in the private sector. For example, an
interviewee from the SPV indicated that there had been
no surprises in relation to risk transfer, which had
occurred as expected.
From our perspective the risks that have transferred I
would have expected, there is nothing we have taken
that wasn’t expected. However, I think there is a
perception within the trust that all risk is put with us,
and I think probably that wasn’t as clearly defined at
the beginning as it should have been. There are issues
around, say, the services or even the building that the
trust has some responsibility, but I think there may
have been a level of expectation that it may have been
totally undertaken. My view is that risk has been
appropriately undertaken and that this is in
accordance with the contract.
Therefore, the trust had to change its understanding
about the ability to transfer service provision risks for
both new and old buildings during the early period of
PFI implementation. Several interviewees indicated that
initially they had believed that they would lose all
responsibility and hence all the workload associated
with services, but that now it had become clear that:
‘The trust had to have far more involvement in estates
services and domestic services and all those things that
they thought might have transferred but didn’t’.
Consequently: ‘The PFI wasn’t something you just sort
of did and someone ran your services for you, there’s
an active management role monitoring them’. The most
obvious manifestations of this realisation can be seen in
the appointment of new role holders, increasing
quantities of monitoring activities, and a reliance on
more formalised systems of monitoring, which we
discussed in the previous section.
The trust has found that it retains risk for a range of
activities that include: liability for accidents to staff and
the public, many statutory obligations such as
compliance with electrical, lift and pressure vessel
testing legislation, programmes associated with issues
such as legionella and asbestos control: ‘We are the
duty holder for the site and we’re also the landlord for
the properties, so it still falls to us to ensure a duty of
care’.
In some cases, this risk is shared with the relevant
service provider, but there is uncertainty about the
proportions of risk sharing that apply:
How the proportionality would work out, that’s in the
heads of the HSE [Health and Safety Executive]. They
would look at what have you done, what should you
have done, what was deemed to be your part to play
and what was the service provider’s part to play, so
the proportionality would change depending on what
the topic was and how far we’d addressed the
problem . . . . It’s not a simplistic thing monitoring
the PFI.
Trust interviewees acknowledged that risk had been
transferred in relation to labour relations, especially in
relation to labour disputes and ‘the hassle of
negotiations’. Nevertheless, the changes introduced by
PFI have not been fully understood by all employees,
especially those outside the administrative sphere, and
neither have the changes been understood by members
of the public. For example, service users did not always
understand the transfer of responsibilities: ‘If they feel
as if things aren’t working out for them, they’re not
getting what they expect, then they come to see the
facilities manager’. The facilities manager is now a
monitoring manager employed by the trust and the
correct port of call is the service provider help desk.
An NHS trust case

PAGE 199
Clearly such continued involvement, several years after
the granting of the concession, implies a cost to the
trust.
There may also be a problem for the SPV and the
contractors. If service requirements are not directed
through the help desks then they do not become part of
the contractors’ systems.
What happens is that the wards – rather than ringing
through to the help desk and giving [company Y] the
opportunity to resolve the problem – they will ring the
monitoring team. The monitoring team will go out . . .
. It is escalated to the point where it is reported as a
hospital incident – as a complaint – and it becomes
very difficult to respond to. We are currently looking
at a process of escalation that starts at the help desk
because unless you have that it is not auditable.
(Interviewee from company X).
This interviewee indicated that there may be a lack of
knowledge on the wards about the way that the
performance indicator system works and the
importance of the help desk in relation to measuring
response times. Moreover, a trust interviewee suggested
that some employees transferred to the subcontractors
still believed that they worked for the trust: ‘The porters
are ninety per cent still the staff that used to work for
us – some of them probably think they do work for us,
or at least mentally have a culture of their working for
the hospital’. This culture has persisted despite a re-
launch by the relevant contractor, described by a trust
interviewee as ‘product branding’ of the transferred
staff.
In short, although it is clear that some risks have
transferred from the public to the private sector in the
expected manner, in essence it is too early to assess the
impacts of actual risk transfer, as opposed to either the
expected or even the contracted risk transfer, in relation
to those activities about which there is shared
responsibility. Indeed, it may be the case that the
extent of risk transfer can be known only in the event of
problems that are so serious that the proportionality of
risk sharing has to be negotiated between the parties or
determined in court. Risk retention by the trust has had
an impact on the monitoring processes and in the next
section we will show that it overlaps with issues of
affordability.
AFFORDABILITY
PFI ties the procurer into a long-term contract for the
provision of specific services, of both a capital and a
revenue nature, and the cost of the annual payments is
a charge against its budget. Therefore, it is clearly
essential that the procurer is able to afford these
payments over the long term. The payment, as an
aggregate payment that includes both capital and
service elements, may have led to a number of trade-
offs between immediate gain, in terms of obtaining a
much-needed building, and the long-term provision of
services. A number of interviewees provided examples
of this kind of trade-off and we highlight three here:
provision of facilities and services, transfer of risk and
response times. These examples also illustrate
differences in perceptions about the objectives of the
PFI project, which we referred to earlier.
One interviewee believed that the need to ensure
affordability had resulted in significant downsizing of
the facilities available within one of the new build units,
and that staff and clinical provision were suffering
continuing problems as a result of this trade-off:
I think on the building side you could argue that the
objective of the PFI has been achieved. We’ve got a
building, and it’s a reasonably good one, and it works
fairly well, and yes, you know we got value for money. I
think on another front, affordability, that very word
was a disaster because in making it affordable, things
were taken out, things were pared down and we, me,
my boss, the people that work for me, are now
suffering the consequences of that affordability. Out
An NHS trust case

PAGE 200
of 26 departments, pathology, pharmacy, sterile
services – virtually all the therapies – only two were
catered for – all the others had nothing out of the new
build.
This perception was not, however, shared by two other
more senior trust employees, one of whom is very
closely involved with the PFI project. These
interviewees have both indicated independently that
the PFI plans never included these facilities and that
downsizing did not therefore result. This difference in
understanding appears to be linked to the very long
period over which plans were discussed and the fact
that many interested people were not closely involved
with the discussions. This raises questions about
whether the project was oversold. Under conditions
where many of the original negotiators have left the
trust, such perceptual variations are not easy to rectify.
Interviewees from both public and private sectors
indicated that initially all parties tended to place a lot
of emphasis on the new building as opposed to the
arrangements for services and facilities management
over the next 30 years. However, eventually the
emphasis did shift to the services. A monitoring
manager suggested that although the building is
important to the clinical teams, the services now have
a very important impact on the way in which clinical
care is provided. One interviewee indicated that there
was a lack of knowledge among clinical and medical
staff about the nature of PFI. Speaking about service
performance indicators, he said:
I remember a classic letter from a consultant, in fact
he’s very senior, very experienced, but the letter shows
a total lack of understanding that the building he’s
working in is only there because we went into this
arrangement. They don’t get it. Most people in the
trust don’t understand what the PFI is about and what
we’ve had to commit ourselves to, to get that building
built without having to spend exchequer capital . . . .
Affordability is a dirty word in this office.
Since the contract was signed, the trust has had to
upgrade some service specifications and add others
and the cost is consequently increasing. These changes
may be undermining the affordability of the PFI.
When I’m doing change notices and we’re agreeing to
pay them more, I think we’re probably near, if we
haven’t already reached, the level of financial
cutbacks that I suspect needed to be made to get that
[contract] signed. It was around affordability, and I’m
sure we’ve probably gone over the threshold now,
whatever it was that was needed for affordability,
because the majority of the change notices that have
been put in are because the service was required but
wasn’t in the concession.
One small, but quite costly, omission was the failure to
specify litter collection. A more serious change notice
arose: dedicated porters for the theatres in the new
build proved essential, but were not in the original
specification.
The trust couldn’t possibly run without dedicated
portering staff, but you know they weren’t in [the
concession agreement] – they were categorically not in
. . . . That’s what I mean we’ve either breached or are
coming up to the threshold around what must have
been affordability to actually get that contract signed off.
There is no evidence that negotiators deliberately
reduced contract specification to an inappropriate level.
As the project manager indicated, mistakes were likely
to occur, especially at a first-wave hospital. Although,
with the benefit of hindsight, the portering
arrangements, as in the business case, were
unworkable this is not necessarily related to PFI; many
projects involve trade-offs between costs and
specification. Nevertheless, this provides an interesting
illustration of the very practice that PFI was supposed
to end: that of the failure to specify properly in order to
get a project through. In other words, PFI did not so
much change a poor practice as make it more visible.
An NHS trust case

PAGE 201
One disadvantage of these belated negotiations is that:
‘We probably haven’t got the economies of scale we
could have had then’.
A second example of trade-off relates to the retention of
risk. A monitor argued that the available money was
insufficient to enable the transfer of risk in relation to
the non-PFI buildings.
They are maintaining older buildings, that’s why they
won’t accept the risk, they will not accept the risk on
old buildings because of the implications of
maintaining old buildings, and the fact that the money
they were given, they felt, was not enough to take on
board the risk. There are millions and millions of
pounds in what we call backlog maintenance here,
things that [company Y] have inherited, leaky roofs,
poor infrastructure . . . if you don’t give somebody
enough money to maintain all of that and put it right,
then you can’t really expect them to take the risk.
As we have shown above, because the trust retains the
risk there is a need to increase the monitoring of the
provider. This creates additional bureaucracy and
increases operating costs for both the trust and the
contractor. The project director perceived the
maintenance and affordability issues from a different
perspective. He indicated that the need to resolve the
trust’s maintenance problems by obtaining a new
building drove the trust into an agreement which had
unnecessary elements: ‘We had a backlog maintenance
problem of about £20 million a year, and it was getting
worse the whole time. All we needed to do was to get a
new building to sort that out – we didn’t really need to
outsource all our other services, but we ended up
having to do that to move forward’.
A third example was given in relation to the portering
tasks and performance indicators. Portering services
are measured on the basis of response times, which are
categorised as: very urgent response in five minutes,
urgent response in thirty minutes or routine response by
agreement and as soon as reasonably practicable. In
the early phases of implementation of the PFI there
was a misunderstanding about the meaning of these
response times.
A response time is the time from when the call is
made to [company Z] – please move this patient – to
the porter starting the task, it is not the actual
fulfilling of the task in totality, it’s about responding.
So you could have a call from theatres at two o’clock
and in essence [company Z] have until two thirty to
start that task.
This interviewee indicated that it took trust employees
many months to understand this method of working,
but went on to say:
I think the bandings are too great, between five and
thirty minutes that’s a big gap, but that was about
affordability. So we’ve had to sit down and negotiate
’Well, can we include this?’ and of course for most
things there’s a cost. So we have to negotiate, ’Can we
fund this?’ and ‘Can we do something quite
differently?’ and again this is probably around
affordability.
In addition to these examples, affordability problems
may also have occurred in a number of other ways that
have continuing effects. For example, it may have had
an impact on the ability of the contractors to make a
winning bid for some services, especially domestic
services. Trust employees were transferred to the
service providers under TUPE arrangements, which
offer employee protection for existing pay and
conditions of service, if these are better than market
rates. Service providers had to take a view about
expected rates of turnover of these protected employees
and numbers of staff likely to be employed at market
rates to create a winning bid. Market rates are low,
however, and there is nationally some difficulty in
recruiting sufficient staff. This is exacerbated by the
location of our trust, which has a number of large
An NHS trust case

PAGE 202
competitors for these kinds of staff. Service providers
have therefore experienced recruitment and retention
problems.
An estates manager indicated his concern that over
time the PFI may create a leakage of funds from the
trust in relation to some kinds of estates work, raising
potential affordability issues for the future. Prior to the
PFI the estates department was able to earn additional
cash over its annual budget by providing building
services beyond the scope of the annual plan. This
cash would then be used to bolster the estates budget:
‘We would push that money back into repairing the
estate, it was money that never left the trust, it was
just reallocated. What’s happening now is that it goes
straight into [company Z’s] pocket. So there’s money
leaving the trust, whereas in the past it was recycled.’
After financial close it has become necessary for the
trust to add services to the original contract. In one
instance, this was to provide more beds, which brings
with it the possibility of more income. Other instances,
such as the failure to specify marmalade for patients’
breakfast, which added some £40,000 to the trust’s
costs, have probably resulted from misunderstandings.
In other cases, the trust has been unable to operate
with the original terms of the concession and has been
forced to issue change notices, thus incurring additional
costs. Therefore, the affordability of this contract would
appear to have reduced since financial close.
DISCUSSION AND CONCLUSION
The relationship between risk, value for money and
affordability is one of the most complex and
controversial areas of the PFI. (Audit Commission
2001, para. 85)
The evidence from these interviews confirms this
statement and provides detailed information about the
nature of the complexities that arise. This case has
highlighted a number of issues that have arisen
because it was in the first wave of hospital PFIs and
therefore a pioneer in terms of both construction and
managing the more problematical transfer of service
provision. It is clearly the case that the experiences,
both positive and negative, of the first wave of hospitals
have been important in highlighting many areas where
contract clarification, involving expensive legal
consultations, is needed. In the case of service
provision, some shortcomings in our trust’s contract
were not immediately apparent and are taking
considerable management time to resolve.
Many other trusts may well be experiencing a similar
level of problems as standard output specifications for
20 areas of non-clinical services were launched by the
DoH only in December 2002. Indeed, when asked in
an interview for PPP Forum if there have been any
problems with the new facilities, Alan Perkins, chief
executive of the Queen Elizabeth Hospital in
Greenwich, commented: ‘We outsource all of the non-
clinical support services. It is not working as well as we
would like yet, but it is consistently improving. Like any
new hospital it is mostly teething troubles’ (PPP Forum
2003a). He also went on to comment in relation to
staff transfer that: ‘Although the concept was right it
was thought that the concessionaire could have
resourced training more adequately. Catering and
portering have had teething troubles, which were felt by
the staff’ (PPP Forum 2003a).
An interviewee at our trust suggested that this may
underestimate the difficulties at Greenwich.
Nevertheless, since our trust is a first-wave hospital
PFI, it could be argued that its difficulties may have
formed the basis of a learning curve for other hospital
PFIs. In some respects this is undoubtedly the case. A
number of interviewees indicated that they have been
visited by representatives from other trusts, which have
been able to benefit from their experience. Although the
DoH has put considerable effort into the
standardisation of contracts since the first wave of PFI
hospitals, legal costs are still extremely high. There is
An NHS trust case

PAGE 203
also some dissent as to whether standardisation of
contracts is the best way forward: ‘I do not believe
standardising contracts is the right way forward. It
should only be a part of the process. More weight has
to be given to innovation, change and flexibility. We
have got to get more innovative in contract structures
and how we do the core business.’ (Malcolm Stamp,
chief executive of Norfolk and Norwich University
Hospital, quoted in PPP Forum, 2003b)
The interview material that we have provided above
shows that implementing this PFI involved and
continues to involve an enormous workload for the trust
and their service providers in terms of very detailed
discussions about elements of the contract,
performance assessment and monitoring. Given the
level of detail that is involved, it is unlikely that other
trusts can learn these lessons and/or implement the
solutions very easily. The information we have been
given suggests a piecemeal approach to contacts
between trusts and the use of benchmarking data, so
that it is not certain that all the lessons or available
information is moving around the health sector.
Furthermore, this first-wave hospital has not yet
conducted a post-implementation review, and nor is
there a timetable for doing so. Given the length of time
that the PFI has been in action at our trust, it is
simplistic and inappropriate to write off the issues we
have raised about contract specification, performance
indicators, monitoring and benchmarking, as ‘teething
problems’ that need not arise elsewhere.
Although our trust interviewees were pleased with the
hospital’s design and construction, it was much smaller
than the facilities that it replaced. The planned
reduction in caseload had not occurred, causing
capacity problems. Although the project aimed to
reduce the duplication of working on two sites, there
was still some fragmentation and duplication.
Furthermore, the expected cost savings had not been
achieved because of the failure to reduce length of stay
and shed the anticipated caseload to other trusts in the
area. Combined with the evidence from the commercial
press cited in the previous chapter and our financial
analysis, this suggests that PFI has the potential to
destabilise the trusts’ financial position if capacity is
insufficient to generate the necessary income to cover
the full costs. Although this problem exists irrespective
of the financing method, the effects become more acute
with the additional costs of PFI and the reduced
flexibility it imposes on the budget.
A number of interviewees provided examples that
suggest that costs of managing the PFI have been far
greater than expected, thereby reducing the actual VFM
compared with that expected in the business case. In
part, this is inherent in the nature of contracting,
particularly in human services that unlike roads are so
difficult to define and operationalise, eg cleanliness. In
part, it is the result of trust inexperience with
contracting. Whereas trust personnel may have
expected that some performance monitoring would be
needed, there was little appreciation of both the extent
and the active nature of the monitoring required, as
opposed to merely checking the performance
measurement systems.
Furthermore, the nature of the changes that have been
made to the contract raise questions about whether the
original comparison between the PFI bids and the PSC
was an equal comparison. Some examples illustrate the
point. If the PSC costing assumed patients would
receive marmalade for breakfast and litter would be
collected, as was the case at the time it was created,
and the PFI bid did not include these costs, then the
FBC did not compare like with like. Similarly, if the
trust obtains more than 10% of any refinancing benefit,
this was not included in the PSC. A 12-bed unit,
additional to the original design, was not costed in the
PSC. In addition, a current member of the trust has
argued that the PSC may have lacked rigour because ‘it
was an option you were never going to do’, throwing
doubt on the methodology of PFI decision-making
processes.
An NHS trust case

PAGE 204
It has become clear that a number of important issues
still need to be resolved in relation to this PFI. These
include: the need for better planning; completion of
monitoring protocols; more streamlined procedures for
negotiating changes to contracts; and the conduct of a
post-project evaluation. The additional costs to the trust
relating to changes in the design, contract changes,
and the cost of double monitoring indicate a need for
careful monitoring of the affordability of this project,
since the payments will have to be made for the
duration of the contract, whatever the impact on the
rest of the trust’s budget.
In addition, there are issues that need to be resolved
over the long term, and an important one is the
question of handover at the end of the contract when
the new build PFI reverts to the trust: ‘Life cycle
investment is identified so that everything is replaced
right up to the last year, so that when we get it, it will
be good as new, and in theory the building is almost
guaranteed not for one year but for 35 years’. This
interviewee nonetheless accepted that within the
concession terms ‘there’s room for interpretation and
debate’. Life cycle replacement also covers important
pieces of equipment throughout the life of the PFI, but
as yet it is too early in our case study for any
experience about equipment replacement to have been
gained.
In this chapter we have sought to present evidence
drawn from interviewees about the practicalities of
implementing a first-wave hospital PFI. Interviewees do
not always share the same experiences about such a
large project. Nevertheless, this case raises important
issues about the complex organisational structures
surrounding PFI in health, especially in relation to the
accountability processes of monitoring performance
indicators. Government advice about the need for
contracts to focus on output specifications has been
shown to be difficult to put into practice, especially in
complex practical situations such as cleanliness in a
dynamic environment.
An NHS trust case

PAGE 205
9. Discussion and conclusions
Our analysis shows that PFI is avery expensive way of financingand delivering public services thatmust, where public expenditure isconstrained, lead to cuts in publicservices and/or tax rises, that is, acut in the social wage.
The partnership model and managing the contract 208
Managing the contract to ensure VFM 211
Risk transfer or risk creation? 213
Reporting and accountability 215
Summary 221
Issues for future research 223
Conclusion 224

PAGE 206
Discussion and conclusions
PAGE 207
Our study has focused on three interrelated issues: the
VFM of implemented projects, the procedures for
managing risk transfer, and the reporting of and
accountability for PFI projects. In this chapter, we draw
together important issues raised in our literature review,
and from our findings from the financial analysis of the
roads and health sectors and the two case studies, in
order to discuss them and present our conclusions.
Although we consider each in turn, there is in fact a
considerable degree of overlap.
PFI is a keystone of the Government’s reform of the
public services and the scale of these projects is
significant. The DBFO projects signed in 1996
represented about 35% of all new construction in the
roads sector between 1996 and 2001, and about 25%
of the £21 billion allocated in the Government’s ten-
year national plan to the strategic highway network will
involve private finance. However, since the eight first-
tranche projects were signed new projects have been
less frequent. In the health sector there has been a
continuous expansion of private finance since the first
health contract was signed in 1997, and by March
2003 there were 148 approved health schemes in
England with a value of some £4.5 billion. Since 1997,
about 85% of the funds for major NHS capital
investment projects have been provided by private
finance. Given the size of the commitment in these two
sectors alone it is not surprising that the Government
should seek to control the Private Finance Initiative.
The development of organisational systems to manage,
support and control the PFI procurement process has
resulted in a complex structure of interrelated
organisations with different roles in relation to advising
and supporting both the relevant public sector and
private sector organisations that form the partnerships.
Owing to a lack of management data, and because
projects are still in the very early years of long-term
contracts, it has not been possible to reach definitive
conclusions about whether VFM has been or is likely to
be achieved. Rather, we have been able to investigate
and evaluate issues that are indicative of the VFM
outcome, using a framework provided by the NAO. The
NAO (1999c) stressed the importance of assessing
whether the contract had adequate incentives,
remedies and safeguards to ensure that the service that
was the subject of VFM appraisal would be delivered to
a satisfactory standard throughout the contract period.
In effect this would be underpinned by:
• adequate arrangements to manage the contract
• suitable bonuses and other incentives for good
performance backed up by contractual sanctions to
deter poor performance from the provider
• arrangements for compensation for poor
performance
• satisfactory termination or handover arrangements
• suitable arrangements for dealing with changing
requirements.
The NAO has recommended that when assessing VFM
it is important to examine the mechanisms and
procedures for monitoring the contract, to identify and
analyse the risks to be transferred and to examine
contingency planning. This has formed the basis of our
case study investigations. In addition, in order to assess
the effects of the policy initiative we have sought, by
way of a financial analysis of the sectors, to reach some
conclusions about the wider reporting and
accountability issues.
In this chapter we begin by presenting our conclusions
about the nature of the partnership model and the
management of the contract as it is evidenced in our
two cases. We then consider the available evidence in
relation to VFM and risk transfer associated specifically
with our two case studies. This is followed by a broader
assessment of our conclusions in relation to the general
financial reporting and accountability issues associated
Discussion and conclusions
PAGE 208
with PFI. After indicating some issues for future
research, we draw some general conclusions about PFI
and accountability.
THE PARTNERSHIP MODEL AND MANAGING THE
CONTRACT
In Chapter 1 we highlighted four potential models of
partnership that PFIs might follow: collaborative,
operational, contributory and consultative. In practice,
our literature review shows that the PAC (1999a) has
identified a failure to work in partnership, especially on
early projects, because of the use of a narrow definition
of responsibilities. In addition, we noted that the
Transport Select Committee (2003) had shown an
inherent conflict within the partnership model because
attempts to build positive partnerships were
undermining the use of appropriate contractual
sanctions to enforce maintenance standards. The NAO
(2003e) has stressed that the relationship should not
be that of customer/supplier but rather should be built
upon a whole-business approach with both sectors
interacting through good governance procedures.
Essentially the NAO has indicated that good contract
management can achieve this.
Our cases suggest that the nature of the relationships
between the public and private sector are not
collaborative partnerships, in which there is a pooling
of equal resources and a relinquishing of autonomy in
pursuit of shared goals. It is probably the case that
both sectors are seeking to achieve operational
partnership in which there is a sharing of work but not
of decision-making authority. There appears to be a
consensus that although partnership is an ideal, it is
not a position that has yet been reached, and
interviewees from both sectors have discussed the need
for changing methods of working in order to achieve
partnership. Essentially the cases provide evidence
about how the partnerships operate in practice, and
they raise several important issues: the legalistic nature
of the concessions, the kind of monitoring systems
chosen to measure performance and the nature of
procedures used to ensure that risk is transferred in the
way that the public sector anticipated.
Legalistic contracts
The intention is that procurers should specify required
outcomes, which form the basis of the contractual
relationship between the partners. Our literature review
indicated that there were concerns about the ability of
contracting parties to write a contract with adequate
outcome specifications and that consequently contract
monitoring and assessment of VFM would prove
problematic.
When the expected outcomes from a contract can be
clearly written, for example the specifications for a
brand new construction, then the private sector has
shown itself capable of delivering on time and to
budget, within the context of PFI. Nevertheless, it
should be noted that the same contracting companies
did not achieve this level of performance under
traditional procurement methods. This success should
be viewed in the context of the pre-negotiating phase,
which typically takes longer under PFI. Nevertheless, in
terms of constructing new assets such as roads or
hospitals, PFI has operationalised an incentive system
and payment mechanism that enables the public sector
to use penalties to control the delivery of new build
projects that it was previously less able to control.
There is no particular evidence that this is due to the
integration provided by PFI of the design, build, operate
and finance elements that make up a large-scale
project. Rather it is due to the writing of a contract that
heavily penalises late delivery and insists that the
quoted price and the final price should match. Such
conditions could equally be applied to projects financed
in the conventional manner, begging the question of
why such conditions were not previously made. The
PFI contract model raises a number of issues.
Discussion and conclusions

PAGE 209
First, late delivery penalties are likely to lead to more
cautious time estimates and to contingency reserves
being included within bids, so there may be a trade-off
between cost and prompt delivery. This is a trade-off
that has been recognised by both the NAO and the
PAC. The NAO (2001d) has noted that arrangements
that give incentives to the contractor to complete on
time and minimise the risk of cost variations to the
department may be an important consideration in the
choice of procurement. In addition, the Department of
Health has acknowledged that certainty on price and
timing of delivery formed part of the decision that the
PFI contract for the redevelopment of the West
Middlesex University Hospital represented VFM (PAC
2003a, para. 6).
Secondly, to the extent that price fluctuations between
the original contract and finished cost previously
represented genuine unforeseen circumstances, such as
unexpectedly adverse ground conditions, then price
rises reflect the holding of risk by the public sector.
Whether the private or the public sector is best able to
carry that risk is a matter for future research. Thirdly, to
the extent that price fluctuations previously represented
the private sector’s recouping of a contract price that
was deliberately underpriced or simply incompetently
priced, tougher contractual terms under either PFI or
conventional procurement may be beneficial in a
competitive environment.
By way of contrast, we found that specifying outcomes
for the service element of the contract is far from
straightforward, particularly in hospitals that rely on
team working and human services that are difficult to
define precisely. Furthermore, the legalistic nature of
the arrangements may place stress on the notion of a
partnership.
• The trust, which had no previous experience of CCT,
had a lack of expertise, which was not evident at the
Highways Agency, in writing the very fine detail of
its requirements for services.
• Since the nature of the contract is that quality
assessment is a matter of judgement, sometimes it
was disputed. In addition, the nature of some
services at the trust is less amenable to specification
and measurement than the engineering type services
relevant to the Highways Agency.
• The trust requires a variety of services that are
provided by different subcontractors that may have
conflicting interests under conditions where the
nature of healthcare requires staff to interact and
work as a team, a task rendered more difficult when
staff are managed by different employers.
• The complex chain of subcontracting through which
the private sector operates means that the
partnership relationship is far from simple and
governed by multiple contracts within the private
sector.
• Amendments to contracts are simple to achieve in
terms of obtaining new services, but negotiations
surrounding appropriate payment mechanisms tend
to be complex, detailed and consequently resource-
consuming for all the contracting parties.
Consequently, the public sector is forming secondary,
consultative relationships to seek legal advice about the
contractual terms that govern the primary relationship.
Our cases show that when it is difficult to write
contractual terms clearly, for example because the
evaluation of outcomes is a matter of opinion or where
responsibility and risk is shared, then the very legalistic
nature of PFI results in time-consuming assessments
and conflicts about the quality of performance. It leads
the public sector to seek expensive legal advice. The
evidence from our cases is that these problems occur in
the operations and maintenance phase of projects
rather than the construction phase.
Discussion and conclusions

PAGE 210
Monitoring systems
Fundamentally, the following factors put the notion of
partnership under strain.
• In both public sector organisations there was a lack
of planning about the types of information systems
that would be needed for monitoring, and
consequently both the Highways Agency and the
trust strengthened and formalised these in the post-
implementation period.
• Although the principle of PFI is that private sector
contractors should be self-monitoring and subject
only to limited checking by the procurer, in practice,
data collection and its monitoring have proved more
problematic than expected.
• The procurer has not always been content with the
quality of information provided by the private sector
and changes have been requested but not always
implemented.
• Active monitoring has been required and therefore
monitoring has been a more onerous task than
expected.
• Additional and significant monitoring costs have
been incurred but the organisations are not able to
put a price on them.
Despite the similarities in the ways in which the
management procedures operated in the two case
organisations, we did identify an important difference in
the nature of the partnerships due to the difference in
the level of previous contracting expertise.
• Previous experience in dealing with private sector
contractors and the pre-existence of written quality
standards in relation to road maintenance appear to
have eased the path of the Highways Agency into
PFI. Such experience was not a feature of our case
hospital trust, although some trusts have had
experience of CCT. Consequently, the establishment of
partnership, and monitoring procedures to oversee
it, has been more complex in healthcare and there is
more conflict between the contracting parties.
• Where the operational aspects of the contracts are
concerned, the hospital trust’s lack of previous
experience means that the balance of power rests
largely with the private sector, whereas this is not
the case with the Highways Agency contract.
Previously the NHS had accumulated a central body
of knowledge about the procurement of new hospital
builds, but under PFI procurement responsibility is at
unit level, that is, with the individual hospital trust.
We argued in Chapter 2 that official advice from
government sources tends to be difficult to put into
practice. The case studies show that this is especially
so when employees lack experience, when outcomes
are difficult to assess objectively, and when contract
terms do not transfer readily into measurable
performance indicators. Sector-specific help on contract
writing has been forthcoming but it does not resolve the
difficulties of writing specifications for complex practical
situations in a dynamic environment. Although the OGC
has recognised the importance of continuity of key
personnel to good-quality management of projects, the
length of contracts means that key role holders will
change. Hence continuity needs to be very carefully
managed and cannot be assumed.
Procedures to ensure risk transfer
Although procedures for ensuring the transfer of risk in
the construction stage seem to have worked in our
cases, at least to the extent that the assets were
constructed on time and to budget, the procedures for
ensuring risk transfer during the operational phase are
more problematic. In part, this was because, as one
trust interviewee explained, their attention was focused
on the asset not the service element of the contract. In
part, this was because the contract may not have
adequately reflected the expectations of the trust. There
Discussion and conclusions

PAGE 211
were instances where the trust believed that the private
partner held the risk in that it was responsible for
certain tasks, but the contract did not in fact transfer
the risk to the private sector partner.
• The difficulty in specifying performance standards
and thus in monitoring and enforcing them also
means that it is difficult to ensure that the payments
deliver the expected level of services. Or put another
way: it is difficult to ensure that costs are transferred
in the way that was anticipated.
• Although it is possible to identify the circumstances
in which risk is probably shared between the private
and public sectors, there is sometimes a lack of
clarity about the proportion of risk that each sector
holds. This means that the division of risk may be
resolved only in the event of service failure, that is,
once it is too late to manage the risk, thereby
creating the potential for additional costs (risks).
• It was noticeable that neither of our case projects
had developed contingency plans for exit strategies
in the event of total failure of the private sector. This
was because there is no concept that such an event
is possible.
In summary, the case studies show that although the
Highways Agency and the hospital trust operate within
a common policy framework for PFI, there are
important sectoral differences as to how management
of the contracts operates, indicating that these PFI
experiences may be present in some but not all sectors.
Broadly the differences relate to variations in previous
experience of contractual relationships, to the greater
technical nature of road building, operation and
maintenance, to the importance of team working in
health, and to the perceived success of the service
provision. The two cases also provide a number of
instances where similar operational issues have arisen
across these two sectors, indicating that such issues
may be found also in other sectors. These relate to
inadequacies associated with: planning; data collection
and monitoring systems; assessment of soft project
objectives; uncertainties about where risk is shared;
performance measurement; and the measurement of
VFM. PFI has made visible poor performance on
delivery in terms of both time and cost (a problem
which afflicted public sector projects), because PFI
should ensure good delivery performance. It is the
contractual penalties that create this good performance,
however, and these are a separate element of PFI.
The result is that although partnership is a relationship
to be aspired to, it has not been achieved in practice.
This is means that it is unclear that the procedures for
managing contracts are capable of delivering the
appropriate levels of service provision, given that it is
almost impossible to specify some services adequately.
But without obtaining this level of service, the public
agency cannot be assured of the balance between cost
and quality that is implicit in VFM.
MANAGING THE CONTRACT TO ENSURE VFM
VFM on individual projects may be achieved in a
number of different ways. Our literature review showed
that competitive forces might not operate to create VFM
because of a lack of bidders, market concentration,
uneven power relationships between the partners, and
the locking-in to an existing provider that has become
associated with PFI. Alternatively, the literature
suggests that reduced costs may be achieved by
reductions in labour costs, but that these savings may
fall elsewhere on the public sector budget. Lack of
competition at the bidding stage has not been a feature
of our cases but there is evidence that additional work
not originally contracted for is locked in. In the trust
case, labour costs are an issue of some concern,
because one of the contractors is finding it difficult to
recruit and retain staff. The implication is that too
much labour cost has been stripped from the supplier’s
bid and that this could adversely affect the quality of
service provision.
Discussion and conclusions
PAGE 212
Much previous evaluation of PFI contracts has focused
on the delivery of the construction phase and in this
respect success has been identified generally, but not
uniformly. There seems to be much less information
about the operational phase of contracts. In general
terms, although both our case contracts have delivered
new construction on time, to budget, and much as was
anticipated, there is some diversity of perception about
the performance of contractors in relation to services.
At the Highways Agency there is broad satisfaction that
the road is well maintained. PFI contracts ensure that
maintenance is carried out and to a prescribed
standard, whereas under the ancien régime,
maintenance suffered when budgets were tight. In
contrast, at the trust there is some concern about the
quality of services, especially the cleaning service. The
literature suggests that our trust is not unique. It is
interesting to note that those responsible for monitoring
the contracts take a different perspective on costs.
Whereas the trust monitors were very conscious of the
costs associated with the service that is perceived as
under-performing, the Highways Agency representatives
with close operational association tended to focus on
performance that is deemed to be successful, without
regard to the associated costs.
From the case studies it is possible to draw a number
of conclusions about the arrangements that exist in
relation to managing the contract so that VFM is likely
to occur.
• At the appraisal stage, projects’ VFM is assessed
against the PSCs, but even in the early days of
implementation the PSCs are not fair comparators
for actual performance because they are not updated
for contract amendments.
• Some contract amendments have been required
owing to the failure to specify the required level of
service accurately enough. This raises questions as
to whether in fact the PSC and PFI options were
comparing like with like.
• In order to measure actual VFM it would be
necessary to make a comparison of the PFI’s whole-
life costs against a fair comparator. However,
because the project lifetimes are so long and so
many changes are made to the initial project
specification there is unlikely to be any meaningful
comparator against which to judge VFM in any
holistic sense. Benchmarking of elements of projects
is possible but at present this is not and cannot be
done in any systematic way.
• At the hospital trust there is a lack of evidence about
quality standards before PFI was introduced so that
current performance cannot be measured against
these in any objective manner. This is a common
problem in human services, as the NAO’s report into
the operational performance of PFI prisons
acknowledged (NAO 2003g).
• Projects may have multiple objectives including
‘softer’ objectives and there is little information
available to enable a formal assessment of whether
these objectives have been achieved. For example,
service user feedback is not systematically
evaluated, but depends upon a complaints-based
system at both the hospital trust and the Highways
Agency.
• The focus of contract incentives is response time
rather than performance per se. The implication is
that contractors are not necessarily penalised for
poor performance, but only for failure to respond to
a problem within a reasonable time once it has been
detected. In the context of the team working
required in hospitals, any failure to deliver the
required level of service and respond in time may
have an adverse impact on the hospital’s
performance and its performance ratings. In the
context of patient choice and financial flows where
money follows patients, poor quality of service may
affect future income.
Discussion and conclusions
PAGE 213
• The additional and unexpected costs of managing
the PFI contracts suggest that VFM is unlikely to be
as high as anticipated.
• The complex web of companies through which the
private sector partner operates imposes extra
monitoring costs and supervision difficulties for the
public sector, particularly in healthcare.
• Payments are made on the strength of data that
have not been subject to monitoring at the trust, and
estimated data for which actual details will never be
available at the Highways Agency.
• Although the residual life of assets after the PFI
contract is complete will affect the eventual VFM,
systems to ensure that residual lifetimes are as
anticipated are not yet in evidence. However,
contract periods on some hospitals have been
extended since financial close to 60 years or more,
begging the question as to whether in fact there is
any intention that the assets should revert to the
public sector.
Advice from official sources recognises the need for
evaluation of projects and the dissemination of results.
Our cases indicate that PSCs, often suggested as a
base for this assessment, quickly become out of date
and are not an appropriate benchmark against which to
measure VFM. Alternative benchmarks need to become
the norm but there is a lack of familiarity in some
quarters about government initiatives to create
comparative databases for this purpose. Although there
is informal person-to-person transfer of PFI-related
knowledge, experience and networking through national
contacts, benchmarking is unsystematic, post-
implementation evaluation of projects is slow and the
dissemination of outcomes is restricted or
unsystematic. Taken together, this means that there are
as yet inadequate arrangements to monitor the
contracts in ways that will ensure they will deliver
VFM.
RISK TRANSFER OR RISK CREATION?
Our literature review shows that risk transfer is a
critical feature of many PFI projects, because without
the inclusion of the cost of risk transfer in the VFM
analysis the PSC has a lower net present cost.
However, the methodology that surrounds the valuation
of risk is problematic. The assessed value of risk
transferred is based on probabilities, but there is an
acknowledged shortage of risk management skill within
the public sector so that the establishment of
appropriate probabilities may be difficult. In addition,
the decision-making methodology uses discounted cash
flows so that the rate of discount applied is critical to
the outcome.
There is a concern also that too much risk may be
transferred to the private sector because of the
technical accounting regulations. If a PFI scheme is to
remain off balance sheet in the public sector –
something that the Treasury is anxious to achieve – it is
necessary to show that risk transfer has taken place.
This is because a strict interpretation of FRS 5
Reporting the Substance of Transactions, the relevant
reporting regulation, would have seen many PFIs
remain on balance sheet, contrary to the wishes of the
Government, since the public sector holds the main
risks, demand and residual risks. At present, 57% of
PFI projects are on the public sector’s balance sheet
(HM Treasury 2003d), rather less than the Treasury
had expected originally. This accounting regulation may
have increased pressure to transfer risk into the private
sector. Some evidence that this is so is provided by the
credit ratings agency, Standard and Poor’s (2002),
which notes that the private sector has been asked to
take on more risk in more recent schemes and implies
that the Government has been willing to support the
extra cost. This conflicts with the fundamental premise
of PFI that the contracting party best able to manage it
ought to hold risk.
Discussion and conclusions

PAGE 214
A number of other risk-related issues have been
identified from our study. First, the assumption that the
private sector is willing and able to carry risk may not
always be well founded, and risk transfer may be
difficult to operationalise in practice. Specifically in
relation to roads, the private sector may be reluctant to
carry risks associated with projects that do not have
statutory approval.
Secondly, although it is argued that demand risk has
transferred in relation to the road projects, the
Highways Agency may still retain the risk. Should
demand change in ways that make it impossible for the
private sector to generate the revenue to spend on
maintenance, then it may not be able to maintain the
road. In such circumstances, given the essential (or in
other cases statutory) nature of the service and the fact
that the public sector retains responsibility for service
provision, then, as our literature review shows, the
public sector must shoulder a cost for a risk which it
thought it had transferred and for which it had already
paid. This means that the public sector retains
responsibility without control.
Thirdly, although it is a fundamental premise of PFI
that risk should be transferred to the party best able to
manage it, which usually means that the public sector
should carry the demand risk, in the case of roads the
private sector is very interested in deals that have some
element of demand risk.
Fourthly, our hospital case study has shown that there
is some confusion as to whether the contract has
transferred risk and responsibility in the way that was
intended or expected by the public sector. In any event,
since there is no information in the public domain
about the level of penalties imposed for poor
performance and little indication from our case studies
that many penalties have been imposed, it is
impossible to assess the degree to which risk transfer
has taken place in practice.
Fifthly, our financial analysis shows that there is a high
premium in respect of the expected risk transfer. At the
6% discount rate, risk transfer varied between 31%
and 85% of road construction costs, with similar and
wide variations for hospitals. It seems unlikely that the
degree of risk warrants such a high cost since, first,
Fitch Ratings (2003) argues that the PPP sector will
remain investment grade and will offer a comparatively
safe haven in times of economic downturn. Secondly,
the companies have been able to refinance their loans
at lower rates of interest and generate an additional
source of profit after the construction phase was
completed.
The National Audit Office (1999a) argued that the
companies’ cost of capital above that of public sector
debt costs reflected project risk. Our financial analysis
showed that the risk premium was about six and five
percentage points above the cost of Treasury gilts for
roads and hospitals respectively. Although the
Highways Agency reports its PFI assets as on balance
sheet, most of the trusts do not, implying that the
Highways Agency has transferred less risk than the
trusts. Despite this, our analysis shows that both
projects very quickly earned high post-tax returns on
shareholders’ funds. The actual risk is very limited and
hardly commensurate with their abnormally high
returns. Taken together, our evidence shows that risk
transfer, the fundamental component of VFM, has
proved very expensive.
As well as the problems and cost of risk transfer, PFI
may create additional risks. First, the PAC considered
risk creation to be an outcome of the demand risk
transfer in roads. It made the following
recommendation with regard to the first four design,
build, finance and operate roads contracts (PAC
1998d, Recommendation 3):
Departments should consider carefully the implication
of basing payments to operators on volumes of activity
over which neither the public sector nor the operators
Discussion and conclusions

PAGE 215
have any effective control. In the case of these four
contracts, payments to operators are based primarily
on traffic volumes which are, however, notoriously
difficult to forecast. In other words, the Agency have
created a risk which is borne by the operators and
which can be expected to increase their costs. PFI can
deliver better value than traditional methods of
procurement if risks are transferred to the parties best
able to handle them. But it is a mistake to confuse
risk transfer with risk creation, which is simply likely
to increase costs to the taxpayer.
Secondly, the corporate form (the SPV), typically a shell
company with no employees, and the complex web of
subcontracting through which the private sector
operates serve to minimise the SPV’s risk. Because
each contract is held by a separate SPV, whose only
activity is the PFI project, there is no cross subsidy
between projects. Although this serves to isolate the
private sector’s risk, it also generates extra costs and
creates additional risk for the public sector. Extra costs
are created by the monitoring required to ensure
service delivery across a range of subcontractors.
Additional risk is created because should the SPV fail
financially, for whatever reason, it has no recourse to its
parent companies. Thus the SPV can walk away from a
PFI contract without jeopardising the position of the
parent companies. Given that the SPV’s debts are
underwritten by the government, either de jure or de
facto, the parent companies that have provided the
loan finance are protected. This places the SPV in a
very powerful position in relation to the public sector
purchaser.
Thus, to conclude, it is unclear that risk is transferred
in the way anticipated at financial close. Some risks
have been transferred to parties that are not best
placed to manage them. Even more importantly, PFI
has generated additional risks to the purchaser, the
public sector as a whole, and service users that were
not predicted and/or quantified when the VFM
comparison was undertaken. This means first, that the
VFM comparisons did not compare like with like and,
secondly, the projects are unlikely to achieve the risk
transfer that provided the original justification for both
the project and the policy.
REPORTING AND ACCOUNTABILITY
In this section we present our conclusions relating to
the publicly available information for these two sectors.
Before so doing it is worth making the general point
that information is not easy to obtain, even in some
cases where it is intended to be in the public domain.
Much remains hidden behind the cloak of ‘commercial
confidentiality’. Although the NHS has released more
financial information than the Highways Agency, it is by
no means adequate. This lack of transparency exists at
Treasury, departmental, purchaser and contractor level.
Considering first the reporting of PFI at government
level. First, even the most basic data showing the
number, size and cost of PFI projects are difficult to
collect. For example, numerous government sources
produce information in ways that do not reconcile.
Secondly, it was impossible to produce a table showing
the amount of PFI and non-PFI expenditure on a
departmental basis for each year since the policy was
introduced. Thirdly, it is almost impossible to ascertain
PFI expenditure as a proportion of total public capital
expenditure. This is because although the Treasury
produces a list of all signed deals, dates and their
capital values on a departmental basis, we could not
find a comparable list of non-PFI or even total capital
expenditure reported on a departmental basis. In
addition, it is not clear that the government records all
IT PFI projects as PFI capital expenditure, since it
maintains it is purchasing services not assets. Certainly,
the Treasury list was not complete, eg the Home Office
did not show the problematic Criminal Records Bureau
project. Furthermore, PFI will not be scored as
government expenditure if the underlying asset is off
the government’s balance sheet. Since the statistics do
not identify whether the asset is on or off the
Discussion and conclusions

PAGE 216
government’s balance sheet, the ratio of public to non-
public capital expenditure is impossible to calculate.
Fifthly, it is impossible to find out, in a systematic way,
the public sector’s expected annual payments on a
project basis (since the full business cases setting out
the financial costs are not in the public domain for
reasons of ‘commercial confidentiality’) or even on a
departmental basis. However, the Treasury does
produce aggregated data that suggests that future
commitments now constitute about 3% of
departmental expenditure (excluding welfare
payments). Finally, despite the fact that central
government is known to guarantee the Highways
Agency’s payments to the private sector and
presumably its other contracts, and implicitly to do so
in healthcare, the departmental accounts make no
mention of such future commitments.
Although the use of parliamentary questions has
elucidated some information (Health Select Committee
Memorandum 2000), this is a cumbersome route that
provides data on an ad hoc basis only and has limited
visibility. Thus it only serves to highlight not resolve the
problem.
At purchaser level, despite a considerable amount of
information about DBFO in general, the Highways
Agency’s reporting of its DBFO payments was missing
for three years and was then very limited. Although the
trusts put their summary accounts on their websites,
these do not contain any financial information relating
to PFI. Some trusts required frequent reminders to send
financial statements. In the context of stakeholder
reporting, the research team, all of whom are UK tax
payers, was also surprised to be charged for a hard
copy of the accounts of one hospital trust. In addition
the financial information in both sectors lacks clarity,
the message from annual reports is opaque and
consequently public accountability is reduced.
Information that was promised by other public bodies
was not always forthcoming. Although none of this was
necessarily a deliberate attempt to reduce public
accountability, it does mean that only the persistent are
successful. There is no information in the notes to the
accounts explaining the performance levels, payments,
any deductions for poor performance, or why payments
were higher than expected at financial close or even the
previous year, or any contract renegotiations. Neither is
there an explanation for the accounting treatment of the
PFI assets and liabilities and any changes that have
occurred. A further point relates to the reporting of the
operation of the contracts. Neither sector provides any
financial or other reporting on how satisfactorily or
otherwise the contract is operating. Yet this information
is crucial for assessing the degree to which the
contracts provide incentives for the private sector
partners to deliver the appropriate level of service and
thus achieve risk transfer.
The reporting of PFI transactions by companies wholly
dependent upon public funding is opaque in the
extreme. The ability to hide behind the ‘corporate veil’
means that related party transactions and the full
extent of the financial gains made out of PFI are not
disclosed. This is not a small matter since our evidence
shows that, at least in the roads sector, a significant
proportion of the payments made by the Highways
Agency constitute additional costs that would not be
borne under conventional procurement. There is a lack
of open book accounting that would enable the
purchasing agency to trace the contractors’ costs and
profits. In both sectors, the purchasing agencies were
unaware of the extent of the financial gains made by
the private sector out of their PFI contracts, particularly
by the related parties.
In short, there is a lack of consistent and useful data
about the extent of private finance in public services at
project, programme or policy level, making it difficult to
analyse the efficacy of private finance and its wider
implications. The reporting of PFI is not simply a
question of the annual revenue cost, although this is
not insignificant. More importantly, it is about the
present Government’s implicit debt levels and future
Discussion and conclusions

PAGE 217
commitments under long-term contracts that have the
effect of binding future government administrations and
of creating ring-fenced resources within departmental
budgets. Such commitments have the potential to
destabilise the financial viability of purchasing agencies
and squeeze out other public sector activities. In
addition, there are sector-specific issues that reflect the
same lack of accountability in relation to private sector
profits and the scale of the Government’s financial
dealings, as our literature review found to be the case
in Australia.
The roads sector
PFIs have been used to improve, widen and build new
road length and structures so that, unlike the health
sector, PFIs have inserted new capacity into the
system. Compared with the health sector, where
according to the IPPR (2004), the NHS has a better
framework than central or local government for
releasing information to the public, there is less
information about DBFOs in the public domain. For
example, the full business cases are not available in
roads and there is less public information about
contract values and payments. It is important to
recognise that this is government-imposed secrecy. As a
consequence, there has been less empirical evaluative
research. No one at the Treasury, the DoT, the
Highways Agency or the National Audit Office has
carried out a post-implementation evaluation of the
VFM obtained under DBFO.
Financial reporting within the private sector is opaque,
from a public accountability perspective, because of the
complexity of the web of companies that make up the
SPV and the contracting organisations. The SPV
normally lets the operational contracts to the
companies that own it, and so transactions and transfer
prices need not be at arm’s length. Consequently it is
difficult to measure the total returns on capital and to
assess the cost to the public of paying for that return.
Moreover, as we noted earlier in the literature review,
the PAC has called for a review of contractors’ returns
earned on PFI projects (PAC 2003d). To do this,
however, it would be necessary for the NAO as the
external auditor to exercise its ‘right to roam’ through
these organisational structures.
The analysis in Chapter 5 shows a high cost of capital
in the SPV, which is likely to be an underestimate
because of transfer pricing between the SPV and its
contractors, and indeed our analysis suggests that the
contractors have higher profits on PFIs than on other
contracts. The private sector parent organisations may
profit from the DBFO in different ways, including an
equity stake in both the SPV and subsidiary
organisations that carry out work and from interest on
any loans to the SPV. We have made the following
estimates.
• The Highways Agency pays about £210 m a year
based largely on the amount of (rising) traffic flows.
• For the first three years, the Highways Agency did
not report its DBFO payments and could not make
such information available to the research team.
• In the subsequent three-year period, the Highways
Agency has paid more than the initial capital cost of
£590 m on the first eight projects, so that in effect
the remaining payments on the 30-year contract
worth about £6 billion in total are for risk transfer, the
cost of finance, operation and maintenance.
• Finance costs are in the order of three times the
initial construction cost and one third of the total
£6 billion cash cost of the projects.
• 68% of the DBFO companies’ receipts from the
Highways Agency is operating profit, in effect the
public sector’s effective cost of using private finance.
And even this is an underestimate since this figure
relates to operating profits after deductions of
payments to their subcontractors, usually sister
companies.
Discussion and conclusions

PAGE 218
• About 35% of the payments made by the Highways
Agency actually go towards the operation and
maintenance of roads.
• In so far as the Highways Agency is pleased with the
operation and maintenance of the roads under
DBFO, this appears to be because there has been
adequate financial provision within the contract for
this.
• The Highways Agency is paying a premium of some
25% of construction cost to ensure the project is
built on time and to budget.
• Although the Highways Agency’s payments of about
£210 m per year are set to rise because of the
payment profile and rising traffic volumes, future
payments are not disclosed in ways that identify
these factors.
In addition, the payments profile raises some cause
for concern. Although the payment mechanism may
include a higher payment in years in which significant
repairs are expected, the volume-based nature of the
toll means that payments are also front loaded and
consequently money that should be applied to
maintenance is held in the private sector. There is no
ring-fencing of that resource within the private sector
(so for example one company made an interest-free
loan for an indefinite period to its parent company),
nor is there a requirement that the monies be set
aside in, say, an escrow account for future
maintenance. This creates risk for the taxpayer, who
may be faced with paying a second time for
maintenance, if for any reason the private sector is
unable to pay.
Several other reporting issues have been identified.
• There is no reporting of any deductions for poor
performance.
• In the 1999/2000 Highways Agency accounts,
seven of the eight first-tranche projects were off
balance sheet, although intangible assets
representing the reversionary interests were
recognised. Subsequently, the Agency has had to
change its accounting policy and in 2000/1 all eight
projects were on balance sheet for construction costs
together with associated long-term and short-term
creditors. The Agency has indicated that it will
continue to look for risk transfer to ensure that future
DBFO contract liabilities are off balance sheet, and
that it has developed a strategy for taking a view on
the accounting treatment before contract award
(Highways Agency 2003). Although the Agency
accepts that the accounting treatment should not be
an aim in itself, this suggests that there is pressure
to transfer risk for accounting purposes without
considering which party is best able to carry the
risk.
• Although the Highways Agency’s payments to the
SPVs are guaranteed by the government there is
little transparency about future payments,
obligations and the implications for public
expenditure.
• There is no reporting of how much DBFO is costing
the public sector as a whole. For example, under
DBFO, the complex reporting web of SPVs and
related companies makes it impossible to tell what
the true rate of tax is.
In conclusion, the road projects appear to be costing
more than expected as reflected in net present costs
that are higher than those identified by the Highways
Agency (Haynes and Roden 1999), owing to rising
traffic and contract changes. It is, however, impossible
to know now whether or not VFM has been or is likely
to be achieved, because the expensive element of the
service contract relates generally to maintenance that
will not be required for many years.
Discussion and conclusions

PAGE 219
The health sector
The PFI has been used to build new hospitals and
refurbish existing ones and to operate and maintain the
estate. Compared with the roads sector, there is more
information in the public domain, particularly in
relation to the business cases used to support the case
for PFI. However, health sector PFIs are also more
complex to understand because:
• PFI contracts are at various different stages of
completion
• data are available at unit level as opposed to agency
level
• there is considerable and continuing restructuring
within the sector and the PFI hospitals, which
creates organisational change
• the sector is more politically charged and highly
visible and the environment is confused by issues
such as waiting lists and patient flows and
• the issues around performance and its measurement
are more subjective.
The financial statements of our trust case were not easy
to interpret over the relevant period because a number
of related and significant transactions were booked to
fixed asset, debtor, creditor and income accounts.
Given that these transactions crossed more than one
year and were linked to transactions with the relevant
primary care trusts (PCT) and the Department of
Health, they act to disguise the effects of PFI from all
but the trained reader, who will probably also need
additional information from the trust. We experienced
the same difficulties with the complex SPV accounts as
were evident in the roads sector, but nevertheless the
following issues have been identified.
• The annual cost of about £205 m for our trusts is
likely to rise because of the contractual
arrangements. These include increases for inflation,
volume increases and contract amendments and
additions.
• Because the effects of PFI are not separated from
other means of procurement, it is impossible to
identify, from information in the public domain, the
current or long-term service and finance
commitments being made under PFI.
• New additions to contract may not be subject to
benchmarking, raising questions about the power of
the contractors to charge higher than normal prices.
• Returns to contractors are higher than typically
available under their conventional business
contracts.
• The contracting companies also benefit from user
charges for parking, patients’ televisions and
telephones, retail concessions and catering in ways
that are not transparent. This underestimates the
revenues to the SPVs’ subcontractors, lost revenues
to the trusts and/or the additional costs to staff and
patients.
• Although the Government does not guarantee the
payments, as it does for the roads projects, it did
issue a letter of support to investors in the case of
the Meridian hospital, which the credit ratings
agency believes to be almost as good as a formal
government guarantee.
Two technical accounting issues have been identified
which have practical implications for the management
of trusts in the future. First, revenue expenditure
associated with PFI is allocated between different
budget lines of the standard operating expenses.
Although traditional costing patterns are likely to be
used where possible, any PFI revenue cost that cannot
be readily allocated will be recorded in the category
‘other expenditure’. Consequently, although each trust
Discussion and conclusions

PAGE 220
is likely to maintain comparability across time, cross-
sectional analysis between trusts may be distorted if
trusts account for PFI on different lines.
This distortion has the potential to invalidate the
system of National Reference Costs, which is to be
used as the basis for paying the trusts on a fee per
service basis whereby money will follow patients after
2007. This is an important issue in relation to future
funding because any hospital that has costs running
above the National Reference Cost benchmark could
lose income. Since the trusts are committed to paying
the SPVs for the duration of the contract, they must
seek to increase their income either from the local
PCTs, which must therefore divert income and patients
to the PFI hospitals (although how this will be possible
under ‘patient choice’ is unclear), and/or cut other
services.
Secondly, our analysis of 13 schemes that are
operational shows that nine are off balance sheet and
four are on balance sheet, but that in at least one case,
Bromley, there has been a change in accounting policy,
because a scheme that was intended to be off balance
sheet was eventually included in the balance sheet. It is
important to recognise that the off balance sheet
treatment may have consequences for managing the
trust’s budget. In our case trust, the PFI element for the
new build is an operating lease in its accounts, and an
annual transfer into tangible fixed assets is made which
cumulatively builds up to the expected valuation of a
hospital, taking into account its expected residual life at
the end of the contract. This asset, like other trust
assets, is revalued using a national indexation formula,
which is fine-tuned for local conditions by the District
Valuer on a five-year cycle. The timing of these
revaluations can be critical to the trust, especially if
they fall late in the financial year, because a sudden
upward movement reduces the trust’s ability to meet its
financial target. In cases like this the implication of the
PFI transfers to fixed asset accounts is that they
increase budgetary uncertainty.
Our literature review indicated that there is little
attention paid in evaluation studies to the question of
project affordability in the long term at either trust or
NHS level. Our analysis suggests the following
important issues.
• In some cases PFI charges are higher than expected
at the decision-making stage only a few years earlier
(Health Select Committee 2000). Although a feature
of PFI contracts was supposed to be that costs
would be fixed and determined by the contract, the
contract provides numerous ways of increasing costs
to the trusts. This undermines the reliability and
validity of the VFM case, which in any event showed
that the financial advantage of PFI was very
marginal.
• It is likely that our trust was dissatisfied with some
aspects of the operational phase of the contract
because it is simply not possible to provide the level
of service required at the contract price. Any further
efficiencies would have to be made over and above
the hospitals’ repeated ‘efficiency savings’ over the
last 20 years as others have acknowledged (Arthur
Andersen/LSE 2000).
• The cost of capital for trusts rises with PFI. When
the cost of capital rises, then labour, the main cost,
must be cut. Any labour cuts could threaten the
ability of the trusts to process the necessary
throughput either to meet the Government’s waiting
list targets or to generate sufficient income, thereby
threatening the trusts’ financial viability.
• Six out of the 13 trusts we analysed are in deficit.
Four of the nine trusts with off balance sheet PFI
projects and two of the four trusts with on balance
sheet PFI projects had significant net deficits after
paying for the cost of capital.
Discussion and conclusions

PAGE 221
• Assuming that the financial performance of trusts is
a proxy for affordability, then it is disconcerting that
hospitals with PFI contracts are more likely to be in
deficit in 2002/3.
• We estimate that the additional capital costs of the
new hospitals, which are smaller than the ones they
replace, took about one quarter of the increase in
the trusts’ income between 2000 and 2003. In
other words, a significant proportion of the new
money is not going to front-line services.
• The total cost of PFI to the public sector is unclear.
It includes the ‘leakage’ of the capital charge
element contained in the trusts’ budgets – at least
£125 m a year – that would normally be recycled
within the healthcare economy, and the capital
allowances that reduce the SPVs’ tax.
Although the Government maintains that costs under
PFI are fixed and contractually determined in ways that
reduces uncertainty, this is misleading. There has been
contract cost ‘drift’. PFI charges have risen more than
expected in five trusts and are expected to increase for
at least three more. This indicates that within a very
short time these projects have turned out to be less
economical than those who prepared the supporting
business cases expected.
Taken together, this financial analysis shows that some
of the contracts have turned out to be more expensive
than expected at financial close. Furthermore, since
these are all long-term projects, it is impossible to know
how the contracts will perform over the entire life cycle.
In so far as they are costing more than expected, this has
an impact on the individual trusts and the wider NHS
budget that must affect both staff and patients.
SUMMARY
Our findings may be summarised under three headings:
financial performance and accountability; partnership
and managing the contract; and value for money and
risk transfer.
Financial performance and accountability
• Financial information about PFI is opaque, partly
because of government-imposed confidentiality,
which especially restricts access to business cases in
the roads sector.
• Private sector organisations use complex structures
that involve close company status and related party
transactions that are thus not disclosed, the result
being that returns on PFI projects are disseminated
between various entities and are thus disguised.
• In both sectors some PFI projects are accounted for
on balance sheet but others are off balance sheet
and there has been a change in accounting policy in
some projects. In addition, accounting across the
private and public sectors may not be symmetrical,
for example, the Worcester Hospital scheme is off
the balance sheet of both the public and private
sectors.
• The relationship may not be causal but the
propensity for trusts with PFIs to be in deficit is
greater than the current national average.
Partnership and managing the contract
• Partnership is an aspiration rather than a description
of the actual working relationship between public
and private contracting parties.
• Planning of the performance monitoring systems has
been poor and has led to an increased workload
once the projects have been implemented.
Discussion and conclusions

PAGE 222
• Self-monitoring systems require high levels of trust
that are not always present, and public sector
partners are conducting more monitoring activities
than was expected.
• Outcomes that are subjective in nature are difficult
to write in contractually effective ways, and cause
monitoring difficulties.
• Contingency plans should be identified at least in
principle for all large-scale PFIs against the
possibility of default by the private sector.
Value for money and risk transfer
• Measuring VFM against the PSC is inappropriate
because it quickly becomes out of date.
• Soft project objectives may not be evaluated and
user opinions about service are not always sought.
• Additional monitoring costs have reduced VFM
compared with the original expectations.
• Transactions and monitoring costs have a fixed
element and, consequently, small projects may be
unsuitable for PFI. Indeed, more recent health schemes
have tended to be larger than those in the first wave.
• Where risk is shared between partners its allocation
may be unknown and therefore its transfer is
uncertain.
• In roads, demand risk is held by the private sector
but this may create a new source of risk because the
private sector cannot control demand.
• In practice, the government appears to retain
ultimate responsibility for the SPVs’ debt, which is
higher than the cost of the assets and carries the
burden of higher interest rates, since payments are
guaranteed either explicitly or implicitly.
• There is a lack of ring-fencing of profiled annual
payments so that in the event of a private sector
failure, money intended for future maintenance may
be lost.
In the study we have followed recommendations by the
NAO (1999c) for examining the procedures put in
place by the agencies to monitor the contract, risk
transfer and contingency planning. We have identified
areas in which change has been needed and
implemented within the sectors, but also areas where
problems remain. Monitoring of performance where its
assessment is subjective is problematic. Risk transfer is
not always certain especially when it is shared and
there is a lack of detailed contingency planning for
ultimate failure.
The net result of all this is that although risk transfer is
the central element in justifying VFM and thus PFI, our
analysis shows that risk does not appear to have been
transferred to the party best able to manage it.
Furthermore, rather than transferring risk to the private
sector, PFI has, first, created additional risks to the
public agency and the public sector as a whole that
must increase costs to the taxpayer and/or reduce
service provision, a travesty of risk transfer. Secondly,
PFI has generated extra costs to hospital users, both
staff and patients, and to the Treasury, through tax
concessions and the leakage of the capital charge
element in the NHS budget, in ways that are neither
transparent nor quantifiable. Thus, inadequate financial
reporting means that it is impossible to demonstrate
whether or not VFM has or indeed can be achieved in
these or any other projects.
Although the Government’s case rested upon value for
money, including the transfer of risk, PFI is likely to
lead to a loss of benefits in kind and a redistribution of
income, from the public at large to the corporate sector.
It has boosted the construction industry, whose PFI
subsidiaries are now the most profitable parts of their
enterprises, and led to a major expansion of the
Discussion and conclusions

PAGE 223
facilities management sector. The principle
beneficiaries, however, are likely to be the financial
institutions whose loans are effectively underwritten by
the taxpayers, as evidenced by the renegotiation of the
Royal Armouries PFI (NAO 2001a).
Finally, two points should be made. First, the
Government, by focusing on the need for private
finance to modernise Britain’s ageing infrastructure and
on concepts as ambiguous as value for money and risk
transfer, made the distribution issue invisible in order to
justify a deeply unpopular policy. Secondly, the
inadequate financial reporting of and lack of
accountability for PFI serves to obscure what the
Government does not wish to reveal.
ISSUES FOR FUTURE RESEARCH
From the sectoral analysis and the two case studies we
have explored in this work, it is possible to identify a
number of future research projects. These include the
following.
• Given that the contracts are written for very long
periods of time, it would be useful to carry out
another financial analysis of the two sectors,
particularly in health, when the schemes have
settled down. Furthermore, longitudinal case studies
that track changing relationships between the
contracting parties are necessary because sectoral
and contract-specific issues change over time.
• Risk transfer, the main component of VFM, is critical
if the public sector is to approve a PFI/DBFO
contract. But less risk transfer implies a lower rate of
return to the private sector, and that the project will
be on balance sheet in the public sector. An
extended financial analysis as projects mature
should make a comparison of the rates of return
between on and off balance sheet schemes.
Although we have indicated that measuring the VFM
of projects is problematic, it would be interesting to
compare the financial performance with any
available evidence about VFM or the procurers’
perceptions about the success or failure of projects.
• Demand risk is carried by the private sector in
roads, but owing to increasing traffic volumes
nationally it is possible that there is little real
downside risk. An analysis of forecast against actual
volumes across all roads PFIs would be interesting.
• There are a number of issues in relation to asset
values worthy of future research. For example, our
hospital trust is concerned about the proposed
changes to the way in which assets are to be
accounted for, since it estimates that under the new
rules, whereby control will create an asset, it is likely
to see a significant rise in its asset base. The
concern is that this will create problems in relation
to its external financing limit and its ability to meet
its financial target. A sectoral assessment of the
effects of this change in accounting regulation might
influence policy. In addition, the SPV for our roads
project indicated that it had some concerns about
the valuation and depreciation of the roads asset. A
further issue relates to the basis of valuation and the
reporting of construction values in both the
purchasing agency and the Government’s accounts.
Finally, although symmetry between the accounting
for the assets provided by PFI across the private and
public sectors is not currently required, empirical
evidence about the nature of the differences would
be of interest to regulators.
• We have no evidence of a causal relationship but our
analysis shows that 6 out of 13 hospital trusts with
PFIs are in deficit for the current financial year, and
that this is a higher proportion than the national
average, measured using the most recent available
statistics. Further investigations of any association
between PFI projects and trust deficits tracked over
time are needed. Similarly, the implications of such
deficits on the local healthcare economy (the
Discussion and conclusions

PAGE 224
primary care trusts and acute hospital trusts) need
to be examined.
• Although it is possible to draw very general
conclusions about the distributive implications of the
policy, more detailed research is needed to quantify
the impact on public expenditure, the financial
stability of the public agencies that are using PFI,
the performance and outputs of such agencies, the
SPVs and their financial backers.
• Given that PFI/PPP is new way of delivering public
services that blurs the lines between the public and
private sector, further research is needed to examine
the degree to which the current forms of financial
reporting, corporate governance and ownership
structures, particularly in the context of
internationalisation, provide accountability to the tax
payers and service users. The implications for
national accounting also need to be considered since
PFI, like pensions commitment, climate change, etc,
creates implicit debt for governments.
CONCLUSION
As we stated earlier, our concept of accountability in
the context of public expenditure on essential public
services implies that, first, citizens or at least their
political representatives, the media, trade unions,
academics, etc can see how society’s resources are
being used, and secondly, that no members of that
society are seen to have an explicitly sanctioned unfair
advantage over others in relation to how those
resources are used. These two axioms are of course
intimately related. With respect to the first point, the
difficulties experienced by the research team in
obtaining and interpreting the financial statements of
the relevant parties do not generate much hope that
patients, road users, tax payers and other citizens can
see how society’s resources are being used. It is
significant that more information is made available by
both the companies and the Government to the capital
markets than to the public at large. Within the financial
statements there is little information about the impact
of PFI contracts on the performance of the procurer,
and there is a build-up of commitments and implicit
guarantees within very long-term contracts about which
there is little transparency. With respect to the second
point, our analysis shows that PFI is a very expensive
way of financing and delivering public services that
must, where public expenditure is constrained, lead to
cuts in public services and/or tax rises, that is, a cut in
the social wage. In contrast, the chief beneficiaries are
the providers of finance and some of, though not
necessarily all, the private sector service providers,
leading to a redistribution not from the rich to the poor
but from the mass of the population to the financial
elite. In short, PFI does not pass the accountability
test.
Discussion and conclusions

PAGE 225
Abadie, R. and Larocca, D. (2003), ‘Streets Ahead –
PPP Road Schemes Lead the Way’, Project Finance
Yearbook 2002/03 (Euromoney Publications).
Accounts Commission (2002), Taking the Initiative:
Using PFI Contracts to Renew Council Schools
(Edinburgh: Audit Scotland).
Accounting Standards Board (1994), FRS5: Reporting
the Substance of Transactions, Accounting Standards
Board (London).
ASB (Accounting Standards Board) (1998),
Amendment to FRS 5: Reporting the Substance of
Transactions – The Private Finance Initiative and
Similar Contracts (London).
Accounting Standards Committee (1984), Statement
of Standard Accounting Practice No. 21 Accounting
for Leases and Hire Purchase (London).
Akintoye, A., Taylor, C. and Fitzgerald, E. (1998), ‘Risk
Analysis and Management of Private Finance Initiative
Projects’, Engineering Construction & Architectural
Management, Vol. 5, No. 1, pp. 9–21.
Appleby, J. and Coote, A. (2002), Five-Year Health
Check: A Review of Health Policy 1997–2002
(London: King’s Fund).
Arruñada, B. (2000), ‘Audit Quality: Attributes, Private
Safeguards and the Role of Regulation’, The European
Accounting Review 2000, Vol. 9, No. 2, pp. 205–24.
Arthur Andersen and Enterprise LSE (2000), Value for
Money Drivers in the Private Finance Initiative,
(London: Treasury Taskforce). [online report]
<www.treasury-projects.gov.uk/series_1/Andersen>,
accessed 02 August 2000.
Audit Commission (2000a), Aiming to Improve the
Principles of Performance Measurement (London).
—— (2000b), On Target: The Practice of Performance
Indicators (London).
—— (2001), Building for the Future (London).
—— (2003), PFI in Schools: The Quality and Cost of
Buildings and Services Provided by Early PFI Private
Finance Initiative Schemes (London).
Auditor General Western Australia (1997), Private Care
for Public Patients: The Joondalup Health Campus,
Report No. 9 (Perth).
Ball, R., Heafey, M. and King, D. (2003a), ‘Risk
Transfer and Value for Money’, Public Management
Review, Vol. 5, No. 2, pp. 270–90.
—— (2003b), ‘Some Lessons from Using PFI for
School Building Projects’, Local Government Study, Vol.
29, No. 2, summer, pp. 89–106.
Barclays Capital (1998), Meridian Hospital Company
Plc, Initial Public Offering Circular (London).
Bates, M. (1997), Review of the PFI (Private/Public
Partnership) Process (London: HM Treasury).
Boase, J.P. (2000), ‘Beyond Government? The Appeal
of Public-Private Partnerships’, Canadian Public
Administration, Vol. 43, No. 1, p. 88.
Boyne, G., Gould-Williams, J., Law. J. and Walker, R.
(2002), ‘Plans, Performance Information and
Accountability: The Case of Best Value’, Public
Administration, Vol. 80, No. 4, pp. 691–710.
Broadbent, J. and Laughlin, R. (2002), ‘Accounting
Choices: Technical and Political Trade-Offs and the UK’s
Private Finance Initiative’, Accounting, Auditing and
Accountability Journal, Vol. 15, No. 5, pp. 622–54.
References

PAGE 226
—— Gill, J. and Laughlin, R. (2003), The Private
Finance Initiative in the National Health Service:
Nature, Emergence and the Role of Management
Accounting in Decision Making and Post-Project
Evaluation (London: Chartered Institute of Management
Accountants).
Catalyst Healthcare (Worcester) Holdings Ltd (2002),
Annual Report and Accounts 2001 (Worcester).
Cabinet Office (2000), Successful IT: Modernising
Government in Action (London).
Centre for Public Services (2002), Privatising Justice:
The Impact of the Private Finance Initiative in the
Criminal Justice System (Sheffield).
Collyer, F. (2001), ‘Port Macquarie Base Hospital’ in
Collyer, F., McMaster, J. and Wettenhall, R. (eds.),
Public Enterprise Divestment: Australian Case Studies
(Suva: The University of the South Pacific).
Cutler, T. and Waine, B. (1997), Managing the Welfare
State (Oxford and New York: Berg).
Deakin, N. and Walsh, K. (1996), ‘The Enabling State:
The Role of Markets and Contracts’, Public
Administration, Vol. 74, Spring, pp. 33–48.
Debande, O. (2002), ‘Private Financing of Transport
Infrastructure: An Assessment of the UK experience’,
Journal of Transport Economics and Policy, Vol. 36,
Part 3, September, pp. 355–87.
Deloitte and Touche Corporate Finance (2001), London
Underground Public-Private Partnership – Emerging
Findings (London: Transport for London).
DoH (Department of Health) (2000), Sold on Health
(London).
—— (2002a), Good Practice Guide: Learning Lessons
from Post-Project Evaluation (London).
—— (2002b), Improving PFI Procurement (London).
—— (2004), Progress of New Hospital Schemes
approved to go ahead [online spreadsheet] <http://
www.dh.gov.uk/assetRoot/04/09/03/37/
04090337.xls>, (accessed 8/12/03).
DoE (Department of the Environment) (1995), Digest
of Data for the Construction Industry, 2nd edition
(London).
—— (1996), Digest of Data for the Construction
Industry, 3rd edition (London).
—— (1997), Digest of Data for the Construction
Industry, 4th edition (London).
DoT (Department of Transport) (2003), Transport
Statistics Great Britain: 2002 (London).
DETR (Department of the Environment, Transport and
the Regions) (1998), Digest of Data for the
Construction Industry, 5th edition (London).
—— (1999), Digest of Data for the Construction
Industry, 6th edition (London).
—— (2000a), Construction Statistics Annual – 2000
(London).
—— (2000b), Transport 2010: The 10-Year Plan
(London).
DTI (Department of Trade and Industry) (1993), Paying
for Better Motorways (London).
—— (1994), Design Build Finance Operate
Concessions for Trunk Roads and Motorways (London).
References

PAGE 227
—— (2001), Construction Statistics Annual – 2001
(London).
—— (2002), Construction Statistics Annual – 2002
(London).
—— (2003), Transport Statistics Great Britain: 2002
(London: The Stationery Office).
Edwards, P. and Shaoul, J. (2003), ‘Partnerships: For
Better, for Worse?’, Accounting, Auditing and
Accountability Journal, Vol.1 6, No. 3, pp. 397–421.
Egan, J. (1998), Rethinking Construction (London:
Office of the Deputy Prime Minister).
Estache, A., Romero, M. and Strong, J. (2000), ‘Toll
Roads’, World Bank Policy Research Working Paper,
No. 2387 (Washington DC: World Bank).
Fitch Ratings (2003), PPP-PFI: UK Market Trends and
Fitch Rating Criteria for European PPP Transactions
(London).
Flyvjberg, B., Bruzelius, N. and Rothengatter, W.
(2003), Megaprojects and Risks: An anatomy of
ambition (Cambridge: Cambridge University Press).
Freeman, P. (2004), Evaluating Project Performance in
Transport Projects in Developing Countries:
Presentation to Transport Research Congress, Istanbul,
July (Washington, DC: World Bank).
Freedland, M. (1998), ‘Public Law and Private Finance
– Placing the Private Finance Initiative in a Public Law
Framework’, Public Law, summer, pp. 288–307.
Froud, J. and Shaoul, J. (2001), ‘Appraising and
Evaluating PFI for NHS Hospitals’, Financial
Accountability and Management, Vol. 17, No. 3,
August, pp. 247–70.
Gaffney, D. and Pollock, A. (1997), Can the NHS
afford the Private Finance Initiative? (London: British
Medical Association, Health Policy and Economic
Research Unit).
—— —— (1999a), Downsizing for the 21st Century,
a report to Unison Northern Region on the North
Durham Acute Hospitals PFI scheme (London:
University College London, School of Public Policy).
—— —— (1999b), ‘Pump Priming the PFI: Why are
Privately Financed Hospital Schemes being
Subsidised?’ Public Money & Management, Vol. 17,
No. 3, pp. 11–16.
—— —— Price, D. and Shaoul, J. (1999a), ‘NHS
Capital Expenditure and the Private Finance Initiative –
Expansion or Contraction?’ British Medical Journal,
Vol. 319, pp. 48–51.
—— —— —— —— (1999b), ‘PFI in the NHS – Is
There an Economic Case?’ British Medical Journal, Vol.
319, pp. 116–19.
—— —— —— —— (1999c), ‘The Politics of the
Private Finance Initiative and the New NHS’, British
Medical Journal, Vol. 319, pp. 249–53.
Gershon, P. (1999), Review of Civil Procurement in
Central Government (London: HM Treasury).
Glaister, S. (1999), ‘Past Abuses and Future Uses of
Private Finance and Public Private Partnerships in
Transport’, Public Money and Management, Vol. 19,
No. 3, pp. 29–36.
Grimsey, D. and Lewis, M. (2002), ‘Evaluating the
Risks of Public Private Partnerships for Infrastructure
Projects’, International Journal of Project
Management, Vol. 20, pp. 107–18.
References

PAGE 228
Grimshaw, D., Vincent, S. and Willmott, H. (2002),
‘Going Privately: Partnership and Outsourcing in UK
Public Services’, Public Administration, Vol. 80, No. 3,
pp. 475–502.
Hastings, A. (1999), ‘Analysing Power Relationships in
Partnerships: Is There a Role for Discourse Analysis?’
Urban Studies, Vol. 36, No. 1, February, pp. 91–106.
Haynes, L. and Roden, N. (1999), ‘Commercialising
the Management and Maintenance of Trunk Roads in
the United Kingdom’, Transportation, Vol. 26, No. 1,
pp. 31–54.
Heald, D. (1997), Privately Financed Capital in Public
Services (Manchester: The Manchester School of
Economic and Social Services).
Health Select Committee (2000), Public Expenditure
on Health and Personal Social Services 2000:
Memorandum received from the Department of Health
containing replies to a written questionnaire from the
Committee, HC 882, Session 1999–2000 (London:
The Stationery Office).
Health Committee (2002), The Role of the Private
Sector in the NHS, HC 308, Session 2001–02
(London: The Stationery Office).
Hewitt, C. (1997), ‘Complexity and Cost in PFI
Schemes’, Public Money and Management, Vol. 17,
No. 3, pp. 7–9.
Highways Agency (1997), Value in Roads – a DBFO
Case Study (London).
—— (1999a), Framework Document (London).
—— (1999b), Paving the Way (London).
—— (2002), Improving DBFOs – A Consultation
Document (London).
—— (2003), Design, Build, Finance & Operate,
[online text] <http://www.highways.gov.uk/roads/dbfo/
dbfo_intro.htm>, accessed 26 August 2003.
Hodges, R. and Mellett, H. (1999), ‘Accounting for the
Private Finance Initiative in the United Kingdom
National Health Service’, Financial Accountability and
Management, Vol. 15, Nos. 3 and 4, pp. 275–90.
—— —— (2002), ‘Investigating Standard Setting:
Accounting for the United Kingdom’s Private Finance
Initiative’, Accounting Forum, Vol. 26, No. 2,
pp. 126–51.
Hood, J. and McGarvey, N. (2002), ‘Managing the
Risks of Public-Private Partnerships in Scottish Local
Government’, Policy Studies, Vol. 23, No. 1, March,
pp. 21–35.
House of Commons Official Report (Hansard) (1997),
Untitled document deposited in House of Commons
Library in response to question 6555, July 16, p. 298,
col. 534, No. 43.
Howard, M. (2002), ‘Losing the Initiative’, Financial
Management, November, pp. 26–7 (London: Chartered
Institute of Management Accountants).
Inland Revenue (2004), CT6001 – Close companies:
broad definition, [online text] <http://
www.inlandrevenue.gov.uk/manuals/ct123manual/
ct6001.htm>, accessed 16 September 2004.
Institute of Fiscal Studies (2002), The Green Budget
(London).
Institute for Public Policy Research (2001), Building
Better Partnerships: The Final Report of the
Commission on Public Private Partnerships (London).
—— (2004), Openness Survey (London).
References

PAGE 229
Kernaghan, K. (1993), ‘Partnership and Public
Administration: Conceptual and Practical
Considerations’, Canadian Public Administration, Vol.
36, No. 1, Spring, pp. 60–5.
Kirkpatrick, I. and Lucio, M.M. (1996), ‘Introduction:
The Contract State and the Future of Public
Management’, Public Administration, Vol. 74, Spring,
pp. 1–8.
Levy, S.M. (1996), Build Operate and Transfer: Paving
the way for Tomorrow’s Infrastructure (Stamford: Frank
Mercede & Sons, Inc.).
Lister, J. (2003), The PFI Experience: Voices from the
Frontline (London: Unison).
Mackie, P. and Preston, J. (1998), ‘Twenty-one Sources
of Error and Bias in Transport Project Appraisal’,
Transport Policy, Vol. 5, No. 1, pp. 1–7.
McKendrick, J. and McCabe, B. (1997), ‘An Observer’s
Tale: Stonehaven Community Hospital’, Public Money &
Management, Vol. 17, No. 3, pp. 17–20.
McWilliam, J. (1997), ‘A Commissioner’s Tale: Avery
Hill Student Village, University of Greenwich’, Public
Money & Management, Vol. 17, No. 3, pp. 21–4.
Meara, R. (1991), Unfreezing the Assets: NHS Estate
Management in the 1980s, King’s Fund Institute
Research Report 11 (London: King’s Fund).
—— (1997), A Capital Conundrum: The Effect of the
Private Finance Initiative on Strategic Change in
London’s Health Care (London: King’s Fund).
Methven, A. (2004), ‘East Lothian Rescue: Global
Infrastructure Review, Rescuing a PFI Deal’, Project
Finance International, May, pp. 42–5.
Mills, G. (1991), ‘Commercial Funding of Transport
Infrastructure: Lessons from Some Australian Cases’,
Journal of Transport Economics and Policy, September,
pp. 279–98.
Miquel, S. and Condron, J. (1991), Assessment of
Road Maintenance by Contract, Infrastructure and
Urban Development Report INU 91 (Washington DC:
World Bank).
Mulgan, R. (2000), ‘Accountability: An Ever-expanding
Concept?’ Public Administration, Vol. 78, No. 3,
Autumn, p. 555.
Nathan, S. and Whitfield, D. (2000), ‘The PFI and
Europe’s Most Privatised Criminal Justice System’, The
PFI Report, February, No. 39 (London: Centaur).
NAO (National Audit Office) (1988), Department of
Transport, Scottish Department and Welsh Office:
Road Planning, Report of Comptroller and Auditor
General, HC 688, Session 1987–88 (London: The
Stationery Office).
—— (1997), The Skye Bridge, Report of Comptroller
and Auditor General, HC 5, Session 1997–98 (London:
The Stationery Office).
—— (1998a), The Private Finance Initiative: The First
Four Design, Build, Finance and Operate Roads
Contracts, Report of Comptroller and Auditor General,
HC 476, Session 1997–98 (London: The Stationery
Office).
—— (1998b), Cost overuns, Funding Problems and
Delays on Guy’s Hospital Phase III Development,
Report of Comptroller and Auditor General, HC 761,
Session 1997–98 (London: The Stationery Office).
References

PAGE 230
—— (1999a), The Private Finance Initiative: The
Contract to Complete and Operate the A74(M)/M74 in
Scotland, Report of Comptroller and Auditor General,
HC 356, Session 1998–99 (London: The Stationery
Office).
—— (1999b), The PFI Contract for the New Dartford
and Gravesham Hospital, Report of Comptroller and
Auditor General, HC 423, Session 1998–99 (London:
The Stationery Office).
—— (1999c), Examining the Value for Money of Deals
under PFI, Report of Comptroller and Auditor General,
HC 739, Session 1998–99 (London: The Stationery
Office).
—— (1999d), The Passport Delays of Summer 1999,
Report of Comptroller and Auditor General, HC 812,
Session 1998–99 (London: The Stationery Office).
—— (2000a), Public Health Laboratory Service Board
Accounts 1998–1999, Report of Comptroller and
Auditor General, HC 874, Session 1998–99 (London:
The Stationery Office).
—— (2000b), The Refinancing of the Fazakerley PFI
Prison Contract, Report of Comptroller and Auditor
General, HC 584, Session 1999–2000 (London: The
Stationery Office).
—— (2000c), Supporting Innovation: Managing Risk
in Government Departments, Report of Comptroller
and Auditor General, HC 864, Session 1999–2000
(London: The Stationery Office).
—— (2000d), The Radiocommunications Agency’s
Joint Venture with CMG, Report of Comptroller and
Auditor General, HC 21, Session 2000–01 (London:
The Stationery Office).
—— (2000e), The Financial Analysis for the London
Underground Public Private Partnership, Report of
Comptroller and Auditor General, HC 54, Session
2000–01 (London: The Stationery Office).
—— (2001a), The Department of Media, Culture and
Sport: The Renegotiation of the PFI-type Deal for the
Royal Armouries Museum in Leeds, Report of
Comptroller and Auditor General, HC 103, Session
2001–02 (London: The Stationery Office).
—— (2001b), Modern Policy-Making: Ensuring
Policies Deliver Value For Money, Report by the
Comptroller and Auditor General, HC 289, Session
2001–02 (London: The Stationery Office).
—— (2001c), Channel Tunnel Rail Link, Report of
Comptroller and Auditor General, HC 302, Session
2001–02 (London: The Stationery Office).
—— (2001d), NIRS2 Contract Extension, Report of
Comptroller and Auditor General, HC 355, Session
2001–02 (London: The Stationery Office).
—— (2001e), Managing the Relationship to Secure a
Successful Partnership in PFI Projects, Report of
Comptroller and Auditor General, HC 375, Session
2001–02 (London: The Stationery Office).
—— (2002a), The Joint Services Command and Staff
College, HC 537, Report of Comptroller and Auditor
General, Session 2001–02 (London: The Stationery
Office).
—— (2002b), Public Private Partnerships: Airwave,
Report of Comptroller and Auditor General, HC 730,
Session 2001–02 (London: The Stationery Office).
—— (2002c), MOD: Redevelopment of MOD Main
Building, Report of Comptroller and Auditor General,
HC 748, Session 2001–02 (London: The Stationery
Office).
References

PAGE 231
—— (2002d), The Public Private Partnership for the
National Air Traffice Services Ltd, Report of
Comptroller and Auditor General, HC 1096, Session
2001–02 (London: The Stationery Office).
—— (2002e), PFI Refinancing Update, Report of
Comptroller and Auditor General, HC 1288, Session
2001–02 (London: The Stationery Office).
—— (2002f), The PFI Contract for the redevelopment
of the West Middlesex University Hospital, Report of
Comptroller and Auditor General, HC 49, Session
2002–03 (London: The Stationery Office).
—— (2003a), New IT Systems for Magistrates’ Courts:
the LIBRA project, Report of Comptroller and Auditor
General, HC 327, Session 2002–03 (London: The
Stationery Office).
—— (2003b), PFI: Construction Performance, Report
of Comptroller and Auditor General, HC 371, Session
2002–03 (London: The Stationery Office).
—— (2003c), Maintaining England’s Motorways and
Trunk Roads, Report of Comptroller and Auditor
General, HC 431, Session 2002–03 (London: The
Stationery Office).
—— (2003d), NHS (England) Summarised Accounts
2001–2002, Report of Comptroller and Auditor
General, HC 493, Session 2002–03 (London: The
Stationery Office).
—— (2003e), PPP in Practice: National Savings and
Investments’ Deal with Siemens Business Services,
Four Years On, Report of Comptroller and Auditor
General, HC 626, Session 2002–03 (London: The
Stationery Office).
—— (2003f), Northern Ireland Court Service – PFI:
The Laganside Courts, Report of Comptroller and
Auditor General, HC 649, Session 2002–03 (London:
The Stationery Office).
—— (2003g), The Operational Performance of
Prisons, Report of Comptroller and Auditor General, HC
700, Session 2002–03 (London: The Stationery
Office).
—— (2003h), Managing resources to Deliver Better
Public Services, HC 61-1, Session 2003–04 (London:
The Stationery Office).
—— (2004), NHS (England) Summarised Accounts
2002–2003, Report of Comptroller and Auditor
General, HC 505-II, Session 2003–04 (London: The
Stationery Office).
New South Wales Auditor General (1996), ‘Report for
1996: Volume I’ (Sydney: NSW Parliament).
NHS (2003), Benchmarking and Performance
Management, [online text] <http://www.nhs-
procure21.gov.uk/aims/benchmarking.html>, accessed
26 August 2003.
NHS Estates (2003a), Estates Return Information
Collection (ERIC) – 2003, [online text] <http://
www.nhsestates.gov.uk/property_management/content/
eric.html>, accessed 26 August 2003.
—— (2003b), ‘NHS Estates Data Collection & Analysis
System (NEDCAS)’, [online text] <http://
www.doh.gov.uk/nedcas/index.htm> accessed 26
August 2003.
—— (2003c), NHS Estates’ Annual Report and
Accounts 2002/03, HC 828, Session 2002–03
(London: The Stationery Office)
References

PAGE 232
NHS Executive (1994), Capital Investment Manual
(Leeds: NHS Executive).
—— (1999a), ‘Public Private Partnerships in the
National Health Service: The Private Finance Initiative
Overview’, Good Practice Manual (London: The
Stationery Office)
—— (1999b), Public Private Partnerships in the
National Health Service: Private Finance Initiative
(London: Department of Health).
—— (1999c), NHS Trust Manual of Accounts (Leeds:
NHS Executive).
Office of Government Commerce (2001), Best Practice
Gateway Review 5: Benefits Evaluation (London).
—— (2002a), Standardisation of PFI Contracts, July
(London).
—— (2002b), Refinancing of Early PFI Transactions:
Code of Conduct, October (London).
—— (2003a), Post-Implementation Review,
Successful Delivery Toolkit Version 3.91, May
(London).
—— (2003b), Achieving Excellence in Construction
Procurement Guide 8: Improving Performance
(London).
—— (2003c), Delivering Your Agenda, 2003/4
(London).
—— (2003d), Gateway Frequently Asked Questions,
[online text] <http://www.ogc.gov.uk/
index.asp?docid=1001004>, accessed 4 September
2003.
—— (2004), Overview of OGC, [online text]<http://
www.ogc.gov.uk/index.asp?id=1000312>, accessed
28 January 2004.
Osborne, D. and Gaebler, T. (1993), Reinventing
Government: How the Entrepreneurial Spirit is
Transforming the Public Sector From Schoolhouse to
State House, City Hall to Pentagon (New York: Plume
Books).
Owens, J. (1999), ‘Why PFI Performs in Practice’,
Public Finance, April 23–29, pp. 26–7.
Partnerships UK (2003), What is Partnerships UK?,
[online text] <http://www.partnershipsuk.org. uk/puk/
index.htm> accessed 17 April 2003.
Pike, R.H. and Wolfe, M.B. (1988), Capital Budgeting
in the 1990s (London: Chartered Institute of
Management Accountants).
Pilling, J.R. (2002), ‘Establishing a Contract for a PACS
Managed Service’, Clinical Radiology, Vol. 57, pp.
178–83.
Pollock, A., Price, D. and Dunnigan, M. (2000),
Deficits Before Patients: A Report on the
Worcestershire Royal Infirmary PFI and
Worcestershire Hospital Configuration (London:
University College).
—— Shaoul, J., Rowland, D. and Player, S. (2001),
Public Services and the Private Sector: A Response to
the IPPR (London: Catalyst working paper).
—— —— Vickers, V. (2002), ‘Private Finance and
“Value for Money” in NHS Hospitals: A Policy in Search
of a Rationale?’ British Medical Journal, Vol. 324, pp.
1205–8.
PPF (2001), Focus: Health (London).
References

PAGE 233
PPP Forum (2003a), Project Interviews, [online text]
<http://www.pppforum.com/interviews/
interview_alanperkins.html>, accessed 1 September
2003.
—— (2003b), Project Interviews, [online text] <http://
www.pppforum.com/interviews/
interview_malcolm.html>, accessed 1 September 2003.
—— (2003c), Signed Projects, [online text] <http://
www.pppforum.com/signed.html>, accessed 1
November 2003.
Price, D., Gaffney, D. and Pollock, A. (1999), The Only
Game in Town: A Report on the Cumberland Infirmary
Carlisle PFI, Report, Unison Northern Region (London:
Unison).
Public Accounts Committee (1998a), The Skye Bridge,
HC 348, Session 1997–98 (London: The Stationery
Office).
—— (1998b), Contract to Develop and Operate the
Replacement National Insurance Recording System,
HC 472, Session 1997–98 (London: The Stationery
Office).
—— (1998c), The PFI Contracts for Bridgend and
Fazakerley Prisons, HC 499, Session 1997–98
(London: The Stationery Office).
—— (1998d), The Private Finance Initiative: The First
Four Design, Build, Finance and Operate Roads
Contracts, HC 580, Session 1997–98 (London: The
Stationery Office).
—— (1999a), Delays to the New National Insurance
Recording System, HC 182, Session 1998–99
(London: The Stationery Office).
—— (1999b), The PRIME Project: The Transfer of the
Department of Social Security Estate to the Private
Sector, HC 548, Session 1998–99 (London: The
Stationery Office).
—— (1999c), Department of Health: Cost Over-runs,
Funding Problems and Delays on Guy’s Hospital Phase
III Development, Twenty-Eighth Report, HC 289,
Session 1998–99 (London: The Stationery Office).
—— (2000a), The Contributions Agency: The
Newcastle Estate Development Project, HC 104,
Session 1999–2000 (London: The Stationery Office).
—— (2000b), Home Office: The Immigration and
Nationality Directorate’s Casework Programme, HC
130, Session 1999–2000 (London: The Stationery
Office).
—— (2000c), The PFI Contract for the new Dartford
and Gravesham Hospital, HC 131, Session 1999–
2000 (London: The Stationery Office).
—— (2000d), The Passport Delays of Summer 1999,
HC 208, Session 1999–2000 (London: The Stationery
Office).
—— (2000e), Inland Revenue/EDS Strategic
Partnership: The Award of New Work, HC 431,
Session 1999–2000 (London: The Stationery Office).
—— (2001a), The Cancellation of the Benefits
Payment Card Project, HC 358, Session 2001–02
(London: The Stationery Office).
—— (2001b), The Refinancing of the Fazakerley PFI
Prison Contract, HC 372, Session 2000–01 (London:
The Stationery Office).
—— (2002a), Managing the Relationship to Secure a
Successful Partnership in PFI Projects, HC 460,
Session 2001–02 (London: The Stationery Office).
References

PAGE 234
—— (2002b), The Channel Tunnel Rail Link, HC 630,
Session 2001–02 (London: The Stationery Office).
—— (2002c), PPP: Airwave, HC 783, Session 2001–
02 (London: The Stationery Office).
—— (2003a), The PFI Contract for the
Redevelopment of the West Middlesex University
Hospital, HC 155, Session 2002–03 (London: The
Stationery Office).
—— (2003b), PFI Refinancing Update, HC 203,
Session 2002–03 (London: The Stationery Office).
—— (2003c), The Highways Agency: Maintaining
England’s Motorways and Trunk Roads, Thirty-Second
Report, HC 556, Session 2002–03 (London: The
Stationery Office).
—— (2003d), PFI: Construction Performance, HC
567, Session 2002–03 (London: The Stationery Office).
—— (2003e), Delivering Better Value for Money from
the Private Finance Initiative, HC 764, Session 2002–
03 (London: The Stationery Office).
Queen Elizabeth Hospital NHS Trust (2003), Queen
Elizabeth Hospital PFI Project: post-project evaluation
report (Woolwich).
Rhodes, R.A.W. (1994), ‘The Hollowing Out of the
State’, Political Quarterly, Vol. 65, pp. 138–51.
Ricketts, M. (1994), The Economics of Business
Enterprise: An Introduction to Economic Organisation
and the Theory of the Firm, 2nd edn. (Brighton:
Wheatsheaf).
Ridley, A. (1997), ‘Infrastructure – Private Finance
without Privatisation’, in Privatisation of Utilities and
Infrastructure: Methods and Constraints, OECD
Proceedings, Centre for Co-operation with the
Economies in Transition (Paris: OECD).
Rosenau, P.V. (2000), ‘The Strengths and Weaknesses
of Public-Private Policy Partnerships’. In P.V. Rosenau
(ed.), Public-Private Policy Partnerships (London: MIT
Press).
Rowsell, S. (2001), ‘The Partnering Approach to
Procurement’, Private Finance Initiative Journal, Vol.
6, No. 5, November–December 2001.
Royal Infirmary of Edinburgh (1997), Royal Infirmary
of Edinburgh Full Business Case (Edinburgh).
Seal, W. (1999), ‘Accounting and Competitive
Tendering in UK Local Government: An Institutionalist
Interpretation of the New Public Management’,
Financial Accountability & Management, Vol. 15, Nos.
3 and 4, August/November, pp. 309–27.
Senate Community Affairs References Committee
(2000), Healing our Hospitals (Canberra).
Shaoul J. (1998), ‘Charging for Capital in the NHS: To
Improve Efficiency?’ Management Accounting
Research, March 1998, Vol. 9, pp. 95–112.
—— (2004a), ‘Railpolitik: The Financial Realities of
Operating Britain’s National Railways’, Public Money
and Management, Vol. 24, No. 1, pp. 27-36.
—— (2005), ‘A Critical Financial Analysis of the
Private Finance Initiative: Selecting a Financing Method
or Reallocating Economic Wealth?’ Critical
Perspectives on Accounting (forthcoming).
References

PAGE 235
Silva, G. F. (2000), Toll Roads: Recent Trends in
Private Participation, Private Sector and Infrastructure
Network, Note Number 224 (Washington DC: World
Bank).
Sinfield, A. (2000), ‘Tax Benefits in Non-State
Pensions’, European Journal of Social Security, Vol. 2,
No. 2 pp. 137–67.
Spackman, M. (2002), ‘Public-Private Partnerships:
Lessons from the British Approach’, Economic
Systems, Vol. 26, pp. 283–301.
Standard and Poor’s (2002), ‘How is the UK Private
Finance Initiative Risk Changing?’ Ratings Direct,
October 14 (London).
Standard and Poor’s (2003), Public Finance/
Infrastructure Finance: Credit Survey of the UK
Private Finance Initiative and Public-Private
Partnerships (London).
Sussex , J. (2001), The Economics of the Private
Finance Initiative in the NHS (London: Office of Health
Economics).
—— (2003), ‘Public-Private Partnerships in Hospital
Development: Lessons from the UK’s “Private Finance
Initiative”’, Research in Health Care Financial
Management, Vol. 8, No. 1, pp. 59–76.
Taylor, P. and Cooper, C. (2002), Privatised Prisons
and Detention Centres in Scotland, An Independent
Report (Universities of Stirling and Strathclyde:
Mimeo).
The Cabinet Office (1997), Your Right to Know: The
Government’s Proposals for a Freedom of Information,
presented to Parliament by the Chancellor of the Duchy
of Lancaster, Cmnd 3818 (London: The Stationery
Office).
Timms, S. (2001), Public Private Partnership, Private
Finance Initiative, Keynote Address by the Financial
Secretary to the Treasury to Global Summit, Cape
Town, 6 December.
Transport Select Committee (2003), The Work of the
Highways Agency, Select Committee on Transport:
Eighth Report, HC 453, Session 2002–03 (London:
The Stationery Office).
Travers, M. (1996), ‘Banks call for less talk and more
action’, Project Scotland, June 20, pp. 16–17.
HM Treasury (1991), Appraisal and Evaluation in
Central Government: The Green Book (London: The
Stationery Office).
—— (1997a), Appraisal and Evaluation in Central
Government: The Green Book (London: The Stationery
Office).
—— (1997b), A Step-By-Step Guide to the PFI
Procurement Process (London: HM Treasury).
—— (1998), Modern Public Services for Britain:
Investing in Reform. Comprehensive Spending Review:
New Public Sector Spending Plans 1999–2002,
Cmnd 4011 (London: The Stationery Office).
—— (2000), Guide to the Centre of Government
(London: HM Treasury).
—— (2002), Minute in response to PAC Report
Managing the Relationship to Secure a Successful
Partnership in PFI Projects, Cmnd 5600, Session
2001–02 (London: HM Treasury).
—— (2003a), Appraisal and Evaluation in Central
Government: The Green Book (London: The Stationery
Office).
References

PAGE 236
References
—— (2003b), Budget Report: Red Book (London: The
Stationery Office).
—— (2003c), PFI: Meeting the Investment Challenge
(London: HM Treasury).
—— (2003d), Draft Value for Money Appraisal
Guidance (London: HM Treasury).
—— (2003e), PFI Construction Performance, Treasury
Minutes, Cmnd 5984 (London: HM Treasury).
Treasury Taskforce (1999a), How to Account for PFI,
Technical Note No. 1 (Revised) (London: HM Treasury).
—— (1999b), How to Construct a Public Sector
Comparator, Technical Note No. 5 (London: HM
Treasury).
Walker, B. and Con Walker, B. (2000), Privatisation:
Sell Off or Sell Out? The Australian Experience
(Sydney: ABC Books).
Whorley, D. (2001), ‘The Andersen-Comsoc Affair:
Partnerships and the Public Interest’, Canadian Public
Administration-Administration Publique du Canada,
Vol. 44, No. 3, pp. 320–345.
World Bank (1994), World Development Report 1994:
Infrastructure for Development (Washington DC).
Worthington, J. (2002), 2020 Vision: Our Future
Healthcare Environments, Report of the Building
Futures Group (London: The Stationery Office).

PAGE 237

RR/084/001
ISBN: 1 85908 405 2
ACCA 29 Lincoln’s Inn Fields London WC2A 3EE United Kingdom / +44 (0)20 7396 5980 / www.accaglobal.com