evaluating the performance and safety effectiveness of roundabouts
TRANSCRIPT
z
December 2011
www.opusinternational.com
Evaluating the Performance and Safety Effectiveness of Roundabouts
The Michigan Department of Transportation
Opus International Consultants Inc.
6230 Orchard Lake Road, Suite 110
West Bloomfield, MI 48322
Contact: Jeff Bagdade, PE – Vice President
T: 248 539 2222 F: 248 539 3670

RESEARCH REPORT:
Evaluating the Performance and Safety
Effectiveness of Roundabouts
FINAL REPORT
Opus International Consultants Inc.
Prepared by:
Kiel McIntosh
Transportation Engineer
Under the Direction of:
Cynthia Redinger, PE, PTOE
Senior Transportation Engineer
And Jeffrey Bagdade, PE
Vice President
December 2011
OR 09083 (H-U0316.02)
6230 Orchard Lake Road
Suite 110
West Bloomfield, MI 48322
Tel: 248 539 2222
Fax: 248 539 3670
www.opusinternational.com

1. Report No. RC-1566
2. Government Accession No. N/A
3. MDOT Project Manager Dean Kanitz
4. Title and Subtitle Evaluating the Performance and Safety Effectiveness of Roundabouts
5. Report Date December, 2011
6. Performing Organization Code N/A
7. Author(s) Jeffrey Bagdade, Bhagwant N. Persaud, Kiel McIntosh, Joyce Yassin, Craig A. Lyon, Cynthia Redinger, Jason Whitten and Wesley A. Butch
8. Performing Org. Report No. H-U0316.02
9. Performing Organization Name and Address Opus International Consultants Inc. 6230 Orchard Lake Road, Suite 110 West Bloomfield, MI 48322 Tel: (248) 539-2222, Fax: (248) 539-3670
10. Work Unit No. (TRAIS) N/A
11. Contract No. 2010-0278
11(a). Authorization No. Z2
12. Sponsoring Agency Name and Address Michigan Department of Transportation Murray Van Wagoner Building 425 West Ottawa, P.O. Box 30050 Lansing, MI 48909 Tel: (517) 241-2780, Fax: (517) 335-2785
13. Type of Report & Period Covered Annual Report 10/1/2010 to 12/31/2011
14. Sponsoring Agency Code N/A
15. Supplementary Notes
16. Abstract This report documents the evaluation of the performance and safety effectiveness of roundabouts within the State of Michigan. The study began with the identification of roundabouts within Michi-gan. This was followed by collecting data on the geometric features of the roundabouts and crash history for each roundabout site from January 1, 2001 to December 31, 2010. The analysis of the roundabouts within Michigan included a literature review, a best practices review of other municipali-ties, an evaluation of the crash data (both a simple before and after and an Empirical Bayes (EB) anal-ysis, and a site visit to a select group of roundabouts that was determined by the study team. The site visits included a speed study at several of the locations, a conflict analysis at several of the locations, and an assessment of overall operations of the roundabout, including noting any potential issues that may be observed from the operations of the roundabouts. Another finding of the analysis was an av-erage cost savings that the various types of roundabouts are expected to have based on savings the reduction in delay and crash reduction. Additional findings from the site visits resulted in a rating of issues based on Collision Risk Assessment Method. Based upon the results of the EB analysis, Safety Performance Functions (SPFs) and Crash Modification Factors (CMFs) were established to reflect the roundabouts in Michigan. These are the first SPFs and CMFs that were developed to reflect the be-haviors of Michigan roundabouts.
17. Key Words Accident severity, Roundabouts, Highway operations, Truck traffic, Geometric design, Highway design, High-way safety, Traffic Crashes
18. Distribution Statement No restrictions. This document is available to the public through the Michigan De-partment of Transportation.
19. Security Classification – report Unclassified
20. Security Classification – page Unclassified
21. No. of Pages 97
22. Price N/A


Evaluating the Performance and Safety Effectiveness of Roundabouts
i
Table of Contents Executive Summary ......................................................................................................................................... v
1.0 Introduction ...................................................................................................................................... 1-1 1.1 Background Information ..................................................................................................................... 1-1 1.2 Scope and Study Objectives ................................................................................................................ 1-1 1.3 Methodology ...................................................................................................................................... 1-4
2.0 Literature Review ........................................................................................................................... 2-1 2.1 Safety Impacts of Roundabout Implementation ................................................................................ 2-1
2.1.1 Driver Safety ...................................................................................................................... 2-1
2.1.2 Pedestrian Safety ............................................................................................................... 2-3
2.1.3 Bicyclist Safety ................................................................................................................... 2-5 2.2 Operational Characteristics of Roundabouts...................................................................................... 2-6 2.3 Pedestrian, Bicyclist, and Driver Behavior in Roundabouts ............................................................... 2-8
2.3.1 Pedestrian Behavior ........................................................................................................... 2-8
2.3.2 Bicyclist Behavior ............................................................................................................... 2-8
2.3.3 Driver Behavior .................................................................................................................. 2-9 2.4 Truck Maneuvers in Roundabouts .................................................................................................... 2-10 2.5 Traffic Control Devices within Roundabouts .................................................................................... 2-11 2.6 Costs .................................................................................................................................................. 2-12 2.7 Winter Operations ............................................................................................................................ 2-13
3.0 Best Practices Review .................................................................................................................... 3-1
4.0 Field Data Collection ...................................................................................................................... 4-1 4.1 Identify Roundabouts ......................................................................................................................... 4-1 4.2 Site Visits ............................................................................................................................................. 4-3 4.3 Collect Operational Data................................................................................................................... 4-10 4.4 Collect Conflict Data ......................................................................................................................... 4-12
5.0 Additional Data Collection ........................................................................................................... 5-1 5.1 Data Requirements ............................................................................................................................. 5-1
6.0 Safety Analyses ................................................................................................................................ 6-1 6.1 Simple Before and After Analysis........................................................................................................ 6-1 6.2 Detailed Crash Statistics ..................................................................................................................... 6-3 6.3 Empirical Bayes Analysis to Develop Crash Reduction Factors .......................................................... 6-8
6.3.1 Data Collection ................................................................................................................... 6-9
6.3.2 Development of Reference Group SPFs and Yearly Calibration Factors ......................... 6-12
6.3.3 “Before”-“After” Study Results and Discussion ............................................................... 6-14 6.4 Development of Safety Performance Functions ............................................................................... 6-16
6.4.1 Estimating Roundabout Conversion Benefits .................................................................. 6-17 6.5 Operational Impacts of Roundabouts ............................................................................................... 6-21 6.6 Economic Analysis ............................................................................................................................. 6-22
7.0 Conclusion ......................................................................................................................................... 7-1 7.1 Identifying and Rating the Issues ........................................................................................................ 7-2 7.2 Recommendations for Further Research ............................................................................................ 7-7 7.3 Recommendations for Implementation ............................................................................................. 7-8
8.0 List of References ............................................................................................................................ 8-1
Appendix
Evaluating the Performance and Safety Effectiveness of Roundabouts
ii
List of Figures Figure 2.1: Roundabout Conflict Points ................................................................................................. 2-2
Figure 2.2: Chance of Pedestrian Fatality if Hit by a Motor Vehicle...................................................... 2-4
Figure 2.3: Roundabout Safety Features ............................................................................................... 2-9
Figure 2.4: Evaluation of Driver Behavior at HAWK Signals ................................................................ 2-10
Figure 2.5: Right-of-way Requirements for Roundabouts and Signalized Intersections .................... 2-12
Figure 4.1: NB M-53 Ramps at 26 Mile Road Speed Study.................................................................. 4-11
Figure 6.1: Single and Double Lane Roundabout “Before” and “After” Crash Severity ........................ 6-3
Figure 6.2: Single and Double Lane Roundabout “Before” and “After” Crash Type ............................. 6-4
Figure 6.3: Single and Double Lane Roundabout “Before” and “After” Crash Lighting Conditions ...... 6-5
Figure 6.4: Triple Lane Roundabout “Before” and “After” Crash Severity ............................................ 6-6
Figure 6.5: Triple Lane Roundabout “Before” and “After” Crash Type ................................................. 6-7
Figure 6.6: Triple Lane Roundabout “Before” and “After” Crash Lighting Conditions .......................... 6-8
Figure 7.1: WB M-14 at Maple .............................................................................................................. 7-5
Figure 7.2: WB departing at Maple Rd and Drake Rd ............................................................................ 7-6
Figure 7.3: Indirect left turn utilizing roundabouts ............................................................................... 7-7
Evaluating the Performance and Safety Effectiveness of Roundabouts
iii
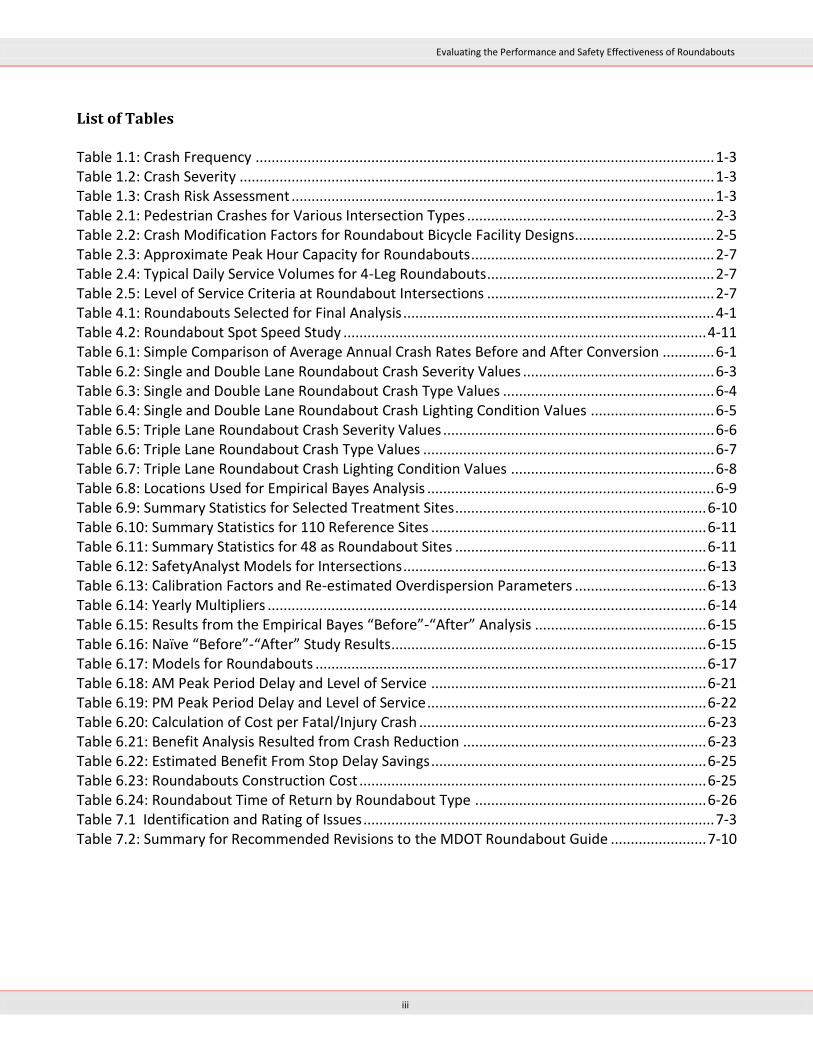
List of Tables Table 1.1: Crash Frequency ................................................................................................................... 1-3
Table 1.2: Crash Severity ....................................................................................................................... 1-3
Table 1.3: Crash Risk Assessment .......................................................................................................... 1-3
Table 2.1: Pedestrian Crashes for Various Intersection Types .............................................................. 2-3
Table 2.2: Crash Modification Factors for Roundabout Bicycle Facility Designs................................... 2-5
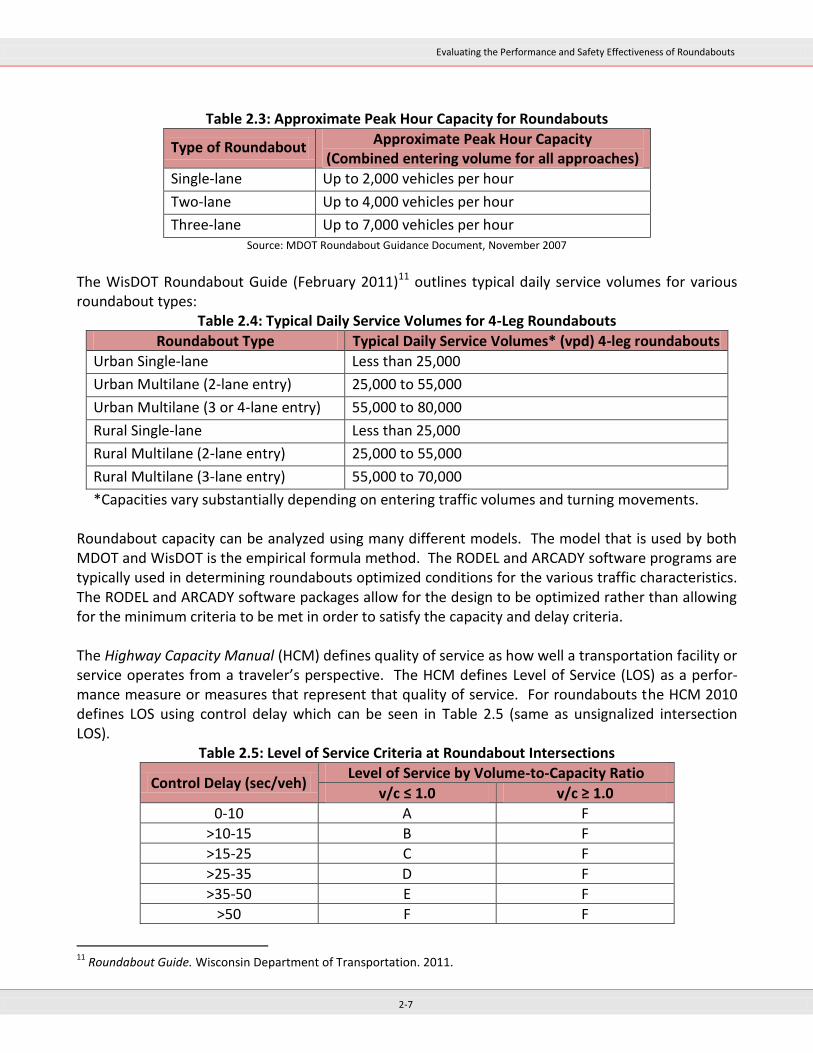
Table 2.3: Approximate Peak Hour Capacity for Roundabouts ............................................................. 2-7
Table 2.4: Typical Daily Service Volumes for 4-Leg Roundabouts ......................................................... 2-7
Table 2.5: Level of Service Criteria at Roundabout Intersections ......................................................... 2-7
Table 4.1: Roundabouts Selected for Final Analysis .............................................................................. 4-1
Table 4.2: Roundabout Spot Speed Study ........................................................................................... 4-11
Table 6.1: Simple Comparison of Average Annual Crash Rates Before and After Conversion ............. 6-1
Table 6.2: Single and Double Lane Roundabout Crash Severity Values ................................................ 6-3
Table 6.3: Single and Double Lane Roundabout Crash Type Values ..................................................... 6-4
Table 6.4: Single and Double Lane Roundabout Crash Lighting Condition Values ............................... 6-5
Table 6.5: Triple Lane Roundabout Crash Severity Values .................................................................... 6-6
Table 6.6: Triple Lane Roundabout Crash Type Values ......................................................................... 6-7
Table 6.7: Triple Lane Roundabout Crash Lighting Condition Values ................................................... 6-8
Table 6.8: Locations Used for Empirical Bayes Analysis ........................................................................ 6-9
Table 6.9: Summary Statistics for Selected Treatment Sites ............................................................... 6-10
Table 6.10: Summary Statistics for 110 Reference Sites ..................................................................... 6-11
Table 6.11: Summary Statistics for 48 as Roundabout Sites ............................................................... 6-11
Table 6.12: SafetyAnalyst Models for Intersections ............................................................................ 6-13
Table 6.13: Calibration Factors and Re-estimated Overdispersion Parameters ................................. 6-13
Table 6.14: Yearly Multipliers .............................................................................................................. 6-14
Table 6.15: Results from the Empirical Bayes “Before”-“After” Analysis ........................................... 6-15
Table 6.16: Naïve “Before”-“After” Study Results ............................................................................... 6-15
Table 6.17: Models for Roundabouts .................................................................................................. 6-17
Table 6.18: AM Peak Period Delay and Level of Service ..................................................................... 6-21
Table 6.19: PM Peak Period Delay and Level of Service ...................................................................... 6-22
Table 6.20: Calculation of Cost per Fatal/Injury Crash ........................................................................ 6-23
Table 6.21: Benefit Analysis Resulted from Crash Reduction ............................................................. 6-23
Table 6.22: Estimated Benefit From Stop Delay Savings ..................................................................... 6-25
Table 6.23: Roundabouts Construction Cost ....................................................................................... 6-25
Table 6.24: Roundabout Time of Return by Roundabout Type .......................................................... 6-26
Table 7.1 Identification and Rating of Issues ........................................................................................ 7-3
Table 7.2: Summary for Recommended Revisions to the MDOT Roundabout Guide ........................ 7-10

Evaluating the Performance and Safety Effectiveness of Roundabouts
iv
Evaluating the Performance and Safety Effectiveness of Roundabouts
v
Executive Summary
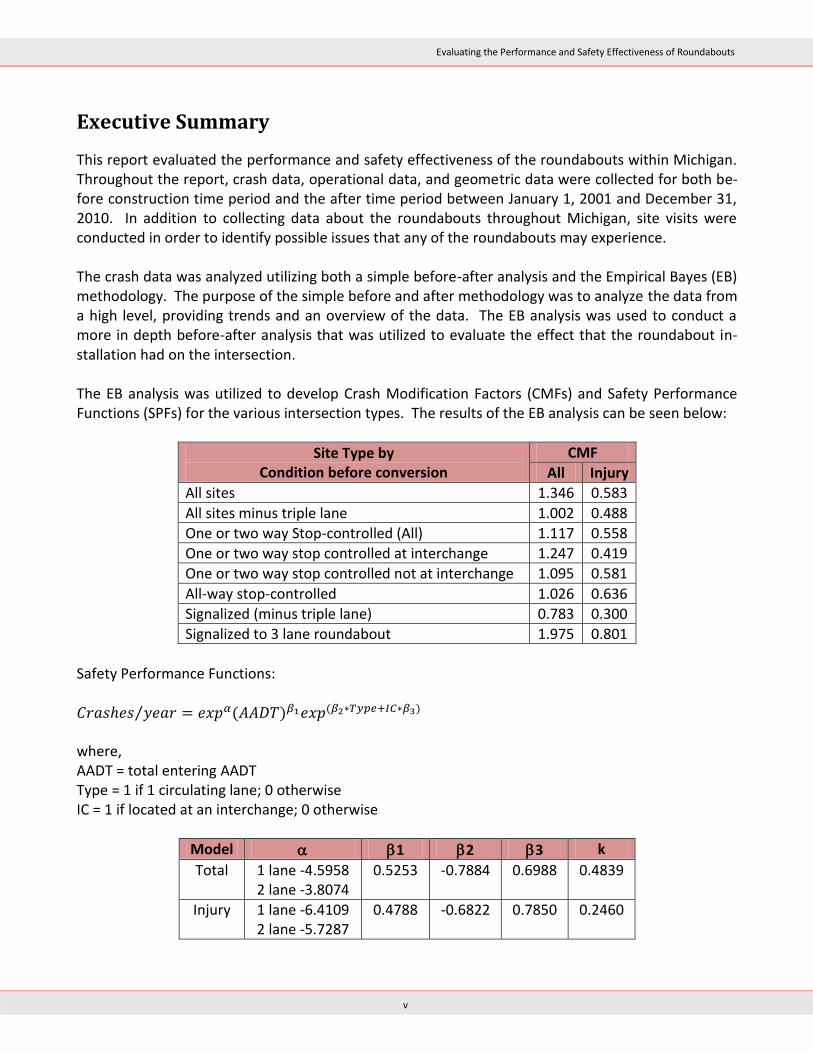
This report evaluated the performance and safety effectiveness of the roundabouts within Michigan. Throughout the report, crash data, operational data, and geometric data were collected for both be-fore construction time period and the after time period between January 1, 2001 and December 31, 2010. In addition to collecting data about the roundabouts throughout Michigan, site visits were conducted in order to identify possible issues that any of the roundabouts may experience. The crash data was analyzed utilizing both a simple before-after analysis and the Empirical Bayes (EB) methodology. The purpose of the simple before and after methodology was to analyze the data from a high level, providing trends and an overview of the data. The EB analysis was used to conduct a more in depth before-after analysis that was utilized to evaluate the effect that the roundabout in-stallation had on the intersection. The EB analysis was utilized to develop Crash Modification Factors (CMFs) and Safety Performance Functions (SPFs) for the various intersection types. The results of the EB analysis can be seen below:
Site Type by Condition before conversion
CMF
All Injury
All sites 1.346 0.583
All sites minus triple lane 1.002 0.488
One or two way Stop-controlled (All) 1.117 0.558
One or two way stop controlled at interchange 1.247 0.419
One or two way stop controlled not at interchange 1.095 0.581
All-way stop-controlled 1.026 0.636
Signalized (minus triple lane) 0.783 0.300
Signalized to 3 lane roundabout 1.975 0.801
Safety Performance Functions: ⁄ where, AADT = total entering AADT Type = 1 if 1 circulating lane; 0 otherwise IC = 1 if located at an interchange; 0 otherwise
Model 1 2 3 k
Total 1 lane -4.5958 2 lane -3.8074
0.5253 -0.7884 0.6988 0.4839
Injury 1 lane -6.4109 2 lane -5.7287
0.4788
-0.6822 0.7850 0.2460
Evaluating the Performance and Safety Effectiveness of Roundabouts
vi
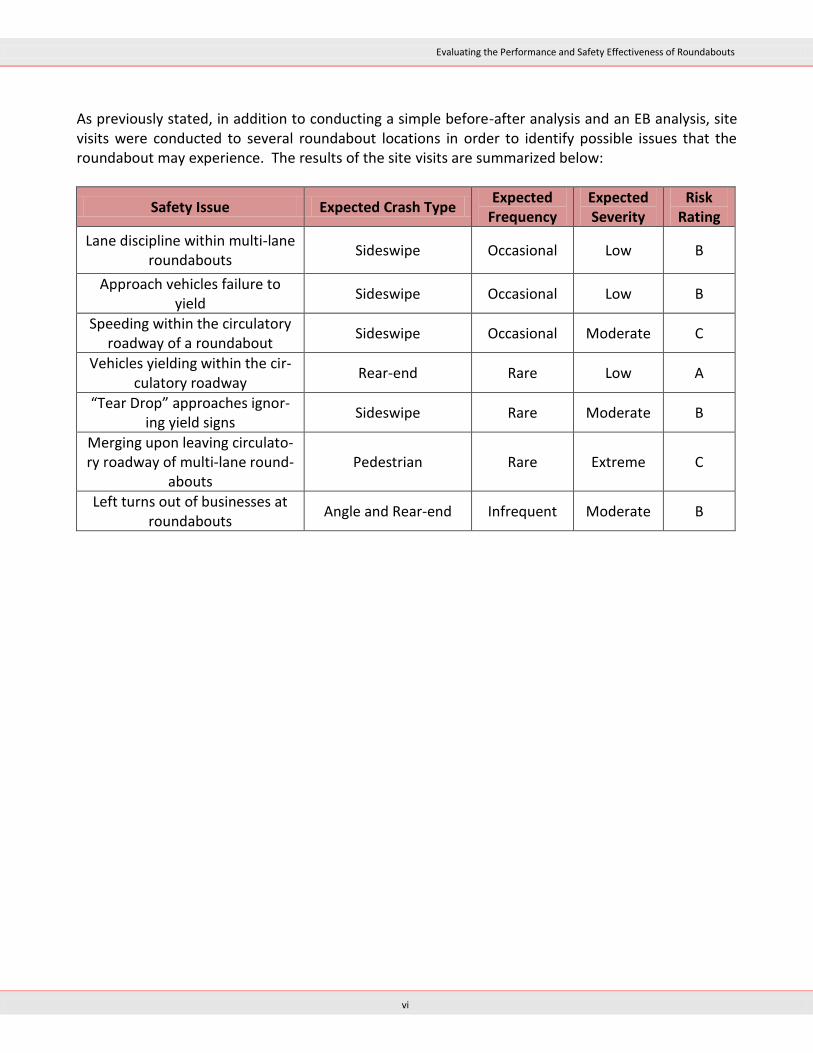
As previously stated, in addition to conducting a simple before-after analysis and an EB analysis, site visits were conducted to several roundabout locations in order to identify possible issues that the roundabout may experience. The results of the site visits are summarized below:
Safety Issue Expected Crash Type Expected
Frequency Expected Severity
Risk Rating
Lane discipline within multi-lane roundabouts
Sideswipe Occasional Low B
Approach vehicles failure to yield
Sideswipe Occasional Low B
Speeding within the circulatory roadway of a roundabout
Sideswipe Occasional Moderate C
Vehicles yielding within the cir-culatory roadway
Rear-end Rare Low A
“Tear Drop” approaches ignor-ing yield signs
Sideswipe Rare Moderate B
Merging upon leaving circulato-ry roadway of multi-lane round-
abouts Pedestrian Rare Extreme C
Left turns out of businesses at roundabouts
Angle and Rear-end Infrequent Moderate B
Evaluating the Performance and Safety Effectiveness of Roundabouts
1-1
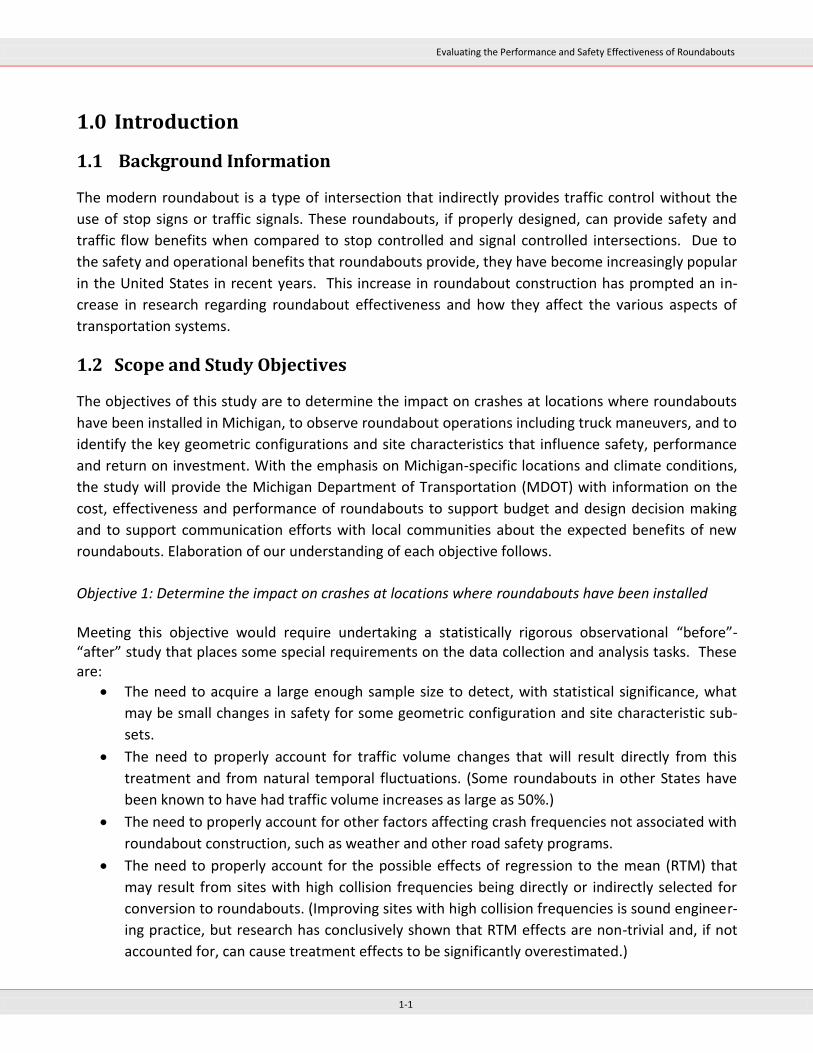
1.0 Introduction
1.1 Background Information
The modern roundabout is a type of intersection that indirectly provides traffic control without the
use of stop signs or traffic signals. These roundabouts, if properly designed, can provide safety and
traffic flow benefits when compared to stop controlled and signal controlled intersections. Due to
the safety and operational benefits that roundabouts provide, they have become increasingly popular
in the United States in recent years. This increase in roundabout construction has prompted an in-
crease in research regarding roundabout effectiveness and how they affect the various aspects of
transportation systems.
1.2 Scope and Study Objectives
The objectives of this study are to determine the impact on crashes at locations where roundabouts
have been installed in Michigan, to observe roundabout operations including truck maneuvers, and to
identify the key geometric configurations and site characteristics that influence safety, performance
and return on investment. With the emphasis on Michigan-specific locations and climate conditions,
the study will provide the Michigan Department of Transportation (MDOT) with information on the
cost, effectiveness and performance of roundabouts to support budget and design decision making
and to support communication efforts with local communities about the expected benefits of new
roundabouts. Elaboration of our understanding of each objective follows.
Objective 1: Determine the impact on crashes at locations where roundabouts have been installed Meeting this objective would require undertaking a statistically rigorous observational “before”-“after” study that places some special requirements on the data collection and analysis tasks. These are:
The need to acquire a large enough sample size to detect, with statistical significance, what
may be small changes in safety for some geometric configuration and site characteristic sub-
sets.
The need to properly account for traffic volume changes that will result directly from this
treatment and from natural temporal fluctuations. (Some roundabouts in other States have
been known to have had traffic volume increases as large as 50%.)
The need to properly account for other factors affecting crash frequencies not associated with
roundabout construction, such as weather and other road safety programs.
The need to properly account for the possible effects of regression to the mean (RTM) that
may result from sites with high collision frequencies being directly or indirectly selected for
conversion to roundabouts. (Improving sites with high collision frequencies is sound engineer-
ing practice, but research has conclusively shown that RTM effects are non-trivial and, if not
accounted for, can cause treatment effects to be significantly overestimated.)
Evaluating the Performance and Safety Effectiveness of Roundabouts
1-2
Objective 2: Observe roundabout operations including truck maneuvers
The requirement to determine the impact on motorist delay of the conversions will be calculated us-
ing the empirical models embedded within RODEL. Before traffic operational and geometric data to
determine the level of service and delay in the “before” period will be gathered. This data will be
compared to the operational characteristics of the implemented roundabout to determine the
change in delay. Truck maneuvers will be observed using the Road Safety Audit (RSA) methodology.
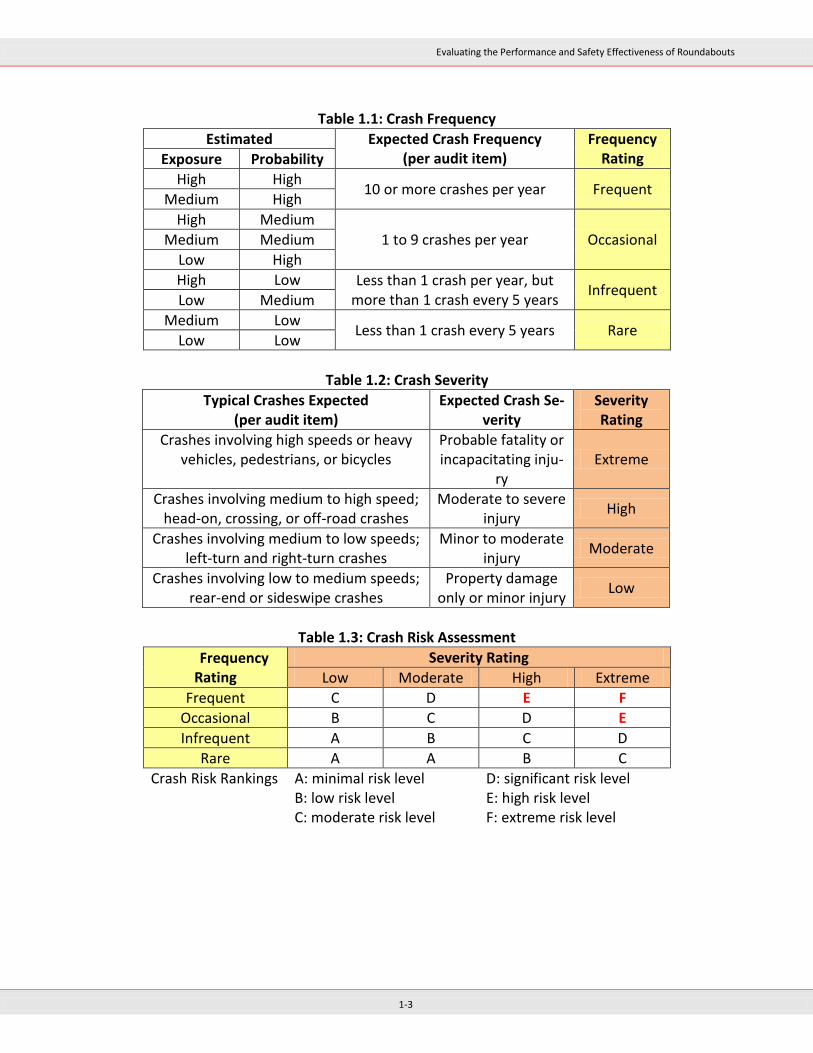
Objective 3: Identify the key geometric configurations and site characteristics that influence safety, performance and return on investment Utilizing the RSA methodology, key geometric, operational, road user and environmental site charac-teristics that influence safety and performance will be identified. A multi-disciplinary team will ob-serve road user behavior through a review of crash, conflict, human factors and other surrogate measures. This information will be analyzed using the Collision Risk Assessment Method. The ex-pected frequency and severity of crashes caused by each safety issue have been identified and rated according to the categories shown in Table 1.1 and Table 1.2. These two risk elements were then combined to obtain a risk assessment on the basis of the matrix shown in Table 1.3. Consequently, each safety issue is assessed on the basis of a ranking between F (highest risk and highest priority) and A (lowest risk and lowest priority). For each safety issue identified, possible mitigation measures have been suggested. MDOTs return on investment for its roundabout implementation program will be calculated using the safety and operational data. This will help MDOT senior management determine the overall effects of roundabouts in Michigan and how future roundabout projects should be addressed in the future.
Evaluating the Performance and Safety Effectiveness of Roundabouts
1-3
Table 1.1: Crash Frequency
Estimated Expected Crash Frequency (per audit item)
Frequency Rating Exposure Probability
High High 10 or more crashes per year Frequent
Medium High
High Medium
1 to 9 crashes per year Occasional Medium Medium
Low High
High Low Less than 1 crash per year, but more than 1 crash every 5 years
Infrequent Low Medium
Medium Low Less than 1 crash every 5 years Rare
Low Low
Table 1.2: Crash Severity
Typical Crashes Expected (per audit item)
Expected Crash Se-verity
Severity Rating
Crashes involving high speeds or heavy vehicles, pedestrians, or bicycles
Probable fatality or incapacitating inju-
ry Extreme
Crashes involving medium to high speed; head-on, crossing, or off-road crashes
Moderate to severe injury
High
Crashes involving medium to low speeds; left-turn and right-turn crashes
Minor to moderate injury
Moderate
Crashes involving low to medium speeds; rear-end or sideswipe crashes
Property damage only or minor injury
Low
Table 1.3: Crash Risk Assessment
Frequency Rating
Severity Rating
Low Moderate High Extreme
Frequent C D E F
Occasional B C D E
Infrequent A B C D
Rare A A B C
Crash Risk Rankings A: minimal risk level D: significant risk level B: low risk level E: high risk level C: moderate risk level F: extreme risk level

Evaluating the Performance and Safety Effectiveness of Roundabouts
1-4
1.3 Methodology
To accomplish the objectives of the study, four phases were developed. The four phases are pre-sented in the following sections. Phase 1 – Literature and Best Practice Review
Task 1.1: Conduct Initial Meeting
In this task the project team along with relevant MDOT and Federal Highway Administration (FHWA) staff held an initial meeting in order to discuss contractual obligations, work plan, de-liverables, project milestones, schedules and appropriate procedures and policies.
Task 1.2: Literature Review The project team conducted a literature review related to the implementation of roundabouts. Industry-standard reference guides, recent conference proceedings, journal publications, the internet, libraries, and discussions with various road agency staff were included in the search. The project team attempted to find out why there was a need for a roundabout, as well as when, where and how they were successfully applied.
Task 1.3: Best Practices Review The project team also investigated best practices related to roundabouts (including indirectly related issues, such as operations, geometric design, maintenance, guidelines, and/or strate-gies). The best practices were reviewed for other state departments of transportation as well as county and municipal road agencies which the project team has relationships with and those agencies have the reputation for being “progressive” in the area of implementing roundabouts. The project team compared the guidelines and best practices that are documented during Task 1.2 and Task 1.3 to existing MDOT practices.
Phase 2 – Field Data Collection
Task 2.1: Identify Roundabouts During this task, the project team prepared the criteria and rationale for the identification of in-tersections to evaluate. The project team contacted MDOT Region and various TSC traffic engi-neers to determine if any roundabouts have been completed in their regions. Additionally, var-ious cities and country road commissions around the state were contacted to determine if any roundabouts have been applied on their roadways. All of the information collected was verified using web aerial photographs from agencies such as Southeast Michigan Council of Govern-ments (SEMCOG). This information was used to prepare the final list of roundabouts that were evaluated as part of this project.
Evaluating the Performance and Safety Effectiveness of Roundabouts
1-5
Task 2.2: Site Visit Once the roundabouts had been identified, a group of roundabouts were selected that best represented the various forms of roundabouts. The site visits to the roundabouts were com-pleted by a multi-disciplinary team. The multi-disciplinary team included experts in the follow-ing areas: road safety, traffic operations, geometric design, non-motorized road users, trucks, and enforcement. Task 2.3: Collect Operational Data The project team worked with the MDOT Regions and Transportation Service Centers (TSCs) to collect traffic count and other operational data. Operational data including turning movement counts (for both vehicles and non-motorized road users) and average daily traffic (ADT) counts were collected. Speed studies to determine 85th percentile speeds along the approaching roadways were also conducted. Task 2.4: Collect Conflict Data The project team collected conflict data at select sites as determined in conjunction with MDOT. Traffic conflicts are “near misses” that occur when two or more road users approach each other in time and space, and one road user takes evasive action to avoid a collision. Traffic conflicts are much more common than traffic collisions and are proposed to be used as a key surrogate measure for safety performance. The observation, recording, and analysis of traffic conflicts can increase the understanding of why collisions are occurring at the study locations.
Phase 3 –Additional Data Collection
Task 3.1: Data Requirements In this task the project team prepared a list of further data requirements. The following data requirements were used in the evaluation:
Crash data at treatment sites, before and after implementation
Crash data at a group of similar reference sites, before and after implementation
Traffic volume at the treatment sites, before and after implementation
Traffic volume at a group of similar reference sites, before and after implementation
Geometric and operational characteristics of the treatment sites
Geometric and operational characteristics of the reference sites
Roundabout implementation dates
Photos of locations, before and after implementation
Construction costs
Evaluating the Performance and Safety Effectiveness of Roundabouts
1-6
Task 3.2: Safety Analysis Data Collection – Treatment Sites The project team collected and summarized crash data, traffic information, and geometric in-formation for the target and reference sites. The data collection and analysis included data for as many “before” and “after” years as are available, including such data for sites with less than three years of data in either of these periods. Crash data was assembled from the Michigan State Police (MSP) crash database. Traffic and geometric information was collected from the partner agencies and from online resources (i.e. MDOT, SEMCOG, Grand Valley Metro Council (GVMC), etc.). This data included number of approaches “before” and “after”, number of lanes per approach “before” and “after”, speed limits per approach “before” and “after”, and many other various features of the intersections. Intersection average daily traffic (ADT) volumes were also obtained for the roundabouts “before” and “after” construction. This information helped account for the change in traffic patterns in the crash analysis. This data can be found in the Appendix of this report. Task 3.2: Safety Analysis Data Collection – Reference Sites Untreated reference group data are required for this study to develop safety performance func-tions (SPFs) required for the Empirical Bayes (EB) evaluation methodology. Crash, traffic and geometric information was collected from various sources. These sites were similar to those of the treatment sites in order to have a group of sites that would represent the conditions of the roundabouts had no change in intersection type occurred.
Phase 4 – Final Analysis
Task 4.1: Development of Safety Performance Functions (SPFs) Fundamental to the state of the art EB approach, SPFs were applied to represent the conditions before roundabout construction, i.e., for conventional stop controlled and signalized intersec-tions. These SPFs relate crashes of different types and severities to traffic flow and other rele-vant factors, with appropriate adjustments for temporal effects. This enables the simultaneous accounting for temporal and possible regression-to-mean effect, as well as those related to changes in traffic volume. Where sufficient data is available, Generalized Linear Modeling would be used to estimate these functions using appropriate statistical analysis software. This approach allows for the specification of a negative binomial error structure known to be more appropriate for crash modeling than the normal distribution assumed in conventional regres-sion analysis. In addition, the negative binomial dispersion parameter calibrated in the process is fundamental to the EB methodology. For “before” period conditions, for which sufficient reference site data is not available, existing SPFs were adopted from the AASHTO SafetyAnalyst software1. Existing SPFs were recalibrated for application. In this procedure, the ratio of the sum of the crash counts to the sum of the SPF
1 http://www.safetanalyst.org/
Evaluating the Performance and Safety Effectiveness of Roundabouts
1-7
estimated crashes for each year for the reference group is applied as an annual multiplier in the regression equation. Task 4.2: Empirical Bayes Analysis to Develop Crash Reduction Factors The EB methodology was used to conduct the “before”-“after” study. In the EB evaluation of the effect of a treatment, the change in safety for a given crash type at a treated location is giv-en by: (1) where B is the expected number of crashes that would have occurred in the “after” period without the treatment and A is the number of reported crashes in the after period. Because of changes in safety that may result from changes in traffic volume, from regression-to-the-mean, and from trends in crash reporting and other factors, the count of crashes before a treatment by itself is not a good estimate of B – A reality that has now gained common acceptance. In-stead, B is estimated from an EB procedure in which a safety performance function (SPF) is used to first estimate the number of crashes that would be expected in each year of the “before” pe-riod at locations with traffic volumes and other characteristics similar to a treatment site being analyzed. The sum of these annual SPF estimates (P) is then combined with the count of crashes (x) in the “before” period at the treatment site to obtain an estimate of the expected number of crashes (m) before the treatment. This estimate of m is: (2) The weights w1 and w2 are estimated as:
(3)
where k is the overdispersion parameter of the negative binomial distribution that is assumed for the crash counts used in estimating the SPF. The value of k is estimated from the SPF cali-bration process with the use of a maximum likelihood procedure. A factor is then applied to m from Equation 2 to account for the length of the “after” period and differences in traffic volumes between the “before” and “after” periods. This factor is the sum of the annual SPF predictions for the “after” period divided by P, the sum of these predictions for the “before” period. The result, after applying this factor, is an estimate of B. The procedure also produces an estimate of the variance of B, the expected number of crashes that would have occurred in the “after” period without the treatment. The estimate of B is then summed over all sites in a treatment group of interest (all treatment sites, or subsets disaggregated by traffic volume or other variables of interest) (to obtain Bsum) and compared with the count of crashes during the “after” period in that group (Asum). The vari-
Evaluating the Performance and Safety Effectiveness of Roundabouts
1-8
ance of B is also summed over all sections in the group of interest. The index of safety effec-
tiveness () is estimated as:
(4)
The standard deviation of is given by:
√
(
)
(5)
The percent change in crashes is in fact 100(1 – ); thus a value of = 0.7 with a standard devia-tion of 0.12 indicates a 30 percent reduction in crashes with a standard deviation of 12%. Task 4.3: Operational Impacts of Roundabouts Operational impacts of the roundabout sites were determined using the RODEL software pack-age. For each of the treatment sites, the Level-of-Service (LOS) and other operational measures of effectiveness (MOE) including delay were calculated. These MOEs were compared against the treatment site conditions before the roundabout was implemented. If traffic volume and geometric data is unavailable for the “before” period, the project team compared the treat-ment segments to nearby control sites. Task 4.4: Economic Analysis The change in safety for each site may be estimated by Equation 1 and then applied to estimate crash cost benefits in an economic analysis of the roundabout conversions to assess the cost-effectiveness of the program to date. First these crash changes are summed over all sites and an annual value calculated by dividing this sum by the total number of “after” period site years in the data. FHWA unit comprehensive crash costs are then applied to estimate an annual dollar benefit that can be compared to an annual program cost that includes the capital costs con-verted to an annual value using estimated service life and discount rate derived from consulta-tion with MDOT. In this procedure, crashes were disaggregated by crash type and severity to the extent possible, and unit crash costs for those types and severities applied before aggregat-ing to obtain an overall crash cost savings. Operational data, such as the reduction in delay, is also included in the economic analysis. A time of return was calculated for each site using the procedure identified in the FHWA Roundabout Guide.
Evaluating the Performance and Safety Effectiveness of Roundabouts
1-9
Task 4.5: Identifying and Ranking the Issues At the end of the technical analysis tasks, the project team summarized the issues identified at each site. The Collision Risk Assessment Method was used to determine the risk of each issue. This method was originally developed by Sany Zein of Opus International Consultants. This method has been adopted by FHWA in their RSA guidelines and training materials. Issues that contribute to a high frequency of crashes, or to crashes with high severity likelihood, should be ranked as having the highest risk and be assigned highest priority. Conversely, issues that are likely to rarely result in serious collisions should be assigned a relatively low priority. Task 4.6: Update Guidance for Future Application Based on the information outlined in the earlier tasks the existing guidelines in the MDOT Roundabout Design Guide were reviewed and updated guidance was provided.
Evaluating the Performance and Safety Effectiveness of Roundabouts
2-1
2.0 Literature Review
The purpose of this literature review is to analyze exiting research and best practices used by various road agencies in the field of roundabout effectiveness in the various aspects of transportation. This review will analyze the effect of roundabouts with respect to:
Safety impacts
Operational characteristics
Pedestrian, bicyclist and driver behavior
Truck maneuvers
Traffic control devices
Costs
Winter operations
2.1 Safety Impacts of Roundabout Implementation
Many recent studies have investigated the effect that roundabouts would have on the safety of the road users. Roundabouts are expected to impact the safety of the motorists, as well as pedestrians and bicyclists. This section will examine how roundabouts effect safety related to drivers, pedestri-ans, and bicyclists.
2.1.1 Driver Safety
With the growing interest of roundabouts in the U.S., a need for data and studies regarding the safety impacts of roundabouts has become apparent. Many studies in the international literature have demonstrated that roundabouts are safer forms of intersections when compared to more conven-tional types (stop controlled or signalized). However, there had been a concern that the safety bene-fits that were realized in the international studies would not be directly related to those benefits ob-served in U.S. sites. Safety Effect of Roundabout Conversions in the United States2 by Persaud, Retting, Garder, and Lord evaluated the effects that roundabout conversions had on the safety of the intersection following the conversion of 23 intersections that were previously stop sign and traffic signal controlled within the U.S. The conversion of the intersections to roundabouts occurred in seven separate states across the U.S. between 1992 and 1997. The study applied a statistically rigorous procedure to compare the ex-pected number of crashes per year without the roundabout conversion and the observed number of crashes per year after the conversion.
2 Persaud, B. N., R. A. Retting, P. E. Gardner, and D. Lord. Safety Effect of Roundabout Conversions in the United States:
Empirical Bayes Observational Before-After Study. In Transportation Research Record 1751, TRB, National Research Council, Washington, D.C., 2002.
Evaluating the Performance and Safety Effectiveness of Roundabouts
2-2
The results of the analysis by Persaud et al. are summarized below:
40% reduction of all crash types
80% reduction of all injury crashes
A more comprehensive study was conducted by the National Cooperative Highway Research Program (NCHRP) in the NCHRP Report 572 Roundabouts in the United States3. A part of this study evaluated crash performance “before” and “after” conversion to a roundabout for 55 intersections within the U.S. The results of the crash analysis in the NCHRP Report 572 are summarized below:
35.4% reduction of all crash types
75.8% reduction of all injury crashes
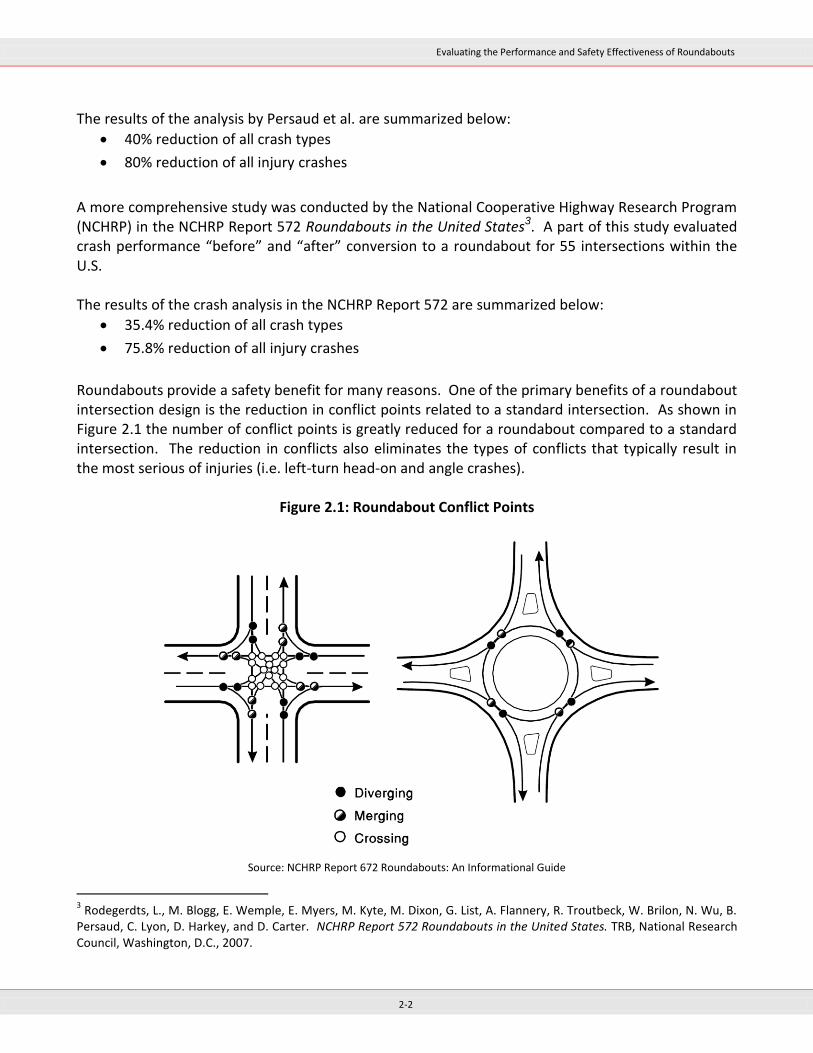
Roundabouts provide a safety benefit for many reasons. One of the primary benefits of a roundabout intersection design is the reduction in conflict points related to a standard intersection. As shown in Figure 2.1 the number of conflict points is greatly reduced for a roundabout compared to a standard intersection. The reduction in conflicts also eliminates the types of conflicts that typically result in the most serious of injuries (i.e. left-turn head-on and angle crashes).
Figure 2.1: Roundabout Conflict Points
Source: NCHRP Report 672 Roundabouts: An Informational Guide
3 Rodegerdts, L., M. Blogg, E. Wemple, E. Myers, M. Kyte, M. Dixon, G. List, A. Flannery, R. Troutbeck, W. Brilon, N. Wu, B.
Persaud, C. Lyon, D. Harkey, and D. Carter. NCHRP Report 572 Roundabouts in the United States. TRB, National Research Council, Washington, D.C., 2007.

Evaluating the Performance and Safety Effectiveness of Roundabouts
2-3
With the addition of the roundabout, vehicle traveling speeds are typically reduced in order to safely navigate the roundabout. Speeds within a roundabout typically range from 10 to 25 miles per hour. As a result, crashes that do occur typically have lower severity than those at other intersection types. The NCHRP Report 672 Roundabouts: An Informational Guide4 summarizes the benefits provided by lower speeds below:
Provide more time for entering drivers to judge, adjust speed for, and enter a gap in circulat-
ing traffic, allowing for safer merges;
Reduce the size of sight triangles needed for users to see one another;
Increase the likelihood of drivers yielding to pedestrians (compared to an uncontrolled cross-
ing);
Provide more time for all users to detect and correct for their mistakes or mistakes of others;
Make crashes less frequent and less severe, including crashes involving pedestrians and bicy-
clists; and
Make the intersection safer for novice users.
2.1.2 Pedestrian Safety
Pedestrian safety at roundabouts is affected by numerous factors including but not limited to driver and pedestrian unfamiliarity with roundabout operations. However, as previously stated, rounda-bouts reduce the number of conflict points. The number of pedestrian related conflict points is also reduced from sixteen (16) for a 4 legged signalized intersection, to eight (8) for a 4-leg roundabout intersection. British statistics found in studies by Maycock and Hall5 and Crown6 show the safety po-tential from the reduction in conflicts points also provides a reduction in pedestrian crashes. Table 2.1 summarizes the number of pedestrian crashes, per million trips, at various intersection types.
Table 2.1: Pedestrian Crashes for Various Intersection Types
Intersection Type Pedestrian Crashes per Million Trips
Mini-roundabout 0.31
Conventional roundabout (older designs) 0.45
Flared roundabout (newer designs) 0.33
Signals 0.67
4 Rodegerdts, L., J. Bansen, C. Tiesler, J. Knudsen, E. Myers, M. Johnson, M. Moule, B. Persaud, C. Lyon, S. Hallmark, H.
Isebrands, R. B. Crown, B. Guichet, and A. O’Brien. NCHRP Report 672 Roundabout: An Informational Guide. TRB, National Research Council, Washington, D.C., 2010. 5 Maycock, G. and Hall R. D. Crashes at Four-Arm Roundabouts. TRRL Laboratory Report LR 1120. Transport and Road Re-
search Laboratory, Crowthorne, England, 1984. 6 Crown, B. “An Introduction to Some Basic Principles of U.K. Roundabouts Design.” Presented at the ITE District 6 Confer-
ence on Roundabouts, Loveland, Colorado, October 1998.
Evaluating the Performance and Safety Effectiveness of Roundabouts
2-4
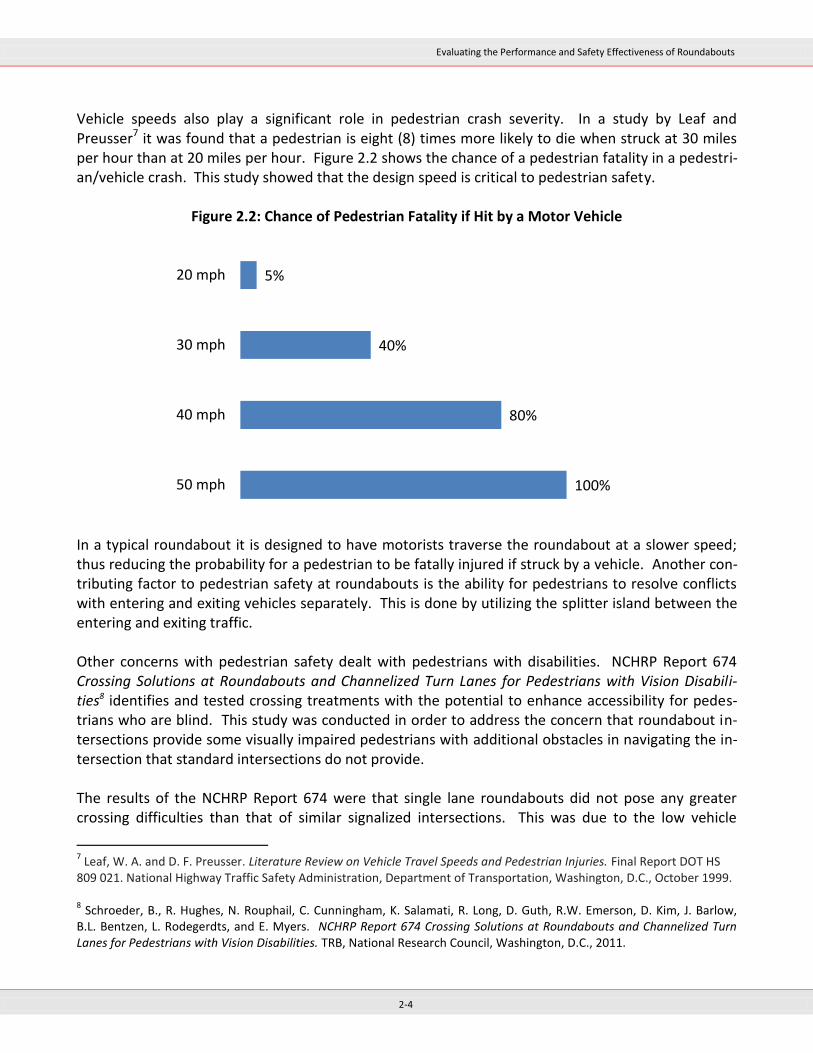
Vehicle speeds also play a significant role in pedestrian crash severity. In a study by Leaf and Preusser7 it was found that a pedestrian is eight (8) times more likely to die when struck at 30 miles per hour than at 20 miles per hour. Figure 2.2 shows the chance of a pedestrian fatality in a pedestri-an/vehicle crash. This study showed that the design speed is critical to pedestrian safety.
Figure 2.2: Chance of Pedestrian Fatality if Hit by a Motor Vehicle
In a typical roundabout it is designed to have motorists traverse the roundabout at a slower speed; thus reducing the probability for a pedestrian to be fatally injured if struck by a vehicle. Another con-tributing factor to pedestrian safety at roundabouts is the ability for pedestrians to resolve conflicts with entering and exiting vehicles separately. This is done by utilizing the splitter island between the entering and exiting traffic. Other concerns with pedestrian safety dealt with pedestrians with disabilities. NCHRP Report 674 Crossing Solutions at Roundabouts and Channelized Turn Lanes for Pedestrians with Vision Disabili-ties8 identifies and tested crossing treatments with the potential to enhance accessibility for pedes-trians who are blind. This study was conducted in order to address the concern that roundabout in-tersections provide some visually impaired pedestrians with additional obstacles in navigating the in-tersection that standard intersections do not provide. The results of the NCHRP Report 674 were that single lane roundabouts did not pose any greater crossing difficulties than that of similar signalized intersections. This was due to the low vehicle
7 Leaf, W. A. and D. F. Preusser. Literature Review on Vehicle Travel Speeds and Pedestrian Injuries. Final Report DOT HS
809 021. National Highway Traffic Safety Administration, Department of Transportation, Washington, D.C., October 1999. 8 Schroeder, B., R. Hughes, N. Rouphail, C. Cunningham, K. Salamati, R. Long, D. Guth, R.W. Emerson, D. Kim, J. Barlow,
B.L. Bentzen, L. Rodegerdts, and E. Myers. NCHRP Report 674 Crossing Solutions at Roundabouts and Channelized Turn Lanes for Pedestrians with Vision Disabilities. TRB, National Research Council, Washington, D.C., 2011.
100%
80%
40%
5%
50 mph
40 mph
30 mph
20 mph
Evaluating the Performance and Safety Effectiveness of Roundabouts
2-5
speeds at the crosswalk that were a result of correct roadway geometry, the willingness of the major-ity of drivers to yield to pedestrians, and properly installed warning surfaces to distinguish between the sidewalk and the street. The NCHRP Report 674 also concluded that while single lane roundabouts do not adversely affect vis-ually impaired pedestrians behavior, two-lane roundabouts are challenging and not accessible for visually impaired pedestrians without the provision of additional crossing treatments or without a drastic change in driver behavior to voluntarily yield to pedestrians. Two treatments were tested in the report, both resulting in notable improvements over the non-treatment conditions. The tested treatments were pedestrian hybrid beacon (PHB, also known as a HAWK signal) and a raised cross-walk. Both of the treatments showed significant improvements in pedestrian delay and pedestrian crossing risk.
2.1.3 Bicyclist Safety
As stated in the previous sections, roundabouts have a favorable effect on traffic safety for both the driver and pedestrians, especially in the number of severe crashes. Roundabouts also impact the safety of bicyclists utilizing roundabouts. A study by Daniels et al.9 (2009) examined the effects of roundabout conversion on the number of bicycle crashes and the severity. Daniels et al. examined four different bicycle facilities design types at roundabouts:
Mixed traffic;
Bicycle lanes;
Separate cycle paths;
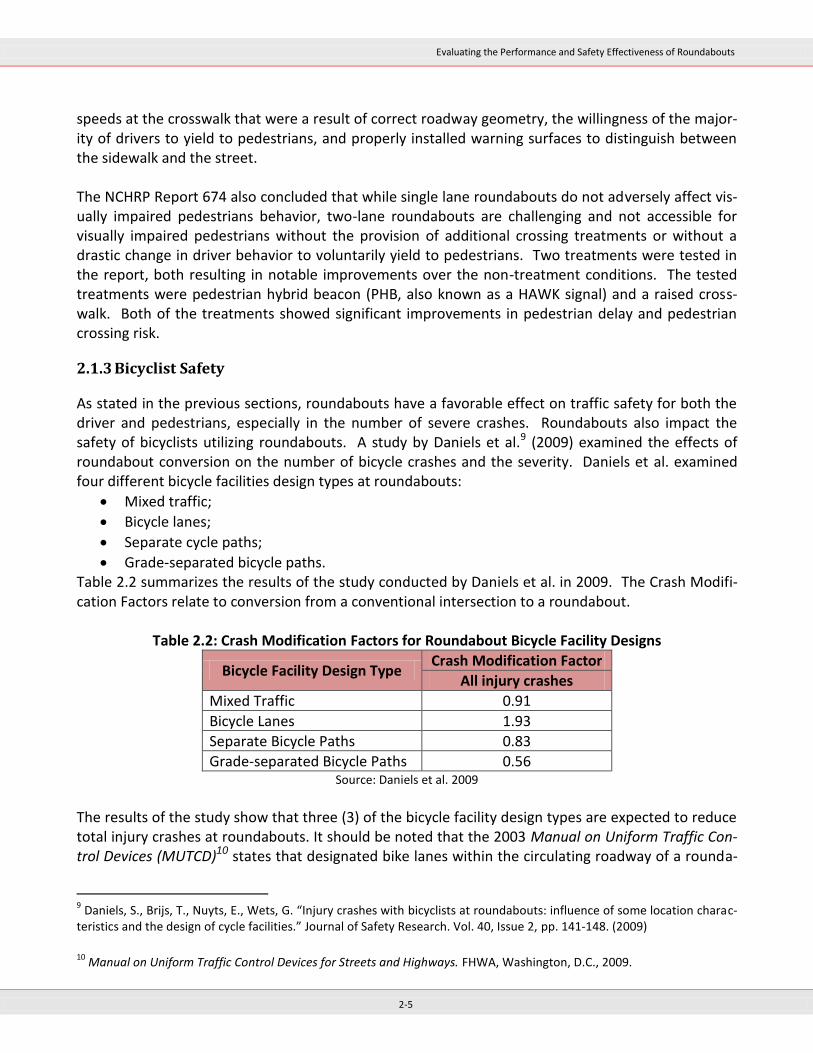
Grade-separated bicycle paths. Table 2.2 summarizes the results of the study conducted by Daniels et al. in 2009. The Crash Modifi-cation Factors relate to conversion from a conventional intersection to a roundabout.
Table 2.2: Crash Modification Factors for Roundabout Bicycle Facility Designs
Bicycle Facility Design Type Crash Modification Factor
All injury crashes
Mixed Traffic 0.91
Bicycle Lanes 1.93
Separate Bicycle Paths 0.83
Grade-separated Bicycle Paths 0.56 Source: Daniels et al. 2009
The results of the study show that three (3) of the bicycle facility design types are expected to reduce total injury crashes at roundabouts. It should be noted that the 2003 Manual on Uniform Traffic Con-trol Devices (MUTCD)10 states that designated bike lanes within the circulating roadway of a rounda-
9 Daniels, S., Brijs, T., Nuyts, E., Wets, G. “Injury crashes with bicyclists at roundabouts: influence of some location charac-
teristics and the design of cycle facilities.” Journal of Safety Research. Vol. 40, Issue 2, pp. 141-148. (2009)
10
Manual on Uniform Traffic Control Devices for Streets and Highways. FHWA, Washington, D.C., 2009.
Evaluating the Performance and Safety Effectiveness of Roundabouts
2-6
bout shall not be used. Typical designs for roundabout bicycle facilities for the Wisconsin Depart-ment of Transportation (WisDot) and MDOT utilize the mixed traffic and separate bicycle paths bicy-cle facility design types. A more detailed analysis of bicyclist’s behavior at roundabouts will be dis-cussed in Section 2.3.2 of this report.
2.2 Operational Characteristics of Roundabouts
The research conducted in the NCHRP Report 572 analyzed the delay experienced by roundabouts and compared it to the delay experienced by signalized intersections with similar turning volumes. The results were that when at signal warrant volume thresholds, as defined in the MUTCD, the roundabout intersection experiences approximately 12 seconds less overall delay, than the signalized intersection. With roundabouts being a relatively new intersection type in the United States, they may not be operating as efficiently as they are capable of because of driver unfamiliarity. As drivers become more accustomed to how roundabouts operate, the operations of the roundabout will con-tinue to improve. Recent research has showed that roundabouts contain benefits and concerns in the aspect of traffic and pedestrian operations. The NCHRP Report 672 provided general information for a “planning-level” operational comparison of control modes:
A roundabout will always provide a higher capacity and lower delays than all-way stop-control
(AWSC) operating with the same traffic volumes.
A roundabout is unlikely to offer better performance in terms of lower overall delays than two
way stop control (TWSC) at intersections with minor movements (including cross-street entry
and major-street left turns) that are not experiencing, nor predicted to experience, operation-
al problems under TWSC.
A single-lane roundabout may be assumed to operate within its capacity at any intersection
that does not exceed the peak-hour volume warrant for signals.
A roundabout that operates within its capacity will generally produce lower delays than a sig-
nalized intersection operating with the same traffic volumes
One common concern with roundabouts is capacity. A roundabout’s capacity is based on its geome-try (i.e. number of entering lanes, diameter, entry angle, lane width, etc.) and its peak hour traffic volume and turning patterns. The MDOT Roundabout Guidance Document, November 2007 provides approximate maximum capacities for various types of roundabouts. It is also noted in the MDOT Roundabout Guidance Document that the table is only a general guide and there is no substitute for an intersection-specific capacity analysis.
Evaluating the Performance and Safety Effectiveness of Roundabouts
2-7
Table 2.3: Approximate Peak Hour Capacity for Roundabouts
Type of Roundabout Approximate Peak Hour Capacity
(Combined entering volume for all approaches)
Single-lane Up to 2,000 vehicles per hour
Two-lane Up to 4,000 vehicles per hour
Three-lane Up to 7,000 vehicles per hour Source: MDOT Roundabout Guidance Document, November 2007
The WisDOT Roundabout Guide (February 2011)11 outlines typical daily service volumes for various roundabout types:
Table 2.4: Typical Daily Service Volumes for 4-Leg Roundabouts
Roundabout Type Typical Daily Service Volumes* (vpd) 4-leg roundabouts
Urban Single-lane Less than 25,000
Urban Multilane (2-lane entry) 25,000 to 55,000
Urban Multilane (3 or 4-lane entry) 55,000 to 80,000
Rural Single-lane Less than 25,000
Rural Multilane (2-lane entry) 25,000 to 55,000
Rural Multilane (3-lane entry) 55,000 to 70,000
*Capacities vary substantially depending on entering traffic volumes and turning movements. Roundabout capacity can be analyzed using many different models. The model that is used by both MDOT and WisDOT is the empirical formula method. The RODEL and ARCADY software programs are typically used in determining roundabouts optimized conditions for the various traffic characteristics. The RODEL and ARCADY software packages allow for the design to be optimized rather than allowing for the minimum criteria to be met in order to satisfy the capacity and delay criteria. The Highway Capacity Manual (HCM) defines quality of service as how well a transportation facility or service operates from a traveler’s perspective. The HCM defines Level of Service (LOS) as a perfor-mance measure or measures that represent that quality of service. For roundabouts the HCM 2010 defines LOS using control delay which can be seen in Table 2.5 (same as unsignalized intersection LOS).
Table 2.5: Level of Service Criteria at Roundabout Intersections
Control Delay (sec/veh) Level of Service by Volume-to-Capacity Ratio
v/c ≤ 1.0 v/c ≥ 1.0
0-10 A F
>10-15 B F
>15-25 C F
>25-35 D F
>35-50 E F
>50 F F
11
Roundabout Guide. Wisconsin Department of Transportation. 2011.
Evaluating the Performance and Safety Effectiveness of Roundabouts
2-8
2.3 Pedestrian, Bicyclist, and Driver Behavior in Roundabouts
The overall behavior of motorists, pedestrians, and bicyclists differ while utilizing roundabouts than other traffic control modes (stop controlled or signal controlled). With signalized and stop controlled intersections the road users (pedestrians, bicyclists, and drivers) have a designated time or phase to traverse the intersection. In a roundabout, it is up to the user to determine an acceptable gap in traf-fic in order to enter the intersection. This section will analyze the advantages and disadvantages for the different road users in a roundabout. 2.3.1 Pedestrian Behavior
At roundabout locations where pedestrian access is provided, pedestrians typically traverse the roundabout utilizing crosswalks around the perimeter of the roundabout. When proper space is pro-vided on the splitter island, allowing pedestrians to use the splitter island as a refuge island, pedestri-ans can consider one direction of traffic at a time. The locations of the pedestrian crosswalks are lo-cated one to two car lengths from the yield line for various reasons. The NCHRP Report 672 states that crosswalks are set back from the yield line to:
Shorten the crossing distance compared to locations adjacent to the inscribed circle;
Separate vehicle-vehicle and vehicle-pedestrian conflict points, and
Allow the second entering driver to devote attention to crossing pedestrians while waiting for
the driver ahead to enter the circulatory roadway.
As previously discusses, there were concerns with visually impaired pedestrians being able to traverse roundabouts. Additional traffic control devices, such as HAWK signals or Flashing Pedestrian Beacons at roundabout entrances and exits help enforce driver compliance and will be further examined in Section 2.5. 2.3.2 Bicyclist Behavior
Bicyclists have the ability to traverse roundabouts in multiple ways:
Riding on the shared use path
Riding in the circulating lane like a motorist, controlling traffic within the lane
Dismounting and walking like a pedestrian
This allows for more experienced bicyclists to utilize the roadway to traverse the intersection, while novice bicyclists can utilize the shared path or dismount and cross the intersection utilizing the pedes-trian facilities. Bicyclists who ride on the sidewalk or shared path and who dismount to walk like pedestrians will face the same challenges as pedestrians when attempting to cross the intersection. Bicyclists will need to select acceptable gaps in traffic in order to cross a leg of traffic at a roundabout. Bicyclists who utilize the circulating lane like motorists may face some of the following challenges: (1) Bicyclists must be able to “control the lane” before entering the roundabout, preventing motorists merging into the path of the bicyclist, (2) Higher vehicle volumes may minimize acceptable bicyclist
Evaluating the Performance and Safety Effectiveness of Roundabouts
2-9
gaps (3) Due to varying speeds of motorists, bicyclists may not be able to judge correctly the size of a gap to determine if a gap is acceptable (4) Motorists entering the roundabout may not be able to properly judge the bicyclist’s speed or even notice the bicyclist approaching. 2.3.3 Driver Behavior
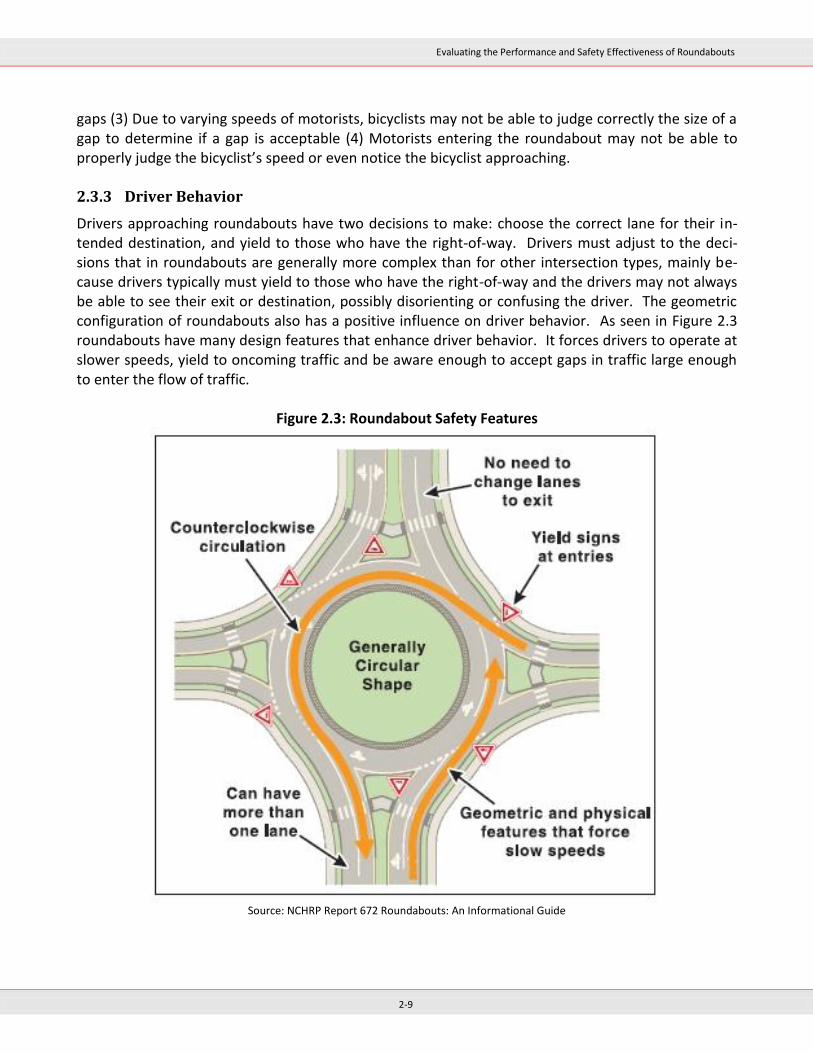
Drivers approaching roundabouts have two decisions to make: choose the correct lane for their in-tended destination, and yield to those who have the right-of-way. Drivers must adjust to the deci-sions that in roundabouts are generally more complex than for other intersection types, mainly be-cause drivers typically must yield to those who have the right-of-way and the drivers may not always be able to see their exit or destination, possibly disorienting or confusing the driver. The geometric configuration of roundabouts also has a positive influence on driver behavior. As seen in Figure 2.3 roundabouts have many design features that enhance driver behavior. It forces drivers to operate at slower speeds, yield to oncoming traffic and be aware enough to accept gaps in traffic large enough to enter the flow of traffic.
Figure 2.3: Roundabout Safety Features
Source: NCHRP Report 672 Roundabouts: An Informational Guide
Evaluating the Performance and Safety Effectiveness of Roundabouts
2-10
In a roundabout, yielding to those who have the right-of-way occurs at several points. The NCHRP Report 672 summarizes the points along a roundabout where the decision to yield may occur:
Drivers must be mindful of any bicyclists merging into motor vehicle traffic from the right side
of the road, a bicycle lane, or shoulder.
Drivers must yield to any pedestrians crossing at the entry (the laws on this vary somewhat
from state to state).
Drivers must choose an acceptable gap in which to enter the roundabout.
Drivers must yield to any pedestrians crossing the exit (the laws on this vary somewhat from
state to state).
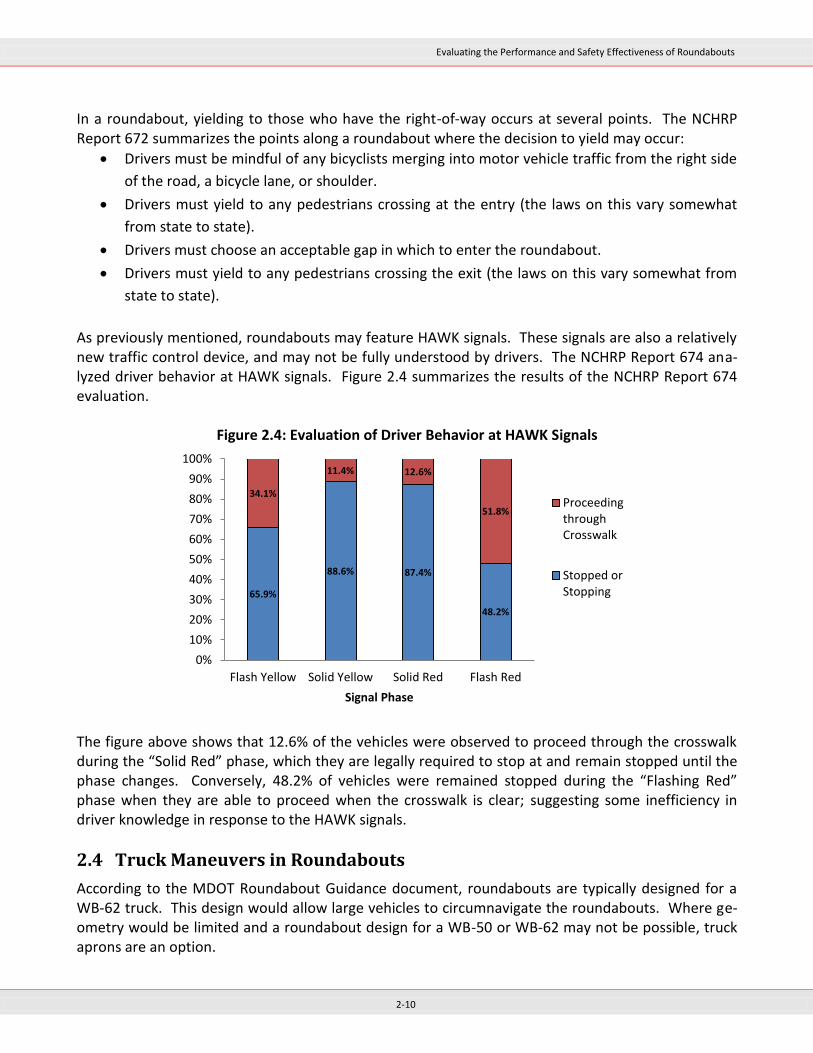
As previously mentioned, roundabouts may feature HAWK signals. These signals are also a relatively new traffic control device, and may not be fully understood by drivers. The NCHRP Report 674 ana-lyzed driver behavior at HAWK signals. Figure 2.4 summarizes the results of the NCHRP Report 674 evaluation.
Figure 2.4: Evaluation of Driver Behavior at HAWK Signals
The figure above shows that 12.6% of the vehicles were observed to proceed through the crosswalk during the “Solid Red” phase, which they are legally required to stop at and remain stopped until the phase changes. Conversely, 48.2% of vehicles were remained stopped during the “Flashing Red” phase when they are able to proceed when the crosswalk is clear; suggesting some inefficiency in driver knowledge in response to the HAWK signals.
2.4 Truck Maneuvers in Roundabouts
According to the MDOT Roundabout Guidance document, roundabouts are typically designed for a WB-62 truck. This design would allow large vehicles to circumnavigate the roundabouts. Where ge-ometry would be limited and a roundabout design for a WB-50 or WB-62 may not be possible, truck aprons are an option.
65.9%
88.6% 87.4%
48.2%
34.1%
11.4% 12.6%
51.8%
0%
10%
20%
30%
40%
50%
60%
70%
80%
90%
100%
Flash Yellow Solid Yellow Solid Red Flash Red
Signal Phase
ProceedingthroughCrosswalk
Stopped orStopping
Evaluating the Performance and Safety Effectiveness of Roundabouts
2-11
WisDOT defines truck aprons as a traversable portion of the central island adjacent to the circulatory roadway. It is required to accommodate snow plows and off-tracKing of trucks. The FHWA recom-mends using a truck apron when there are no means for providing adequate deflection while ac-commodating the design vehicle because the aprons provide a lower level of operation than standard non-mountable islands. The MDOT Roundabout Guidance Document explains two methods of two lane roundabouts to ac-commodate large vehicles. The first method is to assume that the truck will utilize more than one lane to enter, circulate, and exit the roundabout. The second method is to design the roundabout so that each lane within the roundabout can accommodate a large truck. The second method is not as commonly used because the overall geometry of the roundabout is typically larger, possibly resulting in increased right-of-way needs, higher cost, and a potential for increases in certain types of crashes. A study by the Center for Transportation Research and Education12 in 2008 examined the network of roundabouts in Bend, Oregon. The study determined lessons that should be learned from the City of Bend implementation of the roundabouts. The lessons learned include:
When accommodating trucks, truck apron height should discourage passenger vehicles and al-
low for easy maintenance (i.e. plowing)
Trucks should be allowed to use both lanes in a two-lane roundabout to minimize the design
footprint.
2.5 Traffic Control Devices within Roundabouts
Traffic control devices within roundabouts are used in order to enhance safety and traffic operations. As previously mentioned in 2.3.1, two-lane roundabouts may be challenging and not accessible for visually impaired pedestrians without the provisions of additional crossing treatments. These addi-tional provisions include, but are not limited to:
Pedestrian Hybrid Beacons (PHB, also known as HAWK signals)
Flashing pedestrian beacons (Including the Rectangular Rapid Flashing Beacon)
Raised sidewalks
The NCHRP Report 674 analyzed the effectiveness of the HAWK signal and raised sidewalk as possible treatments at roundabout intersections. Both of the treatments showed significant improvements in pedestrian delay and pedestrian risk. Additional traffic control devices utilized at roundabouts may include advanced signing, destination and lane use signs, and chevron signs located in the central island.
12
Isebrands, H., S. Hallmark, E. Fitzsimmons, and J. Stroda. Toolbox to Evaluate the Impacts of Roundabouts on a Corridor or Roadway Network. Center for Transportation Research and Education, Ames, IA, July 2008.
Evaluating the Performance and Safety Effectiveness of Roundabouts
2-12
2.6 Costs
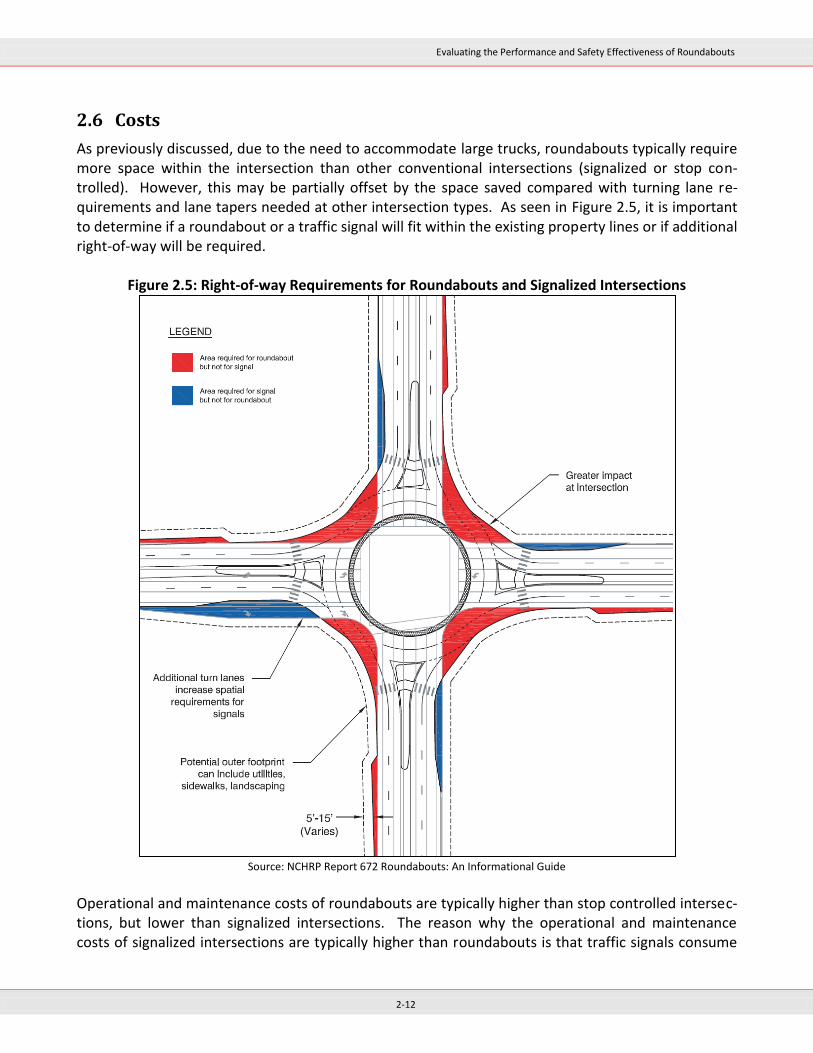
As previously discussed, due to the need to accommodate large trucks, roundabouts typically require more space within the intersection than other conventional intersections (signalized or stop con-trolled). However, this may be partially offset by the space saved compared with turning lane re-quirements and lane tapers needed at other intersection types. As seen in Figure 2.5, it is important to determine if a roundabout or a traffic signal will fit within the existing property lines or if additional right-of-way will be required.
Figure 2.5: Right-of-way Requirements for Roundabouts and Signalized Intersections
Source: NCHRP Report 672 Roundabouts: An Informational Guide
Operational and maintenance costs of roundabouts are typically higher than stop controlled intersec-tions, but lower than signalized intersections. The reason why the operational and maintenance costs of signalized intersections are typically higher than roundabouts is that traffic signals consume
Evaluating the Performance and Safety Effectiveness of Roundabouts
2-13
electricity and require periodic services to replace bulbs, detectors, and require periodic signal re-timings. The ambient lighting for roundabout and signalized intersections is typically greater than that at stop controlled intersections.
When conducting an economic evaluation of what intersection type is best suited for a given inter-section it is important to account for both the costs and benefits of each alternative. While in some instances, the costs of the construction of a roundabout may be greater than other intersection types, the benefits of utilizing a roundabout may be greater than other intersection types. The NCHRP Report 672 suggests utilizing the benefit-cost analysis method when evaluating public work projects of this type. As previously discussed, roundabouts have been shown to decrease crash rates and also decrease vehicle delay and emissions in most instances. Mandavilli, Russell, and Rys13 (2003) conducted a study that evaluated three locations in Kansas where roundabouts replaced all way stop controlled intersections. The results of this study were:
Carbon Monoxide (CO) emissions reduced by 38% and 45%
Particulate Matter (PM) reduced by 45%
Carbon Dioxide (CO2) reduced by 55% and 61%
Nitrogen Oxide (NOx) reduced by 44% and 51%
Hydrocarbons (HC) reduced by 62% and 68%
Statistically significant decrease in delay, queuing, and stopping
Varhelyi14 (2002) conducted a study evaluating the effects of the implementation of a roundabout at signalized intersections. The results of this study were:
Number of vehicles stopping reduced from 63% to 26%
Carbon Monoxide (CO) emissions reduced by 29%
Nitrogen Oxide (NOx) reduced by 21%
Fuel consumption reduced by 28%
2.7 Winter Operations
The NCHRP Report 672 outlines snow removal at roundabouts in the maintenance section. The re-port states that the geometric layout of a roundabout should be designed to accommodate the width of a snow plow. Many jurisdictions have standard widths for snow plows, and they should be ac-counted for within the design stage. The NCHRP Report 672 also states that some maintenance crews have noted that roundabouts make it easier to turn around snowplows
13
Mandavilli, S., E. R. Russell, and M. J. Rys. Impact of Modern Roundabouts on Vehicular Emissions. Proceedings of the 2003 Mid-Continent Transportation Research Symposium, Ames, IA, August 2003. 14
Varhelyi, Andras. The Effects of Small Roundabouts on Emissions and Fuel Consumption: A Case Study. Transportation Research Part D. Vol. 7. 2002, pp. 65-71.

Evaluating the Performance and Safety Effectiveness of Roundabouts
2-14
The MDOT Roundabout Guidance Document along with the WisDOT Roundabout Guide also provides information on snow removal at roundabout intersections. They state that snow removal should be conducted from the inside of the roundabout to the outside of the roundabout. This is done to keep the storage of the snow away from the central island as much as possible. The storage should also not create sight obstructions for drivers as well as they should not affect pedestrian access through a roundabout.
Evaluating the Performance and Safety Effectiveness of Roundabouts
3-1
3.0 Best Practices Review
Current MDOT guidance related to roundabouts is primarily included in MDOT’s roundabout guide which was published in November 2007. Since that time, there have been many developments relat-ed to best practices. Specifically, FHWA has updated their roundabout guide (published as NCHRP report 672), numerous other states have developed or updated their guides with applicable infor-mation, additional research studies have been conducted, and roundabout design philoso-phy/techniques have evolved. As part of the MDOT Roundabout Study, numerous guides, reports, scholarly research articles, and studies were reviewed to identify best practices being used by FHWA, other State Highway Agencies, and municipalities. The following best practices should be considered for inclusion in applicable MDOT guidance and policies. The practices noted below are described in general terms and do not include specific design details. 1. Update policies and guidance to be consistent with the revised FHWA Roundabout Guide (NCHRP
Report 672). It is recommended that a thorough evaluation would be conducted to ascertain all areas where updates are needed. Specific areas of emphasis could include the following:
Mini-Roundabouts – Consideration should be given to including guidance for mini-roundabouts per FHWA Roundabout Guide. Although MDOT may have limited opportunities for implementing mini-roundabouts on the state trunk highway system, MDOT should consid-er mini-roundabouts at locations such as on low-speed roadways with congestion problems (may be applicable on some state trunk routes in downtown areas). As noted in the FHWA Roundabout Guide, mini-roundabouts operate in the same manner as larger roundabouts and can help reduce delays and improve safety at physically constrained intersections. In addition to the FHWA Roundabout Guide, FHWA is currently undertaking a nationwide study to devel-op design recommendations and applications for mini-roundabouts. MDOT should consider incorporating the results of this study in the MDOT Roundabout Guide in order to provide in-formation that may be helpful to state and local officials.
Preventing exiting and circulating conflicts – Incorporate language/design criteria from the FHWA Roundabout Guide for preventing exiting and circulating conflicts at multi-lane rounda-bouts. As noted in Section 6.5.6 - Exit Curves, conflicts can occur if appropriate lane assign-ments are not provided, as a result of inadequate horizontal design features, and/or if there is too much separation between an entry and adjacent exit. The guide provides effective design measures to prevent such exiting and circulating conflicts.
Conditions for using simulations –There may be certain complex situations where model simu-lations can provide additional benefits beyond the isolated intersection analysis offered by RODEL. The FHWA Roundabout Guide notes that many different simulation software pack-ages are available for modeling roundabouts. Any simulation software that is used should be calibrated to reflect the capacities and delays predicted by RODEL, ARCADY, and Sychro 8.0.
Applying HSM for crash analyses – NCHRP Report 572 used U.S. data to develop safety predic-tion models for intersection and approach analysis. The models have been included in the re-cently published Highway Safety Manual (HSM). Therefore, if detailed crash analysis is being
Evaluating the Performance and Safety Effectiveness of Roundabouts
3-2
performed related to roundabouts, the HSM crash procedures could be used as an evaluation method.
Trucks – The FHWA Roundabout Guide (Section 6.5.7) illustrates design options for accommo-dating trucks - either staying in lane or using both lanes to navigate the intersection.
Lighting – The FHWA Roundabout Guide (Chapter 8) provides a detailed summary of recom-mended lighting considerations based on the Design Guide for Roundabout Lighting (Illumina-tion Engineering Society).
Landscaping – The FHWA Roundabout Guide (Chapter 9) provides general landscaping princi-ples and guidance for landscaping the central island, splitter islands, and approaches.
Bypass lanes – The FHWA Roundabout Guide (Section 6.8.6) illustrates options and considera-tions for designing right-turn bypass lanes.
Pedestrian and bicycle accommodations – The FHWA Roundabout Guide provides general guidance for pedestrian and bicycle facilities at roundabouts.
Concrete jointing – The FHWA Roundabout Guide (Section 6.8.8.2) provides information for designing joint patterns when using concrete at roundabouts.
Signing and marking per new MUTCD – Develop signing and marking language consistent with the federal MUTCD (Section 2B.45 and Chapter 3C, respectively).
2. Incorporate information from the Wisconsin Department of Transportation (WisDOT) Roundabout
Guide– Facilities Development Manual (FDM). It is recommended that an evaluation would be conducted to ascertain areas where information could be adapted to improve MDOT’s policies. Specific areas of emphasis should include, at a minimum, the following:
Truck accommodation – Section 30.5.4 of the FDM. o Oversize/overweight (OS/OW) truck accommodation o Develop statewide freight network, identifying OS/OW routes to help guide rounda-
bout locations and size
Methods for avoiding path overlap – Section 30.5.16 of the FDM
Splitter island design and curbing for high speed approaches – Section 30.5.18 of the FDM
Measuring phi – Section 30.5.20 of the FDM
Methods for constructing a fast path spline – FDM 11-26-50, Attachment 50.1 3. Incorporate findings from the WisDOT/Minnesota Department of Transportation (Mn/DOT) Joint
Truck Study which is currently underway. This study investigates design methods for accommo-dating trucks at multi-lane roundabouts. Phase 1 is a synthesis of current design practice and has been completed. Phase 3 of the study includes design guidelines for accommodating trucks. This information will be incorporated into the WisDOT and Mn/DOT roundabout guides.
4. Considering the very significant safety benefits provided by roundabouts and the fact that this
intersection type often provides better traffic flows at similar/lower cost (relative to other inter-section types), MDOT should consider adopting a formal policy requiring careful consideration (along with other viable options) and utilization of roundabouts at all appropriate locations on the state trunk highway system. Such a policy could require that roundabouts (along with other via-
Evaluating the Performance and Safety Effectiveness of Roundabouts
3-3
ble options) be fully evaluated for all planning and design projects meeting certain criteria (crite-ria would be broad so that most capital projects at intersections would be covered). Such a policy would be consistent with FHWA directives. Specifically, FHWA’s Guidance Memorandum on Con-sideration and Implementation of Proven Safety Countermeasures (dated July 10, 2008, revised July 1, 2009) states the following:
Roundabouts are the preferred safety alternative for a wide range of intersections. Although they may not be appropriate in all circumstances, they should be considered as an alternative for all proposed new intersections on Federally-funded highway projects, particularly those with major road volumes less than 90 percent of the total entering volume. Roundabouts should also be considered for all existing intersections that have been identified as needing major safety or operational improvements. This would include freeway interchange ramp ter-minals and rural intersections.
Many other State Highway Agencies have adopted policies and guidance which result in greater utili-zation of this intersection type. Some state DOT’s (such as New York, Alaska) have adopted a “round-about first” approach to intersection design. These states require that a roundabout be used as the intersection of choice unless there are certain reasonable conditions which would preclude the use of a roundabout. Other states (such as Wisconsin) have policies which encourage roundabout use in appropriate situations (i.e., not “roundabout first”, but still highlighting the importance of seriously considering roundabouts), and their staff members are fairly aggressive in implementing roundabouts at appropriate locations where an objective comparison to other options shows roundabouts to be the best solution. Although a “roundabout first” policy may not be appropriate for MDOT, the best practice of careful comparison to other options could be highlighted by MDOT. 5. Section 6.8.5.4 of the FHWA Roundabout Guide shows the use of a succession of three curves
(chicane) to achieve speed reduction on high speed approaches prior to the roundabout. Availa-ble research does not demonstrate any safety benefits associated with this design method. Therefore, except in unusual cases, this design technique is not recommended for inclusion in the MDOT Roundabout Guide.
6. Require MDOT’s Local Agency Program projects to follow all aspects of FHWA and MDOT policies
and guidance, including application of roundabout guides. 7. Require uniform information be provided to MDOT’s Geometric Design Unit (GDU) for rounda-
bout reviews. Information needed could be modeled after WisDOT Roundabout Guide (FDM 11-26-5) which includes:
Table of critical design parameters
Truck turn graphics
Fast path graphics
Sight distance graphics
RODEL, ARCADY, or Synchro 8.0 outputs
Evaluating the Performance and Safety Effectiveness of Roundabouts
3-4
8. Pedestrian Facilities – Since the development of the MDOT Roundabout Guide, numerous studies and reports have been undertaken related to pedestrian accessibility, pedestrian facility types, and accommodation of pedestrians with disabilities. Therefore, it is recommended that the MDOT Roundabout Guide provide updated information related to this topic, to include the fol-lowing:
Incorporation of applicable results from NCHRP Report 674: Crossing Solutions at Rounda-bouts and Channelized Turn Lanes for Pedestrians with Vision Disabilities and related studies is recommended. Criteria could be developed for utilizing the following elements:
o Pedestrian Hybrid Beacons (HAWK signal) o Rectangular Rapid Flashing Beacon (RRFB) o Raised crosswalks/speed table. o Z-style crosswalks
Incorporation of applicable findings from the Oakland County, Michigan lawsuit regarding ADA accommodations at roundabouts15.
Consider installing Z-style crosswalks at multi-lane roundabouts, regardless of whether PHB’s are used.
9. Develop standard traffic counting methodology for roundabouts. 10. Incorporate complete street policy recommendations into the MDOT Roundabout Guide. MDOT
is currently developing a complete street policy. It is recommended that the two documents are integrated as applicable.
11. Discourage the use of radial design techniques at three lane roundabouts. Alternatively, empha-
sis should be placed upon providing optimal entry angles of 20 degrees or greater.
12. Develop example drawings to illustrate common roundabout design situations. This would not include standard drawings that apply in all situations however it would provide novice designers basic guidance and help illustrate good design techniques.
13. If MDOT provides guidance for teardrop roundabout designs, their effect on the capacity of the
next downstream entry must be assessed carefully. This is because a teardrop scheme will result in one entry that is free-flowing (i.e., does not yield). Under such conditions, the capacity of the next entry downstream is reduced. Additionally, RODEL, ARCADY, Synchro 8.0, and many other software packages may not accurately model the downstream entry since many software packag-es assume yielding at all entries. As a result, designers will need to take this into consideration. These capacity and modeling implications should be reflected in any new guidance provided by MDOT.
15
Department of Blindness and Low Vision Studies – Western Michigan University, Institute for Transportation Research and Education – North Carolina State University, Accessible Design for the Blind. Kittelson & Associates. Road Commission for Oakland County PHB and RRFB Study. 2011
Evaluating the Performance and Safety Effectiveness of Roundabouts
3-5
14. Consider using a phased approach to construction of multi-lane roundabouts, especially where three-lane roundabouts are being considered. A phased approach typically involves initial con-struction of geometry that will accommodate opening day volumes plus five to ten years of traffic growth. Once certain “trigger” volumes are reached, the roundabout can be “converted” to the ultimate long term design. Typically, this will involve adding additional lanes. Different ap-proaches to adding lanes are available and should be assessed in the new guidance.
15. Consider the use of overhead lane signs. In certain limited circumstances, it may be beneficial to
consider the use of overhead signs to guide motorists as they approach a roundabout. Incorpora-tion of information from the WisDOT Roundabout Guide–FDM (Section 35.1.3.2) could be consid-ered. Criteria identifying when overhead signs should be used could also be developed.
16. Consider the use of alternative software packages to model roundabouts in order to determine
capacity and delay. With the recent publication of the 2010 HCM, the HCM methodology should be considered as an adequate analysis tool. The HCM procedure utilized U.S. data to develop a methodology to determine a roundabouts capacity, delay, and Level of Service. There are many other software packages available (VISSIM, ARACDY, RODEL, 2010 HCM, etc) and it should be de-termined what is the best software package to use when modeling roundabout traffic patterns.
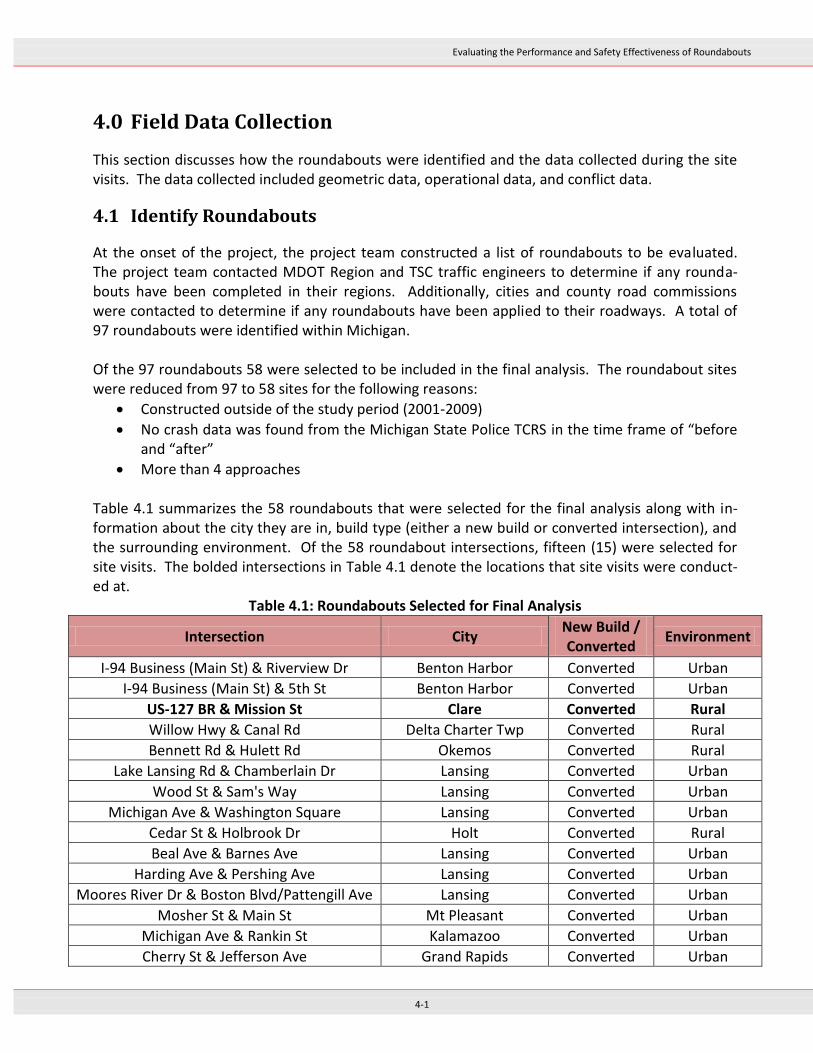
Evaluating the Performance and Safety Effectiveness of Roundabouts
4-1
4.0 Field Data Collection
This section discusses how the roundabouts were identified and the data collected during the site visits. The data collected included geometric data, operational data, and conflict data.
4.1 Identify Roundabouts
At the onset of the project, the project team constructed a list of roundabouts to be evaluated. The project team contacted MDOT Region and TSC traffic engineers to determine if any rounda-bouts have been completed in their regions. Additionally, cities and county road commissions were contacted to determine if any roundabouts have been applied to their roadways. A total of 97 roundabouts were identified within Michigan. Of the 97 roundabouts 58 were selected to be included in the final analysis. The roundabout sites were reduced from 97 to 58 sites for the following reasons:
Constructed outside of the study period (2001-2009)
No crash data was found from the Michigan State Police TCRS in the time frame of “before and “after”
More than 4 approaches Table 4.1 summarizes the 58 roundabouts that were selected for the final analysis along with in-formation about the city they are in, build type (either a new build or converted intersection), and the surrounding environment. Of the 58 roundabout intersections, fifteen (15) were selected for site visits. The bolded intersections in Table 4.1 denote the locations that site visits were conduct-ed at.
Table 4.1: Roundabouts Selected for Final Analysis
Intersection City New Build / Converted
Environment
I-94 Business (Main St) & Riverview Dr Benton Harbor Converted Urban
I-94 Business (Main St) & 5th St Benton Harbor Converted Urban
US-127 BR & Mission St Clare Converted Rural
Willow Hwy & Canal Rd Delta Charter Twp Converted Rural
Bennett Rd & Hulett Rd Okemos Converted Rural
Lake Lansing Rd & Chamberlain Dr Lansing Converted Urban
Wood St & Sam's Way Lansing Converted Urban
Michigan Ave & Washington Square Lansing Converted Urban
Cedar St & Holbrook Dr Holt Converted Rural
Beal Ave & Barnes Ave Lansing Converted Urban
Harding Ave & Pershing Ave Lansing Converted Urban
Moores River Dr & Boston Blvd/Pattengill Ave Lansing Converted Urban
Mosher St & Main St Mt Pleasant Converted Urban
Michigan Ave & Rankin St Kalamazoo Converted Urban
Cherry St & Jefferson Ave Grand Rapids Converted Urban
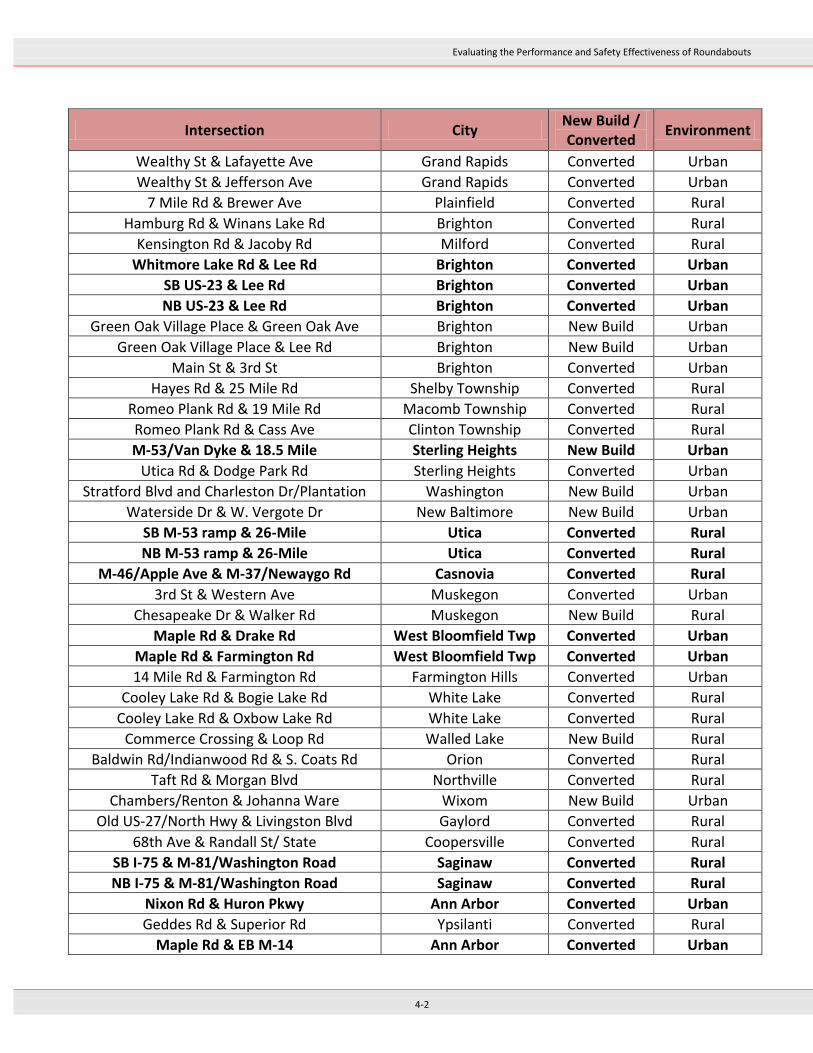
Evaluating the Performance and Safety Effectiveness of Roundabouts
4-2
Intersection City New Build / Converted
Environment
Wealthy St & Lafayette Ave Grand Rapids Converted Urban
Wealthy St & Jefferson Ave Grand Rapids Converted Urban
7 Mile Rd & Brewer Ave Plainfield Converted Rural
Hamburg Rd & Winans Lake Rd Brighton Converted Rural
Kensington Rd & Jacoby Rd Milford Converted Rural
Whitmore Lake Rd & Lee Rd Brighton Converted Urban
SB US-23 & Lee Rd Brighton Converted Urban
NB US-23 & Lee Rd Brighton Converted Urban
Green Oak Village Place & Green Oak Ave Brighton New Build Urban
Green Oak Village Place & Lee Rd Brighton New Build Urban
Main St & 3rd St Brighton Converted Urban
Hayes Rd & 25 Mile Rd Shelby Township Converted Rural
Romeo Plank Rd & 19 Mile Rd Macomb Township Converted Rural
Romeo Plank Rd & Cass Ave Clinton Township Converted Rural
M-53/Van Dyke & 18.5 Mile Sterling Heights New Build Urban
Utica Rd & Dodge Park Rd Sterling Heights Converted Urban
Stratford Blvd and Charleston Dr/Plantation Washington New Build Urban
Waterside Dr & W. Vergote Dr New Baltimore New Build Urban
SB M-53 ramp & 26-Mile Utica Converted Rural
NB M-53 ramp & 26-Mile Utica Converted Rural
M-46/Apple Ave & M-37/Newaygo Rd Casnovia Converted Rural
3rd St & Western Ave Muskegon Converted Urban
Chesapeake Dr & Walker Rd Muskegon New Build Rural
Maple Rd & Drake Rd West Bloomfield Twp Converted Urban
Maple Rd & Farmington Rd West Bloomfield Twp Converted Urban
14 Mile Rd & Farmington Rd Farmington Hills Converted Urban
Cooley Lake Rd & Bogie Lake Rd White Lake Converted Rural
Cooley Lake Rd & Oxbow Lake Rd White Lake Converted Rural
Commerce Crossing & Loop Rd Walled Lake New Build Rural
Baldwin Rd/Indianwood Rd & S. Coats Rd Orion Converted Rural
Taft Rd & Morgan Blvd Northville Converted Rural
Chambers/Renton & Johanna Ware Wixom New Build Urban
Old US-27/North Hwy & Livingston Blvd Gaylord Converted Rural
68th Ave & Randall St/ State Coopersville Converted Rural
SB I-75 & M-81/Washington Road Saginaw Converted Rural
NB I-75 & M-81/Washington Road Saginaw Converted Rural
Nixon Rd & Huron Pkwy Ann Arbor Converted Urban
Geddes Rd & Superior Rd Ypsilanti Converted Rural
Maple Rd & EB M-14 Ann Arbor Converted Urban
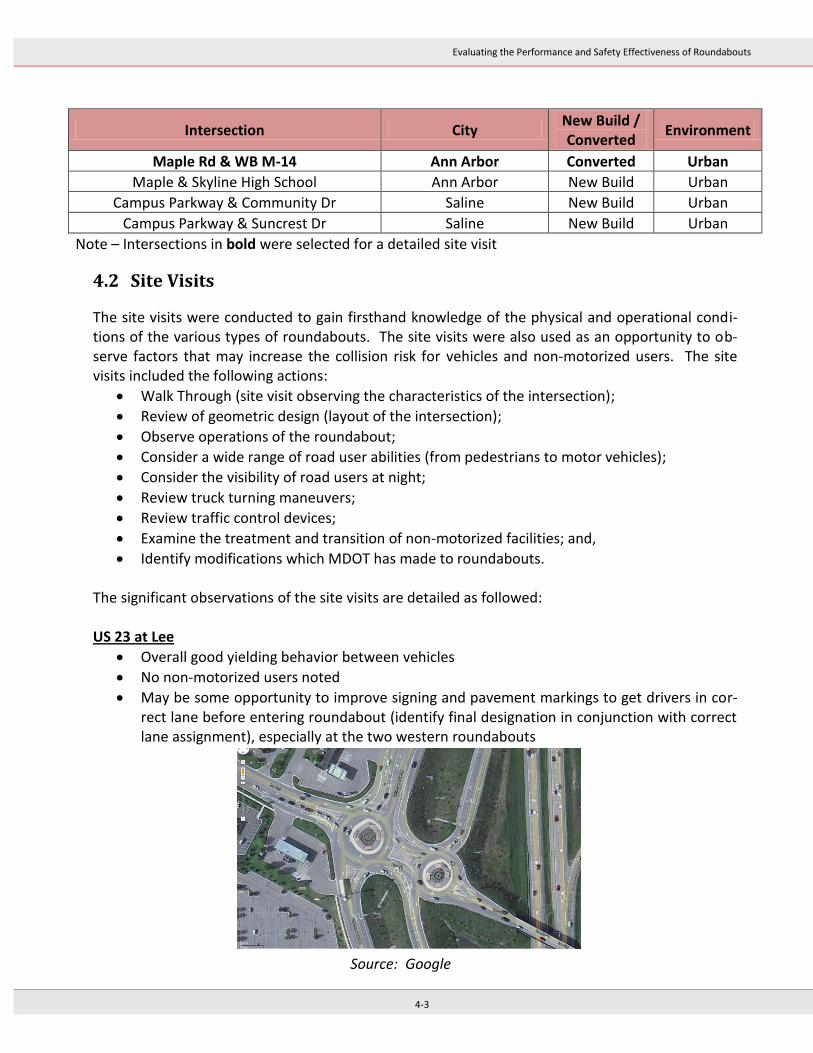
Evaluating the Performance and Safety Effectiveness of Roundabouts
4-3
Intersection City New Build / Converted
Environment
Maple Rd & WB M-14 Ann Arbor Converted Urban
Maple & Skyline High School Ann Arbor New Build Urban
Campus Parkway & Community Dr Saline New Build Urban
Campus Parkway & Suncrest Dr Saline New Build Urban
Note – Intersections in bold were selected for a detailed site visit
4.2 Site Visits
The site visits were conducted to gain firsthand knowledge of the physical and operational condi-tions of the various types of roundabouts. The site visits were also used as an opportunity to ob-serve factors that may increase the collision risk for vehicles and non-motorized users. The site visits included the following actions:
Walk Through (site visit observing the characteristics of the intersection);
Review of geometric design (layout of the intersection);
Observe operations of the roundabout;
Consider a wide range of road user abilities (from pedestrians to motor vehicles);
Consider the visibility of road users at night;
Review truck turning maneuvers;
Review traffic control devices;
Examine the treatment and transition of non-motorized facilities; and,
Identify modifications which MDOT has made to roundabouts. The significant observations of the site visits are detailed as followed: US 23 at Lee
Overall good yielding behavior between vehicles
No non-motorized users noted
May be some opportunity to improve signing and pavement markings to get drivers in cor-rect lane before entering roundabout (identify final designation in conjunction with correct lane assignment), especially at the two western roundabouts
Source: Google
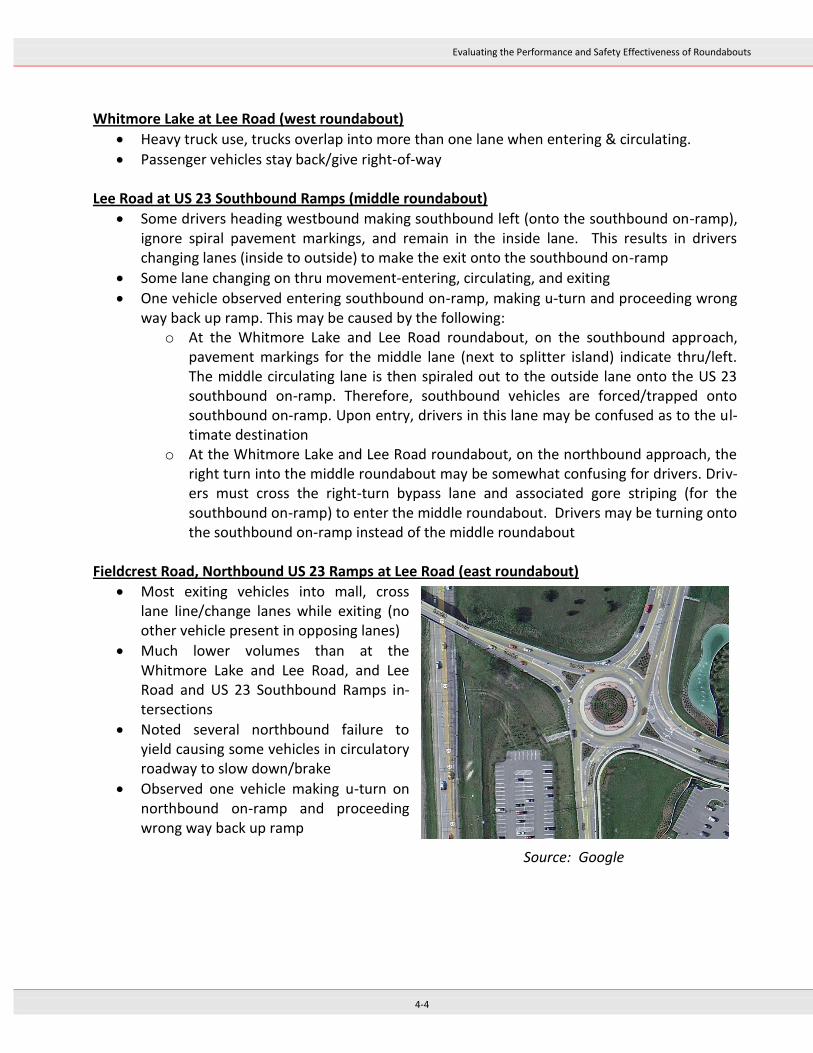
Evaluating the Performance and Safety Effectiveness of Roundabouts
4-4
Whitmore Lake at Lee Road (west roundabout)
Heavy truck use, trucks overlap into more than one lane when entering & circulating.
Passenger vehicles stay back/give right-of-way Lee Road at US 23 Southbound Ramps (middle roundabout)
Some drivers heading westbound making southbound left (onto the southbound on-ramp), ignore spiral pavement markings, and remain in the inside lane. This results in drivers changing lanes (inside to outside) to make the exit onto the southbound on-ramp
Some lane changing on thru movement-entering, circulating, and exiting
One vehicle observed entering southbound on-ramp, making u-turn and proceeding wrong way back up ramp. This may be caused by the following:
o At the Whitmore Lake and Lee Road roundabout, on the southbound approach, pavement markings for the middle lane (next to splitter island) indicate thru/left. The middle circulating lane is then spiraled out to the outside lane onto the US 23 southbound on-ramp. Therefore, southbound vehicles are forced/trapped onto southbound on-ramp. Upon entry, drivers in this lane may be confused as to the ul-timate destination
o At the Whitmore Lake and Lee Road roundabout, on the northbound approach, the right turn into the middle roundabout may be somewhat confusing for drivers. Driv-ers must cross the right-turn bypass lane and associated gore striping (for the southbound on-ramp) to enter the middle roundabout. Drivers may be turning onto the southbound on-ramp instead of the middle roundabout
Fieldcrest Road, Northbound US 23 Ramps at Lee Road (east roundabout)
Most exiting vehicles into mall, cross lane line/change lanes while exiting (no other vehicle present in opposing lanes)
Much lower volumes than at the Whitmore Lake and Lee Road, and Lee Road and US 23 Southbound Ramps in-tersections
Noted several northbound failure to yield causing some vehicles in circulatory roadway to slow down/brake
Observed one vehicle making u-turn on northbound on-ramp and proceeding wrong way back up ramp
Source: Google
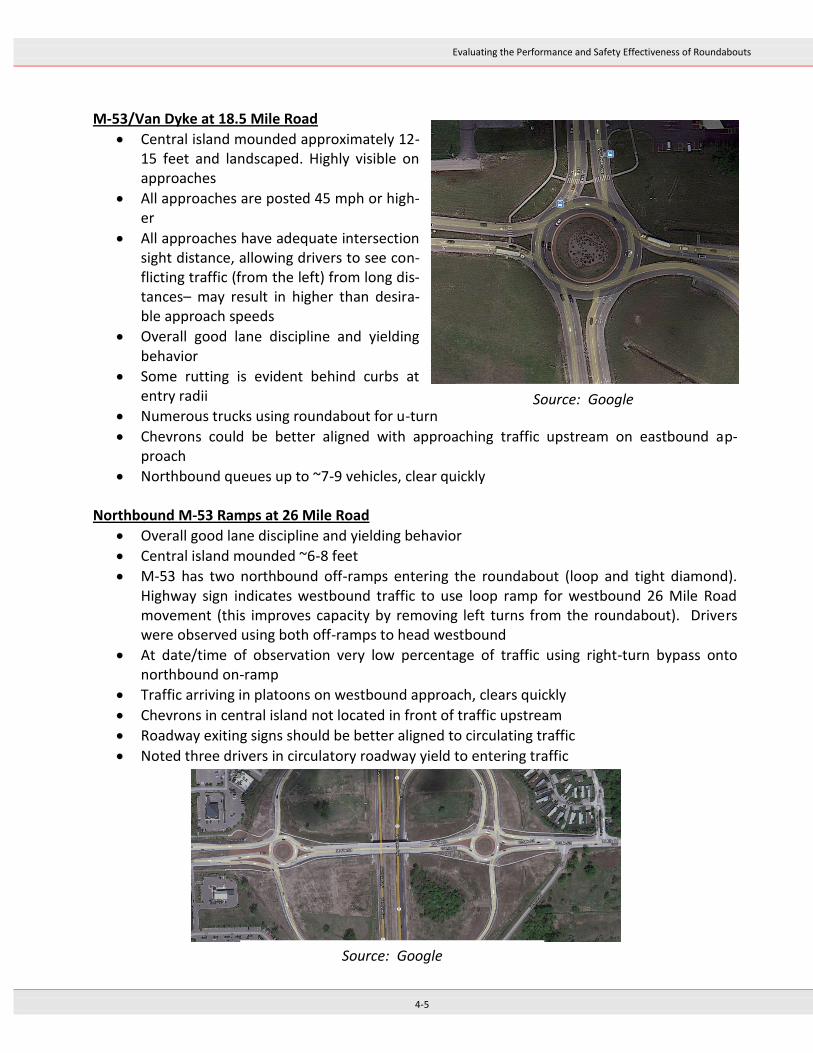
Evaluating the Performance and Safety Effectiveness of Roundabouts
4-5
M-53/Van Dyke at 18.5 Mile Road
Central island mounded approximately 12-15 feet and landscaped. Highly visible on approaches
All approaches are posted 45 mph or high-er
All approaches have adequate intersection sight distance, allowing drivers to see con-flicting traffic (from the left) from long dis-tances– may result in higher than desira-ble approach speeds
Overall good lane discipline and yielding behavior
Some rutting is evident behind curbs at entry radii
Numerous trucks using roundabout for u-turn
Chevrons could be better aligned with approaching traffic upstream on eastbound ap-proach
Northbound queues up to ~7-9 vehicles, clear quickly Northbound M-53 Ramps at 26 Mile Road
Overall good lane discipline and yielding behavior
Central island mounded ~6-8 feet
M-53 has two northbound off-ramps entering the roundabout (loop and tight diamond). Highway sign indicates westbound traffic to use loop ramp for westbound 26 Mile Road movement (this improves capacity by removing left turns from the roundabout). Drivers were observed using both off-ramps to head westbound
At date/time of observation very low percentage of traffic using right-turn bypass onto northbound on-ramp
Traffic arriving in platoons on westbound approach, clears quickly
Chevrons in central island not located in front of traffic upstream
Roadway exiting signs should be better aligned to circulating traffic
Noted three drivers in circulatory roadway yield to entering traffic
Source: Google
Source: Google
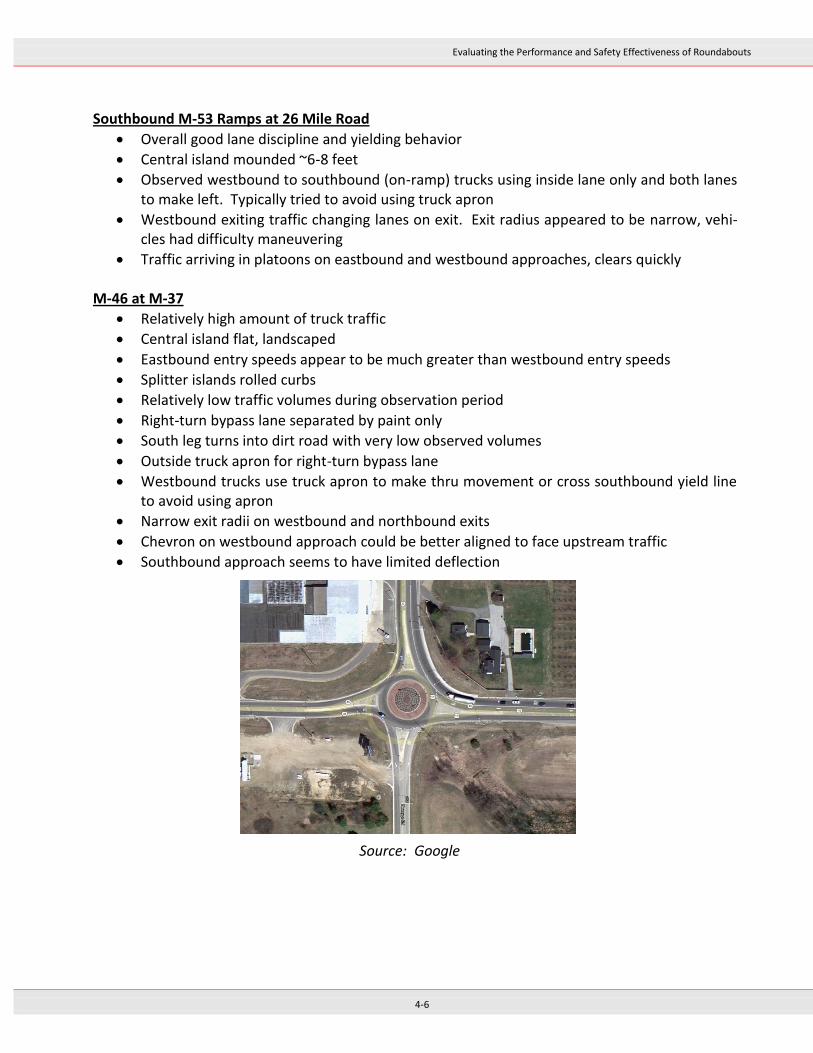
Evaluating the Performance and Safety Effectiveness of Roundabouts
4-6
Southbound M-53 Ramps at 26 Mile Road
Overall good lane discipline and yielding behavior
Central island mounded ~6-8 feet
Observed westbound to southbound (on-ramp) trucks using inside lane only and both lanes to make left. Typically tried to avoid using truck apron
Westbound exiting traffic changing lanes on exit. Exit radius appeared to be narrow, vehi-cles had difficulty maneuvering
Traffic arriving in platoons on eastbound and westbound approaches, clears quickly
M-46 at M-37
Relatively high amount of truck traffic
Central island flat, landscaped
Eastbound entry speeds appear to be much greater than westbound entry speeds
Splitter islands rolled curbs
Relatively low traffic volumes during observation period
Right-turn bypass lane separated by paint only
South leg turns into dirt road with very low observed volumes
Outside truck apron for right-turn bypass lane
Westbound trucks use truck apron to make thru movement or cross southbound yield line to avoid using apron
Narrow exit radii on westbound and northbound exits
Chevron on westbound approach could be better aligned to face upstream traffic
Southbound approach seems to have limited deflection
Source: Google
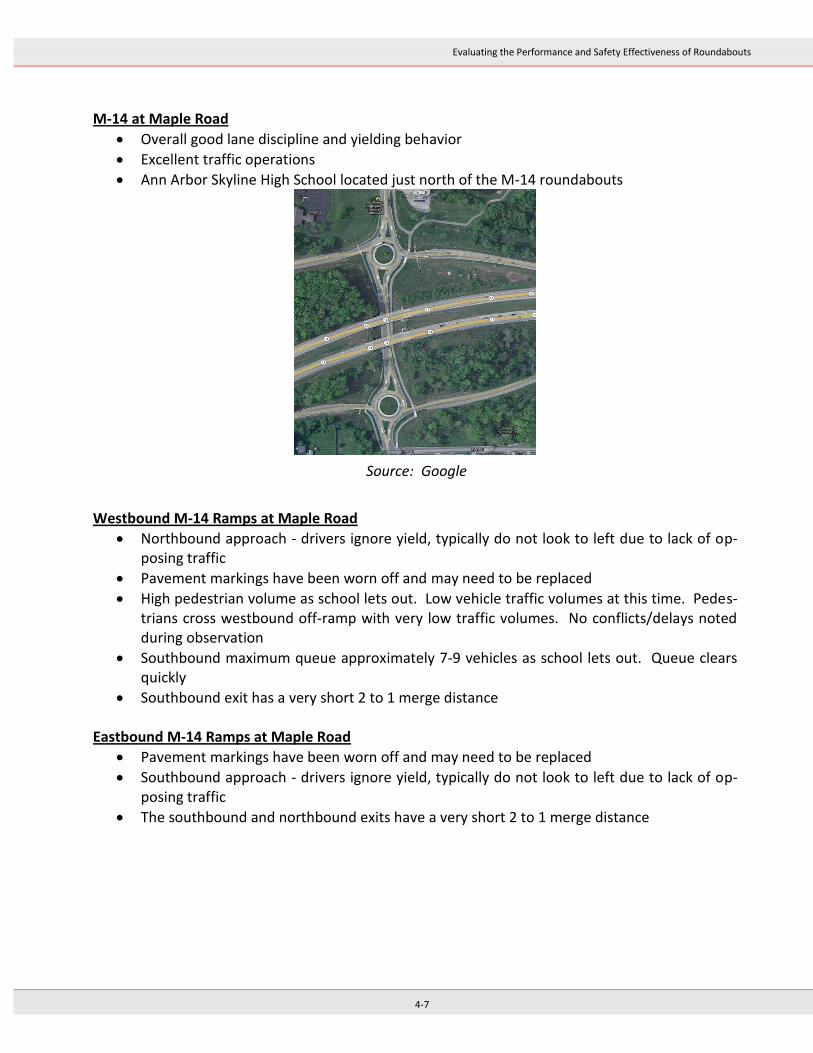
Evaluating the Performance and Safety Effectiveness of Roundabouts
4-7
M-14 at Maple Road
Overall good lane discipline and yielding behavior
Excellent traffic operations
Ann Arbor Skyline High School located just north of the M-14 roundabouts
Westbound M-14 Ramps at Maple Road
Northbound approach - drivers ignore yield, typically do not look to left due to lack of op-posing traffic
Pavement markings have been worn off and may need to be replaced
High pedestrian volume as school lets out. Low vehicle traffic volumes at this time. Pedes-trians cross westbound off-ramp with very low traffic volumes. No conflicts/delays noted during observation
Southbound maximum queue approximately 7-9 vehicles as school lets out. Queue clears quickly
Southbound exit has a very short 2 to 1 merge distance Eastbound M-14 Ramps at Maple Road
Pavement markings have been worn off and may need to be replaced
Southbound approach - drivers ignore yield, typically do not look to left due to lack of op-posing traffic
The southbound and northbound exits have a very short 2 to 1 merge distance
Source: Google

Evaluating the Performance and Safety Effectiveness of Roundabouts
4-8
Huron Parkway at Nixon Road
High pedestrian volumes with large percentage of elderly pedestrians (senior housing near roundabout)
On all legs, pedestrian crossings were identified with an overhead pedestrian (black on yel-low) warning sign attached to a mast arm (pole located in splitter island). Rumble strips were also embedded in the roadway prior to the crosswalks to alert pedestrians of ap-proaching vehicles
Observed visually impaired pedestrian with a white cane cross east and south legs of roundabout. The visually impaired pedestrian crossed both legs with little to no hesitation. Approaching vehicles yielded where appropriate and waited for pedestrian to cross
Overall pedestrian/vehicle interaction excellent. Pedestrians made eye contact with drivers before crossing. Drivers almost always yielded to pedestrians
High volume of single unit trucks and large trucks (WB-50+). Semi-trucks used apron to make lefts
No yield signs were present in the east and west leg splitter islands
Outside truck aprons used for the southbound and northbound right turns. Observed one pedestrian on the truck apron in southeast quadrant
Observed three failure to yield on southbound approach, resulting one near miss (circulat-ing driver came to complete stop to avoid hitting entering driver). Drivers entering south-bound at relatively high speed
No northbound chevron/one way sign in central island
Vehicle speeds appeared high for the westbound right turn movement, resulting in a lower yield rate
Northbound exit radius appears to be narrow. Tire marks on curb and the curb was broken at exit
Yield signs obstructed by mast pole/mast arms and pedestrian signs
Source: Google

Evaluating the Performance and Safety Effectiveness of Roundabouts
4-9
Maple Road at Farmington Road
Vehicles often seen to be changing lanes at exits and entries
Central island mounded ~6-8 feet
Drivers impatient, forcing gaps, changing lanes in circulating roadway and on exit
No semi-trucks observed
Some unbalanced lane use on westbound and eastbound approaches, drivers staying in in-side lane once approach road widens to 3 lanes
Approximately 6-8 pedestrians observed. Two used push buttons to activate HAWK signals. Others crossed mid-block or crossed at crosswalk without activating HAWK
Approximately three drivers ignored flashing red indication when HAWK signal activated
Two southbound approach lanes with three corresponding circulating lanes
Aggressive driver behavior on westbound exit resulted in merge conflicts. Behavior includ-ed:
o Drivers rapidly accelerating to get ahead of adjacent driver o Drivers forcing merge, driver in adjacent lane not giving space o Drivers changing lanes immediately after leaving circulatory roadway
Maple Road at Drake Road
Central island mounded ~6-8 feet
Drivers impatient, forcing gaps, changing lanes in circulating roadway and on exit
Low truck volumes
Some unbalanced lane use on westbound and eastbound approaches, drivers staying in in-side lane once approach road widens to 3 lanes
Approximately 7-9 pedestrians observed. Two used push buttons to activate Rectangular Rapid Flashing Beacon (RRFB). Others crossed mid-block or crossed at crosswalk without activating beacons. One bicyclist entered roundabout, two others crossed thru parking lot
Source: Google

Evaluating the Performance and Safety Effectiveness of Roundabouts
4-10
I-75 at M-81
Overall excellent traffic operations/driver behavior
High volume of trucks
Trucks maneuver through roundabout with relative ease
No trucks observed jumping curbs, but rutting is evident behind curbs at entry radii
US 127 at Mission Road
Overall excellent traffic operations/driver behavior
Very low traffic volumes at time of observation
Roundabout signage on US 127 off-ramp alerts drivers to roundabout.
Some driver hesitation – drivers not taking some of the available/adequate gaps, circulating drivers yielding to entering traffic. Resulted in one conflict, driver stopped in circulatory roadway, requiring driver following behind to come to a sudden stop
The Opus team also conducted a site visit of the M-41 at M-28 roundabout in Marquette, MI. The results of the site visit can be found in the Appendix of this report.
4.3 Collect Operational Data
Operational data was collected to be used in the operational analysis as well as the crash analysis and to get a better understanding of the overall operations at the roundabouts. Turning move-ment counts and ADT data was obtained from various sources, including several MDOT Regions, TSCs, individual cities, prior conducted studies, and county road commissions. Speed studies were also conducted to determine 85th percentile approach speeds for three different types of rounda-bouts:
Multi-lane roundabout
Single lane roundabout
Interchange roundabout Table 4.2 summarizes the results of the spot speed studies. Figure 4.1 demonstrates the locations of where the vehicle speeds for the speed studies were collected. The speeds were taken up-stream of the roundabout to gauge the approaching speed of the vehicles. The markers are the
Source: Google
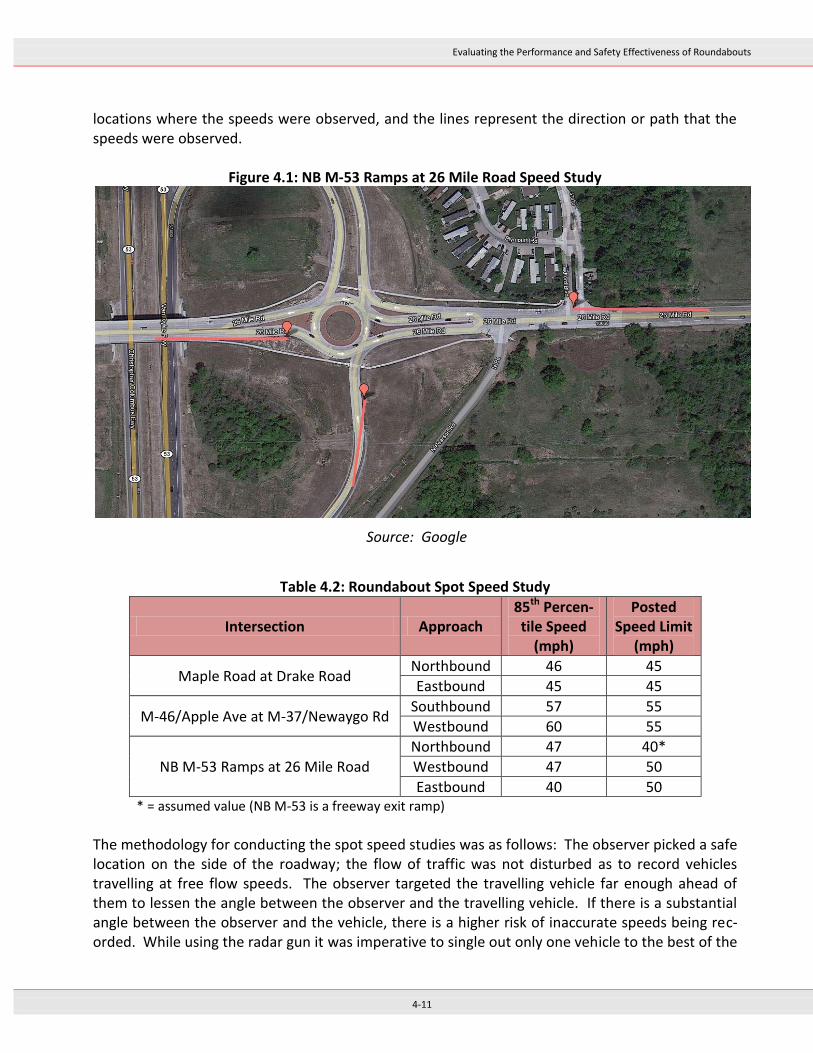
Evaluating the Performance and Safety Effectiveness of Roundabouts
4-11
locations where the speeds were observed, and the lines represent the direction or path that the speeds were observed.
Figure 4.1: NB M-53 Ramps at 26 Mile Road Speed Study
Table 4.2: Roundabout Spot Speed Study
Intersection Approach 85th Percen-tile Speed
(mph)
Posted Speed Limit
(mph)
Maple Road at Drake Road Northbound 46 45
Eastbound 45 45
M-46/Apple Ave at M-37/Newaygo Rd Southbound 57 55
Westbound 60 55
NB M-53 Ramps at 26 Mile Road
Northbound 47 40*
Westbound 47 50
Eastbound 40 50 * = assumed value (NB M-53 is a freeway exit ramp)
The methodology for conducting the spot speed studies was as follows: The observer picked a safe location on the side of the roadway; the flow of traffic was not disturbed as to record vehicles travelling at free flow speeds. The observer targeted the travelling vehicle far enough ahead of them to lessen the angle between the observer and the travelling vehicle. If there is a substantial angle between the observer and the vehicle, there is a higher risk of inaccurate speeds being rec-orded. While using the radar gun it was imperative to single out only one vehicle to the best of the
Source: Google
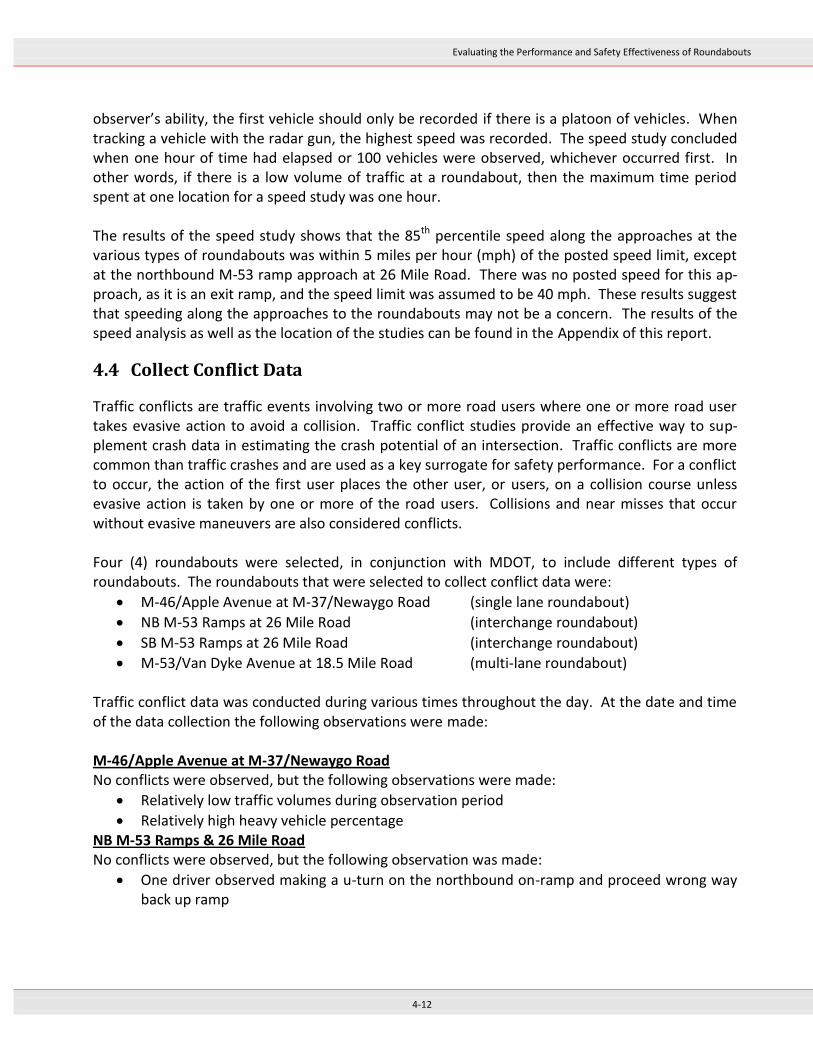
Evaluating the Performance and Safety Effectiveness of Roundabouts
4-12
observer’s ability, the first vehicle should only be recorded if there is a platoon of vehicles. When tracking a vehicle with the radar gun, the highest speed was recorded. The speed study concluded when one hour of time had elapsed or 100 vehicles were observed, whichever occurred first. In other words, if there is a low volume of traffic at a roundabout, then the maximum time period spent at one location for a speed study was one hour. The results of the speed study shows that the 85th percentile speed along the approaches at the various types of roundabouts was within 5 miles per hour (mph) of the posted speed limit, except at the northbound M-53 ramp approach at 26 Mile Road. There was no posted speed for this ap-proach, as it is an exit ramp, and the speed limit was assumed to be 40 mph. These results suggest that speeding along the approaches to the roundabouts may not be a concern. The results of the speed analysis as well as the location of the studies can be found in the Appendix of this report.
4.4 Collect Conflict Data
Traffic conflicts are traffic events involving two or more road users where one or more road user takes evasive action to avoid a collision. Traffic conflict studies provide an effective way to sup-plement crash data in estimating the crash potential of an intersection. Traffic conflicts are more common than traffic crashes and are used as a key surrogate for safety performance. For a conflict to occur, the action of the first user places the other user, or users, on a collision course unless evasive action is taken by one or more of the road users. Collisions and near misses that occur without evasive maneuvers are also considered conflicts. Four (4) roundabouts were selected, in conjunction with MDOT, to include different types of roundabouts. The roundabouts that were selected to collect conflict data were:
M-46/Apple Avenue at M-37/Newaygo Road (single lane roundabout)
NB M-53 Ramps at 26 Mile Road (interchange roundabout)
SB M-53 Ramps at 26 Mile Road (interchange roundabout)
M-53/Van Dyke Avenue at 18.5 Mile Road (multi-lane roundabout) Traffic conflict data was conducted during various times throughout the day. At the date and time of the data collection the following observations were made: M-46/Apple Avenue at M-37/Newaygo Road No conflicts were observed, but the following observations were made:
Relatively low traffic volumes during observation period
Relatively high heavy vehicle percentage NB M-53 Ramps & 26 Mile Road No conflicts were observed, but the following observation was made:
One driver observed making a u-turn on the northbound on-ramp and proceed wrong way back up ramp
Evaluating the Performance and Safety Effectiveness of Roundabouts
4-13
SB M-53 Ramps & 26 Mile Road Two conflicts were observed on the westbound approach:
Five westbound drivers were observed entering the roundabout in the outside lane, once in the circulating roadway the driver proceeded to make a left turn cutting across the inside lane to enter onto the M-53 southbound on-ramp. One resulted in near miss, driver took evasive action (braking), and one resulted in driver slowing significantly and used their horn.
The following observation was also made:
Westbound approach - drivers ignore yield, typically do not look to left due to lack of op-posing traffic
M-53/Van Dyke Avenue & 18.5 Mile Road Two conflicts were observed on the northbound approach:
Two trucks entered roundabout without sufficient gaps, causing one vehicle in the circula-tory roadway to slow down and one to come to a complete stop
Evaluating the Performance and Safety Effectiveness of Roundabouts
5-1
5.0 Additional Data Collection
This section discusses the data required to conduct the safety analysis.
5.1 Data Requirements
The project team, in agreement with MDOT and the RAP, prepared a list of data requirements that were used in the roundabout evaluation:
Crash data at study sites, before and after implementation
Crash data at a group of similar reference sites
Traffic volume at the treatment sites, before and after implementation
Traffic volume at a group of similar reference sites, before and after implementation
Geometric and operational characteristics of the treatment sites
Geometric and operational characteristics of the reference sites
Roundabout implementation dates
Construction costs Crash data for the study intersections for both before and after implementation, along with the crash data for the reference sites was obtained from the Michigan State Police TCRS. Traffic volume data was collected from partner agencies and from online resources, while other information (geometric characteristics, operational characteristics, implementation dates, and construction costs) were ob-tained from plans, field visits, project reports, and aerial photographs. This data was collected for both the study sites and the reference sites used in the EB analysis.
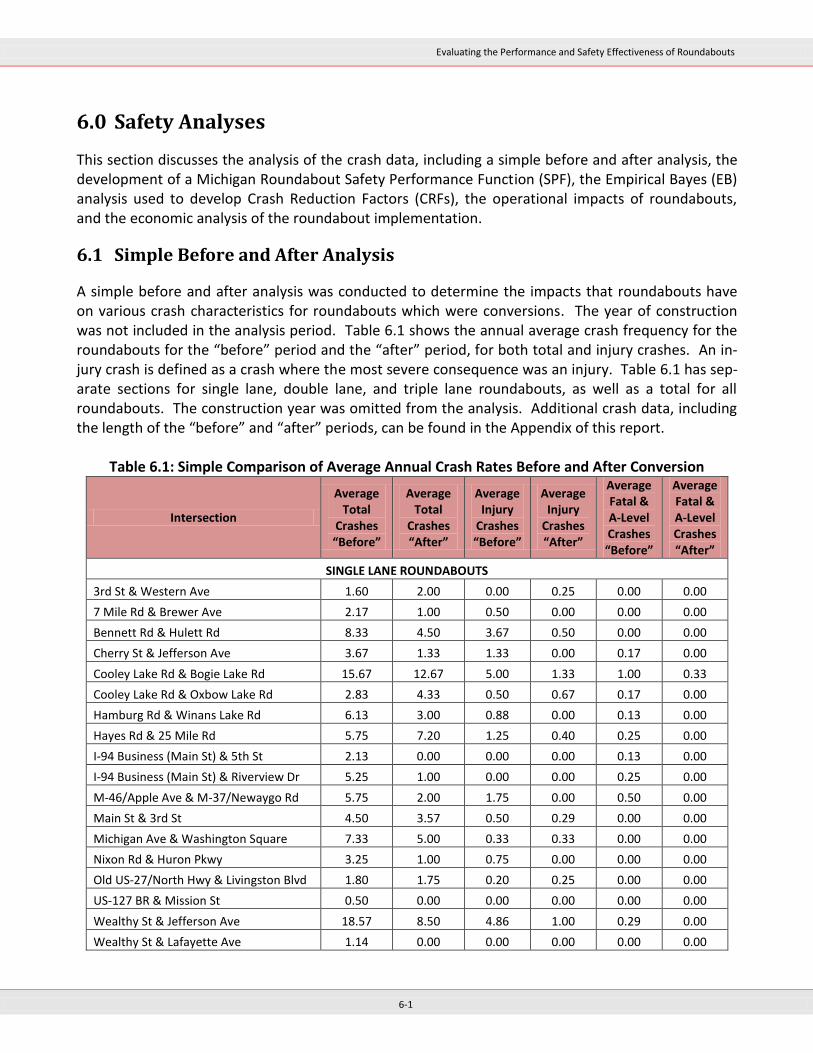
Evaluating the Performance and Safety Effectiveness of Roundabouts
6-1
6.0 Safety Analyses
This section discusses the analysis of the crash data, including a simple before and after analysis, the development of a Michigan Roundabout Safety Performance Function (SPF), the Empirical Bayes (EB) analysis used to develop Crash Reduction Factors (CRFs), the operational impacts of roundabouts, and the economic analysis of the roundabout implementation.
6.1 Simple Before and After Analysis
A simple before and after analysis was conducted to determine the impacts that roundabouts have on various crash characteristics for roundabouts which were conversions. The year of construction was not included in the analysis period. Table 6.1 shows the annual average crash frequency for the roundabouts for the “before” period and the “after” period, for both total and injury crashes. An in-jury crash is defined as a crash where the most severe consequence was an injury. Table 6.1 has sep-arate sections for single lane, double lane, and triple lane roundabouts, as well as a total for all roundabouts. The construction year was omitted from the analysis. Additional crash data, including the length of the “before” and “after” periods, can be found in the Appendix of this report.
Table 6.1: Simple Comparison of Average Annual Crash Rates Before and After Conversion
Intersection
Average Total
Crashes “Before”
Average Total
Crashes “After”
Average Injury
Crashes “Before”
Average Injury
Crashes “After”
Average Fatal & A-Level Crashes “Before”
Average Fatal & A-Level Crashes “After”
SINGLE LANE ROUNDABOUTS
3rd St & Western Ave 1.60 2.00 0.00 0.25 0.00 0.00
7 Mile Rd & Brewer Ave 2.17 1.00 0.50 0.00 0.00 0.00
Bennett Rd & Hulett Rd 8.33 4.50 3.67 0.50 0.00 0.00
Cherry St & Jefferson Ave 3.67 1.33 1.33 0.00 0.17 0.00
Cooley Lake Rd & Bogie Lake Rd 15.67 12.67 5.00 1.33 1.00 0.33
Cooley Lake Rd & Oxbow Lake Rd 2.83 4.33 0.50 0.67 0.17 0.00
Hamburg Rd & Winans Lake Rd 6.13 3.00 0.88 0.00 0.13 0.00
Hayes Rd & 25 Mile Rd 5.75 7.20 1.25 0.40 0.25 0.00
I-94 Business (Main St) & 5th St 2.13 0.00 0.00 0.00 0.13 0.00
I-94 Business (Main St) & Riverview Dr 5.25 1.00 0.00 0.00 0.25 0.00
M-46/Apple Ave & M-37/Newaygo Rd 5.75 2.00 1.75 0.00 0.50 0.00
Main St & 3rd St 4.50 3.57 0.50 0.29 0.00 0.00
Michigan Ave & Washington Square 7.33 5.00 0.33 0.33 0.00 0.00
Nixon Rd & Huron Pkwy 3.25 1.00 0.75 0.00 0.00 0.00
Old US-27/North Hwy & Livingston Blvd 1.80 1.75 0.20 0.25 0.00 0.00
US-127 BR & Mission St 0.50 0.00 0.00 0.00 0.00 0.00
Wealthy St & Jefferson Ave 18.57 8.50 4.86 1.00 0.29 0.00
Wealthy St & Lafayette Ave 1.14 0.00 0.00 0.00 0.00 0.00
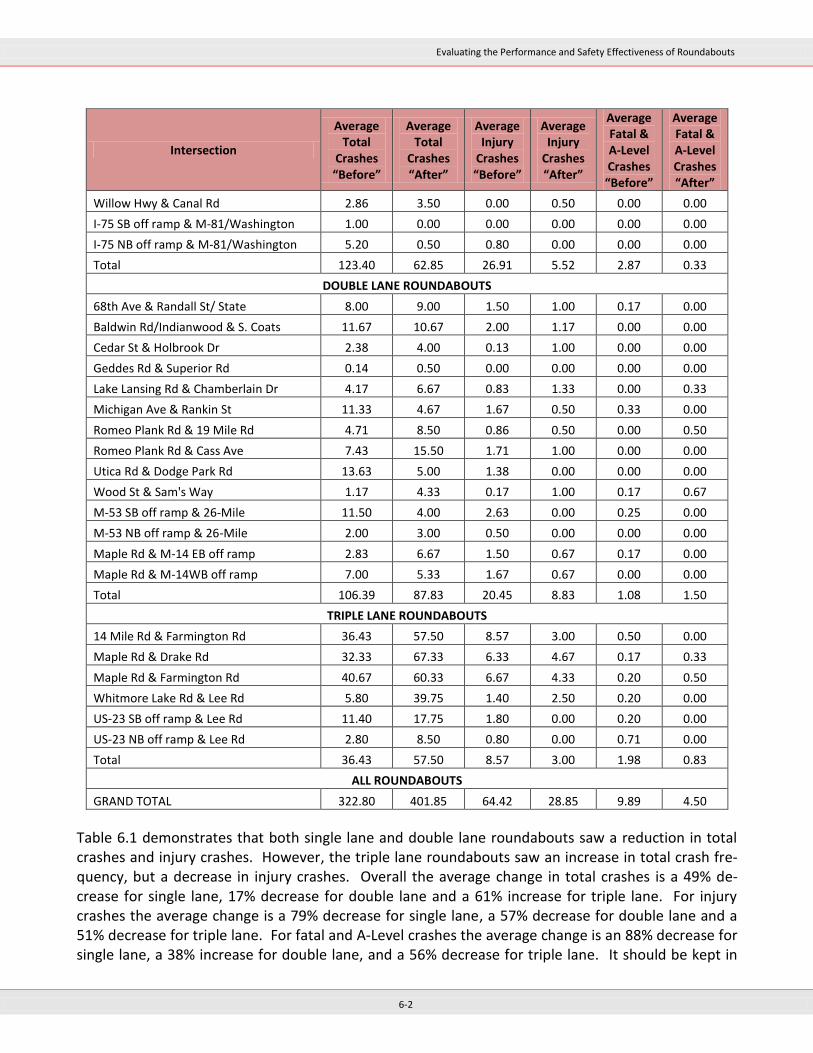
Evaluating the Performance and Safety Effectiveness of Roundabouts
6-2
Intersection
Average Total
Crashes “Before”
Average Total
Crashes “After”
Average Injury
Crashes “Before”
Average Injury
Crashes “After”
Average Fatal & A-Level Crashes “Before”
Average Fatal & A-Level Crashes “After”
Willow Hwy & Canal Rd 2.86 3.50 0.00 0.50 0.00 0.00
I-75 SB off ramp & M-81/Washington 1.00 0.00 0.00 0.00 0.00 0.00
I-75 NB off ramp & M-81/Washington 5.20 0.50 0.80 0.00 0.00 0.00
Total 123.40 62.85 26.91 5.52 2.87 0.33
DOUBLE LANE ROUNDABOUTS
68th Ave & Randall St/ State 8.00 9.00 1.50 1.00 0.17 0.00
Baldwin Rd/Indianwood & S. Coats 11.67 10.67 2.00 1.17 0.00 0.00
Cedar St & Holbrook Dr 2.38 4.00 0.13 1.00 0.00 0.00
Geddes Rd & Superior Rd 0.14 0.50 0.00 0.00 0.00 0.00
Lake Lansing Rd & Chamberlain Dr 4.17 6.67 0.83 1.33 0.00 0.33
Michigan Ave & Rankin St 11.33 4.67 1.67 0.50 0.33 0.00
Romeo Plank Rd & 19 Mile Rd 4.71 8.50 0.86 0.50 0.00 0.50
Romeo Plank Rd & Cass Ave 7.43 15.50 1.71 1.00 0.00 0.00
Utica Rd & Dodge Park Rd 13.63 5.00 1.38 0.00 0.00 0.00
Wood St & Sam's Way 1.17 4.33 0.17 1.00 0.17 0.67
M-53 SB off ramp & 26-Mile 11.50 4.00 2.63 0.00 0.25 0.00
M-53 NB off ramp & 26-Mile 2.00 3.00 0.50 0.00 0.00 0.00
Maple Rd & M-14 EB off ramp 2.83 6.67 1.50 0.67 0.17 0.00
Maple Rd & M-14WB off ramp 7.00 5.33 1.67 0.67 0.00 0.00
Total 106.39 87.83 20.45 8.83 1.08 1.50
TRIPLE LANE ROUNDABOUTS
14 Mile Rd & Farmington Rd 36.43 57.50 8.57 3.00 0.50 0.00
Maple Rd & Drake Rd 32.33 67.33 6.33 4.67 0.17 0.33
Maple Rd & Farmington Rd 40.67 60.33 6.67 4.33 0.20 0.50
Whitmore Lake Rd & Lee Rd 5.80 39.75 1.40 2.50 0.20 0.00
US-23 SB off ramp & Lee Rd 11.40 17.75 1.80 0.00 0.20 0.00
US-23 NB off ramp & Lee Rd 2.80 8.50 0.80 0.00 0.71 0.00
Total 36.43 57.50 8.57 3.00 1.98 0.83
ALL ROUNDABOUTS
GRAND TOTAL 322.80 401.85 64.42 28.85 9.89 4.50
Table 6.1 demonstrates that both single lane and double lane roundabouts saw a reduction in total crashes and injury crashes. However, the triple lane roundabouts saw an increase in total crash fre-quency, but a decrease in injury crashes. Overall the average change in total crashes is a 49% de-crease for single lane, 17% decrease for double lane and a 61% increase for triple lane. For injury crashes the average change is a 79% decrease for single lane, a 57% decrease for double lane and a 51% decrease for triple lane. For fatal and A-Level crashes the average change is an 88% decrease for single lane, a 38% increase for double lane, and a 56% decrease for triple lane. It should be kept in
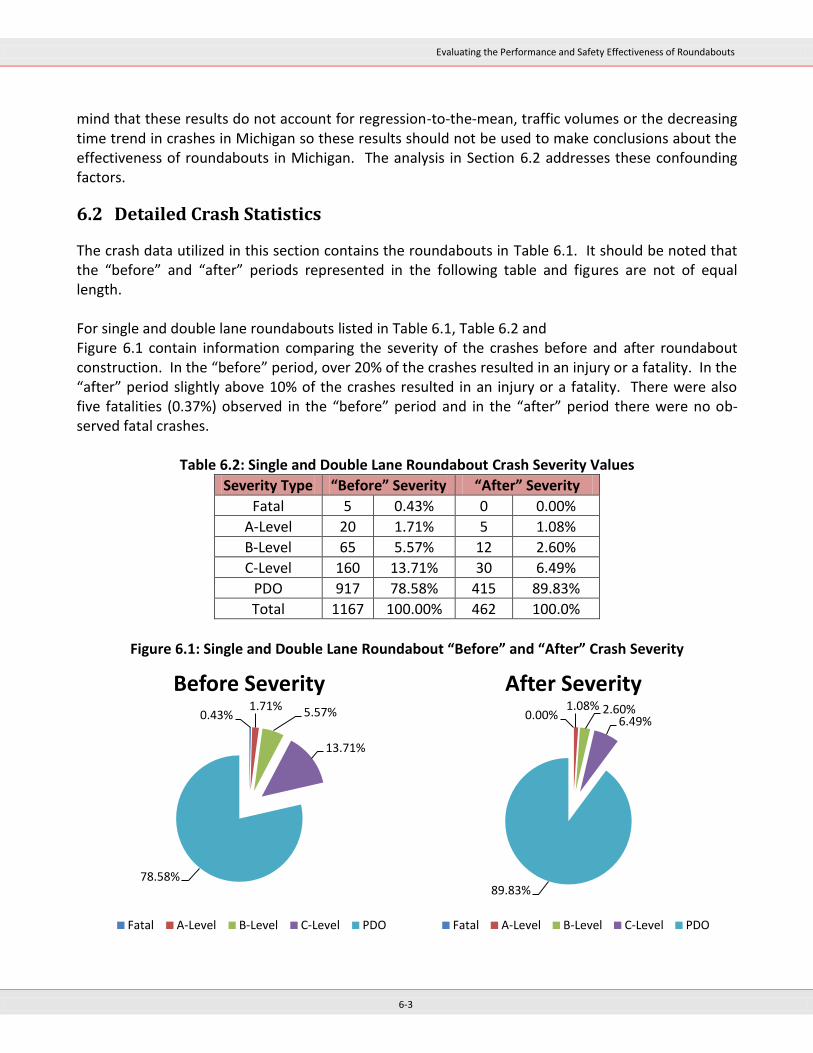
Evaluating the Performance and Safety Effectiveness of Roundabouts
6-3
mind that these results do not account for regression-to-the-mean, traffic volumes or the decreasing time trend in crashes in Michigan so these results should not be used to make conclusions about the effectiveness of roundabouts in Michigan. The analysis in Section 6.2 addresses these confounding factors.
6.2 Detailed Crash Statistics
The crash data utilized in this section contains the roundabouts in Table 6.1. It should be noted that the “before” and “after” periods represented in the following table and figures are not of equal length. For single and double lane roundabouts listed in Table 6.1, Table 6.2 and Figure 6.1 contain information comparing the severity of the crashes before and after roundabout construction. In the “before” period, over 20% of the crashes resulted in an injury or a fatality. In the “after” period slightly above 10% of the crashes resulted in an injury or a fatality. There were also five fatalities (0.37%) observed in the “before” period and in the “after” period there were no ob-served fatal crashes.
Table 6.2: Single and Double Lane Roundabout Crash Severity Values
Severity Type “Before” Severity “After” Severity
Fatal 5 0.43% 0 0.00%
A-Level 20 1.71% 5 1.08%
B-Level 65 5.57% 12 2.60%
C-Level 160 13.71% 30 6.49%
PDO 917 78.58% 415 89.83%
Total 1167 100.00% 462 100.0%
Figure 6.1: Single and Double Lane Roundabout “Before” and “After” Crash Severity
0.43% 1.71% 5.57%
13.71%
78.58%
Before Severity
Fatal A-Level B-Level C-Level PDO
0.00% 1.08% 2.60%
6.49%
89.83%
After Severity
Fatal A-Level B-Level C-Level PDO

Evaluating the Performance and Safety Effectiveness of Roundabouts
6-4
For single and double lane roundabouts listed in Table 6.1, Table 6.3 and Figure 6.2 contain infor-mation comparing the crash types of the crashes before and after roundabout construction for single and double lane roundabouts. The largest change in the crash types came from the crash types that often result in the greatest severity of crashes (angle, head-on, head-on left turn, pedestrian, and bike). Most notably, the percent of angle crashes was reduced by over 10%. This number may also be greater than 10%, because a common error in recording crash types is mistaking sideswipe crashes as angle crashes especially since an angle crash cannot occur in a roundabout.
Table 6.3: Single and Double Lane Roundabout Crash Type Values
Crash Type “Before” Type “After” Type
Angle 321 27.51% 79 17.10%
Head On 9 0.77% 2 0.43%
Head On Left turn 46 3.94% 4 0.87%
Pedestrian 16 1.37% 4 0.87%
Bike 13 1.11% 2 0.43%
Rear-end 377 32.31% 141 30.52%
Single Vehicle 24 2.06% 8 1.73%
Sideswipe Opposite 26 2.23% 8 1.73%
Sideswipe Same 107 9.17% 92 19.91%
Other 228 19.54% 122 26.41%
Total 1167 100.00% 462 100.00%
Figure 6.2: Single and Double Lane Roundabout “Before” and “After” Crash Type
27.51%
0.77%
3.94%
1.37%
1.11%
32.31%
2.06%
2.23%
9.17%
19.54%
17.10%
0.43%
0.87%
0.87%
0.43%
30.52%
1.73%
1.73%
19.91%
26.41%
0% 5% 10% 15% 20% 25% 30% 35%
Angle
Head On
Head On Left Turn
Ped
Bike
Rear-end
Single Vehicle
Sideswipe Opposite
Sideswipe Same
Other
Roundabout Crash Type
After Crash Type Before Crash Type
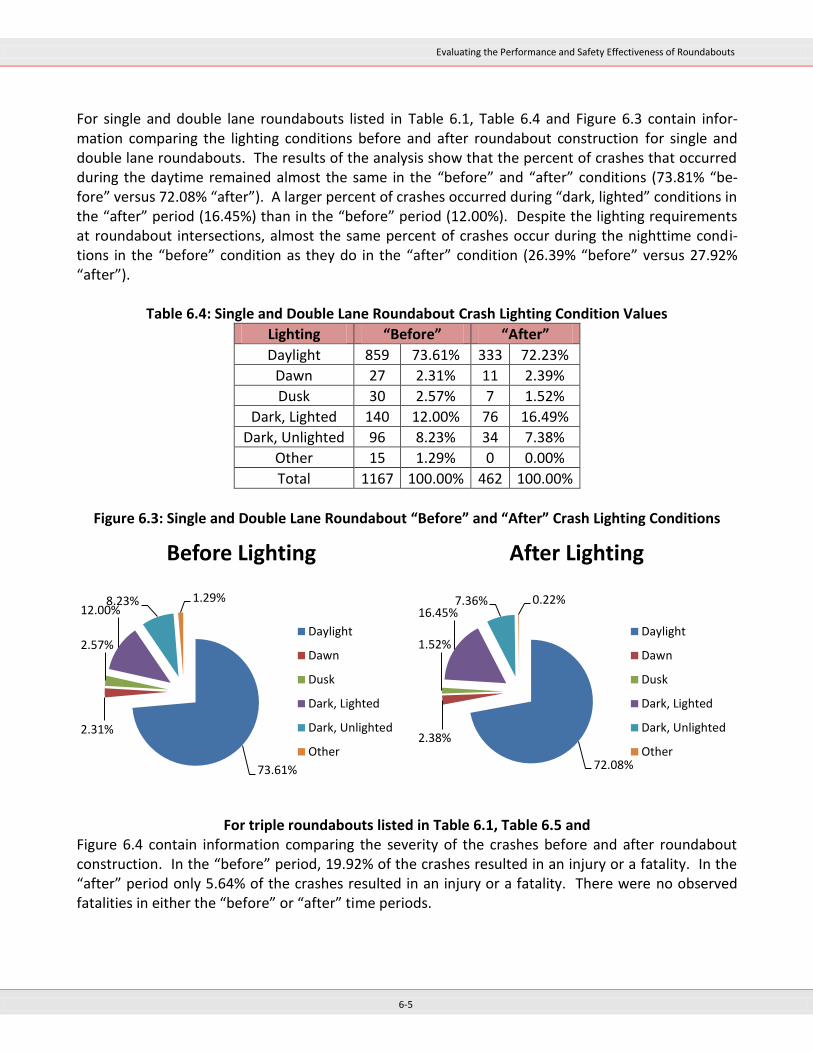
Evaluating the Performance and Safety Effectiveness of Roundabouts
6-5
For single and double lane roundabouts listed in Table 6.1, Table 6.4 and Figure 6.3 contain infor-mation comparing the lighting conditions before and after roundabout construction for single and double lane roundabouts. The results of the analysis show that the percent of crashes that occurred during the daytime remained almost the same in the “before” and “after” conditions (73.81% “be-fore” versus 72.08% “after”). A larger percent of crashes occurred during “dark, lighted” conditions in the “after” period (16.45%) than in the “before” period (12.00%). Despite the lighting requirements at roundabout intersections, almost the same percent of crashes occur during the nighttime condi-tions in the “before” condition as they do in the “after” condition (26.39% “before” versus 27.92% “after”).
Table 6.4: Single and Double Lane Roundabout Crash Lighting Condition Values
Lighting “Before” “After”
Daylight 859 73.61% 333 72.23%
Dawn 27 2.31% 11 2.39%
Dusk 30 2.57% 7 1.52%
Dark, Lighted 140 12.00% 76 16.49%
Dark, Unlighted 96 8.23% 34 7.38%
Other 15 1.29% 0 0.00%
Total 1167 100.00% 462 100.00%
Figure 6.3: Single and Double Lane Roundabout “Before” and “After” Crash Lighting Conditions
For triple roundabouts listed in Table 6.1, Table 6.5 and
Figure 6.4 contain information comparing the severity of the crashes before and after roundabout construction. In the “before” period, 19.92% of the crashes resulted in an injury or a fatality. In the “after” period only 5.64% of the crashes resulted in an injury or a fatality. There were no observed fatalities in either the “before” or “after” time periods.
73.61%
2.31%
2.57%
12.00% 8.23% 1.29%
Before Lighting
Daylight
Dawn
Dusk
Dark, Lighted
Dark, Unlighted
Other72.08%
2.38%
1.52%
16.45% 7.36% 0.22%
After Lighting
Daylight
Dawn
Dusk
Dark, Lighted
Dark, Unlighted
Other
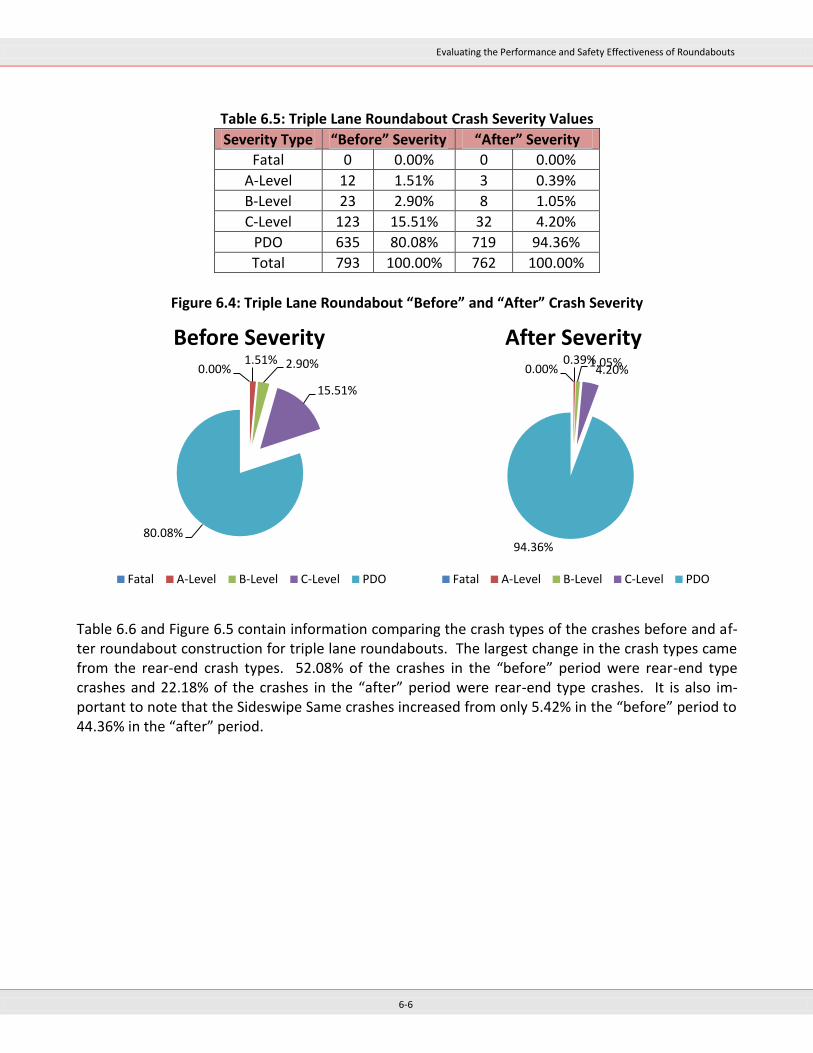
Evaluating the Performance and Safety Effectiveness of Roundabouts
6-6
Table 6.5: Triple Lane Roundabout Crash Severity Values
Severity Type “Before” Severity “After” Severity
Fatal 0 0.00% 0 0.00%
A-Level 12 1.51% 3 0.39%
B-Level 23 2.90% 8 1.05%
C-Level 123 15.51% 32 4.20%
PDO 635 80.08% 719 94.36%
Total 793 100.00% 762 100.00%
Figure 6.4: Triple Lane Roundabout “Before” and “After” Crash Severity
Table 6.6 and Figure 6.5 contain information comparing the crash types of the crashes before and af-ter roundabout construction for triple lane roundabouts. The largest change in the crash types came from the rear-end crash types. 52.08% of the crashes in the “before” period were rear-end type crashes and 22.18% of the crashes in the “after” period were rear-end type crashes. It is also im-portant to note that the Sideswipe Same crashes increased from only 5.42% in the “before” period to 44.36% in the “after” period.
0.00% 1.51% 2.90%
15.51%
80.08%
Before Severity
Fatal A-Level B-Level C-Level PDO
0.00% 0.39% 1.05%
4.20%
94.36%
After Severity
Fatal A-Level B-Level C-Level PDO

Evaluating the Performance and Safety Effectiveness of Roundabouts
6-7
Table 6.6: Triple Lane Roundabout Crash Type Values
Crash Type “Before” Type “After” Type
Angle 174 21.94% 177 23.23%
Head On 10 1.26% 7 0.92%
Head On Left turn 37 4.67% 0 0.00%
Pedestrian 0 0.00% 0 0.00%
Bike 1 0.13% 1 0.13%
Rear-end 413 52.08% 169 22.18%
Single Vehicle 3 0.38% 0 0.00%
Sideswipe Opposite 18 2.27% 24 3.15%
Sideswipe Same 43 5.42% 338 44.36%
Other 94 11.85% 46 6.04%
Total 793 100.00% 762 100.00%
Figure 6.5: Triple Lane Roundabout “Before” and “After” Crash Type
Table 6.7 and Figure 6.6 contain information comparing the lighting conditions before and after roundabout construction for triple lane roundabouts. The results of the analysis show that the per-cent of crashes that occurred during the daytime remained almost the same in the “before” and “af-ter” conditions (78.81% “before” versus 81.76% “after”). A larger percent of crashes occurred during “dark, lighted” conditions in the “after” period (11.15%) than in the “before” period (6.31%). Despite the lighting requirements at roundabout intersections, almost the same percent of crashes occur dur-ing the nighttime conditions in the “before” condition as they do in the “after” condition (21.19% “before” versus 18.24% “after”).
21.94%
1.26%
4.67%
0.00%
0.13%
52.08%
0.38%
2.27%
5.42%
11.85%
23.23%
0.92%
0.00%
0.00%
0.13%
22.18%
0.00%
3.15%
44.36%
6.04%
0% 10% 20% 30% 40% 50% 60%
Angle
Head On
Head On Left Turn
Ped
Bike
Rear-end
Single Vehicle
Sideswipe Opposite
Sideswipe Same
Other
Roundabout Crash Type
After Crash Type Before Crash Type
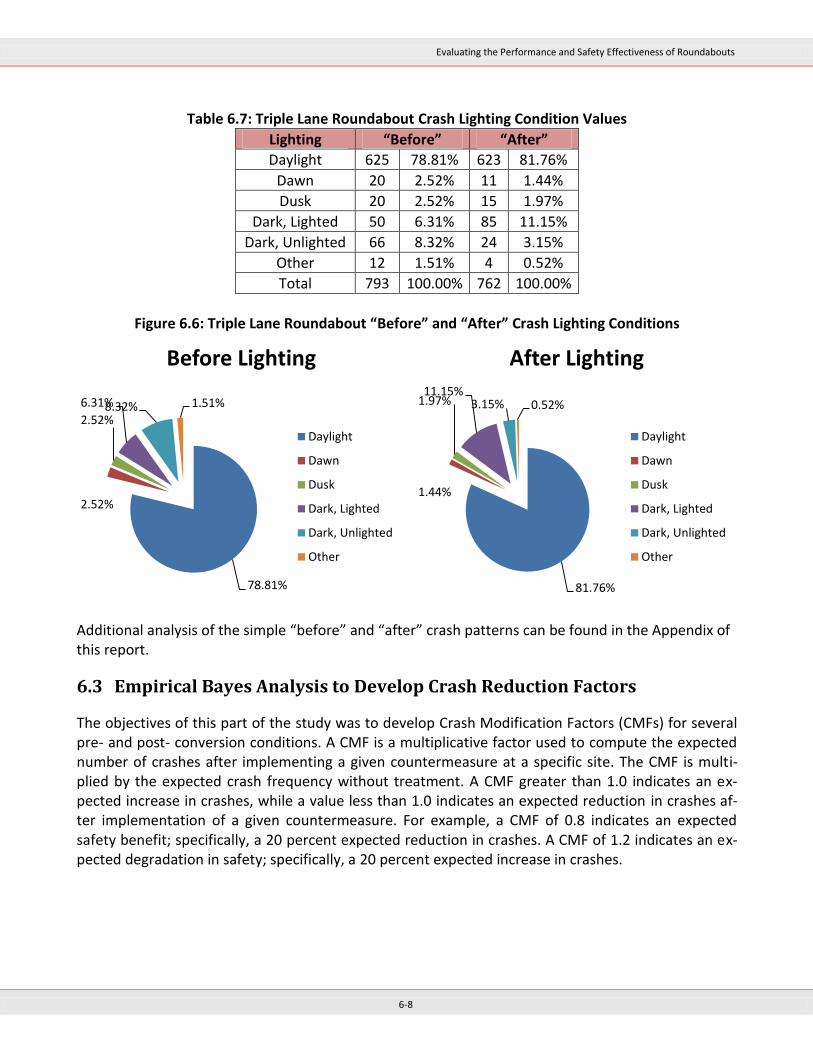
Evaluating the Performance and Safety Effectiveness of Roundabouts
6-8
Table 6.7: Triple Lane Roundabout Crash Lighting Condition Values
Lighting “Before” “After”
Daylight 625 78.81% 623 81.76%
Dawn 20 2.52% 11 1.44%
Dusk 20 2.52% 15 1.97%
Dark, Lighted 50 6.31% 85 11.15%
Dark, Unlighted 66 8.32% 24 3.15%
Other 12 1.51% 4 0.52%
Total 793 100.00% 762 100.00%
Figure 6.6: Triple Lane Roundabout “Before” and “After” Crash Lighting Conditions
Additional analysis of the simple “before” and “after” crash patterns can be found in the Appendix of this report.
6.3 Empirical Bayes Analysis to Develop Crash Reduction Factors
The objectives of this part of the study was to develop Crash Modification Factors (CMFs) for several pre- and post- conversion conditions. A CMF is a multiplicative factor used to compute the expected number of crashes after implementing a given countermeasure at a specific site. The CMF is multi-plied by the expected crash frequency without treatment. A CMF greater than 1.0 indicates an ex-pected increase in crashes, while a value less than 1.0 indicates an expected reduction in crashes af-ter implementation of a given countermeasure. For example, a CMF of 0.8 indicates an expected safety benefit; specifically, a 20 percent expected reduction in crashes. A CMF of 1.2 indicates an ex-pected degradation in safety; specifically, a 20 percent expected increase in crashes.
78.81%
2.52%
2.52%
6.31% 8.32% 1.51%
Before Lighting
Daylight
Dawn
Dusk
Dark, Lighted
Dark, Unlighted
Other
81.76%
1.44%
1.97% 11.15%
3.15% 0.52%
After Lighting
Daylight
Dawn
Dusk
Dark, Lighted
Dark, Unlighted
Other

Evaluating the Performance and Safety Effectiveness of Roundabouts
6-9
6.3.1 Data Collection
The data collected was filtered to remove sites that did not have the required data to be included in the analysis. Certain sites were excluded from the EB analysis because it lacked information on the following criterion:
lack of conversion date
recent conversion, thus no after period data available
lack of AADTs for one or more roadways
lack of information on previous traffic control
lack of crash data The following locations were not used because of their unique geometry. Using these sites in devel-oping the CMFs would bias the results.
Whitmore Lake Rd & Lee Road
SB US-23 & Lee Road
NB US-23 & Lee Road (due to the close proximity of the double roundabout)
Table 6.8: Locations Used for Empirical Bayes Analysis
Intersection City
I-94 Business (Main St) & Riverview Dr Benton Harbor
I-94 Business (Main St) & 5th St Benton Harbor
US-127 BR & Mission St Clare
Willow Hwy & Canal Rd Delta Charter Twp
Bennett Rd & Hulett Rd Okemos
Lake Lansing Rd & Chamberlain Dr Lansing
Wood St & Sam's Way Lansing
Michigan Ave & Washington Square Lansing
Cedar St & Holbrook Dr Holt
Mosher St & Main St Mt Pleasant
Michigan Ave & Rankin St Kalamazoo
Cherry St & Jefferson Ave Grand Rapids
Wealthy St & Lafayette Ave Grand Rapids
Wealthy St & Jefferson Ave Grand Rapids
7 Mile Rd & Brewer Ave Plainfield
Hamburg Rd & Winans Lake Rd Brighton
Main St & 3rd St Brighton
Hayes Rd & 25 Mile Rd Shelby Township
Romeo Plank Rd & 19 Mile Rd Macomb Township
Romeo Plank Rd & Cass Ave Clinton Township
Utica Rd & Dodge Park Rd Sterling Heights
SB M-53 ramp & 26-Mile Utica
NB M-53 ramp & 26-Mile Utica
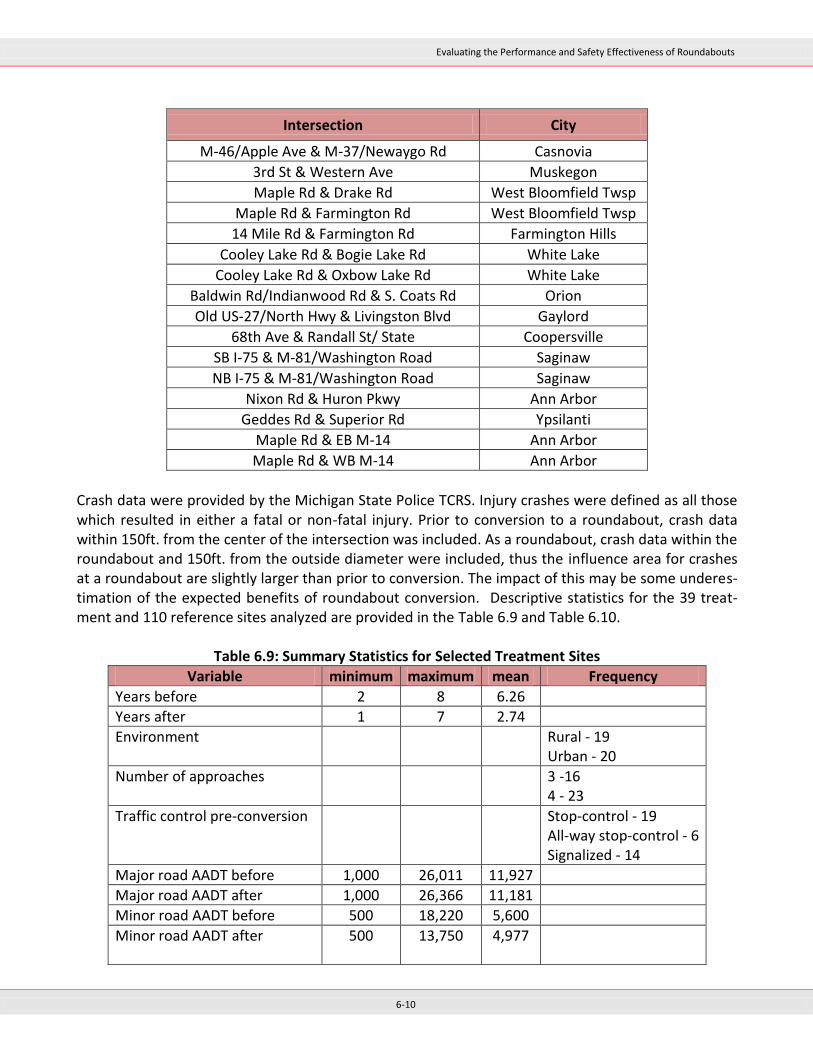
Evaluating the Performance and Safety Effectiveness of Roundabouts
6-10
Intersection City
M-46/Apple Ave & M-37/Newaygo Rd Casnovia
3rd St & Western Ave Muskegon
Maple Rd & Drake Rd West Bloomfield Twsp
Maple Rd & Farmington Rd West Bloomfield Twsp
14 Mile Rd & Farmington Rd Farmington Hills
Cooley Lake Rd & Bogie Lake Rd White Lake
Cooley Lake Rd & Oxbow Lake Rd White Lake
Baldwin Rd/Indianwood Rd & S. Coats Rd Orion
Old US-27/North Hwy & Livingston Blvd Gaylord
68th Ave & Randall St/ State Coopersville
SB I-75 & M-81/Washington Road Saginaw
NB I-75 & M-81/Washington Road Saginaw
Nixon Rd & Huron Pkwy Ann Arbor
Geddes Rd & Superior Rd Ypsilanti
Maple Rd & EB M-14 Ann Arbor
Maple Rd & WB M-14 Ann Arbor
Crash data were provided by the Michigan State Police TCRS. Injury crashes were defined as all those which resulted in either a fatal or non-fatal injury. Prior to conversion to a roundabout, crash data within 150ft. from the center of the intersection was included. As a roundabout, crash data within the roundabout and 150ft. from the outside diameter were included, thus the influence area for crashes at a roundabout are slightly larger than prior to conversion. The impact of this may be some underes-timation of the expected benefits of roundabout conversion. Descriptive statistics for the 39 treat-ment and 110 reference sites analyzed are provided in the Table 6.9 and Table 6.10.
Table 6.9: Summary Statistics for Selected Treatment Sites
Variable minimum maximum mean Frequency
Years before 2 8 6.26
Years after 1 7 2.74
Environment Rural - 19 Urban - 20
Number of approaches 3 -16 4 - 23
Traffic control pre-conversion Stop-control - 19 All-way stop-control - 6 Signalized - 14
Major road AADT before 1,000 26,011 11,927
Major road AADT after 1,000 26,366 11,181
Minor road AADT before 500 18,220 5,600
Minor road AADT after
500 13,750 4,977
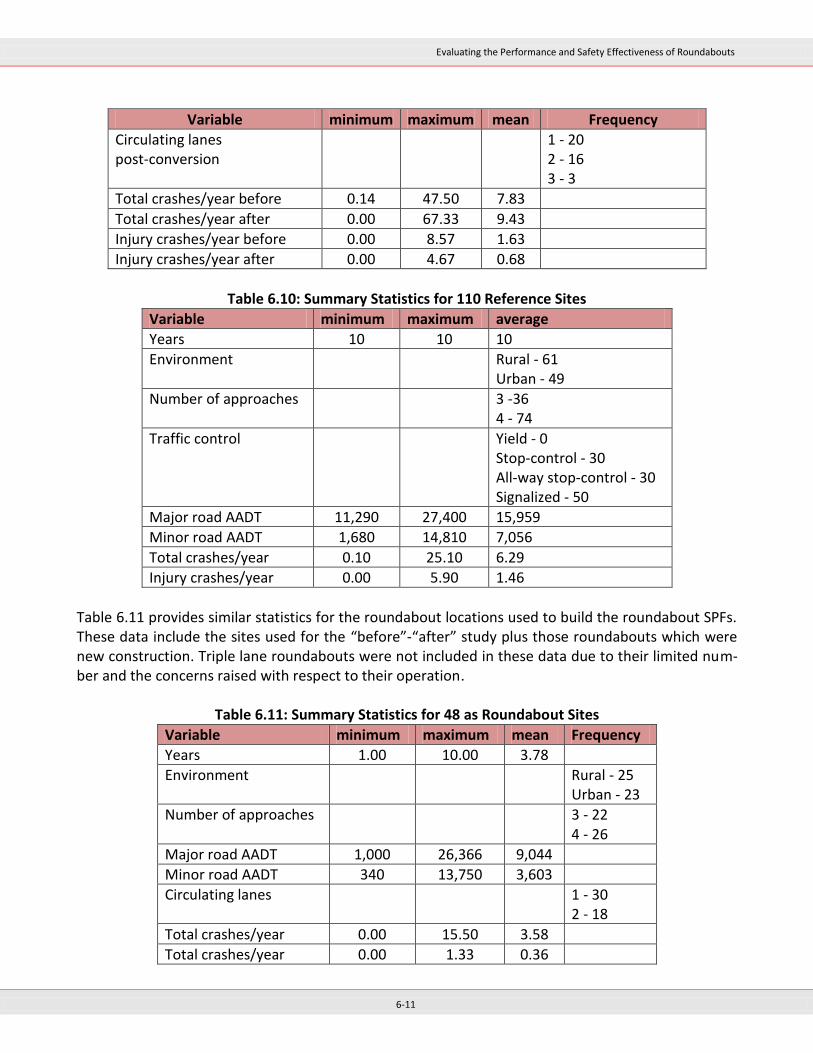
Evaluating the Performance and Safety Effectiveness of Roundabouts
6-11
Variable minimum maximum mean Frequency
Circulating lanes post-conversion
1 - 20 2 - 16 3 - 3
Total crashes/year before 0.14 47.50 7.83
Total crashes/year after 0.00 67.33 9.43
Injury crashes/year before 0.00 8.57 1.63
Injury crashes/year after 0.00 4.67 0.68
Table 6.10: Summary Statistics for 110 Reference Sites
Variable minimum maximum average
Years 10 10 10
Environment Rural - 61 Urban - 49
Number of approaches 3 -36 4 - 74
Traffic control Yield - 0 Stop-control - 30 All-way stop-control - 30 Signalized - 50
Major road AADT 11,290 27,400 15,959
Minor road AADT 1,680 14,810 7,056
Total crashes/year 0.10 25.10 6.29
Injury crashes/year 0.00 5.90 1.46
Table 6.11 provides similar statistics for the roundabout locations used to build the roundabout SPFs. These data include the sites used for the “before”-“after” study plus those roundabouts which were new construction. Triple lane roundabouts were not included in these data due to their limited num-ber and the concerns raised with respect to their operation.
Table 6.11: Summary Statistics for 48 as Roundabout Sites
Variable minimum maximum mean Frequency
Years 1.00 10.00 3.78
Environment Rural - 25 Urban - 23
Number of approaches 3 - 22 4 - 26
Major road AADT 1,000 26,366 9,044
Minor road AADT 340 13,750 3,603
Circulating lanes 1 - 30 2 - 18
Total crashes/year 0.00 15.50 3.58
Total crashes/year 0.00 1.33 0.36
Evaluating the Performance and Safety Effectiveness of Roundabouts
6-12
6.3.2 Development of Reference Group SPFs and Yearly Calibration Factors
This section presents the safety performance functions (SPFs) applied. The SPFs are used in the EB methodology to estimate the safety effectiveness in “before”-“after” studies. The reference site data were used in an attempt to estimate the required SPF coefficients, assuming a negative binomial error distribution, which is consistent with the state of art research in developing these models. Separate models were sought for both total and injury crashes disaggregated by the number of approaches and traffic control. However, due to the relatively small numbers of sites in each category, these modeling attempts were not successful. The attempted models did not con-verge with parameter estimates statistically significant at the 90% confidence interval or greater and were thus rejected. Since models calibrated using the reference group were not successfully calibrated, it was sought to recalibrate existing SPFs using the procedure recommended in the Highway Safety Manual. In this procedure, the ratio of the sum of the crash counts to the sum of the SPF estimates for a reference group in the jurisdiction of interest is applied as a multiplier in the regression equation. The overdis-persion parameter, k, is also re-estimated when the recalibrated model is applied to the reference site data using a maximum log-likelihood procedure. This step is critical since the overdispersion pa-rameter is used in the EB method and in effect indicates how well the model is explaining the varia-tion in crash counts in the data. For recalibration, for each site the sum of crashes over all years and the average AADT for the same time period was used. The decision on which of the available SPFs to adapt for use in a jurisdiction is based on two main considerations. The first is what data are available for the sites that were treated. While some SPFs only require knowledge of traffic volumes, others may require detailed knowledge of geometric de-sign features. The second consideration is which SPF provides the best fit to the reference group data through an assessment of the cumulative residuals by constructing plots of the cumulative residuals versus the predictor variables (CURE Plots). The models selected for application are those developed for intersections for the AASHTO SafetyAna-lyst tool. The number of reference sites would not permit separate recalibrations for urban and rural roads so both the rural and urban SPFs were evaluated and the SPF with the better fit to the data se-lected for each category. For all-way stop-controlled intersections the SPF for injury crashes was ob-tained by multiplying the constant term for the total crash SPF by the observed proportion of injury crashes in the reference group data. SPFs for total and injury crashes were recalibrated for the following site types:
3-legged stop-controlled
3-legged all-way stop-controlled
3-legged signalized
4-legged stop-controlled
4-legged all-way stop-controlled
4-legged signalized
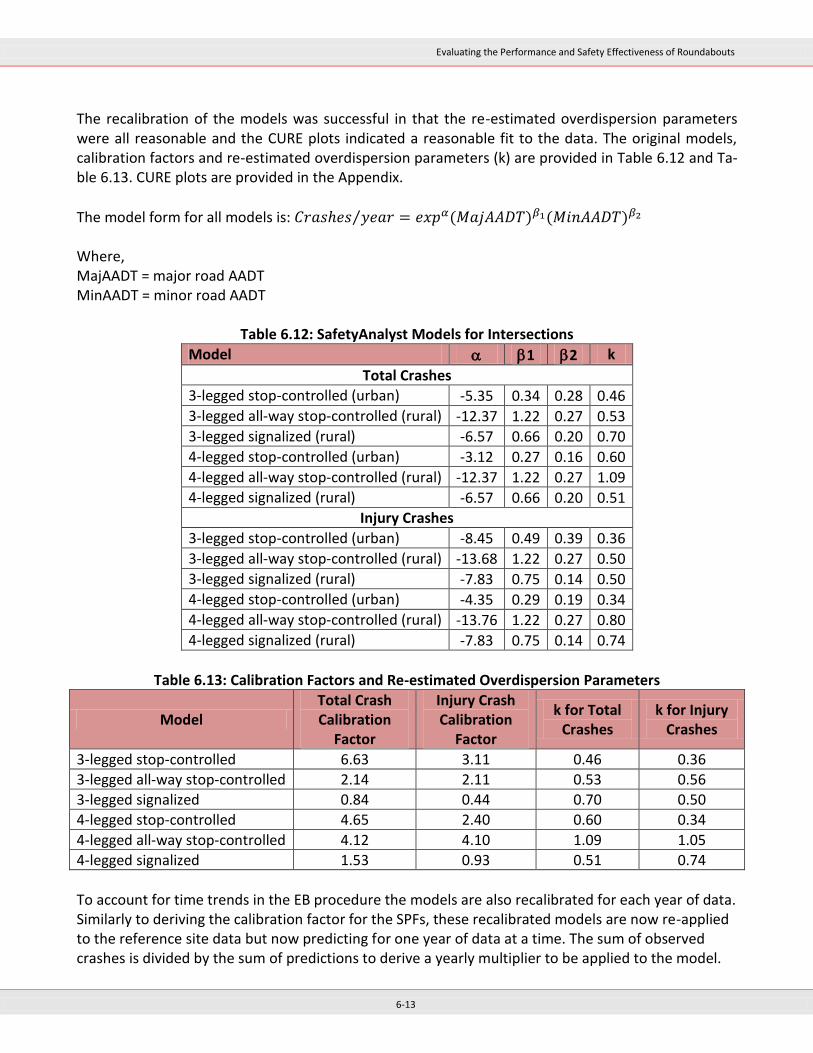
Evaluating the Performance and Safety Effectiveness of Roundabouts
6-13
The recalibration of the models was successful in that the re-estimated overdispersion parameters were all reasonable and the CURE plots indicated a reasonable fit to the data. The original models, calibration factors and re-estimated overdispersion parameters (k) are provided in Table 6.12 and Ta-ble 6.13. CURE plots are provided in the Appendix.
The model form for all models is: ⁄ Where, MajAADT = major road AADT MinAADT = minor road AADT
Table 6.12: SafetyAnalyst Models for Intersections
Model 1 2 k
Total Crashes
3-legged stop-controlled (urban) -5.35 0.34 0.28 0.46
3-legged all-way stop-controlled (rural) -12.37 1.22 0.27 0.53
3-legged signalized (rural) -6.57 0.66 0.20 0.70
4-legged stop-controlled (urban) -3.12 0.27 0.16 0.60
4-legged all-way stop-controlled (rural) -12.37 1.22 0.27 1.09
4-legged signalized (rural) -6.57 0.66 0.20 0.51
Injury Crashes
3-legged stop-controlled (urban) -8.45 0.49 0.39 0.36
3-legged all-way stop-controlled (rural) -13.68 1.22 0.27 0.50
3-legged signalized (rural) -7.83 0.75 0.14 0.50
4-legged stop-controlled (urban) -4.35 0.29 0.19 0.34
4-legged all-way stop-controlled (rural) -13.76 1.22 0.27 0.80
4-legged signalized (rural) -7.83 0.75 0.14 0.74
Table 6.13: Calibration Factors and Re-estimated Overdispersion Parameters
Model Total Crash Calibration
Factor
Injury Crash Calibration
Factor
k for Total Crashes
k for Injury Crashes
3-legged stop-controlled 6.63 3.11 0.46 0.36
3-legged all-way stop-controlled 2.14 2.11 0.53 0.56
3-legged signalized 0.84 0.44 0.70 0.50
4-legged stop-controlled 4.65 2.40 0.60 0.34
4-legged all-way stop-controlled 4.12 4.10 1.09 1.05
4-legged signalized 1.53 0.93 0.51 0.74
To account for time trends in the EB procedure the models are also recalibrated for each year of data. Similarly to deriving the calibration factor for the SPFs, these recalibrated models are now re-applied to the reference site data but now predicting for one year of data at a time. The sum of observed crashes is divided by the sum of predictions to derive a yearly multiplier to be applied to the model.
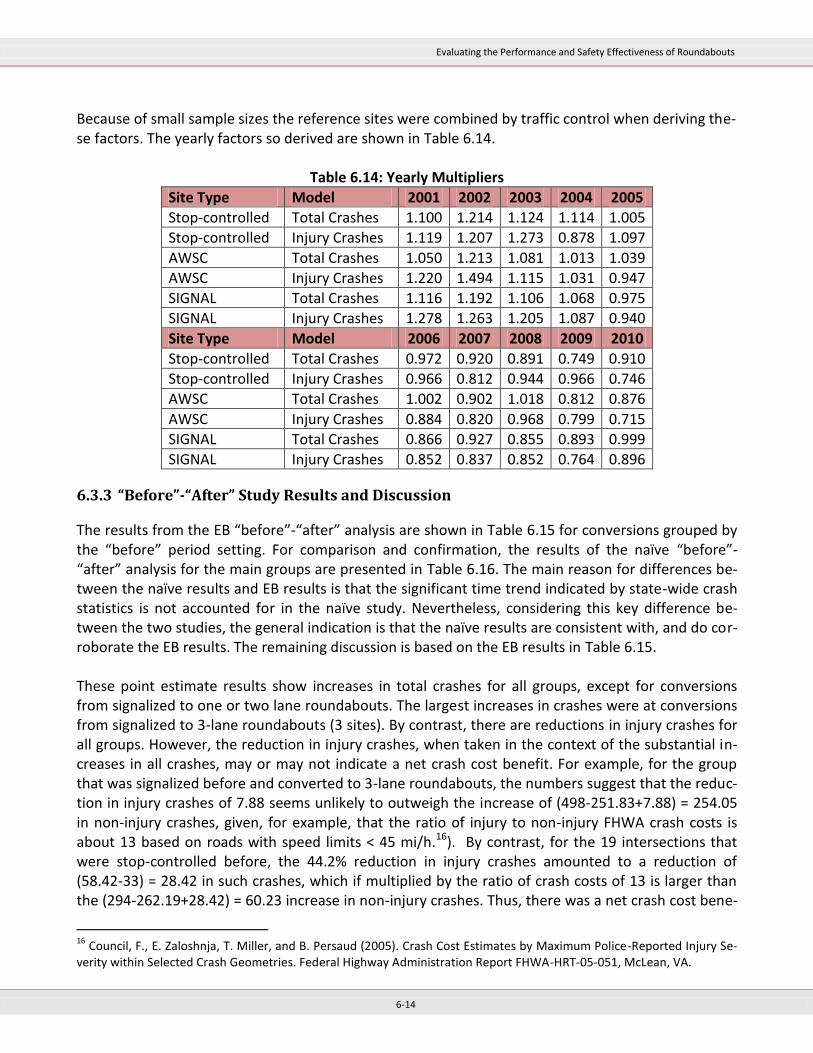
Evaluating the Performance and Safety Effectiveness of Roundabouts
6-14
Because of small sample sizes the reference sites were combined by traffic control when deriving the-se factors. The yearly factors so derived are shown in Table 6.14.
Table 6.14: Yearly Multipliers
Site Type Model 2001 2002 2003 2004 2005
Stop-controlled Total Crashes 1.100 1.214 1.124 1.114 1.005
Stop-controlled Injury Crashes 1.119 1.207 1.273 0.878 1.097
AWSC Total Crashes 1.050 1.213 1.081 1.013 1.039
AWSC Injury Crashes 1.220 1.494 1.115 1.031 0.947
SIGNAL Total Crashes 1.116 1.192 1.106 1.068 0.975
SIGNAL Injury Crashes 1.278 1.263 1.205 1.087 0.940
Site Type Model 2006 2007 2008 2009 2010
Stop-controlled Total Crashes 0.972 0.920 0.891 0.749 0.910
Stop-controlled Injury Crashes 0.966 0.812 0.944 0.966 0.746
AWSC Total Crashes 1.002 0.902 1.018 0.812 0.876
AWSC Injury Crashes 0.884 0.820 0.968 0.799 0.715
SIGNAL Total Crashes 0.866 0.927 0.855 0.893 0.999
SIGNAL Injury Crashes 0.852 0.837 0.852 0.764 0.896
6.3.3 “Before”-“After” Study Results and Discussion
The results from the EB “before”-“after” analysis are shown in Table 6.15 for conversions grouped by the “before” period setting. For comparison and confirmation, the results of the naïve “before”-“after” analysis for the main groups are presented in Table 6.16. The main reason for differences be-tween the naïve results and EB results is that the significant time trend indicated by state-wide crash statistics is not accounted for in the naïve study. Nevertheless, considering this key difference be-tween the two studies, the general indication is that the naïve results are consistent with, and do cor-roborate the EB results. The remaining discussion is based on the EB results in Table 6.15. These point estimate results show increases in total crashes for all groups, except for conversions from signalized to one or two lane roundabouts. The largest increases in crashes were at conversions from signalized to 3-lane roundabouts (3 sites). By contrast, there are reductions in injury crashes for all groups. However, the reduction in injury crashes, when taken in the context of the substantial in-creases in all crashes, may or may not indicate a net crash cost benefit. For example, for the group that was signalized before and converted to 3-lane roundabouts, the numbers suggest that the reduc-tion in injury crashes of 7.88 seems unlikely to outweigh the increase of (498-251.83+7.88) = 254.05 in non-injury crashes, given, for example, that the ratio of injury to non-injury FHWA crash costs is about 13 based on roads with speed limits < 45 mi/h.16). By contrast, for the 19 intersections that were stop-controlled before, the 44.2% reduction in injury crashes amounted to a reduction of (58.42-33) = 28.42 in such crashes, which if multiplied by the ratio of crash costs of 13 is larger than the (294-262.19+28.42) = 60.23 increase in non-injury crashes. Thus, there was a net crash cost bene-
16
Council, F., E. Zaloshnja, T. Miller, and B. Persaud (2005). Crash Cost Estimates by Maximum Police-Reported Injury Se-verity within Selected Crash Geometries. Federal Highway Administration Report FHWA-HRT-05-051, McLean, VA.
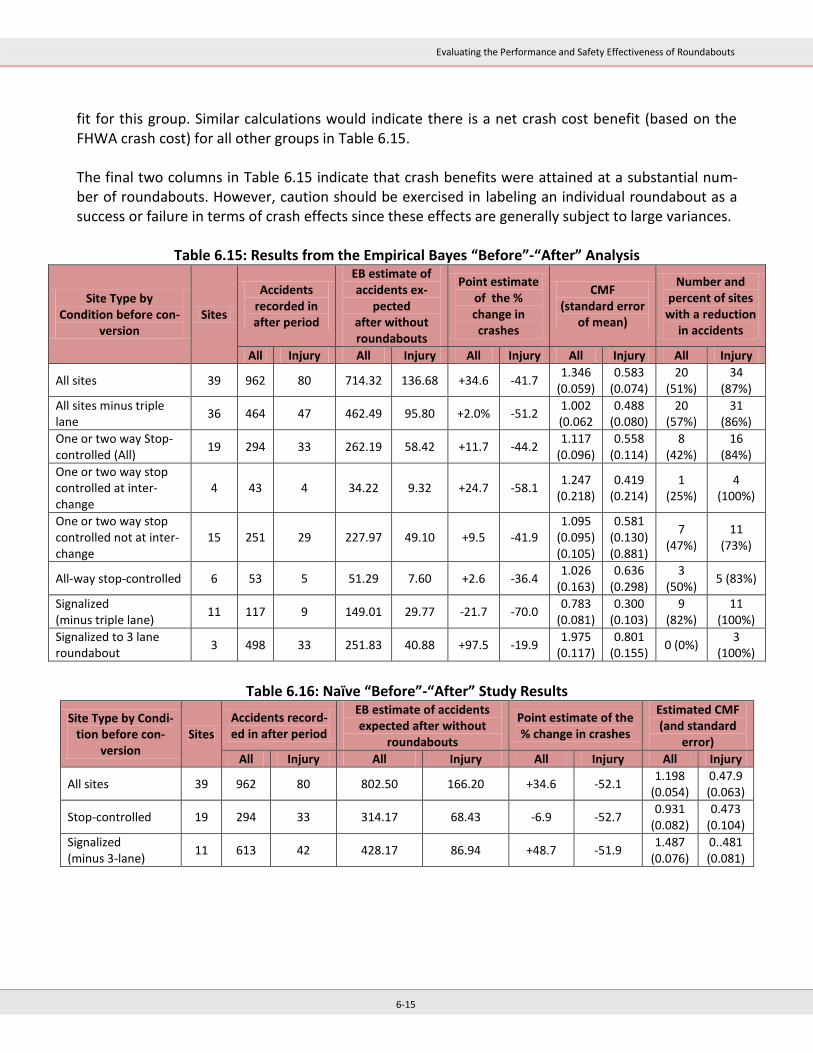
Evaluating the Performance and Safety Effectiveness of Roundabouts
6-15
fit for this group. Similar calculations would indicate there is a net crash cost benefit (based on the FHWA crash cost) for all other groups in Table 6.15. The final two columns in Table 6.15 indicate that crash benefits were attained at a substantial num-ber of roundabouts. However, caution should be exercised in labeling an individual roundabout as a success or failure in terms of crash effects since these effects are generally subject to large variances.
Table 6.15: Results from the Empirical Bayes “Before”-“After” Analysis
Site Type by Condition before con-
version Sites
Accidents recorded in after period
EB estimate of accidents ex-
pected after without roundabouts
Point estimate of the % change in crashes
CMF (standard error
of mean)
Number and percent of sites
with a reduction in accidents
All Injury All Injury All Injury All Injury All Injury
All sites 39 962 80 714.32 136.68 +34.6 -41.7 1.346
(0.059) 0.583
(0.074) 20
(51%) 34
(87%)
All sites minus triple lane
36 464 47 462.49 95.80 +2.0% -51.2 1.002 (0.062
0.488 (0.080)
20 (57%)
31 (86%)
One or two way Stop-controlled (All)
19 294 33 262.19 58.42 +11.7 -44.2 1.117
(0.096) 0.558
(0.114) 8
(42%) 16
(84%)
One or two way stop controlled at inter-change
4 43 4 34.22 9.32 +24.7 -58.1 1.247
(0.218) 0.419
(0.214) 1
(25%) 4
(100%)
One or two way stop controlled not at inter-change
15 251 29 227.97 49.10 +9.5 -41.9 1.095
(0.095) (0.105)
0.581 (0.130) (0.881)
7 (47%)
11 (73%)
All-way stop-controlled 6 53 5 51.29 7.60 +2.6 -36.4 1.026
(0.163) 0.636
(0.298) 3
(50%) 5 (83%)
Signalized (minus triple lane)
11 117 9 149.01 29.77 -21.7 -70.0 0.783
(0.081) 0.300
(0.103) 9
(82%) 11
(100%)
Signalized to 3 lane roundabout
3 498 33 251.83 40.88 +97.5 -19.9 1.975
(0.117) 0.801
(0.155) 0 (0%)
3 (100%)
Table 6.16: Naïve “Before”-“After” Study Results
Site Type by Condi-tion before con-
version Sites
Accidents record-ed in after period
EB estimate of accidents expected after without
roundabouts
Point estimate of the % change in crashes
Estimated CMF (and standard
error)
All Injury All Injury All Injury All Injury
All sites 39 962 80 802.50 166.20 +34.6 -52.1 1.198
(0.054) 0.47.9 (0.063)
Stop-controlled 19 294 33 314.17 68.43 -6.9 -52.7 0.931
(0.082) 0.473
(0.104)
Signalized (minus 3-lane)
11 613 42 428.17 86.94 +48.7 -51.9 1.487
(0.076) 0..481 (0.081)
Evaluating the Performance and Safety Effectiveness of Roundabouts
6-16
6.4 Development of Safety Performance Functions
An additional objective was to develop a Safety Performance Function (SPF) for roundabouts. An SPF is a mathematical model that predicts the mean crash frequency for similar locations with the same traffic volume and other characteristics that define the model. Such an SPF may be used when evalu-ating the safety performance of an existing roundabout by comparing the frequency of observed to predicted crashes or in estimating the likely safety effects of a contemplated roundabout conversion. How to estimate the likely safety effects of conversions is documented within this report. Roundabout SPFs were calibrated for total and injury crashes separately for non-interchange and in-terchange roundabouts. In developing the SPFs several variables were considered, including:
total entering AADT
number of circulating lanes
number of approaches
environment (urban or rural)
interchange versus non-interchange location
These were the only variables available for modeling. Note that triple lane roundabouts were not in-cluded in these data due to their limited number and the concerns raised with respect to their opera-tion. Generalized linear regression modeling was used to estimate the model coefficients assuming a nega-tive binomial error distribution, all consistent with the state of the art research in developing these models. In selecting the recommended SPFs for total and injury crashes, low values of the dispersion parameter and statistical significance of the estimated variable coefficients was considered. All esti-mated coefficients were estimated to be significant at the 95% confidence limit with the exception of interchange presence which was included in the model of injury crashes because the results were consistent with the model for total crashes. The SPFs developed are provided in Table 6.17.
The model form for all models is: ⁄ where, AADT = total entering AADT Type = 1 if 1 circulating lane; 0 otherwise IC = 1 if located at an interchange; 0 otherwise
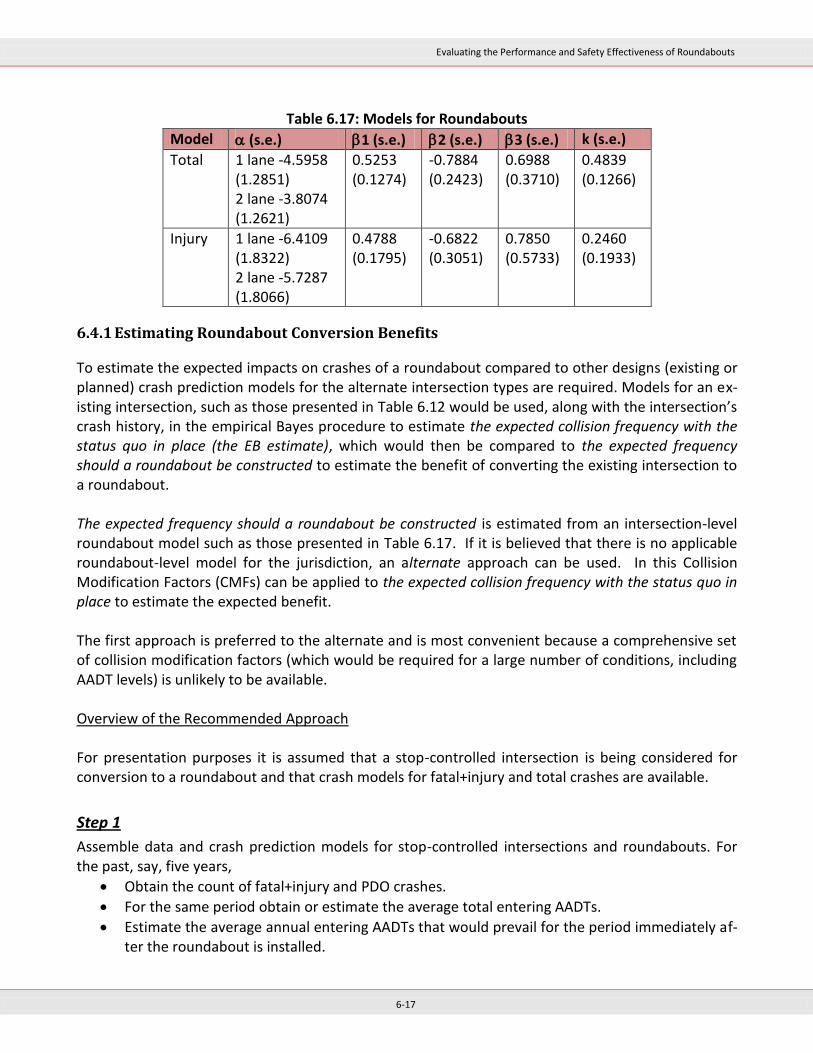
Evaluating the Performance and Safety Effectiveness of Roundabouts
6-17
Table 6.17: Models for Roundabouts
Model (s.e.) 1 (s.e.) 2 (s.e.) 3 (s.e.) k (s.e.)
Total 1 lane -4.5958 (1.2851) 2 lane -3.8074 (1.2621)
0.5253 (0.1274)
-0.7884 (0.2423)
0.6988 (0.3710)
0.4839 (0.1266)
Injury 1 lane -6.4109 (1.8322) 2 lane -5.7287 (1.8066)
0.4788 (0.1795)
-0.6822 (0.3051)
0.7850 (0.5733)
0.2460 (0.1933)
6.4.1 Estimating Roundabout Conversion Benefits
To estimate the expected impacts on crashes of a roundabout compared to other designs (existing or planned) crash prediction models for the alternate intersection types are required. Models for an ex-isting intersection, such as those presented in Table 6.12 would be used, along with the intersection’s crash history, in the empirical Bayes procedure to estimate the expected collision frequency with the status quo in place (the EB estimate), which would then be compared to the expected frequency should a roundabout be constructed to estimate the benefit of converting the existing intersection to a roundabout. The expected frequency should a roundabout be constructed is estimated from an intersection-level roundabout model such as those presented in Table 6.17. If it is believed that there is no applicable roundabout-level model for the jurisdiction, an alternate approach can be used. In this Collision Modification Factors (CMFs) can be applied to the expected collision frequency with the status quo in place to estimate the expected benefit. The first approach is preferred to the alternate and is most convenient because a comprehensive set of collision modification factors (which would be required for a large number of conditions, including AADT levels) is unlikely to be available. Overview of the Recommended Approach For presentation purposes it is assumed that a stop-controlled intersection is being considered for conversion to a roundabout and that crash models for fatal+injury and total crashes are available.
Step 1
Assemble data and crash prediction models for stop-controlled intersections and roundabouts. For the past, say, five years,
Obtain the count of fatal+injury and PDO crashes.
For the same period obtain or estimate the average total entering AADTs.
Estimate the average annual entering AADTs that would prevail for the period immediately af-ter the roundabout is installed.

Evaluating the Performance and Safety Effectiveness of Roundabouts
6-18
Assemble required collision prediction models for stop-controlled intersections and rounda-bouts for fatal+injury and total crashes. If the models cannot be assumed to be representative of the jurisdiction, a calibration multiplier must first be estimated using data (similar to data acquired in Step 1) from a sample of roundabouts representative of that jurisdiction. At a min-imum, a dataset for at least 10 roundabouts with a minimum of 50 crashes total is needed for each model. The recalibration multiplier is the sum of crashes recorded in this dataset divided by the sum of the crashes predicted by the model for this dataset. The multiplier is applied to the equation selected for predicting crashes.
Step 2
Use the EB procedure with the data from Step 1 and the stop-controlled intersection model to esti-mate the expected annual number of fatal+injury and total crashes that would occur without conver-sion, i.e., had the intersection remained stop-controlled. The EB estimate of expected crash frequency, m, is calculated as: Where:
Where: P = the yearly crash frequency expected as predicted by a crash prediction model x = the observed crash frequency n = the number of years of observed crashes per year k = the overdispersion parameter for a given model Separate estimates for fatal+injury and total crashes are produced.
Step 3
Use the appropriate roundabout model and the AADTs from Step 1 to estimate the expected number of fatal+injury and total crashes that would occur if the intersection were converted to a roundabout.
Step 4
Obtain the difference between the stop-controlled EB estimates from Step 2 and the roundabout model estimates from Step 3 for fatal+injury and total crashes. The estimated change for PDO crashes is the difference between the change in total and fatal+injury crashes.
Step 5
Applying suitable dollar values for fatal+injury and PDO crashes to the estimates from Step 4, obtain the estimated net safety benefit of converting the intersection to a roundabout.
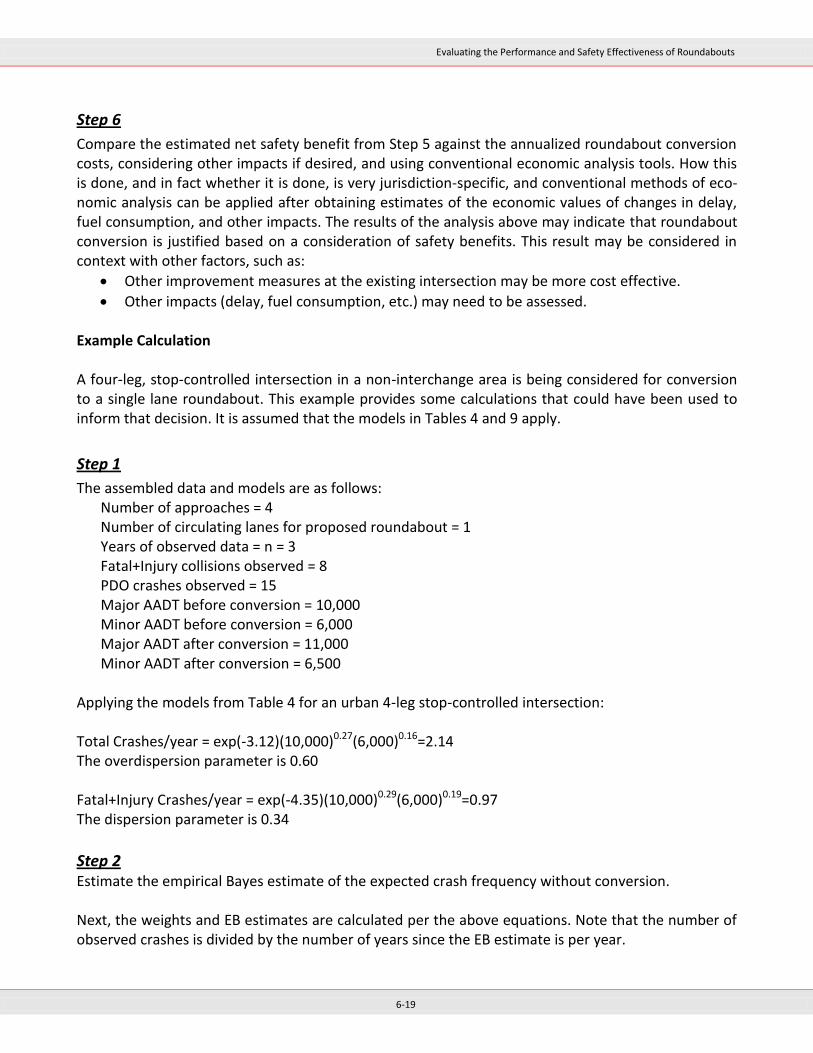
Evaluating the Performance and Safety Effectiveness of Roundabouts
6-19
Step 6
Compare the estimated net safety benefit from Step 5 against the annualized roundabout conversion costs, considering other impacts if desired, and using conventional economic analysis tools. How this is done, and in fact whether it is done, is very jurisdiction-specific, and conventional methods of eco-nomic analysis can be applied after obtaining estimates of the economic values of changes in delay, fuel consumption, and other impacts. The results of the analysis above may indicate that roundabout conversion is justified based on a consideration of safety benefits. This result may be considered in context with other factors, such as:
Other improvement measures at the existing intersection may be more cost effective.
Other impacts (delay, fuel consumption, etc.) may need to be assessed. Example Calculation A four-leg, stop-controlled intersection in a non-interchange area is being considered for conversion to a single lane roundabout. This example provides some calculations that could have been used to inform that decision. It is assumed that the models in Tables 4 and 9 apply.
Step 1
The assembled data and models are as follows: Number of approaches = 4 Number of circulating lanes for proposed roundabout = 1 Years of observed data = n = 3 Fatal+Injury collisions observed = 8 PDO crashes observed = 15 Major AADT before conversion = 10,000 Minor AADT before conversion = 6,000 Major AADT after conversion = 11,000 Minor AADT after conversion = 6,500
Applying the models from Table 4 for an urban 4-leg stop-controlled intersection: Total Crashes/year = exp(-3.12)(10,000)0.27(6,000)0.16=2.14 The overdispersion parameter is 0.60 Fatal+Injury Crashes/year = exp(-4.35)(10,000)0.29(6,000)0.19=0.97 The dispersion parameter is 0.34
Step 2 Estimate the empirical Bayes estimate of the expected crash frequency without conversion. Next, the weights and EB estimates are calculated per the above equations. Note that the number of observed crashes is divided by the number of years since the EB estimate is per year.
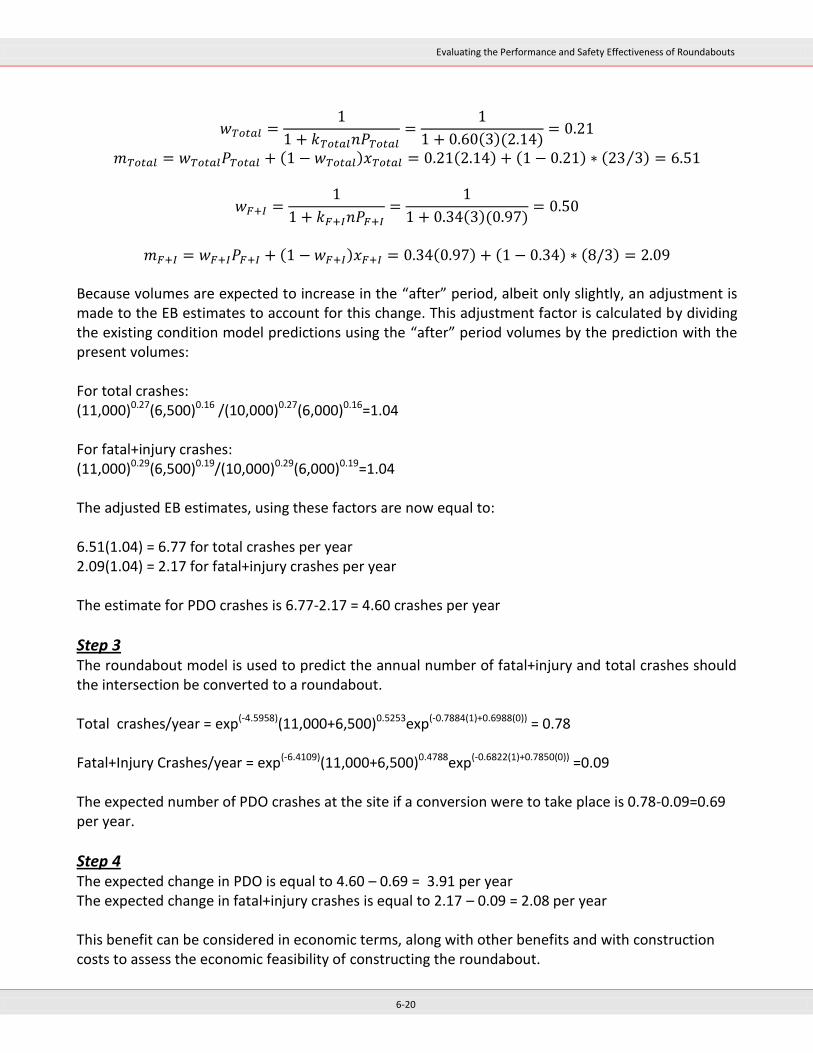
Evaluating the Performance and Safety Effectiveness of Roundabouts
6-20
⁄
Because volumes are expected to increase in the “after” period, albeit only slightly, an adjustment is made to the EB estimates to account for this change. This adjustment factor is calculated by dividing the existing condition model predictions using the “after” period volumes by the prediction with the present volumes: For total crashes: (11,000)0.27(6,500)0.16 /(10,000)0.27(6,000)0.16=1.04 For fatal+injury crashes: (11,000)0.29(6,500)0.19/(10,000)0.29(6,000)0.19=1.04 The adjusted EB estimates, using these factors are now equal to: 6.51(1.04) = 6.77 for total crashes per year 2.09(1.04) = 2.17 for fatal+injury crashes per year
The estimate for PDO crashes is 6.77-2.17 = 4.60 crashes per year
Step 3 The roundabout model is used to predict the annual number of fatal+injury and total crashes should the intersection be converted to a roundabout. Total crashes/year = exp(-4.5958)(11,000+6,500)0.5253exp(-0.7884(1)+0.6988(0)) = 0.78 Fatal+Injury Crashes/year = exp(-6.4109)(11,000+6,500)0.4788exp(-0.6822(1)+0.7850(0)) =0.09
The expected number of PDO crashes at the site if a conversion were to take place is 0.78-0.09=0.69 per year.
Step 4 The expected change in PDO is equal to 4.60 – 0.69 = 3.91 per year The expected change in fatal+injury crashes is equal to 2.17 – 0.09 = 2.08 per year This benefit can be considered in economic terms, along with other benefits and with construction costs to assess the economic feasibility of constructing the roundabout.

Evaluating the Performance and Safety Effectiveness of Roundabouts
6-21
6.5 Operational Impacts of Roundabouts
As part of this study, a comparison of the operations of the different roundabout types was conduct-ed for before construction of the roundabout and after the roundabout was opened for traffic. A list of the roundabouts that operations analysis was conducted for is provided below:
EB M-14 Ramps at Maple Road (Interchange Roundabout)
WB M-14 Ramps at Maple Road (Interchange Roundabout)
Huron Parkway at Nixon Road (Single lane Roundabout)
Maple Road at Drake Road (Multi-lane Roundabout)
Maple Road at Farmington Road (Multi-lane Roundabout) For the “before” conditions, previous traffic operations were obtained from studies conducted prior to each intersection improvement project. The operational analysis for the “before” period was con-ducted using the Synchro software and Highway Capacity Software (HCS) packages. Detailed reports of the “before” operational analysis can be found in the Appendix of this report. In order to conduct an “after” or current (2011) operational analysis, “after” turning movement vol-umes were established by applying growth factors to the before turning movement counts. The growth factors were established by comparing the average daily traffic (ADT) for the before year against the most recent ADT volumes available. No traffic counts were taken as part of this study. Once the 2011 peak hour turning movement volumes were developed, a RODEL analysis was con-ducted to determine the predicted operations for the “after” scenarios. The operational analysis in-cluded both LOS and average delay, in seconds per vehicle. The predicted delay for both the “before” and “after” scenarios was compared to determine a percent change. Table 6.18 and Table 6.19 summarize the results of the operational analysis. The delay for the Maple Road at Drake Road and Maple Road at Farmington Road were assumed because values were not determined at the time of the roundabout construction, only LOS was determined.
Table 6.18: AM Peak Period Delay and Level of Service
Intersection “Before” “After”
Percent Change LOS
Delay (sec/veh)
LOS Delay
(sec/veh)
EB M-14 Ramps at Maple Road F 105.5 A 6.5 93.8%
WB M-14 Ramps at Maple Road D 34.2 A 5.1 85.1%
Huron Parkway at Nixon Road B 22.3 A 5.7 74.4%
Maple Road at Drake Road D 35.0** A 5.7 83.7%
Maple Road at Farmington Road F 80.0** A 7.7 90.4%
** denotes an assumed value
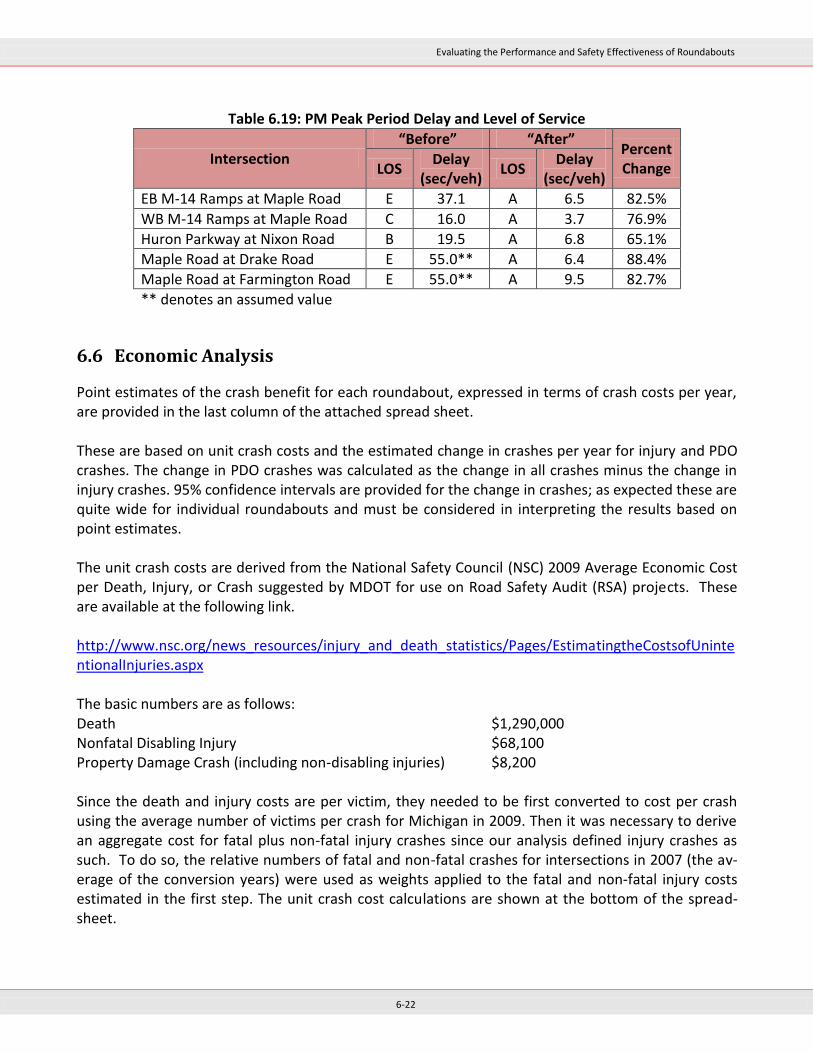
Evaluating the Performance and Safety Effectiveness of Roundabouts
6-22
Table 6.19: PM Peak Period Delay and Level of Service
Intersection “Before” “After”
Percent Change LOS
Delay (sec/veh)
LOS Delay
(sec/veh)
EB M-14 Ramps at Maple Road E 37.1 A 6.5 82.5%
WB M-14 Ramps at Maple Road C 16.0 A 3.7 76.9%
Huron Parkway at Nixon Road B 19.5 A 6.8 65.1%
Maple Road at Drake Road E 55.0** A 6.4 88.4%
Maple Road at Farmington Road E 55.0** A 9.5 82.7%
** denotes an assumed value
6.6 Economic Analysis
Point estimates of the crash benefit for each roundabout, expressed in terms of crash costs per year, are provided in the last column of the attached spread sheet. These are based on unit crash costs and the estimated change in crashes per year for injury and PDO crashes. The change in PDO crashes was calculated as the change in all crashes minus the change in injury crashes. 95% confidence intervals are provided for the change in crashes; as expected these are quite wide for individual roundabouts and must be considered in interpreting the results based on point estimates. The unit crash costs are derived from the National Safety Council (NSC) 2009 Average Economic Cost per Death, Injury, or Crash suggested by MDOT for use on Road Safety Audit (RSA) projects. These are available at the following link. http://www.nsc.org/news_resources/injury_and_death_statistics/Pages/EstimatingtheCostsofUnintentionalInjuries.aspx The basic numbers are as follows: Death $1,290,000 Nonfatal Disabling Injury $68,100 Property Damage Crash (including non-disabling injuries) $8,200 Since the death and injury costs are per victim, they needed to be first converted to cost per crash using the average number of victims per crash for Michigan in 2009. Then it was necessary to derive an aggregate cost for fatal plus non-fatal injury crashes since our analysis defined injury crashes as such. To do so, the relative numbers of fatal and non-fatal crashes for intersections in 2007 (the av-erage of the conversion years) were used as weights applied to the fatal and non-fatal injury costs estimated in the first step. The unit crash cost calculations are shown at the bottom of the spread-sheet.

Evaluating the Performance and Safety Effectiveness of Roundabouts
6-23
Table 6.20: Calculation of Cost per Fatal/Injury Crash
Crashes at Intersections (Michi-gan 2007)
Fatal A-Level B-Level C-Level All Injury
265 1,873 5,095 15,174 22,142
NSC Cost per victim Fatal Injury
$ 1,290,000 $ 68,100
Victims per crash (Michigan 2009)
Fatal/crash Injury/crash
1.081 1.357
Cost/crash Fatal Injury Fatal & Injury
$ 1,394,032 $ 92,390 $ 107,784
Once the cost per crash was determined, these values were applied to the change in crashes per year for both PDO and injury related crashes. Table 6.21 contains the benefits resulting from the reduc-tion in crashes. Positive values denote a reduction in crashes.
Table 6.21: Benefit Analysis Resulted from Crash Reduction
Intersection Change in PDO/year
Change in injury/year
PDO/year Savings
Injury/year Savings
ALL/year Savings
SINGLE LANE ROUNDABOUTS
I-94 Business (Main St) & Riverview Dr 3.013 1.186 $24,704 $127,785 $152,488
I-94 Business (Main St) & 5th St 1.451 0.536 $11,897 $57,752 $69,649
US-127 BR & Mission St 0.239 0.382 $1,959 $41,202 $43,162
Willow Hwy & Canal Rd -0.885 -0.118 -$7,259 -$12,770 -$20,029
Bennett Rd & Hulett Rd 0.080 1.822 $659 $196,429 $197,088
Michigan Ave & Washington Square 1.231 0.026 $10,092 $2,794 $12,886
Mosher St & Main St 0.092 0.344 $753 $37,128 $37,881
Cherry St & Jefferson Ave 0.930 0.969 $7,627 $104,432 $112,059
Wealthy St & Lafayette Ave 3.038 0.162 $24,914 $17,454 $42,368
Wealthy St & Jefferson Ave 3.651 2.596 $29,939 $279,836 $309,776
7 Mile Rd & Brewer Ave 0.230 0.534 $1,889 $57,581 $59,469
Hamburg Rd & Winans Lake Rd 1.464 0.695 $12,006 $74,954 $86,959
Main St & 3rd St -0.597 0.624 -$4,896 $67,299 $62,403
Hayes Rd & 25 Mile Rd -2.992 0.939 -$24,532 $101,160 $76,629
M-46/Apple Ave & M-37/Newaygo Rd 1.657 1.228 $13,588 $132,371 $145,960
3rd St & Western Ave -0.723 0.016 -$5,929 $1,763 -$4,166
Cooley Lake Rd & Bogie Lake Rd -1.505 1.880 -$12,344 $202,651 $190,306
Cooley Lake Rd & Oxbow Lake Rd -1.801 -0.035 -$14,770 -$3,764 -$18,534
Old US-27/North Hwy & Livingston Blvd -0.237 -0.069 -$1,945 -$7,451 -$9,397
Nixon Rd & Huron Pkwy 1.061 0.582 $8,698 $62,716 $71,414
AVERAGE 0.470 0.715 $3,852 $77,066 $80,919
TOTAL 9.396 14.300 $77,049 $1,541,322 $1,618,372
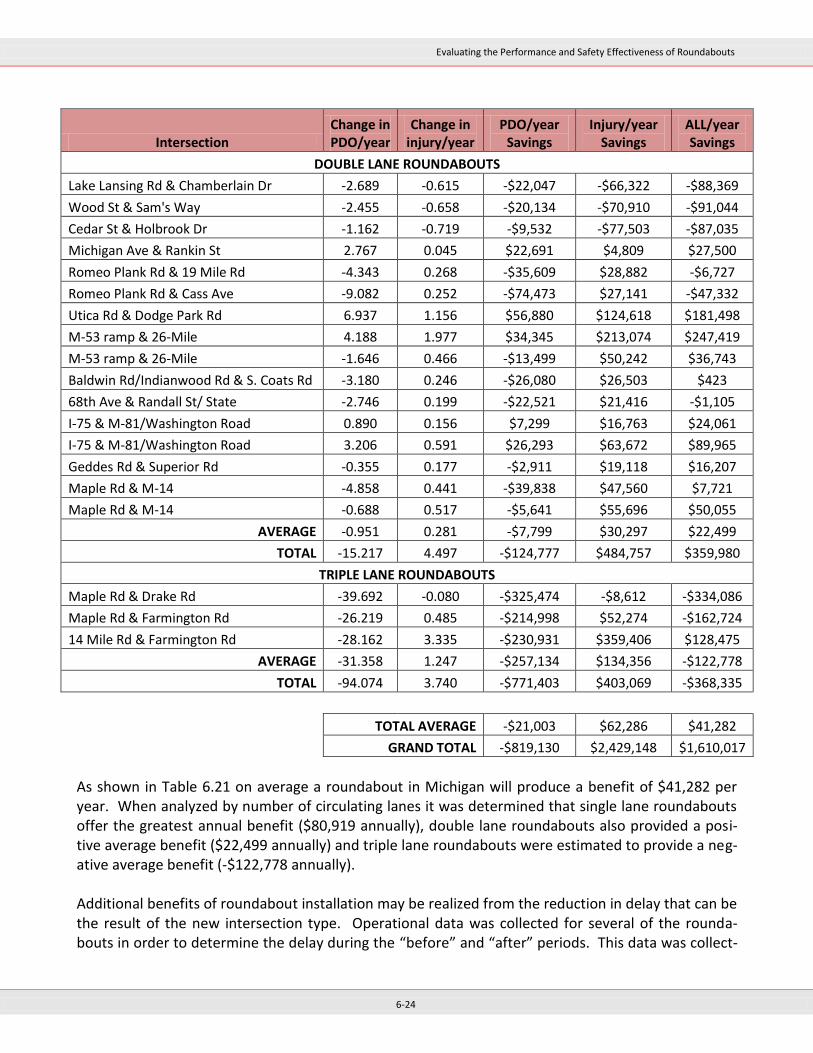
Evaluating the Performance and Safety Effectiveness of Roundabouts
6-24
Intersection Change in PDO/year
Change in injury/year
PDO/year Savings
Injury/year Savings
ALL/year Savings
DOUBLE LANE ROUNDABOUTS
Lake Lansing Rd & Chamberlain Dr -2.689 -0.615 -$22,047 -$66,322 -$88,369
Wood St & Sam's Way -2.455 -0.658 -$20,134 -$70,910 -$91,044
Cedar St & Holbrook Dr -1.162 -0.719 -$9,532 -$77,503 -$87,035
Michigan Ave & Rankin St 2.767 0.045 $22,691 $4,809 $27,500
Romeo Plank Rd & 19 Mile Rd -4.343 0.268 -$35,609 $28,882 -$6,727
Romeo Plank Rd & Cass Ave -9.082 0.252 -$74,473 $27,141 -$47,332
Utica Rd & Dodge Park Rd 6.937 1.156 $56,880 $124,618 $181,498
M-53 ramp & 26-Mile 4.188 1.977 $34,345 $213,074 $247,419
M-53 ramp & 26-Mile -1.646 0.466 -$13,499 $50,242 $36,743
Baldwin Rd/Indianwood Rd & S. Coats Rd -3.180 0.246 -$26,080 $26,503 $423
68th Ave & Randall St/ State -2.746 0.199 -$22,521 $21,416 -$1,105
I-75 & M-81/Washington Road 0.890 0.156 $7,299 $16,763 $24,061
I-75 & M-81/Washington Road 3.206 0.591 $26,293 $63,672 $89,965
Geddes Rd & Superior Rd -0.355 0.177 -$2,911 $19,118 $16,207
Maple Rd & M-14 -4.858 0.441 -$39,838 $47,560 $7,721
Maple Rd & M-14 -0.688 0.517 -$5,641 $55,696 $50,055
AVERAGE -0.951 0.281 -$7,799 $30,297 $22,499
TOTAL -15.217 4.497 -$124,777 $484,757 $359,980
TRIPLE LANE ROUNDABOUTS
Maple Rd & Drake Rd -39.692 -0.080 -$325,474 -$8,612 -$334,086
Maple Rd & Farmington Rd -26.219 0.485 -$214,998 $52,274 -$162,724
14 Mile Rd & Farmington Rd -28.162 3.335 -$230,931 $359,406 $128,475
AVERAGE -31.358 1.247 -$257,134 $134,356 -$122,778
TOTAL -94.074 3.740 -$771,403 $403,069 -$368,335
TOTAL AVERAGE -$21,003 $62,286 $41,282
GRAND TOTAL -$819,130 $2,429,148 $1,610,017
As shown in Table 6.21 on average a roundabout in Michigan will produce a benefit of $41,282 per year. When analyzed by number of circulating lanes it was determined that single lane roundabouts offer the greatest annual benefit ($80,919 annually), double lane roundabouts also provided a posi-tive average benefit ($22,499 annually) and triple lane roundabouts were estimated to provide a neg-ative average benefit (-$122,778 annually). Additional benefits of roundabout installation may be realized from the reduction in delay that can be the result of the new intersection type. Operational data was collected for several of the rounda-bouts in order to determine the delay during the “before” and “after” periods. This data was collect-
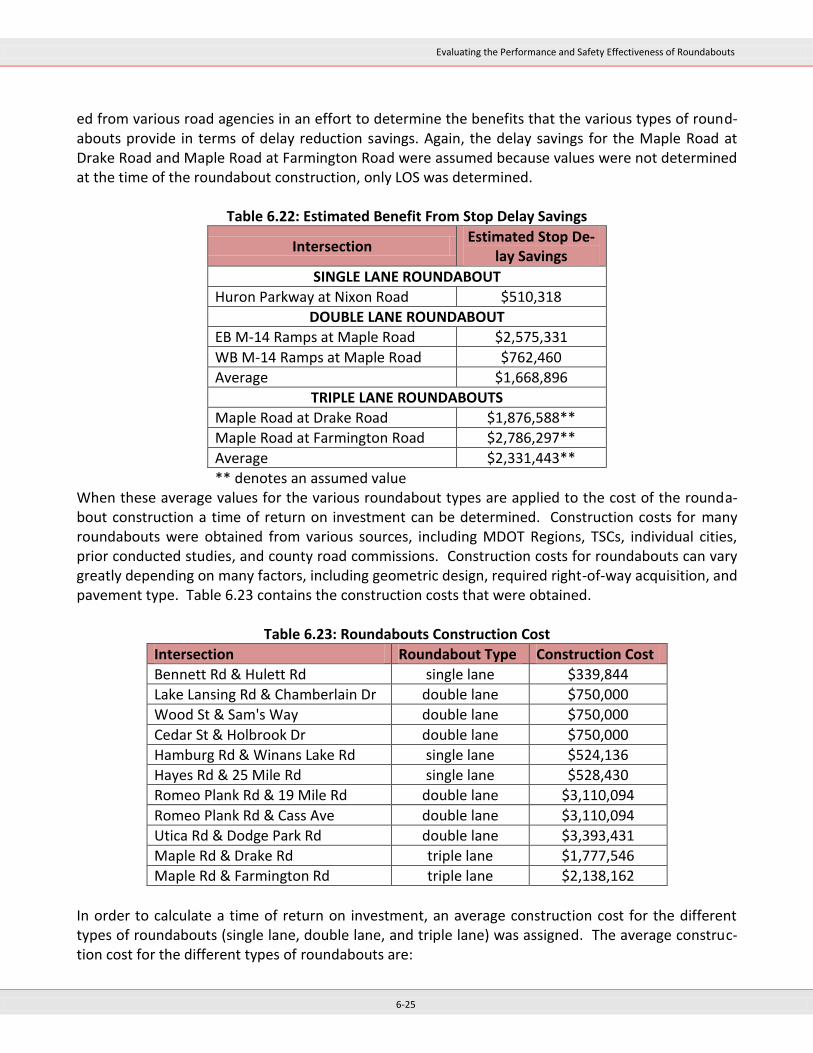
Evaluating the Performance and Safety Effectiveness of Roundabouts
6-25
ed from various road agencies in an effort to determine the benefits that the various types of round-abouts provide in terms of delay reduction savings. Again, the delay savings for the Maple Road at Drake Road and Maple Road at Farmington Road were assumed because values were not determined at the time of the roundabout construction, only LOS was determined.
Table 6.22: Estimated Benefit From Stop Delay Savings
Intersection Estimated Stop De-
lay Savings
SINGLE LANE ROUNDABOUT
Huron Parkway at Nixon Road $510,318
DOUBLE LANE ROUNDABOUT
EB M-14 Ramps at Maple Road $2,575,331
WB M-14 Ramps at Maple Road $762,460
Average $1,668,896
TRIPLE LANE ROUNDABOUTS
Maple Road at Drake Road $1,876,588**
Maple Road at Farmington Road $2,786,297**
Average $2,331,443**
** denotes an assumed value When these average values for the various roundabout types are applied to the cost of the rounda-bout construction a time of return on investment can be determined. Construction costs for many roundabouts were obtained from various sources, including MDOT Regions, TSCs, individual cities, prior conducted studies, and county road commissions. Construction costs for roundabouts can vary greatly depending on many factors, including geometric design, required right-of-way acquisition, and pavement type. Table 6.23 contains the construction costs that were obtained.
Table 6.23: Roundabouts Construction Cost
Intersection Roundabout Type Construction Cost
Bennett Rd & Hulett Rd single lane $339,844
Lake Lansing Rd & Chamberlain Dr double lane $750,000
Wood St & Sam's Way double lane $750,000
Cedar St & Holbrook Dr double lane $750,000
Hamburg Rd & Winans Lake Rd single lane $524,136
Hayes Rd & 25 Mile Rd single lane $528,430
Romeo Plank Rd & 19 Mile Rd double lane $3,110,094
Romeo Plank Rd & Cass Ave double lane $3,110,094
Utica Rd & Dodge Park Rd double lane $3,393,431
Maple Rd & Drake Rd triple lane $1,777,546
Maple Rd & Farmington Rd triple lane $2,138,162
In order to calculate a time of return on investment, an average construction cost for the different types of roundabouts (single lane, double lane, and triple lane) was assigned. The average construc-tion cost for the different types of roundabouts are:
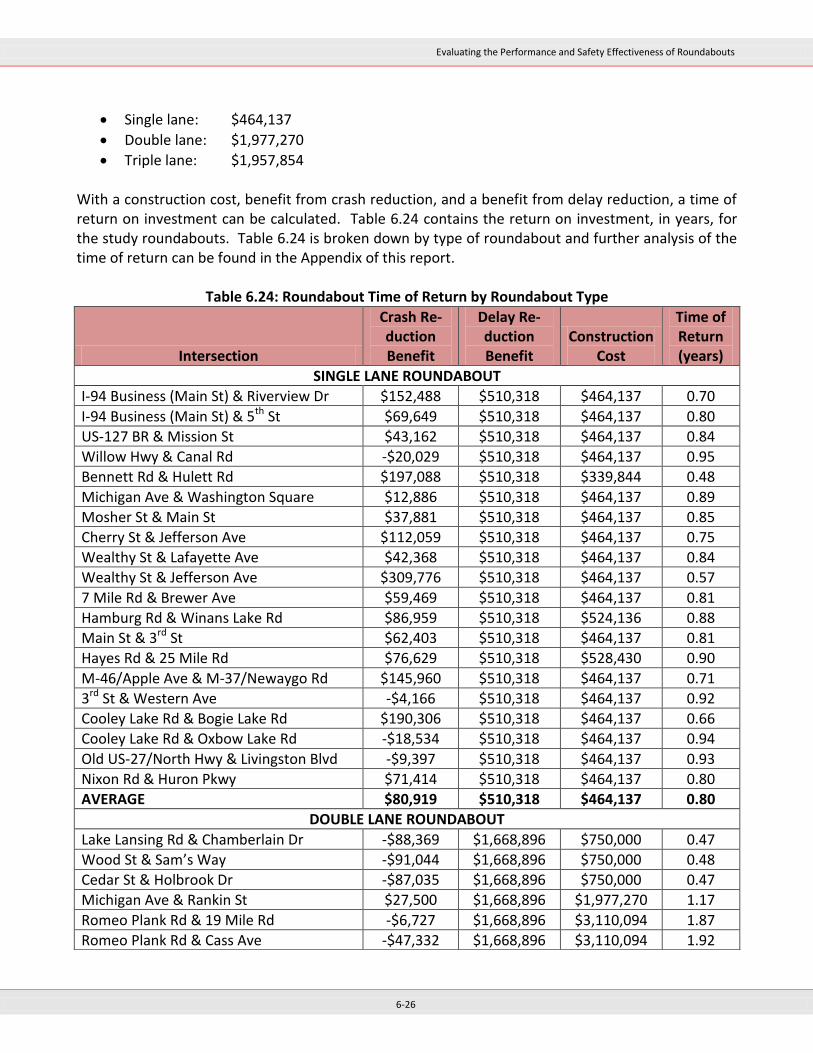
Evaluating the Performance and Safety Effectiveness of Roundabouts
6-26
Single lane: $464,137
Double lane: $1,977,270
Triple lane: $1,957,854 With a construction cost, benefit from crash reduction, and a benefit from delay reduction, a time of return on investment can be calculated. Table 6.24 contains the return on investment, in years, for the study roundabouts. Table 6.24 is broken down by type of roundabout and further analysis of the time of return can be found in the Appendix of this report.
Table 6.24: Roundabout Time of Return by Roundabout Type
Intersection
Crash Re-duction Benefit
Delay Re-duction Benefit
Construction Cost
Time of Return (years)
SINGLE LANE ROUNDABOUT
I-94 Business (Main St) & Riverview Dr $152,488 $510,318 $464,137 0.70
I-94 Business (Main St) & 5th St $69,649 $510,318 $464,137 0.80
US-127 BR & Mission St $43,162 $510,318 $464,137 0.84
Willow Hwy & Canal Rd -$20,029 $510,318 $464,137 0.95
Bennett Rd & Hulett Rd $197,088 $510,318 $339,844 0.48
Michigan Ave & Washington Square $12,886 $510,318 $464,137 0.89
Mosher St & Main St $37,881 $510,318 $464,137 0.85
Cherry St & Jefferson Ave $112,059 $510,318 $464,137 0.75
Wealthy St & Lafayette Ave $42,368 $510,318 $464,137 0.84
Wealthy St & Jefferson Ave $309,776 $510,318 $464,137 0.57
7 Mile Rd & Brewer Ave $59,469 $510,318 $464,137 0.81
Hamburg Rd & Winans Lake Rd $86,959 $510,318 $524,136 0.88
Main St & 3rd St $62,403 $510,318 $464,137 0.81
Hayes Rd & 25 Mile Rd $76,629 $510,318 $528,430 0.90
M-46/Apple Ave & M-37/Newaygo Rd $145,960 $510,318 $464,137 0.71
3rd St & Western Ave -$4,166 $510,318 $464,137 0.92
Cooley Lake Rd & Bogie Lake Rd $190,306 $510,318 $464,137 0.66
Cooley Lake Rd & Oxbow Lake Rd -$18,534 $510,318 $464,137 0.94
Old US-27/North Hwy & Livingston Blvd -$9,397 $510,318 $464,137 0.93
Nixon Rd & Huron Pkwy $71,414 $510,318 $464,137 0.80
AVERAGE $80,919 $510,318 $464,137 0.80
DOUBLE LANE ROUNDABOUT
Lake Lansing Rd & Chamberlain Dr -$88,369 $1,668,896 $750,000 0.47
Wood St & Sam’s Way -$91,044 $1,668,896 $750,000 0.48
Cedar St & Holbrook Dr -$87,035 $1,668,896 $750,000 0.47
Michigan Ave & Rankin St $27,500 $1,668,896 $1,977,270 1.17
Romeo Plank Rd & 19 Mile Rd -$6,727 $1,668,896 $3,110,094 1.87
Romeo Plank Rd & Cass Ave -$47,332 $1,668,896 $3,110,094 1.92
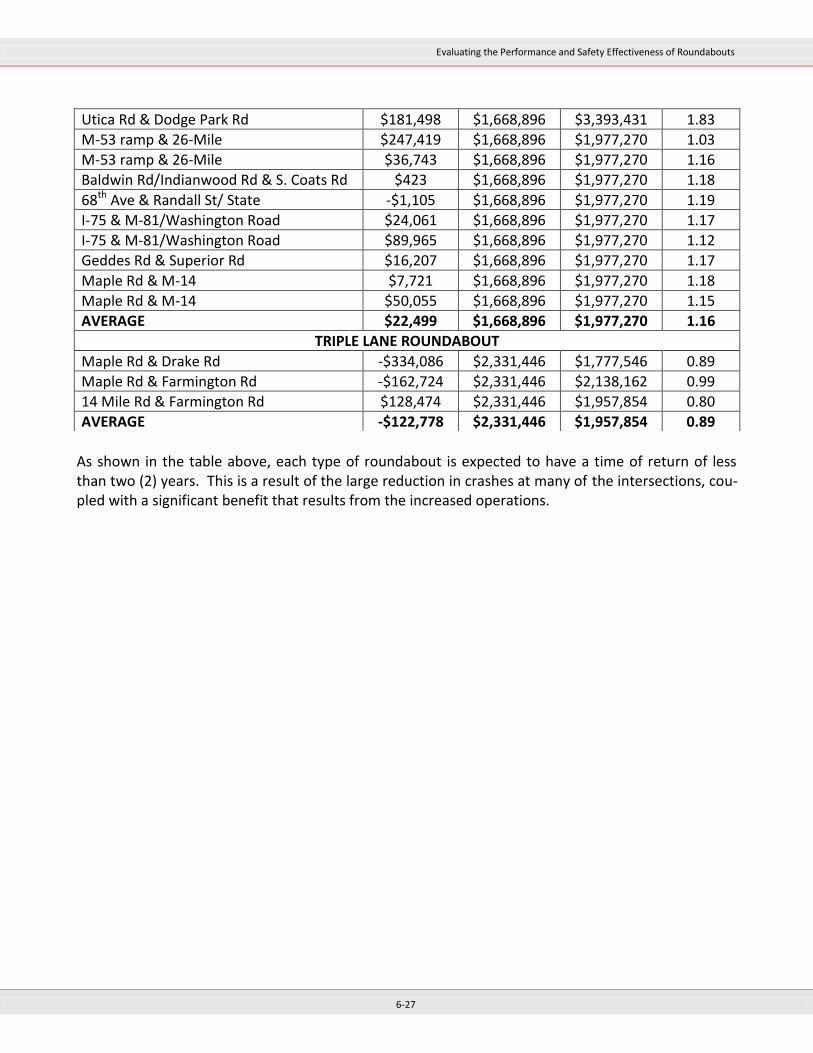
Evaluating the Performance and Safety Effectiveness of Roundabouts
6-27
As shown in the table above, each type of roundabout is expected to have a time of return of less than two (2) years. This is a result of the large reduction in crashes at many of the intersections, cou-pled with a significant benefit that results from the increased operations.
Utica Rd & Dodge Park Rd $181,498 $1,668,896 $3,393,431 1.83
M-53 ramp & 26-Mile $247,419 $1,668,896 $1,977,270 1.03
M-53 ramp & 26-Mile $36,743 $1,668,896 $1,977,270 1.16
Baldwin Rd/Indianwood Rd & S. Coats Rd $423 $1,668,896 $1,977,270 1.18
68th Ave & Randall St/ State -$1,105 $1,668,896 $1,977,270 1.19
I-75 & M-81/Washington Road $24,061 $1,668,896 $1,977,270 1.17
I-75 & M-81/Washington Road $89,965 $1,668,896 $1,977,270 1.12
Geddes Rd & Superior Rd $16,207 $1,668,896 $1,977,270 1.17
Maple Rd & M-14 $7,721 $1,668,896 $1,977,270 1.18
Maple Rd & M-14 $50,055 $1,668,896 $1,977,270 1.15
AVERAGE $22,499 $1,668,896 $1,977,270 1.16
TRIPLE LANE ROUNDABOUT
Maple Rd & Drake Rd -$334,086 $2,331,446 $1,777,546 0.89
Maple Rd & Farmington Rd -$162,724 $2,331,446 $2,138,162 0.99
14 Mile Rd & Farmington Rd $128,474 $2,331,446 $1,957,854 0.80
AVERAGE -$122,778 $2,331,446 $1,957,854 0.89
Evaluating the Performance and Safety Effectiveness of Roundabouts
7-1
7.0 Conclusion
The objective of this report was to determine the impact on crashes at locations where roundabouts have been installed in Michigan, to observe roundabout operations, and to identify the key geometric configurations and site characteristics that influence safety, performance and return on investment. The simple “before” and “after” analysis in this report has shown that roundabouts have reduced the total average annual crashes at single lane and double lane roundabouts, while increasing the total average annual crashes at triple lane roundabouts. The roundabouts were also analyzed for the ef-fect that roundabout installation had on fatal and A-Level crashes. These results are summarized be-low:
Single lane; 60.55 crashes per year reduction
Double lane; 18.56 crashes per year reduction
Triple lane; 94.76 crashes per year increase
Fatal & A-Level; 5.39 crashes per year reduction The EB analysis is a more robust analysis that accounts for the regression to mean, volume trends, and other factors that a simple “before” analysis does not take into consideration. The EB analysis was utilized to more accurately determine the change in crashes at the roundabout intersections. With the reduction in crashes more accurately determined by the EB analysis, CMFs were determined for various roundabout conversions. The results showed increases in total crashes for all groupd, ex-cept for conversions from signalized to one or two lane roundabouts. The largest increases in crashes were at conversions from signalized to three lane roundabouts (three sites). By contrast, there are reductions in injury crashes for all groups. Considering the cost of crashes by severity type there was a net crash cost benefit for most groups. The CMFs are located in Table 6.15 and are summarized be-low:
All sites (minus triple lane roundabouts) stop controlled or signalized before o CMFtotal = 1.002 o CMFinjury = 0.488
Triple lane roundabouts signalized before o CMFtotal = 1.875 o CMFinjury = 0.801
Signalized intersections o CMFtotal = 0.783 o CMFinjury = 0.300
The data were also used to develop SPFs that can be used to estimate the expected number of crash-es an intersection would experience if it was converted to a roundabout. These SPFs vary depending on the type of roundabouts being constructed. Below is a list of the roundabout SPFs developed:
⁄ where, AADT = total entering AADT
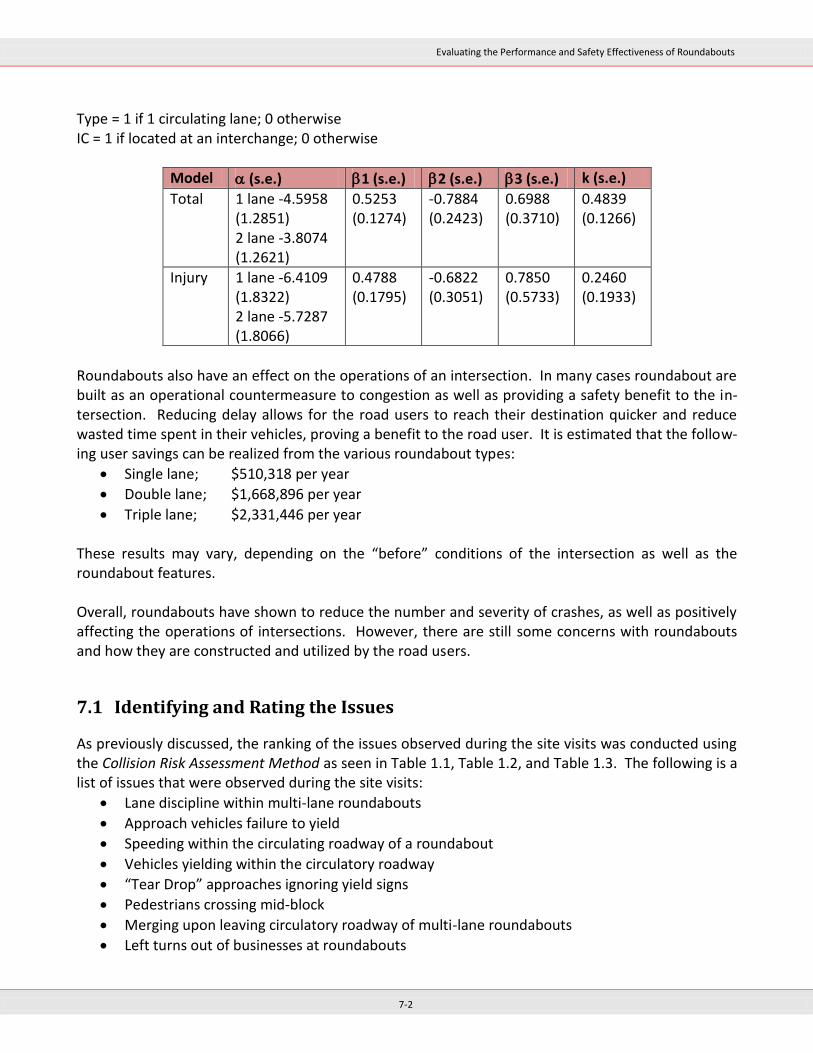
Evaluating the Performance and Safety Effectiveness of Roundabouts
7-2
Type = 1 if 1 circulating lane; 0 otherwise IC = 1 if located at an interchange; 0 otherwise
Model (s.e.) 1 (s.e.) 2 (s.e.) 3 (s.e.) k (s.e.)
Total 1 lane -4.5958 (1.2851) 2 lane -3.8074 (1.2621)
0.5253 (0.1274)
-0.7884 (0.2423)
0.6988 (0.3710)
0.4839 (0.1266)
Injury 1 lane -6.4109 (1.8322) 2 lane -5.7287 (1.8066)
0.4788 (0.1795)
-0.6822 (0.3051)
0.7850 (0.5733)
0.2460 (0.1933)
Roundabouts also have an effect on the operations of an intersection. In many cases roundabout are built as an operational countermeasure to congestion as well as providing a safety benefit to the in-tersection. Reducing delay allows for the road users to reach their destination quicker and reduce wasted time spent in their vehicles, proving a benefit to the road user. It is estimated that the follow-ing user savings can be realized from the various roundabout types:
Single lane; $510,318 per year
Double lane; $1,668,896 per year
Triple lane; $2,331,446 per year These results may vary, depending on the “before” conditions of the intersection as well as the roundabout features. Overall, roundabouts have shown to reduce the number and severity of crashes, as well as positively affecting the operations of intersections. However, there are still some concerns with roundabouts and how they are constructed and utilized by the road users.
7.1 Identifying and Rating the Issues
As previously discussed, the ranking of the issues observed during the site visits was conducted using the Collision Risk Assessment Method as seen in Table 1.1, Table 1.2, and Table 1.3. The following is a list of issues that were observed during the site visits:
Lane discipline within multi-lane roundabouts
Approach vehicles failure to yield
Speeding within the circulating roadway of a roundabout
Vehicles yielding within the circulatory roadway
“Tear Drop” approaches ignoring yield signs
Pedestrians crossing mid-block
Merging upon leaving circulatory roadway of multi-lane roundabouts
Left turns out of businesses at roundabouts
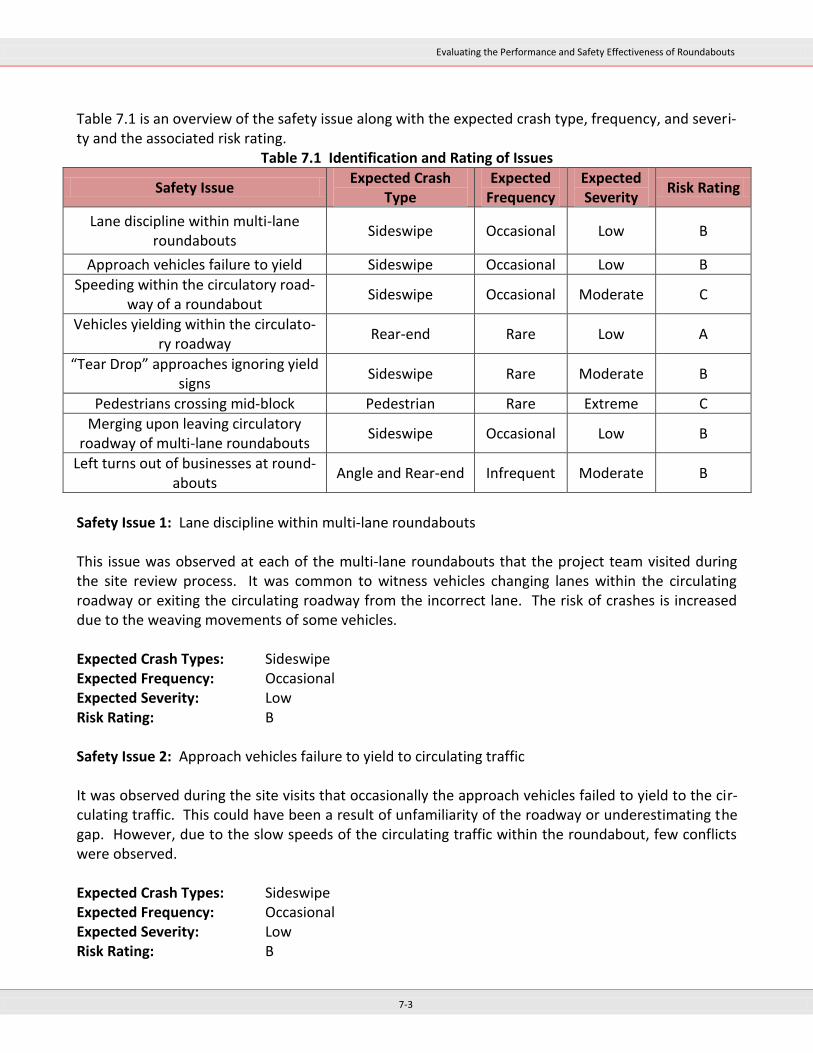
Evaluating the Performance and Safety Effectiveness of Roundabouts
7-3
Table 7.1 is an overview of the safety issue along with the expected crash type, frequency, and severi-ty and the associated risk rating.
Table 7.1 Identification and Rating of Issues
Safety Issue Expected Crash
Type Expected
Frequency Expected Severity
Risk Rating
Lane discipline within multi-lane roundabouts
Sideswipe Occasional Low B
Approach vehicles failure to yield Sideswipe Occasional Low B
Speeding within the circulatory road-way of a roundabout
Sideswipe Occasional Moderate C
Vehicles yielding within the circulato-ry roadway
Rear-end Rare Low A
“Tear Drop” approaches ignoring yield signs
Sideswipe Rare Moderate B
Pedestrians crossing mid-block Pedestrian Rare Extreme C
Merging upon leaving circulatory roadway of multi-lane roundabouts
Sideswipe Occasional Low B
Left turns out of businesses at round-abouts
Angle and Rear-end Infrequent Moderate B
Safety Issue 1: Lane discipline within multi-lane roundabouts This issue was observed at each of the multi-lane roundabouts that the project team visited during the site review process. It was common to witness vehicles changing lanes within the circulating roadway or exiting the circulating roadway from the incorrect lane. The risk of crashes is increased due to the weaving movements of some vehicles. Expected Crash Types: Sideswipe Expected Frequency: Occasional Expected Severity: Low Risk Rating: B Safety Issue 2: Approach vehicles failure to yield to circulating traffic It was observed during the site visits that occasionally the approach vehicles failed to yield to the cir-culating traffic. This could have been a result of unfamiliarity of the roadway or underestimating the gap. However, due to the slow speeds of the circulating traffic within the roundabout, few conflicts were observed. Expected Crash Types: Sideswipe Expected Frequency: Occasional Expected Severity: Low Risk Rating: B
Evaluating the Performance and Safety Effectiveness of Roundabouts
7-4
Safety Issue 3: Speeding at roundabouts During the site visits it appeared that at the multi-lane roundabout vehicles would often take the “fastest path”, weaving between the circulating lanes and traveling faster than the designed speed of the roundabout. Additional concerns with vehicles traveling too fast while entering the roundabout had been voiced by Savolainen et al.17 in Improving Driver’s Ability to Safely and Effectively Use Roundabouts: Educating the Public to Negotiate Roundabouts. Expected Crash Types: Sideswipe Expected Frequency: Occasional Expected Severity: Moderate Risk Rating: C Safety Issue 4: Vehicles yielding within the circulating roadway One observation from the site visits was vehicles within the circulating roadway yielding to approach vehicles. This is most likely due to driver’s unfamiliarity with roundabouts and may become rarer as drivers become more familiar with roundabout operations. These actions increase the risk of rear-end collisions. Expected Crash Types: Rear-end Expected Frequency: Rare Expected Severity: Low Risk Rating: A
17
Savolainen, P., Gates, T., Datta, T., Kawa, J., Flannery, A., Retting, R., “Improving Driver’s Ability to Safely and Effectively Use Roundabouts: Educating the Public to Negotiate Roundabouts.” 2011
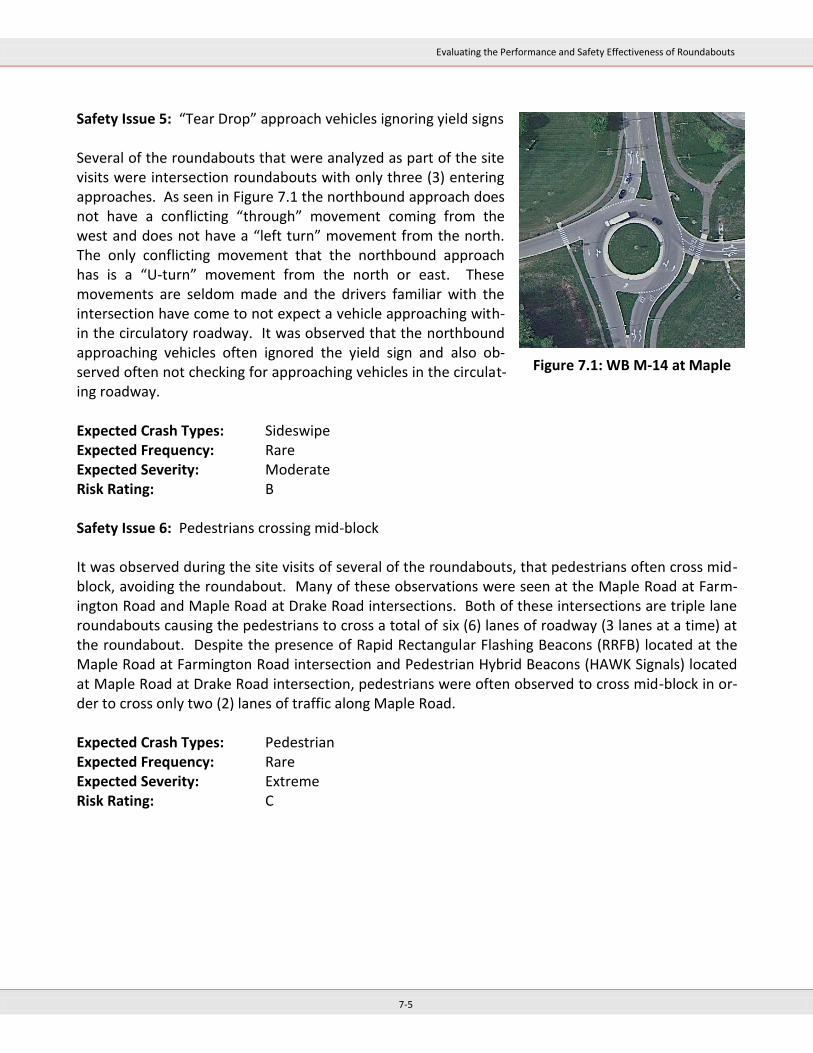
Evaluating the Performance and Safety Effectiveness of Roundabouts
7-5
Safety Issue 5: “Tear Drop” approach vehicles ignoring yield signs Several of the roundabouts that were analyzed as part of the site visits were intersection roundabouts with only three (3) entering approaches. As seen in Figure 7.1 the northbound approach does not have a conflicting “through” movement coming from the west and does not have a “left turn” movement from the north. The only conflicting movement that the northbound approach has is a “U-turn” movement from the north or east. These movements are seldom made and the drivers familiar with the intersection have come to not expect a vehicle approaching with-in the circulatory roadway. It was observed that the northbound approaching vehicles often ignored the yield sign and also ob-served often not checking for approaching vehicles in the circulat-ing roadway. Expected Crash Types: Sideswipe Expected Frequency: Rare Expected Severity: Moderate Risk Rating: B Safety Issue 6: Pedestrians crossing mid-block It was observed during the site visits of several of the roundabouts, that pedestrians often cross mid-block, avoiding the roundabout. Many of these observations were seen at the Maple Road at Farm-ington Road and Maple Road at Drake Road intersections. Both of these intersections are triple lane roundabouts causing the pedestrians to cross a total of six (6) lanes of roadway (3 lanes at a time) at the roundabout. Despite the presence of Rapid Rectangular Flashing Beacons (RRFB) located at the Maple Road at Farmington Road intersection and Pedestrian Hybrid Beacons (HAWK Signals) located at Maple Road at Drake Road intersection, pedestrians were often observed to cross mid-block in or-der to cross only two (2) lanes of traffic along Maple Road. Expected Crash Types: Pedestrian Expected Frequency: Rare Expected Severity: Extreme Risk Rating: C
Figure 7.1: WB M-14 at Maple
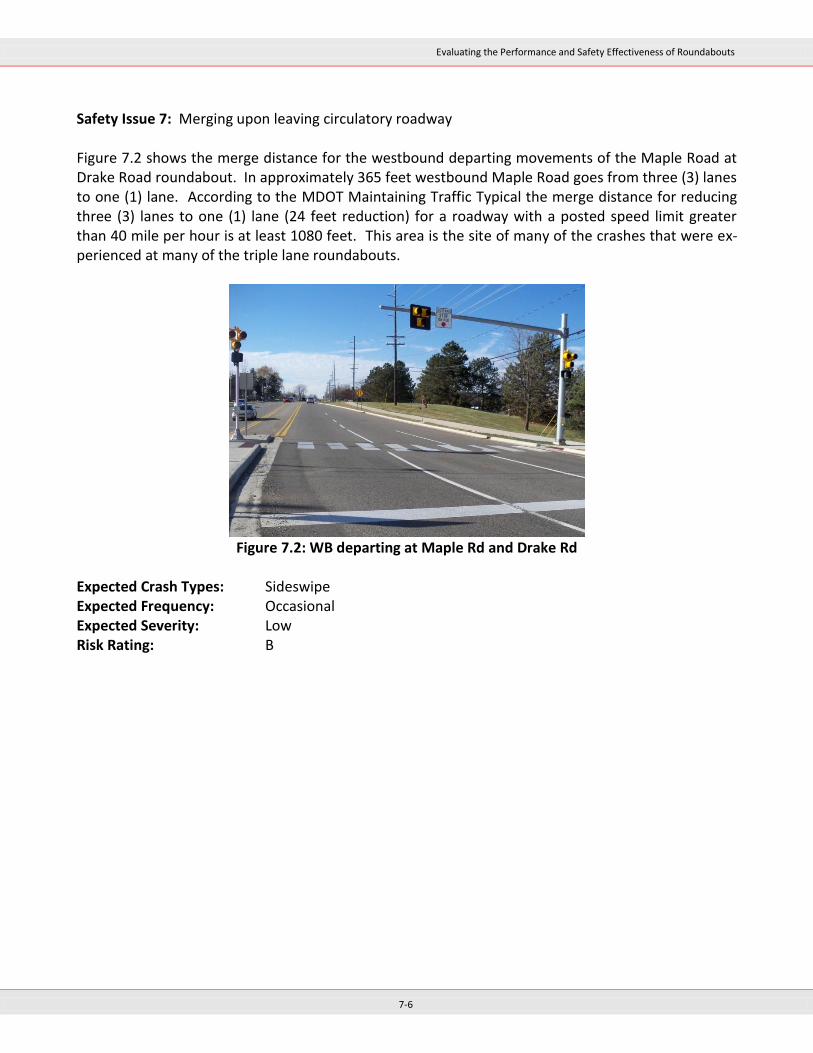
Evaluating the Performance and Safety Effectiveness of Roundabouts
7-6
Safety Issue 7: Merging upon leaving circulatory roadway Figure 7.2 shows the merge distance for the westbound departing movements of the Maple Road at Drake Road roundabout. In approximately 365 feet westbound Maple Road goes from three (3) lanes to one (1) lane. According to the MDOT Maintaining Traffic Typical the merge distance for reducing three (3) lanes to one (1) lane (24 feet reduction) for a roadway with a posted speed limit greater than 40 mile per hour is at least 1080 feet. This area is the site of many of the crashes that were ex-perienced at many of the triple lane roundabouts.
Figure 7.2: WB departing at Maple Rd and Drake Rd
Expected Crash Types: Sideswipe Expected Frequency: Occasional Expected Severity: Low Risk Rating: B
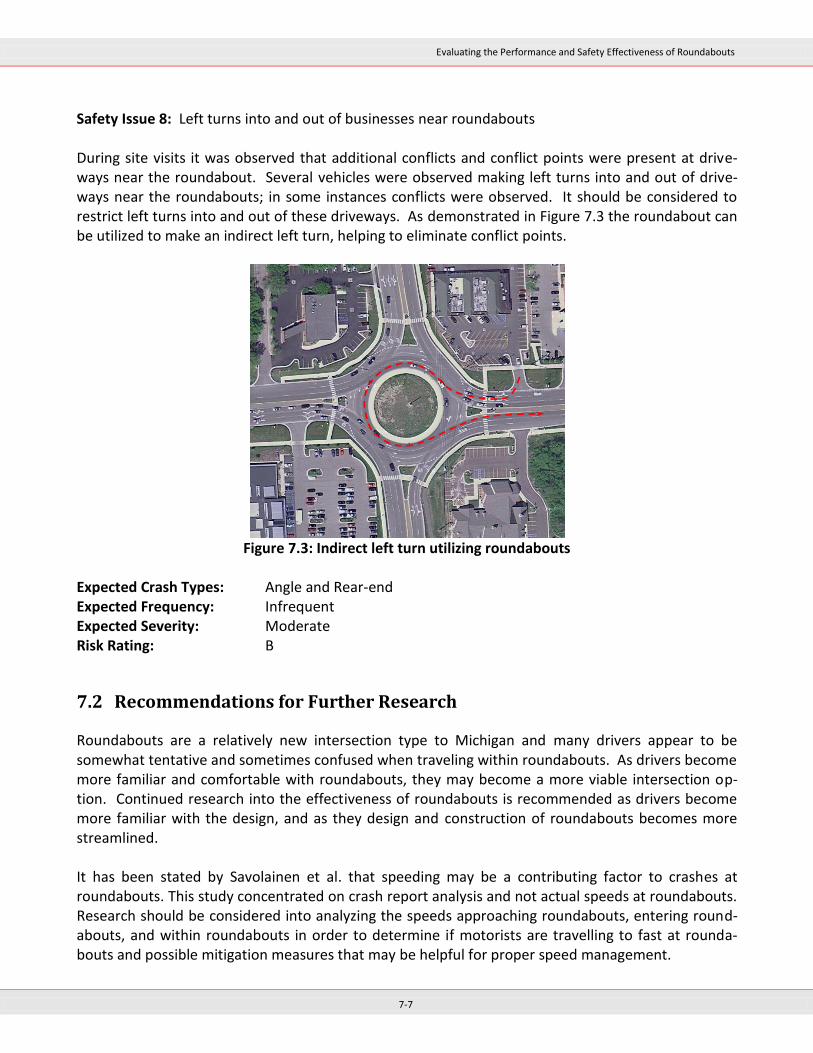
Evaluating the Performance and Safety Effectiveness of Roundabouts
7-7
Safety Issue 8: Left turns into and out of businesses near roundabouts During site visits it was observed that additional conflicts and conflict points were present at drive-ways near the roundabout. Several vehicles were observed making left turns into and out of drive-ways near the roundabouts; in some instances conflicts were observed. It should be considered to restrict left turns into and out of these driveways. As demonstrated in Figure 7.3 the roundabout can be utilized to make an indirect left turn, helping to eliminate conflict points.
Figure 7.3: Indirect left turn utilizing roundabouts
Expected Crash Types: Angle and Rear-end Expected Frequency: Infrequent Expected Severity: Moderate Risk Rating: B
7.2 Recommendations for Further Research
Roundabouts are a relatively new intersection type to Michigan and many drivers appear to be somewhat tentative and sometimes confused when traveling within roundabouts. As drivers become more familiar and comfortable with roundabouts, they may become a more viable intersection op-tion. Continued research into the effectiveness of roundabouts is recommended as drivers become more familiar with the design, and as they design and construction of roundabouts becomes more streamlined. It has been stated by Savolainen et al. that speeding may be a contributing factor to crashes at roundabouts. This study concentrated on crash report analysis and not actual speeds at roundabouts. Research should be considered into analyzing the speeds approaching roundabouts, entering round-abouts, and within roundabouts in order to determine if motorists are travelling to fast at rounda-bouts and possible mitigation measures that may be helpful for proper speed management.

Evaluating the Performance and Safety Effectiveness of Roundabouts
7-8
It was observed in the site visits that non-motorized road users often avoided roundabouts. At sev-eral of the roundabouts, non-motorized road users chose to cross the street mid-block rather than cross at the crosswalks provided at the roundabouts. Research should be considered to analyze the non-motorized behaviors at roundabouts and possible mitigation measures that may be required.
7.3 Recommendations for Implementation
As part of the MDOT Roundabout Study, the MDOT Roundabout Guide (November, 2007) was also reviewed to determine potential updates or changes based on best practices. In addition to the best practices mentioned above which should be incorporated, the following revisions should be consid-ered for inclusion in the next version of the MDOT Roundabout Guide:
Sections 2/3/4: ARCADY software and the Highway Capacity Manual models could also be ac-ceptable.
Page 32: Eliminate combined lane use/destination signs. Remove language and figures for combined lane use/destination signs. Include coordination with MDOT Signing Unit.
Section 4: Consider including conduit for future pedestrian signals (PHB) at multi-lane rounda-bouts, should they be needed in the future.
Markings/Signing: New MMUTCD by January 2012 – once approved, should be referenced
Appendix B: Update various costs for B/C calculations
P. 6: Per additional research regarding HCM and RODEL delay methodology, eliminate table 1 and all text references to adjustment factors for geometric delay. Carry through other parts of the guide as applicable. Replace with text requiring direct comparison of RODEL delay with other software results for stop control/signal.
Crash prediction: Add the new Michigan-specific safety performance functions from the MDOT Roundabout Study.
Consider restricting left turns into and out of driveways near roundabouts. This would reduce the number of conflict points and allow vehicles to utilize the roundabout to make an indirect left turn.
Table 7.2 presents a summary of recommended revisions to the MDOT Roundabout Guide.

Evaluating the Performance and Safety Effectiveness of Roundabouts
7-9
THIS PAGE WAS INTENTIONALLY LEFT BLANK
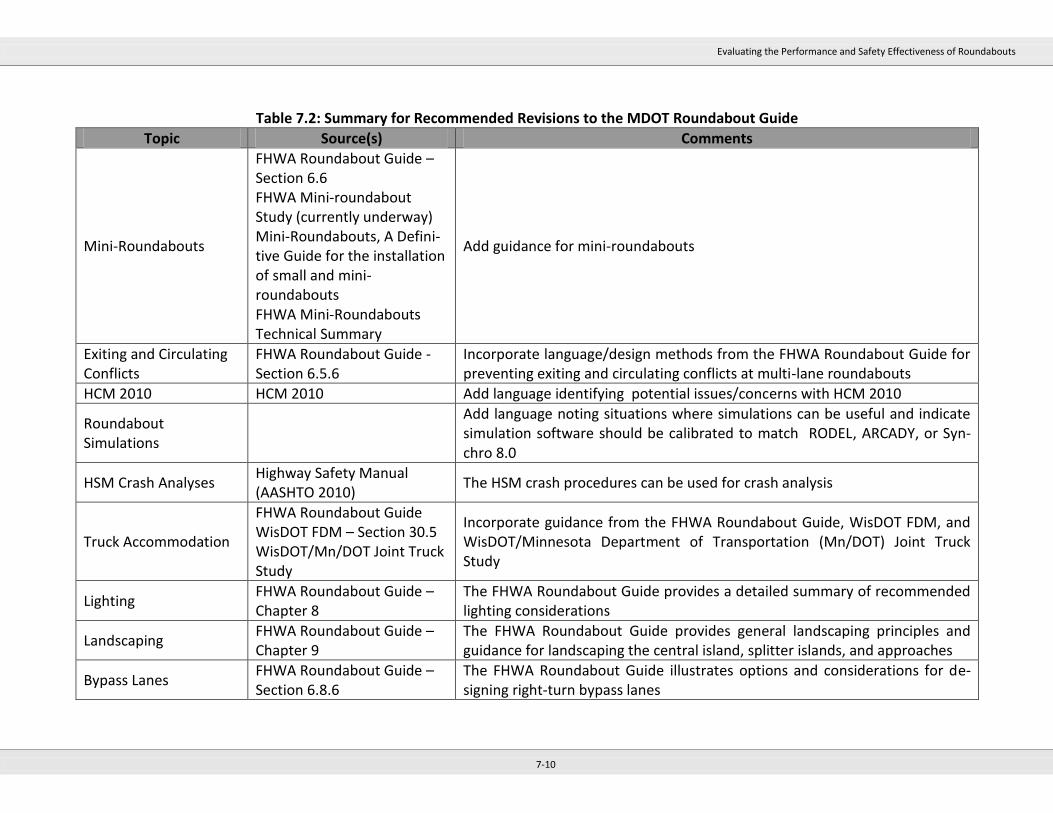
Evaluating the Performance and Safety Effectiveness of Roundabouts
7-10
Table 7.2: Summary for Recommended Revisions to the MDOT Roundabout Guide
Topic Source(s) Comments
Mini-Roundabouts
FHWA Roundabout Guide – Section 6.6 FHWA Mini-roundabout Study (currently underway) Mini-Roundabouts, A Defini-tive Guide for the installation of small and mini-roundabouts FHWA Mini-Roundabouts Technical Summary
Add guidance for mini-roundabouts
Exiting and Circulating Conflicts
FHWA Roundabout Guide - Section 6.5.6
Incorporate language/design methods from the FHWA Roundabout Guide for preventing exiting and circulating conflicts at multi-lane roundabouts
HCM 2010 HCM 2010 Add language identifying potential issues/concerns with HCM 2010
Roundabout Simulations
Add language noting situations where simulations can be useful and indicate simulation software should be calibrated to match RODEL, ARCADY, or Syn-chro 8.0
HSM Crash Analyses Highway Safety Manual (AASHTO 2010)
The HSM crash procedures can be used for crash analysis
Truck Accommodation
FHWA Roundabout Guide WisDOT FDM – Section 30.5 WisDOT/Mn/DOT Joint Truck Study
Incorporate guidance from the FHWA Roundabout Guide, WisDOT FDM, and WisDOT/Minnesota Department of Transportation (Mn/DOT) Joint Truck Study
Lighting FHWA Roundabout Guide – Chapter 8
The FHWA Roundabout Guide provides a detailed summary of recommended lighting considerations
Landscaping FHWA Roundabout Guide – Chapter 9
The FHWA Roundabout Guide provides general landscaping principles and guidance for landscaping the central island, splitter islands, and approaches
Bypass Lanes FHWA Roundabout Guide – Section 6.8.6
The FHWA Roundabout Guide illustrates options and considerations for de-signing right-turn bypass lanes
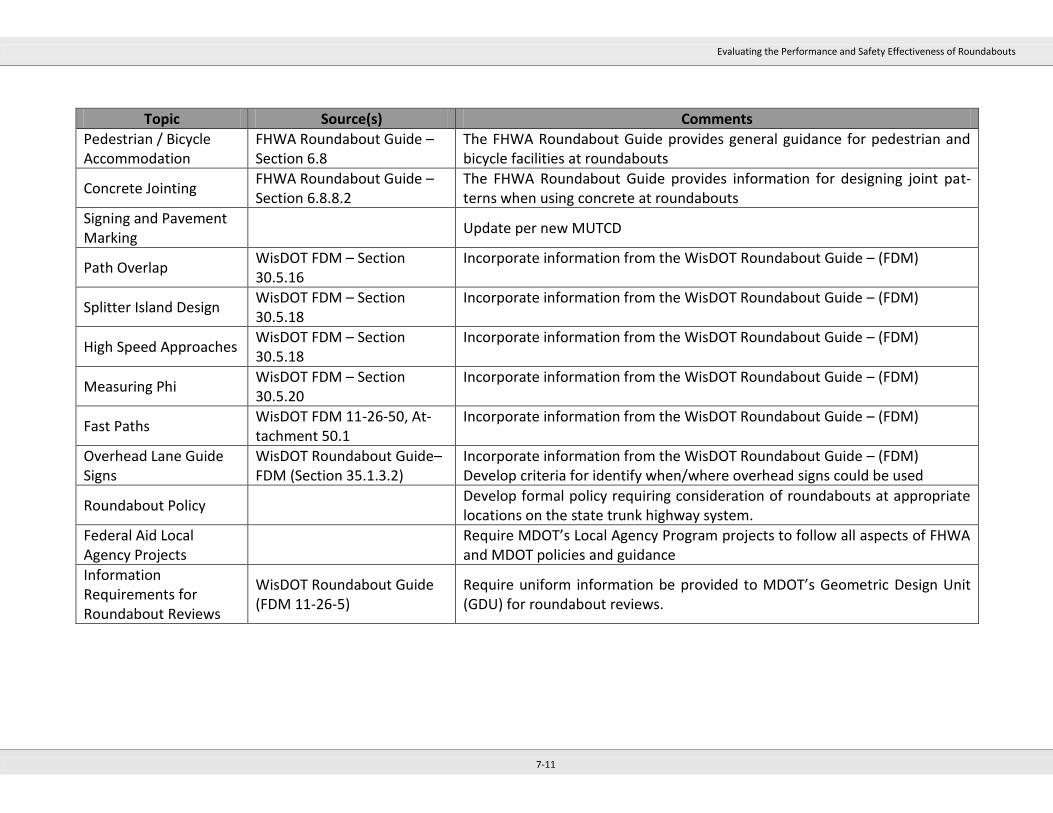
Evaluating the Performance and Safety Effectiveness of Roundabouts
7-11
Topic Source(s) Comments
Pedestrian / Bicycle Accommodation
FHWA Roundabout Guide – Section 6.8
The FHWA Roundabout Guide provides general guidance for pedestrian and bicycle facilities at roundabouts
Concrete Jointing FHWA Roundabout Guide – Section 6.8.8.2
The FHWA Roundabout Guide provides information for designing joint pat-terns when using concrete at roundabouts
Signing and Pavement Marking
Update per new MUTCD
Path Overlap WisDOT FDM – Section 30.5.16
Incorporate information from the WisDOT Roundabout Guide – (FDM)
Splitter Island Design WisDOT FDM – Section 30.5.18
Incorporate information from the WisDOT Roundabout Guide – (FDM)
High Speed Approaches WisDOT FDM – Section 30.5.18
Incorporate information from the WisDOT Roundabout Guide – (FDM)
Measuring Phi WisDOT FDM – Section 30.5.20
Incorporate information from the WisDOT Roundabout Guide – (FDM)
Fast Paths WisDOT FDM 11-26-50, At-tachment 50.1
Incorporate information from the WisDOT Roundabout Guide – (FDM)
Overhead Lane Guide Signs
WisDOT Roundabout Guide–FDM (Section 35.1.3.2)
Incorporate information from the WisDOT Roundabout Guide – (FDM) Develop criteria for identify when/where overhead signs could be used
Roundabout Policy Develop formal policy requiring consideration of roundabouts at appropriate locations on the state trunk highway system.
Federal Aid Local Agency Projects
Require MDOT’s Local Agency Program projects to follow all aspects of FHWA and MDOT policies and guidance
Information Requirements for Roundabout Reviews
WisDOT Roundabout Guide (FDM 11-26-5)
Require uniform information be provided to MDOT’s Geometric Design Unit (GDU) for roundabout reviews.
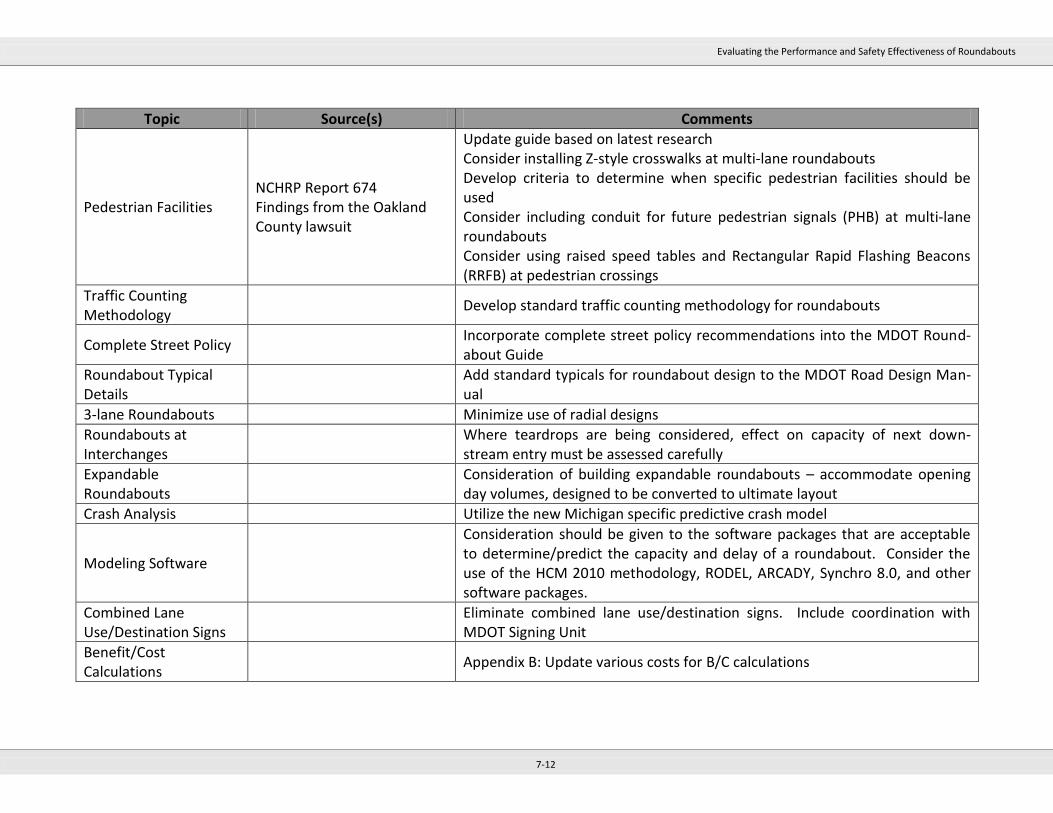
Evaluating the Performance and Safety Effectiveness of Roundabouts
7-12
Topic Source(s) Comments
Pedestrian Facilities NCHRP Report 674 Findings from the Oakland County lawsuit
Update guide based on latest research Consider installing Z-style crosswalks at multi-lane roundabouts Develop criteria to determine when specific pedestrian facilities should be used Consider including conduit for future pedestrian signals (PHB) at multi-lane roundabouts Consider using raised speed tables and Rectangular Rapid Flashing Beacons (RRFB) at pedestrian crossings
Traffic Counting Methodology
Develop standard traffic counting methodology for roundabouts
Complete Street Policy Incorporate complete street policy recommendations into the MDOT Round-about Guide
Roundabout Typical Details
Add standard typicals for roundabout design to the MDOT Road Design Man-ual
3-lane Roundabouts Minimize use of radial designs
Roundabouts at Interchanges
Where teardrops are being considered, effect on capacity of next down-stream entry must be assessed carefully
Expandable Roundabouts
Consideration of building expandable roundabouts – accommodate opening day volumes, designed to be converted to ultimate layout
Crash Analysis Utilize the new Michigan specific predictive crash model
Modeling Software
Consideration should be given to the software packages that are acceptable to determine/predict the capacity and delay of a roundabout. Consider the use of the HCM 2010 methodology, RODEL, ARCADY, Synchro 8.0, and other software packages.
Combined Lane Use/Destination Signs
Eliminate combined lane use/destination signs. Include coordination with MDOT Signing Unit
Benefit/Cost Calculations
Appendix B: Update various costs for B/C calculations
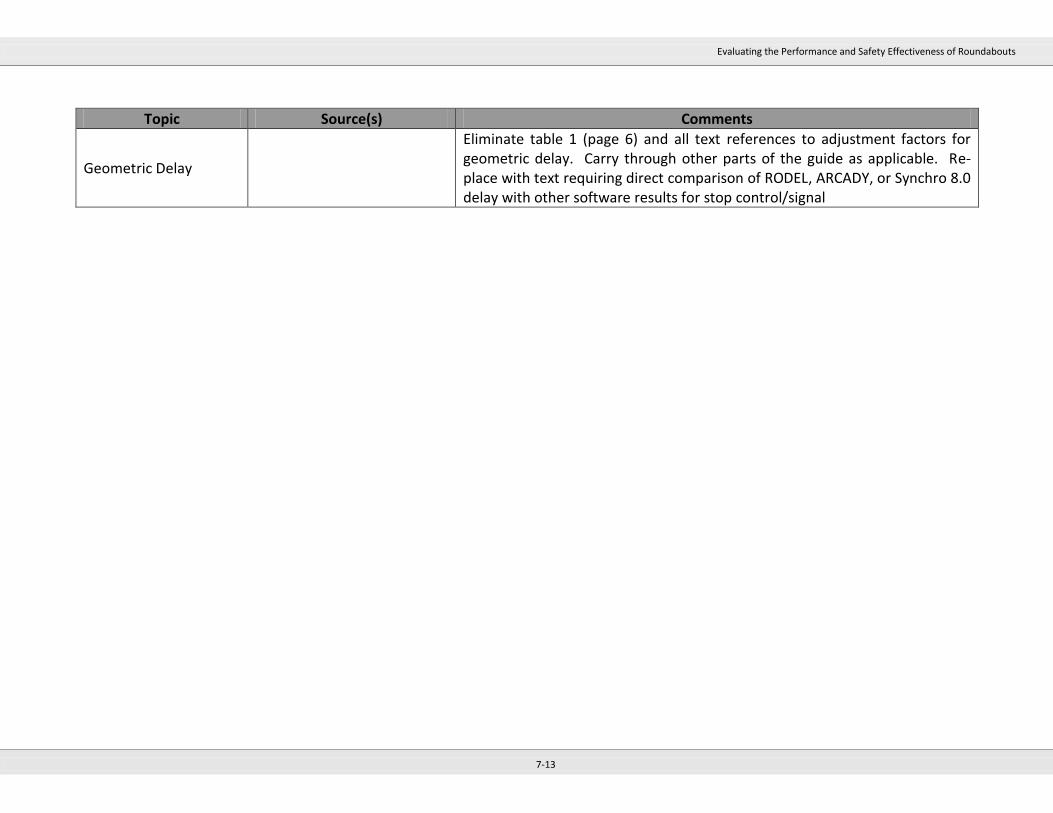
Evaluating the Performance and Safety Effectiveness of Roundabouts
7-13
Topic Source(s) Comments
Geometric Delay
Eliminate table 1 (page 6) and all text references to adjustment factors for geometric delay. Carry through other parts of the guide as applicable. Re-place with text requiring direct comparison of RODEL, ARCADY, or Synchro 8.0 delay with other software results for stop control/signal
Evaluating the Performance and Safety Effectiveness of Roundabouts
8-1
8.0 List of References
AASHTO SafetyAnalyst Software. http://www.safetyanalyst.org Persaud, B. N., R. A. Retting, P. E. Gardner, and D. Lord. Safety Effect of Roundabout Conversions in the United States: Empirical Bayes Observational Before-After Study. In Transportation Research Record 1751, TRB, National Research Council, Washington, D.C., 2002. Rodegerdts, L., M. Blogg, E. Wemple, E. Myers, M. Kyte, M. Dixon, G. List, A. Flannery, R. Troutbeck, W. Brilon, N. Wu, B. Persaud, C. Lyon, D. Harkey, and D. Carter. NCHRP Report 572 Roundabouts in the United States. TRB, National Research Council, Washington, D.C., 2007. Rodegerdts, L., J. Bansen, C. Tiesler, J. Knudsen, E. Myers, M. Johnson, M. Moule, B. Persaud, C. Lyon, S. Hallmark, H. Isebrands, R. B. Crown, B. Guichet, and A. O’Brien. NCHRP Report 672 Roundabout: An Informational Guide. TRB, National Research Council, Washington, D.C., 2010. Maycock, G. and Hall R. D. Crashes at Four-Arm Roundabouts. TRRL Laboratory Report LR 1120. Transport and Road Research Laboratory, Crowthorne, England, 1984. Crown, B. “An Introduction to Some Basic Principles of U.K. Roundabouts Design.” Presented at the ITE District 6 Conference on Roundabouts, Loveland, Colorado, October 1998. Leaf, W. A. and D. F. Preusser. Literature Review on Vehicle Travel Speeds and Pedestrian Injuries. Fi-nal Report DOT HS 809 021. National Highway Traffic Safety Administration, Department of Transpor-tation, Washington, D.C., October 1999. Schroeder, B., R. Hughes, N. Rouphail, C. Cunningham, K. Salamati, R. Long, D. Guth, R.W. Emerson, D. Kim, J. Barlow, B.L. Bentzen, L. Rodegerdts, and E. Myers. NCHRP Report 674 Crossing Solutions at Roundabouts and Channelized Turn Lanes for Pedestrians with Vision Disabilities. TRB, National Re-search Council, Washington, D.C., 2011. Daniels, S., Brijs, T., Nuyts, E., Wets, G. “Injury crashes with bicyclists at roundabouts: influence of some location characteristics and the design of cycle facilities.” Journal of Safety Research. Vol. 40, Issue 2, pp. 141-148. (2009) Manual on Uniform Traffic Control Devices for Streets and Highways. FHWA, Washington, D.C., 2009. Roundabout Guide. Wisconsin Department of Transportation. 2011. Isebrands, H., S. Hallmark, E. Fitzsimmons, and J. Stroda. Toolbox to Evaluate the Impacts of Rounda-bouts on a Corridor or Roadway Network. Center for Transportation Research and Education, Ames, IA, July 2008.
Evaluating the Performance and Safety Effectiveness of Roundabouts
8-2
Mandavilli, S., E. R. Russell, and M. J. Rys. Impact of Modern Roundabouts on Vehicular Emissions. Proceedings of the 2003 Mid-Continent Transportation Research Symposium, Ames, IA, August 2003. Varhelyi, Andras. The Effects of Small Roundabouts on Emissions and Fuel Consumption: A Case Study. Transportation Research Part D. Vol. 7. 2002, pp. 65-71. Department of Blindness and Low Vision Studies – Western Michigan University, Institute for Trans-portation Research and Education – North Carolina State University, Accessible Design for the Blind. Kittelson & Associates. Road Commission for Oakland County PHB and RRFB Study. 2011 Council, F., E. Zaloshnja, T. Miller, and B. Persaud (2005). Crash Cost Estimates by Maximum Police-Reported Injury Severity within Selected Crash Geometries. Federal Highway Administration Report FHWA-HRT-05-051, McLean, VA. Savolainen, P., Gates, T., Datta, T., Kawa, J., Flannery, A., Retting, R., “Improving Driver’s Ability to Safely and Effectively Use Roundabouts: Educating the Public to Negotiate Roundabouts.” 2011 Sawyers, C. “Mini-Roundabouts, A Definitive Guide for the installation of small and mini-roundabouts”. 2008 Mini-Roundabouts Technical Summary. FHWA, Washington D.C., 2010.