evaluating the planning and implementation of major transit capital projects in the portland region
TRANSCRIPT

Evaluating the Planning and Implementation of Major Transit
Capital Projects in the Portland Region
December 5, 2014PSU Transportation Seminar
Joe Recker, TriMet Capital Projects

Overview
• The New Starts/Small Starts program • Before and After studies• Findings from TriMet’s studies• Findings from around the nation
New Starts/Small Starts
• FTA’s primary grant program for major transit capital investments
• New lines or extensions• Rail, BRT, or ferries• Evaluation process and milestones
– Full Funding Grant Agreement (FFGA)
• $1.9 billion annually

A Before and After Study…
• Required component of a New Starts project• analyzes a project’s impact• evaluates the consistency of the predicted
performance, and • identifies sources of differences

Report Topic Areas
• Project Scope• Capital Costs• Service Levels
• Operating & Maintenance Costs
• Ridership

Background
• New Starts program = discretionary $$• Pickrell report (1990) on early transit projects
(70s & 80s)• FTA increases oversight
– Project Management Oversight Contractors (PMOC)
– Cost-effectiveness calculations– Risk assessments– Before and after studies

FTA Requirements
• Before and After Study requirement (2001)• Documentation of capital costs (2005)
– Standard Cost Category (SCC) format– Compare projects across the nation– Compare same project over time
• Annual reports to Congress (SAFETEA-LU2005)• Preservation of ridership forecasts (2006)
– Software compatibility over time

0
2
4
6
8
06' 07' 08' 09' 10' 11' 12' 13' 14'*
Completed FTA Before & After Studies
* Estimated
Yello
w L
ine
Gree
n Li
ne
WES

Report Contents
• Analyze – As-built/current conditions for each topic area
• Evaluate – Transit service before vs. after– Consistency of predictions (at NS milestones) vs.
as-built/after
• Identify – Findings and recommendations

Project Scope
• What was built?• What did we
plan to build?• Why are there
differences?

Capital Costs
• What did it cost?• What did we think it would cost?• Why are there differences?

Service Levels
• What is the service we are providing?• What did we plan to provide?• Why are there differences?

Operating and Maintenance (O&M) Costs
• What does it cost to operate?• What did we think it would cost?• Why are there differences?
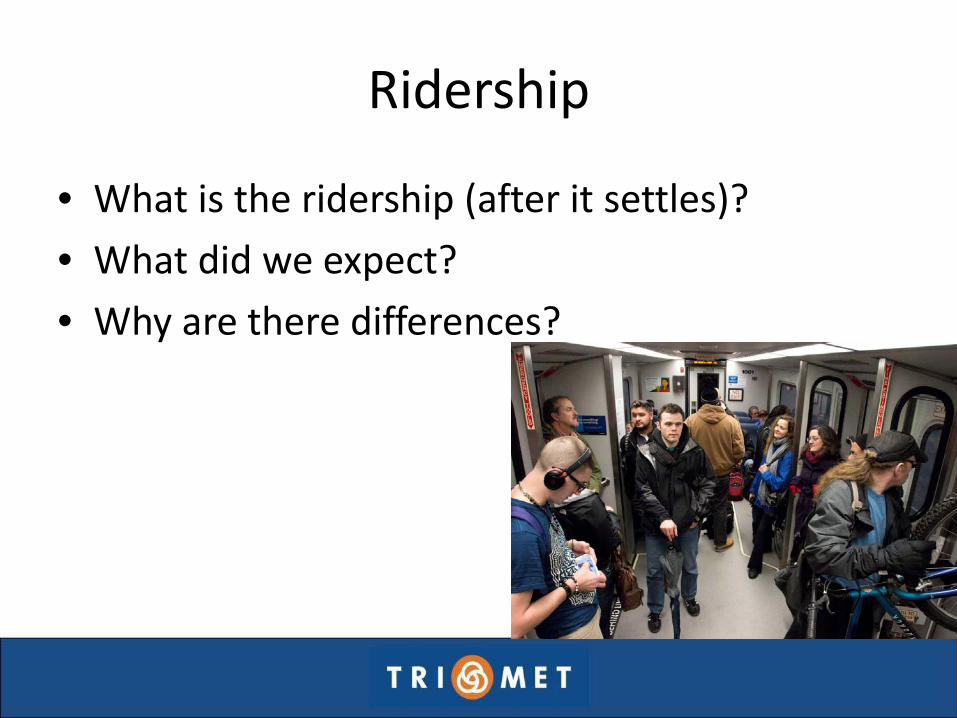
Ridership
• What is the ridership (after it settles)?• What did we expect?• Why are there differences?
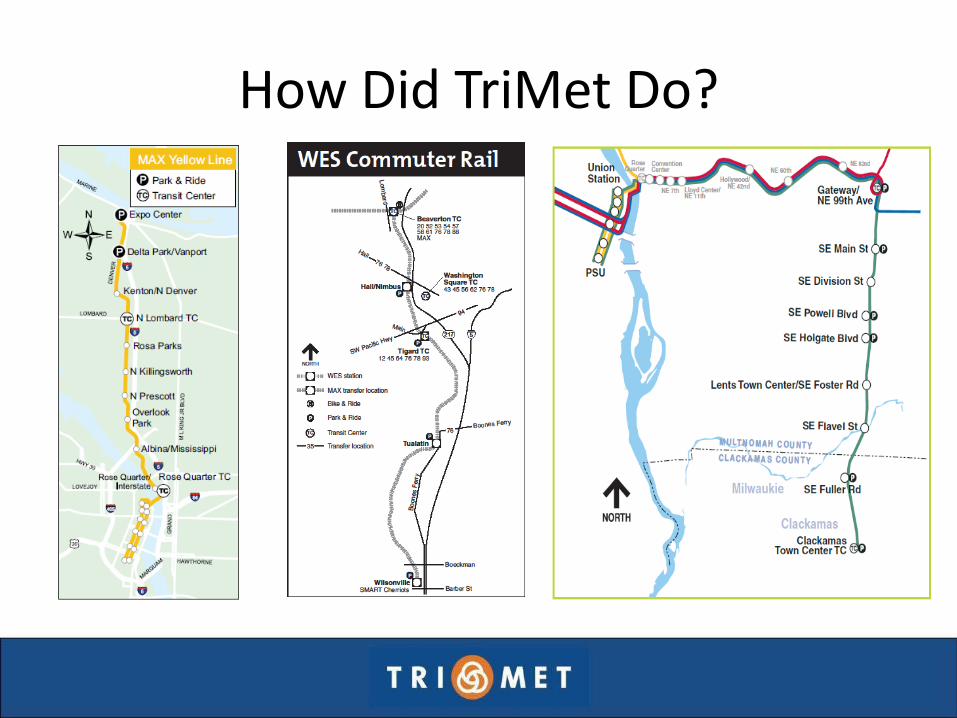
How Did TriMet Do?

Interstate MAX• 5.8 mile light rail extension on urban arterial• Replaces local bus service (line 5) • 10 stations • 2 park-and-ride lots• $350 million ($2004)• 15,200 average daily
riders today
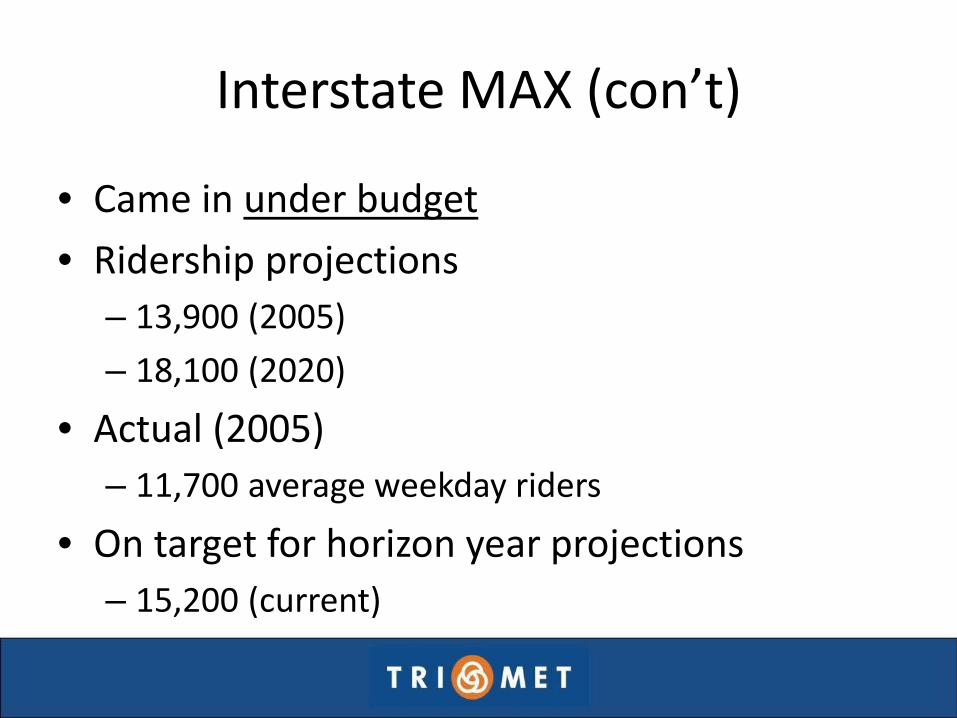
Interstate MAX (con’t)
• Came in under budget• Ridership projections
– 13,900 (2005)– 18,100 (2020)
• Actual (2005)– 11,700 average weekday riders
• On target for horizon year projections – 15,200 (current)

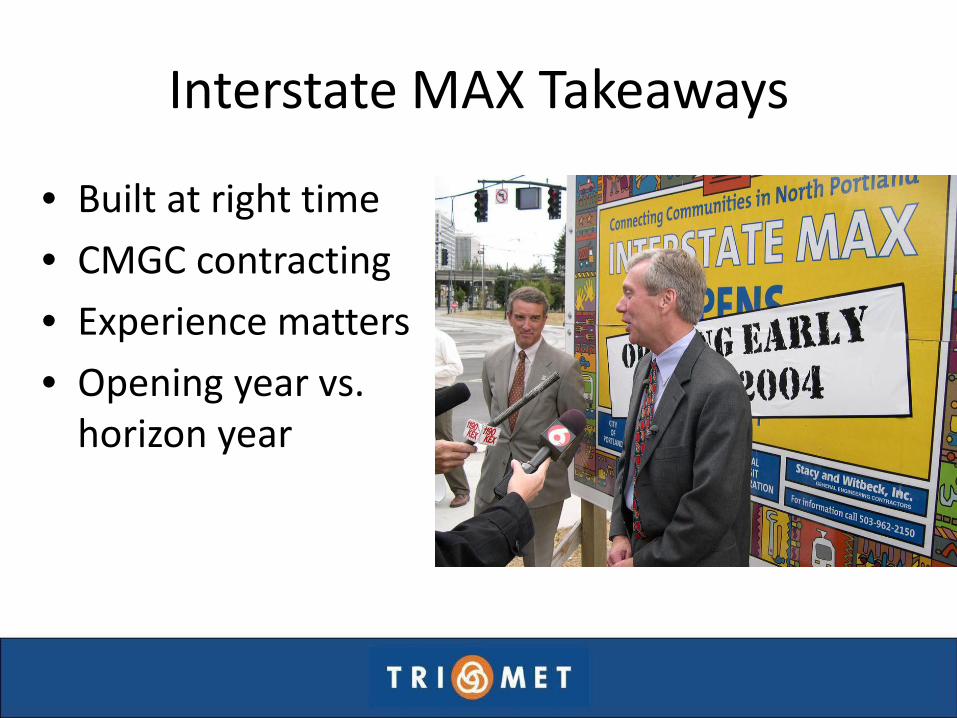
Interstate MAX Takeaways
• Built at right time• CMGC contracting• Experience matters• Opening year vs.
horizon year

WES Commuter Rail• 14.7 mile commuter rail• Shared with freight railroad• 5 stations• 4 park-and-rides• Premium transit service• $162 million• 2,000 average daily
riders

WES Commuter Rail (con’t)
• Cost estimate– (2001) $84.8 million/planned opening 2004– (2001) $103 million using actual inflation rates– Assumptions incorrect
• Project scope• Freight railroad negotiations• Federal $$ request changed past a threshold of
“exempt”• Construction inflation

WES Commuter Rail (con’t)
• Ridership– Range of 1,600 – 2,400 riders (opening year)– Range of 3,000 – 4,650 riders (2020)
• 2009 – 1,200 average daily riders• 2011 – 1,600 average daily riders• 2014 – 2,000 average daily riders• Key ridership factors
– Employment and economy – Park-and-rides/transfers– Travel patterns


WES Takeaways
• Bad timing– FTA oversight growing = delays– Construction inflation = $$– High unemployment at opening = low ridership
• Freight railroad scope changes = $$

I-205 MAX Green Line
• 8.3 mile light rail extension• 15new stations
– I-205 (8)– Portland Mall (7 pairs)
• 6 park-and-rides (I-205 only)
• $575.3 million• 20,400 average daily riders

Green Line (con’t)
• Cost estimates– (2004) $494.8 million (or $595 million w/ actual
inflation)– (2006) $575.7 million
• Predicted Ridership– 25,500 (2009)– 46,250 (2025)
• Service still well below planned levels

Green Line Takeaways
• Project scope changes minimal• Extensive local experience kept costs down
despite rising inflation• Travel forecasting
– Park-and-ride behavior– Walk access– Land use
• Service assumptions incorrect

Employment Forecasts
Forecasted Growth (00'-09')
Actual Growth (00'-10')
Difference (in # of jobs)
Downtown/Lloyd 15% -8% -39,040Banfield 7% -10% -6,595I-205 22% 1% -11,587Region 17% -3% -185,951
Other Projects

FrontRunner, UTA
• 44 mile commuter rail, 9 stations• $614 million (34% higher than PE
estimate)• 5,300 weekday trips
– Predicted 8,400 (PE), 5,650 (FD) and 5,900 (FFGA)
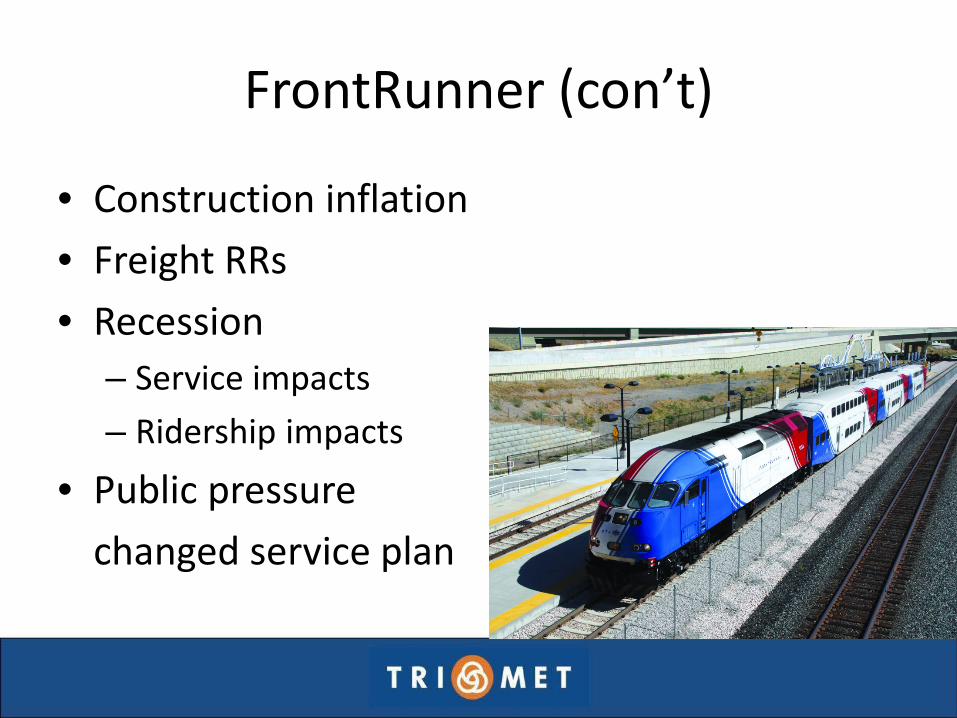
FrontRunner (con’t)
• Construction inflation• Freight RRs• Recession
– Service impacts– Ridership impacts
• Public pressure changed service plan

Valley Metro Rail – Phoenix, AZ
• 19.7 mile light rail on urban arterials• 28 stations• $1.405 billion
– $1.076b (PE) to $1.412b (FFGA)
• 40,700 daily riders (current)– 25,800 – Early estimate for 2020

Valley Metro Rail (con’t)
• Unanticipated growth of universities• Unanticipated growth of carless, low-income
households• Local requirements
changed• Travel time improved• Underestimated
O&M Costs

Euclid Corridor, Cleveland OH
• 7.1 miles BRT, 31 stations• 4.4 miles exclusive ROW• $197.2 million
– 10-28% lower than early estimates
• 14,300 riders (2011)– 21,100 (early on)– 13,500 (at FFGA)

Euclid Corridor (con’t)• Scope reductions• 21% travel time savings• $1 million net O&M costs per year• Recession & drastic service cuts
– Euclid corridor ridership up 31%– Systemwide ridership down 22%
Recap of Lessons Learned

Project Scope: Lessons Learned• Local requirements • Political pressure• Freight railroads

Capital Costs: Lessons Learned
• Construction inflation• Schedule• Scope changes• Freight RRs• Local experience

Service Levels: Lessons Learned
• Replacing express & local service• Economic cycles• Transit priority• Travel times

O&M Costs: Lessons Learned
• New transit mode• Public demands for restoration of bus service• Service cuts• Freight RRs

Ridership: Lessons Learned
• Land use forecasts• Service changes• Travel time• Fare policy


• Data preservation ongoing– Under budget and on schedule
• Bus service planning in progress• “Before” transit rider surveys – spring 2015• “After” surveys scheduled spring 2017.
THANK YOU
Joe ReckerTriMet Capital Projects
Thank you, Questions?