evaluating the use of abba-baba statistics to locate ... · pdf filefor example, smith and...
TRANSCRIPT

Manuscript type: Article
Recommended MBE section: Methods
Evaluating the use of ABBA-BABA statistics to locate introgressed loci
Simon H. Martin‡1, John W. Davey1, Chris D. Jiggins1
1Department of Zoology, University of Cambridge, Downing Street, Cambridge, CB2 3EJ, UK
‡ Corresponding Author: [email protected]
.CC-BY 4.0 International licensenot peer-reviewed) is the author/funder. It is made available under aThe copyright holder for this preprint (which was. http://dx.doi.org/10.1101/001347doi: bioRxiv preprint first posted online Dec. 11, 2013;
ABSTRACT
Several methods have been proposed to test for introgression across genomes. One method tests for a
genome-wide excess of shared derived alleles between taxa using Patterson’s D statistic, but does not
establish which loci show such an excess or whether the excess is due to introgression or ancestral
population structure. Several recent studies have extended the use of D by applying the statistic to small
genomic regions, rather than genome-wide. Here, we use simulations and whole genome data from
Heliconius butterflies to investigate the behavior of D in small genomic regions. We find that D is unreliable
in this situation as it gives inflated values when effective population size is low, causing D outliers to cluster
in genomic regions of reduced diversity. As an alternative, we propose a related statistic f fd, a modified
version of a statistic originally developed to estimate the genome-wide fraction of admixture. f fd is not subject
to the same biases as D, and is better at identifying introgressed loci. Finally, we show that both D and f fd
outliers tend to cluster in regions of low absolute divergence (dXY), which can confound a recently proposed
test for differentiating introgression from shared ancestral variation at individual loci.
.CC-BY 4.0 International licensenot peer-reviewed) is the author/funder. It is made available under aThe copyright holder for this preprint (which was. http://dx.doi.org/10.1101/001347doi: bioRxiv preprint first posted online Dec. 11, 2013;
INTRODUCTION
Hybridization and gene flow between taxa play a major role in evolution, acting as a force against
divergence, and as a potential source of adaptive novelty (Abbott et al. 2013). Although identifying gene
flow between species has been a long-standing problem in population genetics, the issue has received
considerable recent attention with the analysis of shared ancestry between humans and Neanderthals (for
example, Yang et al. 2012; Wall et al. 2013). With genomic data sets becoming available in a wide variety of
other taxonomic groups, there is a need for reliable, computationally tractable methods that identify, quantify
and date gene flow between species in large data sets.
A sensitive and widely used approach to test for gene flow is to fit coalescent models using
maximum-likelihood or Bayesian methods (Pinho and Hey 2010). However, simulation and model fitting are
computationally intensive tasks, and are not easily applied on a genomic scale. A simpler and more
computationally efficient approach that is gaining in popularity is to test for an excess of shared derived
variants using a four-taxon test (Kulathinal et al. 2009; Green et al. 2010; Durand et al. 2011). The test
considers ancestral ('A') and derived ('B') alleles, and is based on the prediction that two particular SNP
patterns, termed 'ABBA' and 'BABA' (see Methods), should be equally frequent under a scenario of
incomplete lineage sorting without gene flow. An excess of ABBA patterns is indicative of gene flow
between two of the taxa, and can be detected using Patterson's D statistic (Green et al. 2010; Durand et al.
2011; see Methods for details). However, an excess of shared derived variants can arise from factors other
than recent introgression, in particular non-random mating in the ancestral population due to population
structure (Eriksson and Manica 2012). It is therefore important to make use of additional means to
distinguish between these alternative hypotheses, for example, by examining the size of introgressed tracts
(Wall et al. 2013), or the level of absolute divergence in introgressed regions (Smith and Kronforst 2013).
The D statistic was originally designed to be applied on a genome-wide or chromosome-wide scale, with
block-jackknifing used to overcome the problem of non-independence between loci (Green et al. 2010).
However, many researchers are interested in identifying particular genomic regions subject to gene flow,
rather than simply estimating a genome-wide parameter. Theory predicts that the rate of gene flow should
.CC-BY 4.0 International licensenot peer-reviewed) is the author/funder. It is made available under aThe copyright holder for this preprint (which was. http://dx.doi.org/10.1101/001347doi: bioRxiv preprint first posted online Dec. 11, 2013;
vary across the genome, both in the case of secondary contact after isolation (Barton and Gale 1993) as well
as continuous gene flow during speciation (Wu 2001). Indeed, a maximum likelihood test for speciation with
gene flow devised by Yang (2010) is based on detecting this underlying heterogeneity. Moreover, adaptive
introgression might lead to highly localized signals of introgression, limited to the particular loci under
selection.
Many methods for characterizing heterogeneity in patterns of introgression across the genome have been
proposed. Several genomic studies have used FST to characterize heterogeneity in divergence across the
genome, often interpreting the variation in FST as indicative of variation in rates of gene flow (for example,
Hohenlohe et al. 2010). However, it is well established that, as a relative measure of divergence, FST is
dependent on within-population genetic diversity (Charlesworth 1998), and is therefore an unreliable
indicator of how migration rates vary across the genome. In particular, heterogeneity in purifying selection
and recombination rate could confound FST-based studies (Noor et al. 2009, Hahn et al. 2012, Roesti et al.
2012, Cruickshank and Hahn, 2014). Various studies of admixture among human populations, or between
humans and Neanderthals, have used probabilistic methods to assign ancestry to haplotypes, and infer how
this ancestry changes across a chromosome (Sankararaman et al. 2008, Price et al. 2009, Henn et al. 2012,
Lawson et al. 2012, Omberg et al. 2012, Maples et al. 2013, Churchhouse and Marchini 2013, Sankararaman
et al. 2014). Other methods have modeled speciation with the allowance for variable introgression rates
among loci (Garrigan et al. 2012, Roux et al. 2013), allowing the detection of more ancient gene flow.
There have also been recent attempts to characterize heterogeneity in patterns of introgression across the
genome using the D statistic, calculated either in small windows (Smith and Kronforst 2013, Kronforst et al.
2013) or for individual SNPs (Rheindt et al. 2014). The robustness of the D statistic for detecting a
genome-wide excess of shared derived alleles has been thoroughly explored (Green et al. 2010; Durand et al.
2011; Yang et al. 2012; Eaton and Ree 2013; Martin et al. 2013). However, it has not been established
whether D provides a robust and unbiased means to identify individual loci with an excess of shared derived
alleles, or to demonstrate that these loci have been subject to introgression. Any inherent biases of the D
statistic when applied to specific loci have implications for methods that assume its robustness.
.CC-BY 4.0 International licensenot peer-reviewed) is the author/funder. It is made available under aThe copyright holder for this preprint (which was. http://dx.doi.org/10.1101/001347doi: bioRxiv preprint first posted online Dec. 11, 2013;

For example, Smith and Kronforst (2013) made use of the D statistic in a proposed test to distinguish
between the hypotheses of introgression and shared ancestral variation at wing-patterning loci of Heliconius
butterflies. Two wing-patterning loci are known to show an excess of shared derived alleles between
co-mimetic populations of Heliconius melpomene and Heliconius timareta (Heliconius Genome Consortium,
2012). At one of these loci, phylogenetic evidence and patterns of linkage disequilibrium are consistent with
recent gene flow (Pardo-Diaz et al. 2012). Nevertheless, Smith and Kronforst (2013) argue that this shared
variation might represent an ancestral polymorphism that was maintained through the speciation event by
balancing selection. Conceptually, this is not unlike the population structure argument of Eriksson and
Manica (2012), except that here structure is limited to one or a few individual loci.
Smith and Kronforst proposed that the alternative explanations of introgression or ancestral polymorphism
could be distinguished by considering absolute divergence within and outside of the loci of interest. Both
hypotheses predict an excess of shared derived alleles at affected loci, but introgression should lead to
reduced absolute divergence due to more recent coalescence at these loci, whereas the locus-specific
population structure hypothesis predicts no reduction in absolute divergence at these loci compared to other
loci in the genome. Loci with an excess of shared derived alleles, and therefore showing evidence of shared
ancestry, were located by calculating the D statistic in non-overlapping 5 kb windows across genomic
regions of interest, and identifying outliers using an arbitrary cutoff (the 10% of windows with the highest D
values). The mean absolute genetic divergence (dXY) was then compared between the outliers and
non-outliers, and found to be significantly lower in outlier windows, consistent with recent introgression
(Smith and Kronforst 2013). This method makes two assumptions. First, that the D statistic can accurately
identify regions that carry a significant excess of shared variation, and second, that D outliers do not have
inherent biases leading to their co-occurrence with regions of low absolute divergence. These assumptions,
which extend the use of D beyond its original definition, may be made by other researchers for similar
purposes, but they remain to be tested.
Here, we first assess the reliability of the D statistic as a means to quantify introgression at individual loci.
Using simulations of small sequence windows, we compare D to a related statistic that was developed by
Green et al. (2010) specifically for estimating f, the proportion of the genome that has been shared, and we
.CC-BY 4.0 International licensenot peer-reviewed) is the author/funder. It is made available under aThe copyright holder for this preprint (which was. http://dx.doi.org/10.1101/001347doi: bioRxiv preprint first posted online Dec. 11, 2013;

propose improvements to this statistic. We then use whole-genome data from several Heliconius species to
investigate how these statistics perform on empirical data, and specifically how they are influenced by
underlying heterogeneity in diversity across the genome. Lastly, we use a large range of simulated data sets
to test the proposal that recent gene flow can be distinguished from shared ancestral variation based on
absolute divergence in D outlier regions.
.CC-BY 4.0 International licensenot peer-reviewed) is the author/funder. It is made available under aThe copyright holder for this preprint (which was. http://dx.doi.org/10.1101/001347doi: bioRxiv preprint first posted online Dec. 11, 2013;
RESULTS
The D statistic is not an unbiased estimator of gene flow
Patterson's D statistic was developed to detect, but not to quantify introgression. We used the deterministic
derivation of the expected value of D (E[D]) provided by Durand et al. (2011, Equation 5) to test how
sensitive the value of D is to other factors apart from the proportion of introgression. We define the
proportion of introgression (f) as the proportion of haplotypes in the recipient population (P2) that trace their
ancestry through the donor population (P3) at the time of gene flow (Figure 1A). The expected D value
increases with the proportion of introgression (f), but not linearly (Figure 1B) and expected D increases as
population size decreases (Figure 1B,C). The split times between populations also have a small effect, with a
more recent split between P1 and P2 leading to higher expected values of D (Figure 1C). This implies that
empirically calculated values of the D statistic will depend on various parameters other than the amount of
gene flow, irrespective of the number of sites analyzed.
Direct estimators of f outperform D on simulated data
Analysis of simulated data confirmed that the D statistic is not an appropriate measure for quantifying
introgression over small genomic windows, but that direct estimation of the proportion of introgression (f)
provides a more robust alternative. The D statistic (Equation 1, Methods) was compared to the f estimator of
Green at al. (2010) (Equation 4, Methods), which is referred to as f fG below, along with two proposed
modified versions of this statistic (Equations 5 and 6, Methods). The first, f fhom (Equation 5), is similar to f fG in
that it explicitly assumes unidirectional gene flow from P3 to P2, but makes a further assumption that
maximal introgression would lead to complete homogenization of allele frequencies in P2 and P3. This is a
conservative assumption, as an extremely high rate of migration would be necessary to attain a maximal
value of f fhom. The second, f fd (Equation 6), is dynamic in that it allows for bidirectional introgression on a
site-by-site basis, setting the donor population at each site as that which has the higher frequency of the
derived allele. These f estimators are distinct from the F2, F3 and F4 statistics of Reich et al. (2009, 2012) and
Patterson et al. (2012), which all test for correlated allele frequencies associated with introgression (much
like the D statistic). However, Patterson's (2012) F4-ratio is conceptually very similar to the f estimators
discussed here, in that it estimates the proportional contribution of a donor population.
.CC-BY 4.0 International licensenot peer-reviewed) is the author/funder. It is made available under aThe copyright holder for this preprint (which was. http://dx.doi.org/10.1101/001347doi: bioRxiv preprint first posted online Dec. 11, 2013;
To compare the utility of these statistics for quantifying introgression in small genomic windows, we
simulated sequences from four populations: P1, P2 and P3 and outgroup O, with the relationship
(((P1,P2),P3),O), with a single instantaneous gene flow event, either from P3 to P2 or from P2 to P3.
Simulations were performed over a range of different values of f (the probability that any particular
haplotype is shared during the introgression event), and with various window sizes, recombination rates and
times of gene flow.
A subset of the results are shown in Figure 2, and full results are provided in Figure S1. In general, the D
statistic proved sensitive to the occurrence of introgression, with strongly positive values for any non-zero
value of f. However, it was a poor estimator of the amount of introgression, as defined by the simulated value
of f (Figure 2). Moreover, D values showed dramatic variance, particularly at low simulated values of f. Even
in the absence of any gene flow, a considerable proportion of windows had intermediate D values. This
variance decreased with increasing window size and recombination rate (Figure S1).
In simulations of gene flow from P3 to P2, all three f estimators gave fairly accurate estimates of the
simulated f value, provided gene flow was recent (Figures 2, S1A). When gene flow occurred further back in
time, f estimators tended to give underestimates, but were nevertheless well correlated with the simulated f
value (Figure S1A). This is unsurprising, as genetic drift and the accumulation of mutations in these lineages
after the introgression event should dilute the signal of introgression. In simulations of gene flow in the
opposite direction, from P2 to P3, both f fG and f fhom showed considerable stochasticity, particularly when
recombination rates were low and gene flow was recent (Figure S1). The size of the window had little effect
on this behavior (Figure S1), implying that it was not an effect of the number of sites analyzed, but rather the
level of independence among sites. This is also to be expected, as these statistics can give values greater than
1 where derived allele frequencies happen by chance to be higher in P3 than P2 (see Methods). Unlike these
two statistics, f fd behaved predictably at all recombination rates and times of gene flow, giving estimates that
were fairly well correlated with the simulated f, but underestimating its absolute value (Figure 2, Figure S1).
Generally, the variance in f fd was lower than in the other two f estimators (Figure S1A-I). Unlike the D
.CC-BY 4.0 International licensenot peer-reviewed) is the author/funder. It is made available under aThe copyright holder for this preprint (which was. http://dx.doi.org/10.1101/001347doi: bioRxiv preprint first posted online Dec. 11, 2013;
statistic, f fd displayed minimal variance at low simulated values of f (Figure 2). However, all four statistics
showed greater variance and more extreme values when recombination rates were lower (Figure S2), as
expected given that decreased recombination reduces the number of independent sites analyzed.
Although none of the examined measures were able to accurately quantify both forms of introgression in all
cases, f fd has some appealing characteristics as a measure to identify introgressed loci in a genome scan
approach. It has low variance and is not prone to false positives when gene flow is absent and recombination
rare. In all of our simulations, it provided estimates that were proportional to the simulated level of
introgression. Although it tended toward underestimates, genome scans for introgressed loci would primarily
be interested in relative rates of introgression across the genome, rather than absolute rates.
f estimators are robust to variation in nucleotide diversity across the genome
Analysis of published whole-genome data from Heliconius species confirmed that Patterson's D statistic was
prone to extreme values in regions of low diversity, whereas f estimators were not (Figure 3 A-C). We
re-analyzed published whole-genome sequence data from two closely related Heliconius butterfly species,
Heliconius melpomene and Heliconius timareta, and four outgroup species from the related silvaniform
clade. The races H. melpomene amaryllis and H. timareta thelxinoe are sympatric in Peru, and show
genome-wide evidence of gene flow (Martin et al. 2013), with particularly strong signals at two
wing-patterning loci: HmB, which controls red pattern elements, and HmYb, which controls yellow and white
pattern elements (Heliconius Genome Consortium 2012, Pardo-Diaz et al. 2012). To determine whether
heterogeneity in diversity across the genome may influence D and the f estimators, we calculated D, f fG, f fhom,
f fd and nucleotide diversity (π) in non-overlapping 5 kb windows across the genome. Variance in the D
statistic was highest among windows with low nucleotide diversity and decreased rapidly with increasing
diversity (Figure 3A, Figure S4). Windows from the wing-patterning loci were among those with the highest
D values, but there were many additional windows with D values approaching or equal to 1. By contrast, f fd,
calculated for all windows with positive D, was far less sensitive to the level of diversity, with most outlying
windows showing intermediate levels of diversity (Figure 3B). Notable exceptions were windows located
within the wing-patterning regions, which tended to have high f fd values and below average diversity. This is
consistent with the strong selection known to act upon the patterning loci. The lack of extreme f fd values in
.CC-BY 4.0 International licensenot peer-reviewed) is the author/funder. It is made available under aThe copyright holder for this preprint (which was. http://dx.doi.org/10.1101/001347doi: bioRxiv preprint first posted online Dec. 11, 2013;
windows with low diversity suggests that most of the D outliers are spurious, and that f fd provides a better
measure of whether a locus has shared ancestry between species. Finally, we also tested the other two f
estimators described here: f fG and f fhom (Equations 4 and 5, Methods). Both performed similarly to f fd except
that both had higher variance (Figures S3, S4), consistent with the simulations reported above (Figure S1),
and both gave a considerable number of values greater than 1, confirming that f fd was the most conservative
and stable statistic.
Taken together, these findings demonstrate that, when small genomic windows are analyzed, a high D value
alone is not sufficient evidence for introgression. Many of the D outlier loci probably represent statistical
noise, concentrated in regions of low diversity, whereas outliers for the f estimates, and particularly f fd, tend
to be less biased.
This effect could also be observed on the scale of whole chromosomes. The variance in D among 5 kb
windows for each of the Heliconius chromosomes (n=21) was strongly negatively correlated with the
average diversity per chromosome (r(19)=-0.936, p<0.001; Figure 3C). This relationship was most clearly
illustrated by the Z chromosome: it had the lowest diversity by some margin, as expected given its reduced
effective population size, and the highest variance among D values for 5 kb windows, despite the fact that
previous chromosome-wide analyses suggest very limited gene flow affecting this chromosome (Martin et al.
2013). By contrast, the variance in f fd, estimated for all windows with positive D, had a weak positive
correlation with the mean diversity per chromosome (r(19)=0.440, p<0.05). This was driven by the fact that
the Z chromosome had the lowest diversity and also the lowest variance in f fd, as expected given the reduced
gene flow affecting this chromosome. When the Z chromosome was excluded, there was no significant
relationship between the variance in f fd values and average diversity (r(18)=0.092, p>0.05). We also
considered the effect of window size on the variance of D and the estimators of f. As window size increases,
the higher variance of D in regions of lower diversity persists, but becomes less extreme (Figure S4). In
summary, these data show that extreme D values, both positive and negative, occur disproportionately in
genomic regions with lower diversity, whereas f fd values are less biased by underlying heterogeneity in
genetic variation.
.CC-BY 4.0 International licensenot peer-reviewed) is the author/funder. It is made available under aThe copyright holder for this preprint (which was. http://dx.doi.org/10.1101/001347doi: bioRxiv preprint first posted online Dec. 11, 2013;
Inherent biases in the D and f fstatistics confound a test to distinguish between introgression and
shared ancestral variation
The biases associated with the D statistic described above may have important consequences for methods
that use D to identify candidate introgressed regions. For example, Smith and Kronforst (2013) proposed a
method to discriminate between gene flow and shared ancestral variation that relies upon D values calculated
for small genomic regions (see Introduction). Briefly, the Smith and Kronforst test calculated D for all
non-overlapping 5 kb windows. Absolute divergence (dXY) was then compared between the set of windows
that were outliers for the D statistic (defined as the windows with the top 10% of D values) and the
remaining 90% of non-outlier windows. The method predicts that introgression between species at a specific
genomic region should reduce the between-species divergence in this region as compared to the rest of the
genome, while shared ancestry due to ancestral population structure would not lead to lower divergence. We
first confirmed this prediction using simulations, and then assessed whether biases in the D statistic might
affect the power of the method.
To test the prediction that introgression and ancestral population structure leave distinct footprints in terms of
absolute divergence, 10 000 sequence windows for three populations (P1,P2,P3) and an outgroup (O) were
simulated. 9000 windows were defined as 'Background', having the topology (((P1,P2),P3),O), without any
gene flow or population structure. The remaining 1000 windows were defined as 'Alternate' and were subject
to either gene flow or structure (see Methods for details). Ten percent of windows were defined as Alternate
to match Smith and Kronforst’s design, wherein the top 10% of D values are taken as outliers. Three
different Alternate scenarios were considered: gene flow from P2 to P3, gene flow from P3 to P2 and ancestral
structure leading to shared ancestry between P2 and P3. For all scenarios, Alternate windows were defined
with the topology ((P1,(P2,P3)),O). In the gene flow scenarios, the split time between P2 and P3 in the
Alternate topology was set to be more recent than the split between P1 and P2 in the Background topology
(Figure 4A,B). In the ancestral structure scenario, the split time between P1 and P2 in the Alternate topology
was set to be more ancient than the split between P2 and P3 in the Background topology (Figure 4C). This
was designed to model a region of the genome undergoing balancing selection or some other process that
maintains polymorphism at particular loci prior to the speciation event. Gene flow or structure in the
Alternate windows can be considered to be complete (f f=1). For example, under gene flow from P2 to P3, all
.CC-BY 4.0 International licensenot peer-reviewed) is the author/funder. It is made available under aThe copyright holder for this preprint (which was. http://dx.doi.org/10.1101/001347doi: bioRxiv preprint first posted online Dec. 11, 2013;
P3 alleles trace their ancestry through P2 at the time of gene flow. This simplified design, where gene flow or
structure is absent in 90% of the sequences and complete in 10%, allowed for the most straightforward and
predictable test of Smith and Kronforst's method; if the logic of the method does not follow in this extreme
scenario, it is unlikely to do so in more complex situations.
For each of the three evolutionary scenarios, 120 different permutations of split times and times of gene flow
or structure were simulated. The split times and times of gene flow for all models are given in the first three
columns of Tables S1, S2 and S3. To simplify our comparisons between models, we focused specifically on
dXY between P2 and P3, the most relevant parameter when testing for introgression between P2 and P3. We
tested whether P2-P3 dXY was significantly lower in the Alternate windows (those that had experienced gene
flow or structure) compared to the Background windows, using a Wilcoxon rank-sum test, with Bonferroni
correction over all 120 models of the same type, and a significance threshold of 99%. We first performed
simulations with a recombination rate parameter (4Nr) of 0.01, and later repeated all simulations at 4Nr =
0.001. The results of all tests are given in full in Tables S1, S2 and S3. These results are summarized in Table
1 and Figure 5, and a single illustrative example for each model type is given in Figure 4 E-L.
As predicted, in all models simulating gene flow, average dXY between P2 and P3 was significantly lower in
Alternate windows compared to Background windows. In contrast, in all models simulating ancestral
population structure, there was no significant difference in P2-P3 dXY between the background and alternate
windows, again in agreement with predictions. These findings therefore demonstrate that the intuitive
premise of Smith and Kronforst's (2013) method is justified.
We then tested whether introgression could be distinguished from shared ancestral variation where loci with
shared ancestry are not known (as would be the situation with empirical data), but are instead inferred by
selecting the top 10% of D values (outliers), following the Smith and Kronforst method. We also tested this
method using the top 10% of f estimates among windows with positive D (using f fd, f fG and f fhom). Using the D
statistic to identify outliers, mean dXY between P2 and P3 was significantly reduced in outlier windows as
compared to non-outlier windows in all 120 models simulating gene flow from P3 to P2, and all but one of the
models simulating gene flow from P2 to P3. The single non-significant case had the most ancient possible t23
.CC-BY 4.0 International licensenot peer-reviewed) is the author/funder. It is made available under aThe copyright holder for this preprint (which was. http://dx.doi.org/10.1101/001347doi: bioRxiv preprint first posted online Dec. 11, 2013;
and the most recent possible t12, and only 11.9% of D outlier windows were genuine Alternate windows, the
lowest recall of any model. Using any of the three f estimators, mean dXY between P2 and P3 was significantly
reduced in outlier windows in all gene flow models.
However, mean P2-P3 dXY was also significantly reduced in D and f outlier windows in more than half of the
120 models simulating ancestral population structure (Figure 4C, 4G, 5; Tables 1, S3). This demonstrates
that a simple test for reduced divergence in P2-P3 dXY among D or f foutlier windows would, under a range of
ancestral structure scenarios, produce results consistent with introgression. The fact that this bias was similar
whether D or f estimators were used to identify outliers indicates that there is an inherent tendency in all of
these statistics toward regions with below-average divergence between P2 and P3. To confirm this finding, we
analyzed a set of simulations using a null model, with no gene flow or structure in any of the 10 000
windows, over 45 permutations of split times (Table S4). Outlier windows showed significantly reduced dXY
between P2 and P3 in most or all of the null models. Finally, we repeated all of these simulations with a lower
within-window recombination rate parameter (4Nr) of 0.001. This tended to increase the reduction in P2-P3
dXY for outliers in ancestral structure and null models (Figures 4I-L, 5), with at most 3 of the ancestral
structure models showing non-significant drops in P2-P3 dXY for outliers, and most or all null models showing
significantly lower P2-P3 dXY for outliers, regardless of the statistic used (Table 1).
In summary, although shared ancestral variation and introgression can theoretically be distinguished based
on the fact that only the latter should reduce dXY between P2 and P3, an inherent bias in both the D and f
statistics makes a simple test for a statistical difference in dXY between outliers and non-outliers problematic.
Both D and f outliers tended toward windows with lower P2-P3 dXY, regardless of the underlying evolutionary
history, and particularly when recombination rates were low. In the absence of any gene flow, the outliers
must therefore be identifying windows that coalesce more recently in the ancestral population. However,
even when the reduction in P2-P3 dXY was significant for ancestral structure or null models, it was typically
smaller than the reductions in dXY seen in the gene flow models (Figure 5). In the presence of gene flow,
some windows coalesce more recently than the species split, so the magnitude of the reduction in P2-P3 dXY is
greater. This difference could potentially be used to distinguish introgression from shared ancestral variation,
but can not be done with a simple significance test, and will require a more sophisticated model-fitting
.CC-BY 4.0 International licensenot peer-reviewed) is the author/funder. It is made available under aThe copyright holder for this preprint (which was. http://dx.doi.org/10.1101/001347doi: bioRxiv preprint first posted online Dec. 11, 2013;

approach.
.CC-BY 4.0 International licensenot peer-reviewed) is the author/funder. It is made available under aThe copyright holder for this preprint (which was. http://dx.doi.org/10.1101/001347doi: bioRxiv preprint first posted online Dec. 11, 2013;
DISCUSSION
With the advent of population genomics, studies of species divergence have moved from simply
documenting inter-specific gene flow, towards the identification of specific genomic regions that show strong
signals of either introgression or divergence (The Heliconius Genome Consortium, 2012; Garrigan et al.
2012; Staubach et al. 2012; Roux et al. 2013, Bosse et al. 2014, Huerta-Sánchez et al. 2014, Sankararaman et
al. 2014). This is a useful goal for many reasons. It can permit the identification of large-scale trends, such as
chromosomal differences, and the fine-scale localization of putative targets of adaptive introgression for
further characterization. Therefore, simple and easily computable statistics that can be used to identify loci
with a history of introgression have considerable appeal.
Previous studies have explored the behavior of Patterson's D statistic, a test for gene flow based on detecting
an inequality in the numbers of ABBA and BABA patterns, using whole genome analyses across large
numbers of informative sites (Green et al. 2010; Yang et al. 2012; Eaton and Ree 2013; Martin et al. 2013;
Wall et al. 2013). These studies have shown that D is a robust method when applied as intended: to test for
an excess of shared variation on a genome-wide scale. Indeed a major strength of the ABBA-BABA test is
that it combines data from across the genome, accounting for chance fluctuations among loci, and therefore
is able to detect the net effect of gene flow. Moreover, the non-independence among linked sites can be
accounted for by block-jackknifing (Green et al. 2010).
However, it is not clear whether D can be extended beyond its original use to identify specific loci with
introgressed variation. We have documented two main problems with this approach. Firstly, D is not an
unbiased estimator of the amount of introgression that has occurred. In particular it is influenced by effective
population size (Ne), leading to more extreme values when Ne is low. Secondly, when calculated over small
windows, it is highly stochastic, particularly in genomic regions of low diversity and low recombination rate,
such that D outliers will tend to be clustered within these regions. Local reductions in genetic diversity along
a chromosome can come about through neutral processes, such as population bottlenecks, but also through
directional selection. Therefore, these problems may be exacerbated in studies specifically interested in loci
that experience strong selective pressures, as this would increase the likelihood of detecting chance outliers
.CC-BY 4.0 International licensenot peer-reviewed) is the author/funder. It is made available under aThe copyright holder for this preprint (which was. http://dx.doi.org/10.1101/001347doi: bioRxiv preprint first posted online Dec. 11, 2013;
at such loci.
Direct estimation of f, the proportion of introgression, holds more promise as a robust method for detecting
introgressed loci. Green et al. (2010) proposed that f could be estimated by comparing the observed
difference in the number of ABBA and BABA patterns to that which would be expected in the event of
complete introgression. As this expected value is calculated from the observed data, this method controls for
differences in the level of standing variation, making it more suitable for application to small regions. In
Green et al.'s approach, complete introgression from P3 to P2 was taken to mean that P2 would come to
resemble a subpopulation of lineage P3. Here we make the conservative assumption that complete
introgression would lead to homogenization of allele frequencies, such that the frequency of the derived
allele in P2 would be identical to that in P3. Green et al.'s approach assumed unidirectional introgression from
P3 to P2, but can lead to spurious values when introgression occurs in the opposite direction. We have
therefore proposed a new dynamic estimator of f, in which the donor population can differ between sites, and
is always the population with the higher frequency of the derived allele. Although this conservative estimator
leads to slight underestimation of the amount of introgression that has occurred, it provides an estimate that
is roughly proportional to the level of introgression, regardless of the direction. It is therefore a more suitable
measure for identifying introgressed loci. This is supported by our analysis of whole-genome data from
Heliconius butterflies, where many 5 kb windows had maximal D values (D=1), but only a few had high f fd
values, the vast majority of which were located around the wing-patterning loci previously identified as
being shared between these species through adaptive introgression (Heliconius Genome Consortium 2012,
Pardo-Diaz et al. 2012).
The sensitivity of D to heterogeneous genomic diversity is likely to affect studies that have drawn
conclusions from D statistics calculated for particular genome regions. For example, Wall et al. (2013)
identified regions carrying putative long (8-100kb) haplotypes segregating in European humans, and then
found that these regions showed evidence of a Neanderthal origin, as indicated by elevated D statistics.
However, it may be that such haplotypes would be over-represented in low-recombination regions, which
also tend to have reduced diversity in humans and many other species (Cutter and Payseur 2013). In another
recent Heliconius study, FST was calculated for 5kb windows across the genome. Windows showing
.CC-BY 4.0 International licensenot peer-reviewed) is the author/funder. It is made available under aThe copyright holder for this preprint (which was. http://dx.doi.org/10.1101/001347doi: bioRxiv preprint first posted online Dec. 11, 2013;

increased differentiation between H. melpomene and H. pachinus (according to FST) also showed
significantly elevated D statistics in a test for introgression between the same species pair (Kronforst et al.
2013). This illustrates how the sensitivity of both D and FST to within-species diversity can produce
conflicting results. This sensitivity is likely to be particularly problematic in studies using very small
genomic regions. At the extreme, Rheindt et al. (2014) calculated D for single SNPs and predicted that genes
linked to SNPs with outlying D values are more likely to have been introgressed.
In the present study, to investigate whether biases in D when calculated over small regions could influence
subsequent analyses, we investigated a recently proposed method to distinguish between introgression and
shared ancestral variation (Smith and Kronforst 2013). The premise of this test is that introgression should
result in an excess of shared derived alleles and a reduction in absolute divergence (dXY), whereas shared
ancestral variation will exhibit the former but not the latter signature. Our simulations confirmed that the
intuitive predictions of this method are valid, but also showed that this test can be misled by the use of D to
identify outliers. Windows that were outliers for D exhibited below average dXY in simulations with gene
flow, but also in most simulations with ancestral structure, or where both gene flow and ancestral population
structure were absent. All three f estimators also failed to distinguish between introgression and ancestral
structure in many models. This implies that all of these statistics are systematically biased toward regions
that coalesce more recently, regardless of whether gene flow has occurred.
We predict that D would have additional problems in real genomes, where selective constraint leads to a
correlation between within-species diversity and between-species divergence, causing D outliers to be even
more strongly associated with reduced dXY. However, it is notable that the reduction in divergence among D
and f outliers was almost always greater in simulations with introgression than in simulations with ancestral
structure or with no alternate topology, across a large range of split times and dates of gene flow. There may,
therefore, be considerable information about the evolutionary history of DNA sequences present in the joint
distribution of dXY and f fd. On the other hand, in real data, levels of divergence can vary dramatically due to
heterogeneity in selective constraint, mutation rate and recombination rate, which would exaggerate the
problems described here. Even an unbiased statistic, when applied to small genomic windows, would be
confounded by heterogeneity in recombination rate across the genome. In regions of reduced recombination,
.CC-BY 4.0 International licensenot peer-reviewed) is the author/funder. It is made available under aThe copyright holder for this preprint (which was. http://dx.doi.org/10.1101/001347doi: bioRxiv preprint first posted online Dec. 11, 2013;
fewer independent data points are sampled by each window, so extreme estimates become more likely.
Heterogeneity in recombination rate is therefore an essential consideration in any study that aims to scan the
genome for regions of interest.
Conclusions
In an era of increasing availability of genomic data, there is a demand for simple summary statistics that can
reliably identify genomic regions that have been subject to selection, introgression and other evolutionary
processes. It seems unlikely, however, that any single summary statistic will be able to reliably distinguish
these processes from noise introduced by demography, drift and heterogeneity in recombination rate. Here
we have shown that, while Patterson’s D statistic provides a robust signal of shared ancestry across the
genome, it should not be used for naïve scans to ascribe shared ancestry to small genomic regions, due to its
tendency toward extreme values in regions of reduced variation. Estimation of f, the proportion of
introgression, particularly using our proposed statistic f fd, provides a better means of identifying putatively
introgressed regions. Nevertheless, both D and f fd tend to identify regions of reduced inter-species divergence,
even in the absence of gene flow, which may confound tests to distinguish between recent introgression and
shared ancestral variation based on absolute divergence (dXY) in outlier regions. However, the joint
distribution of dXY and f fstatistics may be a useful summary statistic for model-fitting approaches to
distinguish between these evolutionary hypotheses.
.CC-BY 4.0 International licensenot peer-reviewed) is the author/funder. It is made available under aThe copyright holder for this preprint (which was. http://dx.doi.org/10.1101/001347doi: bioRxiv preprint first posted online Dec. 11, 2013;
MATERIAL AND METHODS
Statistics used to detect shared ancestry
In this study, we focused on an approach to identify an excess of shared derived polymorphisms, indicated by
the relative abundance of two SNP patterns termed “ABBAs” and “BABAs” (Green et al. 2010). Given three
populations and an outgroup with the relationship (((P1, P2), P3), O) (Figure 1A), ABBAs are sites at which
the derived allele “B” is shared between the non-sister taxa P2 and P3, while P1 carries the ancestral allele, as
defined by the outgroup. Similarly, BABAs are sites at which the derived allele is shared between P1 and P3,
while P2 carries the ancestral allele. Under a neutral coalescent model, both patterns can only result from
incomplete lineage sorting or recurrent mutation, and should be equally abundant in the genome (Durand et
al. 2011). A significant excess of ABBAs over BABAs is indicative either of gene flow between P2 and P3, or
some form of non-random mating or structure in the population ancestral to P1, P2 and P3. This excess can be
tested for, using Patterson's D statistic,
D (P1 ,P2 ,P3 ,O )=∑C ABBA (i )−CBABA (i )
∑C ABBA (i )+C BABA (i )(1)
where CABBA(i) and CBABA(i) are counts of either 1 or 0, depending on whether or not the specified pattern
(ABBA or BABA) is observed at site i in the genome. Under the null hypothesis of no gene flow and random
mating in the ancestral population, D will approach zero, regardless of differences in effective population
sizes (Durand et al. 2011). Hence, a D significantly greater than zero is indicative of a significant excess of
shared derived alleles between P2 and P3.
If population samples are used, then rather than binary counts of fixed ABBA and BABA sites, the frequency
of the derived allele at each site in each population can be used (Green et al. 2010, Durand et al. 2011),
effectively weighting each segregating site according to its fit to the ABBA or BABA pattern, with
C ABBA (i )=(1− p̂i1) p̂i2 p̂i3 (1− p̂i4 ) (2)
CBABA (i )= p̂i1 (1− p̂i2) p̂i3 (1− p̂i4 ) (3)
where pij is the frequency of the derived allele at site i in population j. These values are then used in equation
1 to calculate D (Durand et al. 2011).
.CC-BY 4.0 International licensenot peer-reviewed) is the author/funder. It is made available under aThe copyright holder for this preprint (which was. http://dx.doi.org/10.1101/001347doi: bioRxiv preprint first posted online Dec. 11, 2013;

Green et al. (2010) also proposed a related method to estimate f, the fraction of the genome shared through
introgression (Green et al. 2010, Durand et al. 2011). This method makes use of the numerator of equation 1,
the difference between sums of ABBAs and BABAs, which is called S. In the example described above, with
((P1,P2),P3),O), the proportion of the genome that has been shared between P2 and P3 subsequent to the split
between P1 and P2 can be estimated by comparing the observed value of S to a value estimated under a
scenario of complete introgression from P3 to P2. P2 would then resemble a lineage of the P3 taxon, and so the
denominator of equation 1 can be estimated by replacing P2 in equations 2 and 3 with a second lineage
sampled from P3, or by splitting the P3 sample into two,
f̂ G=S (P1 ,P2 ,P3 ,O )
S (P1 ,P3a ,P3b ,O )(4)
where P3a and P3b are the two lineages sampled from P3. Splitting P3 arbitrarily in this way may lead to
stochastic errors at individual sites, particularly with small sample sizes. These should be negligible when
whole-genome data are analyzed but could easily lead to erroneous values of f f(including f f>1) when small
genomic windows are analyzed, as in the present study. We therefore used a more conservative version, in
which we assume that complete introgression from P3 to P2 would lead to complete homogenization of allele
frequencies. Hence, in the denominator, P3a and P3b are both substituted by P3:
f̂ hom=S ( P1 ,P2 ,P3 ,O )S ( P1 ,P 3, P3 ,O )
(5)
While this conservative assumption may lead to underestimation of the proportion of sites shared, it also
reduces the rate of stochastic error. Moreover, in the present study, we are less concerned with the absolute
value of f f, and more with the relative values of f fbetween genomic regions.
The f fstatistic assumes unidirectional gene flow from P3 to P2 (i.e. P3 is the donor and P2 is the recipient).
Since the branch leading to P3 is longer than that leading to P2 (Figure 1A), gene flow in the opposite
direction (P2 to P3) is likely to generate fewer ABBAs. Thus, in the presence of gene flow from P2 to P3, or in
both directions, the f fequation should lead to an underestimate. However, when small genomic windows are
.CC-BY 4.0 International licensenot peer-reviewed) is the author/funder. It is made available under aThe copyright holder for this preprint (which was. http://dx.doi.org/10.1101/001347doi: bioRxiv preprint first posted online Dec. 11, 2013;
analyzed, the assumption of unidirectional gene flow could lead to overestimates, because any region in
which derived alleles are present in both P2 and P3, but happen to be at higher frequency in P2, will yield f
estimates that are greater than 1. Thus, we propose a dynamic estimator in which the denominator is
calculated by defining a donor population (PD) for each site independently. For each site, PD is the population
(either P2 or P3) that has the higher frequency of the derived allele, thus maximizing the denominator and
eliminating f estimates greater than 1:
f̂ d=S ( P1 ,P2 ,P3 ,O )S (P1 ,PD ,PD ,O )
(6)
Assessing the ability of D and f estimators to quantify introgression in small sequence windows
To assess how reliably Patterson's D statistic, and other estimators of f are able to quantify the actual rate of
introgression, we simulated sequence datasets with differing rates of introgression using ms (Hudson 2002).
For each dataset, we simulated 100 sequence windows for 8 haplotypes each from four populations with the
relationship (((P1,P2),P3),O). The split times t12 and t23 (as on Figure 1A) were set to 1 × 4N generations and 2
× 4N generations ago, respectively, and the root was set to 3 × 4N generations ago. An instantaneous,
unidirectional admixture event, either from P3 to P2 or from P2 to P3, was simulated at a time tGF with a value
f, which determines the probability that each haplotype is shared. We tested two different values for tGF: 0.1
and 0.5 × 4N generations ago. For each direction of gene flow and each tGF, 11 simulated datasets were
produced, with f values ranging from 0 (no gene flow) to 1 (all haplotypes are shared). Finally, the entire set
of simulations was repeated with three different window sizes: 1, 5 and 10 kb, and with three different
recombination rates: 0.001, 0.01 and 0.1, in units of 4Nr, the population recombination rate. DNA sequences
were generated from the simulated trees using Seq-Gen (Rambaut & Grass 1997), with the HKY substitution
model and a branch scaling factor of 0.01. Simulations were run using the provided script
compare_f_estimators.r, which generates the ms and Seq-Gen commands automatically. An example set of
commands to simulate a single 5kb sequence using the split times mentioned above, with gene flow from P3
to P2 at tGF = 0.1 and f = 0.2, and with a recombination rate parameter of 0.01 would be:
ms 32 1 I 4 8 8 8 8 ej 1 2 1 ej 2 3 1 ej 3 4 1 es 0.1 2 0.8 ej 0.1 5 3 r
50 5000 T | tail n +4 | grep v // > treefile
.CC-BY 4.0 International licensenot peer-reviewed) is the author/funder. It is made available under aThe copyright holder for this preprint (which was. http://dx.doi.org/10.1101/001347doi: bioRxiv preprint first posted online Dec. 11, 2013;
partitions=($(wc l treefile))
seqgen mHKY l 5000 s 0.01 p $partitions <treefile >seqfile
We then compared the mean and standard error for D (Equation 1) and the three f estimators (Equations 4, 5
and 6), calculated for all 100 windows in each dataset.
Analysis of Heliconius whole genome sequence data
To investigate how the D and f fstatistics are affected by underlying diversity in a given window, we
re-analyzed whole genome data from Martin et al. (2013). For ABBA-BABA analyses, populations were
defined as follows: P1 = Heliconius melpomene aglaope (4 diploid samples), P2 = Heliconius melpomene
amaryllis (4), P3 = Heliconius timareta thelxinoe (4), O=Heliconius hecale (1), Heliconius ethilla (1),
Heliconius pardalinus sergestus (1), and Heliconius pardalinus ssp. nov. (1). Patterson's D (Equation 1) and
the three f estimators (Equations 4,5,6) were calculated, along with nucleotide diversity (π) and absolute
divergence (dXY), for non-overlapping 5 kb windows across the genome. Both π and dXY were calculated as
the mean number of differences between each pair of individuals, sampled either from the same population
(π), or from separate populations (dXY). Sites with missing data were excluded in a pairwise manner, and each
pair of individuals contributed equally to the mean. Windows were restricted to single scaffolds and windows
for which fewer than 3000 sites had genotype calls for at least half of the individuals were discarded. To
calculate D and the f estimators only bi-allelic sites were considered. The ancestral state was inferred using
the outgroup taxa, except when the four outgroup taxa were not fixed for the same allele, in which case the
most common allele overall was taken as ancestral. The HmB locus was defined as positions 300 000 to 450
000 on scaffold HE670865 and the HmYb locus as positions 650 000 to 900 000 on scaffold HE667780 of
version 1.1 of the H. m. melpomene genome sequence. We also analyzed windows from each of the 21
chromosomes of the H. m. melpomene genome sequence separately. Scaffolds were assigned to
chromosomes according to the Heliconius Genome Consortium (2012), and incorporating the improved
assignment of Z-linked scaffolds by Martin et al. (2013) (details available in Dryad repositories
http://dx.doi.org/10.5061/dryad.m27qq and http://dx.doi.org/10.5061/dryad.dk712). This analysis was
performed using egglib_sliding_windows.py, and figures were generated using Figures_3_S3_S4.R.
.CC-BY 4.0 International licensenot peer-reviewed) is the author/funder. It is made available under aThe copyright holder for this preprint (which was. http://dx.doi.org/10.1101/001347doi: bioRxiv preprint first posted online Dec. 11, 2013;
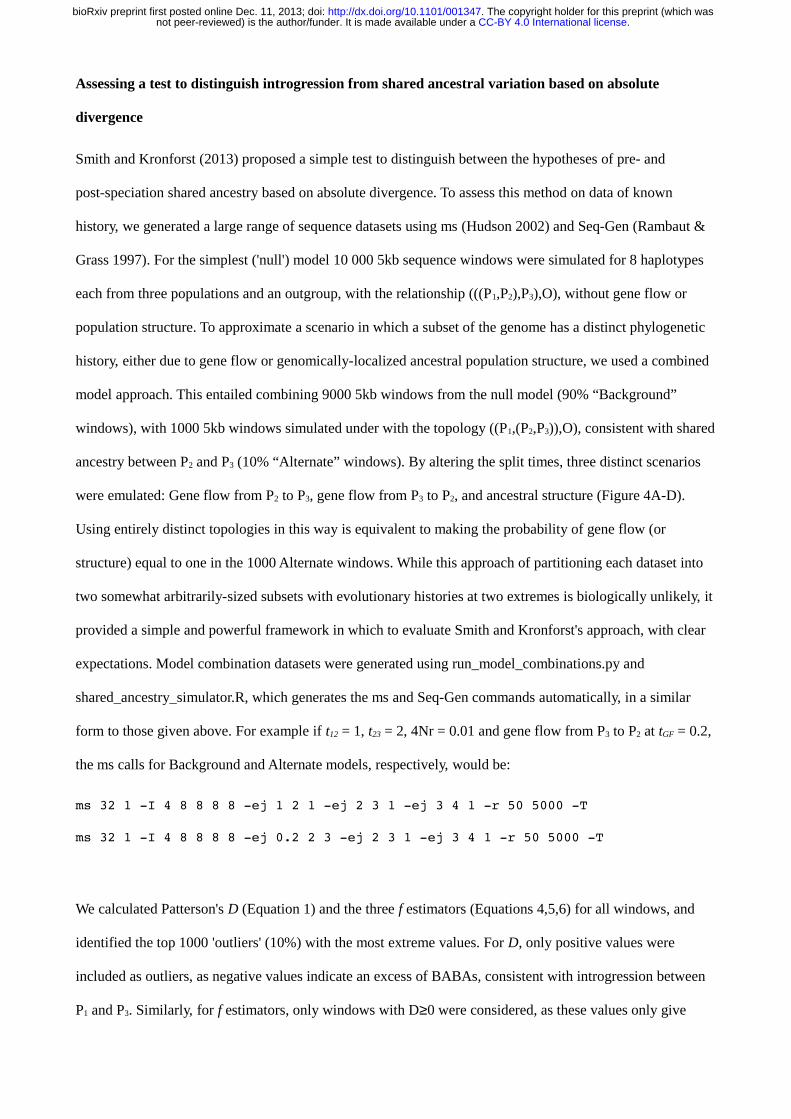
Assessing a test to distinguish introgression from shared ancestral variation based on absolute
divergence
Smith and Kronforst (2013) proposed a simple test to distinguish between the hypotheses of pre- and
post-speciation shared ancestry based on absolute divergence. To assess this method on data of known
history, we generated a large range of sequence datasets using ms (Hudson 2002) and Seq-Gen (Rambaut &
Grass 1997). For the simplest ('null') model 10 000 5kb sequence windows were simulated for 8 haplotypes
each from three populations and an outgroup, with the relationship (((P1,P2),P3),O), without gene flow or
population structure. To approximate a scenario in which a subset of the genome has a distinct phylogenetic
history, either due to gene flow or genomically-localized ancestral population structure, we used a combined
model approach. This entailed combining 9000 5kb windows from the null model (90% “Background”
windows), with 1000 5kb windows simulated under with the topology ((P1,(P2,P3)),O), consistent with shared
ancestry between P2 and P3 (10% “Alternate” windows). By altering the split times, three distinct scenarios
were emulated: Gene flow from P2 to P3, gene flow from P3 to P2, and ancestral structure (Figure 4A-D).
Using entirely distinct topologies in this way is equivalent to making the probability of gene flow (or
structure) equal to one in the 1000 Alternate windows. While this approach of partitioning each dataset into
two somewhat arbitrarily-sized subsets with evolutionary histories at two extremes is biologically unlikely, it
provided a simple and powerful framework in which to evaluate Smith and Kronforst's approach, with clear
expectations. Model combination datasets were generated using run_model_combinations.py and
shared_ancestry_simulator.R, which generates the ms and Seq-Gen commands automatically, in a similar
form to those given above. For example if t12 = 1, t23 = 2, 4Nr = 0.01 and gene flow from P3 to P2 at tGF = 0.2,
the ms calls for Background and Alternate models, respectively, would be:
ms 32 1 I 4 8 8 8 8 ej 1 2 1 ej 2 3 1 ej 3 4 1 r 50 5000 T
ms 32 1 I 4 8 8 8 8 ej 0.2 2 3 ej 2 3 1 ej 3 4 1 r 50 5000 T
We calculated Patterson's D (Equation 1) and the three f estimators (Equations 4,5,6) for all windows, and
identified the top 1000 'outliers' (10%) with the most extreme values. For D, only positive values were
included as outliers, as negative values indicate an excess of BABAs, consistent with introgression between
P1 and P3. Similarly, for f estimators, only windows with D≥0 were considered, as these values only give
.CC-BY 4.0 International licensenot peer-reviewed) is the author/funder. It is made available under aThe copyright holder for this preprint (which was. http://dx.doi.org/10.1101/001347doi: bioRxiv preprint first posted online Dec. 11, 2013;
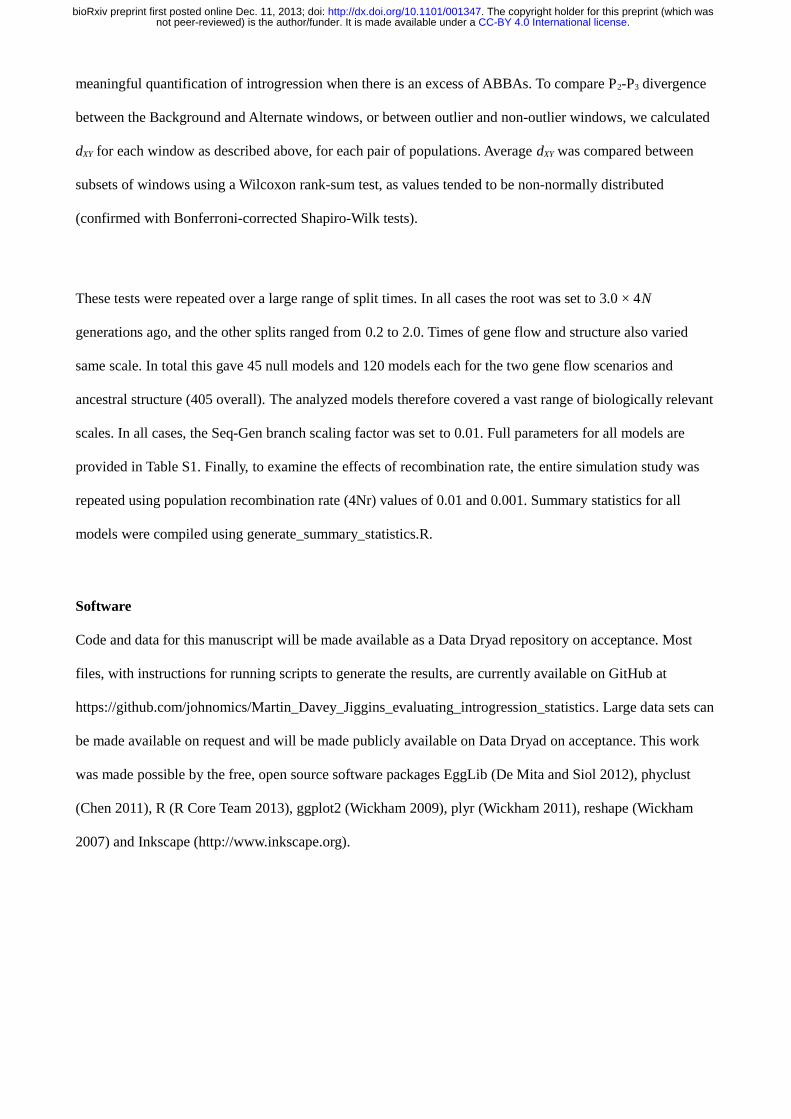
meaningful quantification of introgression when there is an excess of ABBAs. To compare P2-P3 divergence
between the Background and Alternate windows, or between outlier and non-outlier windows, we calculated
dXY for each window as described above, for each pair of populations. Average dXY was compared between
subsets of windows using a Wilcoxon rank-sum test, as values tended to be non-normally distributed
(confirmed with Bonferroni-corrected Shapiro-Wilk tests).
These tests were repeated over a large range of split times. In all cases the root was set to 3.0 × 4N
generations ago, and the other splits ranged from 0.2 to 2.0. Times of gene flow and structure also varied
same scale. In total this gave 45 null models and 120 models each for the two gene flow scenarios and
ancestral structure (405 overall). The analyzed models therefore covered a vast range of biologically relevant
scales. In all cases, the Seq-Gen branch scaling factor was set to 0.01. Full parameters for all models are
provided in Table S1. Finally, to examine the effects of recombination rate, the entire simulation study was
repeated using population recombination rate (4Nr) values of 0.01 and 0.001. Summary statistics for all
models were compiled using generate_summary_statistics.R.
Software
Code and data for this manuscript will be made available as a Data Dryad repository on acceptance. Most
files, with instructions for running scripts to generate the results, are currently available on GitHub at
https://github.com/johnomics/Martin_Davey_Jiggins_evaluating_introgression_statistics. Large data sets can
be made available on request and will be made publicly available on Data Dryad on acceptance. This work
was made possible by the free, open source software packages EggLib (De Mita and Siol 2012), phyclust
(Chen 2011), R (R Core Team 2013), ggplot2 (Wickham 2009), plyr (Wickham 2011), reshape (Wickham
2007) and Inkscape (http://www.inkscape.org).
.CC-BY 4.0 International licensenot peer-reviewed) is the author/funder. It is made available under aThe copyright holder for this preprint (which was. http://dx.doi.org/10.1101/001347doi: bioRxiv preprint first posted online Dec. 11, 2013;

ACKNOWLEDGEMENTS
We are grateful to Milan Malinsky for helpful and detailed discussions about this work. We also thank Jim
Mallet, Marcus Kronforst and two anonymous reviewers for their comments on the manuscript. Richard
Merrill and Richard Wallbank contributed to initial discussions that inspired the work. This work was
supported by the Leverhulme Trust (F/09364/E to C.D.J.) and the Herchel Smith Fund (Postdoctoral
Fellowship to J.W.D.).
.CC-BY 4.0 International licensenot peer-reviewed) is the author/funder. It is made available under aThe copyright holder for this preprint (which was. http://dx.doi.org/10.1101/001347doi: bioRxiv preprint first posted online Dec. 11, 2013;
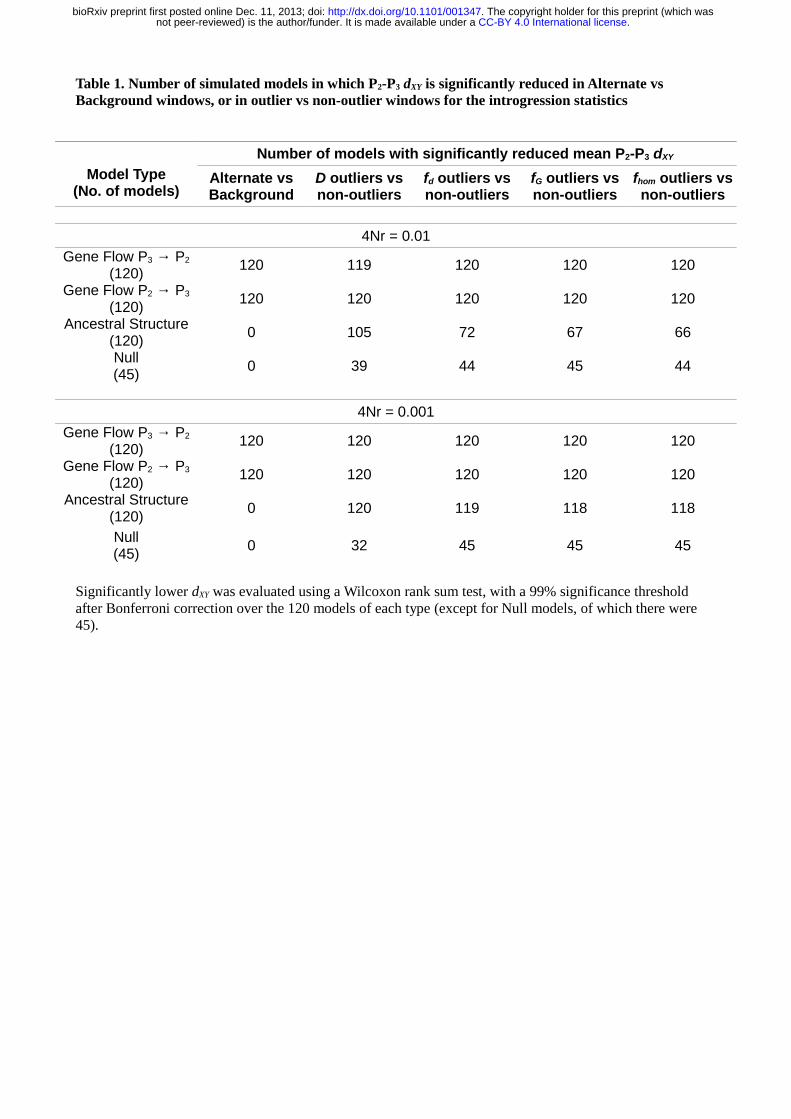
Table 1. Number of simulated models in which P2-P3 dXY is significantly reduced in Alternate vs Background windows, or in outlier vs non-outlier windows for the introgression statistics
Model Type(No. of models)
Number of models with significantly reduced mean P2-P3 dXY
Alternate vsBackground
D outliers vsnon-outliers
fd outliers vsnon-outliers
fG outliers vsnon-outliers
fhom outliers vsnon-outliers
4Nr = 0.01
Gene Flow P3 → P2
(120)120 119 120 120 120
Gene Flow P2 → P3
(120)120 120 120 120 120
Ancestral Structure(120)
0 105 72 67 66
Null(45)
0 39 44 45 44
4Nr = 0.001
Gene Flow P3 → P2
(120)120 120 120 120 120
Gene Flow P2 → P3
(120)120 120 120 120 120
Ancestral Structure(120)
0 120 119 118 118
Null(45)
0 32 45 45 45
Significantly lower dXY was evaluated using a Wilcoxon rank sum test, with a 99% significance threshold after Bonferroni correction over the 120 models of each type (except for Null models, of which there were 45).
.CC-BY 4.0 International licensenot peer-reviewed) is the author/funder. It is made available under aThe copyright holder for this preprint (which was. http://dx.doi.org/10.1101/001347doi: bioRxiv preprint first posted online Dec. 11, 2013;
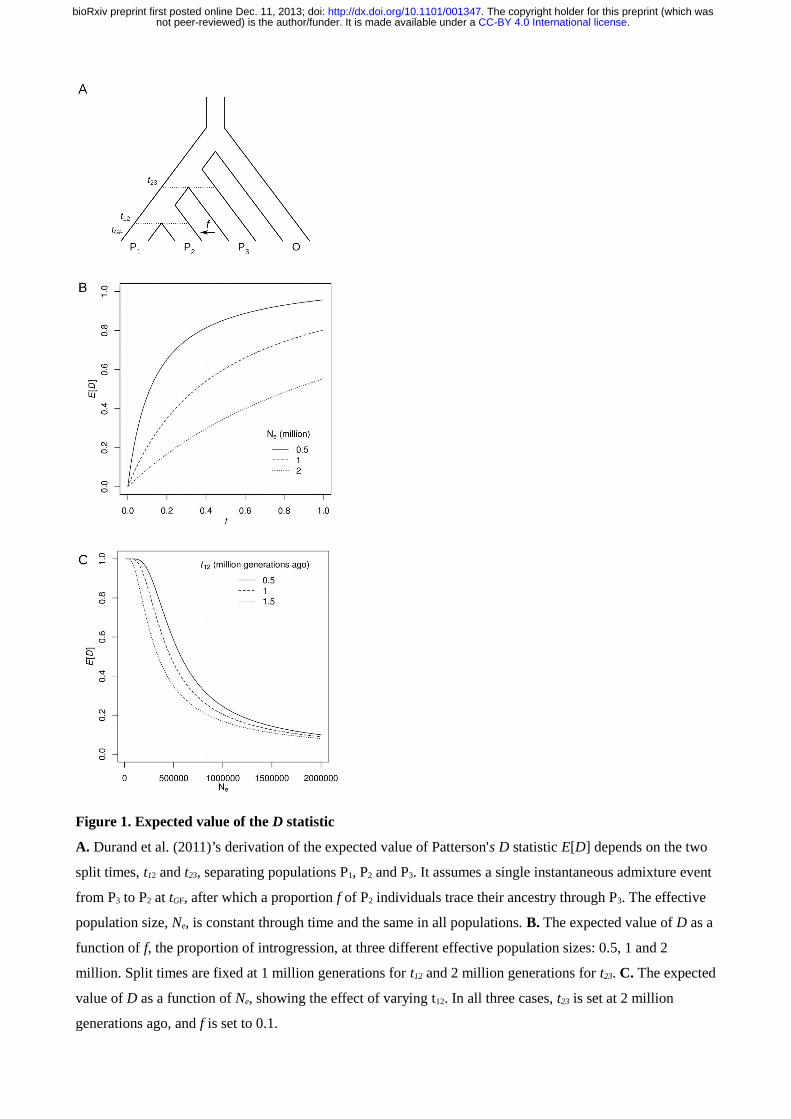
Figure 1. Expected value of the D statistic
A. Durand et al. (2011)’s derivation of the expected value of Patterson's D statistic E[D] depends on the two
split times, t12 and t23, separating populations P1, P2 and P3. It assumes a single instantaneous admixture event
from P3 to P2 at tGF, after which a proportion f of P2 individuals trace their ancestry through P3. The effective
population size, Ne, is constant through time and the same in all populations. B. The expected value of D as a
function of f, the proportion of introgression, at three different effective population sizes: 0.5, 1 and 2
million. Split times are fixed at 1 million generations for t12 and 2 million generations for t23. C. The expected
value of D as a function of Ne, showing the effect of varying t12. In all three cases, t23 is set at 2 million
generations ago, and f is set to 0.1.
.CC-BY 4.0 International licensenot peer-reviewed) is the author/funder. It is made available under aThe copyright holder for this preprint (which was. http://dx.doi.org/10.1101/001347doi: bioRxiv preprint first posted online Dec. 11, 2013;
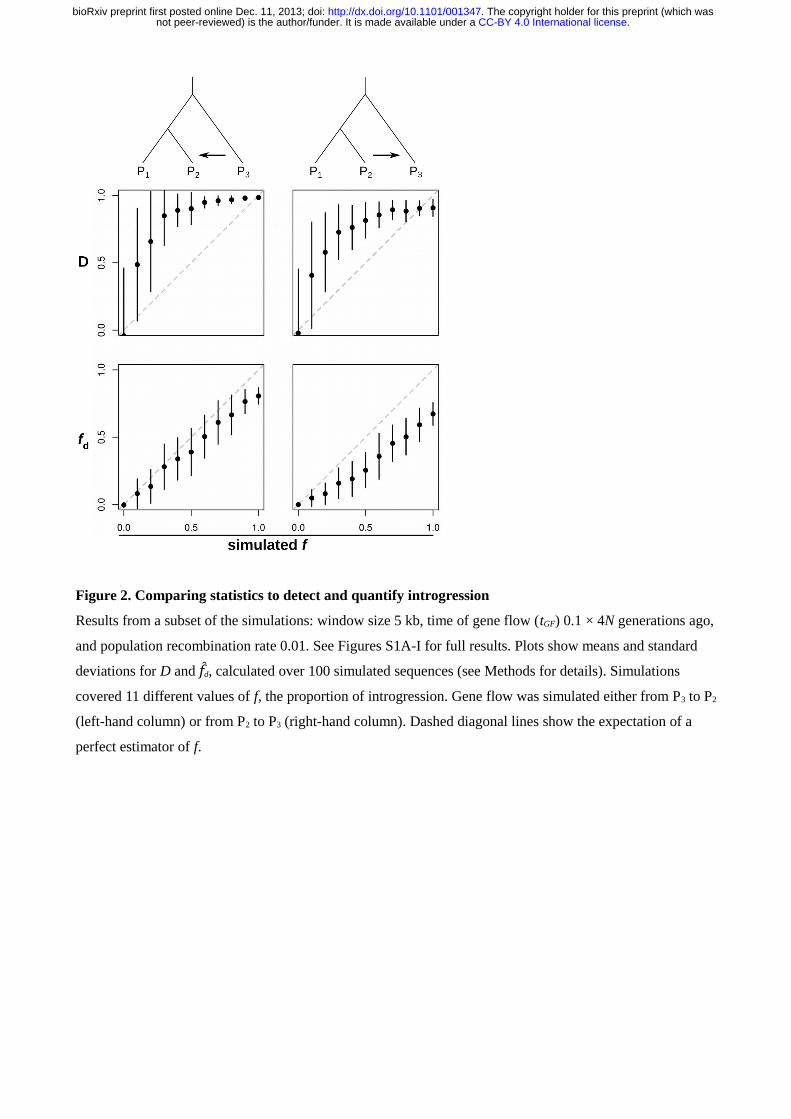
Figure 2. Comparing statistics to detect and quantify introgression
Results from a subset of the simulations: window size 5 kb, time of gene flow (tGF) 0.1 × 4N generations ago,
and population recombination rate 0.01. See Figures S1A-I for full results. Plots show means and standard
deviations for D and f fd, calculated over 100 simulated sequences (see Methods for details). Simulations
covered 11 different values of f, the proportion of introgression. Gene flow was simulated either from P3 to P2
(left-hand column) or from P2 to P3 (right-hand column). Dashed diagonal lines show the expectation of a
perfect estimator of f.
.CC-BY 4.0 International licensenot peer-reviewed) is the author/funder. It is made available under aThe copyright holder for this preprint (which was. http://dx.doi.org/10.1101/001347doi: bioRxiv preprint first posted online Dec. 11, 2013;
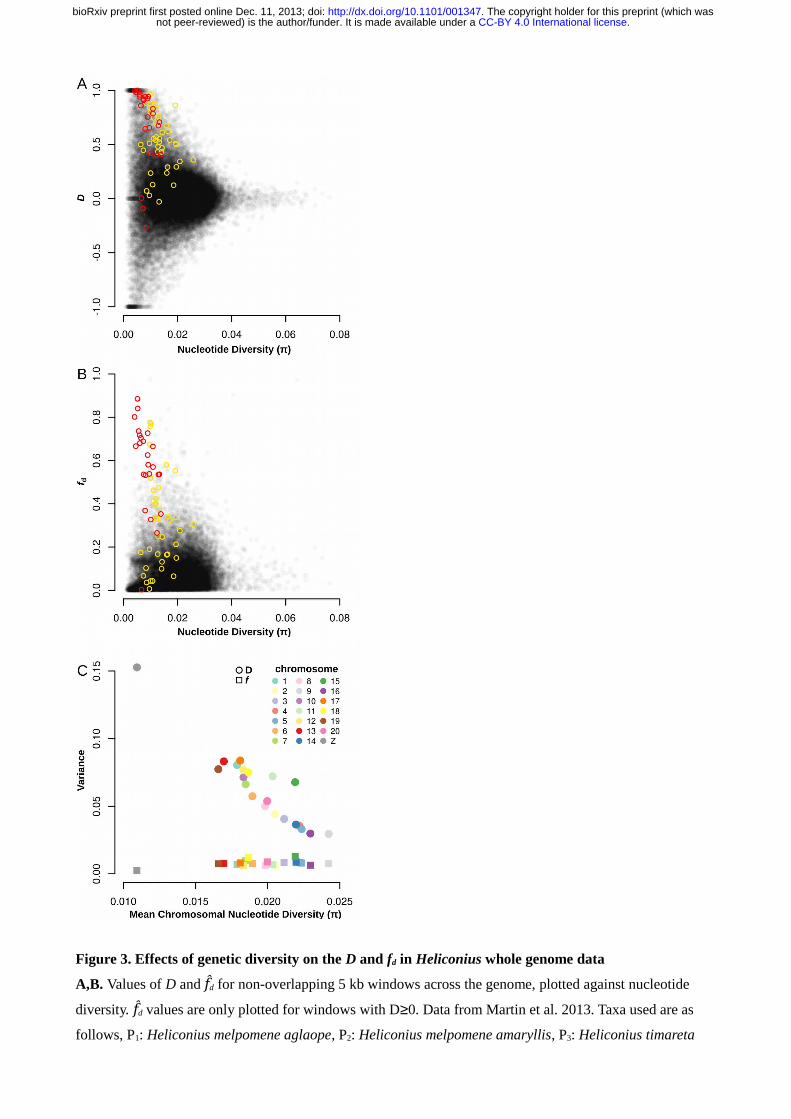
Figure 3. Effects of genetic diversity on the D and fd in Heliconius whole genome data
A,B. Values of D and f fd for non-overlapping 5 kb windows across the genome, plotted against nucleotide
diversity. f fd values are only plotted for windows with D≥0. Data from Martin et al. 2013. Taxa used are as
follows, P1: Heliconius melpomene aglaope, P2: Heliconius melpomene amaryllis, P3: Heliconius timareta
.CC-BY 4.0 International licensenot peer-reviewed) is the author/funder. It is made available under aThe copyright holder for this preprint (which was. http://dx.doi.org/10.1101/001347doi: bioRxiv preprint first posted online Dec. 11, 2013;

thelxinoe, O: four Heliconius species from the silvaniform clade (see Methods for list). Colored points show
windows located within the wing-patterning loci HmB (red) and HmYb (yellow). C. The variance among D
and fd values for each chromosome, plotted against the mean nucleotide diversity from all windows for each
chromosome.
.CC-BY 4.0 International licensenot peer-reviewed) is the author/funder. It is made available under aThe copyright holder for this preprint (which was. http://dx.doi.org/10.1101/001347doi: bioRxiv preprint first posted online Dec. 11, 2013;
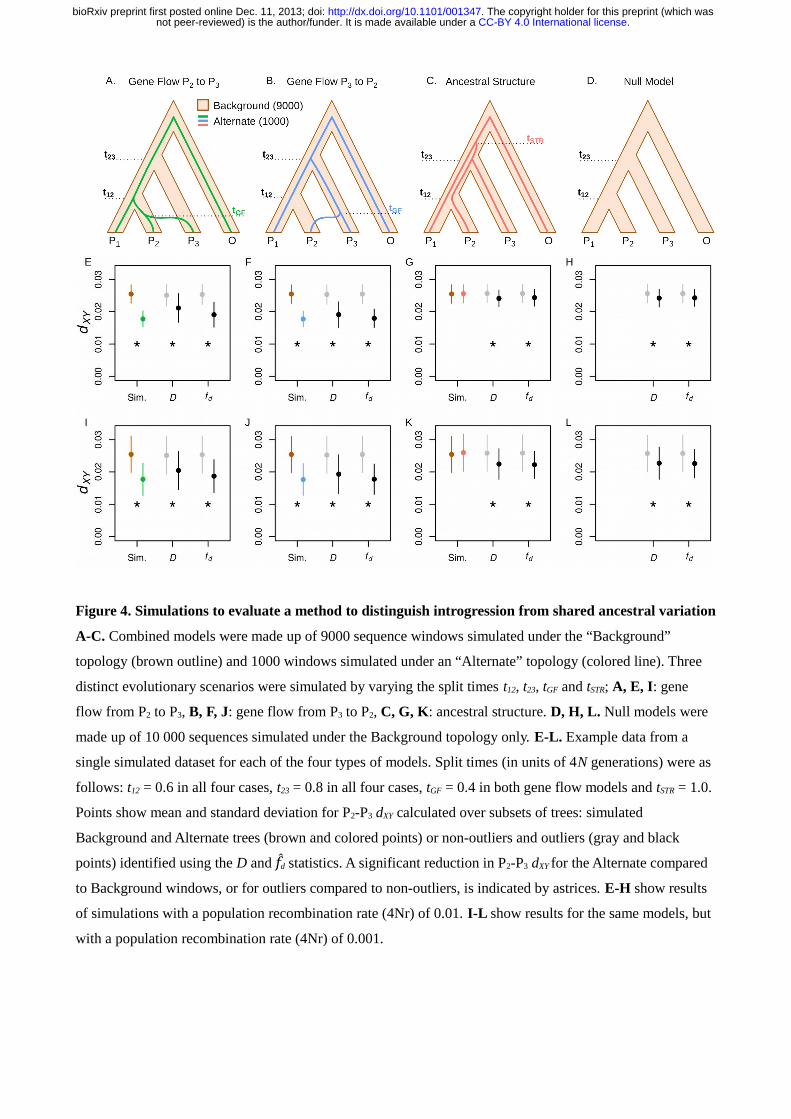
Figure 4. Simulations to evaluate a method to distinguish introgression from shared ancestral variation
A-C. Combined models were made up of 9000 sequence windows simulated under the “Background”
topology (brown outline) and 1000 windows simulated under an “Alternate” topology (colored line). Three
distinct evolutionary scenarios were simulated by varying the split times t12, t23, tGF and tSTR; A, E, I: gene
flow from P2 to P3, B, F, J: gene flow from P3 to P2, C, G, K: ancestral structure. D, H, L. Null models were
made up of 10 000 sequences simulated under the Background topology only. E-L. Example data from a
single simulated dataset for each of the four types of models. Split times (in units of 4N generations) were as
follows: t12 = 0.6 in all four cases, t23 = 0.8 in all four cases, tGF = 0.4 in both gene flow models and tSTR = 1.0.
Points show mean and standard deviation for P2-P3 dXY calculated over subsets of trees: simulated
Background and Alternate trees (brown and colored points) or non-outliers and outliers (gray and black
points) identified using the D and f fd statistics. A significant reduction in P2-P3 dXY for the Alternate compared
to Background windows, or for outliers compared to non-outliers, is indicated by astrices. E-H show results
of simulations with a population recombination rate (4Nr) of 0.01. I-L show results for the same models, but
with a population recombination rate (4Nr) of 0.001.
.CC-BY 4.0 International licensenot peer-reviewed) is the author/funder. It is made available under aThe copyright holder for this preprint (which was. http://dx.doi.org/10.1101/001347doi: bioRxiv preprint first posted online Dec. 11, 2013;
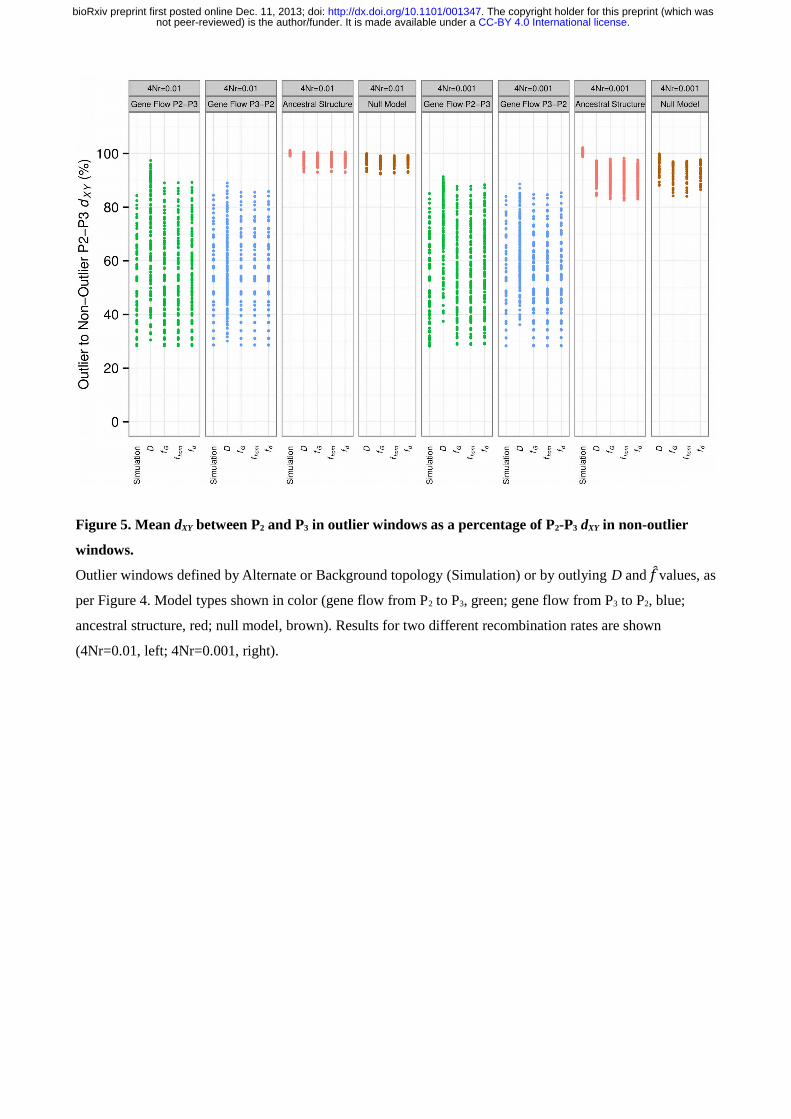
Figure 5. Mean dXY between P2 and P3 in outlier windows as a percentage of P2-P3 dXY in non-outlier
windows.
Outlier windows defined by Alternate or Background topology (Simulation) or by outlying D and f fvalues, as
per Figure 4. Model types shown in color (gene flow from P2 to P3, green; gene flow from P3 to P2, blue;
ancestral structure, red; null model, brown). Results for two different recombination rates are shown
(4Nr=0.01, left; 4Nr=0.001, right).
.CC-BY 4.0 International licensenot peer-reviewed) is the author/funder. It is made available under aThe copyright holder for this preprint (which was. http://dx.doi.org/10.1101/001347doi: bioRxiv preprint first posted online Dec. 11, 2013;
REFERENCES
Abbott R, Albach D, Ansell S, et al. 2013. Hybridization and speciation. J. Evol. Biol. 26:229–246.
Barton NH, Gale KS. 1993. Genetic analysis of hybrid zones. In: Price J, Harrison RG, editors. Hybrid
Zones and the evolutionary process. USA: Oxford University Press.
Bosse M, Megens H-J, Frantz LAF et al. 2014. Genomic analysis reveals selection for Asian genes in
European pigs following human-mediated introgression. Nature Communications 5:4392.
Charlesworth B. 1998. Measures of divergence between populations and the effect of forces that reduce
variability. Mol. Biol. Evol. 15:538–543.
Chen W-C. 2011. Overlapping Codon model, Phylogenetic Clustering, and Alternative Partial Expectation
Conditional Maximization Algorithm, Ph.D. Diss., Iowa Stat University.
Cruickshank TE, Hahn MW. 2014. Reanalysis suggests that genomic islands of speciation are due to reduced
diversity, not reduced gene flow. Mol. Ecol. In Press
Cutter AD, Payseur B a. 2013. Genomic signatures of selection at linked sites: unifying the disparity among
species. Nat. Rev. Genet. 14:262–274.
Churchhouse C, Marchini J. 2013. Multiway admixture deconvolution using phased or unphased ancestral
panels. Genet. Epidemiol. 37:1–12.
De Mita S, Siol M. 2012. EggLib: processing, analysis and simulation tools for population genetics and
genomics. BMC Genet. 13:27.
Durand EY, Patterson N, Reich D, Slatkin M. 2011. Testing for ancient admixture between closely related
populations. Mol. Biol. Evol. 28:2239–2252.
Eaton D, Ree R. 2013. Inferring Phylogeny and Introgression using RADseq Data: An Example from
Flowering Plants (Pedicularis: Orobanchaceae). Syst. Biol. 682:689-706.
Eriksson A, Manica A. 2012. Effect of ancient population structure on the degree of polymorphism shared
between modern human populations and ancient hominins. Proc. Natl. Acad. Sci. U. S. A.
109:13956–13960.
.CC-BY 4.0 International licensenot peer-reviewed) is the author/funder. It is made available under aThe copyright holder for this preprint (which was. http://dx.doi.org/10.1101/001347doi: bioRxiv preprint first posted online Dec. 11, 2013;
Garrigan D, Kingan SB, Geneva AJ, Andolfatto P, Clark AG, Thornton K, Presgraves DC. 2012. Genome
sequencing reveals complex speciation in the Drosophila simulans clade. Genome Res. 22:1499–1511.
Green RE, Krause J, Briggs AW, et al. 2010. A draft sequence of the Neandertal genome. Science
328:710–722.
Hahn MW, White BJ, Muir CD, Besansky NJ. 2012. No evidence for biased co-transmission of speciation
islands in Anopheles gambiae. Philos. Trans. R. Soc. Lond. B. Biol. Sci. 367:374–384.
Henn BM, Botigué LR, Gravel S, et al. 2012. Genomic ancestry of North Africans supports back-to-Africa
migrations. PLoS Genet. 8:e1002397.
The Heliconius Genome Consortium. 2012. Butterfly genome reveals promiscuous exchange of mimicry
adaptations among species. Nature 487:94–98.
Hohenlohe PA, Bassham S, Currey M, Cresko WA. 2012. Extensive linkage disequilibrium and parallel
adaptive divergence across threespine stickleback genomes. Philos. Trans. R. Soc. London B. Biol. Sci.
367:395–408.
Huerta-Sánchez E, Jin X, Asan et al. 2014. Altitude adaptation in Tibetans caused by introgression of
Denisovan-like DNA. Nature 512:194-197.
Kronforst MR, Hansen MEB, Crawford NG, Gallant JR, Zhang W, Kulathinal RJ, Kapan DD, Mullen SP.
2013. Hybridization reveals the evolving genomic architecture of speciation. Cell Rep. 5:666–677.
Kulathinal RJ, Stevison LS, Noor MAF. 2009. The Genomics of Speciation in Drosophila: Diversity,
Divergence, and Introgression Estimated Using Low- Coverage Genome Sequencing. PLoS Genet.
5(7):e1000550.
Lawson DJ, Hellenthal G, Myers S, Falush D. 2012. Inference of population structure using dense haplotype
data. PLoS Genet 8:e1002453.
Li J, Li H, Jakobsson M, Li S, Sjödin P, Lascoux M. 2012. Joint analysis of demography and selection in
population genetics: where do we stand and where could we go? Mol. Ecol. 21:28–44.
Mallet J, Barton N. 1989. Strong natural selection in a warning-color hybrid zone. Evolution 43:421–431.
Martin SH, Dasmahapatra KK, Nadeau NJ, et al. 2013. Genome-wide evidence for speciation with gene flow
.CC-BY 4.0 International licensenot peer-reviewed) is the author/funder. It is made available under aThe copyright holder for this preprint (which was. http://dx.doi.org/10.1101/001347doi: bioRxiv preprint first posted online Dec. 11, 2013;
in Heliconius butterflies. Genome Res. 23:1817–1828.
Maples BK, Gravel S, Kenny EE, Bustamante CD. 2013. RFMix: A discriminative modeling approach for
rapid and robust local-ancestry inference. Am. J. Hum. Genet. 93:278–288.
Noor MAF, Bennett SM. 2009. Islands of speciation or mirages in the desert? Examining the role of
restricted recombination in maintaining species. Heredity. 103:439–444.
Omberg L, Salit J, Hackett N, et al. 2012. Inferring genome-wide patterns of admixture in Qataris using
fifty-five ancestral populations. BMC Genet. 13:49.
Pardo-Diaz C, Salazar C, Baxter SW, Merot C, Figueiredo-Ready W, Joron M, McMillan WO, Jiggins CD.
2012. Adaptive introgression across species boundaries in Heliconius butterflies. PLoS Genet.
8:e1002752.
Patterson N, Moorjani P, Luo Y, Mallick S, Rohland N, Zhan Y, Genschoreck T, Webster T, Reich D. 2012.
Ancient admixture in human history. Genetics 192:1065–1093.
Pinho C, Hey J. 2010. Divergence with Gene Flow: Models and Data. Annu. Rev. Ecol. Evol. Syst.
41:215–230.
Price AL, Tandon A, Patterson N, et al. 2009. Sensitive detection of chromosomal segments of distinct
ancestry in admixed populations. PLoS Genet. 5:e1000519.
R Core Team. 2013. R: A language and environment for statistical computing. R Foundation for Statistical
Computing, Vienna, Austria. URL http://www.R-project.org/.
Rambaut A, Grass NC. 1997. Seq-Gen: an application for the Monte Carlo simulation of DNA sequence
evolution along phylogenetic trees. Bioinformatics 13:235–238.
Reich D, Thangaraj K, Patterson N, Price AL, Singh L. 2009. Reconstructing Indian population history.
Nature 461:489–494.
Reich D, Patterson N, Campbell D, et al. 2012. Reconstructing Native American population history. Nature
488:370–374.
Rheindt FE, Fujita MK, Wilton PR, Edwards S V. 2014. Introgression and phenotypic assimilation in
Zimmerius flycatchers (Tyrannidae): population genetic and phylogenetic inferences from
.CC-BY 4.0 International licensenot peer-reviewed) is the author/funder. It is made available under aThe copyright holder for this preprint (which was. http://dx.doi.org/10.1101/001347doi: bioRxiv preprint first posted online Dec. 11, 2013;

genome-wide SNPs. Syst. Biol. 63:134–152.
Roesti M, Hendry AP, Salzburger W, Berner D. 2012. Genome divergence during evolutionary
diversification as revealed in replicate lake-stream stickleback population pairs. Mol. Ecol.
21:2852–2862.
Roux C, Tsagkogeorga G, Bierne N, Galtier N. 2013. Crossing the Species Barrier: Genomic Hotspots of
Introgression between Two Highly Divergent Ciona intestinalis Species. Mol. Biol. Evol.
30:1574–1587.
Sankararaman S, Sridhar S, Kimmel G, Halperin E. 2008. Estimating local ancestry in admixed populations.
Am. J. Hum. Genet. 82:290–303.
Sankararaman S, Mallick S, Dannemann M, Prüfer K, Kelso J, Pääbo S, Patterson N, Reich D. 2014. The
genomic landscape of Neanderthal ancestry in present-day humans. Nature 507:354–357.
Smith J, Kronforst MR. 2013. Do Heliconius butterfly species exchange mimicry alleles? Biol. Lett.
9:20130503.
Staubach F, Lorenc A, Messer PW, Tang K, Petrov DA, Tautz D. 2012. Genome patterns of selection and
introgression of haplotypes in natural populations of the house mouse (Mus musculus). PLoS Genet.
8:e1002891.
Wall JD, Yang MA, Jay F, et al. 2013. Higher levels of neanderthal ancestry in East Asians than in
Europeans. Genetics 194:199–209.
Wickham H. 2007. Reshaping data with the reshape package. J. Stat. Softw. 21(12).
Wickham H. 2009. ggplot2: elegant graphics for data analysis. Springer (New York).
Wickham H. 2011. The Split-Apply-Combine Strategy for Data Analysis. J. Stat. Softw. 40(1):1-29.
Wu C. 2001. The genic view of the process of speciation. J. Evol. Biol. 14:851–865.
Yang MA, Malaspinas A-S, Durand EY, Slatkin M. 2012. Ancient structure in Africa unlikely to explain
Neanderthal and non-African genetic similarity. Mol. Biol. Evol. 29:2987–2995
Yang Z. 2010. A likelihood ratio test of speciation with gene flow using genomic sequence data. Genome
Biol. Evol. 2:200–211.
.CC-BY 4.0 International licensenot peer-reviewed) is the author/funder. It is made available under aThe copyright holder for this preprint (which was. http://dx.doi.org/10.1101/001347doi: bioRxiv preprint first posted online Dec. 11, 2013;