evaluating transportation equity - vtpi.orgvtpi.org/equity.pdf · evaluating transportation equity...
TRANSCRIPT
www.vtpi.org
250-360-1560
Todd Litman 1997-2018
You are welcome and encouraged to copy, distribute, share and excerpt this document and its ideas, provided the author is given attribution. Please send your corrections, comments and suggestions for improvement.
Evaluating Transportation Equity
Guidance For Incorporating Distributional Impacts in Transportation Planning
11 April 2018
by Todd Litman
Victoria Transport Policy Institute
Abstract Equity refers to the fairness with which impacts (benefits and costs) are distributed. Transportation planning decisions often have significant equity impacts. Transport equity analysis can be difficult because there are several types of equity, many potential impacts to consider, various ways to measure impacts, and may possible ways to categorize people. This report provides practical guidance for evaluating transportation equity. It defines various types of equity and equity impacts, and describes practical ways to incorporate equity evaluation and objectives in transport planning.
Originally published as Todd Litman (2002), “Evaluating Transportation Equity,” World Transport Policy & Practice
(http://ecoplan.org/wtpp/wt_index.htm), Volume 8, No. 2, Summer, pp. 50-65.

Evaluating Transportation Equity Victoria Transport Policy Institute
1
Contents
Executive Summary .................................................................................................... 2
Introduction ................................................................................................................. 3
Transportation Equity Evaluation ................................................................................. 4 Types of Transportation Equity ....................................................................................... 4 Impact Categories........................................................................................................... 5 Measurement Methods ................................................................................................... 6 Categorizing People ........................................................................................................ 9 Equity Evaluation Summary ............................................................................................ 10
Programmatic Versus Structural Solutions .................................................................. 11
Trade-offs Between Equity And Other Planning Objectives......................................... 11
Transportation Equity Indicators .................................................................................. 12
Incorporating Equity Analysis Into Transportation Planning ......................................... 13 Data Sources .................................................................................................................. 13 Horizontal Equity ............................................................................................................. 14 Vertical Equity ................................................................................................................. 15
Transportation Equity Analysis Examples ................................................................... 16
Strategies To Achieve Transportation Equity Objectives ............................................. 39 Horizontal Equity – Planning and Investment Reforms .................................................. 39 Horizontal Equity – Pricing Reforms ............................................................................... 39 Vertical Equity – Progressive With Respect To Income ................................................. 42 Vertical Equity – Benefiting Transportation Disadvantaged People................................ 42 Smart Growth Development Policies .............................................................................. 45 Transport Equity Objectives Summary ........................................................................... 46
Conclusions ................................................................................................................ 47
References and Information Resources ...................................................................... 49

Evaluating Transportation Equity Victoria Transport Policy Institute
2
Executive Summary Equity (also called justice or fairness) refers to the distribution of impacts (benefits and costs) and whether they are appropriate. Transportation equity analysis is important and unavoidable; transport planning decisions often have significant equity impacts, and equity concerns often influence planning debates. Most practitioners and decision-makers sincerely want to achieve equity objectives. However, transport equity can be difficult to evaluate because there are various types, impacts, measurement units, and categories of people to consider (Table ES-1).
Table ES-1 Equity Evaluation Variables
Types of Equity Impacts Measurement Categorization
Horizontal Equal treatment of equals Vertical With-Respect-To Income And Social Class Transport affordability Housing affordability Impacts on low-income communities Fare structures and discounts Industry employment Service quality in lower-income communities Vertical With-Respect-To Need And Ability Universal design Special mobility services Disabled parking Service quality for non-drivers
Public Facilities and Services Facility planning and design Public funding and subsidies Road space allocation Public involvement User Costs and Benefits Mobility and accessibility Taxes, fees and fares Service Quality Quality of various modes Congestion Universal design External Impacts Congestion Crash risk Pollution Barrier effect Hazardous material and waste Aesthetic impacts Community cohesion Economic Impacts Economic opportunities Employment and business activity Regulation and Enforcement Traffic regulation Regulations and enforcement Regulation of special risks
Per capita Per adult Per commuter or peak-period travel Per household Per Unit of Travel Per vehicle-mile/km Per passenger-mile/km Per trip Per commute or peak-period trip Per dollar Per dollar user fees Per dollar of subsidy Cost recovery
Demographics Age and lifecycle stage Household type Race and ethnic group Income class Quintiles Poverty line Lower-income areas Ability People with disabilities Licensed drivers Location Jurisdictions Neighborhood and street Urban/suburban/rural Mode Pedestrians Cyclists Motorcyclists Motorists Public transit Industry Freight Public transport Auto and fuel industries Trip Type Emergency Commutes Commercial/freight Recreational/tourist
There are various types, impacts, measurement units and categories to consider in equity analysis. How equity is defined and measured can significantly affect analysis results. It is important that people involved in transport planning understand these issues. There is no single way to evaluate transport equity; it is generally best to consider various perspectives and impacts. A planning process should reflect each community’s concerns and priorities, so public involvement is important for equity analysis.
Evaluating Transportation Equity Victoria Transport Policy Institute
3
Introduction Equity (also called justice and fairness) refers to the distribution of impacts (benefits and costs) and whether that distribution is considered fair and appropriate. Transportation planning decisions can have significant and diverse equity impacts:
The quality of transportation available affects people’s economic and social opportunities.
Transport facilities, activities and services impose various indirect and external costs, such as congestion delay and accident risk imposed on other road users, infrastructure costs not funded through user fees, pollution, and undesirable land use impacts.
Transport expenditures represent a major share of most household, business and government expenditures.
Transport facilities require significant public resources (tax funding and road rights of way), the allocation of which can favor some people over others.
Transport planning decisions can affect development location and type, and therefore accessibility, land values and local economic activity.
Transport planning decisions can affect employment and economic development which have distributional impacts.
Transportation equity analysis can be difficult because there are several types of equity to consider, numerous impacts and ways of measuring those impacts, and various ways that people can be grouped for equity analysis. A particular decision may seem equitable when evaluated one way but inequitable when evaluated another. Equity analysis is important and unavoidable. Equity concerns often influence transportation policy and planning decisions, and most practitioners and decision-makers sincerely want to address these concerns. However, there is little guidance for comprehensive transport equity analysis. Many existing evaluation tools focus on a narrow set of impacts on a particular group of people. Transport equity analysis is often ad hoc, based on the concerns and values of the stakeholders involved in a planning process; other, significant impacts may be overlooked or undervalued This report provides an overview of transport equity issues, defines various types of transportation equity, discusses methods of evaluating equity impacts, and describes ways to incorporate equity analysis into transportation decision-making.

Evaluating Transportation Equity Victoria Transport Policy Institute
4
Transportation Equity Evaluation This section discusses various ways to define and measure transportation equity impacts. For more discussion see Pereira, Schwanen and Banister (2016).
Types of Transportation Equity
There are three major categories of transportation equity.
1. Horizontal Equity
Horizontal equity (also called fairness and egalitarianism1) concerns the distribution of impacts between individuals and groups considered equal in ability and need. According to this definition, equal individuals and groups should be treated the same in the distribution of resources/benefits and costs. It means that public policies should avoid favoring one individual or group over others, and that consumers should “get what they pay for and pay for what they get” from fees and taxes unless subsidies are specifically justified.
2. Vertical Equity With Regard to Income and Social Class
Vertical equity (also called social justice, environmental justice2 and social inclusion3) is concerned with the distribution of impacts between individuals and groups that differ, in this case, by income or social class. By this definition, transport policies are equitable if they favor economically and socially disadvantaged groups in order to compensating for overall inequities (Rawls 1971). Policies are called progressive if they favor disadvantaged groups and regressive if they harm such groups. This definition supports affordable mode improvements, special services and discounts for lower income groups, and efforts to insure that disadvantaged groups do not bear excessive external costs (pollution, accident risk, financial costs, etc.).
3. Vertical Equity With Regard to Mobility Need and Ability
This is concerned with the distribution of impacts between individuals and groups that differ in mobility ability and need, and therefore the degree to which the transportation system meets the needs of travelers with mobility impairments. This definition is used to support universal design (also called accessible and inclusive design), which means that transport facilities and services accommodate all users, including those with special needs.
These different types of equity often overlap or conflict. For example, horizontal equity requires that users bear the costs of their transport facilities and services, but vertical equity often requires subsidies for disadvantaged people. Therefore, transport planning often involves making tradeoffs between different equity objectives.
1 Egalitarianism means treating everybody equally, regardless of factors such as race, gender or income. 2 Environmental justice is defined as the “equitable distribution of both negative and positive impacts across racial, ethnic, and income groups, with the environment defined to incorporate ecological, economic, and social effects” (Alsnih and Stopher 2003). 3 Social inclusion means everybody can participate adequately in important activities and opportunities, including access to services, education, employment, and decision-making (Litman 2003b; Lucas 2004).

Evaluating Transportation Equity Victoria Transport Policy Institute
5
Impact Categories
Transport equity can involve various impacts (costs and benefits), such as those listed below.
Public Facilities and Services
Amount and distribution of public funds for transport facilities and services.
Parking requirements imposed on developers, businesses and residents.
Government subsidies and tax exemptions for transportation industries.
Use of tax-exempt public land for transportation facilities.
Planning and design of transportation facilities.
Degree of public involvement in transport planning.
User Costs and Benefits
Overall level of mobility and accessibility (passenger-miles, trips, ability to reach activities).
Vehicle ownership and operating expenses.
Vehicle taxes and government fees, and fuel taxes.
Road tolls and parking fees (including exemptions and discounts).
Public transportation fares (including exemptions and discounts).
Fitness (use of physically active modes, such as walking and cycling).
Cost recovery and subsidies (portion of costs borne by a particular activity or group).
Service Quality
Number of travel modes available in an area (walking, cycling, private automobile, vehicle rentals, public transportation, taxi, rail, air travel, delivery services, etc.).
Roadway quality (traffic speeds, delay, safety, physical condition, etc.).
Parking facility supply, location, regulation, price and design.
Public transportation service quality (frequency, speed, reliability, safety, comfort, etc.).
Land use accessibility (density, mix, connectivity, location of activities, etc.).
Universal design (accommodation of people with disabilities and other special needs).
External Impacts
Traffic congestion and risk an individual or vehicle class imposes on other road users.
Air, noise and water pollution emissions.
Barrier effect (delay that roads and railroads cause to nonmotorized travel).
Transport of hazardous material and disposal of hazardous waste.
Aesthetic impacts of transportation facilities and traffic activity.
Impacts on community livability.
Economic Impacts
Access to education and employment, and therefore economic opportunities.
Impacts on business activity, property values, and economic development in an area.
Distribution of expenditures and employment (who gets contracts and jobs).
Regulation and Enforcement
Regulation of transport industries (public transportation, trucking, taxis, etc.)
Traffic and parking regulation and enforcement.
Regulation of special risks (railroad crossings, airport security, hazardous material, etc.).

Evaluating Transportation Equity Victoria Transport Policy Institute
6
Measurement Methods
Transportation impacts can be measured in various ways that affect equity analysis.
Definition of Transportation (Mobility- Versus Accessibility-Based Planning)
Transportation analysis is affected by how transport is defined and evaluated (CTS 2006). Conventional planning tends to evaluate transport based on mobility (physical travel), using indicators such as traffic speed and roadway level-of-service. However, mobility is seldom an end in itself, the ultimate goal of most transport activity is accessibility, which refers to people’s ability to reach desired services and activities. Various factors can affect accessibility including mobility, transport network connectivity and affordability, the geographic distribution of activities, and mobility substitutes such as telecommunications and delivery services (Litman 2003a). This has important equity implications. Mobility-based planning tends to favor faster modes and longer trips over slower modes and shorter trips, and therefore motorists over non-drivers. For example, evaluating transport system performance based on roadway level-of-service tends to justify roadway expansion projects even though wider roads and increased traffic speeds tend to degrade walking and cycling conditions (called the barrier effect), and since most public transit trips include walking links, to reduce transit access. Accessibility-based evaluation can consider such tradeoffs and their equity impacts. Table 1 Transportation Evaluation Perspectives (Litman 2003)
Mobility Accessibility
Definition of Transportation Vehicle travel
Ability to obtain desired services and activities
Measurement units Vehicle-miles/kms Trips, generalized costs
Modes considered Automobile, truck and transit Active transport (walking and cycling), motorized, mobility substitutes
Common indicators Vehicle traffic speeds, roadway Level of Service, costs per vehicle-mile
Quality of available transport options, average trip distances, costs per trip
Favored transportation improvement strategies
Roadway and parking facility expansion
Improvements to various modes, transport demand management, smart growth development policies
This table compares mobility- and accessibility-based transport planning.
Accessibility-based analysis expands the range of impacts and options considered in planning. It recognizes the important roles that active and public transport can play in an efficient and equitable transport system, considers impacts such as the barrier effect and sprawled development on accessibility, and expands transport improvement options to include improvements to alternative modes, increased transport network connectivity, more accessible land use development, and improved telecommunications and delivery services. This provides more comprehensive equity evaluation.

Evaluating Transportation Equity Victoria Transport Policy Institute
7
Basic Accessibility and Mobility
Basic (also called essential or lifeline) accessibility refers to people’s ability to reach activities that society considers basic or essential, such as those listed below. Basic mobility refers to travel that provides this basic access.
Basic Goods, Services and Activities
Emergency services (police, fire, ambulances, etc.).
Public services and utilities (garbage collection, utility maintenance, etc.).
Health care (medical clinics, rehabilitation services, pharmacies, etc).
Basic food and clothing.
Education and employment (commuting).
Some social and recreational activities.
Mail and package distribution.
Freight delivery.
Basic access can be considered a “merit good” and even a right (Hamburg, Blair and Albright 1995). This is why, for example, emergency, service and high occupant vehicles are often given priority in traffic and parking, why public transit services are often subsidized, and why there are standards to insure that transport systems accommodate people with disabilities. The concept of basic access is important for transport equity analysis. It means that transport activities and services can be evaluated and prioritized according to the degree to which they provide basic access. Transport equity analysis often requires determining which goods, services and activities are considered basic, and the quality of transport services can be considered adequate to satisfy basic access needs. These standards can be based on the quality of service that people would consider adequate if they were ever mobility disadvantaged, for example, becoming a non-driver due to physical disability or financial constraints (Rawls 1971; Pereira, Schwanen and Banister 2016). Measurement Units
Transportation activities and impacts can be measured in various ways that can affect analysis results. Impacts are often compared using various reference units, such as per-capita, per-trip, per-passenger-mile, or per-dollar. The scope of impacts considered in analysis can vary significantly. For example, costs can include capital, operating or total expenditures; for a single year or several years; expenditures by a particular agency, a particular level of government, all levels of government, or by society overall (for example, including parking subsidies and pollution damages). Geographic areas and demographic groups can be defined in various ways. Reference units reflect various assumptions and perspectives. For example, per capita analysis assumes that every person should receive an equal share of resources. Per-mile or per-trip analysis assumes that people who travel more should receive more resources. Cost recovery analysis assumes that people should receive public resources in proportion to how much they pay in fees and taxes. Table 2 summarizes the equity implications of various reference units often used for transport impact analysis.
Evaluating Transportation Equity Victoria Transport Policy Institute
8
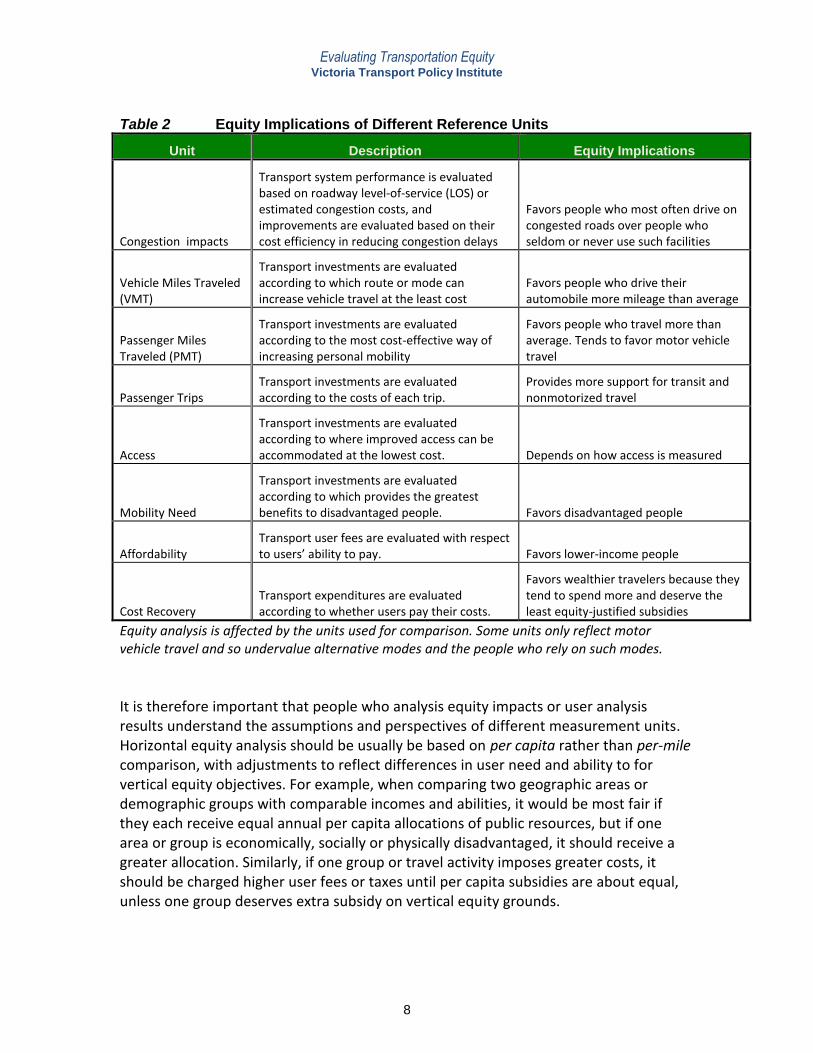
Table 2 Equity Implications of Different Reference Units
Unit Description Equity Implications
Congestion impacts
Transport system performance is evaluated based on roadway level-of-service (LOS) or estimated congestion costs, and improvements are evaluated based on their cost efficiency in reducing congestion delays
Favors people who most often drive on congested roads over people who seldom or never use such facilities
Vehicle Miles Traveled (VMT)
Transport investments are evaluated according to which route or mode can increase vehicle travel at the least cost
Favors people who drive their automobile more mileage than average
Passenger Miles Traveled (PMT)
Transport investments are evaluated according to the most cost-effective way of increasing personal mobility
Favors people who travel more than average. Tends to favor motor vehicle travel
Passenger Trips Transport investments are evaluated according to the costs of each trip.
Provides more support for transit and nonmotorized travel
Access
Transport investments are evaluated according to where improved access can be accommodated at the lowest cost.
Depends on how access is measured
Mobility Need
Transport investments are evaluated according to which provides the greatest benefits to disadvantaged people.
Favors disadvantaged people
Affordability Transport user fees are evaluated with respect to users’ ability to pay. Favors lower-income people
Cost Recovery Transport expenditures are evaluated according to whether users pay their costs.
Favors wealthier travelers because they tend to spend more and deserve the least equity-justified subsidies
Equity analysis is affected by the units used for comparison. Some units only reflect motor vehicle travel and so undervalue alternative modes and the people who rely on such modes.
It is therefore important that people who analysis equity impacts or user analysis results understand the assumptions and perspectives of different measurement units. Horizontal equity analysis should be usually be based on per capita rather than per-mile comparison, with adjustments to reflect differences in user need and ability to for vertical equity objectives. For example, when comparing two geographic areas or demographic groups with comparable incomes and abilities, it would be most fair if they each receive equal annual per capita allocations of public resources, but if one area or group is economically, socially or physically disadvantaged, it should receive a greater allocation. Similarly, if one group or travel activity imposes greater costs, it should be charged higher user fees or taxes until per capita subsidies are about equal, unless one group deserves extra subsidy on vertical equity grounds.

Evaluating Transportation Equity Victoria Transport Policy Institute
9
Categorizing People
Equity evaluation requires that people be categorized by demographic and geographic factors to evaluate their capabilities and identify those who are transport disadvantaged (Fan and Huang 2011; Jiao and Dillivan 2013; Karner and Niemeier 2013; Pereira, Schwanen and Banister 2016). Such categories can be defined in various ways. For example, although people are often categorized as motorists, transit users and pedestrians, many use multiple modes, particularly over the long-term. Although only a small portion of households depent completely on public transit at any time, many have members who use transit, and many people who do not currently use it may value having it available for possible future use. Similarly, most people experience mobility impairments sometime during their lives and so may value universal design. For this reason, it is often most appropriate to use a household or lifecycle analysis for equity analysis. Sustainability is concerned with intergenerational equity, that is, insuring that impacts on future generations are considered in decision-making. This represents an additional perspective for categorizing people. Factors That Can Contribute to Transportation Disadvantaged Status
Low Income
Non-driver/car-less
Disability
Language barriers
Isolation (in an inaccessible location)
Caregiver (responsible for dependent child or disabled adult)
Obligations (requires frequent medical treatments, attends school or is employed)
Disadvantaged status is multi-dimensional, so its evaluation should take into account the degree and number of disadvantaged factors that apply to an individual. The greater their degree and the more factors that apply, the more disadvantaged an individual or group can be considered. For example, a person who has a low income but is physically able, has no caregiving responsibilities, and lives in an accessible community is not significantly transportation disadvantaged, but if that person develops a disability, must care for a young child, or moves to an automobile-dependent location, their degree of disadvantage increases. Various sources can be used to identify the size of these groups. For example, the U.S. Census has data on the number of residents with low incomes, driver’s licenses and disabilities in a community.
Equity of Opportunity Versus Equity of Outcome There is an ongoing debate about how to measure vertical equity. There is general agreement that everybody deserves “equity of opportunity,” meaning that disadvantaged people have adequate access to education and employment opportunities. There is less agreement concerning “equity of outcome,” meaning that society insures that disadvantaged people actually succeed in these activities. Transportation affects equity of opportunity. Without adequate transport it is difficult to access education and employment. It therefore meets the most “conservative” test of equity.

Evaluating Transportation Equity Victoria Transport Policy Institute
10
Equity Evaluation Summary
Table 3 summarizes key variables that affect transportation equity analysis. How equity is defined, impacts considered and measured, and people categorized can significantly affect result. There is no single correct way to evaluate transportation equity. It is generally best to consider various perspectives, impacts and analysis methods. It is important that people involved in equity analysis understand how the selection of variables can affect results. Table 3 Equity Evaluation Variables
Types of Equity Impacts Measurement Categorization
Horizontal Equal treatment of equals Vertical With-Respect-To Income And Social Class Transport affordability Housing affordability Impacts on low-income communities Fare structures and discounts Industry employment Service quality in lower-income communities Vertical With-Respect-To Need And Ability Universal design Special mobility services Disabled parking Service quality for non-drivers
Public Facilities and Services Facility planning and design Public funding and subsidies Road space allocation Public involvement User Costs and Benefits Mobility and accessibility Taxes, fees and fares Service Quality Quality of various modes Congestion Universal design External Impacts Congestion Crash risk Pollution Barrier effect Hazardous material and waste Aesthetic impacts Community cohesion Economic Impacts Economic opportunities Employment and business activity Regulation and Enforcement Traffic regulation Regulations and enforcement Regulation of special risks
Per capita Per adult Per commuter or peak-period travel Per household Travel unit Per vehicle-mile/km Per passenger-mile/km Per trip Per commute or peak-period trip Per dollar Per dollar user fees Per dollar of subsidy Cost recovery
Demographics Age and lifecycle stage Household type Race and ethnic group Income class Quintiles Poverty line Lower-income areas Ability People with disabilities Licensed drivers Location Jurisdictions Neighborhood and street Urban/suburban/rural Mode users Walkers Cyclists Motorcyclists Motorists Public transit users Industry Freight Public transport Auto and fuel industries Trip Type Emergency Commute Commercial/freight Recreational/tourist
There are various types impacts, measurement units and categories to consider in equity analysis.

Evaluating Transportation Equity Victoria Transport Policy Institute
11
Programmatic Versus Structural Solutions There are two general approaches for addressing transport inequity: programmatic solutions which target special protections and services at particular disadvantaged groups, or structural changes that affect overall policies and planning activities (Litman and Brenman 2012). For example, special mobility services for people with severe disabilities, and special facilities such as wheelchair ramps are examples of programmatic strategies. Broad policy reforms intended to increase transport system affordability and diversity (better walking, cycling, public transit, taxi, delivery services, and development policies that help create more accessible, multi-modal communities) are examples of structural solutions. Many programs involve a combination of both. Programmatic solutions often appear to be most cost effective since they focus resources on people who are most disadvantaged, but structural reforms often provide significant co-benefits and so are often most beneficial overall. For example, most communities can only afford to provide a small amount of special mobility services, but planning reforms that help create more multi-modal transportation systems and more accessible land use develpment may improve access for physically, economically and socially disadvantaged people, including those who not fit into standard “disadvantaged” categories such as people with moderate incomes or mild disabilities.
Trade-offs Between Equity And Other Planning Objectives Transportation planning often involves tradeoffs between equity objectives and other planning objectives. For example, improving pedestrian safety may reduce traffic speeds and therefore economic productivity, and providing public transit services may require tax subsidies, and in some cases may increase local air and noise pollution. There is no standard way to determine how much weight to give a particular equity objective; such planning decisions should reflect community needs and values. Some communities may place a higher or lower value on a particular equity objective. For example, some communities may place a higher value on providing basic mobility for non-drivers. Some communities may consider road tolls and parking fees unfair because they are regressive, while others consider them fair because they charge motorists directly for the facilities they use and so increase horizontal equity. Transportation equity issues are sometimes evaluated based on performance targets, such as annual per capita expenditures on special mobility or public transit services, that transit fares should be less than a certain maximum portion of low-income workers’ income, or that a certain portion of housing in transit-oriented areas should be affordable. Setting such targets usually require some sort of public involvement process to help incorporate community needs and values into planning and funding decisions (FHWA 1996).
Evaluating Transportation Equity Victoria Transport Policy Institute
12
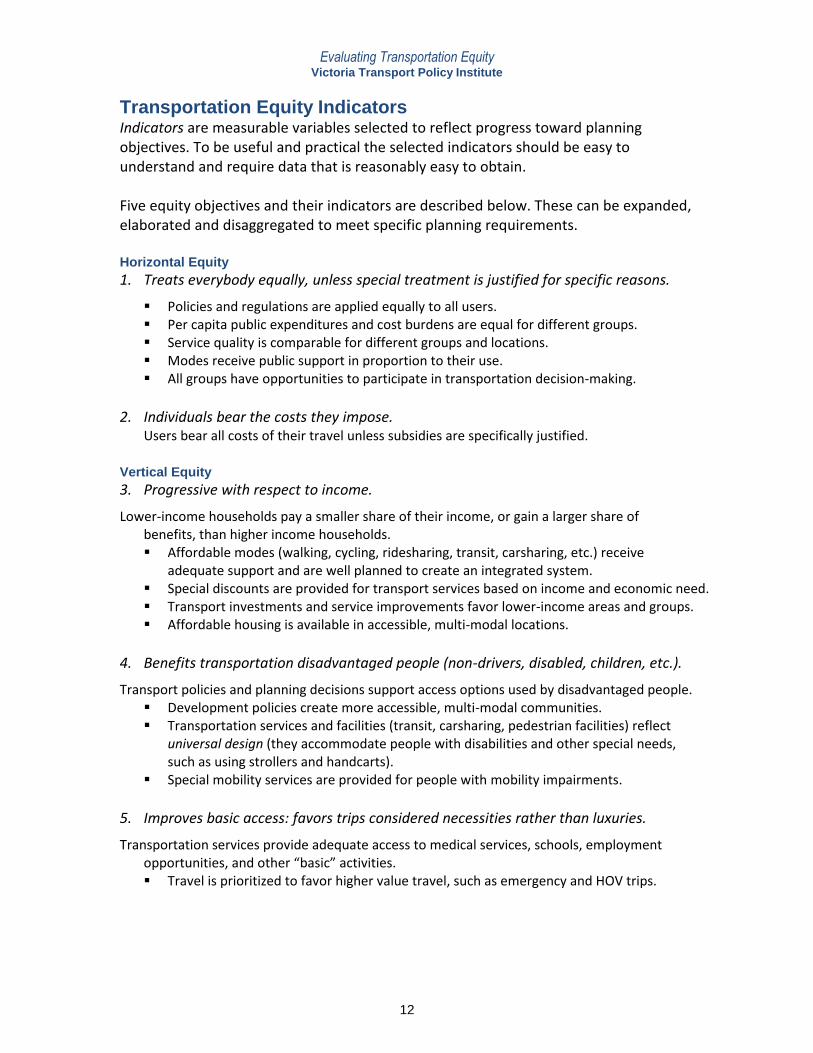
Transportation Equity Indicators Indicators are measurable variables selected to reflect progress toward planning objectives. To be useful and practical the selected indicators should be easy to understand and require data that is reasonably easy to obtain. Five equity objectives and their indicators are described below. These can be expanded, elaborated and disaggregated to meet specific planning requirements. Horizontal Equity
1. Treats everybody equally, unless special treatment is justified for specific reasons.
Policies and regulations are applied equally to all users. Per capita public expenditures and cost burdens are equal for different groups. Service quality is comparable for different groups and locations. Modes receive public support in proportion to their use. All groups have opportunities to participate in transportation decision-making.
2. Individuals bear the costs they impose.
Users bear all costs of their travel unless subsidies are specifically justified.
Vertical Equity
3. Progressive with respect to income.
Lower-income households pay a smaller share of their income, or gain a larger share of benefits, than higher income households. Affordable modes (walking, cycling, ridesharing, transit, carsharing, etc.) receive
adequate support and are well planned to create an integrated system. Special discounts are provided for transport services based on income and economic need. Transport investments and service improvements favor lower-income areas and groups. Affordable housing is available in accessible, multi-modal locations.
4. Benefits transportation disadvantaged people (non-drivers, disabled, children, etc.).
Transport policies and planning decisions support access options used by disadvantaged people. Development policies create more accessible, multi-modal communities. Transportation services and facilities (transit, carsharing, pedestrian facilities) reflect
universal design (they accommodate people with disabilities and other special needs, such as using strollers and handcarts).
Special mobility services are provided for people with mobility impairments.
5. Improves basic access: favors trips considered necessities rather than luxuries.
Transportation services provide adequate access to medical services, schools, employment opportunities, and other “basic” activities. Travel is prioritized to favor higher value travel, such as emergency and HOV trips.

Evaluating Transportation Equity Victoria Transport Policy Institute
13
Incorporating Equity Analysis Into Transportation Planning Transport equity analysis is usually performed as part of other planning activities. This chapter describes techniques for incorporating equity analysis into transport planning. Data Sources
Various tools and resources are available to help evaluate the distribution of transport impacts and their equity impacts (FHWA 1997). These provide information on the distribution of impacts between different groups. New data sources are available to help evaluate people by income and ability (FHWA and FTA 2002), and new GIS (Geographic Information System) tools facilitate geographic analysis of impacts. It is often possible to collect information for transportation equity analysis in surveys performed for other purposes, by including questions concerning income and mobility constraints in regular travel surveys, and by including transportation questions in surveys related to other issues (Schmocker, et al. 2005). For example, a survey of social service clients can include questions concerning how they normally travel, their ability to use an automobile, and whether inadequate transportation is a significant problem. Below are examples of potential data sources useful for equity analysis. 1. Government agency budgets and reports that indicate public expenditures by jurisdiction
and mode, and on facilities and programs targeted to serve particular groups. 2. Census and surveys can provide the following data, disaggregated by geographic,
demographic, and income category:
People’s level of mobility (e.g. person-trips and person-miles of travel during an average day, week or year).
The portion of the population with disadvantaged status (low income, physical disability, elderly, single parents, etc.) (Schmocker, et al. 2005).
The portion of their time and financial budgets devoted to travel.
The problems people face using transportation facilities and services.
The degree to which people lack basic access.
Residents’ desire for transportation options.
3. Traffic accident injury and assault rates for various groups. 4. Audits of the ability of transport facilities and services to accommodate people with
disabilities and other special needs. 5. Analysis of the degree to which disadvantaged people are considered and involved in
transport planning. 6. Reports on the frequency of special problems by disadvantaged travelers (faulty equipment,
inaccurate information, inconsiderate treatment by staff, etc.), the frequency of complaints by disadvantaged travelers, and the responsiveness of service providers to such complaints.

Evaluating Transportation Equity Victoria Transport Policy Institute
14
Horizontal Equity
Horizontal equity requires that public resources be allocated equally to each individual or group unless a subsidy is specifically justified. Exactly what constitutes an equal share depends on which resources are considered and how they are measured. For example, comparisons can be made per household, per resident, per adult or per vehicle. This requirement applies to allocations of general taxes but not to user fees, so equity analysis may depend on how certain revenue sources are categorized. Adjustments may be required to account for differences in geography (such as greater dependence on walking and transit in cities, and greater dependency on highways in suburbs and rural areas), costs (such as higher costs of facilities and services in dense urban areas), and the extra costs of serving people with disabilities and other special needs. In most jurisdictions, transportation facilities and services are financed by several levels of government (local, regional, state/provincial, national), all of which should be considered in analysis. Many transportation projects involve large budget expenditures certain years. Some public resource allocations are not reflected in transportation budgets, including tax discounts and exemptions for particular groups, land allocations (for example, public land devoted to transportation facilities), or are incorporated into other budgets, such as traffic services provided by police and parking facility costs borne in building budgets. Comprehensive analysis is therefore required to accurately determine the distribution of public resources for transportation facilities and services. Various roadway cost allocation (also called cost responsibility) studies have calculated the share of roadway costs imposed by different types of vehicles (motorcycles, automobiles, buses, light trucks, heavy trucks, etc.), and how these costs compare with roadway user payments by that vehicle class (Jones and Nix 1995; FHWA 1997). This reflects the principle of horizontal equity, assuming that users should bear the costs they impose unless a subsidy is specifically justified. User payments refers to special fees and taxes charged to road users, including tolls, fuel taxes, registration fees and weight-distance fees, but does not include general taxes applied to vehicles and fuel.4
4 Although highway cost allocation principles specify that only special roadway taxes beyond general taxes should be considered user fees, some advocacy groups argue that all taxes on vehicles and fuel should be considered user fees and allocated based on payments. For discussion see “Evaluating Criticism of Transportation Cost Analysis” in Litman, 2009.
Evaluating Transportation Equity Victoria Transport Policy Institute
15
Vertical Equity
Vertical equity requires that disadvantaged people be identified and given special consideration in planning, to insure that they are not made worse off, and that their needs are accommodated. Ng (2005) describes the following steps for doing this.
1. Identify disadvantaged groups (minority, low income, car-less, disabled, single parents).
2. Identify disadvantaged geographic areas using census data (“Environmental Justice Areas”).
3. Identify degrees of disadvantage in each geographic area, with five levels of severity.
4. Identify location of important public services and destinations (transit, highways, employment centers, hospitals, daycare centers, etc.).
5. Evaluate specific transportation plans according to how they affect accessibility between disadvantaged communities and important destinations.
Martens, Golub and Robinson (2012) argue that equity should maximize average accessibility and minimize disperities between the lowest and highest groups. The study, Measuring Accessibility as Experienced by Different Socially Disadvantaged Groups (TSG 2005) examines the quality of transport services provided to various groups. Gullo, et al. (2008) evaluated the time and money costs of accessing jobs by various demographic groups, and recommend more transit-oriented planning to improve opportunity and fairness. Creger, Espino and Sanchez (2018) identified ways that planning can better respond to the needs of disadvantaged minory groups. The degree to which non-drivers are disadvantaged relative to drivers can be measured using mobility gap analysis (LSC 2001), which measures the different in motorized travel (automobile, public transit, taxi, etc.) between households with and without automobiles (called “zero-vehicle households”). This can be determined using travel survey data to compare the average daily trips generated by different household types taking into account factors such as the smaller average size and lower employment rates of zero-vehicle households. Accounting for these factors, zero-vehicle households are generally found to generate 30-50% fewer personal trips. This methodology may understate real transportation needs by assuming that automobile-owning households have no unmet mobility needs, which ignores the mobility problems facing non-drivers in vehicle-owning households. For example, a household that owns one vehicle shared by two or three adults, or households with adults who cannot drive due to disabilities or other problems, may face mobility gaps similar to zero-vehicle households. Various techniques can be used to quantify inequity with respect to income (Marshall and Olkin 1979; Ramjerdi 2006). The Dalton Principle assumes that resource transfers from high- to lower-income people that maintain their overall income ranking improves equity. The Gini-index, the Theil Coefficient and the Coefficient of Variation are used to quantify inequity. Since these only consider income they may need adjustment to reflect other factors, such as people’s mobility needs and physical ability.

Evaluating Transportation Equity Victoria Transport Policy Institute
16
Transportation Equity Analysis Examples This section describes examples of transport equity analysis. Also see FHWA and FTA (2002).
Public Funding Allocation
Horizontal equity requires that users pay for the costs they impose unless subsidies are specifically justified. Transportation funding practices often violate this principle, resulting in more per capita spending in some jurisdictions than others. For example, Georgia state law requires that state highway funds be allocated equally among the state’s 13 Congressional Districts, resulting in more spending per capita in rural districts. Chen (1996) also found that cities receive far less per capita transport funding due to planning practices that favor spending on automobile-oriented facilities over other modes. There are three possible justifications for these cross-subsidies.
1. If highways are considered user funded (vehicle fees, fuel taxes and tolls), funding could be allocated based on where these fees are paid. However, urban regions generate about half of all fuel tax revenues, so this does not justify the funding discrepancy.
2. It could be argued that urban residents often drive on rural highways, and rely on interregional fright services, and so benefit from rural highway expenditures. However, rural residents also travel in urban areas and rely on urban services.
3. It could be argued that rural residents are economically disadvantaged and have fewer travel options compared with urban residents. Such subsidies are only justified for truly disadvantaged rural motorists, it does not justify subsidizing all rural vehicle travel.
This suggests that highway funding is inequitable. Only by providing significant urban transit funding can transportation budgets be considered fair. Transportation Insecurity Costs Imposed on Women
The article “'Paying to Stay Safe': Why Women Don't Walk as Much as Men.” (Shadwell 2017) describes evidence that fear of sexural harassment and other personal insecurity threats deter women from walking, reducing their independence, health and affordability. This discrepancy in women’s step counts diminished with increased walkability scores, suggesting that more compact and walkable communities increase women’s security. Some communities are developing special programs to improve women’s security, as discussed in, Planning and Designing Transport Systems to Ensure Safe Travel for Women (Tiwari 2014). Pedestrian access to transit stations, and personal security when waiting for a bus or train, are as important as in-vehicle security. Women’s Employment Access
A detailed survey of womens’ travel behavior in North East England found that women have diverse travel needs, including high rates of errands and chauffeuring trips, that access to a car significantly increases their employment opportunities and therefore economic inclusion, and even in car-owning households women typically have second priority in car access (Dobbs (2005).

Evaluating Transportation Equity Victoria Transport Policy Institute
17
Public Transit Equity Analysis
Evaluating Public Transit Benefits and Costs (Litman 2014) points out that public transit planning often involves trade-offs between economic efficiency objectives (reducing traffic and parking congestion, facility cost savings, accident and pollution emission reductions), which tends to favor transit services on major urban corridors that attract more affluent commuters, and social equity objectives (basic mobility for non-drivers), which tends to favor services used by physically, economically and socially disadvanted groups. Similarly, In his book, Human Transit: How Clearer Thinking about Public Transit Can Enrich Our Communities and Our Lives, Jarrett Walker (2012) points out that public transit planning decisions often involve trade-offs between maximizing ridership (so service is concentrated on the highest demand corridors) and coverage (so service is dispersed, and so serves times and locations when and where demand is low). The article, “Meeting the Public’s Need For Transit Options: Characteristics of Socially Equitable Transit Networks,” (Krameer and Goldstein 2015) provides guidance for evaluating public transit social equity impacts, specific strategies for achieving social equity goals, and several examples. Lubitow, Rainer and Bassett (2017) identify ways that public transit designed primarily to accommodate economically stable, able-bodied, white, male commuters may underserve vulnerable groups such as mothers with young children and people with disabilities. Spatial and Skills Mismatch of Unemployment and Job Vacancies (www.cts.umn.edu/Research/Featured/TransitandWorkforce)
Fan, Andrew Guthrie and Kirti Vardhan Das (2016) evaluated disadvantaged residents’ job access through metropolitican areas. They find that non-drivers’ access to job vacancies varies widely. Targeted transit improvements can provide significant benefits by improving disadvantaged residents to “sweet spots,” defined as in-demand occupations with low education requirements that are likely to pay a living wage. The report recommends redefining “accessible jobs” based on transit access rather than geography, considering every stage of connecting workers with jobs, considering their skills, available training, jobs accessible by transit, as well as information on worker and job availability. The report also recommends identifying employers with labor supply problems, considering disadvantaged workers’ complex schedules, engaging with TMO’s and pursuing creative first mile/last mile solutions to connect workplaces with transit lines, as well as pursuing transit-oriented economic development. Smart Growth Equity Impacts
Numerous studies indicate that more compact, multi-modal smart growth development patterns tend to increase integration (poor and racial minorities are less geographically isolated), economic opportunity (disadvantaged people’s ability to access education and job opportunities), and economic mobility (the chance that children born in low-income families will become economically successful as adults (Kneebone and Holmes 2015).

Evaluating Transportation Equity Victoria Transport Policy Institute
18
Quality of Mobility Options for Disadvantaged Groups
Stanley, et al. (2011) identify five social exclusion risk factors, including income, employment, political engagement, participation in selected activities, and social support (being able to get help when needed). They estimate the marginal rate of substitution between household income and trip making, assuming that each additional trip is equivalent to undertaking an additional activity, which indicates their value to users. Applying this analysis approach in Melbourne, Australia they find that residents aged over 15 average 3.8 daily trips (all modes), but decline as the number of social exclusion risk factors increase: people with 2 or more risk factors take 2.8 or fewer daily trips, indicating a significant decline in community involvement. This analysis estimates an additional trip (and activity) is valued at approximately $20 at an average income, and more for increased mobility by lower income households. This is about four times the value ascribed to such trips using traditional economic evaluation. The report Measuring Accessibility as Experienced by Different Socially Disadvantaged Groups (TSG 2005) evaluates local accessibility (e.g. access to bus stops) and regional accessibility (e.g. access to employment opportunities) for seven socially disadvantaged groups: young people (16-24), older people (60+), Black and Minority Ethnic (BME) people, people with mental or physical disabilities, travelers with young children, unemployed people, and shift workers. This indicate that many of these groups have significant mobility constraints. It developed the WALC (Weighted Access for Local Catchments) to reflect perceived walk access. Titheridge, et al (2014) recommend the development of minimum standard of accessibility for transportation equity analysis. In an article, “How Low-Income Cyclists Go Unnoticed,” Koeppel (2006) describes examples of poor and minority residents who rely on bicycle transportation, but are often overlooked in the transportation planning process. The Vancouver, Canada region’s Mobility Pricing Independent Commission (2017), comprised of 14 community leaders, is using stakeholders engagement and detailed analysis of transport trends and costs by income class to evaluate the impacts of various investment and pricing options for policy analysis. Figure 1 2011 Primary trip mode by household income level (MPIC 2017)
Automobile mode share, annual vehicle travel and peak-period trips tend to increase with income. Lowest income seldom drive during peak periods. This indicates that road user fees and congestion pricing are less regressive than financing roads and parking through general taxes or through building rents.

Evaluating Transportation Equity Victoria Transport Policy Institute
19
Civil Rights Analysis (Karner and Niemeier 2013)
In their article, “Civil Rights Guidance And Equity Analysis Methods For Regional Transportation Plans: A Critical Review Of Literature And Practice,” Karner and Niemeier (2013) critically evaluate the methods currently used to evaluate transportation impacts on minority populations. The conclude that, “prevailing methods of equity analysis are more likely to obviscate than to reveal and that there are no standards for agencies to follow in order to a rigorous equity analysis.” They recommend more integrated modeling and Geographic Information Systems (GIS) analysis to provide better information on the ways that specific planning decisions affect the mobility and accessibility disadvantaged groups, such as low-income, minority communities. Transit Dependency and Transit Deserts (Jiao and Dillivan 2013)
Jiao and Dillivan used GIS to measure the number of transit dependent people (people unable to drive due to age, physical disability or poverty) in urban neighborhoods, and identify “transit deserts,” defined as areas numerous transit-dependent residents and poor transit service. They use the following formula calculate transit dependency:
Household drivers = (population age 16 and over) – (persons living in group quarters)
Transit-dependent household population = (household drivers) – (vehicles available)
Transit-dependent population = (transit-dependent household population) + (population ages 12–15) + (non-institutionalized population living in group quarters)
Transit service (supply) was determined by four criteria:
1. number of bus and rail stops in each block group
2. frequency of service for each bus and rail stop per day (weekday service) in each block group
3. number of routes in each block group
4. length of bike routes and sidewalks (miles) in each block group
Each criterion was divided by acres to get a density value, and the values for each criterion were aggregated to determine the level of supply in each area. Demand and supply are subtracted and a final numerical value was calculated, and used to determine an excess or lack of supply for each census block group. Non-Drivers Accessibility
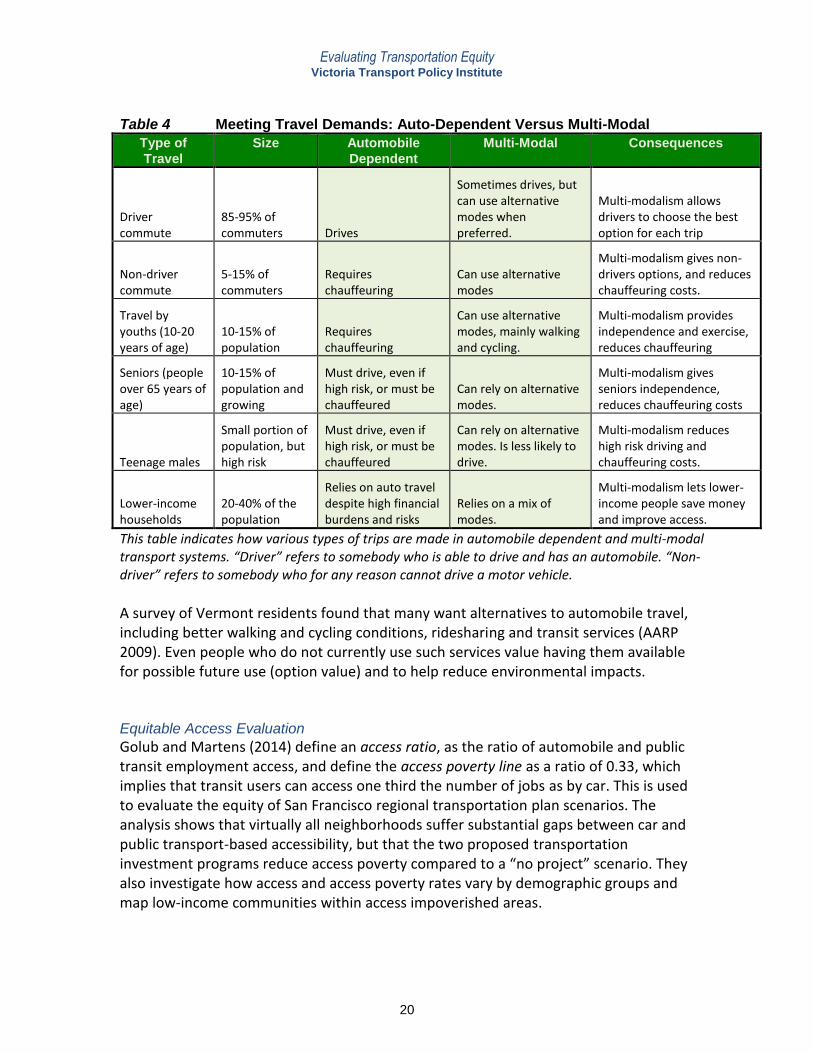
Case (2011) developed a model that evaluates nondrivers’ accessibility based on non-drivers trip generation rates. This technique can help identify the best neighborhoods to focus non-automobile transportation improvement efforts, including targeted walking, cycling and public transport improvements, more accessible land use development, and increased affordability. Table 4 compares automobile-dependent and multi-modal transport systems ability to meet various transport demands. In a multi-modal community motorist can still drive (although somewhat slower), but in an automobile-dependent community non-drivers are significantly disadvantaged. This indicates that a diversified, multi-modal transport system is most vertically equitable (Sharp and Tranter 2010).
Evaluating Transportation Equity Victoria Transport Policy Institute
20
Table 4 Meeting Travel Demands: Auto-Dependent Versus Multi-Modal
Type of
Travel
Size Automobile
Dependent
Multi-Modal Consequences
Driver commute
85-95% of commuters Drives
Sometimes drives, but can use alternative modes when preferred.
Multi-modalism allows drivers to choose the best option for each trip
Non-driver commute
5-15% of commuters
Requires chauffeuring
Can use alternative modes
Multi-modalism gives non-drivers options, and reduces chauffeuring costs.
Travel by youths (10-20 years of age)
10-15% of population
Requires chauffeuring
Can use alternative modes, mainly walking and cycling.
Multi-modalism provides independence and exercise, reduces chauffeuring
Seniors (people over 65 years of age)
10-15% of population and growing
Must drive, even if high risk, or must be chauffeured
Can rely on alternative modes.
Multi-modalism gives seniors independence, reduces chauffeuring costs
Teenage males
Small portion of population, but high risk
Must drive, even if high risk, or must be chauffeured
Can rely on alternative modes. Is less likely to drive.
Multi-modalism reduces high risk driving and chauffeuring costs.
Lower-income households
20-40% of the population
Relies on auto travel despite high financial burdens and risks
Relies on a mix of modes.
Multi-modalism lets lower-income people save money and improve access.
This table indicates how various types of trips are made in automobile dependent and multi-modal transport systems. “Driver” refers to somebody who is able to drive and has an automobile. “Non-driver” refers to somebody who for any reason cannot drive a motor vehicle.
A survey of Vermont residents found that many want alternatives to automobile travel, including better walking and cycling conditions, ridesharing and transit services (AARP 2009). Even people who do not currently use such services value having them available for possible future use (option value) and to help reduce environmental impacts. Equitable Access Evaluation
Golub and Martens (2014) define an access ratio, as the ratio of automobile and public transit employment access, and define the access poverty line as a ratio of 0.33, which implies that transit users can access one third the number of jobs as by car. This is used to evaluate the equity of San Francisco regional transportation plan scenarios. The analysis shows that virtually all neighborhoods suffer substantial gaps between car and public transport-based accessibility, but that the two proposed transportation investment programs reduce access poverty compared to a “no project” scenario. They also investigate how access and access poverty rates vary by demographic groups and map low-income communities within access impoverished areas.

Evaluating Transportation Equity Victoria Transport Policy Institute
21
Inclusive Planning Analysis
Many jurisdictions apply sustainable transport planning which balances economic, social and environmental objectives, but social sustainability is often less clearly defined than other impacts. Social sustainability is often defined in terms of avoiding excessive burdens on disadvantaged groups (the basis of environmental justice), or in terms of general social goals such as poverty reduction, community cohesion and accountability. Researcher Rebecca Mann recommends applying inclusive impact assessment when evaluating urban transport project impacts (Mann 2011). Inclusive development is defined as “growth that reduces disadvantage,” and inclusive transport planning refers to policies and projects that enhance the wellbeing of physically, economically and socially disadvantaged groups. Mann recommends considering these factors when evaluating specific transport policies and projects:
1. Who benefits and who is excluded?
2. How does the project help disadvantaged people (in terms of time savings, comfort and safety) access employment and income opportunities, education, and health services?
3. How does it affect the travel costs of different households?
4. How will it impact public and non-motorized transport?
5. How will it affect disadvantaged people’s environment and health.
An Inclusive Transport Impact Assessment Tool which includes:
Spatial analysis of poverty and impacts that a policy or project may have on poor people’s economic and social opportunities (where they live, school, work and shop).
Identification of various affected “stakeholder” groups (by income, gender, age, physical ability, employment status, racial or ethnic minority, or other vulnerabilities).
Analysis of “transmission channels” through which the project will affect disadvantaged groups (access, prices, subsidies, health and safety, and employment in transport sector)
An impact matrix which summarizes how various disadvantaged groups are affected.
Special factors to consider when evaluating accessibility, affordability, safety and health.
Transportation Equity Analysis Theory
Pereira, Schwanen and Banister (2016) discuss how various theories of justice (utilitarianism, libertarianism, intuitionism, Rawlsian, and Capability Approaches) can apply to transport planning. Based on Rawlsian and Capability Approaches principles they propose that transport equity should be evaluated based on detailed analysis of how policies affect disadvantaged groups’ accessibility to basic services and activities; impact disadvantaged groups; reduce inequalities of opportunities; mitigate transport externalities; and respect individuals’ rights. This requires more complete accessibility analysis than usually applied in conventional transport planning, including factors such as proximity and location, mobility options, financial costs and user capabilities.

Evaluating Transportation Equity Victoria Transport Policy Institute
22
Parking Requirement Equity Impacts
Parking requirements are an example of transport planning decisions that have significant, unintended, and often overlooked equity impacts. Most jurisdictions have regulations that specify the minimum number of parking spaces that must be supplied at each destination. These requirements tend to be generous, designed to insure that motorists can almost always find convenient at any destination (Litman 2000). They are even justified on equity grounds, to insure that each development bears the costs of the parking demand it generates, to avoid spillover parking problems at nearby sites. These parking requirements represent a subsidy of vehicle ownership and use worth hundreds of dollars annually per motorist (Shoup 2005; “Parking Costs,” Litman 2009). They cause parking costs to be borne indirectly through mortgages and rents, retail prices, and taxes. People bear these costs regardless of how many vehicles they own and how much they drive. As a result, households that own fewer than average vehicles or drive less than average tend to pay more than the parking costs they impose, while those who own more than average vehicles or drive more than average tend to underpay. Since vehicle ownership and use tend to increase with income, these regulations and subsidies tend to be regressive, that is, they place a relatively large burden on lower-income people. Because parking requires paving large amounts of land, they tend to encourage sprawl and create less walkable communities. These changes reduce mobility and accessibility for non-drivers, and increase total transportation costs, which tends to be particularly harmful to disadvantaged people. These equity impacts are often overlooked when parking requirements are established. This is not because the people involved are immoral or uncaring, rather they generally have not considered all the equity impacts resulting from such decisions, particularly indirect and long-term impacts on other groups.5
5 Since decision-makers tend to be busy, middle-class professionals who drive automobiles, they are likely to perceive the benefits of generous parking requirements and are less sensitive to the unfair costs such requirements impose on non-drivers.
Evaluating Transportation Equity Victoria Transport Policy Institute
23
Transportation Cost Analysis
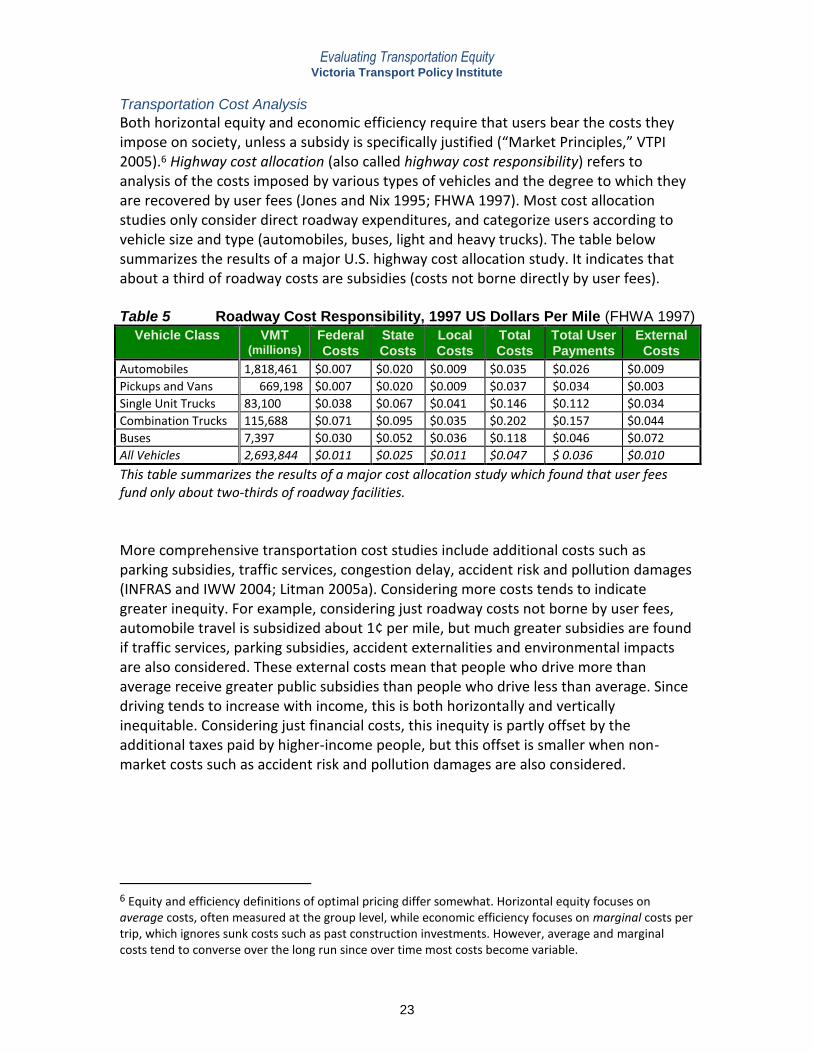
Both horizontal equity and economic efficiency require that users bear the costs they impose on society, unless a subsidy is specifically justified (“Market Principles,” VTPI 2005).6 Highway cost allocation (also called highway cost responsibility) refers to analysis of the costs imposed by various types of vehicles and the degree to which they are recovered by user fees (Jones and Nix 1995; FHWA 1997). Most cost allocation studies only consider direct roadway expenditures, and categorize users according to vehicle size and type (automobiles, buses, light and heavy trucks). The table below summarizes the results of a major U.S. highway cost allocation study. It indicates that about a third of roadway costs are subsidies (costs not borne directly by user fees). Table 5 Roadway Cost Responsibility, 1997 US Dollars Per Mile (FHWA 1997)
Vehicle Class VMT (millions)
Federal
Costs
State
Costs
Local
Costs
Total
Costs
Total User
Payments
External
Costs
Automobiles 1,818,461 $0.007 $0.020 $0.009 $0.035 $0.026 $0.009
Pickups and Vans 669,198 $0.007 $0.020 $0.009 $0.037 $0.034 $0.003
Single Unit Trucks 83,100 $0.038 $0.067 $0.041 $0.146 $0.112 $0.034
Combination Trucks 115,688 $0.071 $0.095 $0.035 $0.202 $0.157 $0.044
Buses 7,397 $0.030 $0.052 $0.036 $0.118 $0.046 $0.072
All Vehicles 2,693,844 $0.011 $0.025 $0.011 $0.047 $ 0.036 $0.010
This table summarizes the results of a major cost allocation study which found that user fees fund only about two-thirds of roadway facilities.
More comprehensive transportation cost studies include additional costs such as parking subsidies, traffic services, congestion delay, accident risk and pollution damages (INFRAS and IWW 2004; Litman 2005a). Considering more costs tends to indicate greater inequity. For example, considering just roadway costs not borne by user fees, automobile travel is subsidized about 1¢ per mile, but much greater subsidies are found if traffic services, parking subsidies, accident externalities and environmental impacts are also considered. These external costs mean that people who drive more than average receive greater public subsidies than people who drive less than average. Since driving tends to increase with income, this is both horizontally and vertically inequitable. Considering just financial costs, this inequity is partly offset by the additional taxes paid by higher-income people, but this offset is smaller when non-market costs such as accident risk and pollution damages are also considered.
6 Equity and efficiency definitions of optimal pricing differ somewhat. Horizontal equity focuses on average costs, often measured at the group level, while economic efficiency focuses on marginal costs per trip, which ignores sunk costs such as past construction investments. However, average and marginal costs tend to converse over the long run since over time most costs become variable.

Evaluating Transportation Equity Victoria Transport Policy Institute
24
Transportation Cost Burdens
Transportation is a major financial burden to many consumers, particularly for lower-income households. Figure 1 illustrates transport expenditures relative to total household income by income class. The portion of household income devoted to transport declines with annual income, so these costs are regressive.7 Figure 1 Portion of Household Income Spent on Transport (BLS 2000)
Transportation expenditures are highest as a portion of net (after tax) income for lower-income households, indicating that transportation costs are regressive.
Households that own a motor vehicle tend to spend far more of their income on transportation then zero-vehicle households, as illustrated in Figure 2. Figure 2 Portion of Household Income Devoted to Transport (BLS 2003)8
Transport costs tend to be regressive for vehicle-owning households, but not zero-vehicle households.
7 Equity impacts can also be evaluated with respect to expenditures rather than income. Expenditures are less volatile and include other types of wealth such as savings and benefits such as foodstamps. 8 This figure assumes that all vehicle costs are borne by vehicle-owing households and all public transport costs are borne by zero-vehicle households. This is not exactly accurate since vehicle-owning households do use public transport and zero-vehicle households pay some vehicle expenses, but is consistent with other research showing much lower transport expenditures in vehicle-owning than zero-vehicle households.

Evaluating Transportation Equity Victoria Transport Policy Institute
25
This financial burden is significantly affected by the type of transport system in an area. Low-income residents of automobile-dependent communities tend to spend much more of their income on transport than residents of communities with more diverse, multi-modal transport systems.9 This suggests that automobile dependency is regressive, and that policies and programs that improve travel options tend to be progressive (Frumkin, Frank and Jackson 2004). The consumer costs and regressivity of automobile transport are even greater than these figures indicate when indirect costs are also considered, particularly residential parking, which averages about 10% of housing costs and more for lower-priced, urban housing (Jia and Wach 1998). High parking costs reduce housing affordability, imposing additional burdens on lower-income households, which are often forced to choose between suburban housing with lower rents but higher transportation costs, and more costly urban housing with lower transportation costs. Although automobiles are expensive and their costs are regressive, studies indicate that vehicle ownership can be an important contribution to helping disadvantaged people obtain and maintain employment (Sawicki and Moody 2001; Smart and Klein 2015). This has several equity implications. It suggests that strategies that help poor people obtain access to automobiles may provide equity benefits, for example, as part of welfare-to-work programs. Carsharing and other vehicle rental services, special vehicle and insurance purchase loan programs, and Pay-As-You-Drive insurance can help some disadvantaged people increase their mobility and economic opportunities (VTPI 2005). Because driving is costly, regressive and difficult (particularly for some disadvantaged people, such as people with disabilities and immigrants who do not speak English), automobile-oriented solutions create additional equity problems. Cheap automobiles affordable to poor people tend to be unreliable, and are sometimes unsafe. Lower-income drivers often share vehicles with other household members. Even poor people who own an automobile often rely somewhat on other modes. As a result, disadvantaged people tend to benefit from a more diverse transport system. In other words, disadvantaged people may benefit from policies that help them drive, but they can benefit even more overall from policies and programs that increase total travel options. Similarly, land use strategies that improve community accessibility, such as locating affordable housing, public services and jobs in more accessible, multi-modal locations provides equity benefits by reducing cost burdens on disadvantaged households (“Location Efficient Development,” VTPI 2005).
9 For example, households in communities with high quality transit systems spend a smaller portion of their income on transport than residents of more automobile dependent communities (Litman, 2004).
Evaluating Transportation Equity Victoria Transport Policy Institute
26
Traffic Impacts
Vehicle traffic impacts can have significant equity impacts. For example, the congestion impacts that motor vehicles impose on other road users is horizontally inequitable to the degree that higher-occupant vehicle (carpools, vanpools and buses) passengers are delayed by congestion, although they use less road space and so impose less delay on others per passenger-mile. Similarly, motor vehicle use imposed delay and accident risk on pedestrians and cyclists, and noise and air pollution on nearby residents. Horizontal equity therefore suggests that a bus carrying fifty passengers should be able to use up to fifty times as much road space as a car carrying one passenger, that pedestrians and cyclists should be protected from risks imposed by motorists, and that people who seldom or never use automobiles should avoid subsidizing motorists parking facilities. Some traffic impacts, such as congestion delay and accident risk, can be monetized (measured in monetary units) for economic evaluation (Litman 2009). However, adjustments may be needed for equity evaluation. For example, most monetized congestion cost estimates only measure motor vehicle traffic impacts, effects on nonmotorized travel are usually ignored, although they are often significant compared with costs that are considered, particularly in urban areas (“Barrier Effects,” Litman 2009). They represent a horizontal inequity (motorists impose far more delay and risk on nonmotorized travelers than nonmotorized travelers impose on motorists), and to the degree that people who are transportation disadvantaged drive less and rely more on nonmotorized modes, this represents a vertical inequity. Described in a more positive way, current evaluation practices tend to underestimate the full benefits and equity impacts of strategies that reduce vehicle traffic and improve nonmotorized travel conditions because they ignore benefits from improved nonmotorized travel, which are particularly important to many disadvantaged people. Road space allocation and traffic management decision have various, sometimes overlooked distributional impacts. For example, traffic calming tends to reduce automobile traffic speeds while improving safety for motorist and nonmotorists, and neighborhood livability (Bellefleur 2013). HOV priority strategies benefit rideshare and transit passengers, and motorists if they reduce traffic congestion (“HOV Priority,” VTPI 2005). Bicycle lanes benefit cyclists and motorists to the degree that they reduce conflicts. Parking regulations, such as parking duration limits, benefit some users, trips and businesses at the expense of others. Special analysis may be justified to determine whether planning decisions violate environmental justice principles. For example, geographic analysis can help determine whether lower-income and minority communities contain an excessive portion of undesirable transportation facilities such as major highways and freight terminals. Special programs may be justified to clean up brownfields, insure that regional transport facilities meet local community needs, mitigate traffic impacts, and compensate for external costs imposed on disadvantaged populations.

Evaluating Transportation Equity Victoria Transport Policy Institute
27
Planning Biases and Distortions
Current planning practices contain biases and distortions that are both horizontally inequitable (they favor one mode or user over others), and vertically inequitable (they tend to harm disadvantaged people). Examples are described below (Beimborn and Puentes 2003; Litman 2003b).
Emphasis on mobility rather than accessibility. Conventional planning measures mobility rather than accessibility, which favors motorized modes, and undervalues alternative modes and land use policies to increase accessibility.
Undervaluation of nonmotorized travel. Conventional travel surveys tend to undercount short trips, non-commute trips, travel by children and walking links of motorized trips, which undervalues nonmotorized travel. This skews planning and funding toward motorized modes, reducing transport quality for nondrivers.
Incomplete evaluation. Conventional economic evaluation tends to overlook many indirect costs of roadway capacity expansion and the full benefits of alternative modes and mobility management solutions (Litman 2009).
Fragmented and incremental planning, that allows individual decisions that contradict strategic planning objectives. For example, it is common for planning agencies to impose generous parking requirements on development, even in areas that want to encourage infill development, more compact development, and use of alternative modes.
More funding and lower local matching requirements for roadway and parking facilities than for other modes. This encourages decision-makers to define transportation problems as highway problems and underinvest in alternative modes and management solutions.
Automobile underpricing, including free parking, fixed insurance and registration fees, general taxes funding roadways, and lack of congestion pricing. These market distortions increase vehicle ownership and use, and therefore reduce development of other modes.
Environmental injustice. There is evidence that lower income and minority neighborhoods bear more than their share of undesirable transport facilities, and receive less than a fair share of transport investments and services (Bullard and Johnson 1997).
Land use policies that favor sprawl, such as generous parking and setback requirements, density restrictions, and single-use zoning. This leads to more automobile-dependent communities that provide poor access for non-drivers.
Although individually these biases and distortions may seem modest and justified, their impacts are cumulative, resulting in large total subsidies for automobile travel and significant harm to society. For example, parking subsidies total hundreds of dollars annually per vehicle (Shoup 2005), far higher than public subsidies per transit rider. Automobile travel also imposes costs for local road and traffic services, congestion, accident costs and environmental damages worth hundreds of dollars annually per

Evaluating Transportation Equity Victoria Transport Policy Institute
28
vehicle (“Transportation Costs,” VTPI 2005). These impacts are widely dispersed through the economy, incorporated into taxes, rents and retail prices, and so are generally ignored in individual planning decisions. By reducing transport system diversity and land use accessibility, these distortions harm disadvantaged people, which is vertically inequitable. Critical Evaluation of Equity Objectives in Regional Transprtation Plans
Manaugh, Badami and El-Geneidy (2015) evaluate how social equity is conceptualized, operationalized, and prioritized in 18 urban region transportation plans in North America. They critically analyze the quality of the related objectives, how meaningfully their achievement is assessed through the choice of performance measures or indicators, and their prioritization relative to other objectives. They find e good examples of social equity objectives and measures in several plans, but social equity goals and objectives are in many cases not translated into clearly specified objectives, and appropriate measures for assessing their achievement in a meaningful, disaggregated manner are often lacking. In general, there is a stronger focus on the local environment (and congestion reduction) than on social equity in the plans. They discussion considerations for generating objectives and measures for better integrating social equity into urban transportation plans. Economic Opportunity and Mobility
Economic opportunity refers to the education, employment and consumer opportunities available to residents, particularly those who are physically, economically or socially disadvantaged. Economic mobility refers to the chance that a child will be more economically successful than their parents. Numerous studies suggest that more compact, mixed and multimodal development tends to increase poor residents’ economic opportunity by improving access to education, employment and positive role models (Bouchard 2015; Levy, McDade and Dumlao 2010). This is particularly important for those who lack a driver’s license or cars (Kneebone and Holmes 2015). Lens and Monkkonen (2016) find that regulations that limit infill development increase economic segregation. Using data from Harvard Univesity’s Equality of Opportunity Project (Chetty, et. al. 2014) data, Ewing and Hamidi (2014) found that each 10% increase in their Smart Growth index is associated with a 4.1% increase in residents’ upward mobility (probability of children born in the lowest income quintile reaching the top quintile by age 30). Ewing, et al. (2016) found that Smart Growth increases economic mobility (the chance that children born in low-income families will become economically successful as adults); doubling their compactness index increases the probability that a child born to a family in the bottom income quintile will reach the top quintile by age 30 by about 41%. Corak (2017) found higher rates of economic mobility in Canadian urban areas compared with rural areas, although some suburbs, those with large immigrant populations, have higher rates of mobility than their cities.
Evaluating Transportation Equity Victoria Transport Policy Institute
29
Using different research methods, Chyn (2016) found that children who left concentrated poverty neighborhoods are 9% (4 percentage points) more likely to be employed as adults relative to their non-displaced peers, and have $602 higher average annual earnings – an 16% increase relative to their counterparts who remained in concentrated poverty. Similarly, Talen and Koschinsky (2013) found strong correlations between neighborhood accessibility (based on WalkScores) and high income mobility (the chance that child in a low-income household will eventually earn a high income). They found that a child born to the bottom fifth income group in a walkable neighborhood has a much better chance of becoming financially prosperous than a poor child born in a non-accessible area. Hsieh and Moretti (2015 and 2017) analyzed the economic impacts of restrictions on development density in Boston, New York, Seattle, San Francisco and Washington DC. They estimate that allowing more affordable infill development in these highly productive cities could increase aggregate national economic output by 13%, more than $1 trillion annually, equivalent to several thousand dollars per worker, and improve economic opportunity to economically disadvantaged workers. Some studies indicate that economically disadvantaged workers (such as former welfare recipients) tend to work and earn more if they have an automobile (Pendall, et al. 2014; Smart and Klein 2015; Wachs and Taylor 1998), and have better access to basic services such as medical care and shopping. This leads some people to conclude that increased vehicle ownership increases social equity, that vehicle subsidies (subsidized vehicles, low fuel prices, unpriced roads and parking, etc.) help achieve equity objectives, and efforts to reduce vehicle travel are regressive (Pisarski 2009). However, the issue complex. Most studies showing positive associations between cars and economic mobility were performed in automobile-dependent regions, such as Los Angeles, where non-drivers are particularly disadvantaged. Other studies indicate that high quality public transit also increases labor participation (CTS 2010; Sanchez, Shen and Peng 2004), even in automobile-oriented cities (Yi 2006). Analysis by Gao and Johnston (2009) indicates that transit improvements provide greater total benefits to all income groups than subsidizing automobiles for lower-income groups. Automobile subsidies only benefit the subset of disadvantaged people who can drive. Because alternative modes experience strong scale economies (sometimes called the Mohring Effect), and because increased motor vehicle traffic creates barriers to walking and cycling, policies that encourage increased automobile travel tend to harm non-drivers overall. For example, if a large employment center has 1,000 transit commuters, half of whom cannot drive and half of whom can drive but lack an automobile, and a new program subsidized vehicle purcheses so 500 daily transit commuters shifted to

Evaluating Transportation Equity Victoria Transport Policy Institute
30
driving, transit service to that destination may decline significantly due to declining demand, so the remaining transit commuters are worse off. Automobiles are costly. Low income motorists must typically spend $300 to $500 per month to own and operate a vehicle, including sometimes large unexpected expenses due to vehicle failures, accidents and traffic citations. Their insurance premiums tend to be high, and the older vehicles they own tend to be unreliable, imposing large repair costs. As a result, much of the additional income provided by automobile ownership must be spent on vehicles, reducing net gains. A sophisticated panel study by Smart and Klein (2015) found that after shifting from being carless to owning one car, a typical low-income family earned approximately $2,300 more but spent more than $4,100 annually to own and maintain that vehicle, so the incremental income was insufficient to pay the additional costs. Automobile travel also tends to increase users’ accident risks and health problems associated with sedentary living (APHA 2010; Lachapelle, et al. 2011), and increases external costs imposed on local communities including traffic congestion, road and parking facility costs, accident risk, and pollution emissions. An automobile dependent transportation system is inherently inefficient and inequitable. Subsidies intended to help lower-income people own and operate automobiles treat one symptom but exacerbate other problems. Creating a more diverse and efficient transport system addresses the root of the problem, which provides the greatest total benefits to society, including increased social equity by improving mobility and accessibility for physically, economically and socially disadvantaged people. This analysis indicates that although automobile use can benefit some economically disadvantaged people, in fact, some jobs require an automobile, other accessibility improvement strategies are often more cost effective and beneficial overall. These include improved walking and cycling conditions, improved rideshare and public transit services, carsharing, distance-based vehicle insurance and registration fees, and more affordable housing in accessible locations (Sullivan 2003; Litman 2010). These solutions tend to benefit all residents, and especially people who for any reason cannot or should not drive, and leave commuters with more net income compared with automobile ownership.
Evaluating Transportation Equity Victoria Transport Policy Institute
31
Transportation Pricing Reforms
Horizontal equity requires that as much as possible, consumers pay the costs imposed by their activities. Reforms such as higher fuel tax, road and parking pricing, and distance-based fees, can increase equity by making prices more accurately reflect the costs imposed by a particular trip, reducing cross-subsidies (“Pricing Evaluation” VTPI 2005). There is often debate over the equity of road and parking pricing, particularly when fees are introduced on previously unpriced facilities. New fees are often criticized on horizontal equity grounds, since most roads and parking facilities are currently unpriced. Motorists ask, “Why should I pay while other motorists do not?” But this argument can be reversed: unpriced roads and parking can be considered unfair if motorists must pay elsewhere. Critics argue that road pricing represents “double taxation” since they already pay fuel taxes that fund roads. However, road and parking pricing is usually applied in areas where the costs of providing facilities is particularly high, such as in city centers and new highways. Such fees can be considered a surcharge for these higher-than-average costs. Pricing proponents emphasize that motorists receive benefits, such as reduced traffic congestion, and that pricing is optional. For example, motorists may have a choice between free but congested highway lanes, and uncongested but priced lanes. Similarly, they may be able to choose between convenient but priced parking, and less convenient but free parking. This is called value pricing. Whether motorists have adequate alternatives is often an important issue in pricing equity analysis. Pricing reforms can also benefit disadvantaged people (increase vertical equity) if they reduce negative impacts on disadvantaged neighborhoods or improve travel options for non-drivers. For example, Kain (1994) predicts that congestion pricing can benefit lower income commuters and non-drivers overall by improving transit and rideshare services. Transportation price increases are often criticized as being regressive, since a particular fee represents a greater portion of income for lower-income people than for higher-income people. Overall equity impacts depend on how prices are structured, the quality of transport alternatives available (Golub 2010; Manville 2017; Schweitzer 2009), how revenues are used, and whether driving is considered a necessity or a luxury (Litman 1996; Rajé 2003; TRB 2011). If there are good alternatives, revenues are used to benefit the poor, and disadvantaged people are given discounts, price increases can be progressive overall. There is a long history of incorporating vertical equity objectives into transport pricing, with targeted discounts for lower-income people. Adam Smith (1976), a founder of modern economics, wrote that, “When the toll upon carriages of luxury coaches, post chaises, etc. is made somewhat higher in proportion to their weight than upon carriages of necessary use, such as carts, wagons, and the indolence and vanity of the rich is made to contribute in a very easy manner to the relief of the poor, by rendering cheaper the transportation of heavy goods to all the different parts of the country.”
Evaluating Transportation Equity Victoria Transport Policy Institute
32
Evaluating Transportation Equity Victoria Transport Policy Institute
33
Transportation Equity Spatial Analysis
The report, Equity Analysis of Land Use and Transport Plans Using an Integrated Spatial Model (Rodier, et al. 2010), used the PECAS (Production, Exchange, and Consumption Allocation) Model Activity Allocation Module to evaluate the equity effects of various land use and transport policies intended to reduce greenhouse gas emissions. It quantifies the distributions various transport and economic interactions, including wages, rents, productivity, and consumer surplus, for segments of households, labor, and industry. It evaluates the equity impacts of different transport and land development patterns. The results indicate that a more compact, multi-modal development tends to reduce travel costs, wages, and housing costs by increasing accessibility, providing both economic productivity and social equity benefits. Higher income households may be net losers, since their incomes are more dependent on reduced wages, they are less willing to switch to higher density dwellings, and they are more likely to own their own home. Dodson, et al. (2011) apply cluster analysis to a large regional household travel survey to identify the geographic distribution and travel activity of low socioeconomic status (SES) groups. The study used this information to develop a new integrated land use and transport accessibility model that can quantify the overall accessibility to goods and services for disadvantaged populations. District level census data (approximately 200 households) integrates with conventional transport models transport analysis zones. Climate Change Emission Reduction Equity
Lin (2008) evaluated the equity impacts of climate change policies, including the distribution of damages from climate change and other pollutants, and the distribution of benefits from emission reduction efforts (such as whether energy conservation programs provide incentives and jobs to low income and minority populations). She critiques emission reduction policies, such as cap-and-trade, feebates and road pricing in terms of their impacts on disadvantaged populations, and recommends specific design principles, such as insuring adequate alternative travel modes if congestion pricing or carbon taxes are implemented, and use of revenues in ways that benefits disadvantaged populations. Equitable VMT Reduction Strategies (Carlson and Howard 2010)
The report Impacts Of VMT Reduction Strategies On Selected Areas And Groups, sponsored by the Washington State Department of Transportation, investigated the equity impacts of the state’s vehicle miles travelled (VMT) reduction targets (18% reduction by 2020, 30% reduction by 2035, and 50% reduction by 2050), and ways to minimize negative equity impacts. It identified various VMT reduction strategies and evaluated their impacts on five groups and areas, including small businesses, low-income residents, farmworkers, distressed counties, and counties with more than half the land in federal or tribal ownership. It identified ways to implement VMT reductions with the most positive or least negative impacts on those groups.

Evaluating Transportation Equity Victoria Transport Policy Institute
34
Equitable Road Funding (Schweitzer and Taylor 2008)
Opponents of efficient road pricing, such as congestion tolls, often argue that low-income, urban residents will suffer if they must pay to use congested freeways. This contention, however, fails to consider (1) how much low-income residents already pay for transportation in taxes and fees, or (2) how much residents would pay for highway infrastructure under an alternative revenue-generating scheme, such as a sales tax. Schweitzer and Taylor compare the cost burden of road toll and a local option transportation sales tax. The analysis indicates that although the sales tax spreads the costs of transportation facilities across a large number of people, it redistributes about $3 million in revenues from less affluent residents to those with higher incomes. Low-income drivers individually save if they do not have to pay tolls, but low-income residents as a group pay more with sales taxes. Fairness in a Car Dependent Society (SDC 2011)
The report, Fairness in a Car Dependent Society, by the U.K. Sustainable Development Commission (SDC) analyzes the costs of car dependency and the distribution of these costs to various groups. While recognizing that car travel can provide significant benefits, it also imposes significant costs, which tend to be particularly burdensome to physically, economically or socially disadvantaged people. These groups tend to benefit least from automobile travel and dispersed development patterns, and face major costs from accident risks and pollution emissions, and reduced accessibility. This analysis concludes that a new approach to national transport policy is needed that better balances conflicting interests. This must recognize that transport planning decisions have significant indirect and external impacts, and so should consider effects on all members of society, not just motorists. It recommends that transport decision makers should adopt a transport hierarchy approach to ensure the most sustainable and fair transport solutions are prioritized:
1. Demand reduction for powered transport 2. Modal shift to more sustainable and space efficient modes 3. Efficiency improvements of existing modes 4. Capacity increases for powered transport (only when options 1-3 have been exhausted)
Right To Basic Transport (KOTI 2011)
Korea recognizes the right to basic transportation, which includes the right to move freely, conveniently and safely, the freedom to choose transport modes, the right to transport cargo, and the right to gain access to transport information regardless of economic, physical, social and regional barriers. It is a right based on the citizens’ basic rights stipulated in the Korean Constitution such as freedom of residence and movement, freedom of occupation, assurance regarding human dignity and worth. Korean planners are developing minimum service policies based on indices and criteria to implement these rights within practical resource constraints.
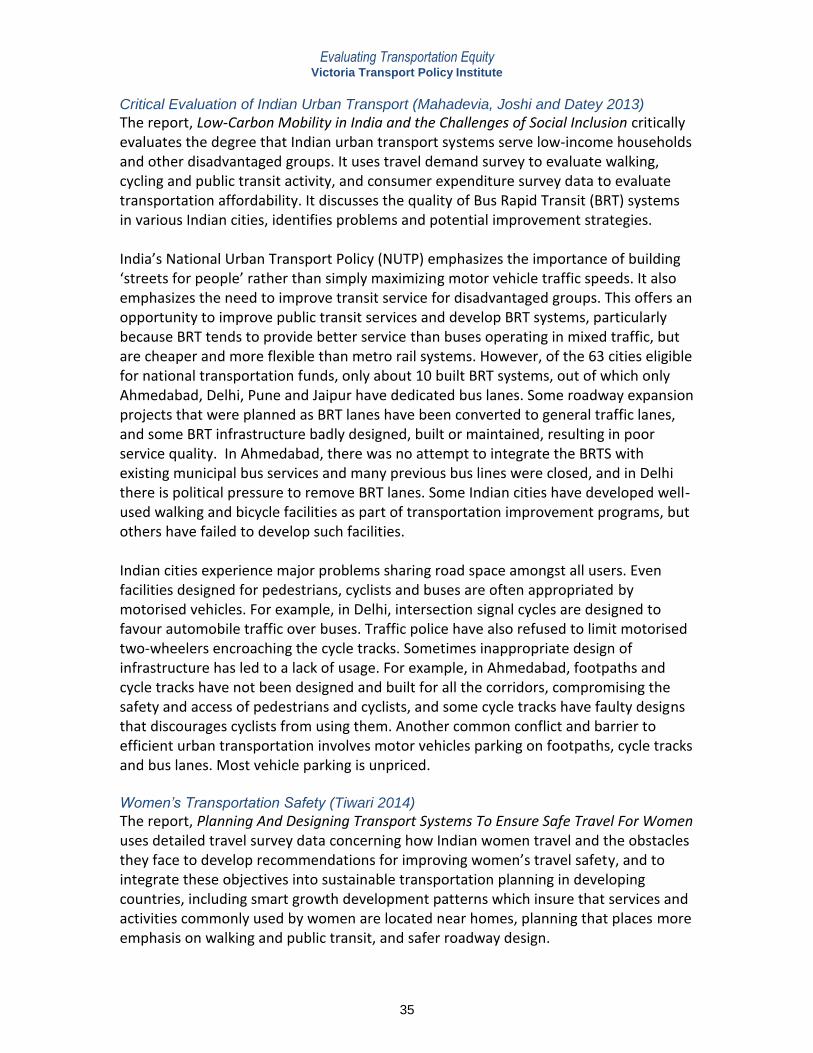
Evaluating Transportation Equity Victoria Transport Policy Institute
35
Critical Evaluation of Indian Urban Transport (Mahadevia, Joshi and Datey 2013)
The report, Low-Carbon Mobility in India and the Challenges of Social Inclusion critically evaluates the degree that Indian urban transport systems serve low-income households and other disadvantaged groups. It uses travel demand survey to evaluate walking, cycling and public transit activity, and consumer expenditure survey data to evaluate transportation affordability. It discusses the quality of Bus Rapid Transit (BRT) systems in various Indian cities, identifies problems and potential improvement strategies. India’s National Urban Transport Policy (NUTP) emphasizes the importance of building ‘streets for people’ rather than simply maximizing motor vehicle traffic speeds. It also emphasizes the need to improve transit service for disadvantaged groups. This offers an opportunity to improve public transit services and develop BRT systems, particularly because BRT tends to provide better service than buses operating in mixed traffic, but are cheaper and more flexible than metro rail systems. However, of the 63 cities eligible for national transportation funds, only about 10 built BRT systems, out of which only Ahmedabad, Delhi, Pune and Jaipur have dedicated bus lanes. Some roadway expansion projects that were planned as BRT lanes have been converted to general traffic lanes, and some BRT infrastructure badly designed, built or maintained, resulting in poor service quality. In Ahmedabad, there was no attempt to integrate the BRTS with existing municipal bus services and many previous bus lines were closed, and in Delhi there is political pressure to remove BRT lanes. Some Indian cities have developed well-used walking and bicycle facilities as part of transportation improvement programs, but others have failed to develop such facilities. Indian cities experience major problems sharing road space amongst all users. Even facilities designed for pedestrians, cyclists and buses are often appropriated by motorised vehicles. For example, in Delhi, intersection signal cycles are designed to favour automobile traffic over buses. Traffic police have also refused to limit motorised two-wheelers encroaching the cycle tracks. Sometimes inappropriate design of infrastructure has led to a lack of usage. For example, in Ahmedabad, footpaths and cycle tracks have not been designed and built for all the corridors, compromising the safety and access of pedestrians and cyclists, and some cycle tracks have faulty designs that discourages cyclists from using them. Another common conflict and barrier to efficient urban transportation involves motor vehicles parking on footpaths, cycle tracks and bus lanes. Most vehicle parking is unpriced. Women’s Transportation Safety (Tiwari 2014)
The report, Planning And Designing Transport Systems To Ensure Safe Travel For Women uses detailed travel survey data concerning how Indian women travel and the obstacles they face to develop recommendations for improving women’s travel safety, and to integrate these objectives into sustainable transportation planning in developing countries, including smart growth development patterns which insure that services and activities commonly used by women are located near homes, planning that places more emphasis on walking and public transit, and safer roadway design.
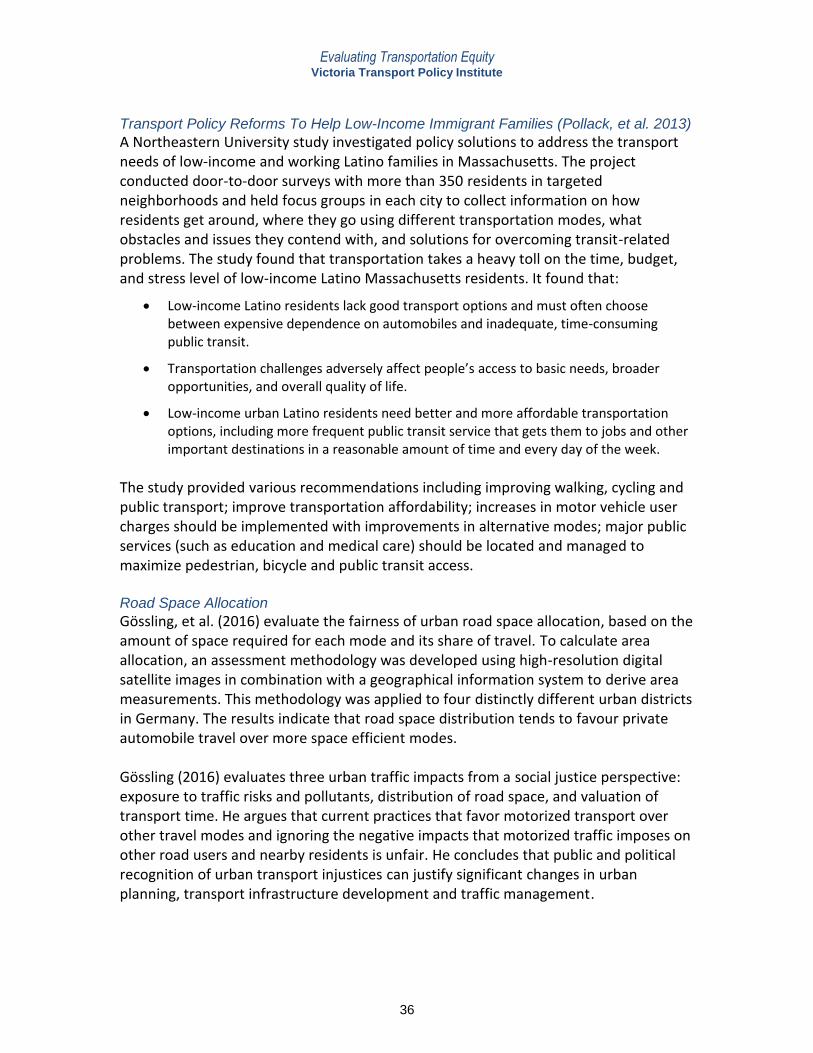
Evaluating Transportation Equity Victoria Transport Policy Institute
36
Transport Policy Reforms To Help Low-Income Immigrant Families (Pollack, et al. 2013)
A Northeastern University study investigated policy solutions to address the transport needs of low-income and working Latino families in Massachusetts. The project conducted door-to-door surveys with more than 350 residents in targeted neighborhoods and held focus groups in each city to collect information on how residents get around, where they go using different transportation modes, what obstacles and issues they contend with, and solutions for overcoming transit-related problems. The study found that transportation takes a heavy toll on the time, budget, and stress level of low-income Latino Massachusetts residents. It found that:
Low-income Latino residents lack good transport options and must often choose between expensive dependence on automobiles and inadequate, time-consuming public transit.
Transportation challenges adversely affect people’s access to basic needs, broader opportunities, and overall quality of life.
Low-income urban Latino residents need better and more affordable transportation options, including more frequent public transit service that gets them to jobs and other important destinations in a reasonable amount of time and every day of the week.
The study provided various recommendations including improving walking, cycling and public transport; improve transportation affordability; increases in motor vehicle user charges should be implemented with improvements in alternative modes; major public services (such as education and medical care) should be located and managed to maximize pedestrian, bicycle and public transit access. Road Space Allocation
Gössling, et al. (2016) evaluate the fairness of urban road space allocation, based on the amount of space required for each mode and its share of travel. To calculate area allocation, an assessment methodology was developed using high-resolution digital satellite images in combination with a geographical information system to derive area measurements. This methodology was applied to four distinctly different urban districts in Germany. The results indicate that road space distribution tends to favour private automobile travel over more space efficient modes. Gössling (2016) evaluates three urban traffic impacts from a social justice perspective: exposure to traffic risks and pollutants, distribution of road space, and valuation of transport time. He argues that current practices that favor motorized transport over other travel modes and ignoring the negative impacts that motorized traffic imposes on other road users and nearby residents is unfair. He concludes that public and political recognition of urban transport injustices can justify significant changes in urban planning, transport infrastructure development and traffic management.

Evaluating Transportation Equity Victoria Transport Policy Institute
37
Active Transport (Walking and Cycling) Planning for Equity
The U.S. Federal Highway Administration report, Pursuing Equity in Pedestrian and Bicycle Planning (Sandt, Combs and Cohn 2016) identifies practical ways to help achieve social equity objectives by examining the travel demands of traditionally underserved populations (low income, minority, older adults, limited English proficiency (LEP) and people with disabilities), and ensuring that pedestrian and cycling planning decisions serve those demands. The research finds:
Many children, older adults, and people with disabilities are unable to drive and so tend to rely on nonmotorized modes. These groups are often less able to take advantage of walking and cycling. For example, immigrants and those with language barriers are more likely to travel by bicycle but less likely to practice safe bicycling techniques (such as riding with traffic, using lights, and wearing helmets and reflective clothing), and are often forced to ride along roads lacking safe, accessible pedestrian and bicycle facilities.
Many underserved population groups live where public transit services are limited.
Many people in the U.S., in particular traditionally underserved populations, suffer from problems associated with inactivity, many of which could be addressed through improved access to safe walking and wheeling facilities.
Women and minorities feel significantly less safe traveling by bicycle than non-minority males in the U.S. A majority of women and minorities agreed or strongly agreed that, given more supportive infrastructure (e.g., sidewalks, bike lanes, and separated facilities), they would be much more likely to bicycle for transportation.
Individuals with limited travel options (including nonmotorized modes) travel less overall, make fewer trips for shopping and socializing; have a harder time applying for and accepting employment; are less likely to access healthy foods, health care, and educational resources; and are more likely to experience social isolation.
This and other research indicate that pedestrian and bicycle improvements can help reduce transportation inequities on underserved communities (Lee, Sener and Jones (2016). These studies identify specific, practical ways to make pedestrian and bicycle planning more responsive to underserved population travel demands, including specific objectives to support social equity goals, new tools for understanding how walking and cycling conditions affect disadvantaged populations’ access (such as the number of jobs accessible to disadvantaged groups within an acceptable commute travel time, and how planning decisions would affect this), and more involvement of underserved populations in the planning process. The FHWA report includes examples and case studies of pedestrian and bicycle planning that applies advanced equity analysis. Tools for Measuring Multi-modal Accessibility
Several new tools use various approaches to measure multi-modal accessibility, taking into account the time and money costs required to reach basic services and activities. This is important for equity analysis because many physically, economically and socially disadvantaged people are limited in their automobile travel and so rely on walking, cycling, ridesharing and public transit. These tools can help quantify the obstacles facing

Evaluating Transportation Equity Victoria Transport Policy Institute
38
disadvantaged populations, and the impacts that planning decisions will have on their accessibility. These tools include:
Access Across America (http://ao.umn.edu/research/america) measures accessibility to jobs via various modes of transportation in major metropolitan areas across the United States.
Accessibility Observatory (http://ao.umn.edu) is a leading resource for the research and application of accessibility-based transportation system evaluation.
Access To Jobs Mapping System (http://fragile-success.rpa.org/maps/jobs.html) is an interactive system that quantifies the number of suitable jobs available in a given commute travel time by various modes.
COST Accessibility Instruments (www.accessibilityplanning.eu) is developing practical tools for accessibility planning.
Opportunity Score (https://labs.redfin.com/opportunity-score) ranks locations in 350 U.S. cities based on the number of jobs that can be accessed within a 30-minute walk or transit ride.
Revision (http://revision.lewis.ucla.edu/?mc_cid=6d7654de44&mc_eid=b8e4b2304e) is a regional mapping and analysis program that integrates a range of public and private data for sustainable communities planning and trend visualization.
Smart Location Mapping (www.epa.gov/smartgrowth/smart-location-mapping) provides interactive maps and data for measuring location efficiency, including the effects of the built environment on per capita vehicle travel, and methods for measuring access to jobs and workers by public transportation.
Sugar Access (www.citilabs.com/software/sugar/sugar-access) is a GIS tool that can evaluate the quality of accessibility to various services and activities in a particular community.
Travel Time and Housing Price Maps (www.mysociety.org/2007/more-travel-maps/morehousing). This interactive mapping system shows both travel times to the city center and housing costs for various locations in London.
Toolbox for Regional Policy Analysis Website (www.fhwa.dot.gov/planning/toolbox/index.htm) by the US Federal Highway Administration, describes analytical methods for evaluating regional economic, social and environmental impacts of various transportation and land use policies.
Urban Accessibility Explorer (http://urbanaccessibility.com) is an easy-to-use mapping system that measures the number of jobs, stores, schools and parks that can be reached by residents of a specified neighborhood within a given travel time, by a particular mode and time of day in the Chicago region.
Automobile Ownership and Travel By Low-Income Households
Analyzing the 2009 U.S. National Household Travel Survey, Blumenberg and Pierce (2012 and 2014) identified factors that affect vehicle ownership and travel, including income, age, gender, race-ethnicity, employment status (student, worker, retiree, homemaker), children in household, geographic location (density and urban region), vehicle insurance costs and vehicle ownership (as it affects personal travel). They found that low-income households are less likely to own cars and more likely to travel by alternative modes. As household incomes rise from low to medium levels, vehicle ownership and travel tend to increase proportionately faster than incomes, particularly households with workers and children, and decline with land use density. The authors conclude that these findings justify public policies that help lower-income households located in automobile-dependent communities own vehicles.
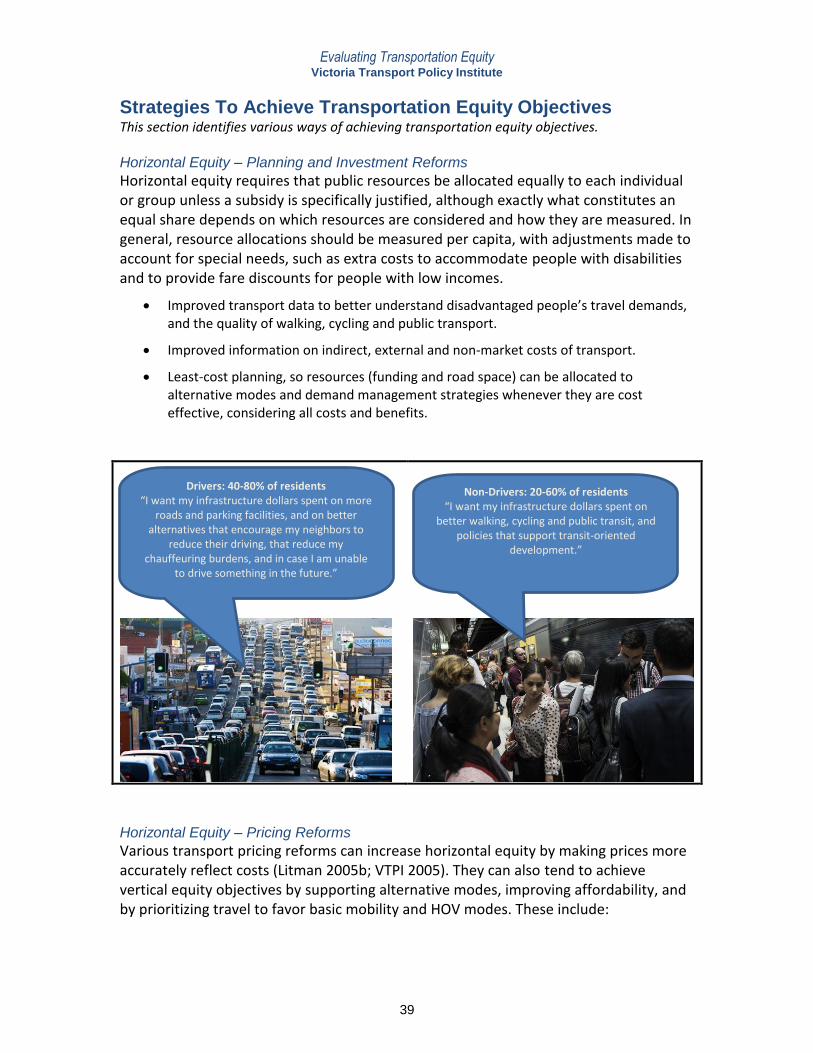
Evaluating Transportation Equity Victoria Transport Policy Institute
39
Strategies To Achieve Transportation Equity Objectives This section identifies various ways of achieving transportation equity objectives. Horizontal Equity – Planning and Investment Reforms
Horizontal equity requires that public resources be allocated equally to each individual or group unless a subsidy is specifically justified, although exactly what constitutes an equal share depends on which resources are considered and how they are measured. In general, resource allocations should be measured per capita, with adjustments made to account for special needs, such as extra costs to accommodate people with disabilities and to provide fare discounts for people with low incomes.
Improved transport data to better understand disadvantaged people’s travel demands, and the quality of walking, cycling and public transport.
Improved information on indirect, external and non-market costs of transport.
Least-cost planning, so resources (funding and road space) can be allocated to alternative modes and demand management strategies whenever they are cost effective, considering all costs and benefits.
Horizontal Equity – Pricing Reforms
Various transport pricing reforms can increase horizontal equity by making prices more accurately reflect costs (Litman 2005b; VTPI 2005). They can also tend to achieve vertical equity objectives by supporting alternative modes, improving affordability, and by prioritizing travel to favor basic mobility and HOV modes. These include:
Drivers: 40-80% of residents “I want my infrastructure dollars spent on more
roads and parking facilities, and on better alternatives that encourage my neighbors to
reduce their driving, that reduce my chauffeuring burdens, and in case I am unable
to drive something in the future.”
Non-Drivers: 20-60% of residents “I want my infrastructure dollars spent on
better walking, cycling and public transit, and policies that support transit-oriented
development.”

Evaluating Transportation Equity Victoria Transport Policy Institute
40
Fuller cost recovery – User fees such as fuel taxes and tolls increase to reflect costs imposed. For example, fuel taxes could be increased to fund a greater portion of roadway costs, and more parking facilities should be priced.
Weight-distance fees – Fees that reflect the roadway costs imposed by a vehicle class.
Road Pricing – Charge directly for road use, with rates vary to reflect how roadway and congestion costs vary by location, time and vehicle type.
Parking cash out – Allow commuters to choose cash instead of subsidized parking.
Parking pricing – Vary rates to reflect how costs vary by location, time and vehicle type.
Distance-based vehicle insurance and registration fees, which converts fixed costs into variable costs with respect to annual vehicle travel.
Environmental taxes and emission fees. Some economists recommend special fees based on the environmental imposed by an activity, such as vehicle air pollution emissions.
Ramjerdi (2006) evaluates the vertical equity impacts of various mobility management transport policies in Oslo, Norway, including road pricing, parking pricing and public transit service improvements. The analysis employs a range of equity measures reflecting different assumptions and perspectives, including the Gini coefficient and the Lorenz curve, which are measures of inequity. Bandegani and Akbarzadeh (2016) evaluated the horizontal equity of developed a distance-based public transit fare structure. Fare elasticity of demand and probability distribution of transit passenger trip lengths were investigated through a field survey. Although mainly used in the measurement of inequality in income or wealth, the Gini index and the recovery ratio (revenue to cost for each transit passenger) in evaluating equity were used in this study. Results show that the Gini index would decrease from 0.38 to 0.17 after switching from a flat to a distance-based structure. Assessment of the ratio of revenue per mile over cost per mile (RPM/CPM) shows that switching to a distance-based fare structure makes the RPM/CPM curve significantly flatter, which indicates more similarity among passengers. As a byproduct, the amount of change in demand and revenue of the transit system also were formulated. Transit Generalized Cost Equity Modelling
El-Geneidy, et al. (2016) developed new transit accessibility measures based on generalized costs (both travel time and transit fares). Those measures are used to compare the level of transit accessibility between residents of socially disadvantaged and other neighborhoods in Montreal, Canada. This indicates that the number of jobs that can be reached within a given time and money budget is smaller than indicated by models that only consider travel time. However, residents of socially disadvantaged areas tend to have more equitable public transit job access than in most other neighborhoods, as reflected in smaller decreases in accessibility when fare costs are
Evaluating Transportation Equity Victoria Transport Policy Institute
41
included. The authors argue that generating new measures that combine travel time and transit fares is a more accurate indicator of overall accessibility, that can be easily communicated by planners and engineers to policy makers and the public, since it translates accessibility measures to a dollar value. Gender Equity
The study, Building Sustainable Mobility for Women (FIA 2017), examined women’s public transport experience in cities in South Africa, Ecuador, Argentina and Chile. The associated ‘Ella se mueve segura’ (‘Women move safely’) project identified four reasons why public transport personal security is particularly important for women: 1. Women need safe public transport to support economic development. Women make a vital and growing economic contribution globally. Improving women’s participation in the work force in Latin America could add an additional 34% to the region's GDP, and that their role in the Latin American so called ‘economic miracle’ with average growth rates of around 5% between 2002 and 2008 was crucial. 2. Women need safe public transport options to make good health and education choices for their families & communities. Women shape communities. They access healthcare for themselves and their families which is essential to ensure healthy communities, and they choose the education which will enable children to grow to be skilled and fulfilled people. They will miss health checks, and use the easiest and not necessarily the best schools if transport links are poor. 3. Women need to experience safe public transport options because unless they feel safe on public transport they won’t recommend it to their families, and we won’t make any progress. Linked to this women also influence the transport choices of the next generation of transport users. They share their experiences of sustainable transport options with their families, and like anyone they will only recommend what they like. 4. Women have a right to be safe. Finally, and most fundamentally; women have personal rights to be safe, to be respected, and to achieve their potential, yet currently traditional systems of public transportation delivery and management ‘are a nightmare for women everywhere’ as the New York Post recently opined. Creating safe public spaces is challenging, but it is vital that this is taken forward. Public transport options which address women’s concerns are at the heart of our ability to achieve sustainable development and sustainable mobility. A system which fails women, undermines ambitions for sustainable mobility and sustainable development.

Evaluating Transportation Equity Victoria Transport Policy Institute
42
Vertical Equity – Progressive With Respect To Income
There are many ways to increase transport system affordability and insure that transport policies and program are progressive with respect to income:
Transport policy and planning decisions should favor affordable modes (walking, cycling, public transit, ridesharing, carsharing and delivery services). This includes improved sidewalks and crosswalks, traffic calming and traffic speed control, HOV and bus lanes, and other transit service improvements.
Insure public transit affordability to lower-income users (Toronto Public Health 2013).
Support transportation demand management strategies that increase affordability including improvements to lower-priced modes, reduced and more flexible parking requirements, parking cash out (commuters offered subsidized parking but don’t drive can choose instead to receive the cash equivalent), parking unbundling (parking is rented separately from housing, so residents are not forced to pay for parking they do not need).
Support policies that make automobile ownership more affordable, including targeted grants, loans and distance-based vehicle insurance (Blumenberg and Pierce 2012)
Support carsharing (vehicle rental services designed to provide an affordable alternative to private vehicle ownership), pay-as-you-drive insurance (insurance and registration fees based directly on how much a vehicle is driven), and other programs and pricing options that make occasional automobile use more affordable.
Price transportation to favor economically, socially and physically disadvantaged people (Iacono and Lari 2006). For example, transit services, road tolls and other services can have discounts for people who qualify for low-income benefits. Each household can receive a limited number of free road toll or parking vouchers.
Support development of affordable-accessible housing (affordable housing in accessible, multi-modal communities).
Vertical Equity – Benefiting Transportation Disadvantaged People
Vertical equity (also called distributional justice) considers the quality of transportation services between advantaged and disadvantaged groups. Because disadvantaged people tend to drive less than average and often rely on non-automobile modes, anything that increases transportation system diversity and land use accessibility tends to increase vertical equity (“Transportation Diversity,” VTPI 2005). Conversely, anything that increases automobile dependency tends to contradict vertical equity objectives by reducing travel options for non-drivers and increasing transportation costs (“Automobile Dependency,” VTPI 2005). As a result, planning and market distortions that favor automobile travel, described earlier in this report, tend to reduce vertical equity, while mobility management and smart growth strategies tend to increase vertical equity by creating more diverse and accessible transport systems.

Evaluating Transportation Equity Victoria Transport Policy Institute
43
Certain modes and services are particularly important to transport disadvantaged people, including walking, ridesharing, public transportation, taxi, special mobility services, carsharing, public Internet services, and delivery services – they can be considered inclusive and affordable modes. It is important to provide good connections between these modes and destinations, for example, insuring that there are good walking and cycling conditions around transit stops, that transportation terminals accommodate people with disabilities, and that public transit serves airports. Because users have few alternatives, Nguyen-Hoanga and Yeung (2010) find that paratransit service benefits far exceed their costs. Creger, Espino and Sanchez (2018) proposes a framework designed to define and evaluate mobility equity, and address structural inequities through a planning process that that better responds to the needs of disadvantaged people and communities. They identify twelve equity indicators related to improved mobility options, reduced air pollution exposure, and enhanced economic opportunities for disadvanted groups. Palmateer and Levinson (2018) evaluate transportation equity using four theoretical foundations: Absolute Need (transportation provides some minimal level of access to jobs), Equality of Opportunity (access to jobs are equal between groups), Maxi-Min Theory of Justice (disadvantaged groups should have better job acces than more advantaged groups), and Relative Need (the differences in access to jobs between drivers and non-drivers). They evaluate these impacts using transportation models that measure public transit travel times, and therefore non-drivers’ employment opportunities. They conclude that the Absolute Minimum allocation measure is excellent gauging local job access experience by system users and overall shape of the distribution of transportation services. The Equality of Opportunity analysis provides a basis for direct statistical comparison of transportation services between groups that can be scaled to a variety of geographic areas. The Maxi-Min Theory works well for comparing between regions, once region size is controlled for, but does poorly at comparison between groups. Relative Need measures compare between groups both within a single mode and between modes, and can also be scaled within or between regions. Hertel, Keil and Collens (2016) evaluates the fairness of public transport service allocation and pricing in the Toronto, Canda region, and recommends policies to achieve social equity objectives. Their analysis emphasizes that public transit provides many disadvantaged residents with a gateway to critical services, opportunities and amenities. They argue that fares should be based on people’s ability to pay, with targeted discounts to lower-income areas and groups. It describes how transportation agencies expand their planning to better address social equity goals. Martens (2006) argues that current transport evaluation practices exaggerate the benefits of automobile-oriented improvements and undervalue improvements to

Evaluating Transportation Equity Victoria Transport Policy Institute
44
alternative modes, which tends to be regressive because it skews planning and investment decisions to favor people who are economically, socially and physically advantaged (those who currently drive high mileage) and at the expense of those who are disadvantaged (who currently drive low mileage and rely on alternative modes). As he explains:
“Both transport modeling and cost-benefit analysis are driven by distributive principles that serve the highly mobile groups, most notably car users, at the expense of the weaker groups in society. Transport modeling is implicitly based on the distributive principle of demand. By basing forecasts of future travel demand on current travel patterns, transport models are reproducing the current imbalances in transport provision between population groups. The result is that transport models tend to generate suggestions for transport improvements that benefit highly mobile population groups at the expense of the mobility-poor. Given the importance of mobility and accessibility in contemporary society for all population groups, the paper suggests to base transport modeling on the distributive principle of need rather than demand. This would turn transport modeling into a tool to secure a minimal level of transport service for all population groups.” (Martens 2006).
To correct these biases he recommends the following changes to transportation modeling and economic evaluation techniques to reflect equity objectives:
Evaluate transport improvements primarily in terms of accessibility rather than mobility. For example, improvements should be rated based on the number of public services and jobs accessible to people, taking into account their ability (i.e., ability to walk and drive), travel time and financial budgets, not simply travel time savings to vehicle travelers. This recognizes the value of non-automobile modes (walking, cycling, public transit and telecommuting) and land use improvements (such as more compact and transit-oriented development) to improve accessibility and achieve transport planning objectives.
The monetary value assigned to accessibility gains should be inversely related to people’s current levels of accessibility to reflect the principle of diminishing marginal benefits. In other words, accessibility gains for the mobility-poor (who travel lower annual miles) should receive higher monetary value than for mobility-rich (high annual mile travelers), because accessibility-constrained people tend to gain relatively more from a given transportation improvement. This means that travel time savings for mobility-poor people should be valued higher than for the mobility-rich. This helps increase consumer welfare and efficiency, not just social justice objectives. For example, it helps disadvantaged people access education and employment opportunities that allow them to be more productive.
Evaluating Transportation Equity Victoria Transport Policy Institute
45
Sustainable Transport and Poverty (Starkey and Hine 2014)
Transporation improvements are often used to support economic development and reduce poverty. However, recent research indicates that transport investments tend to benefit the ‘non‐poor’ most, and investments must be consciously designed to avoid further impoverishing poor people. This includes improving roadways serving the most isolated rural areas, and improving walking and cycling conditions, rather than more costly motorized transport, and implementing policies that reduce poor residents’ accident risk and pollution exposure. They recommend the following practices to ensure that transportation policies help poorer residents:
Encourage proper participation of all stakeholders, including the poor, in planning and implementing transport
Collect and use planning data that disaggregates users by income groups, as well as by age, gender and disabilities
Make the urban environment much easier for walkers and cyclists to use and enjoy
Adopt ‘universal design’ standards for all new transport investments
Controll polluting vehicles and enforcing traffic laws and parking restrictions
Regulate effectively informal minibus services to improve operational standards
Develop city transport authorities able to plan transport services and infrastructure and able to raise funds to help pay for investments
Introduce road pricing, area traffic control and integrated transport services.
Ensure that new transit facilities can be used by the poor, by walkers and cyclists.
Adopte urban spatial planning criteria to encourage compact growth and prioritising public transit, walking and cycling (eg, Transit Orientated Development)
Ensure that where resettlement is required, it implemented in a fair manner, with people relocated as close as possible to their previous locations and work opportunities.
Smart Growth Development Policies
Automobile dependency and sprawl tend to be inequitable because they make non-drivers (people who cannot rely on automobile transportation) relatively worse of compared with drivers, and tend to increase transportation costs, which is regressive (Beard, Mahendra, Westphal 2016; Schneider and McClelland 2005). Lower-income households that rely on automobile transportation tend to spend a relatively large portion of their income on basic transportation, while those that use other travel modes spend much less (Smart and Klein 2015). Described more positively, transportation and land use policies that create more compact communities and more multi-modal transport systems help achieve equity objectives by improving non-drivers’ accessibility and increasing affordability (Rodier, et al. 2010; Semuels 2017).

Evaluating Transportation Equity Victoria Transport Policy Institute
46
There is sometimes a conflict between a short-term perspective, which focuses on current cost burdens, and a long-term perspective that considers how current policies affect future transportation and land use patterns. For example, increased vehicle taxes and fees intended to discourage automobile travel and encourage use of alternative modes may seem inequitable from a short-term perspective, because they increase the unit costs of vehicle travel, but may increase equity overall if they help create a more diverse transportation system and more accessible land use patterns, which reduce total consumer transportation costs. Frederick and Gilderbloom (2018) found that increased commute mode diversity (smaller automobile mode shares) is associated with less income inequality between white and African-American households, and between men and women, and with higher earnings for white women and African-American men. Transport Equity Objectives Summary
Table 6 identifies various transportation improvement strategies that help achieve specific equity objectives. This type of analysis can be modified to reflect the needs and values of a particular community. For example, different types of pricing reforms can have different equity impacts, depending on how they are structured and how revenues are used, so with thoughtful design, pricing reforms can achieve a maximum range of equity objectives. Table 6 Strategies for Achieving Equity Objectives
Strategy
Treats
Everybody
Equally
People Bear
the Costs
They Impose
Progressive
With Respect
To Income
Benefits
Transport
Disadvantaged
Improves
Basic
Access
Direct user charges for road and parking pricing. X X
Distance-based (rather than flat) insurance and registration fees X X
Increased transport system diversity (improvements to modes used by disadvantaged people).
X X X
More accessible land use, and location-efficient development. X X X
More affordable automobile options (PAYD insurance, carsharing, need-based discounts, etc.)
X X
Correct policies that favor automobile travel over other modes (planning and investment reforms).
X X X X
Improve public involvement in transport planning. X X
Improve data collection (more information on disadvantaged people and alternative modes).
X X X
This table indicates the equity objectives achieved by various transportation planning and management strategies. Many strategies support multiple equity objectives.

Evaluating Transportation Equity Victoria Transport Policy Institute
47
Conclusions Transportation equity analysis is important and unavoidable. Transport planning decisions often have significant equity impacts and equity concerns often influence transportation planning activities. Most practitioners and decision-makers sincerely want to help achieve equity objectives. Transportation equity can be difficult to evaluate because there are various types of equity, impacts, ways to measure impacts and categories of people, as summarized in Table 7. Table 7 Transportation Equity Categories and Indicators
Types of Equity Impacts Measurement Categories of People
Horizontal Equal treatment of equals Vertical With-Respect-To Income And Social Class Transport affordability Housing affordability Impacts on low-income communities Fare structures and discounts Industry employment Service quality in lower-income communities Vertical With-Respect-To Need And Ability Universal design Special mobility services Disabled parking Service quality for non-drivers
Public Facilities and Services Facility planning and design Public funding and subsidies Road space allocation Public involvement User Costs and Benefits Mobility and accessibility Taxes, fees and fares Service Quality Quality of various modes Congestion Universal design External Impacts Congestion Crash risk Pollution Barrier effect Hazardous material and waste Aesthetic impacts Community cohesion Economic Impacts Economic opportunities Employment and business activity Regulation and Enforcement Traffic regulation Regulations and enforcement Regulation of special risks
Per capita Per adult Per commuter or peak-period travel Per household Per Unit of Travel Per vehicle-mile/km Per passenger-mile/km Per trip Per commute or peak-period trip Per dollar Per dollar user fees Per dollar of subsidy Cost recovery
Demographics Age and lifecycle stage Household type Race and ethnic group Income class Quintiles Poverty line Lower-income areas Ability People with disabilities Licensed drivers Geographic location Jurisdictions Neighborhood and street Urban/suburban/rural Mode and Vehicle Type Walkers People with disabilities Cyclists & motorcyclists Motorists Public transit Industry Freight Public transport Auto and fuel industries Trip Type Emergency Commute Commercial/freight Recreational/tourist
There are various types, impacts, measurement units and categories to consider in equity analysis.

Evaluating Transportation Equity Victoria Transport Policy Institute
48
There is no single correct methodology. It is generally best to consider a variety of issues and perspectives. A planning process should reflect each community’s equity concerns and priorities so public involvement is important for transport equity planning. More comprehensive equity analysis allows planners to better anticipate problems, incorporate equity objectives in planning (for example, it can help identify congestion reduction strategies that also improve mobility for non-drivers and help lower-income people), and it can help optimize planning decisions to maximize equity objectives. New analysis tools and information resources are available to better evaluate equity and incorporate equity objectives into transport planning. Improved equity analysis in transport planning can reduce conflicts and delays, and better reflect a community’s needs and values.

Evaluating Transportation Equity Victoria Transport Policy Institute
49
References and Information Resources AARP (2009), The Road Ahead: AARP Survey on Transportation in Vermont, American Association for Retired Persons (www.aarp.org); at http://assets.aarp.org/rgcenter/il/vt_transport_09.pdf. Access Exchange International (www.globalride-sf.org) is a non-profit organization that promotes improved access to public transportation for disabled persons in developing countries. ADA Homepage (www.ada.gov), by the U.S. Department of Transportation, provides information on implementing the Americans with Disabilities Act. Heather Allen and Marianne Vanderschuren (2016), Safe and Sound: International Research on Women's Personal Safety on Public Transport, FIA Foundation (www.fiafoundation.org); at www.fiafoundation.org/media/224027/safe-and-sound-report.pdf. Alan Altshuler (2013), “Equity as a Factor in Surface Transportation Politics,” Access 42, Spring, pp. 2-9; at www.uctc.net/access/42/access42_equity.pdf. APHA (2010), The Hidden Health Costs of Transportation: Backgrounder, American Public Health Association (www.apha.org); at www.apha.org/advocacy/reports/reports. Qureshi Intikhab Ahmed, Huapu Lu and Shi Ye (2008), “Urban Transportation and Equity: A Case Study of Beijing and Karachi,” Transportation Research A, Vol. 42, Issue 1 (www.elsevier.com/locate/tra), January, pp. 125-139. Asha Weinstein Agrawal, et al. (2011), Getting Around When You’re Just Getting By: The Travel Behavior and Transportation Expenditures of Low-Income Adults, Mineta Transportation Institute (www.transweb.sjsu.edu); at http://tinyurl.com/kdrbtmo. Heather Allen (2008), Sit Next To Someone Different Every Day - How Public Transport Contributes To Inclusive Communities, Thredbo Conference (www.thredbo.itls.usyd.edu.au); at www.thredbo.itls.usyd.edu.au/downloads/thredbo10_papers/thredbo10-plenary-Allen.pdf. Anvita Arora and Geetam Tiwari (2007), A Handbook for Socio-Economic Impact Assessment (SEIA) of Future Urban Transport (FUT) Projects, Transportation Research and Injury Prevention Program (TRIPP), Indian Institute of Technology, New Delhi; at http://cleanairinitiative.org/portal/system/files/articles-72151_handbook.pdf. Milad Bandegani and Meisam Akbarzadeh (2016), “Evaluation of Horizontal Equity under a Distance-Based Transit Fare Structure,” Journal of Public Transportation, Vol. 19, No. 3, pp. 161-172 (DOI: http://dx.doi.org/10.5038/2375-0901.19.3.10); at http://scholarcommons.usf.edu/jpt/vol19/iss3/10.
Evaluating Transportation Equity Victoria Transport Policy Institute
50
Victoria A. Beard, Anjali Mahendra, Michael I. Westphal (2016), Towards a More Equal City: Framing the Challenges and Opportunities, Working Paper, World Resources Institute (www.wri.org); at www.wrirosscities.org/sites/default/files/WRR_Framing_Paper_Final.pdf. Judith Bell and Larry Cohen (2009), The Transportation Prescription: Bold New Ideas for Healthy, Equitable Transportation Reform in America, PolicyLink and the Prevention Institute Convergence Partnership (www.convergencepartnership.org/transportationhealthandequity). Edward Beimborn and Robert Puentes (2003), Highways and Transit: Leveling the Playing Field in Federal Transportation Policy, Brookings Institute (www.brookings.edu). Olivier Bellefleur (2013), Urban Traffic Calming and Health Inequalities: Effects and Implications for Practice, National Collaborating Centre for Healthy Public Policy (www.ncchpp.ca); at www.ncchpp.ca/175/publications.ccnpps?id_article=917. BLS (Annual reports), Consumer Expenditure Surveys, Bureau of Labor Statistics (www.bls.gov). Evelyn Blumenberg and Gregory Pierce (2012), “Automobile Ownership and Travel By The Poor,” Transportation Research Record 2320, Transportation Research Board (www.trb.org), pp. 28-36; summary at http://trb.metapress.com/content/c55v7w5212611141. Evelyn Blumenberg and Gregory Pierce (2016), “A Driving Factor in Moving to Opportunity,” Access 48 (www.accessmagazine.org); at www.accessmagazine.org/wp-content/uploads/sites/7/2016/05/access48-webprint_adrivingfactor.pdf. Mikayla Bouchard (2015), “Transportation Emerges as Crucial to Escaping Poverty,” New York Times (www.nytimes.com); at www.nytimes.com/2015/05/07/upshot/transportation-emerges-as-crucial-to-escaping-poverty. BTS (Annual reports), Federal Subsidies to Passenger Transportation, Bureau of Transportation Statistics (www.bts.gov). Robert Bullard and Glenn Johnson (1997), Just Transportation; Dismantling Race & Class Barriers to Mobility, New Society Publishing (www.newsociety.com). Daniel Carlson and Zachary Howard (2010), Impacts Of VMT Reduction Strategies On Selected Areas and Groups, Washington State Department of Transportation (www.wsdot.wa.gov); at www.wsdot.wa.gov/research/reports/fullreports/751.1.pdf. Robert B. Case (2011), “Accessibility-Based Factors of Travel Odds: Performance Measures for Coordination of Transportation and Land Use to Improve Nondriver Accessibility,” Transportation Research Record 2242, Transportation Research Board (www.trb.org), pp. 106-113; at http://amonline.trb.org/165u61/165u61/1. CBT (2012), Transport, Accessibility and Social Exclusion, Campaign for Better Transport (www.bettertransport.org.uk); at http://bit.ly/2fD3fi2.

Evaluating Transportation Equity Victoria Transport Policy Institute
51
CDOT (2003), Environmental Justice In Colorado’s Statewide and Regional Planning Process Guidebook, Colorado Department of Transportation (www.codot.gov); at www.codot.gov/programs/research/pdfs/2002/env-justice.pdf. Center for the Analysis of Social Exclusion (CASE), (http://sticerd.lse.ac.uk/case) is a specialized research organization at the London School of Economics dealing with social equity issues. Don Chen (1996), Getting A Fair Share: An Analysis of Federal Transportation Spending, Surface Transportation Policy Project (www.transact.org). Eric Chyn (2016), Moved to Opportunity: The Long-Run Effect of Public Housing Demolition on Labor Market Outcomes of Children, Department of Economics, University of Michigan; at www-personal.umich.edu/~ericchyn/Chyn_Moved_to_Opportunity.pdf. Miles Corak (2017), Divided Landscapes of Economic Opportunity: The Canadian Geography of Intergenerational Income Mobility, Human Capital and Economic Opportunity Working Paper Number 2017-043, University of Chicago (https://econresearch.uchicago.edu); at https://milescorak.com/equality-of-opportunity. Also see Doug Saunders and Tom Cardoso (2017), “A Tale of Two Canadas: Where You Grew Up Affects Your Income in Adulthood,” Globe and Mail (www.theglobeandmail.com); at www.theglobeandmail.com/news/national/a-tale-of-
two-canadas-where-you-grow-up-affects-your-adult-income/article35444594. Hana Creger, Joel Espino and Alvaro S. Sanchez (2018), Mobility Equity Framework: How to Make Transportation Work for People, The Greenlining Institute (http://greenlining.org); at http://greenlining.org/wp-content/uploads/2018/03/Mobility-Equity-Framework-Final.pdf. CTS (2006), About Accessibility: Access to Destinations Study, Center for Transportation Studies, University of Minnesota (www.cts.umn.edu); at www.cts.umn.edu/access-study/about/index.html. CTS (2010), How Light-Rail Transit Improves Job Access for Low-Wage Workers: A Transitway Impacts Research Program (TIRP) Research Brief, Center for Transportation Studies, Univesity of Minnesota (www.cts.umn.edu); at www.cts.umn.edu/Research/featured/transitways/research. Graham Currie, et al. (2009), Investigating Links Between Transport Disadvantage, Social Exclusion And Well-Being In Melbourne –Preliminary Results, Transport Policy Vol. 16, Is. 3, July, Pages 97-105; at http://tinyurl.com/lv3jexa. Graham Currie and Alexa Delbose (2010), Modelling the Social and Psychological Impacts of Transport Disadvantaged,” Transportation, Vol. 37, No. 6, pp. 953-966; abstract at www.springerlink.com/content/e1j732870x124241. DFID (2013), Social Dimensions of Transport –A Resource for Social Impact Appraisals, UK Department for International Develoment (www.gov.uk/government/organisations/department-for-international-development); at http://tinyurl.com/o3mvbpe.
Evaluating Transportation Equity Victoria Transport Policy Institute
52
Lynn Dobbs (2005), “Wedded to the Car: Women, Employment and the Importance of Private Transport,” Transport Policy, Vol. 12, No. 3 (www.elsevier.com), May, pp. 266-278. Jago Dodson, Matthew I. Burke, Rick Evans and Neil Sipe (2011), “How Will We Get There? Analyzing Access of Low-Socioeconomic-Status Households to Destinations in Australian Cities,” Transportation Research Record 2242, Transportation Research Board (www.trb.org), pp. 90-97; at http://trb.metapress.com/content/d40q305j363jj902. Ahmed El-Geneidy, et al. (2016), “The Cost of Equity: Assessing Transit Accessibility and Social Disparity Using Total Travel Cost,” Transportation Research A, Vol. 91, pp. 302–316 (http://dx.doi.org/10.1016/j.tra.2016.07.003). Environmental Justice Website (www.fhwa.dot.gov/environment/ej2.htm), by the USDOT, provides information on methods for incorporating environmental justice into transport planning. Environmental Justice And Transportation Website (www.brejtp.org) is developing tools to incorporate equity analysis into regional transportation planning. Reid Ewing and Shima Hamidi (2014), Measuring Urban Sprawl and Validating Sprawl Measures, Metropolitan Research Center at the University of Utah for the National Cancer Institute, the Brookings Institution and Smart Growth America (www.smartgrowthamerica.org); at www.arch.utah.edu/cgi-bin/wordpress-metroresearch. Reid Ewing, et al. (2016), “Does Urban Sprawl Hold Down Upward Mobility?,” Landscape and Urban Planning, Vol. 148, April, pp. 80-88; www.sciencedirect.com/science/article/pii/S016920461500242X. Yingling Fan and Arthur Huang (2011), How Affordable is Transportation? An Accessibility-Based Evaluation, CTS Report 11-12, Transitway Impacts Research Program, Center for Transportation Studies (www.cts.umn.edu); at www.cts.umn.edu/Publications/ResearchReports/reportdetail.html?id=2024. Yingling Fan, Andrew Guthrie and Kirti Vardhan Das (2016), Spatial and Skills Mismatch of Unemployment and Job Vacancies, Center for Transportation Studies, University of Minnesota (www.cts.umn.edu); at www.cts.umn.edu/Research/Featured/TransitandWorkforce. FHWA (1996), Public Involvement Techniques for Transportation Decisionmaking, Federal Highway Administration, (www.fhwa.dot.gov/reports/pittd/cover.htm). FHWA (1997), 1997 Federal Highway Cost Allocation Study, USDOT (www.ota.fhwa.dot.gov/hcas/final). Additional data and appendices were added in 2000. FHWA (2008), Income-Based Equity Impacts of Congestion Pricing: A Primer, Office of Transportation Management, Federal Highway Administration (www.ops.fhwa.dot.gov); at http://ops.fhwa.dot.gov/publications/fhwahop08040/fhwahop08040.pdf.

Evaluating Transportation Equity Victoria Transport Policy Institute
53
FHWA and FTA (2013), Transportation & Environmental Justice: Effective Practices, Federal Highway Administration and Federal Transit Administration, FHWA-EP-02-016 (www.fhwa.dot.gov/environment/ej2.htm). FIA (2017), Building Sustainable Mobility for Women, FIA Foundation (www.fiafoundation.org); at www.fiafoundation.org/blog/2017/november/building-sustainable-mobility-for-women. David J. Forkenbrock and Lisa A. Schweitzer (1997), Environmental Justice and Transportation Investment Policy, Public Policy Center, University of Iowa (http://ppc.uiowa.edu); at www.intrans.iastate.edu/reports/environmental_justice.pdf. David J. Forkenbrock and Glen E. Weisbrod (2001), Guidebook for Assessing the Social and Economic Effects of Transportation Projects, NCHRP Report 456, Transportation Research Board, National Academy Press (www.trb.org); at http://gulliver.trb.org/publications/nchrp/nchrp_rpt_456-a.pdf. David J. Forkenbrock and Jason Sheeley (2004), Effective Methods for Environmental Justice Assessment, National Cooperative Highway Research Program (NCHRP) Report 532, Transportation Research Board (www.trb.org); at http://onlinepubs.trb.org/onlinepubs/nchrp/nchrp_rpt_532.pdf. Geoffrey Fruin and P.S. Sriraj (2005), “Approach of Environmental Justice to Evaluate the Equitable Distribution of a Transit Capital Improvement Program,” Transportation Research Record 1924, Transportation Research Board (www.trb.org), pp. 139-145; summary at http://trb.metapress.com/content/4l30444247931224. Howard Frumkin, Lawrence Frank and Richard Jackson (2004), Urban Sprawl and Public Health: Designing, Planning, and Building For Healthier Communities, Island Press (www.islandpress.org). P. Gaffron, J. P. Hine and F. Mitchell (2001), The Role Of Transport On Social Exclusion In Urban Scotland: Literature Review, Scottish Executive Central Research Unit (www.scotland.gov.uk/cru/kd01/blue/rtseuclrev.pdf). Shengyi Gao and Robert A. Johnston (2009), “Public vs. Private Mobility for Low Income Households: Transit Improvements vs. Increased Car Ownership in the Sacramento Region,” Transportation Research Record 2125 (www.trb.org), pp. 9-15; at http://transweb.sjsu.edu/PDFs/research/2403-public-private-mobility-poor-transit-improvements-car-ownership-sacramento.pdf. Chad Frederick and John Hans Gilderbloom (2018), “Commute Mode Diversity and Income Inequality: An Inter-Urban Analysis of 148 Midsize US Cities,” International Journal of Justice and Sustainability, Vol. 23, No. 1, (https://doi.org/10.1080/13549839.2017.1385001). Edward L. Glaeser, Matthew E. Kahn and Jordan Rappaport (2008), “Why Do The Poor Live In Cities? The Role Of Public Transportation,” Journal of Urban Economics, Vol. 63, No. 1, pp. 1-24; at http://tinyurl.com/qyujr8n.
Evaluating Transportation Equity Victoria Transport Policy Institute
54
Aaron Golub (2010), “Welfare and Equity Impacts of Gasoline Price Changes under Different Public Transportation Service Levels,” Journal of Public Transportation, Vol. 13, No. 3, pp. 1-21; at www.nctr.usf.edu/jpt/pdf/JPT13-3.pdf. Aaron Golub and Karel Martens (2014), “Using Principles Of Justice To Assess The Modal Equity Of Regional Transportation Plans,” Journal of Transport Geography , Vol. 41, pp. 10–20 (www.sciencedirect.com/science/article/pii/S0966692314001628). Stefan Gössling (2016), Urban Transport Justice, Journal of Transport Geography, Vol. 54, Pages 1-9 (http://www.sciencedirect.com/science/article/pii/S0966692316302319). Stefan Gössling, Marcel Schröder, Philipp Späth and Tim Freytag (2016), “Urban Space Distribution and Sustainable Transport,” Transport Reviews, (http://dx.doi.org/10.1080/01441647.2016.1147101) Toni L. Griffin, et al. (2015), The Just City Essays: Visions for Urban Equity, Inclusivity and Opportunity, Next City (https://nextcity.org); at https://nextcity.org/features/view/just-city-essys-toni-griffin-theaster-gates-angela-glover-blackwell. Krista Gullo, et al. (2008), “A Model of Social Inequity and Accessibility in Detroit,” Personal Mobility and Global Climate Change, Future Research Directions in Sustainable Mobility and Accessibility, SMART, University of Michigan (http://um-smart.org). John Hamburg, Larry Blair and David Albright (1995), “Mobility as a Right,” Transportation Research Record 1499, Transportation Research Board (www.trb.org), pp. 52-55. Kerry Hamilton, Linda Jenkins, Frances Hodgson and Jeff Turner (2005), Promoting Gender Equality in Transport, Equal Opportunities Commission (www.eoc.org.uk); at www.eoc.org.uk/PDF/wp_34_gender_equality_in_transport.pdf. Jonathan Haughton and Shahidur R. Khandker (2009), Handbook on Poverty and Inequality, World Bank (www.worldbank.org); at http://go.worldbank.org/4WJH9JQ350. A. Hay and E. Trinder (1991), “Concept of Equity, Fairness, and Justice Expressed by Local Transport Policy Makers,” Environment and Planning C, Vol. 9, pp. 453-465. Sean Hertel, Roger Keil and Michael Collens (2016), Next Stop Equity: Routes To Fairer Transit Access In The Greater Toronto And Hamilton Area, York University http://city.apps01.yorku.ca/wp-content/uploads/2016/02/Transit-Equity_Reduced_020216.pdf. Julian Hine and Margaret Grieco (2003), “Scatters And Clusters In Time And Space: Implications For Delivering Integrated And Inclusive Transport,” Transport Policy, Vol. 10, pp. 299–306; at http://vplno1.vkw.tu-dresden.de/oeko/Data/ESF/Paper_Hine_&_Grieco.pdf.

Evaluating Transportation Equity Victoria Transport Policy Institute
55
Julian Hine and Fiona Mitchell (2001), “Better for Everyone? Travel Experiences and Transport Exclusion,” Urban Studies, Vol. 38, No. 2, 319–332; at http://vplno1.vkw.tu-dresden.de/oeko/Data/ESF/Paper_hine_urban_studies.pdf. David Hodge (1995), “My Fair Share: Equity Issues in Urban Transportation,” in The Geography of Urban Transportation, Susan Hanson (Ed.) Guilford Press (New York). Chang-Tai Hsieh and Enrico Moretti (2015), Why Do Cities Matter? Local Growth and Aggregate Growth, National Bureau of Economic Research (www.nber.org); at http://bit.ly/1IIphXE. Also see, “Home Economics: Sky-High House Prices In The Most Desirable Cities Are Holding Back Growth And Jobs,” The Economist, 4 October 2014; at http://econ.st/1qVWgtr. Chang-Tai Hsieh and Enrico Moretti (2017), Housing Constraints and Spatial Misallocation, University of California, Berkeley and the National Bureau of Economic Research (www.nber.org); at http://eml.berkeley.edu/~moretti/growth.pdf. Michael Iacono and Adeel Lari (2006), Transportation Finance, Congestion, And Equity: Some Policy Perspectives, Transportation Research Board 85th Annual Meeting (www.trb.org). ICMA (2005), Active Living and Social Equity: Creating Healthy Communities for All Residents, International City/County Management Association (www.icma.org) and Active Living By Design (www.activelivingleadership.org). Junfeng Jiao and Maxwell Dillivan (2013), “Transit Deserts: The Gap Between Demand and Supply,” Journal of Public Transportation, Vol. 16, No. 3, pp. 23-35; at www.nctr.usf.edu/wp-content/uploads/2013/10/JPT_16.3.pdf. INFRAS and IWW (2004), External Costs of Transport – Update Study, Community of European Railway and Infrastructure Companies, and the International Union of Railways (www.uic.asso.fr). IMR (2009), Sprawl vs Transit Villages: Environment Justice Implications, Innovative Mobility (www.innovativemobility.org); at www.innovativemobility.org/sprawl/Sprawl_vs_Transit_Villages_Environmental_Justice.shtml. Wenya Jia and Martin Wachs (1998), “Parking and Affordable Housing,” Access, Vol. 13, Fall 1998 (http://socrates.berkeley.edu/~uctc/access.html), pp. 22-25. Joseph Jones and Fred Nix (1995), Survey of the Use of Highway Cost Allocation in Road Pricing Decisions, Transportation Association of Canada (www.tac-atc.ca). John Kain (1994), “Impacts of Congestion Pricing on Transit and Carpool Demand and Supply,” in Curbing Gridlock, TRB, National Academy Press (www.trb.org), p. 502-553. Alex Karner and Deb Niemeier (2013), “Civil Rights Guidance And Equity Analysis Methods For Regional Transportation Plans: A Critical Review Of Literature And Practice,” Journal of

Evaluating Transportation Equity Victoria Transport Policy Institute
56
Transport Geography, Vo. 33, pp. 126-134; at www.ssti.us/wp/wp-content/uploads/2014/02/2013-karner-civil+rights+guidance+critical+review.pdf. C. Jotin Khisty (1997), “Operationalizing Concepts of Equity for Public Project Investment,” Transportation Research Record 1559 (www.trb.org), pp. 94-99. Elizabeth Kneebone and Natalie Holmes (2015), The Growing Distance Between People and Jobs in Metropolitan America, Brookings (www.brookings.edu); at http://brook.gs/1EOA8ei. Dan Koeppel (2006), “How Low-Income Cyclists Go Unnoticed,” Bicycling Magazine (www.bicycling.com); at www.bicycling.com/culture/advocacy/how-low-income-cyclists-go-unnoticed. KOTI (2011), Toward an Integrated Green Transportation System in Korea, Korea Transport Institute (http://english.koti.re.kr). Anna Krameer and Alexandra Goldstein (2015), “Meeting the Public’s Need For Transit Options: Characteristics of Socially Equitable Transit Networks,” ITE Journal (www.ite.org), Vol. 85, No. 9, pp. 23-29; summary at http://trid.trb.org/view.aspx?id=1371713. Ugo Lachapelle, et al. (2011), “Commuting by Public Transit and Physical Activity: Where You Live, Where You Work, and How You Get There,” Journal of Physical Activity and Health (http://journals.humankinetics.com/jpah), Vol. 8, Supplement 1, pp. S72-S82; at http://journals.humankinetics.com/JPAH-supplements-special-issues/jpah-volume-8-supplement-january. LCEF (2011), Where We Need to Go: A Civil Rights Roadmap for Transportation Equity, Leadership Conference Education Fund, Leadership Conference on Civil and Human Rights (www.civilrights.org); at http://tinyurl.com/mntmyq7. Douglass Lee (1987), “Making the Concept of Equity Operational,” Transportation Research Record 677 (www.trb.org), pp. 46-53. Richard J. Lee, Ipek N. Sener and S. Nathan Jones (2016), “Understanding the Role of Equity in Active Transportation Planning in The United States,” Transport Review (http://dx.doi.org/10.1080/01441647.2016.1239660). Diane K. Levy, Zach McDade and Kassie Dumlao (2010), Effects from Living in Mixed-Income Communities for Low-Income Families: A Review of the Literature, Urban Institute (www.urban.org); at www.urban.org/research/publication/effects-living-mixed-income-communities-low-income-families. Amy Lubitow, Jennifer Rainer and Sasha Bassett (2017), “Exclusion and Vulnerability on Public Transit: Experiences of Transit Dependent Riders in Portland, Oregon,” Mobilities
(http://dx.doi.org/10.1080/17450101.2016.1253816).

Evaluating Transportation Equity Victoria Transport Policy Institute
57
Serena Lin (2008), Understanding Climate Change: An Equitable Framework, Policy Link (www.policylink.org); at www.policylink.org/documents/climatechange_final.pdf. Todd Litman (1996), “Using Road Pricing Revenue: Economic Efficiency and Equity Considerations,” Transportation Research Record 1558, Transportation Research Board (www.trb.org), pp. 24-28; at www.vtpi.org/revenue.pdf. Todd Litman (2000), Transportation Land Valuation; Evaluating Policies and Practices that Affect the Amount of Land Devoted to Transportation Facilities, VTPI (www.vtpi.org), 2000. Todd Litman (2001), What’s It Worth? Life Cycle and Benefit/Cost Analysis for Evaluating Economic Value, Presented at Internet Symposium on Benefit-Cost Analysis, Transportation Association of Canada (www.tac-atc.ca); at VTPI (www.vtpi.org). Todd Litman (2002) “Evaluating Transportation Equity,” World Transport Policy & Practice (http://ecoplan.org/wtpp/wt_index.htm), Volume 8, No. 2, Summer, pp. 50-65; updated version at www.vtpi.org/equity.pdf. Todd Litman (2003a), “Measuring Transportation: Traffic, Mobility and Accessibility,” ITE Journal (www.ite.org), Vol. 73, No. 10, October 2003, pp. 28-32, www.vtpi.org/measure.pdf. Todd Litman (2005), Socially Optimal Transport Prices and Markets, VTPI (www.vtpi.org); at www.vtpi.org/sotpm.pdf. Todd Litman (2006), You CAN Get There From Here: Evaluating Transportation Diversity, Victoria Transport Policy Institute (www.vtpi.org); at www.vtpi.org/choice.pdf; originally published as, “You Can Get There From Here: Evaluating Transportation Choice,” Transportation Research Record 1756, TRB (www.trb.org), 2001, pp. 32-41 Todd Litman (2007a), Community Cohesion As A Transport Planning Objective, Victoria Transport Policy Institute website (www.vtpi.org); at www.vtpi.org/cohesion.pdf. Todd Litman (2007b), Transportation Affordability: Evaluation and Improvement Strategies, VTPI (www.vtpi.org); at www.vtpi.org/affordability.pdf. Todd Litman (2008), Celebrate (Transportation) Diversity!, Planetizen Blogs (www.planetizen.com); at www.planetizen.com/node/30539. Todd Litman (2009), Transportation Cost and Benefit Analysis Guidebook: Techniques, Estimates and Implications, VTPI (www.vtpi.org). Todd Litman (2010), Affordable-Accessible Housing In A Dynamic City: Why and How To Support Development of More Affordable Housing In Accessible Locations, Victoria Transport Policy Institute (www.vtpi.org); at www.vtpi.org/aff_acc_hou.pdf. Todd Litman (2012), Whose Roads? Defining Pedestrians and Bicyclists Right To Use Public Roadways, VTPI (www.vtpi.org).
Evaluating Transportation Equity Victoria Transport Policy Institute
58
Todd Litman (2014), Evaluating Public Transit Benefits and Costs, VTPI (www.vtpi.org). Todd Litman (2017), Evaluating Transportation Diversity: Multimodal Planning for Efficient and Equitable Communities, Victoria Transport Policy Institute (www.vtpi.org); at www.vtpi.org/choice.pdf. Todd Litman and Mark Brenman (2012), A New Social Equity Agenda For Sustainable Transportation, Paper 12-3916, Transportation Research Board Annual Meeting (www.trb.org); at www.vtpi.org/equityagenda.pdf. Todd Litman and Tom Rickert (2005), Evaluating Transit Accessibility: ‘Inclusive Design’ Performance Indicators For Public Transportation In Developing Countries, VTPI (www.vtpi.org); at www.vtpi.org/tranacc.pdf. LSC (2001), Montana Rural Passenger Needs Study, Montana Department of Transportation (www.mdt.state.mt.us). Karen Lucas (2004), Running on Empty: Transport, Social Exclusion and Environmental Justice, Policy Press (www.bris.ac.uk); at http://cdj.oxfordjournals.org/content/41/2/252.extract. Darshini Mahadevia, Rutul Joshi and Abhijit Datey (2013), Low-Carbon Mobility in India and the Challenges of Social Inclusion: Bus Rapid Transit (BRT) Case Studies in India, CEPT University Centre for Urban Equity (http://cept.ac.in/178/center-for-urban-equity-cue-), United Nations Environmental Program; at www.unep.org/transport/lowcarbon/Pdf's/BRT_Casestudies_India_fullreport.pdf. Kevin Manaugh, Madhav G. Badami and Ahmed M. El-Geneidy (2015), “Integrating Social Equity into Urban Transportation Planning: A Critical Evaluation of Equity Objectives and Measures in Transportation Plans in North America,” Transport Policy, Vol. 37, pp. 167–176 (http://dx.doi.org/10.1016/j.tranpol.2014.09.013); at http://tram.mcgill.ca/Research/Publications/Equity_planning.pdf. Rebecca Mann (2011), Inclusive Transport: A Tool for Urban Projects, London School of Economics for the Asian Development Bank. Karel Martens (2006), “Basing Transport Planning on Principles of Social Justice,” Berkeley Planning Journal, Volume 19 (www-dcrp.ced.berkeley.edu/bpj). Karel Martens, Aaron Golub and Glenn Robinson (2012), “A Justice-Theoretic Approach To The Distribution Of Transportation Benefits: Implications For Transportation Planning Practice In The United States,” Transportation Research Part A: Policy and Practice, Vol. 46, pp. 684-695; summary at www.sciencedirect.com/science/article/pii/S0965856412000055. Karel Martens (2016), Transport Justice: Designing Fair Transportation Systems, Routledge (www.routledge.com); at www.routledge.com/Transport-Justice-Designing-fair-transportation-systems/Martens/p/book/9780415638326.

Evaluating Transportation Equity Victoria Transport Policy Institute
59
A. W. Marshall and I. Olkin (1997), Inequalities: Theory of Majorization and Its Applications, Academic Press (New York). Michael Manville (2017), Is Congestion Pricing Fair to the Poor?, 100 Hours (https://100hoursla.com); at https://medium.com/100-hours/is-congestion-pricing-fair-to-the-poor-
62e281924ca3. Barbara McCann (2000), Driven to Spend; The Impact of Sprawl on Household Transportation Expenses, STPP (www.transact.org). NEPA (1998), What Is Social Impact Assessment?, Fact Sheet, General Service Administration (www.gsa.gov/pbs/pt/call-in/factshet/1098b/10_98b_7.htm). Mobility Pricing Independent Commission (MPIC) (2017), Moving Around Metro Vancouver: Exploring New Approaches to Reducing Congestion, It’s Time (www.itstimemv.ca), Mayors’ Council on Regional Transportation and the TransLink Board of Directors; at http://bit.ly/2zIkyDk. Peter Newman and Jeff Kenworthy (1999), Sustainability and Cities; Overcoming Automobile Dependency, Island Press (Covelo; www.islandpress.org). Mary Ng (2005), Delaware Valley Regional Planning Commission: An MPO's Methodology Toward Equitable Accessibility And Involvement In Regional Planning, Presented at Racial Equity In Transportation Workshop, by the Harvard Civil Rights Project and the Brookings Institute, 13 January 2005, (www.civilrightsproject.harvard.edu/resources/transportation.php). J-P. Nicolas, P. Pochet and H. Poimboeuf (2003), “Towards Sustainable Mobility Indicators: Application To The Lyons Conurbation,” Transport Policy, Vol. 10 (www.elsevier.com/locate/tranpol), pp. 197-208. Chelsey Palmateer and David Levinson (2018), Justice, Exclusion, and Equity: An Analysis of 48 U.S. Metropolitan Areas, Presented at the TRB Annual Meeting; at https://conservancy.umn.edu/bitstream/handle/11299/189908/TRB50Cities.pdf. Phuong Nguyen-Hoanga and Ryan Yeung (2010), “What is Paratransit Worth,” Transportation Research Part A: Policy and Practice, Volume 44, Issue 10, December, pp. 841-853. Clarissa Penfold, N. Cleghorn, C. Creegan, H. Neil and S. Webster (2008), Travel Behaviour, Experiences And Aspirations Of Disabled People, for the Department of Transport by The National Centre for Social Research (NatCen), Social Research in Transport Clearinghouse (www.sortclearinghouse.info); at www.sortclearinghouse.info/research/325. Rolf Pendall, et al. (2014), Driving to Opportunity: Understanding the Links among Transportation Access, Residential Outcomes, and Economic Opportunity for Housing Voucher Recipients, Urban Institute (www.urban.org); at www.urban.org/UploadedPDF/413078-Driving-to-Opportunity.pdf.

Evaluating Transportation Equity Victoria Transport Policy Institute
60
Rafael H. M. Pereira, Tim Schwanen and David Banister (2016), “Distributive Justice and Equity in Transportation,” Transport Reviews, Pages 1-22 (http://dx.doi.org/10.1080/01441647.2016.1257660). Alan Pisarski (2009), ULI Moving Cooler Report: Greenhouse Gases, Exaggerations and Misdirections, New Geography (www.newgeography.com); at www.newgeography.com/content/00932-uli-moving-cooler-report-greenhouse-gases-exaggerations-and-misdirections. Stephanie Pollack, Liz Williams, Russ Lopez and Ivette Luna (2013), The Toll of Transportation, Dukakis Center for Urban & Regional Policy, Northeastern University (www.northeastern.edu/dukakiscenter/focus-areas/transportation); at http://bit.ly/2fD6shz. James Poterba (1991), “Is the Gasoline Tax Regressive?”, Tax Policy and the Economy, MIT Press. Race Poverty and the Environment Journal (www.urbanhabitat.rpejournal.org) is a biannual national publication that provides analysis and solutions to environmental justice issues, including transportation equity issues. Farideh Ramjerdi (2006), “Equity Measures and Their Performances in Transport,” Transportation Research Record 1983, Transportation Research Board (www.trb.org), pp. 67-74. John Rawls (1971), A Theory of Justice, The Belknap Press of Harvard University Press (www.hup.harvard.edu); at http://en.wikipedia.org/wiki/A_Theory_of_Justice. Piet Rietveld (2003), “Winners and Losers in Transport Policy: On Efficiency, Equity and Compensation,” Handbook of Transport and the Environment, Elsevier, pp. 585-601. Fiona Rajé (2003), Impacts Of Road User Charging/Workplace Parking Levy On Social Inclusion/Exclusion: Gender, Ethnicity And Lifecycle Issues, University Of Oxford Transport Studies Unit (www.tsu.ox.ac.uk/research/impacts.html). Lorien Rice (2004), Transportation Spending by Low-Income California Households: Lessons for the San Francisco Bay Area, Public Policy Institute of California (www.ppic.org/content/pubs/R_704LRR.pdf), 2004 Tom Rickert (1998), Mobility for All: Accessible Transportation Around the World, Access Exchange International (www.globalride-sf.org), Swedish Institute on Independent Living (www.independentliving.org/Mobility/index.html). Glenn Robinson, et al. (2010), Building on the Strength of Environmental Justice in Transportation: Environmental Justice and Transportation Toolkit, Baltimore Region Environmental Justice in Transportation Project (www.ejkit.com) and the Office of Civil Rights, Federal Transit Administration.

Evaluating Transportation Equity Victoria Transport Policy Institute
61
Caroline Rodier, John E. Abraham, Brenda N. Dix and John D. Hunt (2010), Equity Analysis of Land Use and Transport Plans Using an Integrated Spatial Model, Report 09-08, Mineta Transportation Institute (www.transweb.sjsu.edu); at http://tinyurl.com/mew7ns4. Sandra Rosenbloom and Alan Altshuler (1997), in “Equity Issues in Urban Transportation”, Policy Studies Journal, p. 29-39. Talia Shadwell (2017), “'Paying to Stay Safe': Why Women Don't Walk as Much as Men. A Study Shows in Most Countries, Women Walk Significantly Fewer Steps Each Day Than Men,” The Gardian (www.theguardian.com); at www.theguardian.com/inequality/2017/oct/11/paying-to-stay-safe-
why-women-dont-walk-as-much-as-men. Thomas W. Sanchez (1999), “The Connection Between Public Transit and Employment,” Journal of the American Planning Association, Vol. 65, No. 3, Summer, pp. 284-296. Thomas W. Sanchez, Rich Stolz and Jacinta S. Ma (2003), Moving Toward Equity: Addressing Inequitable Effects of Transportation Policies On Minorities, Harvard Civil Rights Project and the Center For Community Change (www.civilrightsproject.harvard.edu); at www.civilrightsproject.harvard.edu/resources/transportation.php. Thomas W. Sanchez and Marc Brenman (2007), The Right To Transportation: Moving To Equity, Planners Press (www.planning.org). Tomas Sanchez, Q. Shen and Z. Peng (2004), “Transit Mobility, Jobs Access and Low-income Labour Participation in US Metropolitan Areas,” Urban Studies, Vol. 41, No. 7, pp. 1313-1331; at www.ncdsv.org/images/UrbanStudies_TransitMobility_June2004.pdf. Laura Sandt, Tabitha Combs and Jesse Cohn (2016), Pursuing Equity in Pedestrian and Bicycle Planning, U.S. Federal Highway Administration (www.fhwa.dot.gov); at www.fhwa.dot.gov/environment/bicycle_pedestrian/resources/equity_paper. David Sawicki and Mitch Moody (2000), “Developing Transportation Alternatives for Welfare Recipients Moving to Work,” APA Journal, Vo. 66, No. 3, Summer, pp. 306-320. K.H. Schaeffer and Elliot Sclar (1975), Access for All, Columbia University Press (New York; www.columbia.edu/cu/cup). Jan-dirk Schmocker, Mohammed A. Quddus, Robert Noland and Michael G. H. Bell (2005), “Estimating Trip Generation of Elderly and Disabled People: Analysis of London Data,” Transportation Research Record 1924, Transportation Research Board (www.trb.org), pp. 9-18. Keith Schneider and Mac McClelland (2005), Follow The Money: Citizens Pay Heavy Price For State’s Sprawl Subsidies, Michigan Land Use Institute (www.mlui.org). Lisa Schweitzer and Abel Valenzuela Jr. (2004), “Environmental Injustice and Transportation: The Claims and the Evidence,” Journal of Planning Literature, Vol. 18, No. 4, pp. 383-398.
Evaluating Transportation Equity Victoria Transport Policy Institute
62
Lisa Schweitzer and Brian Taylor (2008), “Just Pricing: The Distributional Effects of Congestion Pricing and Sales Taxes,” Transportation, Vol. 35, No. 6, pp. 797–812 (www.springerlink.com/content/l168327363227298); summarized in “Just Road Pricing,” Access 36 (www.uctc.net/access); Spring 2010, pp. 2-7; at www.uctc.net/access/36/access36.pdf. Lisa Schweitzer (2009), “Empirical Research on the Social Equity of Gas Taxes, Emissions Fees, and Congestion Charges,” Special Report 303: Equity Of Evolving Transportation Finance Mechanisms, Transportation Research Board (www.trb.org); at http://onlinepubs.trb.org/onlinepubs/sr/sr303Schweitzer.pdf. SDC (2011), Fairness in a Car Dependent Society, Sustainable Development Commission (www.sd-commission.org.uk); at www.sd-commission.org.uk/pages/fairness-in-a-car-dependent-society.html. Alana Semuels (2017), “The Barriers Stopping Poor People From Moving to Better Jobs,” The Atlantic (www.theatlantic.com); at www.theatlantic.com/business/archive/2017/10/geographic-mobility-and-housing/542439. Scott Sharpe and Paul Tranter (2010), “The Hope For Oil Crisis: Children, Oil Vulnerability And (In)Dependent Mobility,” Australian Planner, Vol. 47, No. 4, December, pp. 284-292; summary at http://dx.doi.org/10.1080/07293682.2010.526622. Donald Shoup (2005), The High Cost of Free Parking, Planners Press (www.planning.org). Adam Smith (1776), An Inquiry into the Nature And Causes of the Wealth of Nations, The Adam Smith Institute (www.adamsmith.org.uk). Ken Small (1983), “The Incidence of Congestion Tolls on Urban Highways”, Journal of Urban Economics, December 1983, pp. 90-111. Michael J. Smart and Nicholas J. Klein (2015), A Longitudinal Analysis of Cars, Transit, and Employment Outcomes, Mineta National Transit Research Consortium (http://transweb.sjsu.edu); at http://transweb.sjsu.edu/PDFs/research/1244-cars-transit-employment-outcomes-longitudinal-analysis.pdf. Jamie E.L. Spinney, Darren M. Scott, and K. Bruce Newbold (2009), “Transport Mobility Benefits And Quality Of Life: A Time-Use Perspective Of Elderly Canadians,” Transport Policy, Vol. 16, Is. 1, January, pp. 1-11; at www.sciencedirect.com/science/article/pii/S0967070X0900002X. John Stanley, David A. Hensher, Janet Stanley, Graham Currie, William H. Greene and Dianne Vella-Brodrick (2011). “Social Exclusion and the Value of Mobility,” Journal of Transport Economics and Policy, Vol. 45, (2), pp. 197-222; at www.sortclearinghouse.info/research/861 and http://sydney.edu.au/business/__data/assets/pdf_file/0004/72913/itls-wp-10-14.pdf. Paul Starkey and John Hine (2014), Poverty and Sustainable Transport: How Transport Affects Poor People, with Policy Implications For Poverty Reduction—A Literature Review, Sustainable Low Carbon Transportation (www.slocat.net); at www.slocat.net/docs/1561.

Evaluating Transportation Equity Victoria Transport Policy Institute
63
Kerri Sullivan (2003), Transportation & Work: Exploring Car Usage and Employment Outcomes in the LSAL Data, NCSALL Occasional Paper (http://gseweb.harvard.edu/~ncsall); at www.ncsall.net/fileadmin/resources/research/op_sullivan.pdf. Emily Talen and Julia Koschinsky (2013), Equality of Opportunity Project (EOP), Arizona State University; at www.equality-of-opportunity.org. Marie Thynell (2009), Social Change and Urban Transport, Sustainable Urban Transit Technical Document #2, Sustainable Urban Transport Asia (www.sutp.org); at www.globalstudies.gu.se/digitalAssets/1299/1299523_TD02_SocialChange_Final.pdf. Helena Titheridge, et al (2014), Transport and Poverty A Review of the Evidence, University College London (www.ucl.ac.uk); at www.ucl.ac.uk/transport-institute/pdfs/transport-poverty. Geetam Tiwari (2014), Planning and Designing Transport Systems to Ensure Safe Travel for Women, Paper 2014-04, International Transport Forum (www.internationaltransportforum.org); at www.internationaltransportforum.org/jtrc/DiscussionPapers/DP201404.pdf. Toronto Public Health (2013), Next Stop Health: Transit Access and Health Inequities in Toronto, Toronto Public Health (www.toronto.ca/health); at www.toronto.ca/legdocs/mmis/2013/hl/bgrd/backgroundfile-56681.pdf. TRB (2011), Equity of Evolving Transportation Finance Mechanisms, Special Report 303, Transportation Research Board (www.trb.org); at http://onlinepubs.trb.org/onlinepubs/sr/sr303.pdf. TSG (2005), Measuring Accessibility as Experienced by Different Socially Disadvantaged Groups, Transport Studies Group – University of Westminster. Engineering and Physical Sciences Research Council (EPSRC) (www.wmin.ac.uk/transport/projects/samp.htm). Transportation Equity (www.civilrights.org/transportation), by the Leadership Conference, a coalition of more than 200 U.S. organizations to promote and protect the civil and human rights, provides information on transportation equity issues. TRISP (2005), “Distribution Of Benefits And Impacts On Poor People,” Economic Evaluation Notes, UK Department for International Development and the World Bank (www.worldbank.org); at http://go.worldbank.org/ME49C4XOH0. Summarizes transport project evaluation methods suitable for developing country applications. VTPI (2005), Online TDM Encyclopedia, Victoria Transport Policy Institute (www.vtpi.org). University de Valladolid (2005), The Right to Mobility (El Derecho a la Movilidad), Escuela de Arquitectura, Universidad de Valladolid; at www.ciudad-derechos.org/eindex.html.

Evaluating Transportation Equity Victoria Transport Policy Institute
64
USEPA (2013), Creating Equitable, Healthy, And Sustainable Communities: Strategies For Advancing Smart Growth, Environmental Justice, And Equitable Development, U.S. Environmental Protection Agency (www.epa.gov); at https://bit.ly/2HixRSI. Martin Wachs and Brian Taylor (1998), “Can Transportation Strategies Help Meet the Welfare Challenge?” Journal of the American Planning Association, Winter. Vol. 64, Issue 1. Martin Wachs (2003), Improving Efficiency and Equity in Transportation Finance, Center on Urban and Metropolitan Policy, Brookings Institute (www.brookings.edu/es/urban). Jarrett Walker (2012), Human Transit: How Clearer Thinking about Public Transit Can Enrich Our Communities and Our, Lives, Island Press (http://islandpress.org/book/human-transit); blog at www.humantransit.org. Rania Wasfi and David M. Levinson (2007), The Transportation Needs of People with Developmental Disabilities, Report no. CTS 07-02, Center for Transportation Studies, University of Minnesota (www.cts.umn.edu); at http://tinyurl.com/kylvx9w. D. Brad Wright (2008), “No Way to Go: A Review of the Literature on Transportation Barriers in Health Care,” World Transport Policy & Practice, Volume 14, Number 3 (www.eco-logica.co.uk), pp. 7-23; at www.eco-logica.co.uk/pdf/wtpp14.3.pdf. Chang Yi (2006), “The Impact of Public Transit on Employment Status: Disaggregate Analysis of Houston,” Transportation Research Record 1986 TRB (www.trb.org), pp. 137-144 (http://trid.trb.org/view.aspx?id=776961).
www.vtpi.org/equity.pdf