evaluation and identification of poly-microbial biofilms...
TRANSCRIPT

1
Evaluation and identification of poly-microbial biofilms on
natural green Gordal table olives
Antonio Benítez-Cabello · Verónica Romero-Gil · Francisco Rodríguez-Gómez · Antonio
Garrido-Fernández · Rufino Jiménez-Díaz · Francisco Noé Arroyo-López*
Food Biotechnology Department. Instituto de la Grasa (Agencia Estatal Consejo Superior de
Investigaciones Científicas, CSIC). University Pablo de Olavide, Building 46, Ctra. Utrera, km
1, 41013-Seville, Spain
Running title: Biofilm formation on natural green olives
Corresponding author: Francisco Noé Arroyo-López, Ph.D. Tel: 0034 954 611 550 ext
142. e-mail: [email protected]

2
Abstract 1
This work examines the formation of poly-microbial communities adhered to the 2
epidermis of natural green Gordal olives and the application of different methodologies for 3
recovery and counting of the microorganisms embed in olive biofilms. The fermentation 4
process was physicochemical and microbiologically monitored for 90 d, at which, 5
formation of true biofilms on the skin of fermented fruits was confirmed by scanning 6
electron microscopy. Then, samples of olives were taken and treated with sonication, 7
enzymes, mechanic homogenization with stomacher and ultrasonic bath for biofilm 8
disaggregation. The use of the stomacher for 1 min was the most effective treatment to 9
release the lactic acid bacteria (6.6 log10 cfu·g-1), whereas sonication for 5 min was the 10
most efficient method for quantification of yeasts (up to 3.5 log10 cfu·g-1). Molecular 11
identification of isolates obtained from natural Gordal olive biofilms revealed that 12
Lactobacillus pentosus was the only species found among lactic acid bacteria, while Pichia 13
membranifaciens was the dominant yeast species, with higher counts obtained for the 14
bacteria. 15
Keywords: Biofilm analysis · natural fermented olives · lactic acid bacteria · table olives · 16
yeasts 17

3
Introduction 18
Spain generates almost a quarter of the worldwide table olive production, which 19
nowadays exceeds 2.5 million tons per year (IOC 2013). Among the diverse processing 20
methods, alkali-treated green olives (Spanish style), ripe olives by alkaline oxidation 21
(Californian style) and directly brined olives (natural olives) are the most common 22
(Garrido-Fernández et al. 1997). However, only directly brined olives are produced 23
without alkaline treatment. Thereby, the fresh fruits, after a wash to remove dirty and 24
impurities, are placed in a 7-10% NaCl solution where the addition of different organic 25
acids (citric, acetic or lactic acid) to decrease the initial pH is a common practice. In this 26
way, the olive sweetening is achieved by diffusion of the bitter glucoside oleuropein from 27
fruits into the cover brines, where it is finally hydrolysed. 28
Lactic acid bacteria (LAB) are the most important microorganisms responsible for 29
the fermentation of NaOH treated table olives and other fermented vegetables (Hurtado et 30
al. 2012; Pérez-Díaz et al. 2013). By sugars consumption and subsequent production of 31
lactic acid and other antimicrobial metabolites, the LAB population contributes to the safe 32
preservation of olives by formation of lactic acid, reduction of pH and production of 33
bacteriocins. In directly brined natural olives, both LAB and yeasts may usually coexist 34
along the entire process although, sometimes, yeasts can play a more relevant role in the 35
fermentation due to partial inhibition of LAB by the presence of phenolic compounds 36
(Aponte et al. 2010; Balatsouras 1990; Brenes 2004; Garrido-Fernández et al. 1997; 37
Sánchez et al. 2000; Tassou et al. 2002). Thereby, regardless of olive processing, both 38
groups of microorganisms determine the quality, safety and flavour of the final products. 39

4
For many years, the microbiological study of table olive fermentations has been 40
exclusively focused on the isolation, identification and characterization of microorganisms 41
present in brines. However, recent studies carried out with table olives have shown the 42
presence of polymicrobial communities adhered to both biotic (olive skin) and abiotic 43
(glass slides) surfaces during the fermentation process (Arroyo-López et al. 2012a; 44
Domínguez-Manzano et al. 2012; Nychas et al. 2002). As observed by scanning electron 45
microscopy (SEM), these polymicrobial communities consisted of different yeast and 46
bacteria species embedded in a matrix which keeps them in close proximity. Detachment of 47
microorganisms from olive skin to determine the number of cells and further molecular 48
identification using a protocol consisting of an enzymatic method and RAPD analysis, 49
revealed the presence of Pichia galeiformis, Candida sorbosa and Geotrichum candidum for 50
the yeast species, and Lactobacillus pentosus for the LAB population (Arroyo-López et al. 51
2012a; Domínguez-Manzano et al. 2012). After detachment, both yeasts and bacteria 52
species yielded high population levels (>7 log10 cfu·g-1), thus showing that the olives could 53
be a good carrier of microorganisms. However, this methodology implies a wide variation 54
in the number of microbial cells recovered, which also depends on the group of 55
microorganisms. In fact, the cocktail of enzyme detaches completely the LAB population 56
after 6 h of incubation whereas the release of yeasts requires up to 16 h treatment 57
(personal communication). Greek researches have also evaluated mechanic disaggregation 58
with stomacher for detachment of Lactobacillus pentosus and Pichia membranifaciens 59
species from ripe black (darkened by oxidation) olives with good results, obtaining >7 60
log10 cfu·g-1 (Grounta and Panagou 2014). However, comparison of results is difficult 61
because the use of different methodologies. Thus, bearing in mind the transcendence of 62
further studies on olive biofilms, the standardization of a rapid and accurate procedure to 63
recover microbes from these fruits is needed. 64

5
In this work, we study the fermentation process and the formation of true biofilms 65
on natural green Gordal table olives. For the quantification of the microbial populations on 66
olives, several methods for detachment, recovery and counting of microorganisms attached 67
to fruits have been assessed. Furthermore, the biodiversity of the most important LAB and 68
yeast species present until now unexplored biofilms formed in this type of table olive 69
preparation was investigated by molecular methods. 70
Material and methods 71
Olive fermentations 72
Olive fruits from Gordal variety were obtained during the 2013/2014 season at the 73
green ripening stage from the olive processing plant Ntra. Sra. de las Virtudes S.C.A. (La 74
Puebla de Cazalla, Seville, Spain), and transported to our laboratory where they were 75
classified by size, washed and directly brined in polyethylene fermentation vessels. The 76
process was achieved as industry, by immersing 20 kg of fruits into 13 l of brine (10% 77
NaCl, 0.5 % acetic acid and 0.1% citric acid). The fermentation was let to evolve 78
spontaneously. The study was carried out in two independent fermentation vessels and 79
monitored during 90 d. 80
Analysis of the fermentation brines 81
Physicochemical control of the fermentation was achieved through periodical 82
analyses of brine (0, 10, 20, 40, 60 and 90 d) for determination of pH, NaCl concentration 83
(%, wt·vol-1), titratable acidity, expressed as g lactic acid per 100 ml of brine, and combined 84
acidity (undissociated organic salts, expressed as Eq·l-1) (Garrido-Fernández et al. 1997). 85
6
To study the evolution of the different microbial populations, brine samples were 86
taken at different times throughout fermentation (0, 3, 6, 10, 20, 30, 60, 90 d) and diluted, if 87
necessary, in a sterile saline solution (0.9% NaCl). Then, they were plated using a Spiral 88
System (model dwScientific, Don Whitley Scientific Limited, England) on appropriate 89
media. Enterobacteriaceae were counted on Crystal Violet Neutral-Red Bile Glucose (VRBD) 90
agar (Merck, Darmstadt, Germany), LAB were proliferated on de Man, Rogosa and Sharpe 91
(MRS) agar (Oxoid, Basingstoke, Hampshire, England) supplemented with 0.02% sodium 92
azide (Sigma, St. Luis, USA), and yeasts were grown on yeast-malt-peptone-glucose 93
medium (YM) agar (Difco, Becton and Dickinson Company, Sparks, MD, USA) supplemented 94
with oxytetracycline and gentamicin sulphate (0.005%) as selective agents. The plates 95
were incubated at 30ºC for 48-72 h and counted using a CounterMat v.3.10 (IUL, Barcelona, 96
Spain) image analysis system. Brine counts were expressed as log10 cfu·ml-1. 97
The plot of the log10 cfu·ml-1 versus time for microorganisms produced a sigmoid-98
shape curve that was fitted using the reparameterized Gompertz equation proposed by 99
Zwietering et al. (1990), which has the following expression: 100
y =Nmax*exp(-exp{(µmax*e*(λ- x))/Nmax+1}) 101
where y is the microbial concentration (log10 cfu·ml-1) at time t, x is the time (days), Nmax is 102
the maximum population reached (log10 cfu·ml-1), µmax is the maximum growth rate (d-1) 103
and λ is the lag phase (d). These parameters were obtained by a nonlinear regression 104
procedure, minimizing the sum of squares of the difference between the experimental data 105
and the fitted model, i.e. loss function (observed - predicted). This task was accomplished 106
using the nonlinear module of the Statistica 7.1 software package (StatSoft Inc, Tulsa, OK, 107
USA) and its Quasi-Newton option. Fit adequacy was checked by the proportion of total 108
variance explained by the model (R2). 109
7
In situ observation of olive epidermis 110
The presence of biofilms on the epidermis of fruits at the end of fermentation (90 d) 111
was confirmed by using SEM techniques. For this purpose, olives were treated following 112
the methodology described by Krouwilleypitski et al. (2009) with slight modifications. 113
First, fruits were rinsed twice for 15 min in a PBS buffer solution (8.0 g·l-1 NaCl, 0.2 g·l-1 KCl, 114
1.44 g·l-1 Na2HPO4, 0.24 g·l-1 KH2PO4, pH 7.4 adjusted with HCl 1M) for removing non-115
adhering cells, and then fixed in 2.5 % glutaraldehyde (Sigma-Aldrich, St. Louis, USA) in 116
PBS for 2.5 h. Later, the olives were dehydrated through a graded ethanol series (50%, 117
70%, 80%, 90%, 95% and 100%, 5 min in each one). Finally, fruits were treated for 20 min 118
in 2-methyl-2-propanol. For SEM observation, 2 mm2 slices of the skin of olives were taken 119
and placed on glass slides and coated with gold in a Scancoat Six SEM sputter coater 120
(Edwards, Crawley, England). Pictures were taken with a JEOL JSM- 6460LV SEM model 121
(JEOL USA, Inc., Peabody, MA) in the Technology and Innovation Research Center at 122
University of Seville (CITIUS, Seville, Spain). 123
Assessment of the efficacy of different methodologies for the detachment/recovery of 124
microorganisms from biofilms and fruits 125
All methods described below were applied to 2 olives removed under sterile 126
conditions from the fermentation vessels at the end of the fermentation process (90 d), 127
except the ultrasonic bath which used 5 fruits. For removing microbial non-adhered cells, 128
fruits were previously washed for 30 min in sterile distilled water, weighed (to further 129
refer plate counts of microorganisms as log10 cfu·g-1) and spread (after application of 130
different treatments) onto the different culture media specific for Enterobacteriaceae, 131
yeasts and LAB. Values (means and standard deviations) were obtained from 6 132
measurements per level (n=6), with three technical replicates per independent duplicate. 133
8
Enzymatic method 134
The protocol developed by Böckelmann et al. (2003) was slight adapted to the 135
specific characteristics of table olives. Three different types of enzymes (lipase, β-136
galactosidase and α-glucosidase) were purchased (Sigma-Aldrich, St. Louis, USA) and 137
mixed in the laboratory to obtain an enzymatic cocktail with the following concentrations: 138
lipase (0.74 mg·ml-1), β-galactosidase (0.64 mg·l-1), and α-glucosidase (1.05 µL·ml-1). α-139
glucosidase and β-galactosidase were chosen for the cleavage of the α-D-glucoside residues 140
and β-galactosidic bonds of exopolysaccharides, respectively, while lipase was added to the 141
enzyme mixture as lipids represent a considerable part of this component from biofilms 142
(Böckelmann et al. 2003). It was used at full (standard), half (1/2), double (×2) and four 143
(x4) times concentrations taking as references previous works carried out in table olives 144
(Arroyo-López et al. 2012a; Domínguez-Manzano et al. 2012). The fruits were incubated at 145
30 ºC for 1 h in 50 ml of PBS buffer containing the different enzyme preparations. The 146
resultant suspension was centrifuged at 9,000 ×g for 10 min at 4 ºC, the pellet was re-147
suspended in 2 ml of PBS buffer and finally spread. 148
Sonication method 149
In this case, fruits were immersed into 50 ml of a sterile saline solution (0.9% NaCl), 150
and then sonicated using an ultrasonic liquid processor model MicrosonTm XL 2000 151
(QSonica LLC., Newtown, CT, USA) which works at a wave frequency of 22.5 kHz. The 152
processing tip of the sonicator was dipped 1 cm in the liquid. The olives were sonicated for 153
0.08, 0.016, 0.5, 1, 2, 5, 10, 15, 20 and 30 min at an ultrasound power of 6W (50 % of the 154
total intensity). Suspension of the appropriate dilutions were spread plated. 155
Stomacher method 156

9
Fruits were pitted, weighed and immediately transferred into a stomacher bag 157
containing 75 ml of a sterile saline solution (0.9% NaCl). Then, pulp was homogenized for 158
1, 5, 10, 15 and 20 min at maximum speed (300 rpm) in a stomacher model Seward 400 159
(Seward Medical, Ltd., West Sussex, England). Suspension of the appropriate dilutions were 160
then spread plated. 161
Ultrasonic bath method 162
Fruits were immersed into 35 ml of a sterile saline solution (0.9% NaCl) and treated 163
with an ultrasound bath model Ultrasons 3000513 (J.P. Selecta, S.A., Barcelona, Spain), 164
which works at a power of 360 W. The olives were treated for 1, 5, 10, 15, 20 and 40 min. 165
Samples of the resulting suspensions were taken, diluted in saline solution if needed, and 166
then spread plated. During the entire process, the water in the bath was kept constant at 30 167
ºC by adding ice. 168
Molecular characterization and identification of microorganisms 169
For characterization of yeast isolates, a RAPD-PCR analysis with M13 primer was 170
followed according to the protocol described by Tofalo et al. (2009), while in the case of 171
lactobacilli, a rep-PCR analysis was performed using GTG5 primer (Gevers et al. 2001). PCR 172
products were electrophoresed in a 2% agarose gel, stained with ethidium bromide (20 173
min) and visualized under ultraviolet light. The resulting fingerprints were digitally 174
captured and analysed with the Bio-Numerics 6.6 software package (Applied Maths, 175
Kortrijk, Belgium). The similarity among digitalized profiles was calculated using the 176
Pearson product-moment correlation coefficient. The dendrogram was generated by means 177
of the Unweighted Pair Group Method using the Arithmetic Average (UPGMA) clustering 178
algorithm. The reproducibility and sensitivity of the method was previously evaluated 179
10
using, as internal control, 7 LAB and 8 yeast strains belonging to species Lactobacillus 180
pentosus, Lactobacillus plantarum, Lactobacillus paraplantarum, Saccharomyces cerevisiae, 181
Wickerhamomyces anomalus, Candida boidinii and Pichia galeiformis obtained from the 182
Table Olives Microorganisms Collection from Instituto de la Grasa (CSIC, Spain) (data not 183
shown). Reproducibility of the technique, in the worst case, was determined in 85.1% and 184
80.5% for LAB and yeasts, respectively. 185
Then, molecular identification of representative genotypes was performed using 186
multiplex PCR of recA gene (Torriani et al., 2001) and RFLP analysis of dnaK gene (Huang et 187
al. 2010) in the case of LAB, or RFLP analysis of 5.8S ITS region (Esteve-Zarzoso et al. 1999) 188
in the case of yeasts. The yeast profiles generated were then compared with existing 189
databases (www.yeast-id.org, University of Valencia and CSIC, Spain). 190
Statistical analysis 191
An analysis of variance was performed by means of the one-way ANOVA module of 192
Statistica 7.1 software to check for significant differences among different levels and 193
microbial recovery methods. For this purpose, a post-hoc comparison was applied by 194
means of the Scheffé test. 195
Results and discussion 196
Evolution and control of fermentation 197
Titratable acidity and pH are critical parameters to monitor completion of a safe 198
olive fermentation and control the growth of spoilage and pathogenic microorganisms 199
during fermentation (Garrido-Fernández et al. 1997; Perricore et al. 2010). In this 200
experiment cover brine pH increased rapidly from an initial value of 2.5 to 3.5 after olive 201

11
brining (Figure 1a), due to the diffusion of the organic acids into the flesh. The equilibrium 202
between the olive flesh and cover brine was reached on day 9, after which the pH value 203
oscillated around 3.5 units until the end of the fermentation. On the contrary, titratable 204
acidity decreased during the first 18 days from 0.95 to 0.80 g lactic per 100 ml due to, as in 205
the case of pH, the absorption of organic acids by the pulp. However, a progressive increase 206
was observed after the 30th day, possibly due to the production of lactic acid by the LAB 207
population, which reached a final value of approximately 1.1 g lactic per 100 ml brine in the 208
processed product (Figure 1b). Combined acidity increased throughout the fermentation 209
from initial 0.000 to final 0.035 Eq·l-1, while salt concentration decreased from the initial 210
6.0 to a final 4.5% NaCl, showing the major drop during the first 10 days (data not shown). 211
These changes in pH and salt, together with combined and titratable acidities obtained, are 212
typical of directly brined table olive fermentations (Garrido-Fernández et al. 1997). 213
Furthermore, the pH value far below the limit established for green natural olives (<4.3) in 214
the Table Olive Standard, and the titratable acidity value above 1.0 g lactic per 100 ml brine 215
are important aspects to ensure a safe product (Garrido-Fernández et al. 1997; IOC 2004). 216
Hence, these natural green Gordal olives followed an adequate fermentation process from 217
the physicochemical point of view. 218
Regarding evolution of microbial populations in brines, Enterobacteriaceae were not 219
detected along the 90 d of the fermentation process. Low pH levels have showed to exert a 220
considerable inhibitory effect on this microbial group (Garrido-Fernández et al. 1997). On 221
the contrary, LAB and yeast populations in brine showed the typical growth for this type of 222
processes. Their evolutions could be well fitted with the reparameterized Gompertz 223
equation for growth (Zwietering et al. 1990), with a R2 (quality of the adjustment) of 0.987 224
for LAB and 0.865 for yeasts (Figure 2). The fitted parameters obtained for LAB population 225
(Figure 2a) showed a lag phase (λ) of 3.649±0.778 d, a maximum growth rate (μmax) of 226

12
0.669±0.106 (d-1) and a maximum population size (Nmax) of 6.727±0.239 (log10 cfu·ml-1). In 227
the case of yeasts (Figure 2b), the values obtained were: λ=0.227±3.483 d, μmax= 228
0.228±0.079 d-1, and Nmax=5.066±0.687 log10 cfu·ml-1. Therefore, the process was clearly 229
dominated by LAB, with higher growth rate than yeast (0.669 vs 0.228 d-1) and also 230
maximum population levels (6.73 vs 5.1 log10 cfu·ml-1) in brines, which were obtained 231
approximately at the 30th day of fermentation (Figure 2) and remained stable until the end 232
of the process. The counts and behaviour obtained for both microbial groups throughout 233
the fermentation process can also be considered suitable for this type of table olive 234
elaboration (Arroyo-López et al. 2012b; Nychas et al. 2002). 235
SEM 236
Nychas et al. (2002) reported for the first time using SEM techniques the presence of 237
both LAB and yeast populations colonizing the epidermis of fermented Greek black olives. 238
However, these authors did not report the presence of a matrix surrounding 239
microorganisms (true biofilms). Years later, the formation of true mixed biofilms (with 240
exopolyssacharide matrix) between LAB and yeasts during Spanish-style green table olive 241
fermentations was reported for different types of olive varieties by Arroyo-López et al. 242
(2012a) and Domínguez-Manzano et al. (2012). Recently, Grounta and Panagou (2014) also 243
have showed by SEM the formation of biofilms on Greek black oxidized olives. In this work, 244
we describe for the first time the formation of microbial biofilms on the epidermis of 245
Gordal fruits processed as green directly brined “natural” olives. 246
At the end of the fermentation, both LAB and yeasts appear to be strongly adhered 247
to the epidermis of olives and embedded in a matrix, which is a clear evidence of the 248
presence of true biofilms in this type of table olive elaboration (Figure 3). SEM pictures also 249

13
show some microbial cells apparently ready for leaving the biofilms, or just trying to find 250
physical space to form a thicker layer. 251
Comparison of different methods for quantification and recovery of biofilms 252
Usually, once the biofilm has been formed, the microorganisms are strongly adhered 253
to the epidermis of the olives and are not released with a simple washing procedure 254
(Arroyo-López et al. 2012a; Domínguez-Manzano et al. 2012). Furthermore, the efficiency 255
of the procedures for the biofilm recovery has been scarcely tested. Olives from this 256
experiment have been used to compare different procedures for detachment and 257
quantification of microorganisms forming biofilms. The efficacy of each treatment was 258
measured by statistical analysis of the microorganism mean counts released after its 259
application. 260
Sonication method 261
When a biofilm is sonicated, microorganisms are detached by a mechanism named 262
cavitation. This term refers to the generation, growth and collapse of microbubbles in the 263
sonicated liquid. The changes in pressure can lead to the biofilm disaggregation (Piyasena 264
et al. 2003). In addition of temperature and viscosity of the liquid, frequency and amplitude 265
of the ultrasonic waves influence the degree of cavitation and therefore the effectiveness of 266
the treatment (Mason et al. 1996; Sala 1995). A previous work has reported bactericide 267
and bacteriostatic effects by gradually increasing time and intensity of sonication 268
(Tsukamoto et al. 2004). In this work, sonication was fixed at medium intensity (6W), 269
varying sonication times to determine the more effective time to disaggregate the biofilm 270
and removing the microorganisms without producing lysis or cell inactivation. 271

14
The effect of different times of sonication on the recovery of LAB and yeast 272
populations from the Gordal olive biofilms showed that the LAB counts released from the 273
biofilm were higher than those of yeasts, and that both group of microorganisms increased 274
their detachment as the time of sonication increased up to 15 min (Figure 4). Thereby, 275
there was a significant difference in LAB population between the lowest time of sonication 276
(0.083 min) and the longer treatment (30 min), which released ~4 log10 cfu·g-1 and ~6 277
log10 cfu·g-1, respectively. Sonication for periods above 5 min led to similar counts (Table 278
1). On the contrary, there were no significant differences among the yeast populations from 279
the diverse treatment levels (period of times), and the counts ranged from ̴ 2 log10 cfu·g-1 280
(0.166 min) to ̴ 4 log10 cfu·g-1 (10 min). 281
Enzymatic method 282
Detachment of biofilms in table olives by using a cocktail of enzymes has been 283
previously reported in the literature (Arroyo-López et al., 2012a; Domínguez-Manzano et 284
al. 2012). Usually, an incubation time of 12 h is applied. However, in this work we have 285
used lower incubation time (1 h) to avoid exceeding the generation time of LAB and yeasts, 286
which according to the literature, in optimal conditions, is approximately 1.1 h for many 287
species of LAB, and 2 h for the growth-faster yeast species (Brizuela et al. 2001; Nagpal and 288
Kaur 2011; Willey et al. 2011). In this way, duplication of the microorganisms that are 289
released is prevented and time is reduced. Böckelmann et al. (2003) used an incubation 290
time of 90 min for detachment of biofilms from soils using the same cocktail of enzymes. No 291
bacterial growth was observed during treatment for this period of time. 292
After application of the enzymatic method, LAB population levels obtained from 293
biofilms were considerably higher (approx. 5 log10 cfu·g-1) than yeasts (about 1.5 log10 294
cfu·g-1), with no statistical significant differences between different levels of the enzyme 295

15
cocktail within the same microbial group (see Table 1 and Figure 4). Therefore, according 296
to the data presented in this study, the enzyme cocktail used in the literature could be 297
reduced to a half concentration without a loss of effectiveness in the detachment of 298
biofilms from the olives (Arroyo-López et al. 2012a; Dominguez-Manzano et al. 2012). Due 299
to the heterogeneity of the extracellular polysaccharides, a mixture of enzymes activities is 300
usually necessary for destabilization of biofilms (Arroyo-López et al. 2012a; Dominguez-301
Manzano et al. 2012). These enzymes have targets for the lipids, α-D-glucoside residues 302
and β-galactosidic bonds present in the exopolysaccharide matrix (Böckelmann et al. 303
2003). 304
Stomacher method 305
Release of microorganisms from biofilms using a stomacher apparatus is basically a 306
physical method where the entire structure of the olives, and consequently the biofilms, are 307
disaggregated by using paddles to homogenize the food sample immersed into a liquid 308
medium. This method is widely used in the literature to count microorganisms in solid 309
foods in which 1-2 min of application is currently used (Grounta and Panagou 2014; 310
Medina et al. 2007). 311
After application of stomacher for different periods of time, the population levels of 312
LAB obtained (from 6.5 to 7.0 log10 cfu·g-1) were much higher than those of yeasts (in many 313
cases lower than 1 log10 cfu·g-1) with no statistical significant differences between times of 314
application within the same microbial group (Table 1, Figure 4). In table olives, Grounta 315
and Panagou (2014) used a stomacher time of 2 min to recover microorganisms present in 316
fruits, obtaining a maximum recovery of 7 log10 cfu·g-1 for bacteria and 5 log10 cfu·g-1 for 317
yeasts. 318

16
Ultrasonic bath method 319
Ultrasonic baths are commonly used for the sterilization of laboratory and medical 320
material (Raffin et al. 2008). By immersing the samples into a liquid medium, the ultrasonic 321
wave is applied in different directions setting a specific frequency. The immersion of the 322
naturally fermented olives for diverse periods of time in an ultrasound bath working at 50 323
Hz, showed that LAB population levels obtained ( ̴5 log10 cfu·g-1) were higher than those of 324
yeasts (frequently lower than 1 log10 cfu·g-1), with no statistical significant differences 325
between application times within the same microbial group (Table 1, Figure 4). 326
Statistical comparison between methods 327
Table 1 shows the average counts obtained for the different methods and levels 328
assayed. As can been deduced, there were not statistical significant differences within the 329
same detachment methodology among the different levels, except for sonication in the 330
release of LAB. 331
As a summary, Table 2 shows the statistical comparison (Scheffé test) among the 332
greater LAB and yeast counts obtained within methodologies. The statistical analysis 333
shows that the best method (highest counts) for recovery of LAB was stomacher applied 334
for 1 min (6.6 log10 cfu·g-1) whereas sonication for 5 min (3.53 log10 cfu·g-1) was the 335
treatment which led to the best results for yeasts. However, we must bear in mind that 336
with the stomacher method is not possible to distinguish between microorganisms which 337
are only present in the superficial biofilms, or inside the fruits. In fact, Nychas et al. (2002) 338
showed by SEM that a rich biofilm was developed on the epicuticular wax of the olive skin 339
during fermentation, with yeasts dominated in the stomatal openings, but bacteria were 340
more numerous in intercellular spaces in the sub-stomatal flesh. 341

17
Characterization and identification of microorganisms obtained from biofilms 342
Twenty LAB (10 of them isolated from olive epidermis and other 10 isolated from 343
brines) and 11 yeast isolates (2 isolated from fruits and 9 from brines) were randomly 344
obtained at the end of the fermentation process. A reduced number of yeast isolates was 345
obtained because of the lower counts obtained from olive surface for this type of 346
microorganisms at the end of fermentation. 347
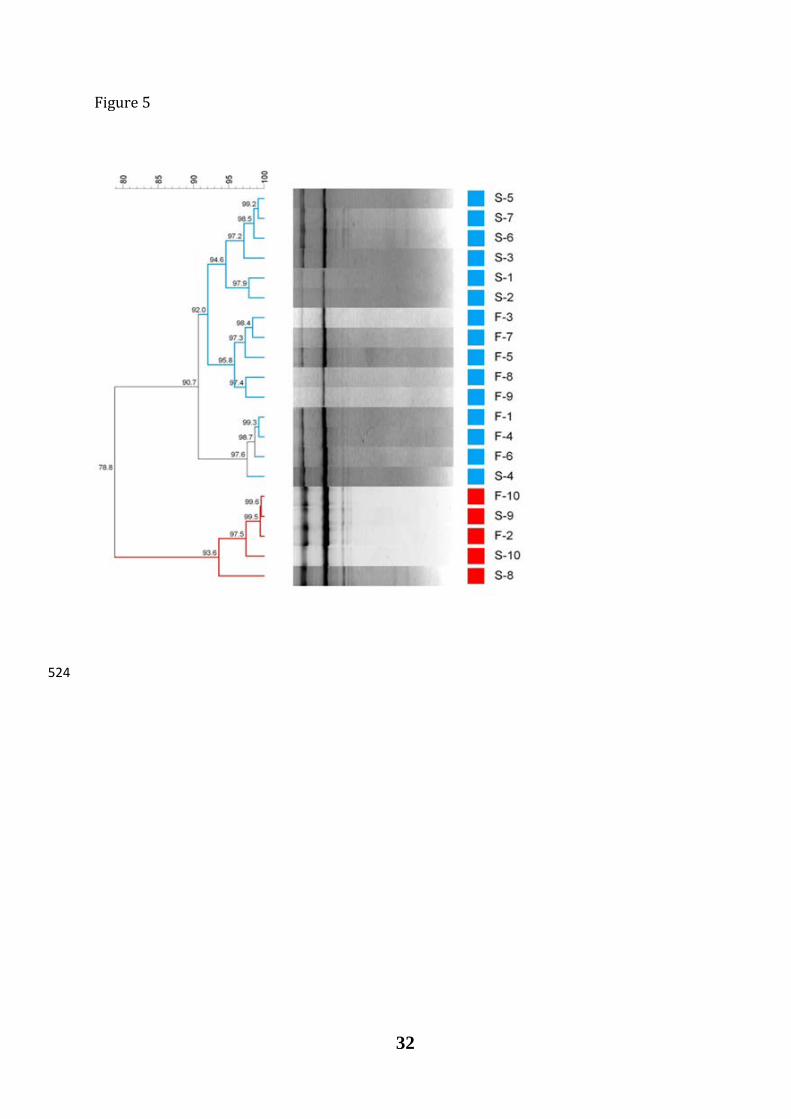
The dendrogram generated by rep-PCR with primer GTG5 using the patterns profile 348
of the 20 LAB isolates randomly obtained at the end of fermentation (Figure 5) showed that 349
the isolates formed two groups clearly differentiated, sharing 78.8% similarity in their 350
banding profile. The first group included isolates obtained from brines (7) and fruits (8), 351
with a coefficient of similarity of 90.7%. The second group presented a coefficient of 352
similarity of 93.6%, being formed by 2 isolates of fruits and 3 isolates of brine. Because of 353
the reproducibility of the rep-PCR analysis for LAB was determined in 85.1%, it was 354
inferred that only two genotypes were present among the LAB population in the 355
fermentation of natural green Gordal olives. Two representative isolates from each 356
genotype (S5, S7, F10 and S9) were selected for identification purposes. Using the 357
multiplex PCR method based on recA gene (Torriani et al. 2001) and RFLP analysis based 358
on dnaK gene (Huang et al. 2010), all selected isolates were identified as Lactobacillus 359
pentosus (multiplex PCR amplification of recA gene of 218 bp; profile of RFLP dnaK gene 360
with TSP509I enzyme of 470+290+200+140 bp), thus indicating the presence of two 361
different strains of the same species in the fermentation process. The presence of L. 362
pentosus in vegetable fermentations, and particularly in biofilms of olives, has already been 363
previously described (Arroyo-López et al. 2012a; Domínguez-Manzano et al. 2012; Grounta 364
and Panagou 2014). 365

18
The dendrogram obtained by RAPD-PCR with primer M13 using the patter profiles 366
of eleven yeast isolates, randomly selected from brines (9) or fruits (2) (Figure 6) showed 367
the presence of two major groups sharing a low homology among them according to their 368
banding profiles (9.6%). Taking into account the technique reproducibility for yeasts 369
(80.5%), four different genotypes were distinguished. One representative isolate from each 370
group (F2, S8, S3 and S4) was selected for identification purposes. 371
The restriction profiles generated by a battery of endonucleases on the 5.8-ITS 372
region (Table 3) and further comparison in yeast data base, showed that isolates S4 and S8 373
obtained from brines belong to the same species (P. galeiformis), while the isolate F2 374
obtained from fruits was identified as P. membranifaciens. Both yeast species have 375
previously been isolated from diverse table olive elaborations (Arroyo-López et al. 2012b) 376
and biofilms (Grounta and Panagou 2014). The profile restriction obtained for S3 isolate 377
has not been found in the yeast database or in the literature, and further studies must be 378
performed for its identification. 379
Conclusions 380
In the present study, it has been shown for the first time the formation of poly-381
microbial biofilms on natural green Gordal olives. The highest recovery of LAB from these 382
biofilms was achieved by using the stomacher for 1 min, while the highest yeast 383
detachment was observed after sonication for 5 min. Thus, a combined treatment 384
consisting of sonication and subsequent physical disaggregation of olives with stomacher 385
could be very useful for a complete release of the different group of microorganisms, which 386
should be confirmed in further studies. L. pentosus and P. membranifaciens were recovered 387
from these biofilms at the end of the fermentation, with higher counts obtained for the 388

19
bacteria. Hence, the study of the microorganisms forming biofilms on the epidermis of 389
natural green table olives and the searching of those with beneficial properties is an 390
interesting challenge because these fruits can also carry a high number of microorganisms 391
(>6.5 log10 cfu·g-1). The use of natural olives for the development of potential probiotic 392
olives is interesting due to is friendly (absence of lye treatment) and low energy cost 393
processing. 394
Acknowledgements 395
The research leading to these results has received funding from the Spanish 396
Government (project OliFilm AGL-2013-48300-R: www.olifilm.science.com.es), and the 397
Junta de Andalucía (through financial support to group AGR-125). A. Benítez and F.N. 398
Arroyo-López wish to express thanks to the Spanish Government for their pre-doctoral 399
fellowship and postdoctoral research contract (Ramón y Cajal), respectively. V. Romero-Gil 400
would like also to thank the AgriFood Campus of International Excellence (ceiA3), Bank of 401
Santander, Spanish Government and ‘Aloreña de Málaga’ Olive Manufacturing Association 402
for her pre-doctoral fellowship (training program of Ph.D. in companies). 403
Conflict of interest 404
The authors declare that they have not conflict of interest. 405
References 406
Aponte M, Ventorino V, Blaiotta G, Volpe G, Farina V, Avellone G, Lanza CM, Moschetti G 407
(2010) Study of green Sicilian table olive fermentations through microbiological, 408
chemical and sensory analyses. Food Microbiol 27:162-170. 409

20
Arroyo-López FN, Bautista-Gallego J, Domínguez-Manzano J, Romero-Gil V, Rodriguez-410
Gómez F, García-García P, Garrido-Fernández A, Jiménez-Díaz R (2012a) Formation of 411
lactic acid bacteria-yeasts communities on the olive surface during Spanish-style 412
Manzanilla fermentations. Food Microbiol 32:295-301. 413
Arroyo-López FN, Romero-Gil V, Bautista-Gallego J, Rodríguez-Gómez F, Jiménez-Díaz R, 414
García-García P, Querol A, Garrido-Fernández A (2012b) Yeasts in table olive 415
processing: desirable or spoilage microorganisms?. Int J Food Microbiol 160:42-49. 416
Balatsouras G (1990) Edible olive cultivars, chemical composition of fruit, harvesting, 417
transportation, processing, sorting and packaging, styles of black olives, deterioration, 418
quality standards, chemical analysis, nutritional and biological value of the end 419
product. Olio d’oliva e olive da tavola: tecnologia e qualità 25:291-330. 420
Böckelmann U, Szewzyk U, Grohmann E (2003) A new enzymatic method for the 421
detachment of particle associated soil bacteria. J Microbiol Methods 55:201-211. 422
Brenes M (2004) Olive Fermentation and Processing: Scientific and Technological 423
Challenges. J Food Sci 69:FMS33-FMS34. 424
Brizuela MA, Serrano P, Pérez Y (2001) Studies on probiotics properties of two 425
lactobacillus strains. Brazilian Arch Biol Technol 44:95-99. 426
Domínguez-Manzano J, Olmo-Ruiz C, Bautista-Gallego J, Arroyo-López FN, Garrido-427
Fernández A, Jiménez-Díaz R (2012) Biofilm formation on abiotic and biotic surfaces 428
during Spanish style green table olive fermentation. Int J Food Microbiol 157:230-238. 429

21
Esteve-Zarzoso B, Belloch C, Uruburu F, Querol A (1999) Identification of yeasts by RFLP 430
analysis of the 5.8S rRNA gene and the two ribosomal internal transcribed spacers. Int 431
J Syst Bacteriol 49:329-337. 432
Garrido Fernández A, Fernandez-Diez M, Adams MR (1997) Table olives: production and 433
processing. Chapman and Hall, London (U.K). 434
Gevers D, Huys G, Swings J (2001) Applicability of rep-PCR fingerprinting for identification 435
of Lactobacillus species. FEMS Microbiol Lett 205:31-36. 436
Grounta A, Panagou EZ (2014) Mono and dual species biofilm formation between 437
Lactobacillus pentosus and Pichia membranifaciens on the surface of black olives under 438
different sterile brine conditions. Annals Microbiol 64:1757-1767. 439
Huang C, Lee F, Liou J (2010) Rapid discrimination and classification of the Lactobacillus 440
plantarum group based on a partial dnaK sequence and DNA fingerprinting 441
techniques. Antonie van Leeuwenhoek 97:289-296. 442
Hurtado A, Reguant C, Bordons A, Rozès N (2012) Lactic acid bacteria from fermented table 443
olives. Food Microbiol 31:1-8. 444
IOC (International Olive Oil Council) (2004) Trade standard applying to table olives. 445
Resolution RES-2/91-IV/04. Madrid, Spain. 446
Kroupitski Y, Golberg D, Belausov E, Pinto R, Swartzberg D, Granot D, Sela S (2009) 447
Internalization of Salmonella enterica in leaves is induced by light and involves 448
chemotaxis and penetration through open stomata. Appl Environ Microbiol 75:6076-449
6086. 450

22
Mason TJ, Paniwnyk L, Lorimer JP (1996) The uses of ultrasound in food technology. 451
Ultrason Sonochem 3:S253-S260. 452
Medina E, Romero C, Brenes M, De Castro A (2007) Antimicrobial activity of olive oil, 453
vinegar, and various beverages against foodborne pathogens. J Food Prot 70:1194-454
1199. 455
Nagpal R, Kaur A (2011) Synbiotic effect of various prebiotics on in vitro activities of 456
probiotic lactobacilli. Ecol Food Nutr 50:63-68. 457
Nychas GE, Panagou EZ, Parker ML, Waldron KW, Tassou CC (2002) Microbial colonization 458
of naturally black olives during fermentation and associated biochemical activities in 459
the cover brine. Lett Appl Microbiol 34:173-177. 460
Peréz-Díaz IM, Breidt F, Buescher RW, Arroyo-López FN, Jiménez-Díaz R, Garrido-461
Fernández A, Bautista-Gallego J, Yoon SS, Johanningsmeire SD (2013) Fermented and 462
Acidified Vegetables. In: Compendium of methods for the microbiological examination 463
of foods. 4th Edition (Ed. Pouch-Downes, F., and Ito, K.). American Public Health 464
Association, Washington, USA. pp- 521-532. 465
Perricone M, Bevilacqua A, Corbo MR, Sinigaglia M (2010) Use of Lactobacillus plantarum 466
and glucose to control the fermentation of “Bella di Cerignola” table olives, a 467
traditional variety of Apulian region (southern Italy). J Food Sci 75:M430-M436. 468
Piyasena P, Mohareb E, McKellar R (2003) Inactivation of microbes using ultrasound: a 469
review. Int J Food Microbiol 87:207-216. 470
Raffin J, Peyron I, Sarfati A (2008) Ultrasounds in sterilization: Study on recommendations 471
follow-up. Pharmacien Hospitalier 43:81-86. 472

23
Sala Trepat FJ (1995) Food preservation through combined processes. Microbiol SEM 473
11:23-32. 474
Sánchez AH, De Castro A, Rejano L, Montaño A (2000) Comparative study on chemical 475
changes in olive juice and brine during green olive fermentation. J Agric Food Chem 476
48:5975-5980. 477
Tassou CC, Panagou EZ, Katsaboxakis KZ (2002) Microbiological and physicochemical 478
changes of naturally black olives fermented at different temperatures and NaCl levels 479
in the brines. Food Microbiol 19:605-615. 480
Tofalo R, Chaves-López C, Di Fabio F, Schirone M, Felis GE, Torriani S, Paparella A, Suzzi G 481
(2009) Molecular identification and osmotolerant profile of wine yeasts that ferment a 482
high sugar grape must. Int J Food Microbiol 130:179-187. 483
Torriani S, Felis GE, Dellaglio F (2001) Differentiation of Lactobacillus plantarum, L. 484
pentosus, and L. paraplantarum by recA Gene Sequence Analysis and Multiplex PCR 485
Assay with recA Gene-Derived Primers. Appl Environ Microbiol 67:3450-3454. 486
Tsukamoto I, Yim B, Stavarache CE, Furuta M, Hashiba K, Maeda Y (2004) Inactivation of 487
Saccharomyces cerevisiae by ultrasonic irradiation. Ultrason Sonochem 11:61-65. 488
Willey JM, Sherwood L, Woolverton CJ (2011) Prescott's microbiology, McGraw-Hill. 489
Zwietering MH, Jongenburger I, Rombouts FM, Van't Riet K (1990) Modeling of the 490
bacterial growth curve. Appl Environ Microbiol 56:1875-1881. 491

24
Figure Legends 492
493
Figure 1. Evolution of pH (a) and titratable acidity (b) throughout fermentation of Gordal 494
directly brine natural table olives. 495
496
Figure 2. Reparameterized Gompertz equation fit to the plate counts (log10 cfu·ml-1) of LAB 497
(a) and yeast (b) populations in brines throughout the fermentation process of directly 498
brined Gordal variety olives. 499
500
Figure 3. SEM pictures obtained from the epidermis of natural green Gordal olives after 90 501
days of fermentation. Arrows indicate LAB and yeasts surrounded by a matrix in the 502
biofilms. 503
504
Figure 4. Counts (log10 cfu·g-1) of the LAB and yeasts populations obtained after application 505
of different sonication times, enzymatic concentrations, stomacher and ultrasonic bath 506
times to the biofilms formed on the skin of directly brined Gordal olives. The means and the 507
associated deviations were obtained from n=6 measurements for each level. Temperature 508
in the ultrasonic bath was kept constant at 30 °C by ice addition. 509
510
Figure 5. Dendrogram generated after bioinformatic analysis with Bionumerics 6.6 511
software package of the rep-PCR profiles obtained with GTG5 primer for the different LAB 512
randomly isolated from brines (S) or biofilms (F) at the end of fermentation (90 d). 513
514
Figure 6. Dendrogram generated after bioinformatic analysis with Bionumerics 6.6 515
software package of the RAPD-PCR profiles obtained with M13 primer for the different 516
yeast isolates randomly obtained from brines (S) or biofilms (F) at the end of fermentation 517
(90 d). 518

25
Table 1. Average plate counts (log10 cfu·g-1) (n=6) of the LAB and yeasts populations adhered to the olive surface after application of the different detachment methods and levels.
Note: Standard deviation in parentheses. Values followed by different superscript letters, within the same row, are significantly different according to Scheffé post-hoc comparison test.
Stomacher Levels 1 min 5 min 10 min 15 min 20 min
LAB 6.57 (0.40)a
6.79 (0.36)a
6.74 (0.44)a
7.02 (0.14)a
6.88 (0.37)a
Yeast 1.13 (0.88)a
1.46 (1.28)a
0.00 (0.00)a
0.00 (0.00)a
0.81 (1.26)a
Enzymatic Levels 1/2 Standard ×2 ×4
LAB 5.26 (0.37)a
5.30 (0.49)a
5.21 (0.79)a
5.37 (0.41)a
Yeast 1.30 (0.82)a
1.29 (0.25)a
1.24 (0.72)a
1.81 (0.60)a
Sonication Levels 0.08 min 0.16 min 0.25 min 0.33 min 0.50 min 1 min 2 min 5 min 10 min 15 min 20 min 30 min LAB 4.23
(0.58)a 4.31
(0.45)a 4.39
(0.23)a.b 4.63
(0.31)a.b 4.37
(0.53)a.b 4.57
(0.38)a.b 4.71
(0.43)a.b 5.43
(0.35)a.b 5.59
(0.42)a.b 5.93
(0.31)b 5.63
(0.88)a.b 6.07
(0.15)b Yeast 2.22
(0.40)a 1.75
(1.38)a 2.02
(0.15)a 1.92
(0.19)a 2.81
(0.36)a 1.88
(1.48)a 3.05
(0.04)a 3.53
(0.14)a 3.82
(0.03)a 2.47
(0.09)a 2.53
(0.49)a 1.73
(1.53)a Ultrasonic bath
Levels 1 min 5 min 10 min 15 min 20 min 40 min
LAB 4.79 (0.38)a
5.11 (0.56)a
5.07 (0.37)a
5.11 (0.44)a
5.21 (0.39)a
4.69 (0.47)a
Yeast 0.77 (0.85)a
0.63 (1.09)a
0.79 (0.87)a
1.17 (1.09)a
1.16 (0.92)a
0.62 (1.07)a

26
Table 2. One-way ANOVA analysis for the comparison among the best levels of the diverse detachment methods for lactic LAB and yeasts populations. Procedure/Level LAB (log10 cfu·g-1) Yeast (log10 cfu·g-1) Stomacher (1 min) 6.57 (0.40)a 1.13 (0.88)a Enzymatic (1/2) 5.25 (0.37)b 1.30 (0.82)a Sonication (5 min) 5.43 (0.35)b 3.53 (0.14)b Ultrasonic bath (1 min) 4.79 (0.38)b 0.77 (0.85)a Note: Standard deviations are in parentheses. Values followed by different superscript letters, within the same column, are significantly different according to Scheffé post-hoc comparison test.

27
Table 3. RFLP profiles (in bp) for the 5.8-ITS region of the four selected yeast isolates from rep-PCR analysis with M13 primer.
Restriction enzyme
Isolates PCR CfoI HaeIII HinfI Species
S-3 480 270+250+100+70 320+90+50 300+250+200+190 Unknown profile
S-4 460 250+100+60 320+90+50 250+200 Pichia galeiformis
S-8 460 250+100+60 320+90+50 250+200 Pichia galeiformis
F-2 490 190+110+90 320+90+50 275+200 Pichia membranifaciens
519

28
Figure 1
520

29
Figure 2
521

30
Figure 3
522

31
Figure 4
523
32
Figure 5
524

33
Figure 6