evaluation design report
TRANSCRIPT

February 17, 2021
This publication was produced by International Development Group LLC, for review by the
Millennium Challenge Corporation.
Evaluation Design Report: Philippines Secondary National Roads Development Project Evaluation
Independent Evaluation Services in support of the Evaluation Design Report Philippines Secondary National Roads Development Project
ii
Philippines Secondary National Roads Development Project Evaluation
Evaluation Design Report
Contract Number 95332418A0009-95332419F0103
This report was prepared by International Development Group LLC (IDG) with the following contributors: Jens Abraham, Hyosun Bae, Nils Junge, Goran Mladenovic, Cesar Queiroz, and John Zeleznak.
DISCLAIMER
The views and opinions expressed herein are those of the authors and do not necessarily represent those of MCC or any other U.S. Government entity.

Independent Evaluation Services in support of the Evaluation Design Report Philippines Secondary National Roads Development Project
iii
TABLE OF CONTENTS TABLE OF CONTENTS .......................................................................................................................... iii LIST OF TABLES ...................................................................................................................................... v LIST OF FIGURES .................................................................................................................................... v LIST OF ACRONYMS ............................................................................................................................. vi I. INTRODUCTION & BACKGROUND ........................................................................................... 1
1.1 COUNTRY CONTEXT ........................................................................................................ 1 1.2 OBJECTIVE OF THE REPORT ........................................................................................... 1
II. OVERVIEW OF THE COMPACT AND THE INTERVENTIONS EVALUATED .................. 2 2.1 OVERVIEW OF THE PROJECT AND IMPLEMENTATION PLAN ............................... 2 2.2 THEORY OF CHANGE ....................................................................................................... 6 2.3 COST-BENEFIT ANALYSIS .............................................................................................. 8 2.4 BENEFICIARY ANALYSIS .............................................................................................. 10 2.5 LITERATURE REVIEW .................................................................................................... 10
III. EVALUATION DESIGN ................................................................................................................ 18 3.1 EVALUATION QUESTIONS ............................................................................................ 18 3.2 EVALUATION DESIGN OVERVIEW ............................................................................. 20 3.3 ALTERNATIVE DATA COLLECTION OPTIONS ......................................................... 28
IV. EVALUATION QUESTION 0 ........................................................................................................ 30 4.1 METHODOLOGY .............................................................................................................. 30 4.2 TIMEFRAME OF EXPOSURE .......................................................................................... 30 4.3 PRIMARY DATA COLLECTION – KIIS ......................................................................... 30 4.4 SUMMARY TABLE ........................................................................................................... 31 4.5 SECONDARY QUANTITATIVE DATA .......................................................................... 31 4.6 ANALYSIS PLAN .............................................................................................................. 32 4.7 CHALLENGES ................................................................................................................... 32
V. EVALUATION QUESTION 1 ........................................................................................................ 33 5.1 METHODOLOGY .............................................................................................................. 33 5.2 TIMEFRAME OF EXPOSURE .......................................................................................... 33 5.3 PRIMARY DATA COLLECTION – MANUAL TRAFFIC COUNT ............................... 34 5.4 PRIMARY DATA COLLECTION – ORIGIN - DESTINATION SURVEY .................... 39 5.5 PRIMARY DATA COLLECTION – VEHICLE OPERATING COST SURVEY ............ 42 5.6 PRIMARY DATA COLLECTION – ROUGHNESS STUDY ........................................... 44 5.7 PRIMARY DATA COLLECTION – ROAD CONDITION STUDY ................................ 45 5.8 PRIMARY DATA COLLECTION – DEFLECTION STUDY .......................................... 47 5.9 SUMMARY TABLE ........................................................................................................... 48 5.10 SECONDARY QUANTIATIVE DATA ............................................................................ 49 5.11 ANALYSIS PLAN .............................................................................................................. 50 5.12 CHALLENGES ................................................................................................................... 51
VI. EVALUATION QUESTION 2A ..................................................................................................... 52 6.1 METHODOLOGY .............................................................................................................. 52 6.2 TIMEFRAME OF EXPOSURE .......................................................................................... 52 6.3 PRIMARY DATA COLLECTION - KIIS .......................................................................... 52 6.4 SUMMARY TABLE ........................................................................................................... 54 6.5 SECONDARY QUANTITATIVE DATA .......................................................................... 54 6.6 ANALYSIS PLAN .............................................................................................................. 54 6.7 CHALLENGES ................................................................................................................... 56
VII. EVALUATION QUESTION 2B ..................................................................................................... 57 7.1 METHODOLOGY .............................................................................................................. 57

Independent Evaluation Services in support of the Evaluation Design Report Philippines Secondary National Roads Development Project
iv
7.2 TIMEFRAME OF EXPOSURE .......................................................................................... 57 7.3 PRIMARY DATA COLLECTION - KIIS .......................................................................... 57 7.4 SUMMARY TABLE ........................................................................................................... 57 7.5 SECONDARY QUANTITATIVE DATA .......................................................................... 57 7.6 ANALYSIS PLAN .............................................................................................................. 58 7.7 CHALLENGES ................................................................................................................. 58
VIII. EVALUATION QUESTION 3A ..................................................................................................... 60 8.1 METHODOLOGY .............................................................................................................. 60 8.2 TIMEFRAME OF EXPOSURE .......................................................................................... 60 8.3 PRIMARY DATA COLLECTION – TRAFFIC COUNT SURVEY ................................. 60 8.4 PRIMARY DATA COLLECTION – ORIGIN - DESTINATION SURVEY .................... 60 8.5 PRIMARY DATA COLLECTION – PUBLIC TRANSPORT USER SURVEY .............. 61 8.6 PRIMARY DATA COLLECTION – TRAVEL TIME STUDY ........................................ 65 8.7 SUMMARY TABLE ........................................................................................................... 66 8.8 SECONDARY QUANTITATIVE DATA .......................................................................... 66 8.9 ANALYSIS PLAN .............................................................................................................. 66 8.10 CHALLENGES ................................................................................................................... 68
IX. EVALUATION QUESTION 3B ..................................................................................................... 69 9.1 METHODOLOGY .............................................................................................................. 69 9.2 TIMEFRAME OF EXPOSURE .......................................................................................... 69 9.3 PRIMARY DATA COLLECTION – TRAFFIC COUNT SURVEY ................................. 69 9.4 PRIMARY DATA COLLECTION – ORIGIN - DESTINATION SURVEY .................... 69 9.5 PRIMARY DATA COLLECTION – PUBLIC TRANSPORT USER SURVEY .............. 69 9.6 SUMMARY TABLE ........................................................................................................... 69 9.7 SECONDARY QUANTITATIVE DATA .......................................................................... 70 9.8 ANALYSIS PLAN .............................................................................................................. 70 9.9 CHALLENGES ................................................................................................................... 70
X. EVALUATION QUESTION 4 ........................................................................................................ 71 10.1 METHODOLOGY .............................................................................................................. 71 10.2 TIMEFRAME OF EXPOSURE .......................................................................................... 71 10.3 PRIMARY DATA COLLECTION – ORIGIN-DESTINATION SURVEY ...................... 71 10.4 PRIMARY DATA COLLECTION – PUBLIC TRANSPORT USER SURVEY .............. 72 10.5 PRIMARY DATA COLLECTION – KIIS ......................................................................... 72 10.6 SUMMARY TABLE ........................................................................................................... 75 10.7 SECONDARY QUANTITATIVE DATA .......................................................................... 75 10.8 ANALYSIS PLAN .............................................................................................................. 75 10.9 CHALLENGES ................................................................................................................. 76
XI. ADMINISTRATIVE ........................................................................................................................ 77 11.1 SUMMARY OF IRB REQUIREMENTS AND CLEARANCES ...................................... 77 11.2 APPROVAL FROM LOCAL AUTHORITIES .................................................................. 77 11.3 DATA PROTECTION, ACCESS, AND DOCUMENTATION ........................................ 77 11.4 DISSEMINATION PLAN .................................................................................................. 78 11.5 EVALUATION TEAM ROLES AND RESPONSIBILITIES ............................................ 78 11.6 EVALUATION TIMELINE & REPORTING SCHEDULE .............................................. 79
ANNEX I: REFERENCES ....................................................................................................................... 80 ANNEX II: EVALUATION WORK PLAN ........................................................................................... 81 ANNEX III: BUDGET ............................................................................................................................. 83 ANNEX IV: O-D SURVEY SAMPLING MEMO ................................................................................. 84 ANNEX V: STAKEHOLDER COMMENTS AND EVALUATOR RESPONSES ............................ 90

Independent Evaluation Services in support of the Evaluation Design Report Philippines Secondary National Roads Development Project
v
LIST OF TABLES Table II.1 Samar Road Activity Contract Package Allocations ..................................................... 3 Table II.2 Samar Road Activity Contract Package Completion ..................................................... 4 Table III.1 Summary of Evaluation Design Overview ................................................................. 20 Table III.2 Detailed Evaluation Design Overview ....................................................................... 22 Table III.3 Summary of Results on Estimated Level of ERR Precisions ..................................... 28 Table III.4 Template Summarizing the Results on Estimated Level of ERR Precisions ............. 29 Table IV.1 Primary Data Collection Summary Table for Evaluation Question 0 ........................ 31 Table V.1 Tetra Tech Traffic Survey Location and AADT .......................................................... 36 Table V.2 Evaluation Traffic Count Survey Locations ................................................................ 36 Table V.3 Evaluation O-D Survey Locations ............................................................................... 39 Table V.4 Primary Data Collection Summary Table for Evaluation Question 1 ......................... 48 Table VI.1 Primary Data Collection Summary Table for Evaluation Question 2A ..................... 54 Table VII.1 Public Transportation Survey Sample and Locations ............................................... 61 Table VII.2 Type of Public Transportation on SNRDP Road ...................................................... 62 Table VII.3 PTU Survey Locations .............................................................................................. 63 Table VII.4 Travel Time Study Timing ........................................................................................ 65 Table VII.5 Primary Data Collection Summary Table for Evaluation Question 3A .................... 66 Table X.1 Transport Sector KII Respondent Type and Sample Size ........................................... 72 Table X.2 Transportation Service Provider Type and the Expected SNRDP Road Usage .......... 72 Table X.2 Primary Data Collection Summary Table for Evaluation Question 4 ......................... 75 Table XI.1 Evaluation Team and Responsibilities ....................................................................... 78 Table XI.2 Summary of Evaluation Timeline and Reporting Schedule ....................................... 79
LIST OF FIGURES Figure II.1 Map of SNRDP Samar Road ........................................................................................ 3 Figure II.2 Map of SNRDP Samar Road and the CMRMP Pilot Road Section ............................. 6 Figure II.3 Final M&E Plan Project Logic ..................................................................................... 7 Figure II.4 MCC Transportation Project Logic .............................................................................. 8 Figure II.5 Alternative Project Logic Proposed by Evaluator ........................................................ 8 Figure III.1 Integration of Evaluation Areas ................................................................................. 20 Figure V.1 Map of Tetra Tech Traffic Survey Locations and Road Sections .............................. 35 Figure V.2 Map of Tetra Tech Traffic Survey Locations and Evaluation Team Traffic Count
Locations ............................................................................................................................... 37 Figure V.2 Map of O-D Survey Locations and Tetra Tech Traffic Count Locations .................. 41 Figure VII.1 Map of PTU Survey Locations ................................................................................ 64 Figure XI.1 Evaluation Team Organization Chart ........................................................................ 79

Independent Evaluation Services in support of the Evaluation Design Report Philippines Secondary National Roads Development Project
vi
LIST OF ACRONYMS AADT Average Annual Daily Traffic ACC Accident Costs ACP Asphalt Concrete Pavement ADB Asian Development Bank ADT Average Daily Traffic ASTM American Standard Test Method BB Benkelman Beam BOM Bureau of Maintenance CBA Cost-Benefit Analysis CBR California Bearing Ratio CMRMP Community-Managed Road Maintenance Project CP Contract Packages DBM Department of Budget and Management DOF Department of Finance DOTr Department of Transportation DPWH Department of Public Works and Highway DWSD Department of Social Welfare and Development EDR Evaluation Design Report EIRR Economic Internal Rate of Return EMC Evaluation Management Committee EMP Evaluation Management Process EQ Evaluation Question ERR Economic Rate of Return ESALF Equivalent Standard Axle Load Factor FIFO First in- first out FWD Falling Weight Deflectometer HDM-4 Highway Development and Management-4 IDG International Development Group LLC IFC International Finance Cooperation IRB Institutional Review Board IRI International Roughness Index JICA Japanese International Cooperation Agency KII Key Informant Interview LTPP Long-term Pavement Performance MCA-P Millennium Challenge Account Philippines MCC Millennium Challenge Corporation MTC Manual Traffic Count NPV Net Present Value ORN TRL Overseas Road Note PCCP Portland Cement Concrete Pavement PHP Philippine Peso PTU Public Transport User

Independent Evaluation Services in support of the Evaluation Design Report Philippines Secondary National Roads Development Project
vii
QA/QC Quality Assurance Quality Control RED Roads Economic Decision RTRRMS Response-type road roughness measuring system RUC Road User Cost SNRDP Secondary National Roads Development Project TOC Turn-Over Certificate TOR Terms of Reference TRRL Transport and Road Research Laboratory TT Travel Time TTS Travel Time Savings VOC Vehicle Operating Cost

Independent Evaluation Services in support of the Evaluation Design Report Philippines Secondary National Roads Development Project
1
I. INTRODUCTION & BACKGROUND
1.1 COUNTRY CONTEXT
The Millennium Challenge Corporation (MCC) and the Government of Philippines (GOP) signed a five-year, US$434 million Compact on September 23, 2010, which entered into force on May 25, 2011. The Compact goal was “to reduce poverty through economic growth in the Philippines.” The Compact is composed of three projects: 1) Revenue Administration Reform Project (RARP) with a budget of US$54.3 million; 2) Kalahi-CIDSS Project (Kapit-Bisig Laban sa Kahirapan – Comprehensive and Integrated Delivery of Social Services) with a budget of US$120 million; and 3) Secondary National Roads Development Project (SNRDP) with a budget of US$214.4 million.
1.2 OBJECTIVE OF THE REPORT
On September 15, 2019, MCC issued a contract to International Development Group LLC (IDG) to conduct an Economic Analysis and Independent Evaluation Services in support of the Philippines SNRDP. The evaluation, designed to understand the impact of the SNRDP on the Philippines economic growth, is mainly threefold: 1) a review of the activity implementation (Evaluation1 Area 0) to identify any deviations from the original design, 2) an economic analysis (Evaluation Area 1) to understand the costs and benefits of the MCC-funded road, and 3) performance evaluations of road maintenance, road usage patterns, and transport market structure to complement and enhance knowledge gained through the economic analysis (Evaluation Areas 2, 3, and 4). The objective of the Evaluation Design Report (EDR) is to allow MCC to accomplish the following:2
• Prioritize evaluation questions and outcomes that meet demand from key decisionmakers; • Ensure that the Program Objectives and all key accountability metrics modeled in the cost-
benefit analysis are measured or justification is provided as to why they are not; • Apply the most rigorous evaluation methodology feasible given project design and
implementation rules; • Clearly define the analysis plan to ensure consensus on outcomes – their definitions and
measurement; • Clearly define sample population and sampling strategy that aligns with project target
populations; • Clearly define exposure period that maps data collection timelines with project start date
timelines; and • Update costs as necessary.
In this report, the team will: i) provide an overview of the Compact and the SNRDP, ii) present quantitative and qualitative evaluation design for each evaluation question, and iii) summarize administrative issues of the evaluation.
1 The scope of work for the evaluation refers to Research Areas but this report will refer to these areas as Evaluation Areas. 2 MCC Independent Evaluations, Evaluation Management Process (EMP) Version: February 2020.

Independent Evaluation Services in support of the Evaluation Design Report Philippines Secondary National Roads Development Project
2
II. OVERVIEW OF THE COMPACT AND THE INTERVENTIONS EVALUATED
2.1 OVERVIEW OF THE PROJECT AND IMPLEMENTATION PLAN
2.1.1 Original Project Description
The SNRDP consisted of the Samar Road Activity and did not include other activities at the time of Compact design. According to the Compact document, the objective of the SNRDP was to i) save time and ii) lower vehicle operating costs for those Filipinos living near the roads.3 MCC funding was intended to “reconstruct and rehabilitate 220km4 of the Samar road crossing the provinces of Samar and Eastern Samar, of which approximately 180km will undergo reconstruction/major rehabilitation while 40 km will receive only minor rehabilitation, as well as the replacement or upgrading of associated structures, such as bridges and culverts, to eliminate flooding and improve road safety”.5 According to the M&E Plan,6 the Samar road begins at the junction of Highway-Buray Wright (km 827+200) in Samar and traverses eastward along primary mountainous terrain to Taft (km 890+000). From Taft, it continues southward, along the coastline of Eastern Samar, ending in the town of Guiuan (km 1,047+300).7 The east-west section of the road had been identified as a critical inter-provincial corridor linking the Samar Province and the Eastern Samar province. The north-south section of the road linking Taft to Guiuan provides access to 13 coastal municipalities.
2.1.2 Project Participants and Project Beneficiaries
While the definition of project beneficiaries is not clearly stated, the Compact document refers to benefits accruing to Filipinos living near the roads from MCC’s investment. However, MCC’s Principles into Practice refutes this theory and suggests that road project beneficiaries should be defined as road users and not those living near the improved road segment.8 The evaluation team will refer to project beneficiaries as SNRDP road users throughout this report and more discussion on beneficiaries can be found under Section 2.4 below.9 On project participants, MCC Monitoring and Evaluation Plan does not define them and how they differ from beneficiaries for the SNRDP.
2.1.3 Geographical Coverage
The geographic scope of the SNRDP is limited to Samar Island, which is the third largest island in the Philippines, located in central Philippines. Samar Island is divided into three provinces, Samar, Northern Samar, and Eastern Samar. The road improved with MCC investment links Samar and Eastern Samar provinces and is presented in Figure II.1 below:
3 Millennium Challenge Cooperation, Millennium Challenge Compact between the United States of America Acting Through the Millennium Challenge Corporation and the Republic of the Philippines, p.1. 4 References of the road length vary in the early MCC documents. MCC Compact document and the MCA-Philippines M&E Plan (September 2016) refer to the road length as both 220km and 222km in several instances. 5 Ibid., Annex I-7. 6 Millennium Challenge Account Philippines, Monitoring and Evaluation Plan, September 2016 7 Millennium Challenge Account Philippines, Monitoring and Evaluation Plan, September 2016, p. 9. 8 Millennium Challenge Corporation, Principles into Practice, Lessons from MCC’s Investments in Roads, November 2017. 9 Millennium Challenge Account Philippines, Monitoring and Evaluation Plan, September 2016

Independent Evaluation Services in support of the Evaluation Design Report Philippines Secondary National Roads Development Project
3
Figure II.1 Map of SNRDP Samar Road10
2.1.4 Description of Implementation to Date
2.1.4.1 Samar Road Activity
The Samar Road Activity covered rehabilitation and improvement of 222km of road, which also included the upgrade and replacement of associated structures such as 61 bridges and culverts, embankments, road safety improvement, and drainage systems. The works were divided into four contract packages (CP) and sections of the road were allocated to two contractors as below: Table II.1 Samar Road Activity Contract Package Allocations11
Contract Package Contractor Road Section Road Length Bridges
CP1 Hanjin Construction Barangay Buray, Samar – Barangay Tinani, Samar 16.36km 2 rehabilitation
1 reconstruction
CP2 Qinjian Group Co. LTD Barangay San Isidro, Samar – San Julian, Eastern Samar 63.78km 20 rehabilitation
6 reconstruction
CP3 Qinjian Group Co. LTD San Julian, Eastern Samar – Balangkayan, Eastern Samar 64.58km 11 rehabilitation
6 reconstruction
10 Tetra Tech, Final Assessment Report Philippines Secondary National Roads Development Project (SNRDP), January 8, 2020, p. ES-12. 11 Evaluation team based on Republic of the Philippines Department of Finance, Annual Summary Report on Philippine Compact, March 2017, p. 10, 11, and 23.

Independent Evaluation Services in support of the Evaluation Design Report Philippines Secondary National Roads Development Project
4
CP4 Hanjin Construction Llorente, Eastern Samar, - Guiuan, Eastern Samar 77.51km 6 rehabilitation
8 reconstruction
TOTAL Barangay Buray – Guiuan 222.23km 39 rehabilitation 21 reconstruction
At the end of the Compact in May 2016, the entire road length of 222km was vehicle-passable, but there were remaining works in drainage and shoulders that were not completed. A total of 174.95km of the 222km of road had received a Turn-Over Certificate (TOC) at the end of the Compact, which is 79 percent of the initial road length intended for improvement. Remaining works were concentrated mainly in CP2 including 6km of unpaved shoulders and two bridge rehabilitations in Taft and Sulat. The remaining road sections and bridges were supervised by the Department of Public Works and Highway (DPWH) and completed by 2017. Details of the road improvement completion dates are listed below: Table II.2 Samar Road Activity Contract Package Completion12
Contract Package
Road Length Sub-CP Contractor TOC Date
By the End of Compact Road
Length with TOC
Bridges Completed
CP1 16.36km CP1 Hanjin
Construction
June 2, 2014 16.36km 2 rehabilitation
1 reconstruction LS003/ 004 May 25, 2016
CP2 63.78km Segments 1-3 Qinjian Group Co. LTD
June 2, 2017 16.5km 18 rehabilitation 6 reconstruction Segment 4 March 22, 2016
CP3 64.58km CP3 Qinjian Group Co. LTD March 13, 2016 64.58km 11 rehabilitation
6 reconstruction
CP4 77.51km CP4 Hanjin Construction May 25, 201613 77.51km 6 rehabilitation
9 reconstruction
TOTAL 174.95km 37 rehabilitation 22 reconstruction
Once the TOCs were handed over, each CP had a one-year Defects Notification Period (DNP). During DNP, defects were identified by the DPWH and corrected by the contractor. Based on the Final Assessment Report from TetraTech (Appendix B-1: Samar Road Treatment), out of 182.3 km that had to be reconstructed, 56.7 km were to be Portland cement concrete pavement (PCCP) and 125.6 km asphalt concrete pavement (ACP), with 37.8 km requiring gravel shoulders upgrades.14 The total length, therefore, adds up to 220.1 km, which does not match the total project length was of 222 km. However, no further details are provided to understand the discrepancy in the total road length.
12 Evaluation team based on Republic of the Philippines Department of Finance, Annual Summary Report on Philippine Compact, March 2019, p. 11, and MCC, Indicator Tracking Table (ITT) Philippines Closeout, September 2016. 13 Even though the report indicates that the TOC date is May 25, 2017, earlier summary report from 2017 indicate that the TOC date for CP4 as May 25, 2016. The evaluation team believes that this is a typo and have corrected the TOC date to May 25, 2016. 14 Tetra Tech, Final Assessment Report Philippines Secondary National Roads Development Project (SNRDP), January 8, 2020, Appendix B-1: Samar Road Treatment.

Independent Evaluation Services in support of the Evaluation Design Report Philippines Secondary National Roads Development Project
5
Based on the Project Status Report dated November 2019, the work was accomplished on 79.13 km of PCCP and 110.07 km of ACP.15 Again, the total length of PCCP and ACP sections does not match the total length of the road for the CP packages nor does the road length completed with TOC at the end of the Compact. The PCCP sections are mainly located within CP1 and CP216 because these road sections are located in mountainous to rolling terrain and the existing pavement was PCCP. CP3 and CP4 are mainly ACP because these sections are located in flat to rolling terrain along the east coast and the existing pavement was mainly ACP. Therefore, CP3 and CP4 were mainly reconstructed/rehabilitated with ACP with an exception of short stretches where PCCP was used.
2.1.4.2 Community-Managed Road Maintenance Project
During Compact implementation, the SNRDP added a new activity aimed at road maintenance referred to as the Community-Managed Road Maintenance Project (CMRMP). According to the Post-Compact Monitoring and Evaluation Plan, the CMRMP is a “pilot convergence project of DPWH, Department of Social Welfare and Development (DSWD), and the Road Board, initiated by Millennium Challenge Account-Philippines (MCA-P) to help with the maintenance of the SNRDP.”17 The CMRMP was linked to the Kalahi-CIDSS Project which was implemented under the Compact in parallel to the SNRDP.18 The activity was designed to provide road maintenance funding from the Road Board to six community groups (barangays) in Paranas19 for conducting routine road maintenance of a 16 km-road section from the Samar road. The CMRMP also aimed to provide income-generating opportunities for poor households and women within the community.20 By recruiting women from the DSWD social safety net scheme participants, the CMRMP intended on providing employment opportunities to vulnerable women. On June 21, 2016, DPWH issued Department Order No. 130 to support the participation and employment of women as workers in construction and civil works projects.21 The CMRMP’s first pilot implementation covered 16 kilometers of road from Buray to Tenani barangays in Paranas, Samar. The 12-month pilot project was funded by the Road Board with an overall budget of PHP 7.04 million, of which PHP 4.18 million was transferred to DSWD for labor costs and PHP 2.86 million was used by DPWH to procure tools and needed materials for road maintenance activities.22
15 DPWH, RMC-II, UPMO, Project Status Report, November 30, 2019. 16 Millennium Challenge Corporation. Secondary National Roads Development Program, Samar Road Rehabilitation Project, Executive Summary. November 30, 2019. 17 Millennium Challenge Account Philippines, Monitoring and Evaluation Plan, September 2016. 18 Based on an interview with Yohannes Abebe and Derick Bowen from MCC on November 4, 2019. 19 Buray, Pequit, Patag, Tabucan, Lokilokon, and Tenani. 20 Republic of the Philippines Department of Finance, Annual Summary Report on Philippine Compact, 2017. 21 Ibid. p. 26. 22 Ibid., p. 26.

Independent Evaluation Services in support of the Evaluation Design Report Philippines Secondary National Roads Development Project
6
Figure II.2 Map of SNRDP Samar Road and the CMRMP Pilot Road Section23
The 2018 Annual Summary Report did not include any funds for CMRMP in 2018,24 And, after the abolishment of the Road Board (Republic Act No. 11239), there have been no available reports onfunding allocated to the CMRMP.25
2.2 THEORY OF CHANGE
2.2.1 Final M&E Plan Project Logic
Figure II.3 shows the project logic for all three Compact projects, including project activities (orange boxes), expected outputs (red boxes), and Compact projects (green boxes). For the KALAHI-CIDSS Project, sub-project implementation and approval will deliver benefits to Barangay residents, encourage communities to engage in development activities, and improve the responsiveness of local governments to community needs. For the SNRDP, the reconstruction and rehabilitation of the Samar Road will increase time savings and lower vehicle operating costs for road users. Finally, the Revenue Administration Reform project will support the development of an electronic tax information system, automated auditing tools, as well as launch a public awareness campaign and support the Revenue Integrity Protection Service. These activities will lead to increased tax revenues and the detection and deterrence of corruption. The combined impact of these outputs will lead to the overall goal of poverty reduction through economic growth.
23 Tetra Tech, Final Assessment Report Philippines Secondary National Roads Development Project (SNRDP), January 8, 2020, p. ES-12. 24 2018 Annual Summary Report, p 13 25 2019 Annual Summary Report, p. 11-12
CMRMP pilot road section

Independent Evaluation Services in support of the Evaluation Design Report Philippines Secondary National Roads Development Project
7
Figure II.3 Final M&E Plan Project Logic
2.2.2 MCC Transportation Project Logic
According to the Compact, the project logic is that the road project inputs of road construction, rehabilitation, and improvement will lead to improved road quality. Assuming good maintenance practices, this will lead to the outcomes of reduced transportation costs, measured in travel and VOCs. These outcomes, in addition to the effects of diverted and generated traffic will lead to a long-term outcome of increased household income, which is anticipated to result in the project’s long-term goal of poverty reduction and economic growth.

Independent Evaluation Services in support of the Evaluation Design Report Philippines Secondary National Roads Development Project
8
Figure II.4 MCC Transportation Project Logic
2.2.3 Alternative Project Logic Proposed by Evaluator
A slightly modified project logic is proposed below. It breaks down anticipated outcomes into additional short-term and intermediate outcomes which eventually lead to the long-term outcome of increased household incomes. It includes an additional output, the CMRMP, which was a pilot convergence project of DPWH, DSWD, and the Road Board. While the CMRMP was part of the original project design, it was added to the SNRDP during the Compact implementation. As a pilot activity on maintenance, it is not considered critical to the reducing travel time or reducing vehicle operating cost, but instead contributes to increased household income over the first five years post-Compact. Two critical assumptions have also been added: i) that sufficient funds are available to maintain the Samar road and ii) that the transportation sector is competitive and well-regulated.
Figure II.5 Alternative Project Logic Proposed by Evaluator
2.3 COST-BENEFIT ANALYSIS
2.3.1 Original CBA Model (MCC Ex-Ante ERR)
Output from the Highway Development and Management (HDM)-4 model 4 economic analysis prepared by Tetra Tech as part of the project feasibility study was applied in MCC’s original CBA

Independent Evaluation Services in support of the Evaluation Design Report Philippines Secondary National Roads Development Project
9
model (MCC Ex-Ante ERR) to find an original Economic Rate of Return (ERR) of 13.7 percent. The feasibility study provided the details of all input data used in the HDM analyses which related to the road network and vehicle operating costs.
The economic analysis considered benefit streams of vehicle operating cost savings, time cost savings, and road maintenance cost savings. No accident reduction benefits were included since these were believed to be insubstantial relative to the other benefit streams. The costs considered in the analysis included: 1) civil works costs, 2) pre-construction costs, 3) construction management and oversight costs, and 4) environmental and social mitigation and resettlement costs. These costs were distributed over time in proportion to the forecast distribution. The benefits calculation assumed all road works began in 2012 and were completed in 2015, as per the planned construction schedule.
The benefits were assumed to accrue through normal and generated traffic, but not diverted traffic, since inadequate data on traffic flows was available. With respect to traffic patterns and economic benefits, the analysis made projections for AADT, “aggregate value of time savings,” and “change in aggregate vehicle operating cost” (in 2009 USD). However, of these three indicators, a baseline was only established for AADT. Traffic counts were conducted by Tetra Tech at four stations (and covering six sections) along the Samar Road in September 2009. AADT was then calculated, resulting in a range from 1,238 to 1,505.26 The M&E plan, however, uses a baseline AADT of 1,179, without providing additional information on how the number was reached, or mentioning the Tetra Tech AADT figures.
2.3.2 Closeout CBA Model (MCC Close-Out ERR)
At the time of closeout, the Original CBA Model HDM-4 workspace was not available. MCC recreated the Original CBA Model HDM-4 workspace using the same approach adopted by the original analysis. The ERR was then calculated by updating the final project cost and traffic data based on traffic counts in 2012. The HDM-4 model assumptions were kept closely in line with those of the original model. The IRI measured by the contractor and by DPWH at the end of Compact were substantially different and there were some concerns about the reliability of results.27 Therefore, the two IRI measurements were not used in the closeout model. Instead, the HDM-4 was updated using the predicted IRI from the original model with increased deterioration
26 Tetra Tech 2010. Final Assessment Report Philippines Secondary National Roads Development Project (SNRDP) Report, p. 9-6. 27 Millennium Challenge Corporation, SNRDP Closeout ERR Summary of Updates Final.

Independent Evaluation Services in support of the Evaluation Design Report Philippines Secondary National Roads Development Project
10
factors to account for the early distress that was observed. Thus, the estimated Closeout ERR is reported as 8.9 percent.28
An updated Evaluation-Based CBA Model (Evaluation ERR) will be developed as part of this independent evaluation using updated benefit streams.
2.4 BENEFICIARY ANALYSIS
The Original Beneficiary Analysis collected the following demographic statistics: approximately 282,000 people living in settlements along the Samar road were expected to benefit from the road rehabilitation. The most common occupations of household heads were ‘farmer’ and ‘driver,’ both of which rely significantly on transportation. The analysis found that 19 percent of household heads were female, and that 13 percent lived below the poverty line ($1.25 per day in 2005 USD), while a total of 42% lived on less than $2 per day.
However, as discussed above under Section 2.1.2, MCC’s definition of project beneficiaries has shifted to actual road users instead of those living in proximity of the improved road.
2.5 LITERATURE REVIEW
2.5.1 Summary of the Existing Evidence
Evaluation Question 0 Summary of existing evidence is not applicable for Evaluation Question 0. Evaluation Question 1 MCC’s document summarizing lessons learned from road investments provides some evidence on ex-post calculation of economic return for road investments. For instance, MCC’s Principles into Practice series on road investment reports that the ex-post economic rate of return (ERR) of MCC’s road investment in Honduras decreased due to higher final investment cost and lower-than expected traffic counts for a highway improvement. A secondary road improvement, however, experienced higher than expected traffic and lower project costs, which increased the ex-post ERR.29 A road investment in Nicaragua resulted in lower ex-post ERR than ex-ante ERR possibly due to data collection timing, as the endline data was collected less than one year after road construction.30 Some evidence of road investment economic return in the Philippines is available from the Asian Development Bank (ADB) project documents. ADB has been supporting the Philippines road sector since 1970. An impact evaluation study from December 1997 which examined six ADB road projects in the Philippines reported that most of ADB’s road projects in the Philippines
28 During the evaluation team’s visit to Samar in December 2019, the team confirmed that the road sections were well-maintained and early distress was properly treated. Therefore, the assumption of increased deterioration has not materialized. It is worth noting that the ERR, without considering increased deterioration, would have been a few percentage points higher than that was anticipated at the end of Compact. 29 Millennium Challenge Corporation, Principles into Practice, Lessons from MCC’s Investments in Roads, November 2017, p.27. 30 Ibid., p.28.

Independent Evaluation Services in support of the Evaluation Design Report Philippines Secondary National Roads Development Project
11
suffered from long delays, cost overruns, poor workmanship, inadequate drainage, dishonest supervision, and a lack of routine maintenance.31 For instance, ADB’s Fourth Road Improvement Project suffered from delays due to 1) substantial time spent in the tender and award process, 2) time extensions up to 869 days on constructions from termination of contracts, changes in scope of work, and slow processes of contractors.32 Similarly, the Fifth Road Improvement Project experienced delays from cancellation of CPs and right-of-way (ROW) acquisition, resulting in a decrease of the total improved road length by 33 percent. The Sixth Road Project implemented by ADB was delayed 47 months due to cancellations during the procurement process and difficulties in land acquisition and resettlement.33 Cost overruns were also common in ADB projects. ADB’s Fourth and Fifth Road Improvement Projects experienced 40 percent and 36 percent cost overrun more than the original estimates for the implemented CPs. The Sixth Road Improvement Project had no cost overrun due to cancellations of some CPs.34 ADB also published a Completion Report presenting the pre-project economic analysis and the reevaluation of the analysis post-project for the Sixth Road Improvement Project. The initial pre-project economic internal rate of return (EIRR) ranged from 7.1 percent to 26 percent for each CP. The reevaluation of the EIRRs showed that they were far higher than the initial EIRRs computed pre-project, with the lowest at 23.75 percent and the highest at 77.7 percent.35 ADB noted that the increase in the EIRR despite the cost overrun and the delays was due to two factors:
First, the rate of increase in basic VOC [Vehicle Operating Cost] from 1995 to 2006 is faster than the rate of increase of project cost during the same period. While both elements were subject to currency movements, the foreign component of VOC (of approximately 95%) is greater than the foreign component of civil works (at some 45%). Second, the actual traffic resulting from the roads improvement is higher than the traffic projected at appraisal.36
The pre- and post-project comparison of the economic analysis in the Philippines is helpful evidence that the evaluation team may also observe from the evaluation. However, ADB’s Sixth Road Improvement Project was implemented between 1995 and 2006 and the factors that impacted the EIRR then may not be as relevant for this particular evaluation. Evaluation Question 2A New paved roads, if inadequately maintained, deteriorate slowly and almost imperceptibly during the first half to two-thirds of their service life, depending on the traffic. After that grace period, which may last ten to fifteen years, the pavements deteriorate much more rapidly. Without timely maintenance they break apart. According to an earlier World Bank report, “Road Deterioration in Developing Countries: Causes and Remedies”37 by Clell Harral and Asif Faiz (H&F), developing
31 Asian Development Bank, Technical Assistance Consultant’s Report - Republic of the Philippines: Road Sector Improvement Project (41076-01), Volume 2: Final Report, February 2011, p. 3-1, 3-2. 32 Ibid., p. 3-2. 33 Ibid., p. 3-3. 34 Ibid., p.3-3. 35 Asian Development Bank, Completion Report – Philippines: Sixth Road Project (23233), October 2017, p.40. 36 Ibid. 37 Clell Harral and Asif Faiz, World Bank, Road Deterioration in Developing Countries: Causes and Remedies, June 1988.

Independent Evaluation Services in support of the Evaluation Design Report Philippines Secondary National Roads Development Project
12
countries faced with budgetary stringency do not give road maintenance a high priority. The authors illustrate the relationship between road deterioration and maintenance needs for developing countries. ADB, JICA, and the World Bank have published reports on the Philippines road sector and, in particular, its maintenance practices. According to these reports, the operations and maintenance of national roads and bridges, major flood control structures, and related facilities of national importance is the responsibility of the DPWH’s Bureau of Maintenance (BOM) while the Regional and District offices generally undertake facility maintenance by administration.38 Resealing training and pavement investigation components are the responsibility of the Bureau of Research and Standards.
ADB’s review of its road projects between 1985 and 2007 concluded that many of the improved roads were in unsatisfactory conditions, believed to be due to poor design and construction, followed by neglected maintenance.39 However, a more recent ADB report suggests that funding for the maintenance of national roads in the Philippines has increased significantly since 2010 with a particular focus on routine maintenance.40 Funding for routine maintenance increased at an average annual growth rate of 25 percent from 2010 to 2017 while funding for intensive maintenance (rehabilitation, reconstruction) remained at an average annual growth rate of 16 percent from 2015 to 2017.
ADB reported that “based on the trend of increasing funding for maintenance of national roads and the lower funding requirement for maintaining the improved project roads, it is considered reasonable to expect that the government will provide sufficient financing for the maintenance of the project roads and that the project is financially sustainable.”41
In March 2019, President Duterte signed Republic Act No.11239 – “An Act Abolishing the Road Board and Providing for the Disposition of the Motor Vehicle User’s Charge Collection (MVUC).” The Road Board, established to assure that required maintenance funds are allocated to roads, has been long hounded by corruption scandals. With the passing of this Act, the Road Board is officially dissolved, and the money collected from the MVUC is reallocated.
Evaluation Question 2B Community contracting is a mechanism used in various sectors including school management, water resource management, and post-crisis recovery efforts, to directly contract small works to local communities. The intention is to boost income in rural communities, stimulate economic activity, build capacity of stakeholders involved, and empower communities to lead development efforts. Evidence of community-led road maintenance is growing. The World Bank, based on its successes in Latin America using microenterprises for labor-intensive routine road maintenance, set up less formal alliances of local people called road maintenance groups (RMG) in China, Nepal,
38 Asian Development Bank, Technical Assistance Consultant’s Report, February 2011, p.5-4. 39 Asian Development Bank, Technical Assistance Consultant’s Report, February 2011, p.3-1. 40 Asian Development Bank, Report and Recommendation of the President to the Board of Directors, Proposed Loan, Republic of the Philippines: Improving Growth Corridors in Mindanao Road Sector Project, November 2017, p.6. 41 Asian Development Bank, Report and Recommendation of the President to the Board of Directors, Proposed Loan, Republic of the Philippines: Improving Growth Corridors in Mindanao Road Sector Project, November 2017, p.6-7.

Independent Evaluation Services in support of the Evaluation Design Report Philippines Secondary National Roads Development Project
13
and Laos.42 The World Bank is currently implementing a community-based rural roads maintenance pilot project in Morocco.43 ADB has also piloted a number of community-based maintenance projects,44 one of which concluded that community-based maintenance contracts in Vietnam required only a low level of state budget support for it combines the state and local beneficiaries’ resources.45
Yet, a common set of prerequisites arise from the pilot projects to make the community-led efforts successful. For instance, the pilot project in Vietnam eludes that community-based contracts will be difficult to implement in communities with industrial development where unskilled labor is expensive. 46 ADB’s Guide to Performance-based Road Maintenance Contracts also suggests that community-based road maintenance projects are only recommended for routine maintenance of unpaved roads with a stable flow of funds available.47
A number of community-led maintenance projects identified similar challenges to the participatory mechanism. An evaluation of the ILO-led community-maintenance pilot project in Indonesia showed that community maintenance of roads was minimal with only one-day training provided to the community in charge of maintenance. An ADB pilot project in Vietnam also concludes that that capacity building of communities is essential to scale up the community-based model.48 Similarly, a TRL-report by Faiz lists numerous challenges in rural road management including decentralization of maintenance functions and responsibilities to local governments, development of asset inventories and management systems, preparation of manuals for rural roads maintenance in regional languages (if necessary), development of trained manpower, and sustainable funding for maintenance.49
Evaluation Questions 3A and 3B Although the case linking rehabilitated roads to improved living standards may seem straightforward, findings on distributive impacts remain ambiguous. While studies of impacts of rural road development have generally found that they can lead to improvements in household income and access to services and markets,50 strong positive correlations between improvements in roads and improvements in living standards are case-specific. The nature and degree of benefits derived from road rehabilitation are often indirect and depend on multiple factors, such as differences between before and after conditions, land quality in surrounding areas, levels of
42 Serge Cartier van Dissel, World Bank, Road Maintenance Groups and Microenterprises, Experiences from Latin America, Asia and the Pacific, 2018. 43 World Bank, Project Paper on Proposed Grant, Morocco- Community-Based Rural Roads Maintenance, April 2019. 44 ADB, Community-based Routine Maintenance of Roads by Women’s Groups: Guide for Communications Bureaus, 2011. 45 ADB, VIE: Making Markets Work Better for the Poor Phase 2, Improving Rural Road Maintenance, July 2012. 46 ADB, VIE: Making Markets Work Better for the Poor Phase 2, Improving Rural Road Maintenance, July 2012. 47 ADB, CAREC, Guide to Performance-based Road Maintenance Contracts, April 2018. 48 ADB, VIE: Making Markets Work Better for the Poor Phase 2, Improving Rural Road Maintenance, July 2012. 49 Asif Faiz, TRB Low-Volume Roads Committee, The Promise of Rural Roads: Review of the Role of Low-Volume Roads in Rural Connectivity, Poverty Reduction, Crisis Management, and Livability, September 2012. 50 Iimi, A. et al. (2015). Social and Economic Impacts of Rural Road Improvements in the State of Tocantins, Brazil. Policy Research Working Paper 7249. World Bank Group.

Independent Evaluation Services in support of the Evaluation Design Report Philippines Secondary National Roads Development Project
14
motorization,51 strategic location,52 maintenance, etc. Because effects are influenced by various existing conditions and investments beyond road infrastructure, distribution of impacts is not necessarily spread evenly. From an equity perspective, much seems to depend on the access to services and markets that the rehabilitated roads provide by poorer populations, although little systemic analysis has been conducted on this issue.53 Khandker and Koolwal found that rehabilitating rural roads in Bangladesh increased non-agricultural wage employment among target households.54 On the other hand, a 2002 study found that the benefits of providing better road access to markets in Nepal were not large enough or targeted efficiently enough to greatly reduce poverty and income inequality.55 Parada finds that even after many years of investments in road rehabilitation by donors, evidence is limited on the heterogeneous distribution of benefits or about how much they reduce transport costs, generate new market activity, and affect input and output prices.56 Evaluation Question 4 When transport service providers are operating under free market conditions, firms behave strategically when determining their prices, knowing that competitors do the same. As a result, if a firm raises its price this can lead to an increase in profit margin but a decrease in traffic which then can lead to a traffic increase for the competitors (in the same or another mode) who may want in turn to set slightly higher prices to increase their margins. This will continue until there is a Nash equilibrium in the marketplace.57 Barriers to prevent markets from freely operating in this manner includes the influence of cartels and governments regulating pricing. The presence of such barriers prevents vehicle operating cost savings from being passed down to transport service consumers. Therefore, while owners of vehicles, who may be of higher income class, directly experience the vehicle operating cost savings, those who do not own vehicles and rely on transport services for either goods or passenger transport, who may be of lower income class, will not be benefiting from the lower transport costs if the prices remain unchanged.
In a World Bank report by Teravaninthorn and Raballand (T&R), “Transport Prices and Costs in Africa: A Review of the Main International Corridors,”58 the authors find that the transport of freight between Sahelian countries and their ports features prices that are significantly higher than the underlying costs. This finding suggests that large profits are funneled to rent-seeking road-transport cartels benefitting from oligopolies. T&R argue that unless governments take steps to remove the structural distortions of the trucking market, there is no point in investing to reduce road-transport costs. The authors claim that the cartels will capture the benefits from lowered costs
51 Escobal, Javier and Carmen Ponce. 2002. “The Benefits of Rural Roads: Enhancing Income Opportunities for the Rural Poor.” GRADE Working Paper 40. 52 Shrestha, S. A. (2012). Access to the North-South roads and farm profits in rural Nepal. Working Paper. 53 Calderon, C. & L. Serven. (2014). Infrastructure, Growth, and Inequality: An Overview. World Bank Group. Working Paper 7034. 54 Khandker, S.R., & G.B. Koolwal (2010) “How Infrastructure and Financial Institutions Affect Rural Income and Poverty: Evidence from Bangladesh.” The Journal of Development Studies 46(6), 1109-1137. 55 Jacoby, H. (2000). Access to markets and the benefits of rural roads. The Economic Journal, 110(465), 713–737 in Parada, J. (2016). Access to modern markets and the impacts of rural road rehabilitation: Evidence from Nicaragua 56 Parada, J. (2016). Access to modern markets and the impacts of rural road rehabilitation: Evidence from Nicaragua 57 Ivaldi, Marc & Vibes, Catherine, 2005. "Intermodal and Intramodal Competition in Passenger Rail Transport," IDEI Working Papers 345, Institut d'Économie Industrielle (IDEI), Toulouse 58 Teravaninthorn, S., & Raballand, G. (2009). Transport prices and costs in Africa: a review of the main international corridors. World Bank Publications.

Independent Evaluation Services in support of the Evaluation Design Report Philippines Secondary National Roads Development Project
15
while the prices will remain the same for the users. In India, truckers’ unions have also fixed freight prices restricting pass-through of cost savings and choking out competition in the market.59
Based on initial interviews in the Philippines, the GOP is planning on imposing stronger market regulation to prevent cost-cutting competition and to control rising accident rates. Similarly, Mexico had strongly regulated the trucking industry until 1989. Regulation was thought to promote fair pricing and control quality of service. But in practice, regulation served to restrict competition and limit supply to a few firms, resulting in high prices and poor services.60 When the government decided to deregulate trucking, the road transport prices had dropped by 23 percent within five years in real terms.61
2.5.2 Gaps in Literature
Evaluation Question 0 Gaps in literature is not applicable for Evaluation Area 0.
Evaluation Question 1 Much of the available information on economic analyses of road investments are ex-ante estimates conducted as part of feasibility studies or a selection process to choose the road to be improved. Without ex-post economic analysis, it is difficult to understand whether the road project actually generated the economic return that was initially anticipated. Evaluation Question 2A The World Bank and ADB have extensive experience supporting the GOP on road maintenance. However, the road maintenance practice and policies have shifted significantly during the last several months. There is limited information on recent changes that have taken place and the impact that they have had on the sustainability of road investments. Evaluation Question 2B Many of the community-led road maintenance projects were pilot projects, often a subset of a larger maintenance project. Literature on community-led road maintenance is nascent and results from the pilot projects are preliminary at this point. Therefore, results of community-led road maintenance projects are unconsolidated and factors that contribute to its success are unclear. Evaluation Questions 3A and 3B Much of the existing evidence has been limited because its definition of beneficiaries pertained to population residing close to the improved road segment. This definition limits development of literature on those who actually use the road, which may differ from those who reside next to road. Therefore, while there is ample, yet inclusive, evidence on benefits of road improvement, it is not helpful in understanding the change of road users before and after the road improvement. In addition, much of the available information is limited to road users prior to road improvement as governments and donors are less inclined to learn about them after the road improvement.
59 Babu Chennupati, D., & Mouly Potluri, R. (2011). A viewpoint on cartels: an Indian perspective. International Journal of Law and Management, 53(4), 252-261. 60 Teravaninthorn, S., & Raballand, G. (2009). Transport prices and costs in Africa: a review of the main international corridors. World Bank Publications, p. 20. 61 Ibid., p. 21.

Independent Evaluation Services in support of the Evaluation Design Report Philippines Secondary National Roads Development Project
16
MCC’s focus on defining the road users as beneficiaries of road infrastructure projects has shifted the evaluations to examine the road user patterns and changes over time. However, many of the evaluations are currently ongoing and not available now. For the evaluation, information from the O-D survey and a traffic count is available from the feasibility study, but this is limited to AADT and O-D, not providing other details on the road users. Evaluation Question 4 T&R finds that there can be a strong disconnect between transport costs and the actual transport prices. Especially for Central Africa, the authors found that higher transport prices are reported for roads in better condition, which is counterintuitive.62 The authors conclude that the high prices are due to informal market-sharing agreements.
Unfortunately, similar data examining the relationship between transport cost and transport price is not available for the Philippines or other Southeast Asian countries. ADB reported that public transport on the project roads increased after the completion of its Fourth Road Improvement Project but does not specify whether the cost savings led to a decrease in transportation price.63
2.5.3 Policy Relevance of the Evaluation
Evaluation Question 0 The response to Evaluation Question 0 will help to inform MCC’s future design of road projects. Evaluation Question 1 The evaluation will be one of the few instances in which an ex-post economic analysis of a road investment is conducted based on rigorous data collection. Evaluation Question 1 will contribute to the literature by providing evidence to the limited number of ex-post performance evaluation conducted for road infrastructure investment. Evaluation Questions 2A and 2B Evaluation Questions 2A and 2B will provide updated information on the Philippines road maintenance practices. It is critical to receive updated information on road maintenance because the Philippines’ road maintenance practices are quickly evolving after President Duterte abolished the Road Board in 2019. Any future road investment in the Philippines should take into account the updated maintenance regime. Evaluation Questions 3A and 3B Evaluation Questions 3A and 3B will provide information on the actual road users that benefit from the road investment projects. The evaluation questions are intended to shine light on who benefits and the details of their choices including the rationale for choosing to drive on the road and what they are transporting. Evaluation Question 3B will help policymakers understand how the road usage changes before and after road improvement, in addition to the total volume of vehicles on the road. Evaluation Question 4 Evaluation Question 4 will inform MCC and other development partners’ understanding of how
62 Ibid., p.41. 63 Ibid., p.3-2.

Independent Evaluation Services in support of the Evaluation Design Report Philippines Secondary National Roads Development Project
17
people who do not own vehicles benefit from road projects. The evaluation question is intended to shine light on how the benefits are distributed among road users.

Independent Evaluation Services in support of the Evaluation Design Report Philippines Secondary National Roads Development Project
18
III. EVALUATION DESIGN
3.1 EVALUATION QUESTIONS
The evaluation will address the following evaluation areas: Evaluation Area 0 examines whether the SNRDP was implemented according to plan. The analysis will focus on highlighting any ways that implementation deviated from the original Compact design to fully understand how the SNRDP was implemented. The evaluation team will review program documents to identify any changes made to the original design. Evaluation Area 1 tests the economic viability of MCC-funded roads by conducting a cost-benefit analysis (CBA) to estimate the economic rate of return (ERR) and net present value (NPV) of the roads. The CBA will employ the HDM-4, an analytical tool developed by the World Bank. The post-Compact CBA will re-evaluate the validity of the initial assumptions made prior to the Compact and the economic viability of the SNRDP. Evaluation Area 2 will evaluate the road maintenance regime within the Philippines to test the sustainability of improvement in road infrastructure. Examining the political and economic factors shaping road maintenance decisions and practices will improve MCC’s assumption on post-Compact maintenance and project-life assumptions about its infrastructure investments. In particular, Evaluation Area 2 will assess whether MCC’s investment in improving maintenance practices were effective in improving the Philippines’ maintenance practices. Evaluation Area 3 is a study of road users to understand the type of beneficiaries from the SNRDP. The data collected for Evaluation Area 3 will inform the HDM-4 model. Information such as the cost and duration of trips and value of goods being transported will be analyzed. This evaluation area is also intended to understand any change over time in road users and their travel patterns before and after the road improvement and how they differ among the road users. Evaluation Area 4 is an analysis of the transportation market structure. This evaluation area will analyze transportation market structure, both formal and informal, to understand how cost savings from road improvements have passed on to transport consumers who do not own their own vehicles. The analysis of the formal and informal institutions of the transportation market will inform whether vehicle operating cost (VOC) savings are passed on to road users who do not own their own vehicle, such as farmers transporting their goods to market and public transportation users. Below are the evaluation questions for each evaluation area: Evaluation Area 0: Project Design and Implementation
0) Were there any deviations from the original project design? [Result: Road Rehabilitation, Construction, and/or Improvement]
Evaluation Area 1: Engineering Analysis and Economic Model

Independent Evaluation Services in support of the Evaluation Design Report Philippines Secondary National Roads Development Project
19
1) What is the economic return of the road investment? [Result: Time Savings and Lower Vehicle Operating Costs (modelled by HDM-4)64]
Evaluation Area 2: Maintenance 2A) What are the relevant road authority’s current maintenance practices and what is the
likelihood that MCC’s investment will remain adequately maintenance for the life of the investment? Specifically, what maintenance regime reflects current practices and will therefore be applied to HDM-4? What maintenance practices most influenced your selection of this regime? [Result: Assumption: Maintenance]
2B) In cases where MCC included targeted maintenance improvements, how were these implemented and what were the effects of those efforts? [Result: Assumption: Maintenance]
Evaluation Area 3: Road Usage Patterns 3A) Who is traveling on the road, why, what are they transporting, what are they paying for
transport, and how long does it take to move along key routes? How does road usage vary by road-user’s income and gender? [Results: Reduced Transportation Costs (actual), Generated and Diverted Traffic]
3B) Have road usage patterns changed, in terms of who is traveling on the road, why, what they are transporting, what they are paying for transport, and how long it takes to move along key routes? [Result: Reduced Transportation Costs (actual), Generated and Diverted Traffic]
Evaluation Area 4: Transportation Market Structure 4) Given the existing transportation market structure, what portion of VOC savings will be
passed on to consumers of transportation services; and if not all savings are passed on, could this project have cost effectively addressed these inefficiencies? [Result: Reduced Transportation Costs (actual)]
Individual evaluation areas are interwoven as outlined in Figure III.1 below. In advance of evaluating the SNRDP, the team will investigate how the project was implemented (Evaluation Area 0). With the economic evaluation (Evaluation Area 1) as an instrument to test the activity objective of reduced transport cost, the performance evaluation components (Evaluation Area 2, 3, and 4) inform and provide critical nuances to understand the final ERR of the MCC-funded road infrastructure projects. The five evaluation areas, collectively, will inform MCC on its future project design, monitoring, and implementation of roads project and/or other large infrastructure projects.
64 Evaluation Question 1 includes “Reduced Road Maintenance Cost” as a result but this has been removed because this is a benefit not attributing to the increased household income, which is the long-term outcome of the SNRDP project.

Independent Evaluation Services in support of the Evaluation Design Report Philippines Secondary National Roads Development Project
20
Figure III.1 Integration of Evaluation Areas
3.2 EVALUATION DESIGN OVERVIEW
Evaluation methodology is determined by the evaluation question. Table III.1 presents the evaluation type, evaluation design methodology, and data collection methods as appropriate for each evaluation question. Table III.1 Summary of Evaluation Design Overview
Evaluation Question
(EQ)
Evaluation Type
Evaluation Methodology
Baseline (Without Project)
Endline (With Project)
EQ 0 Performance Evaluation Ex-post N/A KIIs
Secondary sources
EQ 1 Performance Evaluation Modeling Secondary sources
Primary data collection • Manual traffic count • O-D survey • VOC survey • Road roughness study • Road condition study • Deflection study (to be
determined after completing road roughness study and road condition study)
Secondary sources
EQ 2A Performance Evaluation Ex-post N/A KIIs
Secondary sources

Independent Evaluation Services in support of the Evaluation Design Report Philippines Secondary National Roads Development Project
21
Evaluation Question
(EQ)
Evaluation Type
Evaluation Methodology
Baseline (Without Project)
Endline (With Project)
EQ 2B Performance Evaluation Pre-post N/A KIIs
Secondary sources
EQ 3A Performance Evaluation Ex-post N/A
O-D surveyPTU survey Travel Time study
EQ 3B Performance Evaluation Pre-post
Secondary sources Manual traffic count O-D survey(retrospective baseline) O-D survey
PTU survey (retrospective baseline) PTU survey
EQ 4 Performance Evaluation Ex-post N/A
Secondary sources O-D surveyPTU survey
MCC’s Independent Evaluation Management Guidance (February 2020)65 defines three types of evaluation: impact, performance, and multiple. Based on MCC’s definition of performance evaluations, this evaluation is considered a performance evaluation66 for all of the evaluation questions. With the exception of EQ 1, EQ 2B, and EQ 3B, all other evaluation questions are ex-post evaluations where post-Compact data will used to answer the evaluation questions. EQ 1 is an economic analysis based on road-sector specific model, HDM-4, developed by the World Bank. EQ 2B will employ pre-post comparison to examine the changes that resulted from the CMRMP before and after the MCC Compact. EQ 3B will employ pre-post comparison to examine the changes that took place before and after the road improvements. Because baseline data prior to road improvements are not available, the evaluation team will ask questions about road usage prior to the road improvement to construct a retroactive baseline. Detailed primary and secondary data collection methodology will be discussed in the following sections for each evaluation question and sub-question. The evaluation will use a mixed-methods approach, employing both quantitative and qualitative methods for the performance evaluation.
65 MCC Independent Evaluation Management Guidance, February 2020. 66 MCC defines performance evaluation as “Performance evaluations estimate the contribution of MCC investments to changes in outcome trends, including farm and household income, when formal measurement of a counterfactual is not feasible. Performance evaluations cannot attribute outcome changes to specific causes. However, they often provide crucial insights into strengths or weaknesses in program implementation through critical empirical and analytic assessment of the measurable components of the program’s intermediate and ultimate outcomes. They can often identify clear opportunities to improve program implementation and investment decisions, even when they cannot explicitly estimate how an investment might have contributed to changes in beneficiary incomes.”

Independent Evaluation Services in support of the Evaluation Design Report Philippines Secondary National Roads Development Project
22
Table III.2 Detailed Evaluation Design Overview
Program Logic Result Indicator Unit Definition Baseline Value & Source Closeout Value &
Source Post-Compact Proposed Source Data Quality Controls Cost*
Evaluation Question 0
Output: Reconstruction and rehabilitation of 222km of the Samar road and 61 bridges
Percentage of indicators that exceeded end of Compact target out of all relevant indicators N/A N/A N/A N/A
MCC Project Documents • Review of MCC project documents
• Information obtained from the secondarysources will be triangulated withinformation obtained from the keyinformant interviews.
Summary of deviations from original Compact design
Key Informant Interviews • Semi-structured interviews with MCA and other
stakeholders
• Information obtained from the KIIs will betriangulated with information obtainedfrom the secondary sources
Evaluation Question 1
Outcome: Reduced vehicle operating cost & Outcome: Reduced travel time & Outcome Reduced: maintenance cost
Average Annual Daily Traffic of the MCC-funded road section
Number Annualized daily average number of vehicles by type
Final Assessment Report (Tetra Tech, September 2009)67
1. Section 1A&1B: 1,5052. Section 2: 1,4363. Section 3&4: 1,3364. Section 5: 1,238
Not Available
Manual Traffic Count survey • Location: 4 stations on the Samar road
1. Paranas Junction at the start of the road at Wright2. Between Taft and Borongan (Km 890-Km 946) at
permanent count station3. North of Buenavista Junction (intersection of the
Samar southern coastal road4. South of Buenavista Junction (intersection of the
Samar southern coastal road• Survey days: 3 days 24 hours• Survey period68: February 2022• Adjustment: seasonal traffic variation from DPWH• Instrument: paper-form
• 1 permanent counter (loop) is located onthe Samar road and operated by DPWH.However, there are concerns on DPWH’sclassification of vehicles that it may notdistinguish well between categories.Therefore, an independent Manual TrafficCount survey will be conducted for theevaluation
• Manual traffic count data at Station E2 willbe compared with DPWH’s permanentcounter results to determine its quality andcalculate the seasonal traffic variation
• Pilot test to be conducted• Double entry of data collected to ensure
accurate data entry• Data entry using a software with built-in
quality checks
Vehicle occupancy Number Number of average passengers per vehicle
Final Assessment Report Appendix H-3 (Tetra Tech, September 2009) • Car – 1• Motorcycle - 1• Small Bus -10• Jeepney – 12• Large Bus - 40
Not Available
Origin-Destination survey • Location: 3 locations (MTC station E2 and E4) and an
additional station between Borongan and GenMcArthur near Llorente (E5)
• Survey days: 1 weekday 24 hours• Survey period: March 2022• Sample unit: motorized vehicle on the Samar road• Sample rate: Approximately 33% of personal vehicles,
62% of tricycle/motorcycles, 78% of buses, and 63%of trucks will be stopped.
• Target respondents: driver of motorized vehicles andrandomly selected passenger of the vehicle for amodule on passenger origin and destination
• Back-translation and pre-test ofquestionnaire, and pilot test to beconducted
• Data collected on electronic devices, ifpossible, to minimize data entry errors
• Call-back of 10% respondents to verifydata collected
Trip purpose Category Purpose of road users’ trip (leisure, business, commute)
Final Assessment Report Appendix H-3 (Tetra Tech, September 2009) • Work/business – 75% for
Car, Small Bus, Motorcycle,and Large Bus; 20% forJeepney
Cost of travel time PHP/Trip of 222 km
Cost of traveling based on value of time
Final Assessment Report Appendix H-3 (Tetra Tech, September 2009)
67 The HDM-4 results in Appendix H-3 and the pavement design in the Final Assessment Report uses a different AADT (1,235; 1,093; 1,037; 1,034). The M&E Plan refers to the baseline AADT as 1,179. The baseline value of the Final Assessment Report (2009) will be used as the baseline for the evaluation because i) the M&E Plan’s baseline AADT is not broken down by road segments and the source for the AADT is not clearly stated, and ii) the Compact close-out HDM-4 also uses these AADT results. 68 The traffic count conducted by Tetra Tech for the Final Assessment Report (2009) was completed in September. However, the report also notes that the traffic is lowest in September and October due to less demand in travel. Therefore, the evaluation will be conducted in February when the traffic is expected to be higher and apply the seasonable traffic variation adjustment.

Independent Evaluation Services in support of the Evaluation Design Report Philippines Secondary National Roads Development Project
23
Program Logic Result Indicator Unit Definition Baseline Value & Source Closeout Value &
Source Post-Compact Proposed Source Data Quality Controls Cost*
• 1,485 PHP for car and 410PHP for public transport forwork trips
Cargo value PHP/Trip of 222 km Value of Cargo delay
Final Assessment Report Appendix H-3 (Tetra Tech, September 2009) • 222 PHP for 2-Axle trucks• 398 PHP for 3-axle trucks• 614 PHP for 4 or more axle
trucks
Equivalent standard axle loads (ESAL) factor
ESAL
Summation of equivalent 18,000 lbs (or 18 kips, or 80 kN) single axle loads used to combine mixed traffic to standard loads
Final Assessment Report Appendix H-3 (Tetra Tech, September 2009) • Large bus: 0.8• Truck-2 axle: 2.3• Truck-3 axle: 5.2• Truck-4 axle: 5.0• Truck-5 axle: 4.5
Not Available Axle Load Survey • ESAL factor estimated based on visual inspection of
the traffic during the O-D survey and the IRI survey.
• Permanent weighing station not availableon the Samar road
Vehicle Operating Cost input parameters for HDM-4
N/A
Cost of crew, fuel, maintenance labor, oil, overhead, (retreaded) tire, vehicle etc.
Final Assessment Report Appendix H-3 (Tetra Tech, September 2009) • See attached EXCEL file
Not Available
Vehicle Operating Cost survey • Adjust the existing DPWH VOC data to be appropriate
for the Samar region by conducting additional interviews
• Sample unit: vehicle maintenance workshops• Sample size: 7• Target respondents: Representatives or owners of each
respondent organizations identified
• DPWH annually updates the VOC data, butthese are national values and may bedifferent from the values in the Samarregion. The team will review and updatethe DPWH VOC values
Unit maintenance costs PHP
Annual routine maintenance per km, patching per m2, crack sealing per m, surface treatment per m2, bituminous overlay per m3 etc.
Not Available Not Available DPWH Maintenance Documents • Review of secondary sources from the DPWH
• Data will be compared with internationalcosts to verify the legitimacy of the datacollected
Road physical parameters for HDM-4
N/A Roadway width, geometry, drainage and speed reduction factors etc.
Final Assessment Report Appendix H-3 (Tetra Tech, September 2009) • See attached EXCEL file69
As-built drawing70 As-built drawings • Review of secondary sources (as-built drawing) from
the DPWH
• As built drawings of CP3 not available yet;if not available, geometry features will beadopted based on a subjective rating ofgeometry and HDM-4 defaults
Roughness
International Roughness Index (IRI) m/km
Roughness of the road surface in meters per kilometer of distance traveled
IRI measurement for SNRDP (July 28, 2014)71 72 • S00123SM (30.9 km) IRI =
7.173 (based on MCC M&E Plan)
• S00126SM (63 km) IRI =5.47
SNRDP Closeout ERR Summary of updates Final74 • Estimated IRI for CP1,
CP3, and CP4 = 1.8• CP2: Not Available
Road Roughness study • Survey period: February 2022• Interval: Continuous measure reported every 10-
meters• Equipment: laser profiler
• Calibration: Sample 6 test sections (each300-m long) covering a range of expectedroughness; using dipstick and/ortopographical survey to determine actualIRI, and plotted against the profilersmeasures to determine a line of best fit toderive calibration equation. Testrepeatability at each test section (run 5
69 Road sections with rigid (concrete) pavement are modelled as flexile pavement in the available HDM-4 files and will be adjusted. 70 As-built drawing for CP3 is currently not available to the evaluation team. 71 DPWH, IRI Data for 2014, March 25, 2015. 72 MCC M&E Plan also reports on the baseline IRI (7.1 m/km). However, this is based on a visual assessment. Therefore, the evaluation will use the IRI measurement from DPWH (2014) as the baseline where data is available. 73 DPWH collected IRI data on July 28, 2014 and published the report on March 25, 2015. The IRI reported by the DPWH for the first 30.9km of the SNRDP road section is 5.82. However, this road includes a road section that was improved by MCC in June 2014, which means that the IRI of 5.82 is inclusive of the road that was improved by MCC and cannot serve as the baseline. Therefore, the baseline IRI for this section is based on the MCC M&E Plan IRI which is 7.1, based on visual inspection. 73 DPWH, IRI Data for 2014, March 25, 2015. 74 The IRI measured by DPWH was between 2.6 and 3.2 m/km which was deemed too high by MCC and the Contractor. The Contractor’s IRI measurement for CP1 was 0.82 m/km, which is considered too low to be realistic. Because of these discrepancies and concern on the reliability of DPWH and Contractor’s data, the value was estimated to be somewhere in between.

Independent Evaluation Services in support of the Evaluation Design Report Philippines Secondary National Roads Development Project
24
Program Logic Result Indicator Unit Definition Baseline Value & Source Closeout Value &
Source Post-Compact Proposed Source Data Quality Controls Cost*
• S00136SM (121.3 km) IRI =4.25
times) at least two speeds within the standard range of vehicle speed on the road
Road condition parameters for HDM-4
m2 or m or #/km for AC (flexible) pavement
Area with wide cracking, area with all cracking, area potholed, mean rut depth etc.
Final Assessment Report Appendix H-3 (Tetra Tech, September 2009) • See attached EXCEL file
MCC – Annual Summary Report on Philippine Compact (2017) • Evidence of some
distresses available
Road Condition study • Survey period: same time as road roughness study• Equipment: Simplified visual inspection of distress
and road condition conducted during the roadroughness study
• Level of maintenance performed cross-checked with existing data on maintenanceperformedmm or % or
#/km for PCC (rigid) pavement
Average faulting, spalled joints, cracked slabs, deteriorated cracks, failures per km
Not Available
MCC – Annual Summary Report on Philippine Compact (2017) • Evidence of some
distresses available
AC pavement: Structural Number (SN)
Number Index representing the structural strength of pavement
Final Assessment Report Appendix H-3 (Tetra Tech, September 2009) • See attached EXCEL file
As-Built Drawing75 • For CP4 no cross-
section drawings areavailable.
• As there is noevidence of coring it seems that what’s called “as-built” is in fact “as-designed”.
Deflection study • Standard: ASTM 4695-03(2015) and ASTM
D1195/D1195M – 09(2015) or ASTM D4694 -09(2015) depending on the final equipment selected
• Instrument: FWD or BB depending on availabilityo FWD is used for deflection measurements on
both ACP and PCCPo If using BB, the axle loading of the truck will be
increased from 80 kN to 130 kN to measuredeflection on rigid pavements (PCCP)
• Interval: 200m (staggered)• Survey period: April 2022
• To be conducted under Option Period 2only when there is clear evidence from theRoad Roughness study and Road Conditionstudy results that there will be a drasticchange to the ERR without the deflectionstudy (see Section 3.3.2 for moreinformation)
• For FWD, calibrate geophones weekly oras often as needed by comparing the deflection sensors to one another and checking mechanical calibration of parts; for BB, weigh the axle load of the truck (and adjust weight as required) immediately prior to testing; static loading device calibrated daily with feeler gauge
AC pavement: Adjusted Structural Number
Number
Index representing the structural strength of pavement modified for subgrade support Final Assessment Report
Appendix H-3 (Tetra Tech, September 2009) • See attached EXCEL file
As-Built Drawing76 • For CP4 no cross-
section drawings are available.
• As there is no evidence of coring it seems that what’s called “as-built” is in fact “as-designed”.
As-built drawings • Review of secondary sources (e.g. missing as-built
drawings) from the DPWH
• Primary data collection not required basedon preliminary analysis of the road; to bedetermined after reviewing the RoadRoughness study and Road Condition studyresults
AC pavement: Layer thickness and coefficients
mm Thickness of surface, base and surface layers
California Bearing Ratio (CBR) % Strength of non-stabilized
cohesive materials in subgrade
PCC pavement: Slab thickness and concrete rupture modulus
mm, MPa Thickness of PCC slab and PCC modulus of rupture
Not Available
As-Built Drawing (CP1 & CP2) • DPCC = 265 mm
(reconstructed PCC) • DPCC = 230 mm
(unbonded PCCoverlay)
• No rupture modulusavailable.
As-built drawings • Review of secondary sources (e.g. missing as-built
drawings and QC/QA reports from the DPWH) andfield measurements like slab length
• Primary data collection not required basedon preliminary analysis of the road; to bedetermined after reviewing the RoadRoughness study and Road Conditionstudy results
PCC pavement: Base (subbase) thickness and modulus
mm, MPa Thickness of unbound base (subbase) layer and base modulus
Not Available
As-Built Drawing (CP1 & CP2) • DSUB = 150 mm
(reconstructed PCC)
75 As-built drawing for CP3 is currently not available to the evaluation team. 76 As-built drawing for CP3 is currently not available to the evaluation team.

Independent Evaluation Services in support of the Evaluation Design Report Philippines Secondary National Roads Development Project
25
Program Logic Result Indicator Unit Definition Baseline Value & Source Closeout Value &
Source Post-Compact Proposed Source Data Quality Controls Cost*
• DSUB = 70-300 mm(unbonded PCCoverlay).
• No modulus available,but can be estimatedbased on subgradeCBR
PCC pavement: Slab length m PCC Slab length Not Available
As-Built Drawing (CP1 & CP2) • L = 4.2 - 4.5 m
Evaluation Question 2A
Assumption: Road adequately maintained for the life of the investment
Annual maintenance budget estimated PHP
Annual maintenance budget estimated by DPWH for MCC road section (2016-2022)
N/A N/A DPWH BOM/District Office records • Review of secondary sources
• Information obtained from the secondarysources will be triangulated withinformation obtained from the keyinformant interviews
Annual maintenance budget allocated PHP
Annual budget allocated for the maintenance of the MCC road (2016-2022)
N/A N/A DBM/DPWH records; IFC Annual Summary Report • Review of secondary sources
Annual maintenance budget spent PHP
Annual actual maintenance expenditures on MCC road section (2016-2021)
N/A N/A DPWH BOM/District Office records • Review of secondary sources
Likelihood of periodic maintenance taking place
Number Number of periodic maintenances completed on comparable and older roads
N/A N/A DPWH BOM/District Office records • Review of secondary sources
Quality of maintenance performed N/A
Quality of emergency and routine maintenance performed on the MCC-funded road section
N/A N/A Road Condition study and Road Roughness study • Use data collection under Evaluation Question 1
Road maintenance laws, policies, and processes
N/A N/A
N/A N/A
Laws and DPWH policies • Review available secondary sources including legal
documents such as laws and decrees pertaining to road maintenance.
N/A N/A Key Informant Interviews • Semi-structured interview key stakeholders involved
in maintenance
• Back-translation of questionnaire• Information obtained from the KIIs will be
triangulated with information obtainedfrom the secondary source
Evaluation Question 2B
Outcome: Road adequately maintained through CMRMP
Annual maintenance budget allocated for CMRMP
N/A Annual budget allocated for the CMRMP (2016-2022) N/A N/A
DBM/DPWH/Road Board records; IFC Annual Summary • Review of secondary sources
• Information obtained from the secondarysources will be triangulated withinformation obtained from the keyinformant interviews
Annual maintenance budget spent on CMRMP
N/A Annual actual maintenance expenditures for the CMRMP (2016-2021)
N/A N/A DPWH/DSWD records • Review of secondary sources
Quality of maintenance performed under CMRMP
N/A Quality of maintenance performed under the CMRMP N/A N/A Road Condition study and Road Roughness study
• Use data collection under Evaluation Question 1
Evaluation Question 3A
Outcome: Reduced transportation costs for
Who is traveling on the road N/A
Type of vehicles and number/frequency, education, gender, income, occupation, and vehicle ownership of road users on the MCC road (2022)
N/A N/A
Manual Traffic Count See description under Evaluation Question 1
• Refer to the section above underEvaluation Question 1
Origin-Destination survey See description under Evaluation Question 1
• Refer to the section above underEvaluation Question 1

Independent Evaluation Services in support of the Evaluation Design Report Philippines Secondary National Roads Development Project
26
Program Logic Result Indicator Unit Definition Baseline Value & Source Closeout Value &
Source Post-Compact Proposed Source Data Quality Controls Cost*
passengers and goods & Outcome: Increased number of road users
Type of vehicles and number/frequency, education, gender, income, occupation, and vehicle ownership of public transport users on the MCC road (2022)
N/A N/A
Public Transport User survey • Location: 8 locations in 4 municipalities (Borongan,
Taft, Llorente, Guiuan) • Survey period: April 2022• Sample unit: public transport users• Sample size: 250 assuming 85% response rate• Target respondents: public transport users over 18
years of age who are about to onboard or justoffboarded public transportation operating on SNRDProad
• Back-translation and pre-test ofquestionnaire, and pilot test to be conducted
• Data collected on electronic devices, ifpossible, to minimize data entry errors
• Call-back of 10% respondents to verifydata collected
Why the road users are traveling on the road N/A
O-D, travel time, and trippurpose on the MCC road(2022)
N/A N/A Origin-Destination survey • See description under Evaluation Question 1
• Refer to the section above underEvaluation Question 1
O-D, travel times, and trippurpose of public transportusers on the MCC road (2022)
N/A N/A Public Transport User survey • See description above • Refer to the section above
What the road users are paying for transport
PHP
Fares for goods transported on the MCC road (2022) N/A N/A Origin-Destination survey
• See description under Evaluation Question 1• Refer to the section above under
Evaluation Question 1Fares for passengers transported on the MCC road (2022)
N/A N/A Public Transport User survey • See description above • Refer to the section above
What the road users are transporting N/A
O-D, type, volume, and valueof goods transported on theMCC road (2022)
N/A N/A Origin-Destination survey • See description under Evaluation Question 1
• Refer to the section above underEvaluation Question 1
O-D, travel times, and trippurpose of public transportusers on the MCC road (2022)
N/A N/A Public Transport User survey • See description above • Refer to the section above
How long it takes to move along key routes
Hours O-D and travel time on theMCC road (2022) N/A N/A Origin-Destination survey
See description under Evaluation Question 1 • Refer to the section above under
Evaluation Question 1
Km/hour Travel time on the MCC road (2022) N/A N/A
Travel Time study • Methodology: a test vehicle will be dispatched to
travel along the project corridor at 8 AM, 1 PM, and 5PM in each direction and travel times recorded atdesignated intervals and checkpoints
• Instrument: paper forms• Survey period: February 2022
• Data entry using a software with built-inquality checks
• Data will be cross-checked with videorecordings
Evaluation Question 3B
Output: Reduced transportation costs for passengers and goods & Outcome: Increased number of road users
Change in who is traveling on the road N/A
Change in type of vehicles and number/frequency of road users traveling on the MCC road (2020)
Final Assessment Report (Tetra Tech, September 2009) • Trailer-Truck 5 Axles• Trailer-Truck 4 Axles• Rigid Truck 3 Axles• Rigid Truck 2 Axles• Pick-up/Vans• Car/van• Large Bus• Small Bus• Jeepneys/Mega Taxi• Motor-cycle• Motor-tricycle
Not Available
Manual Traffic Count Information from Evaluation Question 3A
• For baseline values, use secondary sources• Refer to the section above under Evaluation
Question 1
Origin-Destination survey Information from Evaluation Question 3A
• For baseline values, ask recall questions tocapture pre-project conditions
• Refer to the section above under EvaluationQuestion 1
Change in type of vehicles and number/frequency of public Not Available Not Available Public Transport User survey
• Information from Evaluation Question 3A• Refer to the section above under Evaluation
Question 3A

Independent Evaluation Services in support of the Evaluation Design Report Philippines Secondary National Roads Development Project
27
Program Logic Result Indicator Unit Definition Baseline Value & Source Closeout Value &
Source Post-Compact Proposed Source Data Quality Controls Cost*
transport users on the MCC road (2020)
• For baseline values, ask recall questions to capturepre-project conditions
Change in why the road users are traveling on the road
N/A
Change in O-D, travel times, and trip purpose on the MCC road (2022)
Not Available Not Available
Origin-Destination survey • Information from Evaluation Question 3A• For baseline values, ask recall questions to capture
pre-project conditions
• Refer to the section above under EvaluationQuestion 1
Change in O-D, travel times, and purpose of trips of public transport users on the MCC road (2022)
Not Available Not Available
Public Transport User survey • Information from Evaluation Question 3A• For baseline values, ask recall questions to capture
pre-project conditions
• Refer to the section above under EvaluationQuestion 3A
Change in how long it takes to move along key routes
Hours Change in O-D and travel time on the MCC road (2022) Not Available Not Available
Origin-Destination survey • Information from Evaluation Question 3A• For baseline values, ask recall questions to capture
pre-project conditions
• Refer to the section above under EvaluationQuestion 1
Change in what the road users are paying for transport
PHP
Change in fare to transport goods on MCC road (2022) Not Available Not Available
Origin-Destination survey • Information from Evaluation Question 3A• For baseline values, ask recall questions to capture
pre-project conditions
• Refer to the section above under EvaluationQuestion 1
Change in passenger transport fares on the MCC road (2022) Not Available Not Available
Public Transport User survey • Information from Evaluation Question 3A• For baseline values, ask recall questions to capture
pre-project conditions
• Refer to the section above under EvaluationQuestion 3A
Change in what the road users are transporting
N/A
Change in O-D, type, volume, and value of goods transported on the MCC road (2022)
Not Available Not Available
Origin-Destination survey • Information from Evaluation Question 3A• For baseline values, ask recall questions to capture
pre-project conditions
• Refer to the section above under EvaluationQuestion 1
Change in O-D, travel times, and trip purpose of public transport users on the MCC road (2022)
Not Available Not Available
Public Transport User survey • Information from Evaluation Question 3A• For baseline values, ask recall questions to capture
pre-project conditions
• Refer to the section above under EvaluationQuestion 3A
Evaluation Question 4
Outcome: Reduced transportation costs for passengers and goods & Assumption: Transportation sector competitive and well regulated
Portion of vehicle operating cost savings passed on to transport consumers
%
Estimated vehicle operating cos savings that are passed on to transport consumers (if any) over the total estimated vehicle operating cost savings
N/A N/A
Key Informant Interviews • Semi-structured interview transportation service
providers to estimate the cost savings for transportinggoods and passengers
• Back-translation of questionnaire• Information obtained from the KIIs will be
triangulated with information obtainedfrom the secondary source
Origin-Destination survey • See description under Evaluation Question 1
• Refer to the section above underEvaluation Question 1
Public Transport User survey • See description under Evaluation Question 3A
• Refer to the section above underEvaluation Question 3A
Historical records of transportation prices Review of secondary sources
• Information obtained from the secondarysources will be triangulated withinformation obtained from the keyinformant interviews
Transportation market laws, policies, and processes
N/A N/A N/A N/A
Key Informant Interviews • Semi-structured interview transportation service
providers and transport service regulators tounderstand the transport policies
• Back-translation of questionnaire• Information obtained from the KIIs will be
triangulated with information obtainedfrom the secondary source
Laws and DPWH/DOTr policies • Review available secondary sources including legal
documents such as laws and decrees pertaining totransportation market
• Information obtained from the secondarysources will be triangulated withinformation obtained from the keyinformant interviews

Independent Evaluation Services in support of the Evaluation Design Report Philippines Secondary National Roads Development Project
28
3.3 ALTERNATIVE DATA COLLECTION OPTIONS
3.3.1 Option Period 1
The most sensitive inputs to the HDM model for ERR calculation are traffic volume, roughness, and pavement structural variables (adjusted Structural Number calculated from layer thickness or deflection). Based on HDM-4 "A Guide to Calibration and Adaptation - Volume 5," the sensitivity class for these parameters is S-I, which means the impact elasticity is higher than 0.50.77 For instance, a 10 percent increase in pavement roughness causes a 5 percent or more increase in the ERR ceteris paribus. In order to support the decision-making process of the data collection rigor for EQ 1, the evaluation team estimated the impact of excluding certain data collection efforts on the ERR. The team considered two options with and without the axle load survey as follows:
• Option 1: Excludes the axle load survey but includes other surveys and studies.• Option 2: Includes the axle load survey and other surveys and studies.
The estimated ranges of ERR are based on the team’s subjective judgment for each option and should not be considered as a rigorous confidence interval. Both options estimate the ERR with varying levels of precision based on the rigor of the data collection methodology. Table III.3 Summary of Results on Estimated Level of ERR Precisions
Options Option 1 Option 2
Excludes Axle Load Survey Includes Axle Load Survey
Assumptions • Analysis adopts DPWH provided values
(which are national/regional averages)for ESALF.
N/A
Implications on analysis and interpretation
• The actual ESALF could be higher by50% to 100%. However, the roaddeterioration observed during the team’sfield visit does not indicate anaccelerated deterioration.
N/A
Estimated range of ERR +/- 5% points with a 100% increase in axle loading -
The impact of almost doubling the axle load value may result in about 5 percentage point reduction ERR. The visual observation during field visit in December 2019 did not indicate such a high possibility for variation and the likely variation may be in the 50 percent range and that could increase/reduce the ERR by about +/- 3 percentage points. It is important to understand axle loading in order to assess the long term performance and remaining life assessment.
Based on the exercise and discussion with MCC, Option 1 is selected for Evaluation Area 1, which excludes the axle load survey from data collection. In lieu of primary data collection, the team will
77 The World Road Association (PIARC), Highway Development & Management, Volume Five: A Guide to Calibration and Adaptation, 2000.

Independent Evaluation Services in support of the Evaluation Design Report Philippines Secondary National Roads Development Project
29
estimate the ESAL factor based visual inspection of the traffic observed during the O-D survey and the IRI study.
3.3.2 Option Period 2
Once data collection Option Period 1 is completed, the evaluation team will perform a similar exercise to determine additional data collection rigor for EQ 1, especially for the deflection study. The evaluation team will estimate the impact of excluding deflection data collection on the ERR. The team considered two options with and without deflection study as follows:
• Option 1: No additional deflection study.• Option 2: Deflection study conducted in addition to other data collection conducted under
Option Period 1. Table III.4 Template Summarizing the Results on Estimated Level of ERR Precisions
Upon completing the data collection for Option Period 1, the evaluation team will determine if the addition of deflection data collection will result in a drastic change to the ERR. This will be documented and discussed with MCC to determine whether the data collection for deflection will take place or not under Option Period 2.
Options Option 1 Option 2
Excludes Deflection Study Includes Deflection Study
Assumptions • Use layer thickness to calculate StructuralNumber N/A
Implications on analysis and interpretation
• Structural capacity based on deflectionmeasurement could be higher or lower andgives a better indication of pavementstrength
N/A
Estimated range of ERR +/- % points -

Independent Evaluation Services in support of the Evaluation Design Report Philippines Secondary National Roads Development Project
30
IV. EVALUATION QUESTION 0 0) Were there any deviations from the original project design? [Result: Road
Rehabilitation, Construction, and/or Improvement]
4.1 METHODOLOGY
4.1.1 General Overview of Methodology
EQ 0 will be an ex-post performance evaluation looking at how the MCC Compact was designed and whether the implementation of the SNRDP deviated from the original design. In addition, the information obtained to answer the evaluation question will provide the team with a clear foundation to assess other evaluation areas. Based on the information gathered, the team will provide recommendations as relevant to inform future Compact designs.
4.1.2 Detailed Methodology
EQ 0 will employ a mixed-methods data collection to answer the evaluation question. Information will be drawn from secondary sources mainly using MCC and MCA-P project documents for the MCC Philippines Compact. In addition, information from secondary sources will be verified and complemented with key informant interviews (KIIs) with MCC and/or MCA-P staff that worked on the Philippines Compact.
4.2 TIMEFRAME OF EXPOSURE
The road improvements on the Samar Road were partially completed by the end of the Compact in May 2016 and the remaining works were completed by DPWH in 2017. It is expected that the relevant results for EQ 0 have fully taken effect.
4.3 PRIMARY DATA COLLECTION – KIIS
4.3.1 Sample Units
MCC staff and MCA-P staff.
4.3.2 Sample Size and Associated Assumptions
At least two (2) interviews conducted, one with a representative of MCC and one with a representative of MCA-P.
4.3.3 Sample Frame
List of relevant MCC and MCA-P staff will be identified by the evaluation team with the assistance from the MCC Evaluation Project Monitor.
4.3.4 Sampling Strategy
Two respondents, one from MCC and one from MCA-P, will be identified based on recommendations from the MCC Evaluation Project Monitor who was also involved in the Philippines Compact and the SNRDP. The selection will be based on those who have the most relevant experience and information about the MCC Compact implementation.

Independent Evaluation Services in support of the Evaluation Design Report Philippines Secondary National Roads Development Project
31
4.3.5 Instruments
Paper-form questionnaires.
4.3.6 Rounds, Locations, and Timing
KIIs will be conducted in February 2022 to coincide with other data collection efforts.
4.3.7 Respondent(s) within the Sample Unit
N/A
4.3.8 Staff
The Evaluation Expert will conduct the KIIs in English, assisted by the In-Country Coordinator/Survey Manager.
4.3.9 Data Processing
The Evaluation Expert will conduct the KIIs in English, assisted by the In-Country Coordinator for the interview with the MCA-P staff and by a Junior Analyst for the interview in the United States. All KIIs will be audio-recorded on digital voice recorders and transcribed by the In-Country Coordinator/Junior Analyst. The evaluation team will classify, sort, and arrange information gathered to identify trends and examine the relationships in the data using NVivo.
4.3.10 Data Quality
While the Evaluation Expert leads the interviews and takes notes, the In-Country Coordinator/Junior Analyst will assist the interviews by taking notes that will be used to cross-reference with notes taken by the Evaluation Expert. The notes will also capture non-verbal information (circumstances of the interview, emotions, body language etc.). The transcript will be reviewed by the Evaluation Expert within 24 hours of the interview. The team will cross-examine information when relevant to help build a body of evidence to support the analysis.
4.3.11 Safety Procedures/Precautions
N/A
4.4 SUMMARY TABLE
Table IV.1 Primary Data Collection Summary Table for Evaluation Question 0
Data collection Timing Sample Unit/ Respondent Sample Size Relevant
Instruments Exposure
Period KIIs 02/2022 MCC/MCA-P staff 2 Paper questionnaire 69 months
4.5 SECONDARY QUANTITATIVE DATA
4.5.1 List of Secondary Data Sources
The team has reviewed the initial design documents provided by MCC and DPWH. The evaluation team will continue to obtain additional secondary data. For instance, the contract technical specifications, hand-over documents, and technical inspection reports will be reviewed. Any

Independent Evaluation Services in support of the Evaluation Design Report Philippines Secondary National Roads Development Project
32
deviations from the initial Compact design will be noted and discrepancies between available information will be highlighted to be confirmed during the evaluation.
4.5.2 Requirements for Data Capture
Data will be transferred electronically.
4.6 ANALYSIS PLAN
Based on the secondary and qualitative data collected (KIIs), the team will evaluate how the SNRDP was implemented and changes made during implementation. The team will review the rationale for the initial project design and identify changes made during implementation to assess whether the changes made were well-supported with evidence. Upon reviewing the project documents, the evaluation will determine the number of indicators that met or exceeded the end of Compact target.
4.7 CHALLENGES
4.7.1 Limitations of Interpretation of the Results
The evaluation team will ask retrospective questions during the KIIs to gather information about the decision-making process that took place during the Compact implementation and how the implementation diverted from the original project design. Recall bias may impact the quality of information from the KIIs. In addition, the staff interviewed may have incentives to skew the information they provide because they worked on the implementation.
4.7.2 Risks to the Study Design
There is a risk that project implementation documents may not be available to the evaluation team due to delay in sharing the documents, loss of records, or unwillingness of the stakeholders to share sensitive information. Given that the Compact was completed in 2016, there is a higher chance that relevant documents and relevant stakeholders are no longer available.

Independent Evaluation Services in support of the Evaluation Design Report Philippines Secondary National Roads Development Project
33
V. EVALUATION QUESTION 11) What is the economic return of the road investment? [Result: Time Savings and Lower
Vehicle Operating Costs (modelled by HDM-4)]
5.1 METHODOLOGY
5.1.1 General Overview of Methodology
EQ 1 requires an economic analysis, or a Cost-Benefit Analysis (CBA), to calculate the economic return of the road investment. The purpose of determining economic return on the SNRDP is to assess whether the investment resulted in an acceptable rate of return in terms of quantifiable benefits generated by the project. It also helps to compare the Evaluation-Based ERR with the Original ERR to assess the assumptions made for the investment decisions. EQ 1 will use the HDM-4 model, a CBA model specifically designed for road infrastructure. It will compare the monetized benefits and costs for the “with Project” and “without Project” scenarios.
5.1.2 Detailed Methodology
HDM-4 simulates two scenarios: 1) benefits and costs experienced from the project road if the SNRDP road improvement did not take place (counterfactual), and 2) benefits and costs experienced from the project road with the SNRDP implementation. HDM-4 simulates the road condition and resources used for maintenance for each road section per year, as well as the vehicle speeds and physical resources consumed by vehicle operation (fuel, lubricants etc.). After physical quantities involved in construction, road works, and vehicle operation are estimated, user-specified prices and unit costs are applied to determine financial and economic costs.78 Relative benefits are then calculated for different alternatives, followed by Net Present Value (NPV) and EIRR computations. The model is then completed using a sensitivity analysis. Risk analysis cannot be conducted with the HDM-4 model, so a separate software (e.g. Crystal Ball) will be used. Economic performance of a project is appraised with NPV and the Internal Rate of Return (IRR) complemented by other derived ratios. The ERR, as calculated by the HDM-4 model, is the discount rate that equalizes the NPV to zero, where NPV is the discounted difference between the benefits accruing to road users generated by the implementation of the Project and the difference of Project costs as compared to the costs of the alternative “without Project.”
5.2 TIMEFRAME OF EXPOSURE
Realization of impact and benefits of road construction projects depends on the extent of change and economic potential of the project impact area. There is no clear evidence to indicate when to collect data for HDM-4 after a road is completed. In general, “transport experts agree that it is unrealistic to expect to see immediate impacts on high-level outcomes, and that a few years are
78 Based on the ITT and the DPWH annual reports, the number of accidents actually increased from 128 (2012) and 127 (2013) pre-construction to 265 (2018) and 393 (2019) post-construction. DPWH's annual report states that "figure includes accidents which occurred in barangays under Samar and Eastern Samar Police Provincial Offices which may or may not be covered by the project". Taking this account, the evaluation team still believes that the majority of reported accidents would have occurred on the SNDRP road, given that it is the only major road in these provinces. Therefore, the team concluded that no major benefits in accident reduction have taken place on the SNRDP road and will not be included in the ERR calculations.

Independent Evaluation Services in support of the Evaluation Design Report Philippines Secondary National Roads Development Project
34
required for those changes to manifest.”79 While not in a developing country context, a study of 13 improved roads in England shows that the roads experienced an average of 7 percent increase in traffic, as compared to average background growth, between 3 to 7 years after opening.80 Based on this report and other relevant experience, the team believes that improving a congested road will bring out most of the impact within 1-2 years whereas constructing a new road to areas without good access will take 1-2 years to start to see the early impacts and 3-7 years to see larger impacts and 8 or more years to see the full impact. The Samar Road was determined passable at the end of the Compact in May 2016. MCC ex-ante ERR assumed that generated traffic will be fully adjusted in two years of Compact completion. If data collection takes place in/around February 2022, the exposure period is about 6 years which would have provided sufficient time to observe the anticipated effects.
5.3 PRIMARY DATA COLLECTION – MANUAL TRAFFIC COUNT
5.3.1 Sample Units
Motorized and non-motorized vehicle81 on the Samar road.
5.3.2 Sample Size and Associated Assumptions
Sample size is not relevant because all motorized and non-motorized vehicles on the Samar road will be observed and recorded.
5.3.3 Sample Frame
N/A
5.3.4 Sampling Strategy
Motorized and non-motorized vehicles will be classified into the following groups: 1. Sedan/SUV2. Passenger Utility Vans3. Pick Up – Cargo vehicles4. 2-axle Truck5. 3-axle Truck6. 4-axle Truck7. 5-axle Truck8. Medium bus9. Large bus10. Motorcycles11. Motorcycle taxis (habal-habal)12. Tricycles13. Jeepney14. Other (non-motorized vehicles)
79 MCC, Principles into Practice, Lessons from MCC’s Investments in Roads, November 2017. 80 Lynn Sloman, Lisa Hopkinson, and Ian Taylor, Campaign to Protect Rural England, The Impact of Road Projects in England, March 2017. 81 Bicycles and animal-drawn carts will be counted as “non-motorized vehicles”.

Independent Evaluation Services in support of the Evaluation Design Report Philippines Secondary National Roads Development Project
35
5.3.5 Instruments
One permanent counter (loop) is located on the Samar road and operated by DPWH. However, there are concerns on DPWH’s classification of vehicles may not accurately distinguish between categories. Therefore, the traffic count will be done manually for the evaluation. An A4 or letter size paper form with space for four 15-minute intervals will be used for data collection such that each sheet represents one hour of vehicle movements. At the end of the work shift, completed sheets will be transferred to the supervisor for control and data quality.
5.3.6 Rounds, Locations, and Timing
The traffic count conducted by Tetra Tech for the Final Assessment Report (2009) was completed in September. However, the report also notes that the traffic is the lowest in September and October due to lower travel demands. One round of manual traffic count (MTC) will be conducted in February 2022. The month of February is chosen to minimize risk of typhoon and to coincide with normal traffic season. For seasonal variations of traffic patterns, the evaluation team will use DPWH’s seasonable adjustment factor. The duration of the MTC will be three (3) days including two (2) weekdays and one (1) weekend day, with each survey period lasting for 24 hours. Figure V.1 Map of Tetra Tech Traffic Survey Locations and Road Sections82
82 Tetra Tech, Final Assessment Report Philippines Secondary National Roads Development Project (SNRDP), January 8, 2020, p.9-5.
T1 T2
T3
T4

Independent Evaluation Services in support of the Evaluation Design Report Philippines Secondary National Roads Development Project
36
Tetra Tech’s traffic count was conducted in the above four (4) locations and two locations were specified with Km. Two of these locations were at intersections (T1, T4) and two locations were at mid-block sections (T2, T3). The Tetra Tech report notes that the only major ingress/egress to Section 1A and 1B is the main junction at the municipality of Wright. Similarly, the major ingress/egress were the same for Section 3 and Section 4. Table V.1 Tetra Tech Traffic Survey Location and AADT
Tetra Tech Traffic Survey
# Location Km (if specified) Type Road Section AADT
T1 Paranas Junction at the start of the road at Wright 827+200 Intersection Section 1A
Section 1B 1,505
T2 Municipality of Sulat, approximately 31 kilometers north of Borongan Mid-block section Section 2 1,436
T3 Borongan Town Mid-block section - -
T4 Buenavista Junction (intersection of the Samar southern coastal road 1015+000 Intersection
Section 3 Section 4 1,336
Section 5 1,238 The Tetra Tech report indicates that the reported AADT represents traffic along the road sections (1A, 1B, 2, 3, 4, 5) and excludes the local traffic at the major urban centers along the study road. It clearly notes that “estimated local motorcycle and tricycle volumes were subtracted from the estimated 24 hour section traffic volume as the last step in determining the sectional AADT”83 because motorcycles are mainly used for short distance around town centers and tricycles for intra-municipality public transport mode. The report, unfortunately, does not provide evidence of how the local motorcycle and tricycle volumes were calculated. It is also important to note that the traffic count conducted within the town of Borongan picked up significant local traffic. The Tetra Tech report refers to the AADT within the Municipality of Borongan being more than ten times that of any road section on a weekend and 20 times on a weekday (more than 21,000 AADT).84 The report also indicates that both typical weekend and weekday traffic in Borongan mainly consisted of tricycles (65 percent on weekday, 59 percent on weekend) and motorcycles (29 percent on weekday, 35 percent on weekend). Therefore, the traffic count conducted within the Borongan municipality is unlikely to have been used to determine the AADT of the road sections. Instead, it is likely that the traffic survey conducted at Buenavista Junction (T4) was used to determine the AADT for road sections 3, 4, and 5. Table V.2 Evaluation Traffic Count Survey Locations
Evaluation Traffic Count Survey
# Location Km (if specified)
Comparable Tetra Tech Location
Tetra Tech Road Section for
AADT calculation
E1 Paranas Junction at the start of the road at Wright 827+300 100m east of T1 intersection Section 1A
Section 1B
E2 Between Taft and Borongan (Km 890-Km 946) at permanent count station 893+230 T2 (no other major ingress/
egress between T2 and E2) Section 2
E3 North of Buenavista Junction (intersection of the Samar southern coastal road 1014+900 100m north of T4
intersection Section 3 Section 4
83 Ibid. 84 Ibid.
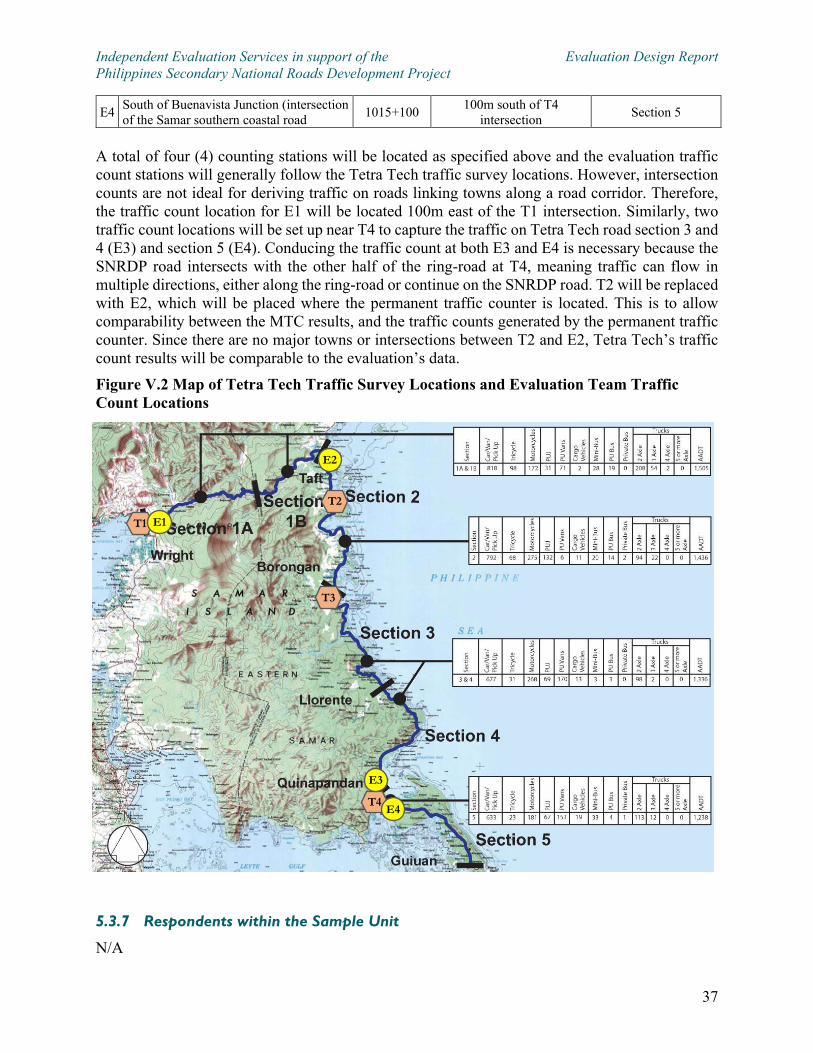
Independent Evaluation Services in support of the Evaluation Design Report Philippines Secondary National Roads Development Project
37
E4 South of Buenavista Junction (intersection of the Samar southern coastal road 1015+100 100m south of T4
intersection Section 5
A total of four (4) counting stations will be located as specified above and the evaluation traffic count stations will generally follow the Tetra Tech traffic survey locations. However, intersection counts are not ideal for deriving traffic on roads linking towns along a road corridor. Therefore, the traffic count location for E1 will be located 100m east of the T1 intersection. Similarly, two traffic count locations will be set up near T4 to capture the traffic on Tetra Tech road section 3 and 4 (E3) and section 5 (E4). Conducing the traffic count at both E3 and E4 is necessary because the SNRDP road intersects with the other half of the ring-road at T4, meaning traffic can flow in multiple directions, either along the ring-road or continue on the SNRDP road. T2 will be replaced with E2, which will be placed where the permanent traffic counter is located. This is to allow comparability between the MTC results, and the traffic counts generated by the permanent traffic counter. Since there are no major towns or intersections between T2 and E2, Tetra Tech’s traffic count results will be comparable to the evaluation’s data. Figure V.2 Map of Tetra Tech Traffic Survey Locations and Evaluation Team Traffic Count Locations
5.3.7 Respondents within the Sample Unit
N/A
E3
E4
T1 T2
T3
T4
E1
E2
E4
E3

Independent Evaluation Services in support of the Evaluation Design Report Philippines Secondary National Roads Development Project
38
5.3.8 Staff
The evaluation team intends to subcontract the traffic count and the team sizes will be determined by the successful bidder based on a competitive procurement process. The evaluation team will allow bidders to consider conducting the traffic counts with teams of five enumerators (two for each direction and one enumerator to support both directions) taking 6 or 8-hour shifts to be cost-effective. One supervisor will be responsible for each team of enumerators.
5.3.9 Data Processing
Data will be entered using a double entry method, where the data entry operators will enter the data twice to identify mismatches. The mismatches will be corrected based on the original copy of the O-D form. All raw data collected will be entered using data entry software with built-in quality checks for data entry.
5.3.10 Data Quality
Quality Assurance/Quality Control (QA/QC) measures will be applied to ensure high quality data collection. The evaluation team will ensure data quality of traffic count forms filled in by counters. Prior to data collection, the subcontractor and the evaluation team will train and pilot the survey to ensure high quality data collection. During data collection, the evaluation team will conduct random checks to ensure the data are recorded correctly and quickly rectify any anomalies. Supervisors will monitor the data collection closely and ensure the vehicle types are properly categorized in the appropriate columns on the traffic count form. Traffic count stations will have a minimum of two personnel at all times and reserves will be in place in case of unexpected emergencies. The data will be used to estimate AADT for each station. The procedure includes three steps, as described below:
i) Conversion of daytime counts to full day traffic (denominated Average Daily Traffic,ADT) on the basis of the percentage between daytime and full day counts carried out forone weekday and one for weekend day. This step is not necessary if the survey is conductedfor 24 hours during the entire week of counts.
ii) Calculation of the week average ADT based on the daily ADT obtained in previous step.iii) To obtain the AADT of the road, the season adjustment factor is applied to the average
weekly ADT. The value of the season factor depends on the month of the year in which thecounts have been made. The season factor provides the monthly fluctuation of traffic ascompared to the year average.
Data from Station #2 will be compared with the results from DPWH’s permanent counter to determine the quality of DPWH data and calculate the seasonal traffic variation.
5.3.11 Safety Procedures/Precautions
Approximately two to three meters of space is required inward from the carriageway in order to position tables, chairs, and also umbrellas or a tent-like structure for the counters that will provide protection against the sun and rain during data collection. Positioning of the survey location would also need to ensure good visibility in both directions (i.e. road bends or slopes must be avoided). In the evening or other dark times of the day, portable battery powered lamps with suitable back-up batteries, will be placed for the counters. The surveyors will also be provided with yellow reflective

Independent Evaluation Services in support of the Evaluation Design Report Philippines Secondary National Roads Development Project
39
jackets. Safety procedures will be in accordance with any guidance provided by DPWH in charge of road control and safety.
5.4 PRIMARY DATA COLLECTION – ORIGIN - DESTINATION SURVEY
5.4.1 Sample Units
Motorized vehicle on the Samar road.
5.4.2 Sample Size and Associated Assumptions
The sample size will depend on the number of motorized vehicle drivers using the Samar road and the sampling rate. A minimum of 20 percent of each vehicle type will be sample at each O-D location (refer to Annex IV for more information on O-D survey sampling). The sample rate will be determined based on the MTC results for each type of vehicle.
5.4.3 Sample Frame
The sample frame for the O-D survey is motorized vehicle drivers using the road sections where the interview stations are located. Sample frame will be done in real time.
5.4.4 Sampling Strategy
Vehicle drivers for each vehicle type will be selected randomly based on the sampling rate. Sampling will be done in real time. A traffic counter will be placed at each interview station for each direction to count the traffic by vehicle type. The counter will indicate to the O-D interviewer and the police escort which vehicle will be intercepted for the interview based on the sampling rate. The counter will track the traffic volume by vehicle type, the number of attempted vehicle interceptions, the number of vehicles successfully intercepted, the number of interviewees interviewed, and those who did not provide consent.
5.4.5 Instruments
The O-D survey will be conducted following a structured questionnaire. Two versions of the questionnaire will be used, one for vehicles transporting goods and the other for passenger vehicles. The questionnaire for vehicles transporting goods will include questions on the goods transported in addition to inquiring about their origin and destination. Questionnaire for passenger vehicles will include a section on fare prices in addition to questions on their origin and destination. When releasing a Request for Proposal to select a data collection firm, the evaluation team will request all bidders to consider using electronic hand-held devices for data collection. The instrument/equipment used may depend on the availability of competent data collection firms in the Philippines.
5.4.6 Rounds, Locations, and Timing
One round of O-D survey will be conducted in March 2022. The month of March is chosen to minimize risk of typhoon and to coincide with normal traffic season. The duration of the O-D survey will be one (1) weekday for 24 hours. Table V.3 Evaluation O-D Survey Locations

Independent Evaluation Services in support of the Evaluation Design Report Philippines Secondary National Roads Development Project
40
# Location Km (if specified) Trips Covered at Location
E2 Between Taft and Borongan (Km 890-Km 946) at permanent count station 893+230
Taft-Wright-Catbalogan-Calbayog (NW) Taft-Oras-Dolores (NE) Taft-Sulat-Borongan (S)
E5 Between Borongan and Gen McArthur near Llorente (junction with Tacloban road) Km 946-Km 1015
970+980 Llorente-Borongan-Sulat (N)
Llorente-Gen McArthur-Quinapondan-Guiuan (S) Llorente-Quinapondan-Giporlos-Basey-Tacloban (SW)
E4 South of Buenavista Junction (intersection of the Samar southern coastal road
1015+100 Guiuan-Quinapondan-Giporlos-Basey-Tacloban (NW) Guiuan-Quinapondan-Llorente (NE)
The table above presents the trips that will be covered at each of the O-D survey stations. The O-D survey will be conducted at three (3) locations as presented in the table above. O-D survey will take place at two of the four MTC locations (E2 and E4). The third O-D survey station will be located between Borongan and Gen McArthur near Llorente (E5, presented in blue on the map below). This location is added to capture the traffic between Borongan City and other major municipalities in the southern part of East Samar province and traffic heading to Tacloban in Leyte. The O-D survey stations will have sufficient space for parking and good visibility of the roads in both directions, avoiding road bends and slopes. Furthermore, stations will be staggered in each traffic direction to avoid congestion. The location will be selected to avoid potential traffic congestion and road safety risks due to its placement.

Independent Evaluation Services in support of the Evaluation Design Report Philippines Secondary National Roads Development Project
41
Figure V.3 Map of O-D Survey Locations and Tetra Tech Traffic Count Locations
5.4.7 Respondents within the Sample Unit
The target respondent of the O-D survey is the driver of motorized vehicle and a randomly selected passengers up to three (3) per vehicle for a module on passenger origin and destinations.
5.4.8 Staff
The evaluation team intends to subcontract the O-D survey and the team sizes will be determined by the successful bidder based on a competitive procurement process. All staff shall have proven experience in conducting O-D surveys. The data collection firm shall provide documentation supporting the required experience of its proposed staff. The evaluation team will allow bidders to consider conducting the O-D survey with teams of six (6) interviewers at each location taking 6 to 8-hour shifts to be cost-effective. A supervisor will oversee each team.
5.4.9 Data Processing
If the evaluation successfully contracts a firm to use electronic surveying method, hand-held electronic devices, such as tablets or smartphones, will be used to collect data. Survey software, such as SurveyToGo, SurveyCTO, or Open Data Kit, will be used depending on the capacity of the local data collection firm. Data will be uploaded from electronic devices and reviewed in real-time.
T1 T2
T3
T4
E2
E4
E5

Independent Evaluation Services in support of the Evaluation Design Report Philippines Secondary National Roads Development Project
42
5.4.10 Data Quality
The first layer of quality assurance is to ensure that the questionnaire is well-designed. Instruments drafted in English will be translated and then back translated to ensure the accuracy of the questions. The questionnaire will be pre-test and piloted. The second layer of quality assurance measures will be the selection of interviewers with proven experience in O-D surveys. The interviewers will also be trained to ask questions in a way that drivers clearly understand and do not feel uncomfortable in answering the questions. Other quality assurance measures will include the design of questionnaires that properly tailor to the traffic volume of the Samar road. The third layer of quality control will be cross-checks aimed to control the consistency of answers. The survey process will be monitored by the supervisors to ensure reliable data are obtained and the supervisors will receive the completed questionnaires after the end of the work shift. The evaluation team will also conduct random spot checks to validate the data collection procedure. The evaluation team will also call back 10 percent of randomly selected respondents to ensure the data is recorded correctly.
5.4.11 Safety Procedures/Precautions
Safety measures including direct and continuous assistance of road police is critical for the safety of data collection staff. All personnel will be required to wear high-visibility safety vests at all times. The evaluation team will develop traffic control plans with the data collection team in accordance with the guidelines from the local police to ensure personnel are safe at each survey station. The traffic plans will provide guidance on the position of the traffic delineators and the percentage of the road that needs to be cordoned off with traffic cones to allow for sufficient space to stop and park the vehicle while the surveyors are at work. The traffic plans will include sketches that provide a visual representation of the survey work area and the space to be reserved/cordoned off. The police, supported by appropriate signage, are expected to assist in intercepting vehicles and directing the surveyed vehicle to the secured survey area. In addition, approximately two to three meters of space will be required inward from the carriageway to position equipment (i.e. tables, chairs, umbrellas and/or tents) that will provide protection against the sun and rain and where surveyors can stow survey materials and/or rest during periods of inactivity.
5.5 PRIMARY DATA COLLECTION – VEHICLE OPERATING COST SURVEY
5.5.1 Sample Units
1) vehicle dealership, 2) tire dealership, 3) fuel and lubricant oil marketer, 4) vehicle maintenanceworkshop.
5.5.2 Sample Size and Associated Assumptions
Seven (7) interviews total with three (3) interviews from vehicle dealership group, one (1) interview with tire dealership group, one (1) interview with fuel and lubricant oil marketer group, and two (2) from vehicle maintenance workshop group.

Independent Evaluation Services in support of the Evaluation Design Report Philippines Secondary National Roads Development Project
43
5.5.3 Sample Frame
A list will be drafted as part of the evaluation for maintenance workshops in Samar, including the details on the size of their operations.
5.5.4 Sampling Strategy
The following sampling strategy will be used for each group of target respondent:
• Vehicle dealership: Three (3) dealers with the greatest number of new vehicle sales thatcover all range of vehicle categories.
• Tire dealership: One (1) dealer selling the greatest number of types of tires for vehicles,preferably wholesale dealers.
• Fuel and lubricant oil marketer: One (1) dealer offering products that cover all range ofvehicle categories, preferably wholesale dealers.
• Vehicle maintenance workshop: Two (2) largest vehicle maintenance workshops forprivate vehicles and trucks.
5.5.5 Instruments
A paper-form listing the VOC areas will be used to guide the interviews and record the data required by the HDM-4 model. The evaluation team will obtain information on vehicle market prices, tire prices, and lubricants market price.
5.5.6 Rounds, Locations, and Timing
One (1) round of VOC survey will be conducted in February 2022 to coincide with the MTC. The survey will take place in major cities around the Samar road.
5.5.7 Respondents within the Sample Unit
Representatives or owners of each respondent firm identified.
5.5.8 Staff
The interviews for the VOC survey will be carried out by the HDM-4 Specialist, supported by the In-Country Coordinator.
5.5.9 Data Processing
All interviews will be audio recorded on digital voice recorders and reviewed by the HDM-4 Specialist as soon as possible after the interview. Any anomalies in the interview and the form will be corrected.
5.5.10 Data Quality
The VOC form will be translated, back-translated, and pre-tested before the interviews. The relevant HDM-4 input data will be formulated in a preparatory Excel file. The data quality will be verified by crosschecking the responses from the interviews among each target responses and also comparing with any available secondary resources. DPWH annually updates the VOC data, but these are national values and may be different from the values in the Samar region, especially with regard to crew wages, maintenance labor costs, and operational characteristics. The evaluation team will review input parameters to validate the VOCs

Independent Evaluation Services in support of the Evaluation Design Report Philippines Secondary National Roads Development Project
44
and RUCs calculated by DPWH. Interviews will be completed by the evaluation team to update the market prices and re-assess conversion factors of the market prices into economic prices.
5.5.11 Safety Procedures/Precautions
N/A
5.6 PRIMARY DATA COLLECTION – ROUGHNESS STUDY
5.6.1 Sample Units
Entire road length of the Samar road.
5.6.2 Sample Size and Associated Assumptions
Vehicular response to traveled surface is a continuous measure and sampling interval is not required. IRI will be calculated and reported for every 10m of the road section. Therefore, a total of 44,440 IRI values will be reported for the Samar road, 22,220 for each direction.
5.6.3 Sample Frame
GPS coordinates of the starting point and the ending point of the Samar road are required to establish the starting and ending point of data collection.
5.6.4 Sampling Strategy
The entire road sections for the Samar will be surveyed in both directions and IRI will be reported at 10m intervals.
5.6.5 Instruments
Class 3 or better IRI measuring devices per World Bank Technical Paper 46 will be used for the IRI study. The evaluation team confirmed during the first trip to the Philippines that laser profilers are available for the study.
5.6.6 Rounds, Locations, and Timing
One round of roughness measurement will be collected in February 2022 to minimize the risk of typhoons. The location of data collection will be on the Samar road.
5.6.7 Respondents within the Sample Unit
N/A
5.6.8 Staff
The evaluation team intends to subcontract the IRI data collection. The team size will be determined by the successful bidder based on a competitive procurement process. The consulting firm may staff the data collection with two staff, one driver, and one technician for IRI. The topographic survey for the calibration will be performed by two or three survey teams of three or four persons.
5.6.9 Data Processing
The average of IRI values obtained using topographical survey will be plotted against the bump counts (in case the data collection firm uses bump integrator) or laser roughness value (if the data

Independent Evaluation Services in support of the Evaluation Design Report Philippines Secondary National Roads Development Project
45
collection firm uses laser profiler) for each of the test sections. The calibration equation will then be derived by calculating the best fit line for the points. The calibration equation can then be used to convert data from bump counts or laser profiler output into IRI units. Samar Road will then be sectioned into homogeneous sections which will also be illustrated in graphical format.
5.6.10 Data Quality
To ensure high-quality data collection, it is essential that the instrument is properly calibrated and regularly checked and that proper testing procedures are followed. Calibration of equipment will adhere to manufacturer recommendations and follow the appropriate ASTM specifications as well as those mentioned in the World Bank Technical Paper No 46. The equipment will be calibrated on six (6) straight reference sections, 300m long each, which are representative of the IRI expected on the Samar road. Each reference section will have its longitudinal profile measured on two wheel paths using a topographical survey and/or dipstick method (Class 1). The same six test sections will be run five (5) times at least at two speeds within the standard range of vehicle speed on the road to test repeatability. The results will be used to establish a calibration equation (or calibration equations for different measuring speeds, as needed) for the laser profiler road roughness measuring device. During data collection, a constant speed will be maintained within a certain range. The IDG evaluation team will closely monitor the data collection process and conduct random checks to ensure the data is collected correctly and quickly rectify for any anomalies.
5.6.11 Safety Procedures/Precautions
IRI is measured at a constant speed and does not require traffic to be diverted. Staffs conducting the survey will remain in the vehicle at all times. Caution signs will be posted at the back of the vehicle or a rotating emergency light on the roof of the vehicle to indicate to other drivers that the survey is in progress and that the vehicle may be proceeding at a slower speed. For the topographical survey, all staff members will wear reflective vests and proper caution signs will be placed before and after the survey sections to warn drivers on the road.
5.7 PRIMARY DATA COLLECTION – ROAD CONDITION STUDY
5.7.1 Sample Units
Entire road length of the Samar road.
5.7.2 Sample Size and Associated Assumptions
N/A
5.7.3 Sample Frame
N/A
5.7.4 Sampling Strategy
N/A

Independent Evaluation Services in support of the Evaluation Design Report Philippines Secondary National Roads Development Project
46
5.7.5 Instruments
The road condition study will be a visual inspection of the road and major surface distresses, maintenances performed, and potential cause of deterioration will be noted along with their location. The Roads/Pavement Engineer will note the following distresses, surface texture, and drainage distresses during the Road Roughness study:
• Cracking: structural (fatigue, wheel track cracking) and transverse (% area).• Potholes (#/km): average number of potholes, which is defined as open cavity in the road
surface with at least 150mm in diameter and at least 25mm depth.• Rutting (mm): average rut depth.• Edge break (m2/km): distressed area within 0.5 from the pavement edge.• Raveling (% area): area with loss of material from wearing surface.• Texture depth: qualitatively assessed in 3-level rating, as good, fair, and slippery, based on
the HDM-4 default aggregate table for texture depth.• Skid resistance: qualitatively assessed in 3-level rating, as good, fair, and slippery, based
on the HDM-4 default aggregate table for skid resistance.• Drainage condition: qualitatively assessed in 5-level ratings, as Excellent, Good, Fair, Poor
or Very Poor, based on AASHTO Guide for Design of Pavement Structures85 as a functionof the permeability of subsurface materials, the crossfall and longitudinal slopes, thedrainage distance and the type of drainage structure.
5.7.6 Rounds, Locations, and Timing
One round of road condition survey will be carried out in February 2022 as part of the Road Roughness study on the Samar Road.
5.7.7 Respondents within the Sample Unit
N/A
5.7.8 Staff
Road Condition study will be performed by the Roads/Pavement Engineer while monitoring the Road Roughness study.
5.7.9 Data Processing
Based on the visual inspection of the road distresses and maintenance performed, the Roads/Pavement Engineer will determine the road condition of the Samar road sections following the guideline in classification and categorization of distresses of the HDM Documentation, Volume 4 – Analytical Framework and Model Description, Part C – Road Deterioration Models.
5.7.10 Data Quality
The road condition data will be reviewed by the Team Leader/Road Maintenance Expert and the HDM-4 Specialist to ensure that the Roads/Pavement Engineer’s assessment of the road is appropriate and reasonable. Where appropriate, the Roads/Pavement Engineer will capture photos of distresses and maintenance works to support the determination of the road condition level.
85 AASHTO Guide for Design of Pavement Structures, American Association of State Highway and Transportation Officials, Washington D.C., 1993.

Independent Evaluation Services in support of the Evaluation Design Report Philippines Secondary National Roads Development Project
47
5.7.11 Safety Procedures/Precautions
See Section 5.6.11.
5.8 PRIMARY DATA COLLECTION – DEFLECTION STUDY
5.8.1 Sample Units
Data collection points on the Samar Road for measuring deflection.
5.8.2 Sample Size and Associated Assumptions
ASTM (D 4695) standard recommends the following:
• Network Level Testing, tests are performed at 100m - 500m intervals.• General Project Level Testing, the intervals are 50m – 200m.• Detailed Project Level Testing, tests are performed at 10m to 100m intervals.
General project-level testing is the most appropriate for the evaluation and the suggested interval is between 50 and 200m. Assuming static deflection measures, deflection will be measured every 200m on the outer wheel path, in a staggered pattern alternating right and left for the Samar road. On PCCP sections, deflection testing will be performed in the middle of the concrete slab, between joints. The total number of samples will be 1,110 per direction.
5.8.3 Sample Frame
GPS coordinates of the starting point and the ending point of the improved road section for the Samar road are required to establish the starting and ending point of data collection.
5.8.4 Sampling Strategy
Assuming static deflection measures, the first deflection measurement on the right lane will start 50m after the start of the road section. The first deflection measurement on the left lane will start 250m after the start of the road section. The next measurement will be located systematically 200m after the previous location.
5.8.5 Instruments
There are broadly three methods for deflection measurements and corresponding equipment for deflection measurement:
• Static deflections: equipment measures deflection in response to static load (e.g.Benkelman Beam (BB))
• Steady state deflections: equipment measures dynamic deflection in response tooscillating load (e.g. Dynaflect, Road Rater)
• Impact load deflections: equipment delivers a transient impulse load to the pavement(e.g. Falling Weight Deflectometer (FWD))
The BB apparatus or FWD will be used depending on availability in the Philippines. If using BB apparatus, the axle loading of the truck will be increased from 80 kN to 130 kN to measure the deflection of PCCP road sections.

Independent Evaluation Services in support of the Evaluation Design Report Philippines Secondary National Roads Development Project
48
5.8.6 Rounds, Locations, and Timing
One (1) round of deflection measurement study will be carried out in April 2022 after the evaluation team reviews the data from the Road Roughness study. Deflection will be measured on the MCC-funded section of the Samar road.
5.8.7 Respondents within the Sample Unit
N/A
5.8.8 Staff
The evaluation team intends to subcontract the work to a data collection company with expertise in this type of deflection survey. A data collection team usually consists of at least five people: two flagmen to control traffic, the driver of the vehicle, a technician, and an assistant for both types of tests.
5.8.9 Data Processing
The deflection raw data will be entered using a data entry software and will include information on test location (route, chainage, lane, distance from the pavement edge), actual axle load used (kN), rebound pavement deflection (0.01mm), date and time of readings, asphalt pavement temperature (on ACP sections), depth at which the temperature is recorded, and the time of recording. The data collection report will summarize the survey results of the road. Deflection readings will be corrected to the reference temperature for ACP sections. The homogeneous sections will be defined based on maximum deflection using Method of cumulative differences defined in AASHTO 1993 Pavement Design Guide.
5.8.10 Data Quality
To ensure high-quality data collection, it is essential that the instrument is properly calibrated and regularly checked and that proper testing procedures are followed. When carrying out the calibration procedure, recommendations from the equipment manufacturer will be considered. Standards such as the ASTM 4695-03(2015) and ASTM D1195/D1195M – 09(2015) or ASTM D4694 -09(2015) will be used depending on the final equipment selected.
5.8.11 Safety Procedures/Precautions
For the deflection, traffic will have to be diverted from the section of the lane where the test is being conducted by the use of traffic control devices. These will include the installation of warning signs prior to the start of the survey. These warnings will need to be moved as the survey progresses. Traffic cones shall be used by channeling traffic away from locations where testing is taking place. Caution signs will be posted at the back of the vehicle or a rotating emergency light on the roof of the vehicle to indicate to other drivers that the survey is in progress.
5.9 SUMMARY TABLE
Table V.4 Primary Data Collection Summary Table for Evaluation Question 1

Independent Evaluation Services in support of the Evaluation Design Report Philippines Secondary National Roads Development Project
49
Data collection Timing Sample Unit/
Respondent Sample Size Relevant Instruments
Exposure Period
Traffic count 02/2022
Motorized and non-motorized vehicle on
the Samar Road N/A Traffic count
form 69 months
O-D survey 03/2022 Motorized vehicle
driver and passenger the Samar Road
Depends on the sampling rate
(minimum 20% per vehicle type)
O-D surveyquestionnaire 70 months
VOC survey 02/2022 vehicle maintenance workshop 7 VOC form 69 months
Roughness study 02/2022 Samar Road Entire length of the
Samar road Laser profiler 69 months
Road Condition study
02/2022 Samar Road 22 (50m/km)
Road Condition
form 69 months
Deflection study* 04/2022 Samar Road
1,110 (every 200m for both
wheel paths) BB or FWD 71 months
* Data collection may not be required based on the results of the road roughness study and the road condition study.
5.10 SECONDARY QUANTIATIVE DATA
5.10.1 List of Secondary Data Sources
IDG will obtain the following secondary data for:
• Maintenance cost from DPWH and its district engineering offices• Road condition and road maintenance data from DPWH
o ACP Overlay of asphaltic concrete (AC) wearing course (USD/km) Pavement reconstruction (USD/km) Heavy patching (USD/m2) Edge repair (USD/m2) Crack sealing (USD/m2) Rejuvenation (wearing course) (USD/m2) Routine pothole patching (USD/m2) Drains & culverts (USD/km) Shoulders maintenance (USD/km) Routine maintenance (Opt. without project) (USD/km)
o PCCP Joint sealing (USD/m) Partial Depth Repair (USD/m2) Full Depth Repair (USD/m2) Slab replacement (USD/m2) Routine maintenance (Opt. without project) (USD/km)
• As-built drawings for physical and geotechnical parameterso Road physical parameters for HDM-4o California Bearing Ratio (CBR)o ACP
Structural Number

Independent Evaluation Services in support of the Evaluation Design Report Philippines Secondary National Roads Development Project
50
Adjusted Structural Number Layer thickness and coefficients (mm)
o PCCP Slab thickness and concrete rupture modulus (mm, MPa) Base (subbase) thickness and modulus (mm, MPa) Slab length (m)
5.10.2 Requirements for Data Capture
Maintenance cost data from DPWH will be compared with international costs to verify the legitimacy of the data. If available in paper form, data will be input into Excel accordingly. If available in an electronic format, the documents will be transferred electronically from DPWH. Currently, the as-built drawings for CP3 are not available to the evaluation team. If CP3 as-built drawing are not available, physical features of CP3 will be adopted based on a subjective rating of geometry and HDM-4 defaults. All available as-built drawings will be reviewed for accuracy by verifying the information with Quality Control/Quality Assurance (QA/QC) documents and team’s observations of the road.
5.11 ANALYSIS PLAN
The HDM-4 analysis is used to estimate the economic or engineering viability of road investment projects by considering the following issues:
• Pavement surface and structural performance• Life-cycle predictions of road deterioration, maintenance effects, and costs• Road user costs and benefits• Economic comparisons of project alternatives
The life-cycle analysis uses sets of costs incurred by the road administration and by the road user. The two sets of costs are added together over time in discounted present values. Costs are determined by first predicting physical quantities of resource consumption and then multiplying these quantities by their unit costs or prices. Economic benefits are then determined by comparing the total cost streams for various maintenance and construction alternatives with a base case (do nothing or do minimum alternative), usually representing minimal routine maintenance. The economic returns are mainly in the form of savings in road user costs due to the provision of a better road quality. The cost of construction, road maintenance, and road user costs constitute what is commonly referred to as the total (road) transport cost or the whole life cycle cost. The remaining service life of pavement will be estimated using AASHTO 1993, “AASHTO Guide for Design of Pavement Structures” method. The effective structural capacity of a pavement, expressed as effective structural number (SNeff) for flexible pavements, or effective slab thickness (Deff) for rigid pavements will be calculated based on:
• non-destructive deflection testing though direct evaluation of in situ subgrade andpavement stiffness along the project,
• visual condition survey and material testing, that involves assessment of current conditionbased on distress and drainage surveys, as well as some coring and testing of materials, or

Independent Evaluation Services in support of the Evaluation Design Report Philippines Secondary National Roads Development Project
51
• fatigue damage from traffic (if accurate historical traffic data and axle weights areavailable).
Deflection data provide the most accurate information on actual pavement structural capacity, while remaining life calculation based on historical traffic is most applicable for pavements which have very little visible deterioration. Once the effective structural capacity of the pavement is known, it can be used to calculate the remaining pavement service life using the same new pavement design equations/ charts (please refer to Part III AASHTO Guide for Design of Pavement Structures, pages III-88 to III-105). Taking into account pavement age at time of deflection testing, calibration coefficients for HDM-4 pavement deterioration models will be adjusted to reflect actual pavement remaining service life.
5.12 CHALLENGES
5.12.1 Limitations of Interpretation of the Results
CBA naturally requires the evaluation team to compare the “with-project’ and “without-project” scenario of the road investment. It is a comparison between what actually happened after MCC’s road investment and what would have happened in the absence of MCC investment. Therefore, the evaluation team will be making the best judgment on how the Samar Road would have been if MCC had not invested on the road in the first place by referring to several other sources and pre-Compact data. However, the results are limited because the “without-project” is not directly observable. Furthermore, assumptions on future maintenance will be made based on review of maintenance regime in place in Samar region and the trend in maintenance budget allocations. These assumptions may have a significant impact on the results.
5.12.2 Risks to the Study Design
The evaluation design maximizes the use of available data to be cost-effective in its data collection. However, this also poses a major risk to the data quality and data availability. First, there is a risk that the data from secondary sources may not be available to the evaluation team in a timely manner (such as the as-built drawing for CP3), limiting the team’s ability to plan for its data collection accordingly. Second, the timing of data collection critical for the evaluation given the high chance of typhoons in the Philippines including the Samar region where the majority of data collection will take place. Adverse weather may affect the traffic on the road for the MTC and O-D survey. Timing of engineering data collection, such as the IRI study, road condition study, and deflection study is also critical because data collection cannot take place during the rain. While the evaluation team anticipates the data collection to take place during the months with the lowest chance of a typhoon taking place, it is difficult to anticipate in advance whether the weather will impact the data.

Independent Evaluation Services in support of the Evaluation Design Report Philippines Secondary National Roads Development Project
52
VI. EVALUATION QUESTION 2A2A) What are the relevant road authority’s current maintenance practices and what is the
likelihood that MCC’s investment will remain adequately maintained for the life of the investment? Specifically, what maintenance regime reflects current practices and will therefore be applied in HDM-4? What maintenance practices most influenced your selection of this regime? [Result: Assumption: Maintenance]
6.1 METHODOLOGY
6.1.1 General Overview of Methodology
EQ 2A will be an ex-post performance evaluation looking at the GOP maintenance practices and its impact on the Samar Road. Determining the maintenance regime will allow the evaluation team to estimate whether or not Samar Road will be adequately maintained by the GOP.
6.1.2 Detailed Methodology
EQ 2A will employ a mixed-methods approach to answer the evaluation question. Information will be drawn from secondary sources, mainly from DPWH, to determine its maintenance practices. In addition, information from secondary sources will be verified and complemented with KIIs with representatives within the GOP and other donor communities. For instance, the team will ask questions on the decision-making process, such as the selection procedures and criteria for road maintenance and rehabilitation and the process for deciding the maintenance treatment that should be performed.
6.2 TIMEFRAME OF EXPOSURE
Since the road was completed in 2017, the GOP has been conducting routine and emergency maintenance on the Samar road for the last three years. Therefore, sufficient information on DPWH’s maintenance practices should be available for the evaluation to determine the GOP’s current practices. Since periodic maintenance is not generally required until five or more years after improvement, the Samar road will not require a periodic maintenance until 2022. However, the evaluation team will examine the maintenance of other comparable roads that were improved before 2015 to examine whether periodic maintenance is likely to take place on the Samar road in the near future.
6.3 PRIMARY DATA COLLECTION - KIIS
6.3.1 Sample Units
Key stakeholder organizations for road maintenance.
6.3.2 Sample Size and Associated Assumptions
In total, around 14 interviews are expected to be completed. Key stakeholders to be interviewed include relevant officials from the 1) DPWH including their regional offices, 2) local governments, 3) the Department of Traffic, 4) the Department of Finance, 5) road maintenance contractors, and6) donors active in the road sector (e.g., ADB, World Bank, and JICA).

Independent Evaluation Services in support of the Evaluation Design Report Philippines Secondary National Roads Development Project
53
6.3.3 Sample Frame
A list of key stakeholders from each organization will be drafted by the evaluation team prior to data collection.
6.3.4 Sampling Strategy
Interviewees will be selected by the evaluation team based on their understanding of road maintenance practices and their involvement with the maintenance of the Samar road.
6.3.5 Instruments
The team will conduct semi-structured interviews with a fairly open framework which allow for focused, conversational, two-way communication. Semi-structured interviews ensure that consistent data is collected yet provide opportunities for an individual to offer their perspectives on the relative importance of any factor. The team will ask questions based on the evaluation questions described above and follow-up with relevant inquiries to obtain more specific information. Interviewee’s responses will be recorded on paper.
6.3.6 Rounds, Locations, and Timing
The KIIs will be conducted in February 2022 and will coincide with one of the engineering data collection trips and interviews for addressing EQ 2B to maximize the information gathered during interviews. Interviews will take place in Manila and major cities close to the Samar Road.
6.3.7 Respondent(s) within the Sample Unit
Representatives from key stakeholder organizations for road maintenance.
6.3.8 Staff
The Team Leader/Road Maintenance Expert will conduct the KIIs in English, assisted by the In-Country Coordinator.
6.3.9 Data Processing
The Team Leader/Road Maintenance Expert will conduct the KIIs in English, assisted by the In-Country Coordinator. All KIIs will be audio-recorded on digital voice recorders and transcribed by the In-Country Coordinator. The evaluation team will classify, sort, and arrange information gathered to identify trends and examine the relationships in the data using NVivo.
6.3.10 Data Quality
While the Team Leader/Road Maintenance Expert leads the interviews and takes notes, the In-Country Coordinator will assist the interviews by taking notes that will be used to cross-reference the notes taken by the Team Leader/Road Maintenance Expert. The notes will also capture non-verbal information (circumstances of the interview, emotions, body language, etc.). The transcript will be reviewed by the Team Leader/Road Maintenance Expert within 24 hours of the interview. The team will cross-examine information when relevant to help build a body of evidence to support the analysis.
6.3.11 Safety Procedures/Precautions
N/A

Independent Evaluation Services in support of the Evaluation Design Report Philippines Secondary National Roads Development Project
54
6.4 SUMMARY TABLE
Table VI.1 Primary Data Collection Summary Table for Evaluation Question 2A
Data collection Timing Sample Unit/ Respondent Sample Size Relevant
Instruments Exposure
Period
KIIs 02/2022 Maintenance stakeholders 14 KII questionnaire 69 months
6.5 SECONDARY QUANTITATIVE DATA
6.5.1 List of Secondary Data Sources
The evaluation team will collect secondary data from various sources to address EQ 2A. The team will mainly collect the documents from the DPWH’s Bureau of Maintenance (BOM), DPWH’s district engineering offices, private contractors (medium and small-sized) in charge of maintenance, and the Department of Finance (DOF) and/or Department of Budget and Management (DBM). The evaluation will attempt to obtain the following documents as available:
• Current laws, regulations, decrees on road maintenance• Road maintenance policies and processes• Records of road maintenance budget estimated, budget allocated, and budget spent• Number of periodic maintenances completed on comparable and older roads
Upon collecting the secondary sources, the team will examine the current road maintenance practices. This will allow the team to evaluate whether GOP’s institutional, financial, and technical aspects of the road maintenance sector are adequate in comparison to international standards. The allocated maintenance budgets and the actual expenditures will be reviewed to estimate whether adequate funds have been allotted and used for the routine, emergency, and periodic maintenance. Road roughness and road condition studies will be conducted to assess the physical distress on the Samar Road. A separate data collection is not required to address EQ 2A because the evaluation team will conduct the IRI study and the Road Condition study as part of EQ 1 (see Section 5.6 and 5.7 for more information).
6.5.2 Requirements for Data Capture
When the team is unable to obtain relevant documents in English, the Filipino document (or at least the executive summary or the relevant sections) will be translated for the purpose of the evaluation. If secondary sources are only available in paper form, data will be input into Excel accordingly. If available in an electronic format, the documents will be transferred electronically.
6.6 ANALYSIS PLAN
Based on the secondary data collected and the qualitative data collected (KIIs), the team will evaluate the current road maintenance practices of the Philippines, the maintenance works performed on the MCC-funded road, analyze the impact of road maintenance reforms, and determine the likelihood that MCC’s investment on the road will remain adequately maintained for the life of the investment. Based on this assessment, the team will also update the maintenance assumptions used in the HDM-4 model.

Independent Evaluation Services in support of the Evaluation Design Report Philippines Secondary National Roads Development Project
55
Each indicator for EQ 2A will be analyzed as follows:
• Annual maintenance budget estimatedo Annual maintenance budget estimated for the MCC road section will be determined
by reviewing the budget requested from the DPWH’s district office to the DPWHBOM between 2016-2021.
o Data gathered from secondary data will be corroborated with information obtainedfrom KIIs to verify the accuracy of the secondary data.
• Annual maintenance budget allocatedo Annual maintenance budget allocated for the MCC road section will be determined
by reviewing the budget allocated from DBM to DPWH between 2016-2022.o Data gathered from secondary data will be corroborated with information obtained
from KIIs to verify the accuracy of the secondary data.• Annual maintenance budget spent
o Annual actual maintenance expenditure on the MCC road section will bedetermined by reviewing the expenditure data from the DPWH’s BOM or theDPWH district offices between 2016-2021. This may include review ofmaintenance contract values.
o Data gathered from secondary data will be corroborated with information obtainedfrom KIIs to verify the accuracy of the secondary data.
• Likelihood of periodic maintenance taking placeo Team Leader/Road Maintenance Expert will determine 3-5 comparable and older
roads by consulting the DPWH during the KIIs taking into consideration thefollowing factors: 1) year when last rehabilitation was undertaken, 2) traffic usagein the last two-three years, and 3) road condition in the last two-three years. Uponselecting the comparable roads, the Team Leader/Road Maintenance Expert willdetermine whether periodic maintenance took place on these roads.
o Information gathered from the KIIs will be verified using DPWH’s data on periodicmaintenance performance in the Philippines.
• Quality of maintenance performedo Road roughness study and the road condition study (visual inspection) will be used
to determine the current quality of emergency and routine maintenance performedon the MCC-funded road section. Team Leader/Road Maintenance Expert will usethe data to develop a descriptive analysis of the quality of maintenance performedon the MCC road section.
• Road maintenance laws, policies, and processeso Team Leader/Road Maintenance Expert will review available secondary sources to
identify the laws and policies that govern the maintenance of the MCC road section.Any recently updated laws and decrees will be reviewed in closer detail tounderstand its potential impact on future road maintenance.
o Key informants will be asked to describe the current laws, policies, and processes.Based on the KIIs, the information will be analyzed using qualitative data softwareto determine how these laws and regulations affect maintenance practices.
Team Leader/Road Maintenance Expert will use the information gathered to determine the maintenance regime for the HDM-4 analysis, in discussion with the HDM-4 Specialist.

Independent Evaluation Services in support of the Evaluation Design Report Philippines Secondary National Roads Development Project
56
6.7 CHALLENGES
6.7.1 Limitations of Interpretation of the Results
The interviews conducted by the team may be influenced by response bias. The stakeholders often have a strong incentive to hide their illicit activities, such as corruption or participating in informal economic ventures. Similarly, stakeholders may be compelled to answer in a certain way for social or political incentives. Consequently, the team is likely to encounter difficulties in probing and understanding these issues, as well as ascertaining the true interests of the people engaged in such activities. For example, determining that a government agency colluded with a private firm to win certain bids requires documentation of their activities. Such evidence is often difficult, if not dangerous, to obtain.
6.7.2 Risks to the Study Design
Secondary data sources and KIIs will be essential for answering EQ 2A. There is a risk that these documents may not be available to the evaluation team due to delays in locating the documents, loss of past records, or unwillingness of the stakeholders to share sensitive information. Even when the documents are available to the team, the documents may be an inaccurate representation of the actual practice. An additional risk is gathering accurate information from KIIs that the evaluation team cannot corroborate with data and/or documents. Interviewees may have biases and/or incentives to skew the information they provide to the evaluation team. To minimize against these risks, we will interview all relevant institutional stakeholders for road maintenance in order to validate the information from multiple perspectives. If not fully explained prior to the interviews, the Philippines government staff may want to provide positive results from the Compact to justify further investments from MCC. To mitigate this risk, evaluation team will make it clear during the introductions the purpose of the evaluation and the independent nature of the evaluation from MCC’s future investment in the Philippines.

Independent Evaluation Services in support of the Evaluation Design Report Philippines Secondary National Roads Development Project
57
VII. EVALUATION QUESTION 2B2B) In cases where MCC investments included targeted maintenance improvements, how
were these implemented and what were the effects of those efforts? [Result: Assumption: Maintenance]
7.1 METHODOLOGY
7.1.1 General Overview of Methodology
EQ 2B will be an ex-post performance evaluation to determine the effect of CMRMP on improving the road maintenance practices in the Philippines. Data collection for EQ 2B will mostly overlap with the data collection required for EQ 2A. Therefore, the KIIs designed to inform EQ 2A will serve also to inform the EQ 2B. An additional KII with DSWD will be conducted to inform EQ 2B specifically.
7.1.2 Detailed Methodology
EQ 2B will employ a mixed-methods approach to answer the evaluation question. Information will be drawn from secondary sources, mainly from DPWH and from MCC project documents, to understand whether the intended road maintenance activities have been effective in improving road maintenance on the MCC-funded road or more generally on the whole road network of the Philippines. In particular, EQ 2B will examine whether MCC’s investment in CMRMP have been effective. The evaluation team will collect information to triangulate the information available from the secondary sources and to obtain additional information not available from the secondary sources.
7.2 TIMEFRAME OF EXPOSURE
MCC’s CMRMP was incorporated into the Philippines Compact, which ended in June 2016. Therefore, there should be sufficient evidence whether budget was allocated to the CMRMP and its performance in the last four or five years.
7.3 PRIMARY DATA COLLECTION - KIIS
KIIs for EQ 2B will follow the data collection methodology described under EQ 2A (Section 6.3). An additional KII will be conducted with DSWD to obtain information regarding the CMRMP.
7.4 SUMMARY TABLE
Summary table of primary data collection is not included in this section because additional primary data collection is not required for EQ 2B.
7.5 SECONDARY QUANTITATIVE DATA
7.5.1 Limitations of Interpretation of the Results
The evaluation team will use secondary data collected under EQ 2A. The following additional documents will be obtained as available:

Independent Evaluation Services in support of the Evaluation Design Report Philippines Secondary National Roads Development Project
58
• Records of road maintenance budget estimated, budget allocated, and budget spent forCMRMP
Upon collecting the secondary sources, the team will examine the quality of maintenance performed under the CMRMP. A separate data collection is not required to address EQ 2B because the evaluation team will conduct the IRI study and the Road Condition study as part of EQ 1 (see Section 5.7 and 5.8 for more information).
7.5.2 Requirements for Data Capture
See Section 6.5.2.
7.6 ANALYSIS PLAN
Based on the secondary data collected and the qualitative data collected (KIIs), the team will examine the implementation of CMRMP and its impact on the Samar road maintenance. The evaluation team will assess if CMRMP was adequately funded and utilized by the GOP. Each indicator for EQ 2B will be analyzed as follows:
• Annual maintenance budget allocated for CMRMPo Annual maintenance budget allocated for the CMRMP will be determined by
reviewing the budget allocated from DBM or the Road Board to DPWH between2016-2022.
o Data gathered from secondary data will be corroborated with information obtainedfrom KIIs to verify the accuracy of the secondary data. If budget is not allocatedfor CMRMP, the KIIs will be used to determine the factors that led to limitedfunding.
• Annual maintenance budget spent on CMRMPo Annual actual maintenance expenditure on the CMRMP will be determined by
reviewing the expenditure data from the DPWH’s BOM or the DPWH districtoffices between 2016-2021. This may include review of maintenance contractvalues with the communities.
o Data gathered from secondary data will be corroborated with information obtainedfrom KIIs to verify the accuracy of the secondary data.
• Quality of maintenance performed under CMRMPo Road roughness study and the road condition study (visual inspection) will be used
to determine the quality of emergency and routine maintenance performed underthe CMRMP.
o Team Leader/Road Maintenance Expert will review the agreement between thecommunity and the CMRMP to determine the type of maintenance that CMRMPwas designed to address.
o Key informants will be asked to describe the type of maintenance performed andits processes under the CMRMP. Based on the KIIs, the Team Leader/RoadMaintenance Expert will determine the quality of maintenance performed.
7.7 CHALLENGES
7.7.1 Limitations of Interpretation of the Results
See Section 6.7.1.

Independent Evaluation Services in support of the Evaluation Design Report Philippines Secondary National Roads Development Project
59
7.7.2 Risks to the Study Design
See Section 6.7.2.

Independent Evaluation Services in support of the Evaluation Design Report Philippines Secondary National Roads Development Project
60
VIII. EVALUATION QUESTION 3A3A) Who is traveling on the road, why, what are they transporting, what are they paying for
transport, and how long does it take to move along key routes? [Results: Reduced Transportation Costs (actual), Generated and Diverted Traffic] How does road usage vary by road-user’s income and gender?
8.1 METHODOLOGY
8.1.1 General Overview of Methodology
EQ 3A will be an ex-post performance evaluation examining the impact of the road improvement on the road users. This evaluation question will help identify the main beneficiaries of the SNRDP (who is traveling on the road, what are they transporting) and how road usage varies depending on the gender and income level of the road user.
8.1.2 Detailed Methodology
The evaluation team will mainly use the data collected under EQ 1 to inform EQ 3A, particularly the data from the MTC and the O-D surveys. The evaluation team will also conduct a Public Transport User (PTU) survey to determine the effect of the MCC-funded project on road usage patterns for those who use public transportation services. Additionally, the evaluation team will conduct a Travel speed survey to understand average driving speeds along the road.
8.2 TIMEFRAME OF EXPOSURE
See Section 5.2.
8.3 PRIMARY DATA COLLECTION – TRAFFIC COUNT SURVEY
The traffic count will be used to determine the number of road users on the MCC-funded road and their respective vehicle type in February 2022. A separate data collection is not required to address EQ 3A because the evaluation team will review the data available from EQ 1 (see Section 5.3 for more information).
8.4 PRIMARY DATA COLLECTION – ORIGIN - DESTINATION SURVEY
An O-D survey will be used to determine who is traveling along the improved roads, why they are traveling, what they are transporting, what they are paying for transport, and how long it takes to move along key routes. A separate data collection is not required to address EQ 3A because the evaluation team will conduct an O-D survey as part of EQ 1 (see Section 5.4 for more information).

Independent Evaluation Services in support of the Evaluation Design Report Philippines Secondary National Roads Development Project
61
8.5 PRIMARY DATA COLLECTION – PUBLIC TRANSPORT USER SURVEY
8.5.1 Sample Units
Individual public transport users (PTU) using public utility Jeepneys (PUJ), public utility vans (PUV), medium buses, and large buses.
8.5.2 Sample Size and Associated Assumptions
The sample size is 270 with 25 surveys conducted per location/stop per type of public transportation. The sample size is designed to ensure at least 20 responses per location/stop per type of public transportation assuming a response rate of 85 percent for PUVs, medium, and large buses, and a response rate of 70 percent for PUJs. Table VII.1 Public Transportation Survey Sample and Locations
# Type of Public Transportation
Typical Routes Covered Example Routes Survey Locations Sample Size
1 Public Utility Jeepney (PUJ)
Between municipalities
All municipalities between Wright-
Guiuan
Taft PUJ stop Borongan PUJ stop Llorente PUJ stop Guiuan PUJ stop
120 (30 per stop)
2 Public Utility Van (PUV)
Between municipalities
Wright-Taft-Sulat-Borongan
Borongan-Llorente-Quinapondan-Guiuan
Borongan PUV stop Guiuan PUV stop
50 (25 per stop)
3 Public medium bus Between major municipalities
Borongan-Dolores Borongan-Tacloban Borongan-Guiuan
Borogan bus terminal 25
Tacloban-Guiuan Guiuan bus terminal 25
4 Public large bus
Between Manila/
provincial capitals and
major municipalities
Manila-Borongan Borogan bus terminal 25
Manila-Guiuan Tacloban-Guiuan Guiuan bus terminal 25
8.5.3 Sample Frame
Six types of passenger transportation are observed on the SNRDP road, as shown in Table VII.2 below. The first two types are motorcycle-modified transportation to travel short distances between villages or within a municipality. Public Utility Jeepney (PUJ), Public Utility Van (PUV), and public medium buses operate between municipalities and are regulated by Region VIII Land Transportation Franchising and Regulatory Board (LTFRB). These forms of public transportation

Independent Evaluation Services in support of the Evaluation Design Report Philippines Secondary National Roads Development Project
62
stop at widely recognized bus stops in the municipalities. Large buses mainly operate between Manila-Borongan, Manila-Guiuan, and Tacloban-Guiuan and stop at municipality bus terminals.
Information for EQ 3A will be collected during the O-D survey passenger module for up to three (3) passengers per motorcycle taxis (habal-habal) and tricycles. Other public transport users willbe surveyed during a separate PTU survey.
Table VII.2 Type of Public Transportation on SNRDP Road86
# Type of Public Transportation
Distance Covered
Typical Routes Covered
Max # of passengers Vehicle Image
Data Collection
Method
1 Motorcycle Taxi (Habal-habal) -
Between barangays;
within a municipality; unpaved roads
6 O-D surveypassengermodule
2 Tricycle -
Between barangays;
within a municipality
8 O-D surveypassengermodule
3 Public Utility Jeepney (PUJ)
about 30km
Between municipalities 35 PTU
survey
4 Public Utility Van (PUV) <60km Between
municipalities 35 PTU survey
5 Public medium bus >60km Between major municipalities 45 PTU
survey
6 Public large bus >60km
Between Manila/ provincial
capitals and major
municipalities
60+ PTU
survey
8.5.4 Sampling Strategy
The PTU survey will be administered to those who are about to board or who just offboarded from public transportation that are operating on the SNRDP road. A filter questionnaire will be used to determine whether respondents meet the criteria: i) over 18 years of age, and ii) about to board or just offboarded from a public transportation operating on the SNRDP, and iii) willingness to participate in the survey. If the respondent declines or does not meet the criteria, the interviewer
86 Distance covered and the maximum number of passengers observed are based on the interview with Region VIII Land Transportation Franchising and Regulatory Board (LTFRB) based in Tacloban.

Independent Evaluation Services in support of the Evaluation Design Report Philippines Secondary National Roads Development Project
63
will approach the next adult at the location. The sampling strategy will be refined based on discussion with the selected data collection firm.
8.5.5 Instruments
The PTU survey will be conducted following a structured questionnaire. The questionnaire will include questions specified for each type of public transportation. When releasing a Request for Proposal to select a data collection firm, the evaluation team will request all bidders to consider using electronic hand-held devices for data collection. The instrument/equipment used may depend on the capacity of data collection firms in the Philippines. Privacy issues with conducting interviews at bus stops/stations are not expected to be a concern, as the questions will not be of a personal nature. This being said, the interviewer will ask waiting passengers to step away from other passengers to allow for greater privacy and increase the probability that responses will be more accurate.
8.5.6 Rounds, Locations, and Timing
One round of PTU survey will be conducted in April 2022, after the O-D survey is completed. PTU surveys will take place in four (4) cities – Borongan (provincial capital), Guiuan (tourist area with large population), Taft (smaller city with traffic from Dolores and Wright), and Llorente (smaller city with traffic from Borongan and Quinapondan) – at the following locations: Table VII.3 PTU Survey Locations
# Municipality Location Type of Users P1 Taft Taft PUJ stop PUJ P2
Borongan
Borongan PUJ stop PUJ P3 Borongan PUV stop PUV
P4 Borongan bus terminal Medium bus Large bus
P5 Llorente Llorente PUJ stop PUJ P6
Guiuan
Guiuan PUJ stop PUJ P7 Guiuan PUV stop PUV
P8 Guiuan bus terminal Medium bus Large bus

Independent Evaluation Services in support of the Evaluation Design Report Philippines Secondary National Roads Development Project
64
Figure VII.1 Map of PTU Survey Locations
8.5.7 Respondents within the Sample Unit
The target respondent of PTU survey are individuals using passenger transportation services on the Samar road.
8.5.8 Staff
The evaluation team intends to subcontract the PTU survey and the team sizes will be determined by the successful bidder based on a competitive procurement process. All staff shall have proven experience in conducting in-person surveys. The data collection firm shall provide documentation supporting the required experience of its proposed staff. The evaluation team will allow bidders to consider conducting the survey with teams of three (3) interviewers at each location.
8.5.9 Data Processing
See Section 5.4.9.
8.5.10 Data Quality
See Section 5.4.10.
8.5.11 Safety Procedures/Precautions
N/A
P1
P5
P2, 3, 4
P6, 7, 8

Independent Evaluation Services in support of the Evaluation Design Report Philippines Secondary National Roads Development Project
65
8.6 PRIMARY DATA COLLECTION – TRAVEL TIME STUDY
8.6.1 Sample Units
The sample unit is the Samar road in each direction.
8.6.2 Sample Size and Associated Assumptions
N/A
8.6.3 Sample Frame
GPS coordinates of the starting point and the ending point of the Samar road will be used to establish the starting and ending point of data collection.
8.6.4 Sampling Strategy
N/A
8.6.5 Instruments
The team will employ a test vehicle technique consisting of a vehicle dispatched to drive alongside the traffic under certain traffic scenarios for the purpose of data collection. A passenger in the test vehicle will record travel times at designated checkpoints or intervals using a clipboard and stopwatch and record vehicle speed, travel times, and distances.87 The passenger will also record the length of time the vehicle was stopped at a traffic signal, a cross walk, or for any other reason. The guidelines for this survey provided by the US Department of Transportation will be followed.
8.6.6 Rounds, Locations, and Timing
There will be one round of data collection which includes 6 one-way trips. The trip details are broken down in Table
Table VII.4 Travel Time Study Timing
# Departing Arriving Departure Time T1 Wright Guiuan 8:00 AM T2 Guiuan Wright 8:00 AM T3 Wright Guiuan 1:00 PM T4 Guiuan Wright 1:00 PM T5 Wright Guiuan 5:00 PM T6 Guiuan Wright 5:00 PM
8.6.7 Respondents within the Sample Unit
N/A
8.6.8 Staff
The surveying team will consist of a driver and a trained technician that will record the travel time. The data collection might be subcontracted to the firm conducting the IRI data collection or one of the evaluation team members might conduct the survey while in the country with support from an experienced driver.
87 FHWA, Travel Time Data Collection Handbook, 1998
Independent Evaluation Services in support of the Evaluation Design Report Philippines Secondary National Roads Development Project
66
8.6.9 Data Processing
All raw data collected will be entered using data entry software with built-in quality checks for data entry.
8.6.10 Data Quality
All rounds of data collection will be video recorded. The recorded data using the paper forms will be compared with the recordings.
8.6.11 Safety Procedures/Precautions
Travel time needs to be measured under certain traffic conditions based on the scenario assumptions, therefore it does not require traffic to be diverted. Staffs conducting the survey will remain in the vehicle at all times.
8.7 SUMMARY TABLE
Table VII.5 Primary Data Collection Summary Table for Evaluation Question 3A
Data collection Timing Sample Unit/ Respondent Sample Size Relevant
Instruments Exposure
Period
PTU Survey 04/2022 Public transport users 250 O-D survey
questionnaire 71 months
Travel Time Study 02/2022 Samar road N/A Paper form 69 months
8.8 SECONDARY QUANTITATIVE DATA
8.8.1 List of Secondary Data Sources
Secondary quantitative data are not required for EQ 3A.
8.8.2 Requirements for Data Capture
N/A
8.9 ANALYSIS PLAN
Data analysis software (e.g. Stata) will be used to analyze the results of the traffic count, O-D survey, and PTU survey. The purpose of the analysis is to understand current road usage on the Samar road. The MTC, the O-D survey, the PTU survey, and the Travel time study will be used to analyze the following indicators:
1. Who is traveling on the roado Traffic volume and type (2022)
AADT for each road section based on MTC results (see Section 5.3.10 formore information on analysis)
Type of vehicles for each road section from MTC results (see Section 5.3.10for more information on analysis)
o Trip characteristics (2022) Frequency of travel on the Samar road for drivers, motorcycle taxi (habal-
habal) passengers, and tricycle passengers from the O-D survey

Independent Evaluation Services in support of the Evaluation Design Report Philippines Secondary National Roads Development Project
67
Frequency of travel on the Samar road for from the O-D survey Frequency of travel on the Samar road for PUJ, PUV, public medium bus,
and public large bus users from PTU surveyo Road user characteristics (2022)
Education, gender, occupation, income level, employment status, vehicleownership of drivers, motorcycle taxi (habal-habal) passengers, andtricycle passengers from the O-D survey
Education, gender, occupation, income level, employment status, vehicleownership of PUJ, PUV, public medium bus, and public large bus usersfrom PTU survey
2. How long it takes to move along key routeso Key routes (2022)
Driver, motorcycle taxi (habal-habal) passengers, and tricycle passengers’key routes determined from the O-D survey
PUJ, PUV, public medium bus, and public large bus users’ key routesdetermined from the PTU survey
o Travel time on key routes (2022) Travel time on key routes from the O-D survey by vehicle type Travel time on key routes from the PTU survey by vehicle type Travel time on key routes from the Travel Time study
3. Why the road users are traveling on the roado Trip purpose (2022)
Trip purpose for drivers, passengers in cars, motorcycle taxi (habal-habal)passengers, and tricycle passengers users from the O-D survey
Trip purpose for PUJ, PUV, public medium bus, and public large bususers from the PTU survey
4. What the road users are paying for transporto Fares for goods transportation (2022)
Fare charged for transporting goods per ton (PHP) for vehiclestransporting goods from the O-D survey
o Fares for passenger transportation (2022) Fare charged for transporting passengers per km (PHP) for motorcycle taxi
(habal-habal) drivers, tricycle, and jeepney drivers from the O-D survey Fare paid to use motorcycle taxi (habal-habal), tricycle, PUJ, PUV, public
medium bus, and public large bus on key routes from PTU survey5. What the road users are transporting
o Volume of goods transported (2022) Total volume of vehicle capacity for trucks from the O-D survey Current vehicle load for trucks from the O-D survey Volume of primary and secondary goods transported on vehicles
transporting goods from the O-D surveyo Type of goods transported (2022)
Types of primary and secondary goods transported on vehiclestransporting goods from the O-D survey
o Value of goods transported (2022) Total value of goods transported on trucks from the O-D survey

Independent Evaluation Services in support of the Evaluation Design Report Philippines Secondary National Roads Development Project
68
8.10 CHALLENGES
8.10.1 Limitations of Interpretation of the Results
Road user study results are dependent upon the quality of the data. Therefore, the O-D/PTU surveys must be a representative sample and the collected data must be carefully processed and analyzed.
8.10.2 Risks to the Study Design
The timing of data collection is critical for the evaluation given the high chance of typhoons in the Philippines including the Samar region where the majority of data collection will take place. Adverse weather may affect the PTU survey. While the evaluation team anticipates the data collection to take place during the months with the lowest chance of typhoon taking place, it is difficult to anticipate in advance whether the weather will impact the data.

Independent Evaluation Services in support of the Evaluation Design Report Philippines Secondary National Roads Development Project
69
IX. EVALUATION QUESTION 3B3B) Have road usage patterns changed, in terms of who is traveling on the road, why, what
they are transporting, what they are paying for transport, and how long it takes to move along key routes? [Results: Reduced Transportation Costs (actual), Generated and Diverted Traffic]
9.1 METHODOLOGY
9.1.1 General Overview of Methodology
EQ 3B will be a pre-post performance evaluation looking at how the road usage change before and after the road improvement. While EQ 3A looks at the post-Compact, present day usage of the road three to four years after road improvement, EQ 3B will examine how this changed over time.
9.1.2 Detailed Methodology
Given that baseline information is limited to allow comparison with post-Compact data, retrospective questions will be asked during the O-D survey and PTU survey to construct a retrospective baseline. Data collection for EQ 3B will overlap with the data collection required for EQ 3A. Therefore, the PTU survey which are designed to inform Evaluation Question 3A will also serve to inform the Evaluation Question 3B.
9.2 TIMEFRAME OF EXPOSURE
See Section 5.2.
9.3 PRIMARY DATA COLLECTION – TRAFFIC COUNT SURVEY
See Section 8.3.
9.4 PRIMARY DATA COLLECTION – ORIGIN - DESTINATION SURVEY
See Section 8.4. The O-D survey will ask retrospective questions about the road usage before the road improvement.
9.5 PRIMARY DATA COLLECTION – PUBLIC TRANSPORT USER SURVEY
See Section 8.6. The PTU survey will ask retrospective questions about the road usage before the road improvement.
9.6 SUMMARY TABLE
Summary table of primary data collection is not included in this section because additional primary data collection is not required for EQ 3B.

Independent Evaluation Services in support of the Evaluation Design Report Philippines Secondary National Roads Development Project
70
9.7 SECONDARY QUANTITATIVE DATA
9.7.1 List of Secondary Data Sources
The evaluation team will use secondary data to provide some relevant baseline information as available:
• MTC conducted on the Samar road prior to road improvement by Tetra Tech• O-D survey on the Samar road prior to road improvement by Tetra Tech (limited
information available)
9.7.2 Requirements for Data Capture
See Section 6.5.2.
9.8 ANALYSIS PLAN
See Section 8.9. Evaluation Question 3B will focus on analysis of change in these factors before and after the Compact.
9.9 CHALLENGES
9.9.1 Limitations of Interpretation of the Results
See 8.10.1. An additional limitation is the use of recall method. Since no baseline was conducted, the O-D survey and PTU survey participants will be asked to remember and report on the period before the road was improved (2012 or 2013). Interviewees and participants may have poor recollection of the public transport usage prior to the road improvement.
9.9.2 Risks to the Study Design
See 8.10.2.

Independent Evaluation Services in support of the Evaluation Design Report Philippines Secondary National Roads Development Project
71
X. EVALUATION QUESTION 44) Given the existing transportation market structure, what portion of VOC savings will be
passed on to consumers of transportation services; and if not all savings are passed on,could this project have cost effectively addressed these inefficiencies? [Result: ReducedTransportation Costs (actual)]
10.1 METHODOLOGY
10.1.1 General Overview of Methodology
EQ 4 will be an ex-post performance evaluation examining the transfer of road users’ benefits stemming from VOC savings. EQ 4 will be testing whether the reduced VOC eventually led to reduced costs for transportation services.
10.1.2 Detailed Methodology
EQ 4 will employ a mixed-methods approach to answer the evaluation question. Information will be drawn from secondary sources, mainly from Department of Transportation (DOTr) and other public transportation service providers, to analyze the transportation market structure and the formal and informal institutions that regulate and govern the transportation market. To answer EQ 4, the evaluation team will:
• Analyze the regulatory framework of the sector and assess the gap between enacted andenforced regulations.
• Analyze the structure and composition of transportation cost.• Collect information on transportation fares over time.• Identify the modalities of pricing of transportation services.
10.2 TIMEFRAME OF EXPOSURE
VOC would have decreased immediately upon completion of the road improvements in 2017. Therefore, it would have given transportation service providers, both formal and informal, at least four or five years to adjust to the reduced VOC.
10.3 PRIMARY DATA COLLECTION – ORIGIN-DESTINATION SURVEY
An O-D survey will be used to determine how much road users are paying for transport. A separate data collection is not required to address EQ 4 because the evaluation team will conduct an O-D survey as part of EQ 1 (see Section 5.4 for more information).

Independent Evaluation Services in support of the Evaluation Design Report Philippines Secondary National Roads Development Project
72
10.4 PRIMARY DATA COLLECTION – PUBLIC TRANSPORT USER SURVEY
A PTU survey will be used to determine how much public transport users are paying for passenger transportation services. A separate data collection is not required to address EQ 4 because the evaluation team will conduct a PTU survey part of EQ 3A (see Section 8.6 for more information).
10.5 PRIMARY DATA COLLECTION – KIIS
10.5.1 Sample Units
Key stakeholder organizations in transportation market.
10.5.2 Sample Size and Associated Assumptions
A total of twelve (12) interviews will be conducted including: 1) truck operators, 2) freight forwarders, 3) transporter cooperative, 4) PUJ operators, 5) PUV operators, 6) public medium bus operators, 7) public large bus operators, 8) passenger transport cooperative, and 9) relevant officials from the DOTr that regulate the sector. The table below illustrates the expected sample size for each type of respondent: Table X.1 Transport Sector KII Respondent Type and Sample Size
# Type # of Interviews 1 Truck operator 1 2 Freight forwarder 1 3 Transporter cooperative 1 4 PUJ operators 2 5 PUV operators 2 6 Public medium bus operator 1 7 Public large bus operator 1 8 Passenger transport cooperative 1 9 Office of Transportation Cooperative (OTC) 1
10 Region VIII LTFRB 1
10.5.3 Sample Frame
There are ten potential transportation service provider types (public and private) who could be operating on the SNRDP road. The expected level of SNRDP road usage (limited, some, or significant) for each type of transportation service provider is determined based on the team’s visit to the Philippines and the Tetra Tech report as presented in the table below. While transportation service providers operating as a firm can be identified, it is more difficult to identify and interview individual-operated service providers. Therefore, the KIIs will focus on obtaining information from the firm-operated transportation service providers and the O-D survey will include questions for individual-operated service providers. Table X.2 Transportation Service Provider Type and the Expected SNRDP Road Usage

Independent Evaluation Services in support of the Evaluation Design Report Philippines Secondary National Roads Development Project
73
# Type of Transportation Service Provider
Transportation Service
Type of Operations
Expected Usage of SNRDP Road
Relevant Data Collection
Method
1 Truck operators Goods Firm Significant usage Transport Sector KII
2 Individual Significant usage O-D survey
3 Freight forwarders Goods Firm Some usage Transport Sector KII
4 Motorcycle Taxi (Habal-habal) operators Passenger Individual Significant usage O-D survey
5 Tricycle operators Passenger Individual Significant usage O-D survey6 Taxi operators Passenger Firm Limited usage - 7 Passenger Individual Limited usage -
8 PUJ operators (about 30km) Passenger Firm Some usage Transport Sector KII
9 PUV operators (below 60km) Passenger Firm Some usage Transport Sector KII
10 Public medium bus operators (more than 60km) Passenger Firm Some usage Transport
Sector KII
11 Public large bus operators Passenger Firm Some usage Transport Sector KII
10.5.4 Sampling Strategy
Interviews with DOTr regulators and the cooperatives will be conducted with unique key informants for each organization and therefore sampling is not required. For the operators and cooperatives, the In-Country Coordinator will obtain a list of potential interviewees relevant for the SNRDP (truck operators, freight forwarders, PUJ operators, PUV operators, public medium bus operators, and public large bus operators) from the transporter cooperatives and passenger transport cooperatives. The Evaluation Expert will then select the firms from the list based on their operation routes and the size of their operations.
10.5.5 Instruments
See Section 6.3.5 for details on the instrument. The KII questionnaires will aim at determining the structure and economics of the transport sector and the following details:
• Industry structure, types of operators, average vehicle fleet, and number of vehicles owned• Operating practices such as:
o Cultural factors affecting the service providers and userso Acquisition of modern vehicleso Maintenance of vehicleso Overloadingo Informal paymentso Transportation service priceso Operating practiceso Regulatory policies and actual enforcement of regulations
• Regulatory policies and enforcement such as:o Freight sharing rules
Independent Evaluation Services in support of the Evaluation Design Report Philippines Secondary National Roads Development Project
74
o Queuing systemso Third country rule, cabotage, and backhaul regulationso Axle load limitso Border crossingso Roadblocks and checkpointso Transit agreementso Domestic transport regulations
10.5.6 Rounds, Locations, and Timing
KIIs will be conducted in February 2022 and coincide with one of the engineering data collection trips to maximize the information gathered during interviews. The KIIs will be conducted in Tacloban, Samar, and East Samar depending on the interviews.
10.5.7 Respondent(s) within the Sample Unit
Representatives from key stakeholder organizations in transportation market.
10.5.8 Staff
The evaluation team will conduct KIIs in English by the HDM-4 Specialist, assisted by the In-Country Coordinator.
10.5.9 Data Processing
The HDM-4 Specialist will conduct the KIIs in English, assisted by the In-Country Coordinator. All KIIs will be audio-recorded on digital voice recorders and transcribed by the In-Country Coordinator. The evaluation team will classify, sort, and arrange information gathered to identify trends and examine relationships in the data using NVivo.
10.5.10 Data Quality
While the HDM-4 Specialist leads the interviews and takes notes, the In-Country Coordinator will assist the interviews by taking notes that will be used to cross-reference the notes taken by the HDM-4 Specialist. The notes will also capture non-verbal information (circumstances of the interview, emotions, body language etc.). The transcript will be reviewed by the HDM-4 Specialist within 24 hours of the interview. The team will cross-examine information when relevant to help build a body of evidence to support the analysis.
10.5.11 Safety Procedures/Precautions
N/A

Independent Evaluation Services in support of the Evaluation Design Report Philippines Secondary National Roads Development Project
75
10.6 SUMMARY TABLE
Table X.3 Primary Data Collection Summary Table for Evaluation Question 4
Data collection Timing Sample Unit/ Respondent
Sample Size
Relevant Instruments
Exposure Period
KIIs 02/2022
truck operators, freight forwarders, passenger
transportation operators, cooperatives, DOTr
12 KII questionnaire 69 months
10.7 SECONDARY QUANTITATIVE DATA
10.7.1 List of Secondary Data Sources
The evaluation team will collect secondary data from various sources to address EQ 4. The team will mainly collect the documents from the DPWH, the DOTr, local governments, transport associations, and private transportation contractors (medium and small-sized). The evaluation will attempt to obtain the following documents as available:
• Current laws, regulations, decrees related to the transportation marketo Freight sharing ruleso Queuing systemso Third country rule, cabotage, and backhaul regulationso Axle load limitso Border crossingso Roadblocks and checkpointso Transit agreementso Transportation policies and processes
• Historical records of transportation prices for passenger and goods transportation• External assessments (by international donors etc.) on the Philippines’ transportation
regulations
10.7.2 Requirements for Data Capture
When the team is unable to obtain relevant documents in English, the Filipino document (or at least the executive summary and the relevant sections) will be translated for the purpose of the evaluation. If data is only available in paper form, data will be input into Excel accordingly. If available in an electronic format, the documents will be transferred electronically from the DOTr and other organizations.
10.8 ANALYSIS PLAN
The team will examine the transportation market to evaluate whether GOP’s and local government’s institutional, financial, and technical aspects of the transportation sector are adequate in comparison to international standards. Based on the understanding of the transportation market structure, the evaluation will review the regulations and historical trend of transportation costs to determine the portion of VOC savings

Independent Evaluation Services in support of the Evaluation Design Report Philippines Secondary National Roads Development Project
76
that will be passed on to consumers of transportation services. Using available information on historical fare prices, the difference in fares before and after project completion will be calculated. To better understand what MCC could have done differently to encourage cost saving benefits to be passed on to passengers, the factors that influence fares (regulation, competition, road conditions, vehicle quality, passenger demand, etc.) will be analyzed. Entry points will be identified that might have informed regulation on competition and pricing.
10.9 CHALLENGES
10.9.1 Limitations of Interpretation of the Results
See Section 6.7.1.
10.9.2 Risks to the Study Design
See Section 6.7.2.

Independent Evaluation Services in support of the Evaluation Design Report Philippines Secondary National Roads Development Project
77
XI. ADMINISTRATIVE
11.1 SUMMARY OF IRB REQUIREMENTS AND CLEARANCES
The Evaluation Team will prepare and submit an Institutional Review Board (IRB) application to an IRB registered with the Research Ethics Board with the University of the Philippines Manila for approval of the research and data collection plan. If there are no registered IRBs that are appropriate for this project in the Philippines, the team will submit the application to a relevant IRB in the US. The team anticipates only minimal psychosocial stress and related risks for the research participants. The application materials for IRB will include four sets of documents at minimum: 1) a copy of the Design Report, 2) a copy of survey protocol, 3) copies of all data collection instruments that will be used for the survey, and 4) a completed IRB application form summarizing the protection of participants’ rights and data safety. All survey and interview procedures will be based on the principles of voluntary participation and informed consent. Prior to participating in the survey, respondents will be given sufficient information on the objective of the survey and the use of the data collected in order to inform their decision about whether or not they wish to participate in the survey. The informed consent statement will closely follow the guidelines provided by MCC.
11.2 APPROVAL FROM LOCAL AUTHORITIES
For the collection of field data, the evaluation team will contact the necessary authorities early and work closely to ensure their timely cooperation. The team, with assistance from data collection firms, will acquire official approval for data collection from the police, weight station authorities, and toll stations.
11.3 DATA PROTECTION, ACCESS, AND DOCUMENTATION
The study will ensure that the confidentiality of information obtained from or about human participants is maintained. The evaluation team will ensure that the raw datasets are cleaned and de-identified closely following MCC’s guidelines for public use of data. The evaluation team will also ensure that all data collection agencies also adhere to this high standard of confidentiality and data security. The obtained data will be stored in a secured server with access limited to project personnel who signed the non-disclosure agreement. The evaluation team will provide both a raw, de-identified dataset and a clean, de-identified dataset to MCC for public and internal use. The public-use dataset will be free of personal or geographic identifiers that would allow for the identification of individual respondents. Any additional variables which risk divulging the identity of individual subjects will be removed. In order to facilitate access to and usability of data, all datasets delivered to MCC will be accompanied with completed documentation in the form of standardized metadata.

Independent Evaluation Services in support of the Evaluation Design Report Philippines Secondary National Roads Development Project
78
11.4 DISSEMINATION PLAN
A Data Collection Report will be submitted in 2022 with the final independent CBA model. The evaluation team will also submit the final datasets (a raw dataset and a clean dataset) and the analysis files. Feedback from MCC and local stakeholders will be incorporated to produce the final data collection report. Upon review by the Evaluation Management Committee (EMC), the evaluation team will present the results of the data collection in the Philippines and Washington DC. The evaluation team will deliver the entire contents of the project library in good order,properly indexed and marked, in both digital and paper copy to MCC.
11.5 EVALUATION TEAM ROLES AND RESPONSIBILITIES
The evaluation team has five key personnel that work closely together for evaluation. The table below presents each of the key personnel on the Evaluation Team and their responsibilities. The support team will provide technical and administrative capacity to carry out the project activities and achieve MCC’s goal and objectives. The diagram (Figure XI.1) below shows the organizational chart of the complete evaluation team. Table XI.1 Evaluation Team and Responsibilities
Name Position Responsibility Cesar Queiroz Team Leader/Road
Maintenance Expert • Evaluation Coordination and Quality Control• Technical lead for the evaluation of Evaluation Area 2
on road maintenanceJens Abraham HDM-4 Specialist • Technical lead for Evaluation of Evaluation Area 1:
Engineering Analysis and Economic Model• Technical lead for the evaluation of Evaluation Area 4:
Transportation Market Structure• Technical support for the evaluation of Evaluation Area
3: Road Usage Patterns• Technical support for the evaluation of Evaluation Area
2: MaintenanceGoran Mladenovic
Roads/Pavement Engineer
• Technical support for the evaluation of Evaluation Area1: Engineering Analysis and Economic Model,especially for the roughness study, the road conditionsurvey, the deflection measurement study, and thegeotechnical study
• Technical support for the evaluation of Evaluation Area2: Maintenance, especially for assisting the analysis ofroad maintenance quality
Nils Junge Evaluation Expert • Technical lead for the evaluation of Evaluation Area 3:Road Usage Patterns
• Technical support for Evaluation of Evaluation Area 4:Transportation Market Structure
Tisha Borinaga In-Country Coordinator
• Assist the team to arrange meetings with differentstakeholders and facilitate the data collectionprocedures

Independent Evaluation Services in support of the Evaluation Design Report Philippines Secondary National Roads Development Project
79
Figure XI.1 Evaluation Team Organization Chart
11.6 EVALUATION TIMELINE & REPORTING SCHEDULE
Table XI.2 Summary of Evaluation Timeline and Reporting Schedule
Name of Round Data Collection Data Cleaning & Analysis
First Draft Report
Expected
Final Draft Report
Expected
Post-Compact February 2022 – April 2022
March 2022-September 2022 September 2022 November 2022
The work plan for the evaluation is outlined in Annex II. The plan accounts for each of the major deliverables along with the expected timeline of the evaluation.

Independent Evaluation Services in support of the Evaluation Design Report Philippines Secondary National Roads Development Project
80
ANNEX I: REFERENCES AASHTO. Guide for Design of Pavement Structures, American Association of State Highway and
Transportation Officials. 1993. Asian Development Bank. Completion Report – Philippines: Sixth Road Project (23233). October
2017. Asian Development Bank. Report and Recommendation of the President to the Board of Directors,
Proposed Loan, Republic of the Philippines: Improving Growth Corridors in Mindanao Road Sector Project. November 2017.
Asian Development Bank. Technical Assistance Consultant’s Report - Republic of the Philippines: Road Sector Improvement Project (41076-01), Volume 2: Final Report. February 2011.
FHWA, Travel Time Data Collection Handbook, 1998 Hopkinson, Lisa, Sloman, Lynn, and Ian Taylor. Campaign to Protect Rural England, The Impact
of Road Projects in England. March 2017. Millennium Challenge Account Philippines. Monitoring and Evaluation Plan. September 2016. Millennium Challenge Corporation. Indicator Tracking Table (ITT) Philippines Closeout.
September 2016. Millennium Challenge Corporation. MCC Independent Evaluations, Evaluation Management
Process (EMP). May 2017. Millennium Challenge Corporation. MCC Policy for Monitoring and Evaluation. March 15, 2017,
https://www.mcc.gov/resources/doc/policy-for-monitoring-and-evaluation#fn-12-a. Millennium Challenge Corporation. Millennium Challenge Compact between the United States of
America Acting Through the Millennium Challenge Corporation and the Republic of the Philippines. September 2010.
Millennium Challenge Corporation. Principles into Practice, Lessons from MCC’s Investments in Roads. November 2017.
Millennium Challenge Corporation. Secondary National Roads Development Program, Samar Road Rehabilitation Project, Executive Summary. November 30, 2019.
Millennium Challenge Corporation. SNRDP Closeout ERR Summary of Updates Final. Republic of the Philippines Department of Finance. Annual Summary Report on Philippine
Compact. March 2017. Republic of the Philippines Department of Finance. Annual Summary Report on Philippine
Compact. March 2018. Republic of the Philippines Department of Finance. Annual Summary Report on Philippine
Compact. March 2019. Tetra Tech. Final Assessment Report Philippines Secondary National Roads Development Project
(SNRDP). January 8, 2010. The World Road Association (PIARC). Highway Development & Management, Volume Five: A
Guide to Calibration and Adaptation. 2000.

Independent Evaluation Services in support of the Evaluation Design Report Philippines Secondary National Roads Development Project
81
ANNEX II: EVALUATION WORK PLAN
Contract Effective Date: 09/18/2019Latest Update: 02/16/2021
23 30 7 14 21 28 4 11 18 25 2 9 16 23 30 6 13 20 27 3 10 17 24 3 10 17 24 31 7 14 21 28 5 12 19 26 2 9 16 23 30 7 14 21 28 4 11 18 25 1 8 15
Rapid Start-up and ReportingKey Personnel mobilized CM, JAKick-off meeting with MCC TL, CM, JASubmit Monthly Progress Report TL, JA
Submit updated work plan with deliverable deadlines TL, CMReview all existing documentations related to the program and the evaluation Key personnel
Submit SOW, Trip Report for each country visit TL, CMReview in-country data to establish current values for economic parameters in HDM-4 TL, HS Draft HDM-4 Level 1 Calibration report as an annex to the EDR TL, HS Draft Evaluability Assessment as an annex to the EDR TL, HS Engage with country counterparts to establish a clear understanding of the project scope and develop/refine research questions and methodologies TL, EE, HS
Develop evaluation methodologies and evaluation questions for each research area Key personnel, JASubmit draft Evaluation Design Report TLIncorporate feedback from MCC and local stakeholders on the draft Evaluation Design Report Key personnel, JA
Conduct a workshop with local stakeholders to discuss research questions and methodology TL
Submit Final Evaluation Design Report incorporating feedback from MCC and local stakeholders TL
Submit Nesstar Metadata for Evaluation Catalog entry TL, CMSubmit revised Option Period I budget for MCC approval/technical directive TL, CM
Revise the Evaluation Design Report as evaluation develops TLIdentify local firms and solicit response from data collection firms and select a firm TL, EE, HS, RE, ICDraft and submit data collection firm terms of reference TL, EE, HS, RE, ICDraft and submit draft survey questionnaires and data collection manuals in English Key personnel, JAIncorporate feedback from MCC on evaluation materials Key personnel, JAConduct a virtual review of data collection questionnaires and data collection manuals with local stakeholders Key personnel, JA
Submit summary of pre-test and written review of back-translation TLSubmit final versions of data collection instruments in English, Filipino, and Waray TLSubmit IRB package including research protocol, informed consent statements, and other documents and approvals TL, IC
Submit SOW, Trip Report for each country visit TL, CMTrain data collection firm enumerators TL, EE, HS, RE, ICConduct pilot tests for all data collection methods TL, EE, HS, RE, ICCollect data and conduct field visits, quality assurance and quality control TL, EE, HS, RE, ICMonitor data and process data entry TL, EE, HS, RE, ICSubmit summary of enumerator training and pilot tests TLSubmit Data Collection Report summarizing results, data collection implementation efforts, challenges encounters, and data quality control checks conducted TL
Assess with MCC whether Option Period II is necessary Key personnel, JASubmit revised Option Period II budget for MCC approval/technical directive TL, CM
Q6
MCC PHILIPPINES +B2:BQ37SECONDARY NATIONAL ROADS PROJECT WORK PLAN
Y4February May August Sept
Y1
Q17
Q18
Y5March April
Y2
Q5
Q8
Q7
Option Period I
Task 1: Review Evaluation Materials and Develop Work Plan
Task 2: Develop Evaluation Design Report
Q14
Q15
Q16Q1
Q2
Q3
Q4 Sep June JulyOctober December JanuaryResponsibility*
Y3
Activity
Base Period
November
Q13
Task 4: Prepare and Undertake Data Collection
Task 3: Develop Evaluation Materials

Independent Evaluation Services in support of the Evaluation Design Report Philippines Secondary National Roads Development Project
82
23 30 7 14 21 28 4 11 18 25 2 9 16 23 30 6 13 20 27 3 10 17 24 3 10 17 24 31 7 14 21 28 5 12 19 26 2 9 16 23 30 7 14 21 28 4 11 18 25 1 8 15
Revise the Evaluation Design Report as evaluation develops TLDraft and submit data collection firm terms of reference TL, RE, ICIdentify local firms and solicit response from data collection firms and select a firm TL, RE, ICDraft and submit draft survey questionnaires and data collection manuals TL, RE, IC, JAIncorporate feedback from MCC on evaluation materials TL, RE, IC, JAConduct a virtual review of data collection questionnaires and data collection manuals with local stakeholders TL, RE, IC, JA
Submit SOW, Trip Report for each country visit TL, CMTrain data collection firm enumerators RE, ICConduct pilot tests for all data collection methods RE, ICCollect data and conduct field visits, quality assurance and quality control RE, ICMonitor data and process data entry RE, ICSubmit summary of training and pilot tests TL, RE, ICSubmit Data Collection Report summarizing results, data collection implementation efforts, challenges encounters, and data quality control checks conducted TL
Submit revised Option Period III budget for MCC approval/technical directive TL, CM
Draft and Submit Data Package as per MCC Evaluation Microdata Guidelines including questionnaires, informed consents, the Data Package Worksheet, public-use and/or restricted-access microdata package, and analysis code
Key personnel, JA
Submit Data Collection Inventory with summary data and analysis Key personnel, JAObtain satellite imagery of each road evaluated GE, JASubmit satellite imagery of each road overlaid with data collected GE, JASubmit draft Evaluation Report in English Key personnel, JASubmit Final Independent CBA model TLSubmit Final Evaluation Report including Public Statements of Difference/Support in English//Filipino TL
Submit SOW, Trip Report for each country visit TL, CMPresent results of the Final Evaluation Report findings at MCC headquarters and to other local stakeholders TL, HS
Deliver entire contents of the project library in digital and paper copy for public distribution TL, CM
Q6
Y4February May August Sept
Y1
Q17
Q18
Y5March April
Y2
Q5
Q8
Q7
Q14
Q15
Q16Q1
Q2
Q3
Q4 Sep June JulyOctober December January
** Weeks/quarters marked in blue indicate a team member traveling to the Philippines*** The Illustrative Work Plan assumes that Option Period II will be exercised.
Responsibility*
Y3
Activity
Task 8: Disseminate Final Results
Task 7: Develop Final ReportOption Period III
Task 6: Prepare and Undertake Data Collection
Option Period IITask 5: Develop Evaluation Materials
November
* Key Personnel - TL: Team Leader/Road Maintenance Expert; EE: Evaluation Expert; HS: HDM-4 Specialist; RE: Road/Pavement Engineer* Non Key Personnel - IC: In-country Coordinator; JA: Junior Analyst, GE: GIS Expert/Survey Specialist; CM: Contract Manager
Q13

Independent Evaluation Services in support of the Evaluation Design Report Philippines Secondary National Roads Development Project
83
ANNEX III: BUDGET The evaluation budget is removed from the report for the external version.

Independent Evaluation Services in support of the Evaluation Design Report Philippines Secondary National Roads Development Project
84
ANNEX IV: O-D SURVEY SAMPLING MEMO 1. Background This memo informs the discussion in the main text on sampling for the O-D estimating travel time along the routes of the SNRDP. It has two interlinked objectives:
i) To propose an optimal method (efficient and cost-effective) for measuring travel time of vehicles along the route.
ii) To consider the advantages and disadvantages of using the O-D survey to obtain information on time savings.
The objectives address MCC comments concerning the need for power calculations for the magnitude of the difference between the 2022 counterfactual and forecast in the MCC ex-ante CBA for travel time, and that forecast should be the same as the target in the M&E Plan. 2. Project Objectives and Time Savings The objectives of the SNRDP were to: i) save time; and ii) lower vehicle operating costs. The time saving objectives are formulated in terms of monetary value, as per the indicator “Motorized Traffic Time Cost,” which measures “the monetary equivalent of the time savings of users as a result of improved road conditions by comparing the with or without [project] scenario.” (M&E Plan, Table 7, p.27) MCC, at the time of Compact development, expected the cumulative value of these savings to be $112 million after Compact completion (Compact Annex III-8).88 The two key factors contributing to these savings are travel time along the road and the number of road users. The greater the number of road users and the less time spent traveling on a given road section compared to without the project, the greater the savings. To arrive at the number of road users, the number of vehicles and their occupants must be known. While traffic counts will give the number of vehicles, an O-D survey is needed in order to estimate the number of vehicle occupants. 3. Baseline Data on Time Savings Number of Road Users As the EDR notes, a baseline for AADT was established in September 2009, when traffic counts were conducted by the design consultant, Tetra Tech, at four stations (and covering six sections) along the Samar Road.89 AADT was then calculated, with the adjusted numbers presented in Table 1: Table 1. Pre-project AADT by road section (2009)
88 The only available information on time savings resulting from the project is anecdotal, “The 2018 Annual report notes that “Feedback from road users estimates travel time of 4 hours from Borongan City (Eastern Samar’s capital) to Tacloban City, the nearest highly-urbanized city in Leyte, has been cut down to approximately 3 hours.” (p. 26). 89 Tetra Tech 2010. Final Assessment Report Philippines Secondary National Roads Development Project (SNRDP) Report, p. 9-6.

Independent Evaluation Services in support of the Evaluation Design Report Philippines Secondary National Roads Development Project
85
Section AADT 1A & 1B 1,505
2 1,436 3 & 4 1,336
5 1,238 Average 1,379
Source: Tetra Tech (2010) and author calculations
However, it is worth noting that the M&E plan uses a baseline AADT of 1,179, which is 200 less than the average AADT reported by Tetra Tech. The M&E plan does not specify the source of the AADT data and does not provide a breakdown by vehicle types, whether it was for a particular road section, or whether it represents an average.
Assuming the baseline AADT of 1,179, the 5-year AADT target set by the Compact is 1,450, which is a projected 23 percent increase over baseline, and the 20-year target is 2,720, a 130 percent increase over baseline.
Travel Time Travel time or speed observed was not reported for the baseline. Available information on speeds is based on subjective estimates. The HDM-4 model estimated travel times can be derived as the HDM-4 model recreated by MCC is available. The HDM-4 output is monetized but speeds can be generated from the model.
No O-D survey was conducted at baseline, which means that pre-project conditions will need to use recall method. The evaluation can obtain information regarding pre-project travel time by asking retrospective questions during the O-D survey (see discussion under Section 8).
4. O-D Survey Objectives
With respect to the O-D survey, travel time along key routes is just one of the five following sub-questions under EQ3A and EQ3B:
i. to determine who is traveling along the improved roads,ii. why they are traveling,
iii. what they are transporting,iv. what they are paying for transport, andv. how long it takes to move along key routes.
The OD survey data will be used to inform the following evaluation questions:
EQ1. What is the economic return of the road investment?
EQ 3A: Who is traveling on the road, why, what are they transporting, what are they paying for transport, and how long does it take to move along key routes? EQ 3B: Have road usage patterns changed, in terms of who is traveling on the road, why, what they are transporting, what they are paying for transport, and how long it takes to move along key routes?

Independent Evaluation Services in support of the Evaluation Design Report Philippines Secondary National Roads Development Project
86
5. O-D Sampling – Vehicle Categories Depending on how sub-categories are counted, 13 to 14 vehicle categories have been used to estimate AADT on the Samar road. AADT is available from two sources – the 2010 Tetra Tech Assessment (reporting data collected in September 2009) and DPWH traffic counts. The two sources classify vehicles differently when estimating AADT. (See Table 2.) Table 2. Comparison of vehicle categorization
# Tetra Tech (2010) # DPWH 1 Car, van, pick-up 1 Passenger car 2 Tricycle (motorized) 2 Motor-tricycle 3 Motorcycle 4 PUJ (public utility jeepney) 5 PU vans 3 Passenger utility 6 Cargo vehicles 4 Goods utility 7 Mini-bus 5 Small bus 8 PU bus 6 Large bus 9 Private bus 10 Trucks (4 subcategories) 7 Trucks (6 subcategories) 10a 2-axle 7a Rigid truck (2-axle) 10b 3-axle 7b Rigid truck 3+ axles)
7c Truck semi-trailer (3 and 4 axles) 10c 4-axle 7d Truck semi-trailer (5+ axles)
7e Truck trailers (4 axles) 10d 5 or more axle 7f Truck trailers (5+ axles)
From the above, the vehicle descriptors and categories differ substantially between Tetra Tech and DPWH. In fact, there is not a single identical descriptor. If ‘trucks’ are considered as a single category with subcategories, Tetra Tech uses 10 categories, while DPWH uses 7 categories. The Tetra Tech traffic was carried out 10 years ago, while DPWH is more recent and is carried out annually (latest data available is for 2018). For the HDM-4 analysis, it can be assumed that the Tetra Tech categories should be used for the 2022 evaluation traffic count. For the O-D sampling, the vehicle categories can be grouped into the following four broad categories:
A) private vehicles, including cars, vans, and pick-up trucks; B) tricycles (motorized tricycles, the main or only public transportation that runs between
barangays (villages) within a municipality) and motorcycles (colloquially known as habal-habal, a motorcycle without a sidecar, which operates along barangay (village) or municipal and sometimes provincial road networks that are mainly unpaved or hard-to-reach areas going to the hinterlands;
C) jeepneys and buses (regardless of size, private or public); and D) goods utility/cargo vehicles and – trucks (regardless of number of axles).
Alternatively, seven categories can be created, corresponding to the underlined categories above.

Independent Evaluation Services in support of the Evaluation Design Report Philippines Secondary National Roads Development Project
87
For comparison purposes with the baseline, the Tetra Tech vehicle categories will be used for sampling. 6. O-D Survey Sampling – Sample Size Determination The main objective of determining the sample size per vehicle type is to obtain a representative sample of each sub-group. For the evaluation design, we can estimate the sample size for each vehicle category type, using a standard sample size formula, with a confidence level of 95% and margin of error 5%.
𝑛𝑛′ = 𝑛𝑛
1 + 𝑧𝑧2 ∗ 𝑝𝑝𝑝(1 − 𝑝𝑝𝑝)𝑒𝑒2𝑁𝑁
Where, Z is the Z value (confidence interval number of standard deviation units of the sampling distribution, corresponding to the desired confidence level given as 1.96), e is the margin of error, N is population size, p̂ is the population proportion picking the choice (i.e. the response distribution, set at 0.5).
The actual sample will be based on the AADT data collected in February 2022 from the MTC, one month prior to the O-D survey is conducted. Using the Tetra Tech data from September 2009 (on sections 1a and 1b), the following illustrative sample size is calculated per category: Table 3. Sample size estimations by vehicle category (based on AADT of 1,503)
Category Tetra Tech Data (2009) Minimum Sample Size
Share N Additional 10%*
Raosoft calc90.** Percentage Out of every 10,
stop ‘x’*** Personal cars 54% 818 900 270 33% 3 tricycle/motorcycle 18% 270 297 168 62% 6 buses 10% 149 164 116 78% 8 trucks 18% 266 293 167 63% 6 Total 100% 1,503 1,653.3 721
* Increase sample size by 10% to take into account refusals/non-responses. ** with 5% margin of error and, 95% confidence interval, 50% response distribution. ***Refers to every ‘x’ vehicle that needs to be stopped to obtain the desired sample size. The number of vehicles to be stopped is increased by 10 percent based on the assumption that some vehicles will refuse to participate in the O-D survey. This may be a particular issue with motorcycles, based on previous experience in other countries. The results from this illustrative sample suggest the share of vehicles sampled (stopped and interviewed) would need to be quite large. This is because the category numbers are relatively low. While stopping 3 out of 10 vehicles is within the normal range, it is not standard for O-D surveys to stop 6 or 8 out of 10 vehicles, and may not be reasonable and resource-intensive. Stopping significantly lower numbers would yield less power, however. Increasing the margin of error (e.g.
90 The Raosoft.com online sample size calculator (http://www.raosoft.com/samplesize.html), which uses the above sampling formula, can be used to arrive at sample estimates.

Independent Evaluation Services in support of the Evaluation Design Report Philippines Secondary National Roads Development Project
88
from 5 to 10%) or adjusting the confidence interval (e.g. from 95% to 90%) would give smaller samples.
The decision on the O-D survey sampling rate and the definition of vehicle category will be determined following the traffic count.
7. Estimating Travel Time and Time SavingsTravel time survey. Dispatching a driver and operator to take a roundtrip covering the entire road, taking notes of the time (and odometer readings) as they drive through major intersections and other milestones, as well as eventual stops. There would be a minimum of three such round trips, two on weekdays and one at the weekend. This will be the primary method for estimating travel times. There are four other possible methods for estimating travel time, each of which comes with advantages and disadvantages:
O-D survey, asking drivers and passengers to estimate the time they take along the route.The benefit of this method is that it can yield before-project information on travel time.However, it comes with several weaknesses:
o Comparability. Only some drivers / passengers will be traveling end-to-end on thetwo points on the road section. Some will cover only a segment of the section,while for others the segment will be part of a longer journey, and so they may notbe able to say how long travel time only along the section of interest is.
o Approximations – respondents are likely to give approximate answers for traveltimes, rounding up or down
o Subjectivity – respondents may give the wrong answero Recall – respondents may not recall how long the route took before the project
Derived from HDM-4 model. Estimated times from the HDM-4 model can be derived, as per the HDM-4 model recreated by MCC. The output is monetized but speeds can be generated from the model. Questions on pre-project travel times asked during KII or OD survey can be used for comparison. Speed cameras. Portable speed cameras can be used to collect some spot speeds. However, this would require a major effort and a high number of speed cameras to obtain a large enough sample to provide a reliable average speed for the entire road (or segments of the road). Administrative data. Bus or trucking companies may keep more accurate records of travel time, and this data can be requested. However, private companies may be unwilling to share this information. Also, bus companies may not collect this data if the buses have their speed regulated.
To mitigate the weaknesses in the above methods, multiple sources of information could be used. This would allow comparison between the findings. If differences are low, confidence in the findings increases. The evaluation team will combine the Travel Time survey and compare the results against the O-D survey and the travel time derived from the HDM-4 model.

Independent Evaluation Services in support of the Evaluation Design Report Philippines Secondary National Roads Development Project
89
Finally, it should be noted that travel time is only one of several basic traffic measures of effectiveness (MOE) that the US DOT has used to quantify performance of higher traffic operations. The others are: speed, delay, queue, stops, density, and travel-time variance.91
91 Traffic Analysis Toolbox Volume VI: Definition, Interpretation, and Calculation of Traffic Analysis Tools Measures of Effectiveness. https://ops.fhwa.dot.gov/publications/fhwahop08054/execsum.htm

Independent Evaluation Services in support of the Evaluation Design Report Philippines Secondary National Roads Development Project
90
ANNEX V: STAKEHOLDER COMMENTS AND EVALUATOR RESPONSES
# Comment Evaluator Response
1 Do NOT cite the Investment Memo anywhere in the document. It is NOT a public document.
We removed the reference to IM from the EDR but kept the information from IM in the EAR, which will be removed from the report before it is made public.
2
Please put traffic count stations on the maps, so that one can visualize how each station would collect unique data, i.e. data that would not be picked up at a different traffic count station
We had added the traffic count in the annex but moved it up to the section under EQ1.
3
The budget includes as part of the "marginal cost of the evaluation CBA" some items that aren't correct. For example, IRI is needed for EQ2, and the OD survey and traffic counts are needed for EQ3, so should not be included there.
When data collected under EQ1 is also used to answer other evaluation questions at no additional expense, the evaluation team included the entire cost under the marginal cost of Evaluation CBA column. Only when other data collection costs are impacted by other EQs (expanded O-D survey and expanded axle load survey), the marginal cost for CBA is lower than the full costs associated with each data collection effort.
4
Given that the purpose of EQ1 is to both estimate the ERR to a level of precision that just tells us whether or not to do such a project again (i.e. only really big ERR differences matter) and to model the travel time and VOC savings such that we can state whether the objective was achieved to the magnitude expected (i.e. whether the difference between the counterfactual and the project in the MCC ex-ante CBA was achieved), and we know that the road in the Philippines is in pretty good shape, it seems like we might have an evaluation design here that gives us greater precision than we need. Is that the case? Since the road is in pretty good shape, there is less to learn from getting precise numbers here, and perhaps more to learn from redirecting those resources to other evaluation questions.
This is helpful for the evaluation team to understand the objective of each evaluation question. The team believes that we have adequate level of precision that we would expect for such purpose for EQ1 with the revisions made to the evaluation design.
5
As stated above, I assume that the objective will be measured in this evaluation through the HDM-4 modelled travel times, the OD survey measured travel times, and the HDM-4 modeled VOCs. There is less to learn from the HDM-4 modelled travel times and VOCs, because those are basically an extrapolation from the output (the road condition)...it's hard to argue that they are even really an outcome. Actual measurements on the beneficiary population are preferred, as we learn more from this (even more from having both and comparing, like we do in EQ4) and it is great that we can achieve this for travel times. I've always assumed that there is no equivalent to be able to measure VOCs. Can you suggest anything?
VOCs comprise of fuel, maintenance, driver cost, and vehicle depreciation and it is very unlikely that anyone can provide an accurate estimate of this information. The fares and hire rates are an indication, but is an average for all condition of roads. For measuring time, a speed survey is an option, measuring time travelling in a car at stream speed – at different times. However, O-D survey will provide a subjective estimate of the travel time.
5a Should we be collecting speeds as an indication of travel time? Is this something you can just do when you go to collect data?
The evaluation team has added a Travel Time study as a primary data collection methodology for Evaluation Question 3A. The details of the methodology are found in

Independent Evaluation Services in support of the Evaluation Design Report Philippines Secondary National Roads Development Project
91
# Comment Evaluator Response section 8.6. The study has also been added to data collection summary tables.
6 It looks like the post-compact M&E Plan includes some indicators that will be reported for five years post-compact that might be useful to the evaluation.
DPWH reports on the following indicators annually: 1) number of DNP inspection conducted, 2) number of defects reported, 3) number of defects corrected, 4) annual funding given to CMRMP, 5) amount of funding allocated for SNRDP maintenance, 6) number of fatal road traffic accidents, and7) number of non-fatal road traffic accidents.All of this information provided will bereviewed by the evaluation team.
7 MCC has an updated Evaluation Management Guidance that we will send to you.
We reviewed the updated Evaluation Management Guidance and updated the footnote and the content of the EDR to reflect the updated information.
8 "Samar Road" should be "Samar Island"? Yes. This has been corrected.
9
The EDR needs to define the target population where benefits will be measured. This doesn’t come through in Section 2.4 (maybe MCC needs to tweak our template). Please re-title 2.1.1 “Project Participants and Project Beneficiaries”. The stated beneficiaries in the Objective statement are “those Filipinos living near the roads.” BUT the MCC Principles into Practice refutes this theory and states that our evaluations should measure the benefits that accrue to road users. Please document that in the revised Section 2.1.1. Because it is little additional cost, we should ask road users where they live to evaluate this aspect of the objective, the overlap between the population of road users and people that live near the roads.
We agree that project beneficiary should be defined as road users. We have revised Section 2.1.2 as "Project Participants and Project Beneficiaries" and added reference to the MCC Principles into Practice.
10 Last sentence - the km of PCCP and ACP don't equal the total number of km of the project. Why the discrepancy?
The reason for the discrepancy is unclear, but we added more text to explain that there is a discrepancy between the total ACP and PCCP and the total road length.
11 What was the rationale for the use of PCCP in some places and ACP in others? What are the implications of these choices on the reductions in transportation costs?
We included text to indicate the use of PCCP and ACP. The team expects the roughness, in terms of IRI, to be higher on the PCCP road sections than on the ACP sections of the road. Consequently, the reduction in transportation costs is expected to be higher on the latter.
12
Please describe the "implementation to date" for CMRMP. The current text includes only what the project was designed to do/aimed to do, but no details about implementation which is the purpose of the section.
We added more information to describe CMRMP implementation to date.
13 Was the 16km section part of the project road? Please highlight this section on the map of the road.
Yes. We have added the CMRMP road section to the map.
14
"The Community-Managed Road Maintenance Project [was designed] to provide employment opportunities for women, many of them vulnerable and participants of a social safety net scheme of DSWD, from which the beneficiaries were recruited." Evaluator can decide what to do with this statement, maybe incorporate it as an
We added some of this text to describe the CMRMP.
Independent Evaluation Services in support of the Evaluation Design Report Philippines Secondary National Roads Development Project
92
# Comment Evaluator Response objective of the CMRMP, but not claim any results unless the results can be backed up.
15 are these time frames correct? It would be better to have year, i.e. 2022 instead of Years 7-10 We revised Figure II.4 to reflect the years.
16
"Output from the HDM-IV economic analysis prepared by Tetra Tech as part of the project feasibility study was applied in MCC’s Original CBA Model to find an Original ERR of 13.7 percent. The feasibility study provided the details of all input data used in the HDM analyses which related to the road network and vehicle operating costs." This text should replace current first paragraph
We have replaced the first paragraph with this text.
17 Third paragraph is a discussion of "Cost-Benefit Analysis" rather than "Beneficiary Analysis" as these terms are used by MCC
We moved the text to the "Original CBA Model" section.
18
Should be titled "Closeout CBA Model" (Note that MCC refers to this as the "Closeout CBA Model" What IDG is producing as part of the independent evaluation is referred to as the "Evaluation-Based CBA Model."
We have revised the section title to "Closeout CBA Model".
19
This section should include the following text, "At the time of closeout, the Original CBA Model HDM-4 workspace was not available. MCC recreated the Original CBA Model HDM-4 workspace using the same approach adopted by the original analysis. The ERR was then calculated by updating the final project cost and traffic data based on traffic counts in 2012. The HDM-4 model assumptions were kept closely in line with those of the original model. The IRI measured by the contractor and by DPWH at the end of Compact were substantially different and there were some concerns about the reliability of results. Therefore, the two IRI measurements were not used in the closeout model. Instead, the HDM-4 was updated using the predicted IRI from the original model with increased deterioration factors to account for the early distress that was observed. Thus, the estimated Closeout ERR is reported as 8.9 percent. Given concerns about the quality of data available at closeout, however, MCC considers the Evaluation-Based CBA Model to be produced as part of this independent evaluation to be critical to understanding the SNRD Project results. " Take out everything else.
We have replaced the report with the recommended text.
20
To reduce confusion, please stick to MCC nomenclature for ERRs: MCC ex-ante ERR, MCC modification ERR, MCC closeout ERR, evaluator's CBA, see comments from Economic Analysis on this too.
We revised where we were to ERRs to follow MCC's nomenclature as recommended by Derick.
21
We need to have a phone call to clarify what theory of change the evaluation is evaluating, and this needs to be clarified in the text and reflected throughout the EDR wherever the results are listed. For Figure II.4: What is the difference between the outputs and "improved road conditions"? How do "reduced maintenance costs" cause "reduced transportation costs" for only passengers and goods? How does "increased number of road users" cause "reduced transportation costs" for passengers and goods?
We have revised Figure II.4 and clarified the text.
21a The project logic is a diagram that shows how the objective (reduced transportation costs in terms of travel
The CMRMP is now contributing to the objectives (reduced transportation costs in

Independent Evaluation Services in support of the Evaluation Design Report Philippines Secondary National Roads Development Project
93
# Comment Evaluator Response times and VOCs) is achieved. Please revise the diagram to show the CMRMP contributing to this, and please drop the separate "arm" directly to increased household income.
terms of travel times and VOCs) and the 'arm' contributing to increased household income is removed from the project logic.
22
No accident reductions benefits were included…."the alternative (without project) scenario could have been higher rate of accidents post completion due to faster speeds on the improved roads" If evaluator decides not to include these benefits, please back-up this decision with data on accidents being rare.
Based on the ITT and the DPWH annual reports, the number of accidents actually increased from 128 (2012) and 127 (2013) pre-construction to 265 (2018) and 393 (2019) post-construction. DPWH's annual report states that "figure includes accidents which occurred in barangays under Samar and Eastern Samar Police Provincial Offices which may or may not be covered by the project". Taking this account, the evaluation team still believes that the majority of reported accidents would have occurred on the SNDRP road, given that it is the only major road in these provinces. Therefore, the team concluded that no major benefits in accident reduction have taken place on the SNRDP road and will not be included in the ERR calculations.
23 has been accepted as the close-out ERR but wanted a measure with updated benefit streams a few years after the road, too.
We revised the text to reflect this.
24 Please only cite public documents, such as the compact agreement, for the MCC ex-ante ERR.
We removed the reference to the Investment Memorandum.
25
I'm not sure where the 1,179 AADT comes from either. I looked at the IM and can't find it. Is it possible it was a weighted average (using segment length as the weights) of AADT from a different year?
It could be a weighted average of AADT from DPWH (2012) that the SNDRP Closeout ERR Summary of Updates refer to but the M&E plan doesn't specify the source of this AADT and so it is unclear and difficult to understand how this number AADT was calculated.
26
This isn’t actually true. The Closeout CBA Model has been cleared and posted to MCC’s website. However, it was agreed that a high-quality Evaluation Based CBA was essential in this case.
We revised the text to reflect this.
27
should include only this text, "The Original Beneficiary Analysis collected the following demographic statistics: approximately 282,000 people living in settlements along the Samar road were expected to benefit from the road rehabilitation. The most common occupations of household heads were ‘farmer’ and ‘driver,’ both of which rely significantly on transportation. The analysis found that 19 percent of household heads were female, and that 13 percent were below the poverty line ($1.25 per day in 2005 USD), while a total of 42% lived on less than $2 per day. "
We have replaced the report with the recommended text.
28
Please include in this section a review of the literature in general, including outside of the Philippines, that is relevant to the Evaluation Questions 2-4 (if any…if not just so say so). Same for the “Gaps” section below. Suggest referencing other EDRs on MCC's website in the text and then building off of their literature review if there
We have included a literature review including outside of the Philippines where relevant.

Independent Evaluation Services in support of the Evaluation Design Report Philippines Secondary National Roads Development Project
94
# Comment Evaluator Response is anything you’d like to add (or just leaving it at that if not).
29 Questions 2A and 2B: may want to mention dissolution of the Road Board and other changes.
We added information on the dissolution of the Road Board in the report.
30
how road benefits are distributed among road users…..so trying to understand benefits for different income classes. rationale from MCC: we assume that different classes of users and in different vehicle) use external information--generalize
We have added more information here on literature review of benefits distributed among road users.
31 The results listed after each evaluation question should map to the project logic once it is decided what logic the evaluation is evaluating.
The revised project logic matches with the results for each evaluation question except for Evaluation Question 1. The evaluation team believes that "reduced road maintenance cost" is a result that is not directly linked to the project beneficiaries (road users). We suggest deleting this result from Evaluation Question 1.
32 "Hopefully, this will be disaggregated as much as possible,, such as by gender, income? It would be good to be explicit on that point"
We will disaggregate data by gender and by income (or an income proxy) wherever possible to understand the distribution of benefits among the road users.
33
See our updated evaluation management guidance for the possible types and methodologies. How will the “without project” be created? If HDM-4, then the methodology is “modelling”. If you’re just comparing directly to the baseline, then pre-post. Either way, it is a performance evaluation.
We have revised the evaluation type and evaluation methodology.
33a
I think the methodology is modelling, not pre-post. Baseline data is used, but the counterfactual is not the baseline, the counterfactual is a model created from baseline data.
The Evaluation Methodology for EQ1 has been changed from "Pre-post" to "Modeling" in Table III.1 Summary of Evaluation Design Overview and the paragraph below.
34 Please use a pre-post methodology for this question, to evaluate the CMRMP
We have revised the evaluation methodology.
35 The AADT baseline in the compact was 1179. Was this from a different year AADT in the TetraTech feasibility study?
Tetra Tech traffic count was completed in 2009, but it is not clear from the M&E Plan the source of the AADT and when this data was collected.
36
What is the rationale for using the feasibility study baseline over the M&E baseline? Lack of documentation? Maybe the PM can help with that. If the M&E baseline was completed closer to the start of construction than the feasibility study baseline, as is typically the case, it is a better measure of the "true" baseline.
The M&E Plan provides the following relevant baseline information: 1) AADT and 2) roughness. For traffic counts, the M&E baseline provides AADT, but it is not clear what the source of the AADT is and how this was calculated. We included this information in more detail as a footnote. For the O-D, the M&E plan baseline does not provide the breakdown of vehicle type and therefore the Feasibility Study is the best information available for the baseline. MCC M&E Plan's roughness was 7.1 but this was based on visual assessment. DPWH's

Independent Evaluation Services in support of the Evaluation Design Report Philippines Secondary National Roads Development Project
95
# Comment Evaluator Response IRI values from July 2014 provide more detailed IRI results. 7.1 is used for the first 30km of the road section because DPWH's data was collected after this road section was improved.
37 Please specify the sample unit, and the respondent(s) within the sample unit.
We added sample unit and target respondent for each survey with respondents.
38
is there a baseline (from the Tetratech report) to compare changes in OD or will you ask retrospective questions in the survey to ask about changes ? If using Tetratech baseline what were their locations and methods and questions, etc.?
Response from Anne: Presented this in the EDR on Table III.2
39 Do we need 4 sites for the OD survey? Why? Will each site have different composition of traffic?
More information is included the report regarding the location selection of the OD survey.
40
survey is fine, but please provide sensitivity analysis in EDR (how does this information affect the HDM ERR)? Please keep track of the costs of all sensitivity analyses exercises, so MCC’s can learn about costs.
Please refer to Section 3.3.1.
41
"Will this include those performing maintenance/hired to do the works? It would be helpful for GSI in particular, there was a focus on providing employment for vulnerable women in communities surrounding the road through this."
Based on the information we have so far, the evaluation team believes that the CMRMP has not received funding after the first year after Compact completion. Therefore, interviews with those currently involved in CMRMP is not likely.
42 What is the $14,221 for related to Road Physical Parameters for HDM-4? It’s not clear what this money is paying for. Is this labor?
Response from Anne: addressed and will cover assessment of as-built drawings
43
The cost seems very high for this survey - more than we would like to spend. What are the assumptions that went into it, and could they be reduced? Would having cheaper oversight labor from IDG result in poorer quality data?
The cost in the summary table includes: 1) labor of the Pavement Engineer for the preparation and oversight of data collection, 2) flight and other ODC associated with the travel of the Pavement Engineer, and 3) subcontracting amount for the data collection. For two of our previous IRI data collection exercises, we found out that supervision of local data collection firms is critical for the integrity of the data as it is easy to overlook the procedures that are described in the protocol. This could skew the results, especially when many firms are not familiar with the calibration procedure using topographical survey. The evaluation team strongly believes that onsite supervision is necessary for the roughness study. The cost may be reduced if the data collection firm in the Philippines propose lower cost for the IRI data collection.
44
In the EDR, please provide evidence that the current VOC data is not sufficient. What is wrong with the current VOC data, does not include adjustments for Samar or locations similar to Samar?
We added this information to the Summary table.
45 Can we differentiate this row because it’s based on Option Period 1 findings (when road roughness and road condition Response from Anne: presented in EDR
Independent Evaluation Services in support of the Evaluation Design Report Philippines Secondary National Roads Development Project
96
# Comment Evaluator Response surveys reveal structural problems) and state that this is an upper estimate that will be refined?
46
How does this information relate to HDM-4? Can we do a lighter touch, i.e. fewer sample sections? Can we just use video to estimate this? Present in the EDR the sensitivity analysis for all options (full, sample, video, etc.)
Response from Anne: This was reduced in scope. MCC has no further comments
47 What is the $9,568 for? PTU focus groups have been removed from the EDR.
48 what does the $28,147 include? Is this for the Public Transport User Focus Group discussions?
PTU focus groups have been removed from the EDR.
49
In other countries, public transport users were surveyed during OD surveys, with enumerators getting on buses, jeepneys, etc. and riding along while conducting surveys of passengers and drivers both. Would this be a more cost-effective option? Why or why not?
IDG explained that this is not feasible since Jeepneys and buses are so crowded. The revised sections under EQ3A and EQ3B further explains the data collection proposed for each type of public transportation on the Samar road.
50
"mixed methods" is a type of data collection, not a methodology to answer an evaluation question. Additionally, please add the quantitative component to the indicator table.
We revised the text to reflect this comment and added a quantitative indicator for EQ0 in the summary table.
51
paragraph should read, "EQ 1 requires an economic analysis, or a Cost-Benefit Analysis (CBA), to calculate the economic return of the road investment. The purpose of determining economic return on the SNRDP is to assess whether the investment resulted in an acceptable rate of return in terms of quantifiable benefits generated by the project. It also helps to compare the Evaluation-Based ERR with the Original ERR to assess the assumptions made for the investment decisions. EQ 1 will use the HDM-4 model, a CBA model specifically designed for road infrastructure. It will compare the monetized benefits and costs for the “with Project” and “without Project” scenarios."
We revised the paragraph to reflect this text.
52
The timing should be synced with the MCC ex-ante CBA. Does this model have the traffic growth rates fully adjusted to the new road by five years out? If not, the timing is not right.
The MCC ex-ante CBA assumes generated traffic realizing in two years. Therefore, the timing of the data collection is appropriate. We have added this text to the report.
53
Because they are using different counting stations, how will they compare/get the without project scenario? And the pre-project scenario? They need to add a discussion of how they will address this.
We added more information to provide details on each location of traffic count and O-D survey under Sections 5.3 and 5.4.
54 For traffic accident or fatality, please justify why this is not included in the ERR? Is it because accident rates are so low?
Please refer to the response to comment #22.
55
How will you compare pre- and post- traffic counts on the road if you are taking them at different locations? Will you revise the pre-project traffic counts or do some other adjustment to account for the change of location? Or collect at some of the original locations to understand/adjust the originals?
We added more information to provide details on each location of traffic count and O-D survey under Sections 5.3 and 5.4.
56
The number and locations of the traffic count and OD surveys needs to be reconsidered and revised. What is the evidence the four locations will show significantly different traffic counts? And that for OD will show
We added more information to provide details on each location of traffic count and O-D survey under Sections 5.3 and 5.4.

Independent Evaluation Services in support of the Evaluation Design Report Philippines Secondary National Roads Development Project
97
# Comment Evaluator Response different origin-destinations, trip purposes, goods carried, and travel times between key routes (i.e. the answers to the survey questions)? From looking at the map, it seems likely that traffic will be the same in some of the locations. I'm open to doing all four if they will be different, but would need a convincing case for it.
57
What is the rationale for the 20% sampling rate? Power calculations are required in this section. The evaluation must be powered to detect whether the targeted magnitude of the objective was achieved, per the MCC Evaluation Management Guidance. I assume that the objective will be measured in this evaluation through the HDM-4 modelled travel times, the OD survey measured travel times, and the HDM-4 modeled VOCs. Specifically, for the OD survey then, the power calculations are needed for the magnitude of the difference between the 2021 counterfactual and forecast in the MCC ex-ante CBA for travel time, and that forecast should be the same as the target in the M&E Plan.
Travel time mean and its standard deviation from the O-D survey varies depending on trip origin-destination, length of the road, traffic condition, and the type of vehicle. The team believes that the assuming the standard deviation from the Mongolia O-D survey will not be applicable for the Philippines power calculation given the different routes and their respective distance. Also, the Philippines Feasibility Study did not provide information on the origin-destination of key routes on the Samar route before road construction. Therefore, it is difficult to make assumptions on the minimum detectable effect. In addition, the percentage of OD survey respondents who have travelled on the road before the road improvement is not available. Post-construction OD sample size's ratio to the pre-construction OD sample size is a difficult assumption to make without this information.
The team will collect the standard deviations for travel times from the Philippines O-D survey and the number of respondents who have travelled on the road prior to road improvement to determine the power for the travel time difference. HDM-4 modelled travel time and VOC is difficult to do power calculations.
In terms of determining the sample size, the evaluation team will use the MTC to determine the sampling rate for each vehicle type, depending on the number of vehicles observed on each section/direction.
57a
Should be a representative sample, then, which I think is in line with the last sentence, but the calculations for this sample need to be presented in the EDR. They can be updated with the the actual traffic count data that comes in after that. Same applies to the PTU survey (See Moldova EDR)
We added Annex IV. O-D Survey Sampling Memo which contains detailed calculations for the O-D survey sample.
58
Thank you for this sensitivity analysis - the cost seems to outweigh the learning to MCC. Please remove and suggest an alternative approach for axel loading (I assume trucks will still be interviewed as part of the OD survey), unless a convincing argument can be made showing that dropping this survey will result in the inability to detect whether the
We removed axle load survey from data collection and updated the report accordingly.

Independent Evaluation Services in support of the Evaluation Design Report Philippines Secondary National Roads Development Project
98
# Comment Evaluator Response targeted magnitude of the objective was achieved for travel time (HDM-4 modelled), travel time (OD survey measured) and/or vehicle operating cost savings.
59
The cost seems excessive for this survey as secondary data is likely to exist showing price differences between Samar and the mainland. Please remove and suggest an alternative approach, unless a convincing argument can be made showing that dropping this survey will result in a drastic change to the ERR and/or the ability to detect whether the targeted magnitude of the objective was achieved for travel time and vehicle operating cost savings.
We have removed the interviews with other respondents but kept two interviews with maintenance workshops to obtain information on maintenance shop crew wages. Information on transport operator crew wage will be obtained during interviews conducted for Evaluation Question 4.
59a Are you sure that is the right approach? In Moldova they gave us a convincing case that the ERR was very sensitive to this input and that we should keep more resources here.
The sample size for the VOC survey has been changed from 2 to 7 in Table III.2 Detailed Evaluation Design Overview and Table V.4 Primary Data Collection Summary Table for Evaluation Question 1. Additionally, the budget has been changed to reflect the proposed budget for the VOC surveys in the first draft of the EDR. Finally, the original text from the first draft of the EDR has been inserted into Section 5.5 Primary Data Collection - Vehicle Operating Cost Survey.
60
If the decision cannot be made now, the trigger must be evidence that there will be a drastic change to the ERR and/or the inability to detect whether the targeted magnitude of the objective was achieved for travel time and vehicle operating cost savings. Please note this in the text.
We noted this under section 3.3.2 and noted this in the Executive Summary.
61
We've understood from our engineers that deflection cannot be measured on cement, and therefore wouldn't be applicable to measure across this road. Is there any truth to that?
FWD can be used to measure deflection on both flexible and rigid (AC and PCC) pavements. BB is more appropriate for flexible pavements (ACP), but by increasing the axle loading of the truck (from 80 kN to 130 kN), BB can also be used for measuring deflections of rigid pavements. We added this information in the summary table and in the section for Deflection under EA1.
62
"It may be helpful to include in the sample those employed to perform road maintenance in the surrounding communities. One of the ideas was that this activity would allow for sustained local employment as well as supporting ongoing maintenance. It will be good to learn if that actually happened, as MCC GSI is considering how women's employment could be supported through such investments. Suggest also adding DSWD as they participated in the pilot maintenance program that MCA set up with the local communities." Evaluator may be able to answer this without adding to the sample frame.
Please refer to response to comment #41. Interviews with DSWD for CMRMP is more relevant for Evaluation Question 2B. This is now included under EQ 2B.
63
This needs much more detail. Explain how the indicators in the indicator table will be analyzed, the qualitative data will be analyzed, and conclusions will be drawn to answer the evaluation question.
We added to the analysis section for each indicator.

Independent Evaluation Services in support of the Evaluation Design Report Philippines Secondary National Roads Development Project
99
# Comment Evaluator Response
64 The CMRMP needs be added to the project logic, and associated indicators added to the indicator table
CMRMP Is included in the project logic and added under EQ 2B indicators.
65 Please explain how the KIIs for 2B will cover the CMRMP. It seems unlikely that it would fully overlap.
DSWD will be interviewed in addition to the list of stakeholders to be interviewed under EQ2A. This has been revised in the report.
66 "Please be specific in what you mean here by type of road user, is this by income and gender?" Yes. We added text in the report.
67
Focus groups locations should be based on the OD survey (and not those areas/communities near the road). Also, please consider using the OD survey for this instead of focus groups, so that you can get more precise data from public transport users. Focus groups are more appropriate for open-ended questions.
We are proposing a number of new data collection methods for EQ 3B and removed the Focus Group Discussions from the design.
68
"It will be important to understand how these patterns have changed for different socio-economic groups, so as much as possible, attention should be paid to disaggregating information."
Information will be disaggregated where possible by income and gender.
69
We cannot approve focus groups around the road to measure the information in the OD survey for passengers for several reasons. First, this is a biased sample and different from the rest of the OD survey results. Second, focus groups are a less rigorous form of data collection and only warranted when it isn't known what to ask (which is clear here because the rest of the targeted population is getting the OD survey, or there are budget constraints. Third, this isn't the target population (road users) and it is against the “lessons learned” in the MCC Principles into Practice. Passengers need to be interviewed in the same individual manner as the OD survey, the sampling needs to be just as rigorous (note how the selection of passengers will be made and the associated calculations), and the instrument needs to cover the same quantitative questions as we ask other road users. There’s no reason we should collect less rigorous information for passengers than for other road users.
We are proposing a number of new data collection methods for EQ 3B and removed the Focus Group Discussions from the design.
70
If there are new open-ended evaluation questions that the evaluation team thinks MCC should explore with focus groups, suggest it. I could see that being the case here, but that case hasn't been made.
Please refer to response to comment #24.
71 Is there anything MCC could have done to get savings to road users if this is not happening? What are the lessons for future compacts?
We added text in the analysis section.
72 Please include the list of stakeholders to be interviewed in the EDR We revised the list of stakeholders.
73 Please explain how the second part of the evaluation question (what could the project have done) will be addressed.
Please refer to response to comment #72.
74
The IRB approach doesn't seem in line with MCC's requirements - an HHS-registered IRB is required, not the Research Ethics Board of the University of the Philippines. If that is required locally it must be included as well. If that IRB is also HHS-registered, then that satisfies both.
Research Ethics Board at the University of the Philippines Manila is a HHS-registered IRB.
75 Please specify the sources and questions that will be asked in the OD survey to measure these
In HDM, travel time and cargo delay are estimated from the speed calibrated for

Independent Evaluation Services in support of the Evaluation Design Report Philippines Secondary National Roads Development Project
100
# Comment Evaluator Response without and with project cases and not from OD survey. OD survey includes questions on travel time which are mainly used in EQ 3.
76 What's the reason for differentiating public and private large busses? Just curious because reasons are given for other changes but not this one.
The feasibility study has this classification and VOC and VOT can be different for these categories as private buses are primarily for tourist purposes.
77 Please adjust the IRI to be reported every 10 meters. The text in section 5.6 and the summary table have been adjusted to reflect this.