evaluation fff impact analysis - ffg.at€¦ · evaluation fff impact analysis background report...
TRANSCRIPT

Evaluation FFF
Impact Analysis
Background report 3.2

Evaluation FFF
Impact Analysis
Background report 3.2
Andreas Schibany1)
Gerhard Streicher1)
Nikolaus Gretzmacher1)
Martin Falk2)
Rahel Falk2)
Norbert Knoll2)
Gerhard Schwarz2)
Martin Wörter3)
1) Joanneum Research – Institute of Technology and Regional Policy 2) WIFO – Austrian Institute of Economic Research 3) KOF – Swiss Institute for Business Cycle Research
Vienna, March 2004

Content
LIST OF TABLES .........................................................................................................................................5
LIST OF FIGURES........................................................................................................................................6
1 INTRODUCTION..................................................................................................................................7
1.1. Background......................................................................................................................................7 1.1.1 Database ...................................................................................................................................7 1.1.2 Structure of the Report ............................................................................................................8
1.2. Relevance of the FFF in the context of the Austrian funding system............................................9
2 FFF-FUNDED PROJECTS - PATTERNS OF PARTICIPATION ...................................................10
2.1. The data .........................................................................................................................................10 2.2. Applications and approvals from 1995 to 2003 ...........................................................................11 2.3. Rejections and Approvals: a project perspective..........................................................................13 2.4. Rejections and Approvals: the firm perspective...........................................................................16 2.5. Rejections, Approvals, and funding: a multivariate approach .....................................................21
2.5.1 A binary participation model.................................................................................................23 2.5.2 A linear funding model..........................................................................................................26
3 INPUT ADDITIONALITY..................................................................................................................28
3.1. What is the problem? ....................................................................................................................28 3.2. Theoretical Considerations ...........................................................................................................28
3.2.1 Typical results: a quick literature survey ..............................................................................30 3.3. The data base .................................................................................................................................31 3.4. The model......................................................................................................................................33
3.4.1 Standard errors revisited: a bootstrap approach....................................................................36 3.4.2 Additionality – a function of firm size? ................................................................................36 3.4.3 Additionality in firms with sporadic R&D activities............................................................38 3.4.4 Concluding remarks...............................................................................................................39
4 OUTPUT ADDITIONALITY .............................................................................................................41
4.1. Factors explaining the Level of R&D Subsidies ..........................................................................41 4.1.1 Hypotheses about the agency's allocation rule......................................................................41 4.1.2 Data and descriptive results...................................................................................................43 4.1.3 Empirical results ....................................................................................................................45 4.1.4 Concluding remarks...............................................................................................................47
4.2. Productivity Effects of R&D subsidies.........................................................................................47 4.2.1 Introduction............................................................................................................................47 4.2.2 Empirical model and hypothesis ...........................................................................................48 4.2.3 Data and descriptive results...................................................................................................49 4.2.4 Results of the productivity effects of the amount of R&D subsidies...................................50 4.2.5 Concluding remarks...............................................................................................................51
5 BEHAVIOURAL ADDITIONALITY................................................................................................52 3
5.1.1 Project additionality...............................................................................................................53 5.1.2 Behavioural changes in case of rejection ..............................................................................55 5.1.3 Collaboration and networking ...............................................................................................56 5.1.4 Preceding and subsequent projects........................................................................................57 5.1.5 Econometric evidence from the FFF-panel data set .............................................................58 5.1.6 Concluding remarks...............................................................................................................62
6 IMPLICATIONS OF THE FFF-SUPPORT: RESULTS OF A SURVEY OF FFF CUSTOMERS 63
6.1. The survey and sampling ..............................................................................................................63 6.1.1 Some basic features of the sample firms...............................................................................64 6.1.2 Objectives and problems with R&D activities of FFF customers........................................68
6.2. Characterisation of FFF-funded Projects......................................................................................69 6.2.1 Main motivation for submission: high costs of R&D...........................................................69 6.2.2 FFF-funded projects lead to R&D extension ........................................................................71 6.2.3 FFF-funded projects are technologically more difficult, more expensive and of longer
duration............................................................................................................................................72 6.2.4 Majority of Firms: FFF funded projects have no impact on other R&D projects ...............73 6.2.5 FFF-Funding Results: New or improved products/services are most frequent ...................74 6.2.6 To open up a market: primary goal for commercialisation ..................................................75 6.2.7 Firms’ motivations and project advancement: differences between successful and unsuccessful FFF submissions .............................................................................................................76
6.3. Licenses, Products and Processes .................................................................................................78 6.3.1 Time to market.......................................................................................................................78 6.3.2 Licenses..................................................................................................................................79 6.3.3 Products and Processes..........................................................................................................80
7 MAIN FINDINGS................................................................................................................................83
8 REFERENCES .....................................................................................................................................86
APPENDIX I: DEFINITION OF NACE-CODES .....................................................................................89
APPENDIX II: SAMPLE DISTRIBUTION BY SECTORAL AFFILIATION AND SUB-BRANCH..90
4

List of Tables Table 1: Applications and approvals by type of applicant, S 1995-2003 (present)....................................10 Table 2: Descriptive statistics of model variables, 1998-2003 (present) ....................................................22 Table 3: Estimation results of the probit model of participation.................................................................23 Table 4: simulated percentage difference in approval rates vis a vis the “benchmark project”.................25 Table 5: Estimation results of the OLS model of the funding share (present value of funding as % of total
project costs).........................................................................................................................................27 Table 6: Econometric results, geographically differentiated.......................................................................30 Table 7: Results of the fixed-effects panel regression.................................................................................35 Table 8: Results of the bootstrapping: descriptive statistics and Kernel density approximation...............36 Table 9: Model results disaggregated by firm size......................................................................................37 Table 10: Additionality of firms with intermittent R&D performance.......................................................39 Table 11: R&D intensity and R&D subsidy ratio (supported firms), 1995-2002 ......................................43 Table 12: R&D intensity and subsidies ratio by firm size (supported firms) .............................................44 Table 13: Summary statistics (supported firms)..........................................................................................44 Table 14: Summary statistics (dummy variables, percentage share of total) .............................................45 Table 15: Determinants of the ratio of R&D subsidies to total R&D: Panel estimates .............................46 Table 16: Change in labour productivity and R&D subsidy ratio: Panel estimates ...................................51 Table 17: Implementation/non-implementation if application was/is rejected: analysis by sector-
affiliation ..............................................................................................................................................53 Table 18: Implementation/non-implementation if application was/is rejected: analysis by firm-size .....54 Table 19: Behavioural Additionality: adaptations if application was/is rejected .......................................55 Table 20: Behavioural Additionality: collaboration and networking (%) ..................................................57 Table 21: Behavioural Additionality: chain effects of public funding (in %) ............................................58 Table 22: Panel estimates of the determinants of log(scientific R&D-personnel) .....................................59 Table 23: Panel estimates of the determinants of the logarithm of scientific R&D personnel by size......60 Table 24: Impact of subsidies on scientific R&D personnel: Dynamic panel estimatesa).........................61 Table 25: Increase in FFF-subsidies necessary to employ one additional R&D-worker ..........................62 Table 26: Sample for the survey ..................................................................................................................63 Table 27: Response rate ...............................................................................................................................64 Table 28: Joint distribution of sector-affiliation and firm-size ...................................................................65 Table 29: Year of foundation (percentile-distribution) (N=1104) ..............................................................65 Table 30: Aggregate sales (in Mio. €) .........................................................................................................66 Table 31: Aggregate export performance (levels in Mio. €)a).....................................................................66 Table 32: R&D-intensity of sample firms ...................................................................................................67 Table 33: Experience with FFF...................................................................................................................68 Table 34: Success categories: absolute frequencies and shares ..................................................................68 Table 35: R&D-activities are aiming at …..................................................................................................68 Table 36: Problems related to companies' R&D-engagement (in %, N=1232) .........................................69 Table 37: Important / not-important reasons to submit a project to FFF (in %, multiple responses) ........70 Table 38: Characteristics of successfully submitted projects (in %, multiple responses)..........................71 Table 39: Comparison of FFF-funded projects and not externally funded projects (in %) ......................73 Table 40: FFF funded projects: impact on other R&D projects (in %, multiple responses)......................74 Table 41: Results of the FFF funded projects (in %, multiple responses)..................................................75
5Table 42: Commercialisation of the results of R&D: the four most important goals (in %) .....................76

List of Figures
Figure 1: Applications and Costs of FFF-funded Projects, 1995-2003 (present).......................................11 Figure 2: Approval and funding rates, 1995-2003 (present) .......................................................................12 Figure 3: Funding mix, 1995-2003 (present)...............................................................................................13 Figure 4: Approval and funding rates by size of project and type of fund, 1995-2003 (present) ..............13 Figure 5: Applications, costs and funding rates by economic activity, 1998-2003 (present) ....................14 Figure 6: Applications and approvals by economic activity, 1998-2000 vs. 2001-2003 (present) ...........16 Figure 7: Repeated Applications, 1995-2003 (present)...............................................................................17 Figure 8: Applications and approvals by firm size and age, 1995-2003 (present) .....................................18 Figure 9: Applications and approvals by firm location 1995-2003 (present)............................................19 Figure 10: Applications and approvals by firms’ export share and R&D share, 1995-2003 (present) .....20 Figure 11: Effects of R&D Subsidies on Total R&D Expenditures ..........................................................29 Figure 12: Constructing time series by the „Relay method“.......................................................................32 Figure 13: Number of firms by number of applications to the FFF, 1995-2003........................................33 Figure 14: Implementation/non-implementation if application was rejected: analysis by firm-size.........37 Figure 15: PV rates by size class..................................................................................................................38 Figure 16: Correlations between the growth rate of labour productivity in the following two years and the
initial R&D subsidy-sales ratio............................................................................................................49 Figure 17: Correlation between the initial R&D subsidy ratio in t-2 and the growth rate of R&D
personnel in the following yearsa)........................................................................................................58 Figure 18: Motivations - Differences between successful and unsuccessful submissions (in %) .............77 Figure 19: Project advancement – Differences between successful and unsuccessful submissions (in %)
..............................................................................................................................................................77 Figure 20: Time to market from the end of project to market entry (N=855) (1995-2003).......................78 Figure 21: Licenses by size and sector in % (N=862) (1995-2003) ...........................................................79 Figure 22: License revenues by size and sector for the period 1995-2003(N=118)...................................79 Figure 23: Product/Process development by size and sector (1995-2003).................................................80 Figure 24: Impact of FFF funding on product development (y-axis = cumulative percentage of answering
firms) ....................................................................................................................................................81 Figure 25: Share of new products out of FFF funding on total turnover (last business year)....................81 Figure 26: Impact of FFF funding on product development (y-axis = cumulative percentage of answering
firms) ....................................................................................................................................................82
6

1 Introduction
1.1. BACKGROUND
The Austrian Industrial Research Promotion Fund (FFF) occupies a central role in the Austrian Innova-tion System. One of its main activities is to provide public funding to industrial R&D projects. One of the principal tasks of the FFF is thus to support promising innovative projects at the limit of a firm’s capabilities in order to encourage continuing R&D activities.
More research and development to generate new products, processes and services are among the most impor-tant factors of business success. We therefore pursue forcefully our legally prescribed objective of encouraging firms to undertake on a lasting basis more research and more ambitious projects and to support them in doing so. Our support is mainly financial, backed by other measures (e.g. networking, partner search).(Mission of the FFF).
This study is part of a larger evaluation of the FFF set by the Ministry for Transport, Innovation and Technology (BMVIT). The study is aimed at giving a thorough description of the patterns of R&D fund-ing by the FFF, identifying parameters which influence the provision of funds and presenting the direct, indirect and broader effects of FFF funding. It was thus one of the main interests to use the concept of additionality to analyze different (additionality) aspects of firms that have received funding from the FFF.
The question of additionality has been hotly discussed in recent years resulting out of the growing inter-est in R&D subsidies and the measurement of their impact. ‘What difference does it make?’ – the ration-ale of additionality still is the main touchstone of design and outcome of public policy. It is the most obvious guideline for government R&D policy and is reflected in most of the mission statements of R&D funding organizations: profit-maximizing firms underinvest in R&D.
The concept of additionality has a wide set of intentions which we try to consider within the present study. It focuses on (i) the extent to which public support of private R&D lead to an increase in overall research expenditures by the funded firms. Input additionality thus investigates whether publicly funded R&D is complementary and thus ‘additional’ to privately funded R&D spending. Another intention (ii) is output additionality, which focuses on the questions whether publicly funded R&D had an impact on both research output and overall productivity growth. Behavioural additionality (iii) broadens the tradi-tional additionality concept by looking at permanent changes in the conduct of a company, possibly mir-rored in a more formal institutionalization of innovation and R&D-activities. It is obvious that these ele-ments are more challenging since they are more intangible, hard to measure and based on more subjec-tive assessments.
1.1.1 Database
We used mainly two databases for our analysis:
• Project- and firm-level data, which were provided by the FFF and comprise the period from 1995 to November 2003.
• Results of a questionnaire survey conducted among funded firms as well as firms, which submit-ted a research proposal to the FFF but were rejected.
A detailed description of both databases can be found at the beginning of the relevant chapters.
7

We are well aware of the fact that some of the issues mentioned above are quite difficult to mention without a valid ‘control group’. Hence, the fundamental question ‘can the attained advance in R&D be credited to public intervention, or would it have been taken place anyway?’ is all but trivial and leads to measurement problems when using the additionality concept. This is because there are great difficulties in estimating the returns to R&D and the nature of the problem as a counterfactual. The latter leads to the problem of finding a valid control group when seeking to estimate impacts based on panel data. How-ever, the reasons for not using a control group in our study are the following:
• As the present study is part of a larger evaluation of the FFF an additional survey of a relevant control group would have allocated too much resources on this issue and ignored other relevant is-sues of the evaluation.
• Austria is a small country and the FFF is the major funding agency. As we covered in our survey all firms, which submitted a proposal at the FFF in the period 1995–2003 we simply presumed that it would be hard to find firms, which are innovative (or undertake R&D) and had never sub-mitted a proposal at the FFF. We guessed that most of the firms, which do R&D are aware of the FFF for supporting business R&D. We therefore concluded that creating a sample of firms, as a control group for FFF funded firms would be enormous costly if not impossible.
1.1.2 Structure of the Report
The study is divided into different sections led by different hypotheses and based on different databases.
The first section concerns the analysis of who are the participants of FFF funding. We thereby look at the application numbers and rejection rates from two perspectives: the project perspective includes the solicited amount, the types of funds, the sectoral activity of the project, and whether it is a follow-up to a previous project or a completely new application; the firm perspective deals with the firms’ geographical location, firm type, size and age, and previous research activities. To complement these ‘one-dimensional’ approaches, a multi-variate model of binary choice will be estimated in the second part. It aims at identifying parameters, which influence the Fund’s decision on whether to accept or reject a cer-tain proposal.
The following chapters deal with the additionality of public R&D Funding. The second section is on input additionality and addresses the question: do public contributions to private research boost total R&D expenditures – and if so, do they boost them by an amount which is larger than the amount of pub-lic money which was used in this way?
The third section deals with output additionality and consists of two parts: the first part presents results on factors explaining the level of R&D subsidies. It looks at the evolution of the R&D subsidy ratio as well as the R&D intensity among FFF supported firms and quantifies econometrically the main factors behind the amount of R&D subsidies. The second part investigates the relationship between privately and publicly funded R&D on labor productivity growth.
The fourth section is on behavioral additionality. This section uses data from the survey as well as in-formation of the FFF project and firm database. It explores various dimensions of behavioural addition-ality resulting from FFF-subsidies and investigates whether participation in FFF funded projects influ-ences the R&D-related behaviour of the firms in a significant manner. The focus is on the building of innovative capabilities and competence building in general and on the companies’ ability to make use of new technologies and R&D procedures elsewhere. In the case of such effects this may strengthen the firm’s ability to absorb new knowledge, i.e. its absorptive capacity.
8

The fifth section is based on the results of the survey and presents the relevant results of the question-naire. The first part deals with the implementation of the survey and describes our approach and sam-pling. It further summarizes the basic features of the sample firms. The following parts deal with the following questions:
• Are there firm (or categories)-specific motivations to submit a research proposal to the FFF? • What are the characteristics of FFF-funded projects, what are the aims and what are the distinct
differences between FFF-funded projects and projects funded by the firm solely? • What are the technical results of FFF-funded projects? • What are the distinct differences between FFF-funded projects and not FFF-funded projects as re-
gards reasons of submission and project advancement?
The final part is related to the FFF funding in total for the period 1995-2003 and aims at assessing the direct economic effects in terms of licenses, new developed products and services and new process inno-vations. Although quite difficult to assess the respondents tried to calculate the proportion of the FFF in relation to all new developed products, services and process for the period 1995-03.
The sixth section summarizes the main findings.
1.2. RELEVANCE OF THE FFF IN THE CONTEXT OF THE AUSTRIAN FUNDING SYSTEM
According to the OECD-MSTI database, Business Expenditure on R&D (BERD) amounted to € 2,107 Million in 1998, the most recent year for which official BERD data are available. Of this sum, 5.5 % or about € 116 Million were financed by government (64.4 % were financed by industry, 30.1 % were fi-nanced by abroad. 0.1 % were financed by other national sources.
In 1998, the FFF supported business R&D with subsidies and loans worth a total of € 187 Million, equivalent to a present value of € 76.7 Million. Thus, the FFF accounted for about 66 % of that part of Austrian BERD which was financed by government. Adding those funds which are provided by other sources but which are managed by the FFF, viz. € 8.5 Million from the OeNB, the Austrian Central Bank, and € 8.4 Million by the ITF, the Ministry of Innovation’s Innovation and Technology Fund, raises the FFF’s share in government-financed BERD to more than 80 %.
Deducing from this impressive number, it is probably safe to assume that the FFF can count the over-whelming majority of innovating firms in Austria as their clients. Of innovating firms, which have ap-plied for public R&D subsidies, probably all have approached the FFF at least once during the last dec-ade.
9

2 FFF-funded Projects - Patterns of Participation
2.1. THE DATA
The project-level data were provided by FFF; they comprise the period from 1995 to November of 2003. The data base consists of two parts, one containing information on the project itself, the other informa-tion on the applying firms. Not all projects, however, can be unambiguously linked to this data base of applying firms: 260 projects were submitted by research co-operations of more than one firm (Arbeits-gemeinschaften, or ARGEs). A further 938 applications (or almost 10 % of the total) were filed by appli-cants which were not contained in the firm data base. According to the FFF, these applicants are indi-viduals, University institutes or “very old” firms. The following Table 1 provides an overview.
Table 1: Applications and approvals by type of applicant, S 1995-2003 (present)
type of applicant # app
lican
ts
# app
licat
ions
# app
licat
ions
/ app
lican
t
cost
s / p
rojec
t [k€
]
appr
oval
rate
[%]
cost
s / ap
prov
ed p
rojec
t [k€
]
fund
ing
rate
[%]
PV ra
te [%
]
Single Firms 3 138 8 769 2.8 510 75 551 45 22ARGE 191 260 1.4 458 76 513 42 24Firm data n.a. 711 938 1.3 404 60 440 49 26total 4 028 9 967 2.5 498 74 542 45 22 Source: FFF; own calculations
In total, the data base lists 4028 applicants submitting a total of 9967 proposals, 7384 or 74 % of which eventually received funding. The overwhelming majority of projects (88 %) is submitted by single firms; less than 3 % are filed by ARGEs. The rest is filed by applicants which are not contained in the data base.
The costs per submitted project amount to about 500 000 €. Interestingly, at 460 000 €, the typical pro-ject submitted by ARGEs is somewhat below that average.
Approval rates are very similar for single firms and ARGEs; only projects for “other applicants”, at 60 %, face markedly below-average approval rates. For all types of applicants, the average costs of ap-proved projects are about 10 % higher than the average costs of proposed projects: obviously, more ex-pensive projects face somewhat higher chances of approval than cheaper ones.
The average funding rate (i.e., the share of project costs eligible for subsidies) is 45 % of the costs of approved projects. It is quite homogenous for all applicants, as is the Present Value rate (PV) (the share of the subsidies’ present (cash) value, which on average amounts to 22 % of total project costs). The PV rate is lower than the funding rate, because only part of the subsidies is non-repayable (the rest consists of loans by the FFF or FFF-subsidised loans by private banks; for more on the “funding mix”, cf. below).
10

Not all subsidies granted by are paid for out of FFF funds proper: additionally to these funds, the FFF manages funds provided by the Austrian Central Bank (OeNB) and by the Ministry for Transport, Inno-vation, and Technology (BMVIT; the so-called Innovations- und Technologiefonds, ITF).
88 % of approved projects were financed out of FFF funds, 6 % received funding from OeNB sources and a further 6 % were funded under the ITF program. All three types of funds, however, are managed by the FFF on identical grounds. Therefore, in the following analysis, they are lumped together as “FFF-funded projects”.
Besides the 9967 applications which were thus managed, a further 472 applications were submitted for dedicated programs initiated and financed by BMVIT, 212 or 45 % of which successfully. Though man-aged by the FFF, these programs follow their own set of rules; accordingly, they will largely be omitted from the following analyses.
2.2. APPLICATIONS AND APPROVALS FROM 1995 TO 2003
Figure 1: Applications and Costs of FFF-funded Projects, 1995-2003 (present)
0
200
400
600
800
1000
1200
1400
1995
1996
1997
1998
1999
2000
2001
2002
2003 tot
al
# pro
jects
0
100
200
300
400
500
600
700
cost
s / p
rojec
t [k€
]
# projectsavg. costs
0%
10%
20%
30%
40%
50%
60%
70%
80%
90%
100%19
95
1996
1997
1998
1999
2000
2001
2002
2003 total
shar
e in
tota
l cos
ts [%
]
unspecifiedotherequipmentstaff
Source: FFF; own calculations
The number of annual applications has risen over the past 9 years, from under 1000 in 1995/96 to more than 1200 in 2002 and 2003 (rem.: for 2003, submissions are included until November only). A rising trend can also be seen in the average solicited amount, from under 400 000 € per project in 1995 to al-most 600 000 € in 2002, an annual increase of 6.6 %. In 2003, however, average project size dropped appreciably, to a level last seen in the year 2000.
Project applications show a remarkable change in their cost structure: in the first three years, staff costs accounted for some 80 % of total costs, with equipment and “other costs” amounting to 6 and 14 % re-spectively. Starting in 1998, staff costs dropped sharply, to about 50 %; equipment and other costs roughly doubled their share. Additionally, some 8 % of the solicited amount remained “unspecified”.
11

Figure 2: Approval and funding rates, 1995-2003 (present)
0
10
20
30
40
50
60
70
80
90
100
1995
1996
1997
1998
1999
2000
2001
2002
2003
tota
l
rate
[%]
approval ratefunding ratePV rate
0
10
20
30
40
50
60
70
80
90
100
1995
1996
1997
1998
1999
2000
2001
2002
2003
tota
l
rate
[%]
share of follow-up projectsfollow-up approval ratenew project approval rate
Source: FFF; own calculations
Whereas application numbers and solicited amount both went up, approval rates markedly decreased, from just under 80 % in 1995-97 to about 70 % in 2001-031. Approval rates are, however, quite different for new and for follow-up projects: not surprisingly, follow-ups experience a drastically higher rate of approval, beating new projects by about 20 percentage points. Both types, however, exhibit the same pattern over time.
The share of follow-up projects is quite stable, if somewhat higher in 1999-2003 than in 1995-1998. At 27 % on average, it is also quite high. This can be explained by the FFF’s policy of favouring shorter projects, with a duration of 6-18 months. Longer projects are then financed via follow-up proposals.
Also shown in Figure 2 are two rates pertaining to the funding of approved projects. The first, the fund-ing rate, gives the share of the amount accepted for funding. Funding, however, consists of a mix of 3 instruments: direct (non-repayable) subsidies, (refundable) loans by the FFF, and bank loans, which are guaranteed (and subsidised) by the FFF. As most projects are financed by a mix of non-refundable con-tributions (from the FFF) and refundable loans (either from the FFF or a private bank; cf. Figure 3 be-low), the Present Value of the approved subsidies is smaller than their nominal amount. Consequently, although the funding rate hovers around 45 %, the PV of the funding mix is much lower, at a stable 20-23 % of the approved project costs.
12
1 In fact, the possible funding decisions are not just “approved” and “rejected”; two further types of decision exist: “rejected for lack of funds” and “retracted”. Both outcomes, however, are of only marginal importance: 1.3 % of projects are rejected by the FFF citing funding problems. Even fewer projects are retracted by the applicant: of almost 10 000 applications, only 4 suffered this fate. Therefore, all three types of negative decision are lumped together.
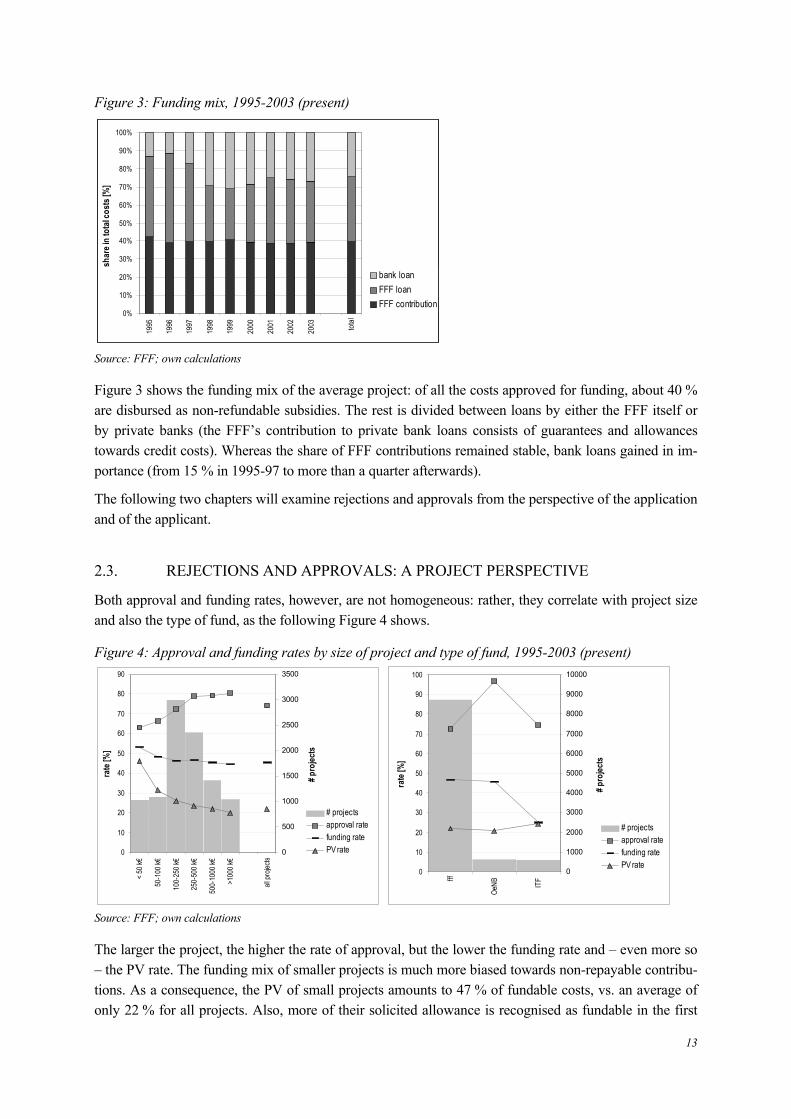
Figure 3: Funding mix, 1995-2003 (present)
0%
10%
20%
30%
40%
50%
60%
70%
80%
90%
100%
1995
1996
1997
1998
1999
2000
2001
2002
2003 total
shar
e in
tota
l cos
ts [%
]
bank loanFFF loanFFF contribution
Source: FFF; own calculations
Figure 3 shows the funding mix of the average project: of all the costs approved for funding, about 40 % are disbursed as non-refundable subsidies. The rest is divided between loans by either the FFF itself or by private banks (the FFF’s contribution to private bank loans consists of guarantees and allowances towards credit costs). Whereas the share of FFF contributions remained stable, bank loans gained in im-portance (from 15 % in 1995-97 to more than a quarter afterwards).
The following two chapters will examine rejections and approvals from the perspective of the application and of the applicant.
2.3. REJECTIONS AND APPROVALS: A PROJECT PERSPECTIVE
Both approval and funding rates, however, are not homogeneous: rather, they correlate with project size and also the type of fund, as the following Figure 4 shows.
Figure 4: Approval and funding rates by size of project and type of fund, 1995-2003 (present)
0
10
20
30
40
50
60
70
80
90
< 50 k
€
50-1
00 k€
100-
250 k
€
250-
500 k
€
500-
1000
k€
>100
0 k€
all pr
ojects
rate
[%]
0
500
1000
1500
2000
2500
3000
3500
# pro
jects
# projectsapproval ratefunding ratePV rate
0
10
20
30
40
50
60
70
80
90
100
fff
OeNB IT
F
rate
[%]
0
1000
2000
3000
4000
5000
6000
7000
8000
9000
10000
# pro
jects
# projectsapproval ratefunding ratePV rate
Source: FFF; own calculations
The larger the project, the higher the rate of approval, but the lower the funding rate and – even more so – the PV rate. The funding mix of smaller projects is much more biased towards non-repayable contribu-tions. As a consequence, the PV of small projects amounts to 47 % of fundable costs, vs. an average of only 22 % for all projects. Also, more of their solicited allowance is recognised as fundable in the first
13

place (at 54 %, their funding rate is higher than the average 46 %). The most expensive applications get rejected only in about 20 % of cases; on the other hand, their subsidies’ PV is less than 20 % of approved costs.
Disaggregation by type of fund shows that projects financed by the OeNB fund are rejected only very rarely. This, however, might be a “statistical artefact”: all projects are put through the same approval process; it is only afterwards that projects are assigned to a specific fund (according to the content of an application). Therefore, the assignment of rejected proposals to the different types of funds might con-ceivably be somewhat arbitrary. ITF funds, however, do exhibit a significant difference: their funding rate is equal to their PV rate. The reason for this is that projects assigned to the ITF fund receive only non-refundable contributions; loans, either from the FFF or from private banks, are not part of their fund-ing mix.
Figure 5: Applications, costs and funding rates by economic activity2, 19983-2003 (present)
0100200300400500600700800900
1000110012001300140015001600
# pro
jects
resp
. avg
.cost
s [k€
]
# projectscosts / project
0102030405060708090
100
economic activity (NACE-code)
rate
[%]
approval ratefunding ratePV rate
Source: FFF; own calculations
According to content, projects are assigned codes for economic activity4. Most projects (20 %) are com-puter-related projects (NACE 72), followed by NACE 29 (machinery and equipment; 16 %). The top 4 activities (which, besides the ones already mentioned, comprise medical, precision, and optical instru-ments and chemicals and chemical products, NACE 33 and 24) account for 52 % of all submitted pro-jects, a share which rises to 67 % for the top 7 and to 75 % for the top 10 activities (in total, 47 different activities were mentioned).
2 For a complete list of 2-digit NACE codes, see Annex A. 3 In 1995, the classification system was changed from BS68 to NACE. However, BS68 codes were obviously still used for project classification
in 1995 and, though less so, in 1996 and 1997. It was only in 1998 that the old BS68 codes seem to more or less vanish from the FFF data base. Consequently, for the part of the analysis dealing with economic activity, we restricted the time frame to the years 1998-2003.
144 Unfortunately, the FFF assignes codes for economic activity only to the project, not to the applicant.

Projects with different activities show a huge variation in size: typical proposals to do with chemicals and chemical products and the manufacture of radio, television and communication equipment and ap-paratus (NACE 24 and 32) ask for more than 1.1 million €, more than double the overall average of 540 000 €. In contrast, projects in the top 3 activities, at under 450 k€, are comparatively low cost pro-jects.
As for approval rates, these show a substantial variation as well. For the less important sectors of activ-ity, this might well be due to the relatively small number of applications (the least numerous activities which are presented separately represent only 10 applications. In this case, a single rejected project re-duces the approval rate by 10 percentage points). More interesting are the relatively low rates of approval for the top 3 activities, and especially for computer-related activities (NACE 72): a reason for the low approval rate for this activity might be that in this field, the boundary between innovations (especially process innovations) and investments is conceivably rather blurred – with the latter not included in the FFF’s task list (probably, unclear distinction between innovation and investment is also behind the be-low-average approval rates of activities #2 and 3, applications for machinery and equipment (NACE 29) and medical, precision, and optical instruments (NACE 33)).
Another reason, of course, might be that the high number of applications in the top-ranking activities allows (and, in way, even forces) the FFF to pick and choose. Figure 6 below examines changes in the structure of applications over time.
15
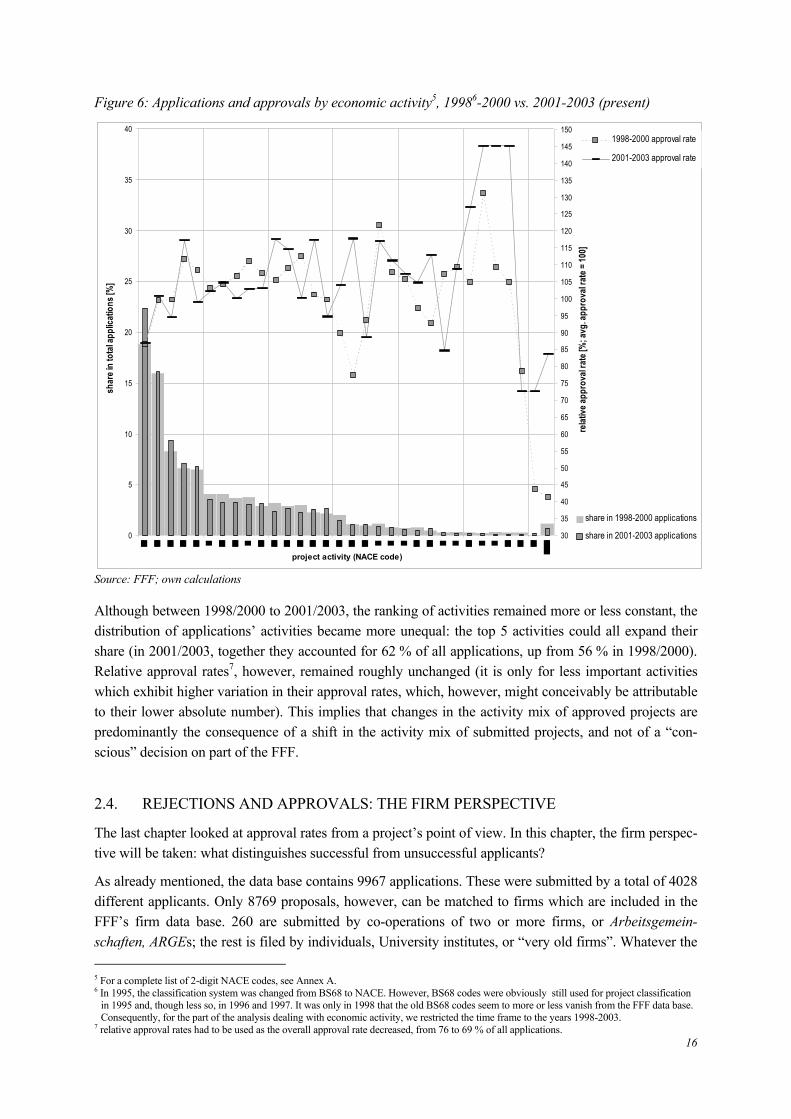
Figure 6: Applications and approvals by economic activity5, 19986-2000 vs. 2001-2003 (present)
0
5
10
15
20
25
30
35
40
project activity (NACE code)
shar
e in
tota
l app
licat
ions
[%]
share in 1998-2000 applications
share in 2001-2003 applications30
35
40
45
50
55
60
65
70
75
80
85
90
95
100
105
110
115
120
125
130
135
140
145
150
relat
ive ap
prov
al ra
te [%
; avg
. app
rova
l rat
e = 10
0]
1998-2000 approval rate
2001-2003 approval rate
Source: FFF; own calculations
Although between 1998/2000 to 2001/2003, the ranking of activities remained more or less constant, the distribution of applications’ activities became more unequal: the top 5 activities could all expand their share (in 2001/2003, together they accounted for 62 % of all applications, up from 56 % in 1998/2000). Relative approval rates7, however, remained roughly unchanged (it is only for less important activities which exhibit higher variation in their approval rates, which, however, might conceivably be attributable to their lower absolute number). This implies that changes in the activity mix of approved projects are predominantly the consequence of a shift in the activity mix of submitted projects, and not of a “con-scious” decision on part of the FFF.
2.4. REJECTIONS AND APPROVALS: THE FIRM PERSPECTIVE
The last chapter looked at approval rates from a project’s point of view. In this chapter, the firm perspec-tive will be taken: what distinguishes successful from unsuccessful applicants?
As already mentioned, the data base contains 9967 applications. These were submitted by a total of 4028 different applicants. Only 8769 proposals, however, can be matched to firms which are included in the FFF’s firm data base. 260 are submitted by co-operations of two or more firms, or Arbeitsgemein-schaften, ARGEs; the rest is filed by individuals, University institutes, or “very old firms”. Whatever the 5 For a complete list of 2-digit NACE codes, see Annex A. 6 In 1995, the classification system was changed from BS68 to NACE. However, BS68 codes were obviously still used for project classification
in 1995 and, though less so, in 1996 and 1997. It was only in 1998 that the old BS68 codes seem to more or less vanish from the FFF data base. Consequently, for the part of the analysis dealing with economic activity, we restricted the time frame to the years 1998-2003.
167 relative approval rates had to be used as the overall approval rate decreased, from 76 to 69 % of all applications.

reason, these projects cannot be analysed from the “firm perspective”. Consequently, they will be omit-ted from the following analysis. These 8769 proposals were submitted by 3138 different firms. Thus, the typical firm applies repeatedly for funding: on average, in 1995 to 2003, each firm applied 2.8 times.
Beneath this average, a huge variability is hidden: 1622 firms were one-time-only applicants. On the other hand, 39 firms submitted more than 20 applications (one firm even boasts 110 proposals). The following Figure 7 shows the statistics.
Figure 7: Repeated Applications, 1995-2003 (present)
3138
396271108
25033
0
656
1622
0
200
400
600
800
1000
1200
1400
1600
1800
2000
all fir
ms>20
11-2
0
8-106-
7
4-5321
# applications
# firm
s / em
ploy
ees p
er fir
m / c
osts
per
pro
ject in
k€
rate
[%]
# firmsemployees / firmcosts / projectapproval ratePV rate
Source: FFF; own calculations
As noted above, more than half of all FFF customer firms have applied only once; including firms which applied twice, this share rises to almost 75 %. Not surprisingly, the number of applications correlates closely with firm size: one-time applicants employ on average 70 people; this number increases to more than 1400 employees in firms with more than 20 applications. Probably more surprisingly, costs per project also correlate quite closely with application numbers: larger firms not only apply more often, they also ask for more money per project. Single applications, on average, amount to 130 000 €; at firms with more than 20 submissions, the average project size is almost 950 000 € (the average price of all projects is 420 000 €). Additionally, the largest firms face above-average approval rates of 80 % vs. 75 % for all projects (although firms with 4 to 20 applications experience even higher rates).
The worst approval rate, at 55 %, is faced by firms with single applications. This, however, seems logi-cal: such firms are smaller, probably younger, and conceivably less R&D intensive. As a consequence, they lack experience in dealing with the FFF (not to mention the possibility that their projects are of somewhat inferior quality).
The only index which unambiguously favours firms with fewer applications is the PV rate: at 23 %, this is above the average of 21.5 %. For firms with more than 20 applications, in contrast, the present value of FFF funding amounts to only 18 % of project costs.
In the light of the last paragraphs, the following Figure 8 offers only little surprising information:
17

Figure 8: Applications and approvals by firm size and age, 1995-2003 (present)
8769
0
10
20
30
40
50
60
70
80
90
100
0-9
10-1
9
20-4
9
50-9
9
100-
249
250-
1000
>100
0
all fir
ms
employees
rate
[%]
0
200
400
600
800
1000
1200
1400
1600
1800
2000
# pro
jects
# firm
s
# projects# firmsapproval ratefunding ratePV rate
8769
0
10
20
30
40
50
60
70
80
90
100
0-2
3-5'
6-10
11-2
5
>25
all fir
ms
firm age
rate
[%]
0
500
1000
1500
2000
2500
3000
# pro
jects
# firm
s
Source: FFF; own calculations
The left diagram shows applications and approvals for different firm size. As the number of applications per firm correlates closely with firm size, approval and funding rates show a pattern which is quite simi-lar to Figure 7: the larger the firm, the higher the approval rate, and the lower the PV rate (though not consistently so). Most projects are submitted by small (<9 employees) and medium-large firms (250-1000 employees), each with a share of 18 %. The other size classes provide between 8 and 12 % of all applications.
Most of FFF’s customers (45 %) are small firms with an average of 1.2 projects each. The largest firms, with almost 17 projects per firm, represent only 2.2 % of all applicants (but submit 14 % of all applica-tions).
The diagram to the right, applications and approvals by firm age, shows a similar picture: the older a firm, the higher the approval rate, but the lower the PV rate. Most projects (30 % of the total) are submit-ted by firms which are older than 25 years; a share which rises to more than half for firms older than 10 years.
The age structure of FFF customers is quite homogeneous8: each age group contains between 15 and 23 % of all applicants. Nevertheless, the average number of projects per firm correlates closely with firm age: start-ups (< 2 yrs old) submitted 1.6 projects each, whereas the oldest firms managed almost 4 ap-plications. Again, this is straightforward: older firms have had more time and/or more experience in submitting proposals; additionally, they tend to be larger than new ones.
18
8 As firm age is defined as a firm’ s age at the time of an application, in this diagram, the total number of firms is larger than in the other dia-grams. The reason for this is double counting: a firm which repeatedly applies for FFF funding can show up in different age groups.

Figure 9: Applications and approvals by firm location 1995-2003 (present)
8769
0
10
20
30
40
50
60
70
80
90
100
Burg
enlan
d
Kärn
ten
Nied
erös
terre
ich
Ober
öste
rreich
Salzb
urg
Steie
rmar
k
Tirol
Vora
rlber
g
Wien
all fir
ms
province
rate
[%]
0
200
400
600
800
1000
1200
1400
1600
1800
2000
# pro
jects
# f
irms
# projects# firmsapproval ratefunding ratePV rate
source: FFF; own calculations
Figure 9 shows the project distribution by geographical location of the applying firm. The provinces with most proposals are Wien and Oberösterreich with 20 and 18 % of all applications, respectively. The few-est proposals, less than 2 %, originate with firms from Burgenland. The variation in the number of pro-jects per firm is not very pronounced and ranges from 2.4 in Niederösterreich to 3.4 in Steiermark. The same holds true for the provinces’ approval and funding rates: both stay reasonably close to their respec-tive Austrian values.
Projects by type of firm show a huge domination of GmbHs (limited companies), which account for 96 % of all proposals. They submit an average of 2.7 projects per firm. AGs (incorporated companies), though comparatively few in number (only 18 FFF customers belong to this type), submitted 228 pro-jects, or almost 13 projects per firm. The other types are of marginal importance: together, they account for less than 1 % of all applications.
19

Figure 10: Applications and approvals by firms’ export share and R&D share, 1995-2003 (present)
8769
0
10
20
30
40
50
60
70
80
90
100
NA
00-
10
10-4
040
-70
70-9
0
90-1
00
all fir
ms
export share [%]
rate
[%]
0
200
400
600
800
1000
1200
1400
1600
1800
2000
# pro
jects
# firm
s
# projects# firmsapproval ratefunding ratePV rate
8769
0
10
20
30
40
50
60
70
80
90
100
00-
22-
55-
1010
-25
>25
all fir
ms
R&D share in turnover [%]
rate
[%]
0
200
400
600
800
1000
1200
1400
1600
1800
2000
# pro
jects
# firm
s
Source: FFF; own calculations
More export-oriented firms are definitely better FFF customers: the higher a firm’s export share, the more project it submits, and the higher the approval rate it faces. The PV rate, however, is inversely re-lated with export share.
The diagram to the right, however, shows a more egalitarian picture. Both approval and PV rates are much more homogeneous. With the exception of previously non-R&D performing firms (R&D share = 0), which get approval for only half of their projects, the approval rate is in the range of 74-81 %. The R&D newcomers, however, face above-average PV rates, second only to firms with R&D rates in excess of 25 %. Most applications per firm can be found in the 2-25 % classes. The reasons seem clear: firms with less than 2 % are certainly not in a position to accommodate high numbers of FFF funded projects, whereas highly research intensive firms, as a tendency, are younger.
20

2.5. REJECTIONS, APPROVALS, AND FUNDING: A MULTIVARIATE APPROACH
In the last chapter, applications and approvals were looked at from a variety of perspectives: size, con-tent, and type of the projects; size, location, age, and type of applying firms. All perspectives, however, were one-dimensional: in what way are applications and approvals different with respect to only a single discriminatory variable?
This is necessarily incomplete: as we have seen, older firms face above-average approval rates. But is this due to their being more mature firms, or is it due to the fact that such firms tend to be bigger – be-cause, as we also have seen, bigger firms also experience higher-than-average rates of approval. Of course, the “true” reason might also be a combination of these two factors.
To disentangle the effects of the various characteristics, pertaining both to a project itself, but also to its submitting firm, a multi-variate approach is called for. This is exactly what will be attempted with the following analysis.
All variables are defined as class variables. For some of the variables, this is straightforward: location and type of firm, for example, cannot be defined otherwise; the same is true for project characteristics such as the type of fund or whether it is a follow-up project or a completely new one. The reason for the classification of continuous variables, such as project size, company turnover, export share, etc. is that their inclusion as class variables allows for a highly “non-linear” response of the dependent variable, i.e. the decision of the FFF whether to approve of a project or not. For example, it might be that small com-panies face higher approval rates than medium companies, but lower rates than large companies. To allow for this response in a continuous setting, the size variable would have to be included in linear and quadratic, possibly even in cubic terms; and even then, the implicit “smooth” response of the decision with respect to the size variable might be a serious mis-specification. Including size as a class variable (e.g., small, medium-small, medium-large, large), though no cure-all, allows for a more flexible re-sponse.
The following Table 2 presents the definitions and descriptive statistics of the class variables used in the multivariate model. The dependent variable in this model is binary: it is 0 for rejected, 1 for approved projects. Accordingly, the model was estimated as a probit model (which among other desirable features restricts simulated values of the dependent variable to fall within the [0,1]-range).
In addition to the binary participation model, a linear model for the PV rate (the ratio of the funding’s present value to total project costs) will be presented.
21

Table 2: Descriptive statistics of model variables, 1998-2003 (present)Variable Description Sum Mean Std. Dev.Granted 1 if project approved, 0 if rejected 4591 0.741 0.438FORTS 1 if follow-up project, 0 if new proje 1801 0.291 0.454DY1998 1 if submitted in 1998 950 0.153 0.360DY1999 1 if submitted in 1999 962 0.155 0.362DY2000 1 if submitted in 2000 1149 0.185 0.389DY2001 1 if submitted in 2001 973 0.157 0.364DY2002 1 if submitted in 2002 1118 0.180 0.385DY2003 1 if submitted in 2003 1047 0.169 0.375DNA01 1 if project activity is NACE01 39 0.006 0.079DNA02 1 if project activity is NACE02 12 0.002 0.044DNA14 1 if project activity is NACE14 22 0.004 0.059DNA15 1 if project activity is NACE15 220 0.035 0.185DNA17 1 if project activity is NACE17 55 0.009 0.094DNA18 1 if project activity is NACE18 16 0.003 0.051DNA19 1 if project activity is NACE19 18 0.003 0.054DNA20 1 if project activity is NACE20 163 0.026 0.160DNA21 1 if project activity is NACE21 38 0.006 0.078DNA22 1 if project activity is NACE22 14 0.002 0.047DNA23 1 if project activity is NACE23 15 0.002 0.049DNA24 1 if project activity is NACE24 430 0.069 0.254DNA25 1 if project activity is NACE25 197 0.032 0.175DNA26 1 if project activity is NACE26 186 0.030 0.171DNA27 1 if project activity is NACE27 172 0.028 0.164DNA28 1 if project activity is NACE28 224 0.036 0.187DNA29 1 if project activity is NACE29 1030 0.166 0.372DNA30 1 if project activity is NACE30 40 0.006 0.080DNA31 1 if project activity is NACE31 255 0.041 0.199DNA32 1 if project activity is NACE32 431 0.070 0.254DNA33 1 if project activity is NACE33 542 0.087 0.282DNA34 1 if project activity is NACE34 227 0.037 0.188DNA35 1 if project activity is NACE35 67 0.011 0.103DNA36 1 if project activity is NACE36 107 0.017 0.130DNA37 1 if project activity is NACE37 6 0.001 0.031DNA45 1 if project activity is NACE45 136 0.022 0.146DNA51 1 if project activity is NACE51 16 0.003 0.051DNA72 1 if project activity is NACE72 1217 0.196 0.397DNA73 1 if project activity is NACE73 36 0.006 0.076DNA74 1 if project activity is NACE74 64 0.010 0.101DNA90 1 if project activity is NACE90 147 0.024 0.152DNAOTHER 1 if project activity is 'other' 57 0.009 0.095DK1 1 if project costs < 50 k€ 625 0.101 0.301DK2 1 if project costs 50-100 k€ 755 0.122 0.327DK3 1 if project costs 100-250 k€ 1956 0.316 0.465DK4 1 if project costs 500-1000 k€ 1461 0.236 0.424DK5 1 if project costs > 1000 k€ 816 0.132 0.338DK6 1 if project costs 50-100 k€ 586 0.095 0.293DF1 1 if application for FFF funds 5396 0.870 0.336DF2 1 if application for OeNB funds 480 0.077 0.267DF10 1 if application for ITF funds 323 0.052 0.222
Variable Description Sum Mean Std. Dev.DAGE1 1 if firm age < 2 yrs 765 0.123 0.329DAGE2 1 if firm age 2-5 yrs 766 0.124 0.329DAGE3 1 if firm age 5-10 yrs 1057 0.171 0.376DAGE4 1 if firm age 10-25 yrs 1557 0.251 0.434DAGE5 1 if firm age > 25 yrs 1992 0.321 0.467DBL1 1 if firm located in Burgenland 100 0.016 0.126DBL2 1 if firm located in Kärnten 469 0.076 0.264DBL3 1 if firm located in Niederösterreich 810 0.131 0.337DBL4 1 if firm located in Oberösterreich 1237 0.200 0.400DBL5 1 if firm located in Salzburg 381 0.061 0.240DBL6 1 if firm located in Steiermark 1023 0.165 0.371DBL7 1 if firm located in Tirol 442 0.071 0.257DBL8 1 if firm located in Vorarlberg 391 0.063 0.243DBL9 1 if firm located in Wien 1344 0.217 0.412DEXP1 1 if firm's export share = 0 % 843 0.136 0.343DEXP2 1 if firm's export share > 0, < 10 % 806 0.130 0.336DEXP3 1 if firm's export share 10-40 % 1272 0.205 0.404DEXP4 1 if firm's export share 40-70 % 1100 0.177 0.382DEXP5 1 if firm's export share 70-90 % 1017 0.164 0.370DEXP6 1 if firm's export share > 90 % 1053 0.170 0.376DFUE1 1 if firm's R&D share = 0 471 0.076 0.265DFUE2 1 if firm's R&D share > 0, <2 % 1273 0.205 0.404DFUE3 1 if firm's R&D share 2-5 % 1403 0.226 0.418DFUE4 1 if firm's R&D share 5-10 % 822 0.133 0.339DFUE5 1 if firm's R&D share 10-25 % 1084 0.175 0.380DFUE6 1 if firm's R&D share > 25 % 1146 0.185 0.388DGF1 1 if firm type is AG 157 0.025 0.157DGF2 1 if firm type is Einzelfirma 5 0.001 0.028DGF4 1 if firm type is GmbH 6012 0.970 0.171DGF5 1 if firm type is KG 19 0.003 0.055DGF6 1 if firm type is OHG 6 0.001 0.031DMA1 1 if firm size is < 10 employees 1277 0.206 0.404DMA2 1 if firm size is 10-19 employees 565 0.091 0.288DMA3 1 if firm size is 20-49 employees 912 0.147 0.354DMA4 1 if firm size is 50-99 employees 673 0.109 0.311DMA5 1 if firm size is 100-249 employees 793 0.128 0.334DMA6 1 if firm size is 250-999 employees 1234 0.199 0.399DMA7 1 if firm size is > 1000 employees 745 0.120 0.325
Source: FFF; own calculations
22

2.5.1 A binary participation model
The model was estimated for applications submitted from 1998 to 2003. The first three years, 1995-1997, had to be discarded due to problems with the correct classification of projects’ economic activity (cf. above). Results of the estimation process are presented in Table 3.
Table 3: Estimation results of the probit model of participation
Dependent Variable: Decision01Method: ML - Binary Probit (Quadratic hill climbing)Included observations: 6199 after adjusting endpoints
Variable Coeff S.E. z-stat prob Variable Coeff S.E. z-stat probconstant -0.366 0.299 -1.225 0.22 2-5 years -0.117 0.072 -1.625 0.10
follow-up? 0.629 0.047 13.399 0.00 5-10 years -0.160 0.070 -2.289 0.021999 -0.088 0.070 -1.252 0.21 10-25 years -0.193 0.067 -2.873 0.002000 -0.200 0.066 -3.030 0.00 > 25 years -0.149 0.073 -2.044 0.042001 -0.280 0.069 -4.070 0.00 Kärnten 0.046 0.160 0.286 0.772002 -0.520 0.066 -7.912 0.00 Niederösterreich 0.151 0.154 0.982 0.332003 -0.346 0.068 -5.088 0.00 Oberösterreich 0.139 0.152 0.915 0.36
1 0.573 0.296 1.936 0.05 Salzburg 0.029 0.162 0.181 0.862 0.369 0.455 0.812 0.42 Steiermark 0.131 0.153 0.857 0.39
14 0.408 0.351 1.163 0.24 Tirol 0.000 0.161 0.002 1.0015 0.789 0.203 3.890 0.00 Vorarlberg -0.042 0.162 -0.262 0.7917 0.690 0.269 2.570 0.01 Wien 0.022 0.151 0.148 0.8818 8.015 ####### 0.000 1.00 0-10 % 0.175 0.070 2.511 0.0119 0.695 0.414 1.677 0.09 10-40 %+ 0.230 0.064 3.578 0.0020 0.781 0.210 3.720 0.00 40-70 % 0.274 0.071 3.828 0.0021 1.008 0.327 3.078 0.00 70-90 % 0.223 0.076 2.912 0.0022 0.796 0.474 1.677 0.09 > 90 % 0.297 0.079 3.778 0.0023 1.033 0.458 2.255 0.02 0-2 % 0.338 0.080 4.209 0.0024 0.649 0.191 3.403 0.00 2-5 % 0.372 0.081 4.584 0.0025 0.599 0.204 2.929 0.00 5-10 % 0.490 0.087 5.617 0.0026 0.777 0.208 3.730 0.00 10-25 % 0.436 0.082 5.339 0.0027 0.463 0.211 2.195 0.03 > 25 % 0.536 0.081 6.647 0.0028 0.534 0.200 2.676 0.01 Einzelfirma -8.334 ####### 0.000 1.0029 0.478 0.180 2.650 0.01 GmbH -0.296 0.153 -1.934 0.0530 0.434 0.279 1.552 0.12 KG -0.391 0.341 -1.146 0.2531 0.512 0.197 2.603 0.01 OHG 0.069 0.640 0.108 0.9132 0.359 0.190 1.894 0.06 10-19 0.299 0.071 4.237 0.0033 0.453 0.185 2.448 0.01 20-49 0.524 0.067 7.809 0.0034 0.422 0.204 2.070 0.04 50-99 0.456 0.077 5.964 0.0035 0.648 0.264 2.450 0.01 100-249 0.496 0.079 6.260 0.0036 0.516 0.221 2.335 0.02 250-999 0.434 0.077 5.636 0.0037 0.553 0.563 0.981 0.33 > 1000 0.231 0.087 2.666 0.0145 0.534 0.211 2.533 0.0151 1.123 0.491 2.285 0.02 McFadden R-squared 0.12872 0.361 0.179 2.015 0.0473 0.792 0.297 2.667 0.01 Obs with Dep=0 1608 Total obs 619974 0.338 0.255 1.325 0.19 Obs with Dep=1 459190 0.830 0.213 3.902 0.00
50-100 k€ -0.064 0.078 -0.827 0.41100-250 k€ 0.009 0.066 0.137 0.89250-500 k€ 0.025 0.069 0.356 0.72
500-1000 k€ 0.008 0.077 0.107 0.91>1000 k€ 0.030 0.084 0.362 0.72
OeNB 0.910 0.112 8.117 0.00ITF 0.340 0.091 3.752 0.00
coefficient value significant at 5% level
decis
ion ye
arac
tivity
of pr
opos
ed pr
oject
(2-d
igit N
ACE-
code
)pr
oject
costs
type of fund
firm ag
efirm
base
d in .
..ex
port
shar
e
coefficient significant at 10% level
R&D
shar
e in
turno
ver
firm ty
pefirm
size
(#
emplo
yees
)
Source: FFF; own calculations
23

The fit of the model, at a (McFadden-)R2 of 0.13, is not overwhelming, although a majority of coeffi-cients is significantly different from zero at least at the 10 %-level 9,10.
Coefficients have to be interpreted as the effects of a project’s structure from the (virtual) “standard pro-ject” implied by the model specification: this standard project has all characteristics which are NOT ex-plicitly included in the model. Therefore, the standard project is a new project, submitted in 1998, pur-sues some “other activity”, and asks for less than 50 000 € from FFF funds. The submitting firm is a start-up (less than 2 years old), is located in Burgenland, and has zero export share. Previous R&D rates are zero, and is an AG with less than 10 employees.
Some of the coefficients give rise to a revision of the results from one-dimensional analysis: approval rates, for example, seem not to depend on the costs of the submitted project, despite earlier result indicat-ing such a dependency (cf. Figure 4). One of the reasons that small projects are more likely to be rejected is that only 8 % of them are follow-up projects, whereas for other projects, this share is 29 % (Recall that follow-up projects face significantly lower rejection rates than new projects, cf. Figure 2). Also, the share of applications from computer-related activities (NACE 72), at 25 %, is higher than the respective over-all share of 19 %. This attribute also lowers the chances of approval.
As it is, the parameter values – aside from their sign – are hard to interpret: a value of 0.63 for the fol-low up-dummy does not imply that such a project faces chances which are 63 %-points better than the chances of a new project. Such “percentages” have to be calculated by simulations. The following Table 4 gives the results of just such an exercise.
The decision year clearly makes a difference: except for 1999, all other year dummies are significantly negative, implying rising rejection rates (in 2002 and 2003, approval rates were 17 resp. 12 %-points less than in the benchmark year of 1998). As for the activity dummies, all of them exhibit positive signs, most of them significantly so. This means that the benchmark activity (“other activity”) faces the least chances of approval. Differences are between 13 and 40 % (as a tendency, at the upper end of this range activities with fewer applications can be found). As already mentioned, computer-related activities (NACE 72, with a share of 19 % of applications the single most important activity), at only 14 %, are at the lower end of this range.
Contrary to the one-dimensional results, project costs exert only small and insignificant influence on the decision. Both other types of fund, however, OeNB and ITF, offer significantly higher approval rates than the standard FFF fund (although caution should be taken in this interpretation: all three types of funds are subject to the same procedure. Projects do not even apply for a specific fund; rather, the type of fund is assigned after the decision process. In this light, the estimated differences between funds are probably spurious).
As for the applicant firm, being a start-up (less than 2 years old) is an advantage: applications from other firms are rejected more often (their approval rates are 4-7 % lower). The geographical location, however, does not make a significant difference (all coefficients are statistically undistinguishable from zero). Export orientation and (prevoius) R&D activities are both rewarded by higher approval rates: non-R&D performing firms are distinctly more often rejected than other firms, as are, though to a smaller extent, 9 A cautonary remark: it would be wrong to interpret the coefficients causally. For example, it would not be correct to say that as the dummy
AGE30m has negative sign, the fact that a coordinator is younger than 30 years causes her project to face worse chances than if the coordinator were in her fourties, say. The correct interpretation would be simply that young coordinators typically submit proposals which get rejected more often. This CAN be brought about by the coordinator’s youth, of course, but also by some other fact: maybe young coordinators are not experi-enced enough to formulate winning projects. The model is not in a position to distinguish between these two (and possibly other) reasons for rejection. In this sense, the estimated differences are EX-POST rather than EX-ANTE.
24

non-exporting firms. The type of firm is not a significant influence; most firms, however, are GmbHs: they account for some 97 % of all applications (AGs provide a further 2 %, the insignificant rest is sub-mitted by firms of some other type).
The influence of firm size is more ambiguous: although all other firms face higher approval rates than the benchmark (0-9 employees), both small (10-19) and very large firms (> 1000 employees) are rejected somewhat more often than medium small to medium large firms.
Table 4: simulated percentage difference in approval rates vis a vis the “benchmark project”11
Variable% difference inapproval rates Variable
% difference inapproval rates
follow-up? 24.7 2-5 years -4.3 1999 -3.2 5-10 years -5.8 2000 -7.1 10-25 years -6.9 2001 -9.8 > 25 years -5.4 2002 -16.9 Kärnten 1.7 2003 -11.9 Niederösterreich 5.8
1 22.5 Oberösterreich 5.3 2 14.4 Salzburg 1.1
14 15.9 Steiermark 5.0 15 30.7 Tirol 0.0 17 27.0 Vorarlberg -1.6 18 64.3 Wien 0.8 19 27.2 0-10 % 6.7 20 30.4 10-40 %+ 8.9 21 38.2 40-70 % 10.6 22 30.9 70-90 % 8.6 23 39.1 > 90 % 11.5 24 25.4 0-2 % 13.2 25 23.5 2-5 % 14.5 26 30.2 5-10 % 19.2 27 18.1 10-25 % 17.1 28 21.0 > 25 % 21.0 29 18.7 Einzelfirma -35.7 30 17.0 GmbH -10.3 31 20.1 KG -13.3 32 14.0 OHG 2.6 33 17.7 10-19 11.6 34 16.5 20-49 20.6 35 25.4 50-99 17.9 36 20.3 100-249 19.4 37 21.7 250-999 17.0 45 21.0 > 1000 8.9 51 41.8 72 14.1 73 30.8 74 13.2 90 32.1
50-100 k€ -2.4 100-250 k€ 0.3 250-500 k€ 0.9
500-1000 k€ 0.3 >1000 k€ 1.1
OeNB 35.0 ITF 13.2
coefficient significant at 10% level
R&D
shar
e in
turno
ver
firm ty
pefirm
size
(#
emplo
yees
)
coefficient value significant at 5% level
decis
ion ye
arac
tivity
of pr
opos
ed pr
oject
(2-d
igit N
ACE-
code
)pr
oject
costs
type of fund
firm ag
efirm
base
d in .
..ex
port
shar
e
Source: FFF; own calculations
10 A re-estimation of the model with only significant variables included yielded only marginally different coefficients.
25
11 All percentage values must be interpreted “ceteris paribus”: a simple addition of a certain combination of variables is not permissible, because the probit model is NOT linear in its parameters! The effect of a certain combination would again have to be simulated.

2.5.2 A linear funding model
The last chapter aimed at disentangling the influences which firm and project characteristics exert on an application’s probability of acceptance, the approval rate. In this chapter, a closer look will be taken on a specific attribute of accepted projects, the PV rate: the ratio of the present value of FFF’s contributions to the total costs of an approved project. The PV rate is substantially lower than the funding rate (the ratio of FFF funding to total costs, typically 50 or 60 %, depending on the type of firm): as most projects are financed by a mix of non-refundable contributions (from the FFF) and refundable loans (either from the FFF or a private bank; cf. Figure 3 above), the Present Value of the approved subsidies is smaller than their nominal amount. The share of the non-refundable part depends positively on the FFF’s assessment of a project’s riskness and technological “new-ness” and negatively on economic potential.
The structure of this model is similar to the participation model: it uses the same design matrix on which to regress the dependent variable. However, in this case the independent variable is no longer a binary 0/1-variable (approval/rejection) but rather a continuous variable, the PV rate (defined as 100*PV/total costs). Accordingly, the model can be estimated using standard linear OLS. Here, interpretation is straightforward: the coefficients can be interpreted as the difference (in percentage points) in PV rate vis a vis the “benchmark project”, which is the same as above: it is a new project, submitted in 1998, pur-sues some “other activity”, and asks for less than 50 000 € from FFF funds. The submitting firm is a start-up (less than 2 years old), is located in Burgenland, and has zero export share. Previous R&D rates are zero, and is an AG with less than 10 employees.
The results of the estimation are presented in Table 5 below. With an R2 of 0.25, the estimation shows satisfactory fit. Most of the coefficients are significant at least at the 10 % level.
Interestingly, although the participation model shows follow-up project to exhibit appreciably larger approval rates, follow-ups seem to face significantly lower PV rates, of about -2.5 %. Again contrary to the tendencies in approval rates, the PV rate seems to steadily rise over time: in 2003, it was a good 3 % higher than in the benchmark year of 1997.
The highest PV rates seem to be granted for projects in NACE activities 37, 14, 23, and 73. But as these activities are rather “rare” (each of these 4 activities represents less than 0.6 % of all projects), statisti-cally this result might be less than solid.
Larger projects face uniformly higher PV rates, by a margin of some 1 to 2 %, than small projects, whereas firm age does not seem to make any difference (contrary to the one-dimensional analysis, where the PV rate seems to be inversely correlated with firm size, cf. Figure 8).
A clear pattern can be seen with respect to firm size: the larger a firm, the lower its project’s PV rates (firms with more than 1000 employees are confronted with an almost 3 % lower PV rate than the small-est firms). A similar though less regular pattern applies to export and R&D share: the higher a firm’s export share (or its R&D share), the lower the PV rate of its projects (for both characteristics, this ten-dency roughly mirrors approval rates: whereas approval rates tend to rise with export and R&D shares, PV rates fall).
Although a firm’s location does not seem to bear significantly on its approval rates (see above), it seems to influence PV rates: all other provinces exhibit higher PV rates than the benchmark Burgenland, three of them significantly so (projects by Styrian firms by more than 3 %).
26

Table 5: Estimation results of the OLS model of the funding share (present value of funding as % of total project costs)
Dependent Variable: PV funding/Total Project Costs*100Method: Least SquaresIncluded observations: 5164 after adjusting endpoints
Variable Coeff S.E. z-stat prob Variable Coeff S.E. z-stat probconstant 41.67 2.49 16.72 0.000 2-5 years 0.87 0.58 1.50 0.135
follow-up? -2.38 0.32 -7.54 0.000 5-10 years 0.65 0.56 1.16 0.2451999 0.88 0.51 1.74 0.082 10-25 years 0.38 0.53 0.71 0.4752000 0.98 0.49 2.00 0.046 > 25 years 0.65 0.56 1.16 0.2472001 1.90 0.52 3.69 0.000 Kärnten 0.77 1.24 0.62 0.5362002 2.81 0.50 5.61 0.000 Niederösterreich 2.75 1.19 2.31 0.0212003 3.61 0.52 6.98 0.000 Oberösterreich 1.88 1.18 1.60 0.110
1 7.56 2.40 3.15 0.002 Salzburg 0.95 1.27 0.75 0.4542 11.82 4.18 2.83 0.005 Steiermark 3.42 1.18 2.89 0.004
14 13.86 2.95 4.69 0.000 Tirol 2.22 1.26 1.76 0.07915 7.33 1.82 4.02 0.000 Vorarlberg 0.57 1.27 0.45 0.65117 4.14 2.19 1.89 0.059 Wien 2.67 1.17 2.27 0.02318 2.16 3.12 0.69 0.488 0-10 % -1.77 0.59 -2.98 0.00319 3.23 2.98 1.08 0.278 10-40 %+ -1.64 0.54 -3.01 0.00320 9.26 1.87 4.94 0.000 40-70 % -2.33 0.58 -4.00 0.00021 3.52 2.37 1.48 0.138 70-90 % -2.06 0.62 -3.31 0.00122 6.87 3.27 2.10 0.036 > 90 % -2.11 0.62 -3.38 0.00123 11.94 3.19 3.74 0.000 0-2 % -0.47 0.73 -0.65 0.51524 3.67 1.74 2.11 0.035 2-5 % -2.18 0.72 -3.00 0.00325 4.77 1.84 2.60 0.009 5-10 % -1.81 0.76 -2.39 0.01726 4.16 1.84 2.27 0.024 10-25 % -1.96 0.74 -2.65 0.00827 5.65 1.88 3.01 0.003 > 25 % 0.32 0.73 0.45 0.65528 3.45 1.82 1.90 0.058 Einzelfirma -28.49 10.22 -2.79 0.00529 3.44 1.69 2.03 0.043 GmbH -21.09 1.06 -19.97 0.00030 2.30 2.45 0.94 0.349 KG -11.30 3.03 -3.73 0.00031 2.86 1.80 1.59 0.113 OHG -14.67 4.34 -3.38 0.00132 3.70 1.75 2.11 0.035 10-19 -0.50 0.61 -0.81 0.41633 3.43 1.73 1.98 0.047 20-49 -0.57 0.54 -1.05 0.29434 3.41 1.84 1.86 0.063 50-99 -1.62 0.62 -2.62 0.00935 4.04 2.16 1.87 0.062 100-249 -1.42 0.62 -2.28 0.02236 5.18 1.97 2.63 0.009 250-999 -2.84 0.61 -4.61 0.00037 17.46 6.08 2.87 0.004 > 1000 -2.79 0.68 -4.10 0.00045 8.51 1.90 4.48 0.00051 8.64 3.19 2.71 0.007 R-squared 0.24772 4.12 1.70 2.43 0.015 Total Observations 516473 10.26 2.43 4.21 0.00074 6.84 2.25 3.04 0.00290 9.38 1.89 4.95 0.000
50-100 k€ 0.95 0.61 1.56 0.118100-250 k€ 1.76 0.52 3.40 0.001250-500 k€ 1.71 0.54 3.19 0.001
500-1000 k€ 1.90 0.60 3.20 0.001>1000 k€ 1.55 0.64 2.42 0.016
OeNB -0.88 0.53 -1.67 0.095ITF 0.67 0.73 0.92 0.360
R&D
shar
e in
turno
ver
firm ty
pefirm
size
(#
emplo
yees
)firm
age
firm ba
sed i
n ...
expo
rt sh
are
decis
ion ye
arac
tivity
of pr
opos
ed pr
oject
(2-d
igit N
ACE-
code
)pr
oject
costs
type of fund
coefficient significant at 10% level coefficient value significant at 5% level
Source: FFF; own calculations
27

3 Input Additionality
3.1. WHAT IS THE PROBLEM?
The main problem which shall be addressed in this section is the additionality (or, more precisely, the input additionality) of R&D subsidies: do public contributions to private research boost total private R&D expenditures - and if so, do they boost them by an amount which is larger than the amount of taxpayers’ money which was used in this way?
Besides input additionality, there are other concepts of “additionality” as well, notably output additionality (what is the effect of the subsidies research on a firm’s turnover, profit, etc.) and behavioural additionality (in how far does the existence and availability of public subsidies alter firms’ research decisions). In the first part of this section, however, only the question of input additionality will be addressed. Moreover, input additionality will be defined primarily in a con-temporaneous way: what is the immediate effect of a subsidy on R&D expenditures? For reasons to do with data availability, the longer term (how total R&D expenditures are influenced by subsi-dies in the long run) will not be dealt with.
The chapter starts out with some brief (and rather non-technical) theoretical considerations about input additionality, followed by a chapter on the data used for its estimation. The main chapter presents the model and estimation results.
3.2. THEORETICAL CONSIDERATIONS
It is important to bear in mind that the level of R&D expenditures is the result of an internal deci-sion process within in the firm; so are the reactions to R&D subsidies. Therefore, subsidies do not (or only partially) influence R&D directly, but rather indirectly: for the firm as a whole, the sub-sidy implies an outward shift of the budget constraint. The allocation of the additional funds within the firm, then, is subject to considerations involving “marginal benefit”. Therefore, the effect of the subsidy on own R&D expenditures depends on many (internal and external) circum-stances.
The following Figure 11 presents possible reactions of own R&D expenditures to a subsidy.

29
Figure 11: Effects of R&D Subsidies on Total R&D Expenditures 12
full crowding out
0
2
4
6
8
10
12
-2 -1 0 1 2 3 4time
leve
l of t
otal
R&D
R&D subsidy
private R&D
level of "counterfactual" R&D
no influence on private R&D
0
2
4
6
8
10
12
-2 -1 0 1 2 3 4time
leve
l of t
otal
R&D
R&D subsidy
private R&D
level of "counterfactual" R&D
partial crowding out
0
2
4
6
8
10
12
-2 -1 0 1 2 3 4time
leve
l of t
otal
R&D
R&D subsidy
private R&D
level of "counterfactual" R&D
crowding in
0
2
4
6
8
10
12
-2 -1 0 1 2 3 4time
leve
l of t
otal
R&D
R&D subsidy
private R&D
level of "counterfactual" R&D
Full crowding out occurs when firms perceive the subsidy as “windfall gains”: in the face of a subsidy, firms do not change their R&D plans, but rather use the subsidy to reduce their own spending13.
Partial crowding out occurs if firms raise their total R&D expenditures, but by less than the amount of the subsidy. This is probably the likeliest effect for firms which are not “liquidity con-strained”, meaning that their R&D plans are not kept down by (external) budget constraints (e.g., the inability to get bank credit). In the presence of liquidity constraints, a possible reaction to a subsidy might be an unchanged level of own R&D expenditures: the firm would like to do more R&D than it is able to afford because of banks’ unwillingness to finance it. In this case, the firm would use the subsidy to extend total research by the full amount of the subsidy. If, additionally, the fact that the firm managed to secure a subsidy somehow results in a loosening of the liquidity constraint (if, say, banks perceive the grant as a positive signal, a “seal of quality”, which leads to an extension of the credit line), a result might be a crowding in.
Reasons for crowding in might also be found in the internal decision process. When a firm allo-cates its total budget to its different departments (marketing, production, research,…), the shares each department is awarded is the result of an internal “struggle” between departments. If, again, the R&D grant acts as a stamp of approval, this might improve the research department’s bargain-ing power, resulting in a larger budget share than would otherwise have been attainable.
12 For simplicity, the level of the counterfactual R&D expenditures (i.e., those expenditures which would have been observed in the
absence of any subsidy) is held constant over time 13 In the context of the present analysis, “more than full” crowding out can be ruled out: it would imply that firms reduce their own R&D
expenditures by more than the amount of the subsidy; total R&D spending (own expenditures + subsidy) would fall. This has been demonstrated in only a few very special cases, notably the SEMATECH program., which was set up in the 1980s to co-ordinate the research efforts of US-american semiconductor firms in order to counter the “Japanese menace”. By reducing duplicate research, this programme seems to have had a (significant) negative influence on total R&D expenditures on the part of participating firms (see Irwin and Klenow, 1995).

30
3.2.1 Typical results: a quick literature survey
The econometric evidence of the substitutability or complementarity effects of public R&D fund-ing is very inconclusive (following David et al. (2000), “substitutability” is taken to imply (even partial) crowding out; “complementarity” implies crowding in).
The empirical evidence on the effects of public subsidy is rather limited consisting of various ‘ad-ditionality studies’ with different methodological approaches (cf. David et al., 2000). However, to be able to provide a common background only the firm level studies are mentioned. One can think of, among others, Czarnitzki and Fier (2001), Meeusen and Janssens (2001), Lach (2000), and Irwin and Klenow (1996), which extend the important work of David et al. (2000).
The comparison of the company-level studies indicates the difficulties of measuring leverage ef-fects: roughly half of the studies indicate complementarity and substitution respectively. An inter-esting difference, though, can be observed between European and US-american studies.
Table 6 shows the results of the 18 econometric studies split into European and US studies. The difference is highly visible. The total of studies with substitution effects is 7 whereof 6 are studies analyzing US data and only one is a European study. The contrary is the case with complementar-ity of public R&D funding, where 5 out of 7 studies comprise data from European countries. Re-ferring to David et al. (2000) this could be partly due to the fact that US studies very often meas-ure the impact of government contract R&D on private R&D spending, whereas in Europe firms get government grants and loans instead of direct R&D contracts.
Table 6: Econometric results, geographically differentiated
study results substitutability complementarity mixed resultsUSA 6 2 3Europe 1 5 1Total 7 7 4
It has to be noted, though, that the firm-level studies employ different methods and look at differ-ent sets of data at different periods of time, thus are not strictly comparable.
As to the size of the additionality effect14, the studies in the survey exhibited a wide range of esti-mated values: this ranges from –6.5 (implying that an additional monetary unit of subsidies leads to a reduction of own R&D expenditures to the tune of 6.5 monetary units) to +8. Both extreme values look implausible: indeed, from the theoretical exposition above, a range of -1 (full crowd-ing out) to, maybe, +2 or +3 seems more appropriate. Indeed, the -6.5 are the results of a study by Toivanen and Niinen (1998), in which they estimated additionality to be between -6.5 and +4.0, depending on firm type and specification15. The only other study to find more than full crowding out, at -2, is the SEMATECH-study by Irwin and Klenow (1996). In this case, the large negative effect seems more plausible16, as SEMATECH in essence constituted an R&D consortium: mem-ber firms pooled part of their R&D efforts. As this construction allowed for more efficient R&D in
14 Numerical values for the additionality effects, in the sense that “1 unit of subsidies leads to x units of additional own R&D expendi-
tures”, could not be provided for all papers; David et al. (2000) do list additionality effects for most of the papers in their survey, but they included this effect as an elasticity, which is not very informative (the net effect is hard to estimate if the result is that “an addi-tional 1 % of subsidies results in an additional 0.07 % of own R&D expenditures”)
15 Summing up, they conclude that “there is additionality for at least some firms” 16 Although their study drew some heavy criticism for comparing large firms within the SEMATECH consortium with small firms
outside the consortium, thereby implying problems with selection bias.

31
the sense of a prevention of some duplicate R&D, the “fuller than full” crowding out could be the result of this increased efficiency.
Closest to full crowding out, at a reduction in own R&D expenditures of 82 cents for every dollar of R&D subsidies, came the study of the Small Business Innovation Research program (SBIR) by Wallsten (2000). His conclusion was that SBIR subsidies mainly financed R&D projects which would anyway have been undertaken by the funded firms, because the funded projects were highly successful in commercial terms.
Most other studies in the survey exhibited modest-to-fair amounts of crowding in, of between +0.1 to some +2.5 of additional own R&D expenditures for every unit of subsidies. The extreme value of +7 was estimated in a study of 86 Italian firms by Antonelli (1989).
3.3. THE DATA BASE
The data base was provided by the FFF17. It comprises two parts: the first part contains informa-tion on the 3138 firms which applied (whether successfully or not) for FFF-funding during 1995 and September of 2003. The second part consists of information on the 8769 projects for which applications were filed during the aforementioned period.
The firm level data contain information which has to be provided when submitting an application. This includes general firm characteristics:
Turnover, cashflow, exports, number of employees, year of foundation, legal form, and location
Besides, R&D specific variables are collected:
R&D expenditures and R&D personnel
This information has to be provided for the three years prior to the application of a project. After the submission of the project, no further data are collected on the firm level.
On the project level, the data include:
classification of the project according to the NACE-definition of economic activity, planned duration of the project, planned project costs (disaggregated into personnel, equipment, other), and, if appropriate, a reference to the original project (for applications requesting continued funding for longer projects).
For successful applications, additional data are included:
time period for which funding is granted (for longer projects, funding is typically not granted for the whole period. After the approved funding period, an application for con-tinued funding has to be submitted), the total amount of funding (nominal and present value), and the “funding mix”.
The last point necessitates some explanation: typically, funding is granted to the tune of 50 % of a project’s costs18 (60 % in some cases). So, the nominal amount of funding is 50 (or 60) %. Most projects, however, are financed by a mix of non-refundable contributions (from the FFF) and re-fundable loans (either a subsidised loan from the FFF or a business loan from a private bank, in
17 The authors would like to thank Mag. Klaus Schnitzer and DI.Mag. Reinhard Zeilinger from the FFF for their co-operation. 18 These are “reviewed” costs: it is not necessarily the amount which the applicant asked for in his proposal. Rather, it is the costs which
are “negotiated” between the applicant and the FFF.

32
which case the FFF’s contribution consists in a debt guarantee or in allowances towards the loan’s annuities, or both); together, these finance instruments amount to the aforementioned 50 % of project costs. Therefore, the present value (PV) of the approved subsidies is smaller than their nominal amount. The share of the non-refundable part depends positively on the FFF’s assessment of a project’s riskiness and technological “new-ness” and negatively on economic potential. On average, the PV of funding represents 22 % of total project costs (or about 47 % of nominal subsi-dies). In all of the analyses, it is the reaction of R&D expenditures to this PV which will be of interest, not the reaction to the nominal amount.
From this description, two problems associated with this data base should be obvious. The first one has to do with the different periodicity of firm level and project level data: whereas the former contains (discrete) annual data, the latter is based on “continuous time”: a project can start and end at any day (or, rather, month) of the year. To solve this discrepancy, the subsidies’ PV is propor-tionally distributed over the approved funding period: for example, if the funding period starts in November of 1997 and ends in June of 1999, thus spanning 20 months, 10 % (i.e., 2/20) of total PV are counted as “funding in 1997”, 60 % (=12/20) are assigned to 1998, leaving 30 % (=6/20) for 1999. This assumption of a linear deduction is certainly not “realistic” in the sense that firms use up their research funds in this linear fashion. However, given our ignorance about the “true” course of each project, this seemed to be the best solution (and it is certainly more realistic than simply allotting the whole amount to, e.g., the first project year).
The second problem is harder to solve: it has to do with the fact that from the way the firm level data are collected, firm level data and project level data cover completely separate periods: the firm level data span the three years prior to the project, leaving the period when the firm actually receives funding completely uncovered - not a very promising situation to start from when trying to estimate the effect of funding on the firms’ total R&D expenditures.
To solve this paradox, we have to rely on firms which have repeatedly applied for funding. For such firms, overlapping time series of both R&D and funding data might be constructed in the following way: say, a firm had applied for funding in 1997. This would imply that this firm had to report company statistics for the years 1994-1996. If this were the last application this particular firm had made, it would be the end of the story. If, on the other hand, this firm again approached the FFF in, say, the year 2000, the company statistics for the years 1997-1999, which the firm would have to report for the new application, could be used to obtain the information necessary for the evaluation of the project applied for in 1996; in an athletic analogy, this might be termed “relay method”.
Figure 12: Constructing time series by the „Relay method“
<- a
pplic
atio
n
<- a
pplic
atio
n
<- a
pplic
atio
n
<- a
pplic
atio
n
<- a
pplic
atio
n
<- a
pplic
atio
n
X X X X X X X X X X X X
1 2 3 4 5 6 7 8 9 10 11 12 13 14 15 16 17 18time -->
X ... data available
Firms with repeated applications to the FFF are quite numerous: on average, each firm submitted almost 3 projects. The following Figure 13 shows a histogram of such “repeat offenders”

33
Figure 13: Number of firms by number of applications to the FFF, 1995-2003
39627110825
0330
656
1622
0
200
400
600
800
1000
1200
1400
1600
1800
2000
>20
11-2
0
8-106-
7
4-5321
# applications
# firm
s
Source: FFF; own calculations
Clearly, all 1600 firms (representing one half of all firms) which only applied once are “lost” for this analysis19. Unfortunately, firms with repeated applications also do not automatically qualify for inclusion in this analysis: their applications have to be “close enough” to provide for the re-quired overlap of firm- and funding data (as an example: suppose in 1996 a firm submitted and started a project which lasted for one year. If this firm then came back with another application in 2002, this would be too late: firm level data would be available for 1993-1995 and then again from 1999-2001, whereas funding data would cover the years 1996 and 1997).
Applied to the FFF data base, this method produces a total of some 1100 firms, for which contem-poraneous firm- and project data are available for at least one year (for different reasons, the sam-ple of firms actually included in the analyses will be smaller still).
3.4. THE MODEL
Given the type of data as described in the previous section (time series data on quite a large num-ber of individual firms), a logical framework for the estimation of the effect of FFF subsidies on firms’ R&D expenditures is given by panel regressions. Under the assumption that (known and unknown) characteristics influence firms’ R&D behaviour in a firm-specific but time-invariant way, incorporating firm fixed effects (i.e., a different constant for every cross-section unit) allow for the implicit modelling of these characteristics. This is quite convenient: although the data base contains information on some firm characteristics (turnover, export share, employees), most vari-ables which might exert some influence are missing (most notably, firms’ sector of activity). In the fixed-effects framework, such unobserved but time-invariant variables should be captured by the inclusion of firm-specific fixed effects.
Additionally, this model allows for every firm to act, in a way, as its own “control firm”, in effect providing information on the firm’s behaviour vis a vis different levels of support. This allows to overcome a major problem of the data base, the almost complete absence of firms which have some R&D activities but which did not get any subsidy.
19 This is a pity because such “one-timers” conceivably represent a type of firm - those who only occasionally perform R&D - whose
reaction to R&D subsidies is especially interesting. To facilitate future analyses, the FFF might contemplate to collect firm level data not only before the start of a project, but at the end as well.

34
Given the enormous range of firms in the database (from “owner-only” firms to companies with a couple of thousand employees), adequate correction for any potential (non-time invariant) size-effect must certainly accounted for. It was found that a polynomial in annual turnover (averaged over two years) seems to provide this correction. Using the number of employees instead of an-nual turnover yielded roughly the same results; however, as turnover is the one variable which is available for every firm (data on employees were missing in about 5 % of firm-years), turnover was used in the final specification20. Once size was “sufficiently” provided for, the inclusion of additional variables (employees, export share) seemed not to make much difference to the estima-tion results.
To allow for the disregard for the calender year of the typical R&D project, lagged R&D expendi-tures are included. Lastly, year dummies were included to account for the panel’s “unbalanced-ness”: as data are not available for all firms and all years, each year’s data comprise a slightly different sample of firms. As a tendency, the larger the firm, the more data-years are available.
The model, then, can be written as
tiit
k
ktitiktititi
Dt
turnoverturnoversubsidiesDRDR
,
2002
1998
4
11,,,1,, )2/)((&&
εγ
βαλ
+++
++++=
∑
∑
=
=−−
The model was estimated for the years 1997-2002. Although project data were available since 1995, the years 1995 and 1996 were not used in the estimation process. The reason for this is the fact that the typical period for which FFF funding is provided is about 18 months. Therefore it cannot be ruled out (in fact, it is more than likely) that pre-1995 funding persists in the following years. To prevent this unknown source of funding from “contaminating” the estimates, the first two years were dropped.
The final sample comprised 495 firms. These were selected according to the following criteria:
- a minimum of 4 observations in 1997-2002, to preserve the “time-series” flavour of the panel regression
- no “problematic” values of their R&D expenditures, defined as an amount of R&D ex-penditure which is less than the contemporaneous amount of (approved) project costs as recorded in the data base.
- no “problematic” values of annual turnover. A few firms reported sales which amount to more than a million euro per employee. Although such values are not strictly impossible, they were interpreted as indicators of possibly erroneous data (the cut-off was actually set at 500 000 euro/employee).
- included were only firms which consistently reported positive R&D expenditures. The reason behind this restriction is the idea that habitual R&D performers react differently to R&D subsidies than intermittent performers: as an extreme case, suppose a firm had per-formed only a single R&D project which was supported by the FFF. This firm, then,
20 Cashflow, which also would have been available, was disregarded. The reason for this is that quite a few definitions of cashflow are in
use; it was not clear whether all firms used the same one. Additionally, as cashflow is an accounting concept similar to profits, R&D
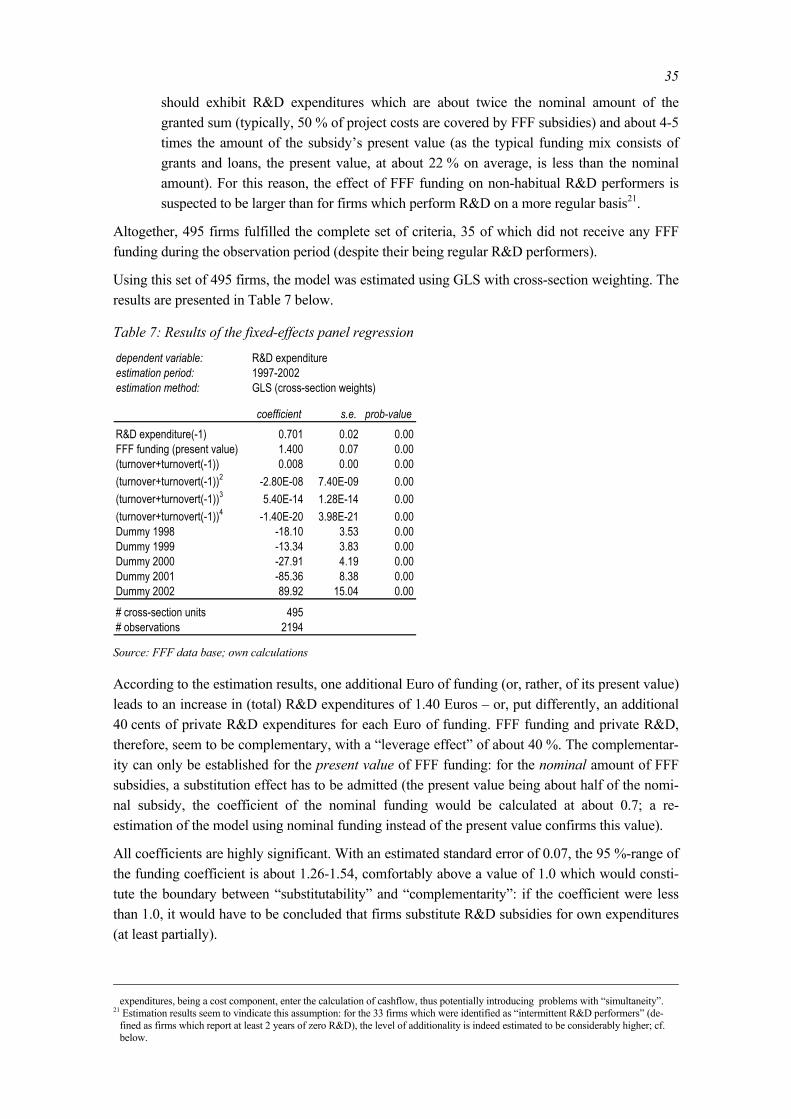
35
should exhibit R&D expenditures which are about twice the nominal amount of the granted sum (typically, 50 % of project costs are covered by FFF subsidies) and about 4-5 times the amount of the subsidy’s present value (as the typical funding mix consists of grants and loans, the present value, at about 22 % on average, is less than the nominal amount). For this reason, the effect of FFF funding on non-habitual R&D performers is suspected to be larger than for firms which perform R&D on a more regular basis21.
Altogether, 495 firms fulfilled the complete set of criteria, 35 of which did not receive any FFF funding during the observation period (despite their being regular R&D performers).
Using this set of 495 firms, the model was estimated using GLS with cross-section weighting. The results are presented in Table 7 below.
Table 7: Results of the fixed-effects panel regression
dependent variable: R&D expenditureestimation period: 1997-2002estimation method: GLS (cross-section weights)
coefficient s.e. prob-valueR&D expenditure(-1) 0.701 0.02 0.00FFF funding (present value) 1.400 0.07 0.00(turnover+turnovert(-1)) 0.008 0.00 0.00(turnover+turnovert(-1))2 -2.80E-08 7.40E-09 0.00(turnover+turnovert(-1))3 5.40E-14 1.28E-14 0.00(turnover+turnovert(-1))4 -1.40E-20 3.98E-21 0.00Dummy 1998 -18.10 3.53 0.00Dummy 1999 -13.34 3.83 0.00Dummy 2000 -27.91 4.19 0.00Dummy 2001 -85.36 8.38 0.00Dummy 2002 89.92 15.04 0.00
# cross-section units 495# observations 2194 Source: FFF data base; own calculations
According to the estimation results, one additional Euro of funding (or, rather, of its present value) leads to an increase in (total) R&D expenditures of 1.40 Euros – or, put differently, an additional 40 cents of private R&D expenditures for each Euro of funding. FFF funding and private R&D, therefore, seem to be complementary, with a “leverage effect” of about 40 %. The complementar-ity can only be established for the present value of FFF funding: for the nominal amount of FFF subsidies, a substitution effect has to be admitted (the present value being about half of the nomi-nal subsidy, the coefficient of the nominal funding would be calculated at about 0.7; a re-estimation of the model using nominal funding instead of the present value confirms this value).
All coefficients are highly significant. With an estimated standard error of 0.07, the 95 %-range of the funding coefficient is about 1.26-1.54, comfortably above a value of 1.0 which would consti-tute the boundary between “substitutability” and “complementarity”: if the coefficient were less than 1.0, it would have to be concluded that firms substitute R&D subsidies for own expenditures (at least partially).
expenditures, being a cost component, enter the calculation of cashflow, thus potentially introducing problems with “simultaneity”.
21 Estimation results seem to vindicate this assumption: for the 33 firms which were identified as “intermittent R&D performers” (de-fined as firms which report at least 2 years of zero R&D), the level of additionality is indeed estimated to be considerably higher; cf. below.

36
3.4.1 Standard errors revisited: a bootstrap approach
This happy result, that the funding is complementary “almost certainly”, warrants some cautionary remarks: it is estimated under the usual assumption that the residuals are normally distributed. Conceivably, this might be implausible: the estimation is performed on the level of R&D expendi-tures as well as turnover; even if the size effect is properly taken care of, the residuals certainly remain affected by the level of a firm’s typical R&D expenditures. Additionally, they are probably distributed as log-normal rather than normal (if they are normally distributed at all). To assess the extent to which the standard errors’ estimates might be biased, a bootstrap exercise was per-formed. In this, the original sample of 495 firms was resampled 1000 times. For each bootstrapped sample, the model was re-estimated. The distribution of the 1000 coefficients of FFF funding were then statistically analysed.
The following Table 8 presents the summary statistics of this bootstrap.
Table 8: Results of the bootstrapping: descriptive statistics and Kernel density approximation
bootstrapped funding coefficient(n=1000)
Mean 1.497 Median 1.422 Std. Dev. 0.594 Maximum 4.151 Minimum -0.122 2.5% limit 0.534 97.5% limit 2.771
Jarque-Bera 95.153
0.000.100.200.300.400.500.600.700.80
-1 0 1 2 3 4 5funding coefficient
Kern
el d
ensi
ty
The results are clear: the average of the bootstrapped coefficients, at about 1.50, is somewhat higher than the point estimate for the whole sample of 495 firms. The real difference, however, can be found for the estimated range of the funding coefficient: whereas our original results indi-cated a narrow range of [1.26,1.54] for the 95 % interval, the bootstrap yields, also at the 95 % level, a range of [0.53, 2.77] – in other words, more than 10 times the range of the original esti-mate. Accordingly, the previous conclusion that complementarity of FFF funding is “almost cer-tain” (provided that our model is valid, of course), has to be downgraded to “most probably” (about 80 % of the bootstrapped coefficients are larger than 1).
In the next two chapters, a closer look will be taken at two specific questions. The one is if addi-tionality is a matter of firm size; the other, whether firms which do not perform R&D on a con-tinuous basis exhibit different reactions to FFF funding.
3.4.2 Additionality – a function of firm size?
For the whole sample of 495 firms, a leverage of about 40 % was estimated. In this chapter, the model will be re-estimated for samples of firms of different size. Firms were assigned to 4 differ-ent categories according to the average reported number of employees: less than 10, 10-50, 50-250, more than 250. The following Table 9 gives the results from the 4 panel regressions.

37
Table 9: Model results disaggregated by firm size dependent variable: R&D expenditureestimation period: 1997-2002estimation method: GLS (cross-section weights)
coefficient s.e. coefficient s.e. coefficient s.e. coefficient s.e.R&D expenditure(-1) 0.088 0.04 0.413 0.03 0.458 0.04 0.771 0.03FFF funding (present value) 1.621 0.15 1.293 0.09 1.048 0.17 1.955 0.26(turnover+turnovert(-1)) 0.153 0.06 0.046 0.02 0.022 0.02 0.003 0.00(turnover+turnovert(-1))2 -1.9E-05 1.35E-04 5.9E-06 5.91E-06 2.3E-06 7.77E-07 -1.6E-08 1.11E-08(turnover+turnovert(-1))3 -5.4E-08 9.72E-08 -9.9E-10 6.62E-10 -5.5E-11 1.26E-11 3.8E-14 1.59E-14(turnover+turnovert(-1))4 1.4E-11 1.78E-11 3.4E-14 2.38E-14 2.6E-16 6.17E-17 -9.9E-21 4.73E-21Dummy 1998 -1.454 4.42 8.818 4.80 7.137 12.85 -42.569 5.94Dummy 1999 3.924 4.89 3.029 5.12 -18.311 21.66 -42.933 22.80Dummy 2000 10.019 5.02 9.139 5.33 -55.753 24.44 -5.919 26.30Dummy 2001 15.679 5.41 17.954 6.66 -62.808 29.33 -202.459 54.47Dummy 2002 11.650 5.90 22.043 9.20 -98.867 27.53 120.214 85.19
# cross-section units 66 146 143 136# observations 259 607 651 746
>250 employees10-50 employees 50-250 employees< 10 employees
bold numbers indicate significance at the 10 % level
All firm sizes exhibit complementarity, though to a differing degree. Interestingly, it is the small-est and the largest firms which exhibit the highest leverage, medium-sized firms show only small additionality. At first sight, this is puzzling: one would probably suspect a homogeneously falling reaction of additionality with respect to firm size.
Candidates for the solutions to this puzzle can come from various corners. The first – and easiest – is certainly that this result is something of a statistical artefact, probably due to an inadequate model22. Of course, this cannot ruled out. On the other hand, this U-shaped function reflects re-sults from a survey which was conducted specifically for the purpose of evaluating the “behav-ioural effects” of FFF funding. In this survey, firms were asked – among other things - whether rejected projects were conducted despite this negative decision, if they were conducted in a modi-fied way, or not at all. Interestingly, the answers, presented in Figure 14, show a similar pattern when disaggregated into size classes.
Figure 14: Implementation/non-implementation if application was rejected: analysis by firm-size
a rejected project's fate:
0%10%20%30%40%50%60%70%80%90%
100%
<10
10-5
0
50-2
50
>250 tot
al
# employees
project cancelledimplemented as planned
implemented with changes
Source: Survey
22 Although different model specifications exhibited similar patterns of additionality with respect to firm size.

38
According to the survey, medium-sized firms, more often than large and much more often than smaller firms, report that they implemented a project “without changes” even when confronted with a rejection. They also cancelled projects less often (although only slightly less often than large firms)23. Although this result does not “explain away” the whole difference in additionality between firms of different sizes, it seems to hint at similar tendencies.
A third explanation, then, is certainly the fact that large firms face a lower PV rate than smaller firms: the ratio of total project costs to the funding’s present value is some 15 % lower than that of medium-sized firms (which enjoy the highest PV rates). In fact, the PV rate, disaggregated by firm size resembles an inverted U-shape (as such, it is the mirror-image of the additionality by size class):
Figure 15: PV rates by size class
0
5
10
15
20
25
30
0-9
10-1
9
20-4
9
50-9
9
100-
249
250-
1000
>100
0
# employees
PV rate: ratio of total project costs to the funding's present (cash) value
Source: FFF; own calculation
A lower PV rate, then, implies higher additionality for each project: as the FFF’s share in total project costs becomes smaller, the “funding leverage” becomes higher: an PV rate of 25 % implies a leverage of 400 %; an PV rate of 20 %, one of 500 %. Together with the different reaction to a rejection, this might provide a partial solution to the “leverage puzzle”.
3.4.3 Additionality in firms with sporadic R&D activities
In the estimation of the model as presented above, only such firms were included which per-formed R&D on a regular basis. A firm was categorized as “regularly R&D performing”, if in every year for which data on turnover were provided, a positive amount for R&D expenditures was reported. This restriction was justified on the ground that firms which regularly perform R&D might conceivably exhibit a weaker reaction to funding than firms which perform R&D only in-termittently. In this chapter, this hypothesis shall now be dealt with.
For this, firms with intermittent R&D were identified as firms which reported zero R&D for at least one year for which data on turnover is available (and which fulfilled the other requirements
23 From the cancellation rate as reported in the survey and a couple of bold assumptions, a (very) rough value for funding additionality
can be derived: in total, about 30 % of rejected projects were aborted. Assume that 100 projects were submitted. If all had been re-jected, only 70 of them would have been conducted (either unchanged or modified), 30 would have been dropped altogether. Suppose further, each project would carry costs of 100 euros. Then, with the 30 dropped projects, 3000 euros of R&D expenditures would not have been spent. The funding of all 100 projects, at an average NPV rate of 22 %, would have cost the FFF 2200 euros. This translates into an “R&D leverage” of 3000/2200 = 1.36, or about 36 cent of additional private R&D for every euro of FFF subsidies. But, of course, this is only a naive assessment.

39
for “sensible data” as stated at the beginning of chapter 3.4). Additionally, firms with at least 2 and 3 years of zero R&D were identified. The number of such firms is small: only 61, 33, and 18 could be identified, respectively.
Table 10: Additionality of firms with intermittent R&D performance dependent variable: R&D expenditureestimation period: 1997-2002estimation method: GLS (cross-section weights)
coefficient s.e. coefficient s.e. coefficient s.e.R&D expenditure(-1) 0.236 0.08 -0.232 0.13 0.110 0.14FFF funding (present value) 1.560 0.29 6.603 1.06 3.571 0.67(turnover+turnovert(-1)) 0.039 0.03 0.509 0.10 0.161 0.07(turnover+turnovert(-1))2 -2.6E-07 2.14E-06 -2.3E-05 5.00E-06 -8.4E-06 5.57E-06(turnover+turnovert(-1))3 -1.6E-11 5.72E-11 4.3E-10 9.99E-11 2.7E-10 2.10E-10(turnover+turnovert(-1))4 2.0E-16 4.60E-16 -2.8E-15 6.94E-16 -3.0E-15 2.49E-15Dummy 1998 28.976 24.09 8.785 19.37 -16.723 63.72Dummy 1999 83.721 22.90 47.019 29.78 -31.301 63.40Dummy 2000 89.017 22.95 30.593 33.83 30.103 64.64Dummy 2001 115.574 24.54 -28.556 48.75 -34.116 67.04Dummy 2002 181.217 42.48 51.380 87.71 49.112 99.49# cross-section units 61 33 18# observations 226 119 65
at least 1 year of 0 R&D at least 2 years of 0 R&D at least 3 years of 0 R&D
From the results it could be inferred that firms which do not perform R&D on a regular basis in-deed exhibit a more pronounced response to R&D subsidies: although firms with at least 1 R&D-free year show only slightly higher leverage than regular R&D performers (1.56 vs. 1.40), firms with 2 or 3 years of zero R&D are credited with markedly higher estimates. Nevertheless, it has to be borne in mind that the panels on which these results were obtained are quite small; the esti-mated standard errors of the funding coefficient are quite large, implying a wide confidence inter-val (which furthermore, as argumented in chapter 3.4.1, is likely to be estimated as much too nar-row).
3.4.4 Concluding remarks
What, now, can be said in answering the question whether FFF funding acts as a compliment or a substitute to privately financed R&D? The evidence can be interpreted as leaning towards com-plementarity: the results of the panel regression model certainly point in this direction, even if a bootstrap exercise adds some qualifications to this result. As for the leverage of FFF funding’s numerical value, the analysis seems to place it at about 40 %; 1 additional euro of funding (or, to be more precise, of its present value) induces firms to contribute an additional 40 cents of their own money. Both very small and large firms seem to exhibit higher leverage, small and medium-sized firms smaller leverage. Additionally, the leverage estimates for firms which perform R&D only occasionally are higher than for regular R&D performers.
In the whole analysis, there are some sources of shakiness: first of all, funding from sources other than the FFF are unknown. Although the FFF is by far the most important source of public subsi-dies to private R&D, it is certainly not the only one. The direction of the bias thus introduced in not completely clear: if funding by the FFF and funding by other sources are positively contempo-raneously correlated, the analysis is likely to overstate the complementary effect; conversely, a

40
negative correlation would dampen the estimated effect24. Whatever the direction, this unknown influence is unlikely to completely alter the results of the analysis (after all, the FFF accounts for about 80 % of all public subsidies to private R&D). Also, the (somewhat arbitrary) linear distribu-tion of the subsidies over the respective funding periods certainly introduces some (unavoidable) “fuzziness”. Longer time series would be of special importance to alleviate this problem by allow-ing some “averaging out” of mis-distribution introduced via the linear method.
The next is the choice of firms to enter the analysis. As it is, the standards for data quality are set rather high (at least 4 years of “sensible” data, etc.). As the bootstrapping exercise showed, even a varying set of firms which fulfill the same standard of data quality leads to a rather wide range of estimates. It shall not be concealed that the choice of functional form is of crucial importance as well; the results as presented in this paper are based on only one of quite a few specifications which were tested in the course of this work (albeit the one which was deemed to be the “best specification”, of course).
Using the lagged endogenous variable, furthermore, might introduce Nickell-Bias, resulting in additionality estimates which are probably too conseravtive. Also, the dynamic formulation of the model conceivably renders the results as the “lower limit” of additionality.
But whatever the “right” specification actually might turn out to be, any econometric analysis is bound to be confronted with a vast amount of “noise” hidden in this data base (which is not to say that the data are “inaccurate”; rather, too much of what actually gets on inside any firm and which influences the amount of realised R&D remains necessarily unknown).
24 If funding by other sources coincides with FFF funding, the subsidies from the other sources would be part of total R&D expenditures,
thus raising the estimated effect of FFF funding on total R&D expenditures. Conversely, if funding by the FFF and other sources took place in different years, the other sources would raise total R&D spending in years without FFF funding, thereby dampening the esti-mated “jump” in R&D expenditures resulting from FFF funding.

41
4 Output Additionality
The following chapter consists of two sub-sections. The first aims at analysing the factors explain-ing the intensity of R&D subsidies and the second investigates the productivity effects of both privately and publicly funded R&D.
4.1. FACTORS EXPLAINING THE LEVEL OF R&D SUBSIDIES
The decision on the level of R&D subsidies will be affected by both the funding agency's objec-tives and firm characteristics. Thus, the amount of R&D subsidies is not exogenous but endoge-nously determined by the funding agency's selection rule. According to technology guidelines and budget constraints, a funding agency decides which projects to subsidize, as well as what amount and what kind of subsidy the projects will receive. Based on certain criteria, the agency ranks the applications and funds the best project. According to the fund's strategy, the size, age, industry affiliation and performance of the firm as well as the firms' R&D intensity may all influence the level of R&D subsidies. Due to data limitations, we will investigate determinants of the level of R&D subsidies of supported firms rather than the factors influencing the probability to receive subsidies.25
4.1.1 Hypotheses about the agency's allocation rule
The funding agency's strategy depends on a number of factors. In principle, the FFF's strategy is to open all industrial R&D projects. The FFF decides whether to give subsidies to a R&D project. If the decision is positive, the amount of the subsidies will be determined. The decision whether or not to subsidize an R&D project as well as the decision on the level of subsidies may depend on specific selection criteria. According to the FFF’s guidelines, the fund encourages R&D in small firms and in start-up firms. Furthermore, a special grant program called "start-up" is established, favoring technology-oriented companies established during the past three years and consisting of less than 50 employees. The support of small firms can be justified by the presence of capital mar-ket imperfections and by the fact that R&D may involve fixed set-up costs, part of which may be sunk costs. Another grant program, "R&D dynamics", is designed to provide financing to firms with a lower-than-average R&D intensity but with high R&D growth in the past.
Another program initiative is the micro technology program. Therefore, we would expect industry variation as well. In particular because the potential for profitable R&D projects in micro technol-ogy is higher, we expect a higher R&D subsidy ratio in R&D-intensive industries using micro technologies such as the electronic industry and instruments, opposed to industries not using micro technologies. Other selection criteria taken into consideration include measures of firm perform-ance such as sales growth rates and cash flow in the past. In order to test the impact of past firm performance, we include the cash flow to sales ratio (lagged two years) and the annual growth rate of total sales in the last two years as additional explanatory variables.
In the following, five hypotheses concerning the determinants of the R&D subsidy ratio are for-mulated that will be evaluated in the following empirical work:
25 For an analysis of the probability of receiving subsidies for an R&D project based on the FFF project database, see section 2.2.

42
H1: We expect that both small firms and young firms receive higher R&D subsidies to total R&D.
H2: The R&D subsidy ratio decreases with increasing firm size.
H3: The R&D subsidy ratio may be higher in the software (Nace 72) and the electronic industry (NACE 30-33) than in other industries.
H4: Fast-growing firms as well as firms with a high cash flow sales ratio in the past are expected to receive higher amounts of R&D subsidies.
H5: The R&D subsidy ratio is significantly negatively related to the current R&D intensity.
The general specification used in the following empirical implementation relates the log ratio of R&D subsidies to total R&D expenditures to log R&D intensity, average annual growth rate of total sales in the past two years, cash flow ratio in the past two years as well as a set of appropriate control variables. In addition, we control for time and fixed effects:
,
))log()((log()/log()/log(
1
23221
itti
K
kkitk
ititititititit
X
CFRYYYRDRDRDSUB
ελθβ
ααα
++++
+−+=
∑=
−−
where i and t are indexes of firm and year, respectively. iθ and tλ denote fixed and time effects.
is the natural logarithm of the ratio of R&D subsidies to total R&D expen-
ditures. denotes the cash flow to sales ratio, is the natural logarithm of
R&D intensity, measured as the ratio of R&D to turnover.
)/log( itit RDRDSUB
2−itCFR )itRD
)(log(
/it Ylog(
))log( 2−− itYitY is the growth
rate of total sales in the last two years and are other explanatory variables that are considered
relevant. Appropriate control variables, which may affect the level of R&D subsidies, include firm age, legal status, industry affiliation and size dummies. In particular, firm age represents a good control variable because one of FFF's strategies is to support newly founded firms. Age effects are captured by a dummy variable indicating whether firms were founded less than six years before the survey year. Furthermore, we include a dummy variable indicating whether the firm is a com-pany with limited liability (GmbH). Year dummies control for common shifts over time. In order to account for the firms' industry affiliation (i.e. types of activities), we use eleven industry dum-mies. Firm size is defined by the number of employees and firms are divided into six size classes: the reference group has less than 10 employees, the three medium-sized classes are defined as 10-24, 25-49, 50-249, while large firms are defined to have 250-499 and more than 500 employees. As normalization we exclude one of the industry dummies and size classes each in the estimation.
kitX
To estimate the factors explaining R&D subsidies and their productivity effects, we use the IV techniques introduced by Hausman and Taylor (1981). Recall that the Hausman Taylor strategy is to divide the time-varying variables and time-invariant variables into exogenous (i.e. independent of individual effects) and endogenous, therefore possibly correlated with fixed effects. In our specification of the R&D subsidy equation, the endogenous explanatory variables are the growth rate of total sales lagged two years, the cash flow ratio lagged two years, the current R&D inten-sity and the duration of the R&D project. Dummy variables for firm size, industry affiliation and year are all assumed to be exogenous.

43
4.1.2 Data and descriptive results
The data used in this study are based on a unique data set containing all firms involved in R&D applying for R&D subsidies from the FFF. The support of the FFF comprises non-repayable grants, loans and guarantees for bank loans. Loans and guarantees are measured in net present value terms. Note that grants account for 90 percent of total R&D subsidies. Projects are sup-ported with up to 50 % of their total R&D project costs.
The FFF project database allows us to identify exactly whether a R&D project is subsidized. This database also includes total project costs, duration in months, total amount of R&D subsidies, level of grants, loans and liabilities and the NACE code of firm specific activity. The FFF project database has been linked with information on the FFF firm database. Firms applying for an R&D project were requested to give information on sales, number of total employees, total R&D expen-ditures, R&D personnel, foundation year, cash flow and total exports for the last three years before the application for an R&D project. The sample size is 12,333 observations on 3,585 firms. It can be considered approximately representative of all firms doing R&D in Austria. The database in-cludes all firms with at least one employee. The linked project-firm database is constructed in various steps. Since the duration of R&D projects usually exceeds one year, the subsidies granted have to be distributed equally between the years. Next, we sum up the amount of R&D subsidies by firm and year. Finally, the project database is merged with the firm database leaving us with information on about 1,250 firms with 3,500 observations. Furthermore, we exclude firms with a ratio of R&D subsidies to total R&D expenditures above two. Similarly we exclude firms with R&D to sales ratio above one. This leads to a final sample of 1,125 firms with 3,179 observations.
Table 11 reports the evolution of the R&D subsidy ratio as well as R&D intensity among the sup-ported firms for the period 1995-2002. The aggregate mean R&D subsidy ratio is quite stable about 4 percent26. The aggregate average R&D intensity of the supported firms is 5 percent and appears to be increasing in 2001 and 2002.
Table 11: R&D intensity and R&D subsidy ratio (supported firms), 1995-2002 R&D/sales R&D subsidies/total R&D # of obs. mean (aggregate) mean median mean (aggregate) mean median 1995 5.0 12.6 5.6 2.6 13.6 7.4 294 1996 5.0 11.7 5.0 3.0 13.0 8.4 357 1997 4.6 12.6 5.1 3.7 14.1 9.0 407 1998 4.1 11.8 5.0 4.2 15.1 10.5 471 1999 4.7 12.8 5.2 4.1 16.4 10.5 477 2000 4.4 12.4 5.2 4.0 16.2 11.0 486 2001 6.1 14.4 5.8 4.4 14.8 10.5 456 2002 8.5 15.8 6.5 3.4 15.2 10.2 231 total 5.1 12.9 5.3 3.7 14.9 9.7 3,179
Notes: Firms receiving R&D subsidies are included. Number of firms is 1,125. Source: Linked FFF project-firm database, own calculations.
26 The aggregate mean ratio is calculated as the ratio of the sum of R&D subsidies to the sum of total R&D expenditures.

44
Table 12: R&D intensity and subsidies ratio by firm size (supported firms) R&D/sales R&D subsidies/total R&D # of obs. mean (aggregate) mean median mean (aggregate) mean median
Firm size: 0-9 20.9 32.7 27.2 18.0 24.9 18.0 487
10-24 13.6 20.3 13.2 14.9 19.6 14.5 459 25-49 11.2 14.8 8.1 12.8 18.8 14.1 302 50-99 6.1 7.8 4.2 12.1 18.9 13.0 353
100-249 4.8 5.5 3.3 7.5 12.1 8.7 573 250-499 3.9 4.9 2.9 7.6 9.4 6.7 475
>500 5.1 5.5 3.1 2.4 4.8 3.1 530
Total 5.1 12.9 5.3 3.7 14.9 9.7 3,179
Firm age:
Last 5 years 4.5 23.0 12.3 5.8 19.9 13.8
Six and more 5.1 9.8 4.7 3.5 13.4 8.7
Notes: Number of firms: 1,125. Source: Linked FFF project-firm database, own calculations.
Table 12 presents the breakdown of both R&D intensity and R&D subsidy ratio by firm size and firm age. Small and medium-sized firms posses the expected higher R&D subsidy ratio than large firms. The R&D subsidy ratio ranges between 18 percent (aggregate means) in the smallest size class (0-9 employees) and 2.4 percent in the largest size class. Furthermore, we find that firms that are five years old or less have an R&D subsidy ratio of about 5.8 percent as compared to that of firms that are more than six years old with an R&D subsidy ratio of about 3.5 percent. The varia-tion of the R&D subsidy ratio across firm size and firm age is in line with the fund's objectives.
Table 13: Summary statistics (supported firms)
Mean Median Std. Dev. Min Max
estimation sample of the R&D subsidy equation
( # of obs.: 2,483, # of firms: 909) Ratio of R&D subsidies to total R&D 14.5 9.6 18.5 0.1 198.1
R&D/sales 11.1 5.0 15.6 0.0 99.2 Growth rate of total sales, t, t-2 15.1 8.5 30.2 -71.0 236.7
Cash flow/total sales, t-2 8.0 7.9 13.8 -99.1 94.1
Duration of the project in months 14.4 13.8 3.0 3.0 28.0
Notes: Variables are expressed as a percentage of 100. Source: Linked FFF project-firm database, own calculations.
Table 13 reports averages and standard deviations of key variables used for the estimation. Table 14 contains information on the firms' industry affiliation, size classes, year dummy variables, a dummy variable indicating whether the firm is less than 6 years old and interaction effects be-tween year dummies and the dummy variable for newly founded firms. About 12.5 percent of the 2,483 observed firms have less than 10 employees. About 15 and 18 percent, respectively, be-longed to the large firm size class with 250-499 and more than 500 employees. With respect to the industry affiliation, the sample of firms doing R&D is broken down into eleven sub sectors. The share of firms is the highest in machinery (21 percent), followed by electrical machinery and in-struments (19.5 percent), chemicals (12.4 percent) and the software industry (12 percent). Fur-thermore, 16 percent of the firms are five or less years old.

45
Table 14: Summary statistics (dummy variables, percentage share of total)
Food, beverages, textiles and clothing (15-19) 6.4 year dummy 1996 11.9Wood, paper, publishing (20-22) 5.3 year dummy 1997 14.1Chemicals, rubber (23-25) 12.4 year dummy 1998 16.5Non-metallic mineral products (26) 4.1 year dummy 1999 16.5Metals, fabricated metal products (27-28) 9.5 year dummy 2000 17.0Machinery (29) 21.0 year dummy 2001 15.8Electrical machinery, instruments (30-33) 19.5 year dummy 2002 8.3 Transport equipment (34-35) 6.3 other indicators Other manufacturing (36) 1.4 company with limited liability (GmbH) 98.6
Computer services (72) 12.0 Enterprises founded in last five years 16.1
Firm size distribution in terms of employees, L founded in last five yrs * year dummy 1996 1.9 L <10 employees 12.3 founded in last five yrs * year dummy 1997 2.5 10 ≤ L<25 employees 13.9 founded in last five yrs * year dummy 1998 2.6 25 ≤ L<50 employees 9.6 founded in last five yrs * year dummy 1999 2.6 50 ≤ L<100 employees 11.5 founded in last five yrs * year dummy 2000 2.4 100 ≤ L <250 employees 19.7 founded in last five yrs * year dummy 2001 2.7 250 ≤ L <500 employees 15.1 founded in last five yrs * year dummy 2002 1.5
L ≥ 500 employees 18.0
Notes: Number of observations is 2,483, number of firms is 909. Variables are expressed as a percentage of 100. Source: Linked FFF project-firm database, own calculations.
4.1.3 Empirical results
In order to quantify the main factors behind the amount of R&D subsidies, the logarithm of the R&D subsidy ratio is regressed against potential explanatory variables discussed above. As noted earlier, the sample includes only firms receiving R&D subsidies. Table 15 reports the results for the Hausman-Taylor instrumental variable estimator as well as the standard fixed effects model. We also report results of a different specification with interaction terms between year dummies and the indicator on newly founded firms.
The most important factors explaining the logarithm of R&D subsidy ratio are firm size, the log current R&D intensity, firm age and the growth rate of total turnover in the past two years. The ratio of R&D expenditures to total turnover is significantly negative suggesting that firms with a high R&D intensity have a lower R&D subsidy ratio. Note that this is consistent with the fund's objectives. Furthermore, we find that the R&D subsidy ratio continuously decreases with firm size, which probably reflects another one of the public agency’s goals. For instance, the R&D subsidy ratio is 37 percent lower for firms with 25-49 employees than for firms with 0-9 or 10-24 employees. The difference between small firms and medium-sized firms with 50-99 employees is 53 percent. The differences for the other size classes (100-249 employees, 250-499 employees and 500 and more employees) are 78, 82, and 91 percent, respectively27. Firms founded in the last five years have a significantly higher R&D subsidy ratio of about 31 percent on average compared to firms that are 6 or more years old28. This is also consistent with the funding agency's strategy. The interaction variables between year and the indicator on firm age show that the subsidy effect of newly founded enterprises is the highest in 2000 and appears to be declining in 2001 and 2002. The significantly negative coefficient on the change in turnover indicates that firms with a higher sales growth rate during the past two years have a lower current R&D subsidy ratio. This means 27 The percentage effect is calculated as exp(coefficient)-1.

46
that fast-growing firms get lower subsidies than slowly growing firms. Surprisingly, the lagged ratio of cash flow to turnover is not a major determinant of the R&D subsidy ratio. The legal form is not significant either. Firm- specific activities in electrical machinery, instruments and software tend to have a significantly higher R&D subsidy ratio.
Table 15: Determinants of the ratio of R&D subsidies to total R&D: Panel estimates
Hausman-Taylor IV estimates Fixed effects estimates (1) (2) (3) (4)
coeff. t-value coeff. t-value coeff. t-value coeff. t-value
Log R&D to sales ratio, % -0.48** -10.31 -0.45** -10.61 -0.49** -10.70 -0.50** -10.87
Change in sales, t, t-2, % -0.37** -4.11 -0.34** -4.07 -0.38** -4.33 -0.40** -4.47
Cash flow to sales ratio, t-2, % 0.10** 0.51 0.08** 0.47 0.07** 0.37 0.11** 0.58
Founded in the last five years 0.27** 3.56 0.20** 1.89
Log project duration in months 2.94** 3.04 1.89** 2.11
Company with limited liability (GMBH) 0.86** 1.68 0.22** 0.49
Year dummy 1996 (ref. 2002) -0.07** -0.79 -0.06** -0.77 -0.05** -0.55 -0.07** -0.81
Year dummy 1997 -0.02** -0.26 -0.06** -0.70 0.00** -0.05 -0.07** -0.85
Year dummy 1998 -0.02** -0.21 -0.03** -0.39 -0.02** -0.28 -0.07** -0.84
Year dummy 1999 0.05** 0.60 0.04** 0.52 0.05** 0.59 0.01** 0.15
Year dummy 2000 0.07** 0.98 0.04** 0.59 0.06** 0.75 0.01** 0.09
Year dummy 2001 0.07** 0.97 0.04** 0.55 0.05** 0.62 0.02** 0.20
Founded in the last five yrs * yr 96 0.33** 2.45 0.20** 1.09
Founded in the last five yrs * yr 97 0.26** 1.90 -0.04** -0.17
Founded in the last five yrs * yr 98 0.17** 0.88 -0.43** -1.54
Founded in the last five yrs * yr 99 0.12** 0.88 0.10** 0.61
Founded in the last five yrs * yr 00 0.39** 3.07 0.39** 2.60
Founded in the last five yrs * yr 01 0.24** 1.95 0.26** 1.66
Founded in the last five yrs * yr 02 0.23** 1.79 0.14** 0.86
Industry, size dummies
Food & bev., textiles and clothing 0.09** 0.55 0.04** 0.26
Wood, paper, publishing 0.13** 0.72 0.14** 0.78
Chemicals, rubber -0.25** -1.71 -0.25** -1.77
Non-metallic mineral products 0.27** 1.16 0.11** 0.48
Metals, fabricated metal products -0.11** -0.73 -0.14** -0.93
Electrical machinery, instruments 0.33** 2.40 0.22** 1.70
Transport equipment 0.26** 1.32 0.16** 0.82
Other manufacturing 0.44** 1.28 0.28** 0.82
Computer services 0.65** 3.33 0.44** 2.38
Other industries -0.16** -0.64 -0.14** -0.57
10 -24 employees -0.12** -0.80 -0.22** -1.58
25-49 employees -0.46** -2.71 -0.58** -3.58
50-99 employees -0.75** -4.55 -0.83** -5.11
100-249 employees -1.52** -9.84 -1.53** -10.11
250-499 employees -1.74** -10.31 -1.76** -10.63
> 500 employees -2.43** -14.68 -2.47** -15.17
Constant -11.63** -4.27 -8.03** -3.21 -3.96** -27.24 -3.94** -26.92
28 The percentage effect is calculated as exp(0.27)-1.

47Notes: Dependent variable is log R&D subsidies to total firms R&D expenditures. Number of observations is 2,483. The references for industry and size dummies are machinery and 0 -9 employees, respectively. * denotes significance at the 10% level; ** denotes significance at the 5% level. Coefficients can be interpreted as elasticities.
4.1.4 Concluding remarks This section of the study provides first systematic evidence on the determinants of the amount of R&D subsidies. The empirical evidence comes from panel data provided by the FFF. In particular, we investigated the determinants of R&D subsidies if firms had received subsidies. R&D subsi-dies are measured as grants plus the net present value of loans. The empirical research indicates that the R&D subsidy ratio is significantly negatively related to both firm size and the R&D inten-sity, but not to the cash flow ratio in the past. Furthermore, we find that newly founded enterprises as well as firms in electrical machinery and computer services have a significantly higher ratio of R&D subsidies to total R&D. In contrast, fast output growth in the past does lead to a higher R&D subsidy ratio. Overall, the results are consistent with the fund's strategy.
4.2. PRODUCTIVITY EFFECTS OF R&D SUBSIDIES
4.2.1 Introduction
Policymakers increasingly recognize the importance of research and development (R&D) as a driver of productivity growth. Governments use both indirect and direct measures to stimulate technological activity.
In recent years, there has been growing interest in R&D subsidies and the measurement of their impact. Previous studies of the possible impact of publicly funded R&D activities can be divided into two main groups: input additionality analysis (see chapter 3) and output additionality analysis. Output additionality analysis assesses the impact of publicly funded R&D on both research output (i.e. patents) and overall productivity growth. Input additionality analysis investigates whether publicly funded R&D is complementary and thus “additional” to privately funded R&D spending (see Arvanitis 2003; David et al., 2000, for a review). There have been few studies investigating in detail the effects of privately vs. publicly funded R&D on productivity growth based on non-U.S. data. Griliches (1998) summarizes the results of extensive econometric studies of rates of return to privately and publicly funded R&D in the United States. These rates of return range between 18 − 20 percent. The author suggests that there is no differential effect of publicly financed versus pri-vate R&D on the levels and rates of growth of total factor productivity at the firm level, although the differences are evident at the industry level. Using U.S. data, Lichtenberg and Siegel (1991) and Nadiri (1993) find that the productivity effects of publicly funded R&D were lower than the estimated effects of privately funded business R&D. Using data for eleven finish manufacturing industries, Niininen (2000) finds that the productivity effect of publicly financed R&D is similar to that of privately financed R&D. Combined, total industrial R&D accounts for nine percent of total factor productivity growth. Using aggregate data for 16 OECD countries, Guellec and van Pottelsberghe (2001) show that increases in both private and public R&D have a positive and sig-nificant impact on the change in total factor productivity. Using industry panel data for German manufacturing, Bönte (2003) found positive and significant productivity effects of publicly fi-nanced R&D. More recently, both OECD (2001) and Bassanini and Scarpetta (2001) have re-ported cross-country regressions that suggest a negative return on public sector R&D. Guellec and Van Pottelsberghe (2001) suggest that considerable caution is needed in drawing policy conclu-

48
sions from empirical analysis at the aggregate level. In this section, we will investigate the impact of public - thus FFF - support for R&D at the firm level.
In this section we investigate the relationship between privately and publicly funded R&D and labor productivity growth. The analysis is based on large sample of Austrian firms doing R&D provided by the FFF for the period 1995-2002.
4.2.2 Empirical model and hypothesis
The empirical model is based on the R&D capital stock model developed on Griliches (1979). Many empirical studies of the productivity effects of R&D relate the change in total factor produc-tivity to the R&D expenditure output ratio because it avoids the problems of measuring the R&D capital stock. The model can be written as:
)/( itit YRDTFP ρη +=•
where TF•
P denotes average annual growth of total factor productivity. Since data on investment are not available, we work with labour productivity growth rather than total factor productivity growth. Furthermore, we use the logarithm of the R&D subsidy to sales ratio rather than the level of the R&D subsidy to sales ratio. It is important to keep in mind that the impact of R&D subsi-dies is lagging and would surface after a certain period after the utilization of the R&D subsidies. Following Guellec and van Pottelsberghe (2001), we assume a two-year time lag for the impact of both publicly and privately financed R&D. The resulting production function relates the average annual growth rate of labour productivity to lagged levels of both the adjusted R&D intensity and the R&D subsidy sales ratio:
itti
K
kkitkit
ititititititit
ZcCFRc
YRDSUBcYRDSUBRDcLY
ελθ +++++
+−=∆
∑=
−
−−−−−
123
2222221 )/log()/)log(()/log(
where i and t are indexes of the firm and the year, respectively. )/log( itit LY∆ denotes the aver-
age annual growth rate of labour productivity between t and t-2. iθ and tλ denote fixed and time
effects. R&D subsidies are subtracted from total R&D expenditures in order to avoid double counting29. This gives the logarithm of the adjusted R&D intensity lagged two years:
. is the natural logarithm of R&D
subsidies as percentage of total turnover lagged two years. denotes the cash flow to sales ratio lagged two years and are other explanatory variables (i.e. firm age, legal status, industry
affiliation and firm size). Since output prices are difficult to get at the two-digit level, one can use the year dummies to proxy the unknown output deflator. The main hypothesis is that the produc-tivity effects of both privately and publicly financed R&D are positive and significant, but we expect that these effects are lower for publicly funded R&D than those estimated for privately financed R&D.
)/)log(( 222 −−− − ititit YRDSUBRD
kZ
)/log( 22 −− itit YRDSUBCFR
29 The average annual growth rate is calculated as: [ ] 2/)/log()/log(exp)/log( 22 −−−= itititititit LYLYLY∆

49
To estimate the factors explaining R&D subsidies and their productivity effects, we use the IV techniques introduced by Hausman and Taylor (1981). Recall that the Hausman Taylor strategy is to divide the time-varying variables and time-invariant variables into exogenous (i.e. independent of individual effects) and endogenous, therefore possibly correlated with fixed effects. In the pro-duction function, the endogenous explanatory variables are R&D subsidies to sales ratio, the ad-justed R&D intensity, firm age and legal status. Dummy variables for firm size, industry affilia-tion and year are all assumed to be exogenous.
4.2.3 Data and descriptive results
The data used in this study are based on a unique data set containing all firms involved in R&D applying for R&D subsidies from the FFF. The FFF project database has been linked with infor-mation on the FFF firm database. Firms applying for an R&D project were requested to give in-formation on sales, number of total employees, total R&D expenditures, R&D personnel, founda-tion year, cash flow and total exports for the last three years before the application for an R&D project. The sample size is 12,333 observations on 3,585 firms. It can be considered approxi-mately representative of all firms doing R&D in Austria. The database includes all firms with at least one employee. The linked project-firm database is constructed in various steps. Since the duration of R&D projects usually exceeds one year, the subsidies granted have to be distributed equally between the years. Next, we sum up the amount of R&D subsidies by firm and year. Fi-nally, the project database is merged with the firm database leaving us with information on about 1,250 firms with 3,500 observations. Furthermore, we exclude firms with a ratio of R&D subsi-dies to total R&D expenditures above two. Similarly we exclude firms with R&D to sales ratio above one. This leads to a final sample of 1,125 firms with 3,179 observations.
In order to get a first insight into the relationship between the change in labour productivity in the following years and the initial R&D subsidy sales ratio we provide a scatterplot with a regression line. We find a significantly positive relationship between the between lagged R&D subsidy ratio the growth rate of labour productivity in the following years (see Figure 16).
Figure 16: Correlations between the growth rate of labour productivity in the following two years and the initial R&D subsidy-sales ratio.
Source: FFF data base; # of obs. 1521. Six firms with R&D subsidy sales ration above 0.4 are excluded

50
4.2.4 Results of the productivity effects of the amount of R&D subsidies
As stated in the previous section, we investigate the productivity effects of public R&D in a pro-duction function framework. The change in labour productivity is a function of the logarithms of the ratio of privately and publicly financed R&D to sales, ten sector dummies, six size dummies, five year dummies, dummy variables for firms founded during the last five years and legal status. Results for Hausman-Taylor IV estimator and the standard fixed effects model are reported in Table 16. Note that both R&D variables are allowed to be correlated with the individual effects. The results indicate that both privately financed R&D and publicly financed R&D make signifi-cant contributions to future labour productivity growth as indicated by the elasticities of 0.11 and 0.05. Moreover, we find that newly founded firms have higher labour productivity growth than firms with six or more years.
The magnitude of the productivity effect of R&D subsidies is quite large given the median R&D subsidy sales ratio of 0.4 %. To give an example of the magnitude, we consider a ten percent in-crease in the R&D subsidy ratio. This would lead to an increase in the growth rate of turnover of about 0.5 percentage points per year given the elasticity of 0.05. Given the elasticities of the pro-duction function, one can also calculate how much of the observed change in output per worker can be attributed to the effects of publicly and privately funded R&D. Combined, both funding sources of R&D account for 24 percent of the change in output per worker per year30. However, the contribution of publicly funded R&D is less than 2 percentage points, while the contribution of privately funded R&D is 22 percentage points.
Furthermore, for a number of reasons the large productivity effects of privately funded R&D should be regarded with caution. As noted by Hall and Mairesse (1995), the use of flow rather than stock data tends to overestimate the productivity effects. Furthermore, the relative large pro-ductivity effects may partly be due to the omission of capital. Thus, the productivity effects seem to be the upper limit. Furthermore, the sample is reduced heavily due to the inclusion of two-year lags and may be no longer representative. Another concern arises out of the use of gross sales rather than value added as a proxy for output. However, in one of the few studies that used data on both gross sales and value added, Hall and Mairesse (1995) found only small differences in the estimated productivity effects based on value added rather than sales.
30 Elasticities are multiplied by the average sample means and are then divided by the average change in output per worker.

51
Table 16: Change in labour productivity and R&D subsidy ratio: Panel estimates Hausman Taylor IV estimates Fixed effects estimates coeff. t-value coeff. t-value
Log R&D subsidies to sales ratio, t-2, % 0.05** 6.24 0.05** 6.46 Log adj. R&D to sales rato, t-2, % 0.11** 7.85 0.11** 8.21 Founded in the last five years 0.13** 3.32 0.11** 2.74 Company with limited liability 1.90** 1.60 Year dummy 1998 (ref. 1997) -0.02** -0.77 -0.01** -0.63 Year dummy 1999 -0.02** -1.06 -0.02** -0.92 Year dummy 2000 0.00** 0.20 0.01** 0.56 Year dummy 2001 -0.02** -0.85 -0.02** -1.13 Year dummy 2002 -0.09** -3.68 -0.10** -4.06 Food, beverages, textiles and clothing1 0.11** 1.64 Wood, paper, publishing 0.18** 1.65 Chemicals, rubber 0.04** 0.56 Non-metallic mineral products 0.17** 1.07 Metals, fabricated metal products 0.08** 1.39 Electrical machinery, instruments -0.10** -2.18 Transport equipment 0.00** 0.02 Other manufacturing 0.10** 0.88 Computer services -0.20** -3.24 other industries 0.03** 0.31 10 -24 employees2 0.04** 0.75 25-49 employees 0.09** 1.32 50-99 employees 0.09** 1.35 100-249 employees 0.03** 0.43 250-499 employees 0.06** 0.82 > 500 employees 0.05** 0.69
Constant -1.14** -0.97 0.77** 12.55
Notes: The dependent variable is average annual change in labor productivity between time t and t-2. Number of obser-vations is 1,527 and the number of firms is 581. 1,2 The references for industry and size dummies are machinery and 0-9 employees, respectively. * denotes significance at the 10% level; ** denotes significance at the 5% level.
4.2.5 Concluding remarks This section provides first systematic evidence on the productivity effects of the amount of R&D subsidies. The empirical evidence comes from a unique panel data provided by the FFF. In par-ticular, we investigate the impact of R&D subsidies on the growth of output per worker from 1997 to 2002. Using a Cobb-Douglas function to assess the productivity of input factors, we find that the amount of R&D subsidies as well as privately financed R&D expenditures (both expressed as a percentage of sales) have a significant and positive effect on output growth in the following years. Furthermore, the impact of R&D subsidies is relatively large considering the amount of subsidies spent. A ten percent increase in the R&D subsidy sales ratio would lead to a rise in the growth rate of output per worker of about 0.5 percentage points in the next two years. Further-more, we find that the productivity effects of publicly funded R&D were much lower than those estimated for privately funded R&D.

52
5 Behavioural Additionality
So far the direct economical effects of FFF-support have been explored. First, the input additonal-ity has been investigated, i.e. the quantification of the extent to which public support stimulates new R&D activity in comparison to the counterfactual of no government funding. Another way of measuring the success of the FFF-scheme is to determine the economic impact of public R&D-support (output additionality), i.e. the focus lies on the gross effects such as increased turnover, enhanced productivity, stronger competitiveness, improved market positions and the like.
Rigby (2003) has proposed to require high output additionality as a necessary first-order condition for the provision of public money, while high input additionality is to be treated as a kind of sec-ond-order condition. In view of the scarcity of public funds, he (among others) argues that the second order test is to make sure that publicly funded R&D is not simply substituting for, or actu-ally crowding-out private R&D-investment31 and that the latter additionality concept is “a measure of the leverage effect of public money on the private resources of the firm”. Without questioning the ultimate need for efficient use of public resources, there is increasing awareness that R&D-promotion schemes must be judged on the basis of more than immediately materializable returns or directly measurable indicators. Instead, intangible social returns should also be taken into con-sideration, general competence building and networking included, since this may lead companies to spend more resources on innovation and R&D-projects in the future.32 Accordingly, this chapter addresses long-term behavioural changes emerging from FFF-participation, so-called “behavioural additionality”.
The concept of behavioural additionality as originally introduced by Buisseret et al. (1995) is an attempt to steer the notion of additionality away from a narrow focus on either immediate com-mercial effects, or various kinds of secondary, nevertheless materializable, effects. Instead, the traditional additionality concept is broadened by investigating whether participation in assisted projects influences the R&D-related behaviour of FFF-funded firms in a significant manner. Thus, attention is not so much drawn on the actual economical effects or the triggering of private eco-nomic funding of the projects themselves; the decisive point is rather if participation in FFF-funded projects has made the actors become more involved in R&D-activities, if there have been permanent changes in the conduct of a company and particularly on the institutionalization of innovation and R&D-activities (Aslesen et al., 2001). In short, the focus is on the building of in-novation capabilities and competence building in general and on the companies’ ability to make use of new technologies and R&D-procedures elsewhere. If such was the case, this may strengthen the company’s ability to absorb new knowledge (their ‘absorptive capacity’). It should be noted that this form of competence building may also benefit other participants in the innova-tion system, including customers and collaboration partners, thus contributing to a permanent and sustainable increase in the level of Austrian R&D-investment.
This section explores various dimensions of behavioural additionality resulting from FFF-assistance, including project additionality, acceleration additionality, scope and scale additionali-ties.33 In this context we present some descriptive evidence from the FFF-survey on, first, the behavioural consequences in case of rejection, second, on collaboration and networking when
ented, and, third, on the degree to which proposals are based on FFF-assisted projects are implem 31 For a survey of the econometric evidence on this issue see David et al. (2000). 32 Georghiou (1997, 2000, 2002), Luukkonen (2000), Papaconstantinou et al. (1997), Sakakibara (1997). 33 For the motivation of these concepts see Davenport et al. (1998) and Georghiou (2002).

53
assisted projects are implemented, and, third, on the degree to which proposals are based on pre-ceding projects and/or result in subsequent projects, respectively. Last, data from the FFF’s linked firm-project database is exploited to estimate the effect of FFF-subsidies on the stock of scientific R&D-personnel.
5.1.1 Project additionality
Within this evaluation the FFF’s customers have been surveyed as regards their appraisal of the working of the FFF. Details on the survey and an overview description of the sample are presented in the next chapter and will not be discussed at this stage. One of the neat features of the survey is that questions in relation to behavioural changes in case of rejection do not take the subjunctive only, but that we can compare the results with answers from those respondents who have actually experienced rejection of their proposals. Ultimately, hypothetical questions are very likely to be answered in a strategic way and the (control) group of actually unsuccessful candidates allows us to uncover such strategic answering behaviour.34
One of the most compelling issues in the context of publicly funded projects is the question of implementation/non-impementation in the (hypothesized) situation of no public assistance. This dimension of additionality is occasionally referred to as “project additionality” (see Davenport et al., 1998). Table 17 below present detailed evidence on this issue derived from the FFF-survey data. Analyses have been undertaken by sector-affiliation, as well as by firm-size and contrast hypothesized outcomes (first column) with actual outcomes (second column).
Table 17: Implementation/non-implementation if application was/is rejected: analysis by sector-affiliation
Hypothetical Actual Scenarioa) Consequencesb) Carry out project without changes (total) 15.13 21.85 Traditional industries 19.77 34.02 R&D-intensive industries 16.32 23.61 Traditional services 16.36 18.75 Knowledege-intensive service 8.93 12.12 Carry out a revised version of the project (total) 57.16 46.79 Traditional industries 60.47 46.39 R&D-intensive industries 59.64 47.92 Traditional services 49.09 41.67 Knowledege-intensive service 54.29 47.73 Cancel project (total) 27.72 31.35 Traditional industries 19.77 19.59 R&D-intensive industries 24.04 28.47 Traditional services 34.55 39.58 Knowledege-intensive service 36.79 40.15 Number of sample firms 985 421
a) Sample comprises companies that never have been rejected by the FFF and answered the relevant question 41; b) Sample comprises companies that have experienced rejection by the FFF and answered the relevant question 56. Source: Survey
The first thing to note is that the readiness to carry out a revised version of the rejected proposal is broadly overestimated by around 10 percentage points (total sample). In fact, nearly every third
34 Since respondents have an interest in the continuation of public support, there is an incentive to over-emphasize the effects of public
assistance measures. On the other hand one could argue that companies are reluctant to admit their dependency on public funds. In either case there is wide scope for speculation, i.e. we simply cannot tell the direction of distortion (Sakakibara, 1997).

54
respondent of the set of companies that have experienced rejection at least once reports full addi-tionality, meaning that the project has been cancelled without FFF-support (as opposed to around 28 % in the hypothetical scenario). Likewise 22 % of the respondents say that the project has been implemented anyway, regardless of public assistance, while within the sample of actually sup-ported firms only a fraction of 15 % admit that ultimately no additional R&D-activities are encouraged by means of FFF-sponsoring. Hence, the case of full additionality (“cancel project if FFF-funding is denied”) is systematically underestimated, as is the ultimate willingness or ability to realize the project even if no support was granted. Firms’ wrong assessment with regard to their actual readiness to carry out a revised version of the project is particularly severe in case of the traditional industries and for companies with more than 10 but below 100 employees,35 while the micro-sector firms are generally characterized by more realistic self-assessments.
Public R&D-assistance proves to be most crucial for servicing companies, while – quite by sur-prise- manufacturing industries are more likely to execute the projects unaltered when FFF-funding is denied, i.e. with the same scale and timetable. Conversely, the share of respondents who claim that the project would have been/has been dropped entirely without FFF-funding is lowest within this subgroup (see Table 17). Presumably these findings are “by construction”. Re-call that the questionnaire has only been sent to firms that have ever applied for FFF-support. It is very likely that R&D-intensive firms, or servicing firms, respectively, apply for FFF-support on regular grounds, while traditional manufacturing firms only do so if the project is deemed to be successful and without risk. This would explain our finding that traditional industries are least dependent on FFF-funding. More sophisticated methods are in order to deduce unambiguous evi-dence on the additionality aspect of public R&D-support.36
Table 18: Implementation/non-implementation if application was/is rejected: analysis by firm-size
Hypothetical Actual Scenarioa) Consequencesb) Carry out project without changes (total) 15.10 21.93 < 10 employees 8.15 14.08 10 – 99 employess 14.07 19.15 100 – 249 employees 21.64 42.31 250 and more employees 25.44 26.97 Carry out a revised version of the project (total) 56.47 46.70 < 10 employees 49.22 47.18 10 - 99 employess 59.55 43.97 100 - 249 employees 56.72 44.23 250 and more employees 62.72 51.69 Cancel project (total) 28.43 31.37 < 10 employees 42.63 38.73 10 - 99 employess 26.38 36.88 100 - 249 employees 21.64 13.46 250 and more employees 11.83 21.35 Number of sample firms 1020 424
a) Sample comprises companies that never have been rejected by the FFF and answered the relevant question 41; b) Sample comprises companies that have experienced rejection by the FFF and answered the relevant question 56. Source: Survey
35 Here, discrepancies between hypothesized and actual outcomes range between 14-16% 36 For a survey of the econometric evidence over the past 35 years see David et al. (2000).

55
A second, likewise unexpected result is that it is not the largest firms which prove to be the least reliant on FFF-funding (see Table 18).
It is true that within this size-category the share of respondents who claim that they would carry out the project irrespective of funding opportunities is highest and, conversely, the share of com-panies reporting that projects would be cancelled in case of FFF-rejection is lowest. However, when we leave the hypothetical scenario and take a look at the actual consequences, we find addi-tionality to be lowest in case of companies with above 100 and below 250 employees. Irrespective of this irregularity, it remains true that micro-sector firms are naturally the most vulnerable if FFF-support is/was withdrawn, or – to put it the other way round - the role of FFF-assistance is quite decisive in encouraging additional R&D-activities within very small firms.
5.1.2 Behavioural changes in case of rejection
Hypothetically asked, 61 % of the set of companies which never failed to qualify for FFF-support state they would seek for alternative public assistance to further promote the rejected project pro-posals, while not even every third respondent within this subset states the contrary.37,38 In this respect differences between various branches turn out statistically insignificant. Repeated analysis by firm-size reveals that the largest size-category is characterized by the highest share of respon-dents stating that they would indeed send in rejected proposals to other R&D-promotion schemes in case their FFF-application was turned down. But in fact only every fourth company of the total sample actually did seek for alternative support funds, suggesting that dependency on public R&D-assistance is broadly overestimated.39 However, evidence on that issue is not that conclusive since for the latter finding the relevant sample is reduced to only about 300 firms as compared to 1131 firms in case of the hypothetically asked question.40
Table 19 below displays conceived, as well as actual consequences, respectively, in case FFF-application turned out unsuccessful. Note that the sample is reduced to the set of respondents who claim that the project would be/has been implemented in a revised form.41
Table 19: Behavioural Additionality: adaptations if application was/is rejected Hypothetical Actual At issue Scenarioa) Consequencesb) Starting date of the project postponed 32.03 43.35 remains unchanged 61.02 48.77 Duration of the project Longer 50.68 61.08 remains unchanged 30.34 23.15 Scale of the project Smaller 74.07 60.10 remains unchanged 21.53 32.51 Technical demands less sophisticated 48.81 39.90 Remain unchanged 46.78 51.72 Accessibility of project results Later 62.71 63.55 at no later point in time 31.02 27.59
a) Refers to Question 42; N = 590; very few firms report an earlier starting date, shorter duration of the project, greater scale of the project or higher technical demand. The share of missing answers ranges between 3%-4%; b) Refers to Question 57; N=203; very few firms report an earlier starting date, shorter duration of the project, greater scale of the project or higher technical demand. The share of missing answers ranges between 4%-7%. Source: Survey
37 Refers to question 50 of the questionnaire (unreported results). Share of missing answers: 8%, 38 untabled results 39 Refers to question 60 of the questionnaire (unreported results). Share of missing answers below 1%. 40 In the actual scenario, companies that dropped their proposal after FFF-rejection are deleted from the relevant sample. 41 For the hypothetically asked question N=590, while 203 respondents report what actually happened when a revised version of the
rejected proposal had been carried out.

56
First, we observe great unanimity when it comes to the accessibility of project results, i.e. in this respect conceived and actual consequences do not really differ from each other. Two out of three respondents agree that project results could only be exploited at some later date than originally aimed at, supporting the notion that so-called “acceleration additionality”42 really matters.43 We find acceleration additionalities to originate as an immediate consequence of postponed starting dates and prolonged implementation phases in case of no public sponsoring. In fact, delays gener-ally turn out much more severe than expected. More than 60% of the unsuccessful candidates admit prolonged project duration.
Most interestingly, it is again the firm-size category of above 100 and below 250 employees which deviates from the norm.44 Not even one in three respondents report extended implementa-tion phases and one in five even claims that the project has even been finished earlier than origi-nally aimed at. Furthermore, when asked hypothetically, more than three in four respondents of this size-category claim they would still stick to the original time schedule and only one in five companies conceive that the starting point would have to be postponed. Quite similar results on (hypothesized) starting date and project duration, respectively, are obtained for traditional servic-ing companies. In summary, there seems to be some evidence that large (but not the largest) firms, as well as traditional servicing firms, do not really change their behaviour when experiencing FFF-rejection, but rather make concessions to the time horizon of the project. This notion is sup-ported by results from a previous customer content analysis based on the same survey data. Here, firms of the size-category 100-250 employees were found to invest the least time-input when seeking for FFF-support. They might thus simply be unable to respond in another than a rather pragmatic way.
A final good news from Table 19 is that the least concession are made when it comes to the tech-nical demands. In fact actual consequences turn out less severe than hypothetically conceived and the same is true for the “scale”-issue. Still, 60 % of the rejected firms state to have carried out the project on a smaller scale when FFF-assistance had been denied, hence so-called “scale addition-alities” are also prevailing to a considerable degree.
5.1.3 Collaboration and networking
Collaboration and networking must be considered as key aspects of project participation. They involve both, individual and organisational learning, generate network externalities and thereby influence the competences of the actors, as well as their future behaviour (Aslesen et al., 2001, Georghiou, 1997). Furthermore, working closely with R&D-institutions enhances the companies’ absorptive capacity as regards scientific knowledge. At least every other respondent claims that collaboration has taken place in one or the other way (see Table 20). Collaboration may take the form of joint project proposals (true for 52 % of the FFF-funded firms), cooperation with research institutes or with other companies (true for 51 % and 55 %, respectively). It is, however, not that conclusive whether additional partnerships have been established, or if existing partnerships have simply been continued. A previous empirical study undertaken in New Zealand, for example, re-vealed that only around 10 % of the respondents claimed that the government-assisted project resulted in a new partnership (Davenport et al., 1998).
42 Acceleration Additionality: when R&D-assistance is speeding up the course of the project (Georghiou, 2002). 43 Within the traditional servicing companies the respective fraction amounts to only 42% when asked hypothetically, however, actual
consequences do not differ in a statistically significant way. 44 Detailed results are not tabled.

57
Table 20: Behavioural Additionality: collaboration and networking (%) yes No Missing Joint project proposal with customers/suppliers/reseach partners 52.4 37.7 9.8 Cooperation with research institutes 50.8 38.1 10.9 Cooperation with other companies 55.3 33.6 10.8 Building of research networks 31.3 56.2 12.3
Source: Survey
A detailed analysis verifies that it is especially the more traditional companies, both within the manufacturing sector as well as within the servicing sector, which aim to make good own defi-ciencies and make use of the particular knowledge of research institutions by respective collabora-tion. Most surprisingly, however, this hypothesis (i.e. levelling own comparative disadvantages by means of collaboration with the scientific community) does not prove true for the microsector, but rather the contrary is the case. Instead, these obviously highly specialized small firms are particu-lar prone to the building of own research networks, i.e. collaboration is rather complementary than substitutive in nature. Generally spoken, servicing firms are more involved into research networks and are more responsive to teamwork with other companies. In other words, supporting servicing firms are more likely to generate so-called “scope additionalities”45 as the benefits of public R&D-assistance spill over to collaboration partners as well, while the diffusion effects are moderate in case of the manufacturing firms.
5.1.4 Preceding and subsequent projects If FFF-participation actually enhanced a company’s efforts as regards own R&D-activities, such increased commitment should ultimately result in subsequent projects. In total 485 firms, account-ing for 43 % of the relevant sample, report that participation in the FFF-funding scheme has re-sulted in successive projects which are directly based on preceding, FFF-sponsored research pro-jects (see Table 21).46 Likewise, roughly the same fraction states that the FFF-sponsored project just happens to be the later project, i.e. the proposal had been based on some project that had been carried out before. Chain effects (in both directions) are the most likely to occur within R&D-intensive industries, or knowledge-intensive services, respectively, where at least every other firm bases FFF-proposals on former projects, or vice versa. Furthermore, three out of four firms within the R&D-intensive industries, or knowledge-intensive services, respectively, appreciate the value of FFF-support in as far as R&D-activities could be extended to new areas. Such extensions imply changes at the strategic level (i.e. to move into a new area of activity) as well as changes at the level of competences to be acquired in the future. More traditional firms, on the other hand, show a significantly lower readiness to enter unknown research territory (hence the term “traditional”) so that in total “only” about two in three companies extend their research scope. Still, the trigger-ing effect of FFF-participation must be regarded as a definite success.
45 Scope additionalities refer to the outcome that “the coverage of an activity is expanded to a wider range of applications or markets
than would have been possible without government assistance (including the case of creating a collaboration in place of a single-company effort)” (Georghiou, 2002).
46 A fraction of 38% (i.e. 182 firms) has been successful to get public support for the following project as well (no significant difference across sector-affiliation or firm-size). Out of these 79% have again managed to attract FFF-subsidies, 44% have received financial assistance from other Austrian R&D-promotion schemes and 12% have been funded by the European Union. Note that some compa-nies must have been assisted by more than one institution.

58
Table 21: Behavioural Additionality: chain effects of public funding (in %) Yes No missing FFF-project is based on former R&D-projects of our company (Question 38) 44.3 44.4 11.1 FFF-Project has resulted in subsequent projects (Question 47) 42.8 49.9 7.1 Project allowed us to extend R&D-activities to new areas (Question 38) 62.8 26.4 10.7
Source: Survey
5.1.5 Econometric evidence from the FFF-panel data set
The standard econometric approach to input additionality is to regress measures of private R&D-resources (expenditure or scientific labour input) on public assistance correcting for selectivity. Behavioural Additionality deals with “the difference in firm behaviour resulting from the interven-tion” (Georghiou, 2003). As straightforward as appealing this definition may appear, it is not that easy to make operational for econometric purposes. After all, Behavioural Additionality aims to capture intangible benefits, such as training of researchers, increased awareness of R&D opportu-nities in general and establishment of informational networks (Sakakibara, 1997). In search for a suitable left hand-side variable we scanned the linked firm-project FFF-database47 and eventually came up with log(R&D-personnel). True, this specification once again sheds some more light on the issue of input additionality in an orthodox sense. But additional R&D-personnel will certainly facilitate “increased awareness of R&D opportunities”, the “establishment of informational net-works” and the like and will hence improve the firm’s absorptive capacity with respect to new knowledge. Ultimately, the differences between input additionality and behavioural additionality are hard to tell and even harder to quantify.
Appendix IV below presents some preliminary bivariate evidence on the relationship between the initial R&D-subsidy ratio (i.e. FFF-subsidies as a share in total R&D-expenditure) and the average annual growth rate of R&D-personnel. Though the correlation turns out statistically significant and positive, as expected, the coefficient of correlation is very small in magnitude.
Figure 17: Correlation between the initial R&D subsidy ratio in t-2 and the growth rate of R&D personnel in the following yearsa)
Source: FFF database; a) number of observations (firms) is 1405
47 For a description of the dataset, see the preceding chapters on input and output additionality.

59
For a multivariate analysis we fit a fixed effects model with time-invariant variables as introduced by Hausman and Taylor (1981), results are displayed in Table 22. Coefficients on the year dum-mies indicate that the number of scientific R&D-staff hat increased by some (exp(0.28)-1)=32%48 between 1995 (the left-out reference year) and 2002. Results on the other control variables are likewise plausible: companies undertaking R&D in computer-related services, or in high-tech electrical machinery, respectively, employ significantly more R&D-workers as compared to the reference group and apparently the number of scientific R&D-personnel is increasing in firm size (a tautological relationship). With respect to the actual variable of interest, viz. log(R&D-subsidies), a highly significant coefficient of only very small magnitude confirms the first impres-sion: a one-percent increase in the amount of R&D-subsidies granted will induce firms to increase its scientific R&D-staff by 0.04 %. To illustrate, suppose the company in concern employs 40 R&D-workers.49 One additional worker would increase the stock of R&D-personnel by 2.5%. Hence, in order to achieve this 2.5 % increase – or to hire exactly one more R&D-worker, respec-tively- the net present value of FFF-subsidies would have to increase by 62.5 %. We conclude that the demand for high-skilled R&D-personnel is only marginally affected by additional FFF-assistance. Instead, it is rather driven by fundamental performance indicators such as total annual sales, or by the NACE-classification of the supported project.
Table 22: Panel estimates of the determinants of log(scientific R&D-personnel) coeff. t-value p-value Year dummy 1996 (ref. 1995) 0.02 0.66 0.51 Year dummy 1997 0.06 2.08 0.04 Year dummy 1998 0.08 2.91 0.00 Year dummy 1999 0.13 4.23 0.00 Year dummy 2000 0.17 5.46 0.00 Year dummy 2001 0.23 7.21 0.00 Year dummy 2002 0.28 7.37 0.00
Founded in the last five years 0.00 -0.07 0.95 log R&D subsidies (net present value) 0.04 4.31 0.00 log total sales 0.19 10.89 0.00 Food & bev., textiles and clothing -0.17 -1.05 0.30 Wood, paper, publishing -0.60 -3.23 0.00 Chemicals, rubber 0.26 1.85 0.06 Non-metallic mineral products 0.06 0.29 0.77 Metals, fabricated metal products -0.41 -2.68 0.01 Electrical machinery, instruments 0.83 6.88 0.00 Transport equipment 0.61 3.36 0.00 Other manufacturing 0.08 0.22 0.83 Computer services 1.06 7.26 0.00 Other industries -0.15 -0.66 0.51
Company with limited liability (GMBH) 0.36 0.90 0.37 10 -24 employees 0.46 3.89 0.00 25-49 employees 0.73 5.19 0.00 50-99 employees 0.67 4.54 0.00 100-249 employees 0.81 5.62 0.00 250-499 employees 1.29 8.02 0.00 > 500 employees 2.38 13.39 0.00
48 See Halvorsen et al. (1980) on the correct interpretation of dummy variables in semilogarithmic equations. 49 This is the average number of scientific R&D-personnel in the linked firm-project database.

60
Log project duration in months 1.23 1.53 0.13 Constant -5.13 -2.44 0.02 # of obs (firms ) 3031(1064)
Notes: Dependent variable is log scientific R&D personnel. Estimates are based on the Hausman-Taylor estimator (Fixed effects with time-invariant variables). The references for industry and size dummies are machinery and 0 -9 employees, respectively. Source: Survey
In qualitative terms, the above findings are confirmed if the same regression is run on various firm-size samples (less than 25 employees, 25-99 employees and 100 and more employees – see Table 23). Comparing the crucial coefficients across size-categories we find that the demand for scientific R&D-labour is the more elastic with respect to FFF-sponsoring the smaller firms. In particular, a statistically insignificant coefficient on log(subsidies) points at the fact that the largest firms hire additional R&D-labour irrespective of additional FFF-funding.
Table 23: Panel estimates of the determinants of the logarithm of scientific R&D personnel by size 100 and more employees 25-99 employees Less than 25 employees coeff. t-value p-value coeff. t-value p-value coeff. t-value p-value Year dummy 1996 (ref. 2002) 0.03 0.71 0.48 -0.03 -0.39 0.70 0.05 0.76 0.45 Year dummy 1997 0.06 1.71 0.09 0.04 0.53 0.59 0.08 1.16 0.25 Year dummy 1998 0.08 2.05 0.04 0.09 1.21 0.23 0.07 1.05 0.29 Year dummy 1999 0.10 2.78 0.01 0.05 0.62 0.54 0.21 2.88 0.00 Year dummy 2000 0.16 3.98 0.00 0.07 0.77 0.44 0.22 3.01 0.00 Year dummy 2001 0.23 5.56 0.00 0.14 1.55 0.12 0.27 3.47 0.00 Year dummy 2002 0.26 5.56 0.00 0.16 1.58 0.11 0.34 3.83 0.00
Founded in the last five years -0.08 -1.45 0.15 0.01 0.09 0.93 0.08 1.45 0.15 log subsidies (net present value) 0.02 1.52 0.13 0.05 2.22 0.03 0.07 3.83 0.00 log total sales 0.24 7.70 0.00 0.26 6.04 0.00 0.14 5.05 0.00 Food & bev., textiles and clothing -0.51 -1.95 0.05 0.25 0.80 0.43 0.19 0.75 0.45 Wood, paper, publishing -1.12 -3.80 0.00 -0.10 -0.25 0.81 -0.12 -0.48 0.63 Chemicals, rubber 0.09 0.35 0.73 0.57 1.87 0.06 0.07 0.42 0.68 Non-metallic mineral products -0.05 -0.13 0.90 -0.14 -0.32 0.75 0.29 0.78 0.43 Metals, fabricated metal products -0.65 -2.68 0.01 -0.12 -0.40 0.69 -0.28 -1.17 0.24 Electrical machinery, instruments 0.95 3.94 0.00 1.12 4.83 0.00 0.46 3.26 0.00 Transport equipment 0.69 2.44 0.02 0.24 0.60 0.55 0.12 0.44 0.66 Other manufacturing -0.25 -0.50 0.62 0.38 0.34 0.73 0.42 0.95 0.34 Computer services 0.69 1.55 0.12 1.36 4.94 0.00 0.69 5.27 0.00 Other industries -0.74 -1.58 0.11 -0.01 -0.02 0.98 0.18 0.74 0.46
limited liability comp. (GMBH) 6.35 3.37 0.00 -0.53 -0.98 0.33 0.00 0.01 1.00 10 -24 employees 0.43 4.92 0.00 25-49 employees 50-99 employees -0.07 -0.44 0.66 100-249 employees 250-499 employees 0.45 2.60 0.01 > 500 employees 1.46 7.69 0.00
Log project duration in months 0.79 0.41 0.68 1.08 1.13 0.26 -0.07 -0.12 0.91 constant -9.32 -1.67 0.09 -4.06 -1.60 0.11 -1.20 -0.83 0.41 # of obs (firms) 1501 (390) 638 (237) 892 (437)
Notes: Dependent variable is log scientific R&D personnel. Estimates are based on the Hausman-Taylor estimator (Fixed effects with time-invariant variables). The references for industry and size dummies are machinery and 0-9 em-ployees (specification1), 50-99 (specification 2) and >500 (specification 3), respectively.

61
Last, some evidence on a dynamic specification resulting from a partial adjustment model is pre-sented in Table 24. Here, coefficients on year dummies turn out insignificant and the trend effect (persistence) is captured by the lagged endogenous variable instead. We find that contemporane-ous, as well as lagged subsidies have a positive short-run effect on the number of scientific R&D-workers of 0.02 %. The long-run effect of 0.06% is calculated as the sum of contemporaneous and (one-period) lagged effects divided by the partial-adjustment coefficient. These effects match the results of the static approach (Table 22) remarkably well and once again support the finding that increased FFF-sponsoring impacts only marginally on the additional demand for high-skilled R&D-labour.
50
51
Table 24: Impact of subsidies on scientific R&D personnel: Dynamic panel estimatesa) (1) (2) Coeff t-value p-value coeff t-value p-value ∆log R&D personnel (t-1) 0.22 1.76 0.08 0.24 1.98 0.05 ∆ log R&D subsidies (t) 0.02 1.65 0.10 0.02 1.68 0.09 ∆ log R&D subsidies (t-1) 0.02 2.12 0.04 0.02 2.12 0.03 ∆log sales (t) 0.06 2.42 0.02 0.06 2.18 0.03 ∆log sales (t-1) 0.05 2.03 0.04 newly founded 0.00 0.04 0.97 0.01 0.44 0.66 year dummy 1997 (ref 2001) -0.01 -0.44 0.66 -0.02 -0.64 0.52 year dummy 1998 -0.02 -1.10 0.27 -0.02 -1.16 0.25 year dummy 1999 0.02 0.85 0.40 0.02 0.71 0.48 year dummy 2000 0.02 1.01 0.31 0.02 0.92 0.36 Constant 0.02 1.16 0.25 0.02 1.51 0.13 nobs (firms) 1186 (422) 1186 (422) Implied long run subsidy ffect 0.06 0.06
a) One-step estimates based on heteroscedasticity robust standard errors. Data consist of all firm-year observations with non-missing and non-zero values of subsidies and sales.
Given the overall disappointing and fairly robust results of the econometric exercise, is FFF-funding at least a useful instrument to boost R&D-employment within small firms? The answer is “yes, in relative terms” and clearly “no in absolute terms”. To illustrate, take the extreme case of a one-person firm. One additional R&D-employee translates into a doubling of the existing stock of scientific labour (+100 %). A one-percent increase would induce the labour stock to rise by 0.07 %. To let it rise by 100 % FFF-subsidies would have to grow by (100/0.07)=1,428.6 %. Table 25 below illustrates this argument.
How to reconcile the unambiguous evidence of high behavioural additionality from the FFF-survey data with the moderate effects from the econometric approach? The first problem deals with the near impossibility to capture what Papaconstantiou und Polt (1997) call the “soft side of innovation” (networking, learning effects, cooperation, innovative behaviour… etc.). Except for the growth of R&D-personnel there is no such variable in the FFF-project database which could be regarded as a proxy for firms’ improved abilities to absorb new knowledge and accordingly we just estimated what is estimable. A second, arguably more technical problem, is introduced by the fact that the FFF requires companies to reveal certain performance indicators and firm characteris-tics only when they apply for funds. At this stage information from the three preceding accounting years are mandatory. But ex post figures are only implicitly available, and that only for supported firms repeatedly turning in new research proposals. For our purposes therefore the relevant sample 50 This specification has been suggested by Lach (2000). 51 Partial adjustment coefficient = (1- coefficient on the lagged endogenous variable).

62
set is highly selective and biased in favour of more or less continuous R&D-performers. Even if further behavioural changes for these were not subject to the law of diminishing returns, the need for an ever greater R&D-staff certainly is.
Table 25: Increase in FFF-subsidies necessary to employ one additional R&D-worker Coefficient Number of scientific Increase in FFF-subsidies on R&D-personnel necessary to hire one Size-classes log(subsidies) (various scenarios) more R&D-workera) all 0.04 40 62.5 7, colums 8-10 smaller 0.07 1 1428.6 7, colums 8-10 firms 0.07 12 119.0 7, colums 8-10 only 0.07 24 59.5 7, colums 5-7 medium- 0.05 25 80.0 7, colums 5-7 sized 0.05 62 32.3 7, colums 5-7 firms 0.05 99 20.2 7, colums 2-4 larger 0.02 100 50.0 7, colums 2-4 firms 0.02 300 16.7 7, colums 2-4 only 0.02 500 10.0 8, short-run effect all 0.02 40 125.0 8, long-run effect all 0.06 40 41.7
a) The following formula applies: ((((X+1)*100)/X) -100)/c, where X denotes the existing stock of scientific R&D-personnel and c gives the estimated coefficient on log(subsidies).
5.1.6 Concluding remarks
This sectin has addressed long-term behavioural changes emerging from FFF-participation, so-called “behavioural additionality”. Descriptive evidence from the survey data revealed that FFF-funding is indeed generating various dimensions of behavioural additionality:
• Around 80-85 % of the sample firms experience some degree of project additionality. • Acceleration additionalities arise for two in three firms. • The share of companies appreciating scale additionalities ranges between 60-74 %. • At least every other firm reports scope additionalities to have arisen from collaboration and
a fraction of over 62 % benefits from scope additionalities in as far as new research areas could be entered with the financial help of the FFF-scheme.
Results from some subsequent econometric exercises based on the linked company-project FFF-database turned out not that conclusive, however. In this context the first problem refers to the unavailability of appropriate measures for the mostly intangible merits of behavioural additional-ity. A second problem is introduced by the general unavailability of ex-post information which makes it hard to systematically evaluate additionality effects of FFF-funding. Conceivably, the greatest effects of FFF-funding on firms’ demand for high-skilled R&D-labour should be observ-able for firms that do not undertake R&D-activities on regular grounds. Unfortunately, however, it is exactly this type of firm which is hardest to assess and the relevant data set consists of “routine” R&D-performers only. Even if further behavioural changes for these were not subject to the law of diminishing returns, the need for an ever greater R&D-staff certainly is.
The FFF is therefore recommended to condition the provision with public assistance on the obli-gation to give ex post information.

63
6 Implications of the FFF-support: results of a survey of FFF customers
6.1. THE SURVEY AND SAMPLING
The main purpose of the survey is to get some idea on how the customers evaluate the working of the FFF. Consequently, we developed a questionnaire for only those companies which have ever sent in a research proposal to apply for R&D-funds.
For this purpose the FFF handed down to the project team a database containing the data set en-tries of all applicants since 1995. This database held more than 5000 entries. After deleting entries which held incomplete contact information (addresses, contact person) or were referring to joint ventures, 4190 entities remained in the gross sample.
Table 26: Sample for the survey N Percent gross sample (number of questionnaires dispatched) 4190 100 % not part of the basic population 48 1 % contact person retired, dead, has quit, is unknown 44 1 % firm closed or substantially re-organised 49 1 % no valid address 397 9 % revised gross sample 3652 87 %
Source: FFF
During fieldwork the gross sample was further reduced by about 13 % to a revised gross sample of 3652 units. The main reason for this further reduction was that 9 % of the addresses were out-dated. A small fraction (in particular university departments) of the original gross sample was actually not part of the basic population.
The questionnaire was a result of an intensive co-operation of the project team, mainly occurring on several joint workshops. The questionnaire was further send to the FFF with their helpful comments included in the final version of the questionnaire. To assure for comprehensibility, a pretest was carried out (see box).
BOX: PRETEST
For pretesting, the project team selected a sample of 50 FFF applicants randomly. The sample included 20 companies which were successful for FFF support with all their project proposals, another 23 companies which had experienced both success and failure while the remaining 7 companies did not receive any FFF support.
End of August, within two days, 44 of the 50 companies were contacted (by phone) and asked to partici-pate in the pretest. It turned out that 14 companies would not be willing or able to complete the draft questionnaire in particular due to a demanding time frame (full response within a week). For another 7 companies a proper respondent was not available because of holidays.
The remaining 19 companies received the draft questionnaire via fax and completed it within one week. Companies were encouraged to comment in particular on wording, availability of data and time required for answering; furthermore, they were asked to earmark any question difficult to answer or to interpret.

64
The project team contacted the respondents of the draft questionnaire by phone in order to also improve the understanding of how each question is being interpreted. The length of these interviews varied be-tween 10 and about 50 minutes; some of the interviewees had only minor problems while others discov-ered several critical points.
Most of the interviewees needed between 30 minutes and one hour for completion of the questionnaire. In particular respondents from larger firms saw a need to involve colleagues from at least one other organ-isational unit. Having received the feedback from the pretest, the project team modified the questionnaire. As a result, 54 questions remained unchanged while modifications became necessary for 7 questions and 4 new questions were added to the final version of the questionnaire.
After completion of the pretest fieldwork started in week 36 2003 as a prenotice letter was sent to the respondents. In the following week the questionnaires were dispatched. The receiver of the questionnaire was the technical project leader or the business administration manager. In week 40 a reminder letter with enclosed replacement questionnaire was posted to the firms, which had not yet responded.
Table 27: Response rate N Percent revised gross sample 3652 100 % realised sample (filled out questionnaires received on time) 1298 36 % latecomers 158 4 % refusals 425 12 %
Source: FFF; survey
Based on the revised gross sample, a quite satisfying response rate of 36 % could be realized. An-other 4 % of the revised gross sample returned completed questionnaires, but unfortunately too late for including them into the analyses. 12 % of the revised gross sample refused to participate in the survey.
6.1.1 Some basic features of the sample firms
As we use for the analysis some categorical variables the following section describes the sample firms according to these categories. It should be proofed if the categories are comprehensible and are useful for further analysis.
Sectoral affiliation
Out of the total sample of 1298 firms we could attribute to 1213 firms, in total accounting for 93.6 % of the sample firms, either one of the following four distinct aggregate branches, viz. tradi-tional industries (23.9 %), R&D-intensive industries (30.3 %), traditional services (11.2 %) and knowledge-intensive services (28.2 %). 72 firms (5.6 %) are attached to the primary sector and 11 companies (0.8%) failed to report their sectoral affiliation (see Table 28).52
Firm size
Second, four size-groups have been introduced, viz. companies with (i) less than 10 employees (synonymously referred to as the micro-sector), (ii) 10 and more, (iii) 100 and more and (iv) 250 and more employees. Table 28 below presents the joint distribution of the sample by sector-affiliation and by firm-size. Every third sample firm belongs to the micro-sector, a fraction of
52 For the classification of aggregate sectors, as well as detailed analysis see Appendix II.

65
broadly 70 % does not engage more than 100 employees and 14 % must be considered as large companies. FFF-application of the latter is subject to particular guidelines.
Table 28: Joint distribution of sector-affiliation and firm-size firm-size (by number of employees) Total across Sector-affiliation < 10 10 - 99 100 - 249 250 and more missing size-category Traditional industries 51 110 65 77 7 310 16.5 35.5 21.0 24.8 2.3 100 11.4 23.2 43.6 42.1 15.9 23.9 R&D-intensive industries 110 149 55 71 8 393 28.0 37.9 14.0 18.1 2.0 100 24.7 31.4 36.9 38.8 18.2 30.3 Traditional services 63 48 10 18 6 145 43.5 33.1 6.9 12.4 4.1 100 14.1 10.1 6.7 9.8 13.6 11.2 Knowledge-intensive 187 137 12 11 18 365 Services 51.2 37.5 3.3 3.0 4.9 100 41.9 28.9 8.1 6.0 40.9 28.2 others/miscellaneous 31 28 6 5 2 72 43.1 38.9 8.3 6.9 2.8 100 7.0 5.9 4.0 2.7 4.6 5.6 Missing 4 2 1 1 3 11 36.4 18.2 9.1 9.1 27.3 100 0.9 0.4 0.7 0.6 6.8 0.9
Total across branches 446 474 149 183 44 1296 34.4 36.6 11.5 14.1 3.4 100 100 100 100 100 100 100
Source: Survey
Firm-age
Though the survey data provides no information on either firm-age, or, equivalently, the year of foundation, this deficiency can be met by merging the survey data with the FFF-database contain-ing basic characteristics of every firm that ever sought for FFF-support. For 1104 sample firms the year of foundation could be reconstructed. The respective percentile-distribution is given in Table 29.
Table 29: Year of foundation (percentile-distribution) (N=1104) Percentile 1% 5% 10% 25% 50% 75% 90% 95% 99% Year of foundation 1850 1911 1945 1973 1990 1996 1999 2000 2001
Source: Survey
Ownership & location The survey contains some valuable information on ownership issues and, in parts, on factory loca-tion. Every third sample firm (N=417) is a group company. Roughly two-third of the combine subset (N=268) report the parent company to be located in Austria and, again, two-third of the latter subset (N=182) claim that some of the factories are located outside Austria.

66
Aggregate sales
Table 30: Aggregate sales (in Mio. €) Branch 2001 2002 growth rate Na) Traditional industries 15783.8 15838.5 0.3 269 R&D-intensive industries 15499.1 16010.7 3.3 343 Traditional services 1619.1 1764.5 9.0 100 Knowledge-intensive services 3424.1 3757.8 9.7 258 others/miscellaneous 1276.3 1298.3 1.7 48 Missing 139.1 148.8 6.9 7 Total 37741.4 38818.5 2.9 1025
Source: Survey a) Balanced sample: refers to the set of firms reporting data on sales and export rate for both accounting years 2001 and 2002.
Export performance
With respect to companies’ export performances, 13 % of the respondents state that sales are ex-clusively realized within Austria, while about the same share did not comment on export activities. 38 % of the total sample figure that on average at least half of their total sales are earned through exports.
Table 31: Aggregate export performance (levels in Mio. €)a) growth- implied export rate Branch 2001 2002 rate 2001 2002 Traditional industries 10112.2 10866.0 7.5 64.1 68.6 R&D-intensive intensive industries 11489.3 12199.6 6.2 74.1 76.2 Traditional services 471.2 493.0 4.6 29.1 27.9 Knowledge-intensive services 2820.6 3090.6 9.6 82.4 82.2 others/miscellaneous 577.9 613.5 6.2 45.3 47.3 Missing 90.8 98.8 8.8 65.3 66.4 Total 25562.0 27361.5 7.0 67.7 70.5
Source: Survey a) Balanced sample: refers to the set of 1025 firms reporting data on sales and export rate for both ac-counting years 2001 and 2002.
R&D-intensity
Table 32 depicts average R&D-intensity of various sub-sectors (panel (i)) and firm-size categories (panel (ii)). R&D-intensity is measured both, in terms of the average firm-wise share of R&D-personnel in total employment, and in terms of the average firm-wise R&D-expenditure share in total sales, respectively. Apparently, both measures generate fairly robust images of the inherent degree of R&D-intensity. Within the traditional industries and services the (absolute) majority of firms are characterized by very little R&D-activities. R&D-intensive industries by the majority fall into the group of medium R&D-performers, while the knowledge-intensive industries are consistently classified as top-performers. Likewise, the analysis by firm-size yields robust order-ings concerning the inherent R&D-intensity, but the size-pattern is not that conclusive as com-pared to the branch-pattern. As a matter of fact, small denominators generate high ratios, so that the mere size-effect dilutes the expressiveness of the measures.

67
Table 32: R&D-intensity of sample firms a) Average share of R&D-personnel in total employmenta) i) by sector-affiliation up to 5% up to 30% more than 30% missing Traditional industries 57.1 27.7 7.4 7.7 R&D-intensive industries 25.7 46.6 22.9 4.8 Traditional services 43.5 25.5 17.2 13.8 Knowledge-intensive services 11.2 28.2 52.3 8.2 others/misc. 33.3 30.6 19.4 16.7 Missing 27.3 27.3 18.2 27.3 ii) by firm-size less than 10 10.3 30.5 51.8 7.4 10 and more 31.9 44.1 19.6 4.4 100 and more 62.4 28.2 6.7 2.7 250 und more 64.5 25.7 6.0 3.8 Missing 2.3 0.0 0.0 97.7 Total 31.6 33.5 26.6 8.3 b) Average R&D expenditure share in total sales b) i) by sector-affiliation up to 2.5 % more than 2.5 % 15 % and more missing Traditional industries 49.0 24.5 9.4 17.1 R&D-intensive industries 24.2 38.4 21.6 15.8 Traditional services 40.0 25.5 12.4 22.1 Knowledge-intensive services 11.2 22.5 45.8 20.6 others/misc. 33.3 25.0 25.0 16.7 Missing 36.4 18.2 18.2 27.3 ii) by firm-size less than 10 15.0 21.8 43.1 20.2 10 and more 29.5 32.3 21.1 17.1 100 and more 47.0 36.9 8.1 8.1 250 and more 51.4 31.7 6.6 10.4 Missing 6.8 6.8 6.8 79.6 Total 28.9 28.2 24.6 18.3
Source: Surveya) average firm-wise number of R&D-employees in 2001 and 2002 (Question 9) measured as a share of average firm-wise total employment in 2001 and 2002 (Question 6); b) average firm-wise R&D-expenditure in 2001 and 2002 (Question 10) measured as a share of average firm-wise total sales in 2001 and 2002 (Question 4).
FFF participation
In this context an additional important categorical variable is experience with the FFF, i.e. compa-nies are grouped according to their former experiences with the FFF-support scheme. 1070 or 83 % of the sample firms have been provided with FFF-subsidies in the preceding 8-9 years, while proposals have been (repeatedly) turned down for 206 (16 %) of the survey participants. Since the ratio of FFF-treated to untreated firms amounts to ca. 5:1, the characteristics of FFF-subsidized will – by construction – not significantly deviate form the characteristics of the survey partici-pants.
58 % report that they have been provided with FFF-funds since 1995 and that none of their pro-posed projects has ever been turned down (“highly successful”, see Table 34). A very small group of 154 firms in total (12 %) is characterized by solely negative feedback as none of their applica-tions has been accepted since 1995. Finally, nearly 30 % of the sample firms have experienced both, acceptances, as well as rejections, respectively (“mixed feedback”).

68
Table 33: Experience with FFF Application has been rejected at least once? Yes No Missing total
Yes 320 717 33 1070 No 135 55 16 206
Qualified for FFF-support at least once? Missing 3 6 11 20 Total 458 778 60 1296
Source: Survey
Table 34: Success categories: absolute frequencies and shares FFF-feedback Abs. Frequency Percent highly successful 756 58.33 never successful 154 11.88 mixed 375 28.94 missing 11 0.85 Total 1296 100
Source: Survey
In spite of increasing rejection rates in the last two years, the chances to be provided with FFF-support are still fairly good. While in 2000 three out of four submitted proposals have been ac-cepted, the average rejection rate in 2001 and 2002 amounts to 33 %. In our sample 1070 compa-nies report to have successfully applied for FFF-assistance at least once, and 458 admit to have been rejected at least once. These figures translate into shares of 83 % and 35 %, respectively. Though the rejection rate of the surveyed firms approximately coincides with the average rejection rate in 2001 and 2002, the sample is most probably biased in favour of the successful candidates. After all, the rejection rate as calculated from the survey data is accumulative in nature.
6.1.2 Objectives and problems with R&D activities of FFF customers
70 % of the sample firms target at a greater variety of products with their R&D activity in general. From Table 35 the general notion arises that traditional and larger companies are able to list more particular goals which are to be pursued through engagement in R&D. Arguably, R&D is an inte-gral part of usual business activities within the R&D-intensive industries and knowledge-intensive services. But traditional manufacturing firms, as well as traditional servicing companies, seem to take the challenge of R&D to upgrade their production processes or to introduce process-innovations, respectively.
Table 35: R&D-activities are aiming at … Replacement
of prod. Greater vari-ety of prod.
Quality impr. of prod.
Improvements of processes
Process innovation
other
Size 0-9 18.6 61.9 45.3 18.4 34.5 7.4 10-99 31.9 73.6 53.0 31.2 43.7 4.9 100-249 42.3 77.9 65.1 43.6 48.3 4.7 250+ 44.8 78.7 65.6 55.2 55.2 5.5 Sector Traditional industry 33.2 74.2 53.9 47.7 56.1 2.9 R&D intensive industry 41.0 76.8 59.0 31.8 38.2 4.6 Traditional services 22.8 66.2 55.2 33.8 42.1 55.5 Knowledge intensive services 21.4 61.4 46.8 18.1 37.3 9.6 Total 29.9 70.1 53.1 31.3 42.7 5.9

69a) Refers to question 13 of the questionnaire. Percentage figures give the share within subgroups agreeing to selected “aims of R&D”.
Companies undertaking R&D apparently struggle with a great deal of problems. Only 29 firms failed to comment on the respective question and merely 35 respondents explicitly state to not face one or the other difficulty in the context of R&D. Below some selected problems are ranked in descending order of importance (see Table 36). The overall impression emerging is that the most frequently mentioned problems basically boil down to the number-one obstacle, viz. high cost of R&D-projects. A perceived “high commercial risk”, “low financial capacity”, or a “too long time to market” can be considered as dimensions of the cost problem. As expected, the most crucial obstacle to R&D-activities of micro-sector firms is given by their limited financial resources. The technological risk in turn is of little importance for micro-sector firms but it is more pronounced within the manufacturing sector.
Table 36: Problems related to companies' R&D-engagement (in %, N=1232) high cost 63.0 high commercial risk 49.8 time to market is too long 36.4 financial ressources are limited 35.6 high technological risk 34.2 little protection against risk of imitation 27.9 amortization of R&D-expenditures takes too long 24.8 no sufficient number of R&D-workers 14.0 little opportunities to cooperate with public R&D-institutions 10.1 little opportunities to cooperate with private companies undertaking R&D 8.7 internal problems to organise R&D 7.6 other miscellaneous problems 3.1
Source: Survey
6.2. CHARACTERISATION OF FFF-FUNDED PROJECTS
The following chapters aim at characterising FFF-funded projects in several respects based on a descriptive analysis. Firstly, we question whether there are firm (grouped to categories)-specific motivations to submit a project. Secondly, we describe FFF-funded projects in relation to projects funded by the firm solely. Thirdly, we look at the technical results of FFF-funded projects. Fourthly, we point at the differences between FFF-funded and not FFF-funded projects as to rea-sons for submission and project advancement.
One should bear in mind that the empirical analysis of the following chapters are related to one project - the last finalized project funded by the FFF (Question 33 of the questionnaire). In the case of not yet finalized projects we asked the respondent to think in their answers of the still on-going project. This is for reasons of comparison as we wanted the respondents not to think only of the most successful project which would have lead to a bias towards overestimation of success.
6.2.1 Main motivation for submission: high costs of R&D
High costs of R&D is the most important reason to submit a project for FFF funding; this is valid for all firm categories (see Table 37). To reduce the R&D risk of technical feasibility and FFF’s reputation as a quick funding possibility are two further important reasons why firms apply for FFF support. Furthermore the survey showed that the percentage of firms frequently submitting

70
R&D projects for FFF funding is small (usual way of R&D funding).53 Also possible spillovers to competitors are a rather unimportant reason for asking support in order to compensate external effects.
Table 37: Important / not-important reasons to submit a project to FFF (in %, multiple responses)
Important reasons Not important reasons Categories R&D costs Technical risks Quick aid Usual way of R&D funding Spillovers
Size 0-9 91.6 61.3 63.9 9.4 18.3 10-99 88.1 68.7 57.9 6.3 17.9 100-249 74.8 66.1 69.2 6.7 15.7 250+ 75.6 71.6 70.7 9.2 14.9 Sector Traditional industry 85.1 72.0 62.3 7.4 20.0 R&D intensive industry 82.7 68.5 69.6 7.2 17.2 Traditional services 86.7 62.4 63.1 6.3 22.0 Knowledge intensive services 85.6 60.5 57.5 9.7 12.5 Export (in % sales) Null 88.7 62.0 60.6 5.9 17.7 1-49 86.8 64.9 59.3 6.6 19.2 50+ 81.3 68.7 67.2 8.8 15.8 Competition Intense 85.6 69.8 62.1 7.6 20.8 Not-intense 84.1 61.4 62.5 8.2 12.8 R&D (in % sales) 0-2.5 81.0 71.0 60.2 7.8 20.4 2.6-14 83.5 70.2 65.4 5.7 15.4 15+ 89.2 58.9 61.6 8.8 13.6 Firm-structure Domestic multinational 75.3 64.0 71.8 6.5 15.7 Domestic concern 80.0 65.1 64.1 14.3 23.8 Foreign multinational 74.5 70.5 61.2 5.8 10.7 Domestic individual firm 89.6 66.2 61.8 7.7 17.6 Total 85.1 66.2 63.5 7.8 17.1
Source: FFF-survey 2003, basis: FFF supported firms. Domestic multinational (head office in Austria with branch(es) abroad), domestic concern (head office in Austria with national branch(es) only), foreign multinational (head office abroad with branch(es) in Austria), domestic individual firm (individual firm in Austria).
Firms of different size show the greatest differences with respect to the various reasons for a fi-nally successful submission. Small firms evaluate high costs of R&D as more important than large firms. This is quite different to the other important motives. Technical R&D risks and quick aid motivate larger firms (100+) stronger than smaller ones. Using FFF support as a usual way of R&D funding is found to be less frequent in middle sized firms than in large firms (250+) and small firms (0-9). Technical spillovers to competitors play a greater role for smaller firms than for larger ones.
The relative importance of different motivations is not related to sectors. For all but one sector (R&D intensive industry) reduction of R&D costs is more important than reduction of technical risks and access to quick aid. R&D costs are relatively unimportant, technical risks and quick aid relatively important for firms with high export rates (50+). In contrast, R&D costs are relatively more important for firms without exports. Fierce competition leads to a higher assessment of the motive of R&D costs, technical risks and – as expected – to a greater importance of spillovers to 53 There is no automatism both on the firms side (to submit) and on the FFF side (to fund).

71
competitors compared with firms in a less competitive environment. Firms with low R&D inten-sity (0-2.5) see technical risks and spillovers as relatively more important reasons for a submission than firms with greater R&D intensity. For latter R&D costs are relatively more important. Firm structure leads to greater differences in the evaluation of R&D costs, quick aid, routine and spill-overs. While individual firms report R&D costs as the relatively most important reason for a sub-mission, Austrian firms with international subsidiaries are relatively stronger motivated by quick aid. Austrian concerns (with subsidiaries only in Austria) submit more regularly projects for FFF funding than other types of firms. And they also see FFF-funding as a compensation for spillovers.
6.2.2 FFF-funded projects lead to R&D extension
FFF funded R&D projects primarily help firms to extent their R&D to new fields (71 %), 62 % of firms stated that the FFF funded project was conducted in cooperation with other firm(s) (see Table 38). And 58 % reported that the idea for the funded project was developed together with customers or suppliers or research partners. Which firm segments differ from this general picture?
FFF funded projects of larger firms are carried out more often in cooperation with research facili-ties than in cooperation with other firm(s). The opposite tendency is observed for smaller firms. This indicates that projects of larger firms are mainly cooperations between partners of different knowledge levels (basic vs. applied), while projects from smaller firms focus on cooperations on a similar knowledge level. No size related-differences are detected with respect to the sources of ideas for R&D projects (“in-house” or in cooperation with other actors).
Table 38: Characteristics of successfully submitted projects (in %, multiple responses) Categories Idea (cooperation) Idea (firm) Lead to R&D
extension Cooperation (re-search facilities)
Cooperation (firms)
Size 0-9 53.9 53.6 70.5 52.6 66.5 10-99 58.6 51.6 68.8 52.4 62.4 100-249 57.9 51.6 69.4 61.1 54.6 250+ 64.0 46.2 73.9 71.1 62.1 Sector Traditional industry 56.8 52.3 67.6 64.3 56.1 R&D intensive industry 58.0 52.7 71.4 52.9 61.8 Traditional services 55.3 55.8 58.8 60.6 71.7 Knowledge intensive services 60.3 47.6 76.6 55.4 64.7 R&D (in % sales) 0-2.5 59.9 47.3 60.8 59.4 60.9 2.6-14 55.1 55.0 72.8 55.0 58.4 15+ 61.4 46.0 77.0 54.7 64.3 Total 58.1 50.9 70.5 57.2 62.2
Source: FFF-survey 2003, basis: FFF supported firms
Traditional industries and traditional services are in some ways different from other sectors. Funded projects from the traditional industry primarily aim (like in other sectors) at R&D exten-sion, but in contrast to other sectors they cooperate quite often with research facilities. Traditional services show a very different picture compared to the general observation (see above). Their FFF funded projects are primarily conducted in cooperation with other firms. The next important char-acteristic is cooperation with research facilities and “R&D extension” can be found only at the third place. In addition the innovative idea is more often developed within the firm than in coop-eration with other actors. So one might conclude that the FFF funds more conservative organised projects focused on well known research areas in the traditional service sector as in other sectors.

72
Quite interesting is the great difference between “idea (cooperation)” (60 %) and “idea (firm)” (48 %) and the importance of R&D extension (77 %) in the knowledge intensive service sector. In combination with the high “ranking” for R&D extension this might reflect the open attitude and the relatively good development of this sector in the last years. The R&D intensity of firms do not influence the ranking of the mentioned characteristics. One can say that here are no exemptions from the rule (except one54). The results for firms with the greatest R&D intensity (15+) confirm the general picture as described above: 77 % of the FFF funded projects lead to R&D extension, 64 % are carried out in cooperation with other firms and the idea for these projects were born in 61 % of the cases in cooperation with other actors (customer, suppliers or research partners).
6.2.3 FFF-funded projects are technologically more difficult, more expensive and of longer duration
Based on the answers from firms with both FFF-funded projects and projects funded by the firm solely, it can be stated that FFF funded projects are in general more expensive, the technological problems are more difficult and takes longer to carry out the project (see Table 39). In addition the majority of firms report that there are no differences at to the type of research (applied or basic) and the easiness of commercialisation. Basically this holds true independent of how we classify the firms: according to size, sector, export intensity, competition, R&D intensity or firm structure. Nevertheless there are some exemptions: the majority (51 %) of very small firms (0-9) detects no differences in project costs between the two types of projects. Also funded projects of the largest firms (250+) are more oriented towards basic research than in other size classes. This supports the result that successfully submitted projects from large firms are very often carried out in coopera-tion with research facilities (see Table 38).
Grouped to industrial sectors, firms of the traditional service sector and the knowledge intensive service sector do not see differences in project costs between FFF aided and not externally sup-ported projects (projects funded by the firm solely). Also more firms in the traditional service sector report that the two types of projects do not show a different duration. While firms in the industry sectors reflect the above mentioned “rule”, firms in the service sectors show some differ-ent patterns which may be due to different product characteristics and/or research processes.
54 60.9% of firms with a low R&D intensity (0-2.5) stated that FFF funded projects are conducted in cooperation with firms, 60.8%
stated that projects led to R&D extension. The “rule” is the other way round: “lead to R&D extension” should be higher ranked than “cooperation (firms)”. The figures are rather similar so that one can hardly speak of an real exemption.

73
Table 39: Comparison of FFF-funded projects and not externally funded projects (in %)
Categories Project-costs Technology Research Project duration Commercialisation
High Nor Low Diff. Nor Easy Basic Nor Appl. Long Nor Short Diff. Nor Easy
Size 0-9 44.6 51.4 4.1 51.1 45.3 3.6 25.7 59.2 15.1 47.5 43.0 9.5 31.1 61.3 7.7
10-99 53.8 40.9 5.4 63.8 34.6 1.6 30.6 54.5 15.0 57.6 36.6 5.7 35.4 58.0 6.7
100-249 54.1 41.8 4.1 63.4 34.2 2.4 37.5 53.3 9.2 48.3 47.5 4.2 40.5 52.1 7.4
250+ 50.0 46.8 3.2 71.0 28.4 0.7 40.4 45.7 13.9 63.0 34.4 2.6 33.1 63.0 3.9
Sector Traditional ind. 54.1 41.4 4.5 68.9 30.2 0.9 34.4 51.6 14.0 60.7 35.7 3.7 40.0 54.0 6.1
R&D intensive ind. 54.6 40.9 4.5 64.1 33.5 2.4 33.0 52.6 14.4 57.4 38.1 4.5 34.5 60.7 4.8
Traditional serv. 46.7 50.7 2.7 52.0 42.7 5.3 25.3 58.7 16.0 41.3 49.3 9.3 25.0 63.2 11.8
Knowl. intensive serv. 42.3 52.4 5.3 53.9 43.8 2.4 33.0 53.9 13.1 49.8 40.1 10.1 32.7 59.6 7.7
Competition Intense 46.9 47.6 5.5 62.7 35.6 1.7 31.9 55.4 12.7 54.8 39.5 5.8 38.3 55.0 6.7
Not-intense 55.3 42.0 2.7 59.9 37.1 3.0 31.5 53.0 15.5 53.6 38.8 7.6 30.2 63.1 6.7
R&D (in % sales) 0-2.5 49.2 47.6 3.3 60.7 37.7 1.6 31.4 53.3 15.3 53.3 43.4 3.3 36.3 58.0 5.7
2.6-14 57.0 37.6 5.4 68.8 29.0 2.2 31.9 56.7 11.5 59.3 34.8 5.9 36.2 57.6 6.3
15+ 43.5 53.4 3.1 56.5 41.4 2.1 35.6 50.3 14.1 49.7 40.3 10.0 31.6 58.6 9.8
Total 50.6 45.0 4.4 61.5 36.3 2.2 32.2 53.7 14.1 54.3 39.7 6.0 34.4 59.0 6.6 Source: FFF-survey 2003, basis: firms with FFF-aided projects and with projects funded solely by the firm
The competitive environment and the R&D intensity of a firm do not cause a substantial deviation from the general pattern as well. Differences are only detected in relation to the project costs. The majority of firms exposed to fierce competition and also the majority of firms with greater R&D intensity (+15) see - in deviation from the “rule” - no differences in project costs between FFF-funded and solely internally funded projects.
6.2.4 Majority of Firms: FFF funded projects have no impact on other R&D projects
In most of the cases FFF funded projects have no impact on other R&D projects within the same firm. They are carried out as planned (58 %). This gives an impression that firms plan their re-search activity independent of FFF support and/or FFF funded projects are not of immediate im-portance. Latter is supported by the fact that only 7 % of the firms stated that they postpone other projects in order to start with the FFF funded project. Only in very small firms (0-9) and firms with an export intensity between 1 and 50 % FFF funded projects have clearly an above-average importance (see Table 40). Furthermore it has to be considered that 21 % of the firms have solely FFF funded projects. For these firms the just mentioned argument is not valid. Especially smaller (34 %) and individual firms (28 %) and firms in the traditional service sector (38 %) have only FFF funded projects.
In 25 % of the cases FFF funding leads also to an extension of existing projects or/and new R&D projects. This means also that in most of the cases FFF funding contributes to existing firm-specific “research-paths” and to a lesser extent to broaden the research activities of a firm. This somehow contradicts to the overall research aim of firms to extent their R&D fields (see Table 38). It seems that FFF funding is important and intensifies R&D but it is not enough financial support to start “radically” new projects. This average assessment applies to smaller individual firms with rather low R&D intensity and null or few export activities. In contrast, FFF funding has a much greater impact on other R&D projects in larger firms (39 %), in R&D intensive Industries

74
(31 %), in export intensive firms (30 %) and in R&D intensive firms (29 %). Also individual firms notice (to above 30 %) that FFF funding has a broad impact on their R&D activities.
Table 40: FFF funded projects: impact on other R&D projects (in %, multiple responses) Categories Postpone other projects Add on and/or start
new projects No impact on other
projects No other projects
Size 0-9 9.0 20.8 43.1 34.2 10-99 7.1 22.2 59.9 21.7 100-249 3.7 26.1 69.4 11.2 250+ 4.2 38.7 72.0 4.2 Sector Traditional industry 5.1 21.4 66.5 17.5 R&D intensive industry 8.7 31.0 59.4 15.5 Traditional services 5.6 21.5 43.0 38.3 Knowledge intensive services 6.9 22.7 55.2 24.2 Export (in % sales) Null 3.5 19.8 45.7 36.2 1-49 10.3 22.0 54.8 22.7 50+ 5.0 29.6 67.6 12.5 Firm-structure Domestic multinational 3.5 32.2 72.5 7.0 Domestic concern 4.2 33.8 62.0 16.9 Foreign multinational 4.4 30.7 72.8 6.1 Domestic individual firm 8.2 21.5 51.3 27.8 Total 6.7 25.0 58.0 21.2
Source: FFF-survey 2003, basis: firms with FFF-aided projects. Domestic multinational (head office in Austria with branch(es) abroad), domestic concern (head office in Austria with national branch(es) only), foreign multinational (head office abroad with branch(es) in Austria), domestic individual firm (individual firm in Austria).
6.2.5 FFF-Funding Results: New or improved products/services are most frequent
63 % of all firms stated that they have achieved their technical goals in an FFF funded project totally, 35 % partly and 2 % have admitted a failure. That is a quite impressing performance for R&D projects. But what are the main achievements in greater detail?
More frequently FFF support leads to new or improved products or services (54 %), especially in middle-sized and large firms. Firms in the knowledge-intensive service sector (63 %) reached this goal more often than firms in other sectors. This is quite in accordance with the dynamic devel-opment of this sector in the last few years, which was heavily based on service/product innova-tions. Also exporting firms – most of the time exposed to fierce competition – as well as R&D intensive firms show an above-average performance in product/service innovations (see Table 41).
FFF funding resulted in a prototype in 37 % of the cases. Mainly middle-sized firms (39 %) and firms in the R&D-intensive industries (40 %) achieved this result. Serial prototypes are more often reached in the R&D intensive industry (36 %) than in any other sector. Also export intensive firms clearly show a better performance in serial prototypes than less export intensive firms or firms that do not export at all. This result may be due to some sectoral/branch effects55 which can not be detected in this descriptive analysis.
55 It might be necessary in some branches to build a serial prototype and in some other branches not. In case that serial prototypes are
more important in branches with high export rates than in others, this would deter the descriptive results and make an interpretation difficult.

75
To apply for a patent does not seem to be of high priority for FFF funded projects - on average 28 %. Medium-sized firms (29 %), the traditional service sector (33 %) and export intensive firms (32%) are above the average. Although internationally oriented firms tend to apply for patents more often than firms mainly active on national markets, firm structure may also play an impor-tant role in this respect. Multinational firms more often apply for patents than other firms do. Thus firms’ patent policy is probably not related to FFF funding. It is more a question of organisational routines of how to protect R&D results.
Table 41: Results of the FFF funded projects (in %, multiple responses) Categories Feasibility
study Patent Prototype Serial proto-
type New/improved product/service
Process innovation
Size 0-9 50.0 27.3 27.3 31.8 45.5 13.6 10-99 25.2 23.6 34.7 26.4 51.6 18.2 100-249 24.2 28.7 38.5 28.9 56.5 28.7 250+ 26.3 23.3 36.8 28.6 51.9 33.1 Sector Traditional industry 23.3 32.9 36.1 33.7 48.2 45.8 R&D intensive industry 27.0 32.9 40.4 36.2 53.9 21.6 Traditional services 31.5 33.3 37.0 23.2 48.2 29.6 Knowledge intensive services 26.5 15.4 34.9 19.1 62.5 15.8 Export (in % sales) Null 38.6 21.1 36.0 19.3 51.8 16.7 1-49 26.7 24.8 36.8 29.9 58.7 29.1 50+ 22.8 32.3 37.8 30.9 54.2 29.0 R&D (in % sales) 0-2.5 28.9 26.1 30.4 27.9 52.5 36.1 2.6-14 24.4 29.5 40.6 32.1 58.1 27.0 15+ 26.1 24.1 36.0 26.9 59.3 20.6 Total 26.3 27.5 36.7 28.6 54.4 27.0
Source: FFF-survey 2003, basis: FFF supported firms
27 % of the firms stated that their last FFF funded project brought out in a new or improved proc-ess. Process innovation point at the efficiency aspect of a firm, which lays in the core of larger firms. So it is not surprising that larger firms, firms in the traditional industry sector and export intensive firms reported this more often than others. Feasibility studies are a rather seldom result of FFF funded projects (26 %). Very small firms (0-9) and firms in the traditional service sector reached this R&D result most often. It seems that they are the result of smaller R&D projects or a first step on the way to a more comprehensive R&D project.
6.2.6 To open up a market: primary goal for commercialisation
Firms commercialise FFF funded projects primarily to open up new markets (67 %). This is a “logical” continuation of the FFF-funding. Successfully submitted R&D projects extent the R&D fields of the firm in 71 % of the cases (see Table 38). So it is obvious that firms’ R&D goals and FFF funding practice are coherent. This is valid for all kind of firms especially for firms with high R&D intensity (15+) (see Table 42). The second important goal for commercialisation is to in-crease/maintain market shares abroad (51 %). R&D seems to be the key for maintain-ing/augmenting activities abroad for many Austrian firms. More often than other large firms and firms in the industry sector (R&D intensive and traditional) as well as export intensive firms and firms with international branches commercialise FFF-funded project in order to strength their

76
international presence. This is of primary importance for the largest firms (250+) and Austrian firms with international branches.
Larger firms in a small, open economy like Austria need to be well positioned on international markets. So it does not wonder that the third important goal is again related with markets abroad. Firms commercialise the results of R&D in order to maintain/increase their export share. Again this is more important for larger firms, firms in the R&D intensive and traditional industry, export intensive firms and internationally fragmented Austrian firms and Austrian firms with national branches only. Latter don not have branches abroad but nevertheless export markets are important.
Table 42: Commercialisation of the results of R&D: the four most important goals (in %) Categories Open up new Markets Maintain/increase
market share abroad Maintain/increase
export share Maintain/increase
national market share Very imp. Not imp. Very imp. Not imp. Very imp. Not imp. Very imp. Not imp. Size 0-9 69.8 2.0 45.2 13.1 44.1 15.6 47.1 8.0 10-99 68.3 1.1 49.2 4.8 49.3 8.0 43.3 7.8 100-249 63.5 1.6 54.8 8.1 50.0 7.3 37.1 7.3 250+ 62.3 2.0 64.9 4.6 53.9 7.7 39.2 7.2 Sector Traditional industry 60.2 2.5 55.7 5.2 50.9 7.3 41.5 9.2 R&D intensive industry 68.5 0.6 64.0 2.6 59.3 3.5 40.3 9.6 Traditional service 71.0 3.0 42.9 13.3 48.0 12.2 58.0 6.0 Knowledge intensive service 68.6 1.6 35.9 13.3 36.3 17.1 40.2 6.4 Export (in % sales) Null 65.1 1.9 23.7 24.7 22.7 29.9 47.0 7.0 1-49 66.7 0.8 48.9 5.6 50.3 8.4 53.1 3.6 50+ 67.6 2.5 64.2 2.3 55.6 4.2 32.9 10.5 Firm-structure Domestic multinational 64.2 1.9 65.0 4.4 56.9 5.6 39.2 8.2 Domestic concern 73.0 3.2 63.9 6.6 62.9 9.7 43.6 4.8 Foreign multinational 69.8 1.9 56.6 2.8 44.9 9.4 31.1 12.3 Domestic individual firm 66.3 1.3 45.4 9.3 45.3 11.3 46.0 7.1 Total 66.8 1.7 51.3 7.8 48.3 10.2 43.1 7.8
Source: FFF-survey 2003, basis: FFF supported firms which plan to commercialise the results of R&D. The firms an-swered based on a five point likert-scala. The table shows the two points: very important and not important. Domestic multinational (head office in Austria with branch(es) abroad), domestic concern (head office in Austria with national branch(es) only), foreign multinational (head office abroad with branch(es) in Austria), domestic individual firm (indi-vidual firm in Austria).
Very small firms (0-9) commercialise the results of R&D very often in order to maintain or in-crease their national market share. This is for them of secondary importance right after “open up new markets”. Firms in the traditional service sector and exporting firms (1-50) also assess this goal to be of above-average importance. Furthermore it is interesting that the commercialisation goals don not vary much with the R&D intensity of firms. This means that these goals are set rather independent of the size or relatively importance of the R&D department. Also it is worth mentioning that “to increase productivity” is only a goal of some importance.
6.2.7 Firms’ motivations and project advancement: differences between successful and unsuccessful FFF submissions
There are no significant differences in motivations between firms which successfully submit R&D projects for FFF-funding and those which unsuccessfully do so (see Figure 18). In both cases high R&D costs are the main motivation for submission. The motives “decrease of the risk of commer-

77
cialisation” or “easy access to R&D money” or “compensation of R&D spillovers to competitors” are ranked at fourth, fifth and sixth position, respectively. Only the motivation to cover “technical risk” and “no other funding” possibility, change the position in dependence of successfully or unsuccessfully submitted projects; FFF-funded projects are more often motivated by “technical risk” reduction than not FFF-funded projects. The contrary is valid for “no other funding”.
Figure 18: Motivations - Differences between successful and unsuccessful submissions (in %)
0 10 20 30 40 50 60 70 80 90
usual way of R&D funding
spillovers
internal R&D money
commercial risk
no other funding
technical risks
R&D costs
% of Responses
not FFF-fundedFFF-funded
Source: FFF-survey 2003, basis: all firms
The more advanced a R&D project is the more information (technical, market possibilities etc.) is available and the lower is the risk of a failure. In Figure 19 different stages of a R&D process are mapped. An idea is followed by a concept, which has to be developed before a prototype can be built. Finally commercialisation shows whether the new/modified product/service or process is a market-success or a market-failure. Based on this serial concept of an R&D process it can be seen that R&D projects are funded by the FFF on every stage of development.
Figure 19: Project advancement – Differences between successful and unsuccessful submissions (in %)
0 10 20 30 40 50 60
commercialisation
prototype
idea
development
concept
% of Responses
not FFF-fundedFFF-funded
Source: FFF-survey 2003, basis: all firms
R&D projects submitted at the idea-stage received more often a FFF-funding than not. Also at the following concept-stage a positive decision was more likely than a negative one (see Figure 19). This picture changes with the development-stage, the prototype-stage and the commercialisation-

78
stage. On these levels the FFF issued more often a negative funding decision than a positive one. The differences are rather great with respect to the prototype- and commercialisation-stage. That means that the differences increase the more advanced the R&D project is. Ceteris paribus R&D projects are more likely to be funded than the less advanced ones. Having in mind that an R&D project becomes less risky the closer it comes to commercialisation, one can conclude that the FFF funds more risky projects more often than less risky ones, which should be part of the FFF-mission.
6.3. LICENSES, PRODUCTS AND PROCESSES
The main aim of the FFF funding for industrial R&D projects is to ‘… strengthen the competi-tiveness of business in Austria and thus help to secure employment, production and wealth in Aus-tria.’ (FFF-mission). Research and development is among the most important factors of business success. It rises directly or indirectly the technological innovation ability of the industry in order to generate new products, processes and services.
The following section deals with the results of the FFF-support and is based on several questions of the survey related to all funded and already finalized projects for the period 1995 – 2003. We thus asked the respondent to think in his or her answers of all of the funded and already finalized projects and to give in the case of more than one project an assessment of the average.
6.3.1 Time to market
The time to market for the project results was an issue explored in the survey. Based on all funded and already finalized projects the respondents were asked to give the length of time when the products were expected to enter the market and/or new processes were introduced and economi-cally utilized. The majority (65 %) of the project results were expected to enter the market within two years after project end. Within this group almost half reported the entry to the market during the first year after the end of the project. The average time length between the end of the project and market entry was 2,2 years (Median=2 years).
Figure 20: Time to market from the end of project to market entry (N=855) (1995-2003)
0
5
10
15
20
25
30
35
40
< 1 year < 2 years < 3 years < 4 years < 5 years > 5 years
<10>=10>=100>=250
0
5
10
15
20
25
30
35
40
45
< 1 year < 2 years < 3 years < 4 years < 5 years > 5 years
Traditional industries
R&D-intensiveindustriesTraditional services
Knowledge-intensiveservices
Source: survey
In general, there also does not seem to be major differences in the time to market by firm size. At least 85 % of all projects in all firm size categories had launched the product to market within three years after project end. However, whereas 59 % of the micro firms reported the market entry within two years this ratio increases to 72 % within the group of the big firms. Based on the an-

79
swers given to this question it can be concluded that big firms are more efficient in commercializ-ing the research results and are faster in terms of time to market.
6.3.2 Licenses
Out of the projects funded and finalized between 1995 and 2003 we were interested in those firms which achieved revenues from licenses. We started this block by asking the firm whether they received license revenues (yes or no). About 18 % of the respondents indicated this question with yes. The analysis by firm size however shows a significant difference between the classes: while 25 % of the micro firms achieved revenues this ratio decrease to about 11 % within the bigger firms.
Figure 21: Licenses by size and sector in % (N=862) (1995-2003)
0
5
10
15
20
25
30
< 10 >= 10 >=100 >=250 total
0
10
20
30
40
Traditionalindustries
R&D-intensiveindustries
Traditionalservices
Knowledge-intensiveservices
Source: survey
An even higher difference shows the comparison between the sectors of activity: nearly 38 % of the firms in the knowledge-intensive services reported license revenues as a project outcome. Thus it confirms the assumption that revenues from licenses are concentrated on the knowledge-intensive service sector (software, data-processing etc.).
The respondents were further asked to give an estimate of the total license revenues out of the FFF projects for the whole period (1995 – 2003). Although it is difficult to answer 118 firms filled in and gave a rough estimate of the revenues: due to a high standard deviation we focused on the median value. The median value of revenues out of licenses for the whole period was 110 tsd. Euro. The following Figure 22 shows the allocation of revenues by firm size and sector. Although the knowledge-intensive sector exhibit the highest share of firms reporting license revenues the volume of the revenues shows a focus on bigger firms in the R&D-intensive sector.
Figure 22: License revenues by size and sector for the period 1995-2003(N=118)
0
50
100
150
200
250
300
350
<10 >=10 >=100 >=250 Total
size class
Med
ian
in ts
d. E
uro
0
50
100
150
200
250
Traditionalindustries
R&D-intensiveindustries
Traditionalservices
Knowledge-intensiveservices
sector affiliation
Med
ian
in ts
d. E
uro

80Source: survey
6.3.3 Products and Processes
The general orientation of the projects was assessed by asking the respondents whether a market-able product, service or process was developed as a project outcome during the period 1995 – 2003 (yes or no). In general, the overwhelming part of the funded projects was market-oriented: 81 % of the respondents answered that a marketable product/service was developed out of the results of a FFF-funded project. 42 % of the respondents said that new processes were developed.
Product development does not seem to depend very much on firm size, although bigger firms indicated a 10-percentage points higher rate of product developers than within the group of smaller firms. The development of new processes tends to be more oriented towards larger firms. Among R&D-intensive industries, the likelihood of having a marketable product as the result of a FFF-project was 85 % whereas for process development the sector of traditional industries exhib-its the highest probability (Figure 23).
Figure 23: Product/Process development by size and sector (1995-2003) product development
65
70
75
80
85
90
<10 >=10 >=100 >=250 total
process development
0
10
20
30
40
50
60
<10 >=10 >=100 >=250 total
product development
65
70
75
80
85
90
Traditionalindustries
R&D-intensiveindustries
Traditionalservices
Knowledge-intensiveservices
process development
0
10
20
30
40
50
60
70
Traditionalindustries
R&D-intensiveindustries
Traditionalservices
Knowledge-intensiveservices
Source: survey
We further asked the respondents for an estimation of the following issues (see Figure 24).
• how many new marketable products were developed out of FFF-projects since 1995; • the share of marketable products out of FFF-funded projects on all new products since
1995; • finally we asked the respondents for an estimation of the share of the marketable products
out of FFF-funding (1995-2003) on the total turnover of the last business year.
The response rate on these questions was astonishing high. Concerning the first issue marketable products were rather concentrated on a few products: for 30 % of the respondents one marketable

81
product resulted out of the FFF-funding for the whole period 1995 - 2003. 90 % answered that not more than 9 products emerged out of the funding. Only 10 % of the answering firms (N = 625) reported that more than 10 products were developed out of FFF-projects – with one firm, which answered that 300 products were developed (!).
The share of new and marketable products out of FFF funding on all new developed products is quite high for some firms. For 25 % of the respondents the share lies between 0 and 10 % of all new products. Two thirds of the answering firms see the ratio up to 50 %. But for another 20 % of the respondents the share on new products is between 70 and 100 % of all new products or ser-vices.
Correspondingly the share of FFF induced products on the total turnover of the last business year reaches for some firms a ratio of 100 %. However, for 25 % of the respondents the share on total turnover lies between 0 and 5 %. Up to 50 % of the responding firms assess the share between 0 and 15 % and for 20 % of the firms the share lies between 50 and 100 % of the total turnover.
Figure 24: Impact of FFF funding on product development (y-axis = cumulative percentage of answering firms)
0102030405060708090
100
0 10 20 30 40 50 60 70 80 90 100
share on total turnover in % N = 647
0102030405060708090
100
0 10 20 30 40 50 60 70 80 90 100
share of all new products in %N = 573
01020304050
60708090
100
0 10 20 30 40
number of productsN = 625
Source: survey
Now the question emerges of what are the characteristics of the firms, which attribute a high share of new developed products and/or a high share of turnover to formerly FFF funded projects?
We focused on the average share of new products out of FFF funding on total turnover of the last business year. We analyzed the sample according to two categories: by size classes and by found-ing year. The results are presented in Figure 25 and show that for young firms as well as small firms the share of new products out of FFF projects is higher compared with the other categories. The Median within the group of micro-firms is 30 – meaning that 50 % of the answering micro firms indicate higher and 50 % indicate lower shares. The same approach can be applied to firms according to their founding year. Younger firms exhibit a higher share than older firms.
Figure 25: Share of new products out of FFF funding on total turnover (last business year)
0
5
10
15
20
25
30
35
<10 >=10 >=100 >=250
size class
Med
ian
0
5
10
15
20
25
1960-79 1980-89 1990-2002
founding year between ...
Med
ian

82Source: survey
The same kind of analysis was used for calculating the attribution of the FFF for the period 1995-2003 in relation to process developments. About 90 % of the respondents assessed that not more than 5 process innovations came out of the FF funded projects. Concerning the share on all proc-ess innovations half of the responding firms said that the FFF contributed to about 20 % of all their process innovations in the period 1995-2003.
Figure 26: Impact of FFF funding on product development (y-axis = cumulative percentage of answering firms)
01 02 03 04 05 0
6 07 08 09 0
1 0 0
0 5 10 15 20 25 30 35 40
n u m b e r o f p ro ce sse sN = 3 06
01 02 03 04 05 06 07 08 09 0
1 0 0
0 10 20 30 40 50 60 70 80 90 100
sh a re o f a l l n e w p ro ce sse s in %N = 2 75
Source: survey

83
7 Main findings
As to the effect of FFF subisidies on firms’ own R&D expenditures, the input additionality, the evidence of our exercise can be interpreted as leaning towards complementarity: the results of the econometric analysis certainly point in this direction. Although any econometric analysis is bound to be confronted with a vast amount of ‘noise’ hidden in the data base and all other effects and sources of R&D funding are not completely covered in the data base it is unlikely that this would completely alter the results – after all, the FFF accounts for about 80 % of all public subsidies to private R&D.
As for the leverage of FFF funding’s numerical value, the analysis seems to place it at about 40 %; 1 additional euro of funding (or, to be more precise, of its present value) induces firms to contrib-ute an additional 40 cents of their own money. Both very small and large firms seem to exhibit higher leverage, small and medium-sized firms smaller leverage. Additionally, the leverage esti-mates for firms which perform R&D only occasionally are higher than for regular R&D perform-ers.
The aggregate mean R&D subsidy ratio, i.e. the ratio of the sum of R&D subsidies to the sum of total R&D expenditures, is about 4 % on average and quite stable over time. Furthermore, the R&D subsidy ratio ranges between 18 % in the smallest firm size class (0-9 employees) and 2.4 % in the largest size class (500 or more employees). Firms that are five years old or less have an R&D subsidy ratio of about 5.8 % as compared to that of firms that are more six or more years old with an R&D subsidy ratio of about 3.5 %.
The results further show that the ratio of R&D subsidies to total R&D expenditures is significantly negatively related to both firm size and the current R&D to total turnover ratio (i.e. R&D inten-sity). This suggests that firms with a high R&D intensity have a lower R&D subsidy ratio. Fur-thermore, the R&D subsidy ratio continuously decreases with firm size, i.e. the bigger the firms the smaller the R&D subsidy ratio. Firms founded in the last five years have a significantly higher R&D subsidy ratio of about 31 % on average compared to firms that are 6 or more years old. In contrast, fast output growth in the past is associated with a lower R&D subsidy ratio. This indi-cates that the fund gives higher subsidies to firms with a low output growth in the past.
Concerning the productivity effects, or output additionality, we find that the amount of FFF subsi-dies as well as privately financed R&D expenditures (both expressed as a percentage of sales) have a significant and positive effect on the labour productivity growth rate in the following years. In particular, we find that the productivity effects of publicly funded R&D were much lower than those estimated for privately funded R&D as indicated by the elasticities. However, the magnitude of the productivity effect of R&D subsidies is quite large given the median R&D subsidy sales ratio of 0.4 %. Given the elasticities, we also calculate how much of the observed change in output per worker can be attributed to the effects of publicly and privately funded R&D. Combined, both funding sources of R&D account for 24 % of the change in output per worker per year. However, the contribution of publicly funded R&D is less than 2 %-points, while the contribution of pri-vately funded R&D is 22 %-points.

84
FFF funding has effects on behavioural additionality, i.e. long-term behavioural changes emerge from FFF-participation. Descriptive evidence from the survey data revealed that FFF-funding is generating various dimensions of behavioural additionality:
• Around 80-85 % of the sample firms experience some degree of project additionality, i.e. in the case of rejection the project would have been cancelled or carried out in a revised ver-sion.
• Acceleration additionalities arise for two in three firms, i.e. FFF-funding is speeding up the course of the project. To put it the other way round, two out of three respondents agree that in the case of rejection the project results could only be exploited at some later date than originally aimed at.
• The share of companies appreciating scale additionalities ranges between 60-74 %. Thus re-jected firms state to have carried out the project on a smaller scale when FFF-support had been denied.
• At least every other firm reports scope additionalities to have arisen from collaboration and a fraction of over 62 % benefits from scope additionalities in as far as new research areas could be entered with the financial help of the FFF-scheme.
Results from some subsequent econometric exercises based on the linked company-project FFF-database turned out not that conclusive, however. It turns out that the demand for high-skilled R&D personnel is only marginally affected by additional FFF-assistance. Instead, it is rather driven by fundamental performance indicators such as total annual sales. Especially larger firms hire additional R&D-labour irrespective of additional FFF-funding.
Some remarks on the FFF data base
The analyses of input and output additionality, as well as parts of the work on behavioural addi-tionality, made extensive use of the FFF’s data base of firm-level variables, i.e. turnover, cash-flow, export share, number of employees, number of research staff. When applying for FFF funding, firms have to provide these data for the three years prior to the application. By this design, firm-level and project-level data refer to completely separate periods. To be able to es-timate the effect of FFF funding on firm characteristics (R&D expenditures in the case of input additionality, growth in turnover for output additionality), the analyses had to rely on firms which repeatedly approached the FFF, thus allowing for the construction of overlapping firm level-project level time series. By this approach, firms which ask for funding only rarely are in essence lost to this sort of analysis. Unfortunately, this introduces significant bias, as it is pre-dominantly smaller and/or newer firms which are more likely to be “irregular” FFF customers.
To close this gap, the collection of firm-level data at later stages in the funding process should be introduced; the “final report” which has to be submitted at the end of each project would lend itself as a logical opportunity for collecting the “missing years”.
To assess the (commercial) results of funded projects, moreover, the FFF might contemplate to add an additional layer to its report system. As a survey of FFF customers showed, a majority of projects reaches marketability some 2-3 years after the completion of the research phase. Thus, a short, standardized questionnaire (probably modelled on an abridged version of the survey used in this evaluation) could be sent to the performers of FFF-funded projects, asking about commercial results. The standard time frame for this follow-up survey should be about 4 years after the final report. For very long-term (and costly) projects, a revisit after maybe a further 2 to 6 years could provide valuable information on the long horizon.
This questionnaire, of course, could also be used to construct even longer time series of firm-level data. For all firm-level data, at whatever stage they are collected, a higher degree of stan-dardisation would be welcome: for example, it is not clear which definition of cash-flow should

85
be used. Similarly, when asking about the number of research staff and research expenditures, firms should be provided with a short explanation of who and what should be included in these numbers – and also whether research staff is supposed to be a simple head count or rather meas-ured in full-time equivalents. Additionally, the FFF should require in the application form the NACE code of economic activity of the firm (in addition to the assignment of codes for the economic activity of the project).
Concerning the implications of FFF-funding from the clients’ point of view, as reported in a sur-vey of 1,300 firms, the following findings can be summarized:
• To cover high costs of R&D, to reduce the risk of technical development and the FFF’s reputation for providing quick aid, are the main motivations for firms submitting projects to the FFF. Furthermore the empirical results showed that the FFF fulfils these expectations: the FFF primarily funded technologically more advanced (difficult) projects, which were more expensive and of a longer duration.
• The majority of firms reported that FFF funded projects have no impact on other R&D pro-jects within the firm. On average only ¼ of the firms said that FFF funded projects led to an extension of existing projects or were the reason to start a new one. This implies that FFF funding is important and intensifies R&D activities of the funded firms. But it also shows that FFF funding has no direct impact on other R&D projects in ¾ of the funded firms. So the FFF support helps to pursue the already existing “research path” within the firm but has not enough financial power to encourage firms to start “radically” new projects or to push a lasting technological change within the economy.
• 63 % of all firms stated that they have achieved their technical goals in an FFF funded pro-ject totally, 35 % partly and 2 % have admitted a failure.
• Commercialisation: In more than half of the cases FFF support leads to a new or improved product or service. The commercialisation of the results of FFF funded projects enables the firm in around 2/3 of the cases to open up new markets.
• R&D projects are funded by the FFF at every stage of development. R&D projects are more likely to be funded than less advanced one. Having in mind that an R&D project becomes less risky the closer it comes to commercialisation, one can conclude that the FFF funds more risky projects more often than less risky ones.
An average assessment of FFF-support based on all funded and already finalised projects for the period 1995-03 shows the following:
• The average time length between end of project and the commercialisation of the product or service was about 2 years whereby bigger firms are more time-efficient in commercialising the research results, i.e. they are fast in terms of time to market than smaller firms.
• About 18 % of the clients reported licence revenues out of the FFF project. The median value of revenues was 110 tsd. € for the total sample.
• Four out five respondents reported a market-oriented project outcome, i.e. a marketable products / services or processes.
• Related to the share of new products out of FFF funding on all new developed products and on the total turnover the FFF turns out to be important for smaller as well as younger firms.

86
8 References
Antonelli, C. (1989), ‘A failure-inducement model of research and development’, Journal of Economic Behavior and Organization 12, 159-180.
Arvanitis, S. (2003), Microeconometric Approaches to the Evaluation of RTD Policies: A Non-Technical Summary of the State of the Art, in: W. Polt and J. Rojo (eds.), Handbook on the Evaluation of Research and Technology Policy: Concepts,Tools and Indicators, Edward Elgar, Cheltenham (erscheint demnächst).
Aslesen, Heidi W., Marianne Broch, Per M. Koch and Nils H. Solum (2001), User oriented R&D in the Research Council of Norway, Technopolis RCN evaluation, Oslo.
Austrian Industrial Research Promotion Fund (FFF), Mission, Strategy and Annual Reports; www.fff.co.at
Bassanini, A. and S. Scarpetta (2001), The Driving Forces of Economic Growth: Panel Data Evidence for the OECD Countries, OECD Economic Studies 33, 9-56.
Bönte W. (2003), Does federally financed business R&D matter for US productivity growth?, Applied economics, 35 15, 1619-1625.
Buisseret, T. J., H. M. Cameron and L. Georghiou (1995), What difference does it make? Additionality in public support of R&D in large firms, International Journal of Technology Management, Vol. 10, pp. 587-600.
Busom, Isabel [1999]: ‘An Empirical Evaluation of the Effects of R&D Subsidies’, Burch Center Working Paper Series B99-05, Berkeley.
Czarnitzky, Dirk and Fier, Andreas (2001): ‘Do R&D Subsidies Matter? – Evidence for the German Service Sector’, Centre for European Economic Research, Working Paper Series, Mannheim.
Davenport, Sally, Charlotte Grimes and John Davies (1998), Research collaboration and behavioural additionality: a New Zealand case study, Technology Analysis & Strategic Management, March 1998, pp. 55-67.
David, P. A., B. H. Hall, and A. A. Toole (2000), Is Public R&D a Complement or Substitute for Private R&D? A Review of Econometric Evidence, Research Policy 29, 497-529.
Georghiou, Luke and David Roessner (2000), Evaluating technology programs: tools and methods, Research Policy, Vol. 29, pp. 657– 678.
Georghiou, Luke, (1997), Issues in the evaluation of innovation and technology policy, in: Policy evaluation in innovation and technology: towards best practice, chapter 3, OECD, Paris.
Georghiou, Luke, (2002), Impact and additionality of innovation policy, IWT-Studies No. 40, pp- 57-65.
Griliches Z. (1998), R&D and Productivity: The Econometric Evidence, Chicago, IL: The University of Chicago Press.

87
Griliches, Z. (1979), Issues in Assessing the Contribution of Research and Development to Productivity Growth, Bell Journal of Economics 10, 1.
Guellec D. and B. VanPottelsberghe DeLaPotterie (2001), R&D and productivity growth: panel data analysis of 16 OECD countries, OECD Economic Studies 2, 103-126.
Halvorsen, Robert and Raymond Palmquist (1980), The interpretation of dummy variables in semilogarithmic equations, American Economic Review, Vol. 70, pp. 474-475.
Hall, B. H. and J. Mairesse (1995), Exploring the Relationship between R&D and Productivity in French Manufacturing Firms, Journal of Econometrics 65, 263-293.
Hausman J.A. and W.E Taylor (1981), Panel data and unobservable individual effects, Econometrica, 49,1317-1398.
Irwin, Douglas A. and Peter J. Klenow (1995): ‘High-tech R&D subsidies: Estimating the effects of Sematech’ in Journal of International Economics 40, 323-344.
Keilbach, Max (2001), ‘Quantitative, Non-Experimental Approaches to the Microeconomic Evaluation of Public Policy Measures - A Survey’, ZEW Discussion Paper.
Lach, Saul (2000), Do R&D subsidies stimulate or displace private R&D? Evidence from Israel, NBER Working Paper No. 7943, Cambridge, MA.
Lehtoranta, Olavi (1999), ‘Impact of Public Funding on the Profitability and Growth Performance of Firms: A Panel Data Study on Finnish Firms’, Science, Technology and Research, Statistics Finland, Helsinki
Lichtenberg, F, R. and D. Siegel (1991), The Impact of R&D Investment on Productivity - New Evidence Using Linked R&D-LRD Data, Economic Inquiry 29, 203-222.
Luukkonen, Terttu (2000), Additionality of EU framework programmes, Research Policy, Vol. 29, pp. 711-724.
Meeusen, Wim and Wim Janssens (2001), ‘On the effectiveness of R&D subsidies to firms in the Flemish Region’, CESIT, University of Antwerp.
Nadiri, M. I. (1993), Innovations and Technological Spillovers, NBER Working Paper No. 4423.
Niininen, P. (2000), Effects of Publicly and Privately Financed R&D on Total Factor Productivity Growth. Finnish Economic Papers vol. 13/2000, no. 1, pp. 56-68.
OECD (2001), The Sources of Economic Growth in OECD Countries, Paris: OECD.
Papaconstantiou, George and Wolfgang Polt (1997), Policy evaluation in innovation and technology: an overview, in: Policy evaluation in innovation and technology: towards best practice, chapter 1, OECD, Paris.
Rigby, John (2003), ASIF: Evaluating socio-economic impact, Plattform Forschungs-und Technologieevaluierung No. 17 (March 2003), pp. 13-17.
Sakakibara, Mariko (1997), Evaluating government-sponsored R&D consortia in Japan: who benefits and how, Research Policy, Vol. 26, pp. 447-473.
Toivanen, O. and P. Niininen (1998), ‘Investment, R&D, subsidies and credit constraints’, Working Paper, Dep. of Economics, MIT and Helsinki School of Economics.

88
Wallsten, Scott J. (2000): ‘The effects of government-industry R&D programs on private R&D: the case of the SBIR program’ in RAND Journal of Economics Vol. 31, No. 1, Spring 2000, 82-100.

89
Appendix I: Definition of NACE-codes NACE Definition
1 Agriculture, hunting and related service activities2 Forestry, logging and related service activities5 Fishing, operation of fish hatcheries and fish farms; service activities incidental to fishing
10 Mining of coal and lignite; extraction of peat11 Extration of crude petroleum and natural gas; service activities incidental to oil and gas extraction excluding surveying12 Mining of uranium and thorium ores13 Mining of metal ores14 Other mining and quarrying15 Food products and beverages16 Manufacture of tobacco products17 Manufacture of textiles18 Manufacture of wearing apparel; dressing and dyeing of fur19 Tanning and dressing of leather; manufacture of luggage, handbages, saddlery, harness and footwear20 Manufacture of wood and of products of wood and cork, except furniture; Manufacture of articles of straw and plainting materials21 Manufacture of pulp, paper and paper products22 Publishing, printing and reproduction of recorded media23 Manufacture of coke, refined petroleum products and nuclear fuel24 Manufacture of chemical and chemical products25 Manufacture of rubber and plastic products26 Manufacture of other non-metallic mineral products27 Manufacture of basic metals28 Manufacture of fabricated metal products, except machinery and equipment29 Manufacture of machinery and equipment n. e. c.30 Manufacture of office machinery and computers31 Manufacture of electrical machinery and apparatus n. e. c.32 Manufacture of radio, television and communication equipment and apparatus33 Manufacture of medical, precision and optical instruments, watches and clocks34 Manufacture of motor vehicles, trailers and semi-trailers35 Manufacture of other transport equipment36 Manufacture of furniture; manufacturing n. e. c.37 Recycling40 Electricity, gas, steam and hot water supply41 Collection, purification and distribution of water45 Construction50 Sale, maintenance and repair of motor vehicles and motorcycles; retail sale of automotive fuel51 Wholesale trade and commission trade, except of motor vehicles and motorcycles52 Retail trade, except of motor vehicles and motor cycles; repair of personal and household goods55 Hotels and Restaurants60 Land transport; transport via pipelines61 Water transport62 Air transport63 Supporting and auxiliary transport activities; activities of travel agencies64 Post and telecommunications65 Financial intermediation, except insurance and pension funding66 Insurance and pension funding, except compulsory social security67 Acivities auxiliary to financial intermediation70 Real estate activities71 Renting of machinery and equipment without operator and of personal and household goods72 Computer and related activities73 Research and development74 Other business activities75 Public administration and defence; compulsory social security80 Education85 Health and social work90 Sewage and refuse disposal, sanitation and similar activities91 Activities of membership organizations n. e. c.92 Recreational, cultural and sporting activities93 Other service activities95 Private households with employed persons99 Extra-territorial organizations and bodies

90
Appendix II: Sample distribution by sectoral affiliation and sub-branch
% within % within Sectoral affiliation and subbranch N branch grand total Traditional industries 310 100.0 23.9 Manufacture of food, beverages & tobacco 42 13.6 3.2 Manufacture of textile & leather 16 5.2 1.2 Manufacture of wood & wood products 35 11.3 2.7 Manufacture of paper & paper products 15 4.8 1.2 Printing, publishing & allied industries 8 2.6 0.6 Manufacture of rubber & Plastic 36 11.6 2.8 Manufacture of non-metallic mineral products 22 7.1 1.7 Basic metal & alloys industries 50 16.1 3.9 Manufacture of metal products and parts 68 21.9 5.2 Manufacture of furniture, jewelry & musical instruments 18 5.8 1.4 R&D-intensive industries 393 100.0 30.3 Manufacture of basic chemicals and chemical products 57 14.5 4.4 Manufacture of machinery & equipment 151 38.4 11.7 Man. of office computing & accounting machinery and parts 9 2.3 0.7 Man. of apparatus for generation and transmission of electricity 24 6.1 1.9 Manufacture of apparatus for radio broadcasting, TV transmission & communication engineering 16 4.1 1.2 Manufacture of medical, surgical, and scientific and measuring equipment 100 25.5 7.7 Manufacture of transport equipment & parts 36 9.2 2.8 Traditional services 145 100.0 11.2 Recycling, power- and water-supply 23 15.9 1.8 Building trade and civil engineering 68 46.9 5.2 Wholesale trade, retail trade, trade & repair of motor vehicles 23 15.9 1.8 Tourism & hotel business 3 2.1 0.2 Transport and traffic 10 6.9 0.8 Sewage and rubbish disposal and other disposal 18 12.4 1.4 Knowledge-intensive services 365 100.0 28.2 News transmission, broadcasting, TV 6 1.6 0.5 Credit & insurance agencies and allied services 1 0.3 0.1 Software, data-processing and database 160 43.8 12.3 Research & development 106 29.0 8.2 Enterprise-related services 63 17.3 4.9 Teaching, instruction & education 10 2.7 0.8 Health, vererinary medicine and social services 10 2.7 0.8 Cultural industries, sports and entertainment 9 2.5 0.7 Other branches/miscellaneous 72 100.0 5.6 Agricuture, hunting, forestry and fishery 13 18.1 1.0 Extraction of mineral oil, natural gas and allied services 4 5.6 0.3 Mining & quarrying 11 15.3 0.8 Other services 44 61.1 3.4 Missing industry affiliation 11 100.0 0.8 Grand total 1296 100.0