evaluation methodology for post facto assessment of water development projects, crida
DESCRIPTION
Evaluation Methodology for Post facto Assessment Of Water Development projects, CRIDATRANSCRIPT

Natural Resource Management and Rural Livelihoods
Kaushalya RamachandranU.K. MandalK.L. Sharma
B.Venkateswarlu
Kaushalya RamachandranU.K. MandalK.L. Sharma
B.Venkateswarlu
Central Research Institute for Dryland AgricultureSantoshnagar, Hyderabad – 500059
February 2010
Evaluation methodology forassessment of
watershed development projectsPost-facto
- a multi-disciplinary, multi-scale & multi-aspect approach
Dec. 2005Dec. 2005
Nov. 2009Nov. 2009
Address for contact:Central Research Institute for Dryland Agriculture,Santosh Nagar,Hyderabad-500059, Andhra Pradesh, India.Tel No.: +9140-24530161/63 Email:Fax : +9140-24531802 Web:
Pamana-HL-TMW-2008
0
1
2
3
4Size of landholding
Gross agricultural incomeInput cost
Household no. 30
" 133
" 36
" 54
" 75
Threshold of sustainability
Pamana-HL-UTMW-2008
0
1
2
3
4Size of landholding
Gross agricultural incomeInput cost
Household no. 107
" 123
" 129
" 15
" 17
Threshold of sustainability
Pamana-WL-TMW-2008
0.0
0.2
0.4
0.6
0.8
1.0Farm OM recycling
S & WC structures
Role of extension agentsSoil moisture conservation
measures
Change in cultivated area
Farmholding No. 238
" 239
" 257
" 295
" 296
Threshold of Sustainability
Pamana-WL-UTMW-2008
0.0
0.2
0.4
0.6
0.8
1.0
Farm OM recycling
S & WC structures
Role of extension agentsSoil moisture conservation
measures
Change in cultivated area
Farmholding No. 229
" 236
" 218
" 220
" 222
Threshold of Sustainability
Pamana-HL-TMW-2008
0
1
2
3
4Size of landholding
Gross agricultural incomeInput cost
Household no. 30
" 133
" 36
" 54
" 75
Threshold of sustainability
Pamana-HL-UTMW-2008
0
1
2
3
4Size of landholding
Gross agricultural incomeInput cost
Household no. 107
" 123
" 129
" 15
" 17
Threshold of sustainability
Pamana-WL-TMW-2008
0.0
0.2
0.4
0.6
0.8
1.0
Farm OM recycling
S & WC structures
Role of extension agentsSoil moisture conservation
measures
Change in cultivated area
Farmholding No. 238
" 239
" 257
" 295
" 296
Threshold of Sustainability
Pamana-WL-UTMW-2008
0.0
0.2
0.4
0.6
0.8
1.0
Farm OM recycling
S & WC structures
Role of extension agentsSoil moisture conservation
measures
Change in cultivated area
Farmholding No. 229
" 236
" 218
" 220
" 222
Threshold of Sustainability

Geo-referencing check-dam Setting GPS base-station
Measuring spectral reflectanceInitialization of spectro-radiometer
Collecting geo-referenced soil sample Updating field boundary using GPS
Discussion with watershed committeeSurvey at farmer’s field
Dr. Kaushalya
Ramachandran is a Principal
Scientist & an ICAR National
Fellow (Geography) since
2005. She is a DAAD Fellow,
a DAAD Visiting Scientist
and holds a doctorate from
the University of Saarland,
Saarbruecken, Germany. She was conferred
the
in 2006 for her significant
contribution in the field of natural resource
management. The Global Land Project – IGBP
- IHDP has issued a letter of endorsement for
her research scheme
in 2008.
Punjabrao Deshmukh Women Agriculture
Scientist Award
Sustainability of rainfed
agriculture in India: Evaluation of watershed
development projects in rainfed agro-
ecological regions in peninsular India
About the authors
Dr. Uttam Kumar Mandal is
a Senior Scientist in Soil
P h y s i c s a t C e n t r a l
Research Institute for
D r y l a n d A g r i c u l t u r e ,
Hyderabad. He holds a
doctorate in Agricultural
Physics from IARI, New
Delhi. He was awarded PDF at ARO Israel
during 2005-06. He was conferred Lal
Bahadur Shastri Young Scientist Award in the
field of NRM in 2005. In 2009 he received the
Golden Jubilee Young Scientist Award from
ISSS. His research interests are soil water
balance, sustainable land management in
watershed, soil quality assessment, and soil &
water conservation. He has several
publications in national and international
journals.
Dr. B. Venkateswarlu is
Director of Central Research
I n s t i t u t e f o r D r y l a n d
Agriculture, Hyderabad. He
led the NATP program for
rainfed agro-ecosystem as
Principal Production System
Scientist from 2001 – 2006.
He served as Head, Division of Crop Sciences
at CRIDA during 2006 – 2008. He was recently
awarded Fellow of the National Academy of
Agricultural Sciences- 2010 for his outstanding
contribution in the area of NRM in dryland
agriculture and specific contributions in
microbial ecology, biological nitrogen fixation,
the molecular basis of stress tolerance in micro-
organisms and adaptation of crops to climate
change. He is a life member of several
academic and professional societies in India
and has published over 100 research papers,
10 books and holds one patent.
Dr. K. L. Sharma is a
Principal Scientist & an
ICAR National Fellow in
Soil Science since 2005 at
Central Research Institute
for Dryland Agriculture,
Hyderabad. He holds a
doctorate in Soil Science
and Agricultural Chemistry from IARI, New
Delhi. He has made significant contribution in
the field of soil fertility and plant nutrition in
rainfed agriculture in general and soil quality
improvement and assessment in particular. He
was awarded the Fellow of Indian Society of
Soil Science, New Delhi in 2009 for his
significant contribution in the field of soil
science. He has numerous publications in
national and international journals.

Natural Resource Management & Rural Livelihoods
Evaluation methodology forPost-facto assessment of watershed
development project
- a multi-disciplinary, multi-scale & multi-aspect approach
Kaushalya RamachandranU.K. MandalK.L. Sharma
B. Venkateswarlu
Central Research Institute for Dryland AgricultureSantoshnagar, Hyderabad – 500059
February 2010

Citation: Kaushalya Ramachandran, U.K. Mandal, K.L. Sharma and B. Venkateswarlu
(2010): Evaluation methodology for Post-facto assessment of watershed development
project – a multi-disciplinary, multi-scale & multi-aspect approach. Natural Resource
Management and Rural Livelihoods series. Central Research Institute for Dryland
Agriculture, Santoshnagar, Hyderabad-500059.
Copyright: CRIDA (ICAR)
Year of Publication: 2010
Printed by: Sree Krishna Prasad Graphics Pvt. Ltd., Hyderabad.Ph : 040-27400671.

Foreword
Watershed Development Program that had been implemented in India since the 5th
Five Year plan (FYP) (1974-79), has been the accepted strategy for agricultural
development in rainfed regions in India. To assess and evaluate the impact of
watershed development projects on agricultural sustainability in rainfed regions, a
study was undertaken in four treated and four untreated micro-watersheds in the
Telangana region of Andhra Pradesh falling under hot and moist semi-arid climate in
Peninsular India. In view of the divergent conclusions published based on earlier
impact studies on several watersheds, it was deemed fit to undertake the study of a
few treated watersheds in this region to understand the critical issues that determine
the sustainability of watershed projects.
Selected micro-watersheds were located in four villages in the districts of Rangareddy
and Nalgonda in Andhra Pradesh. The study used tools of Geomatics – GIS
(Geographical Information System), remote sensing and DGPS (Differential Global
Positioning system) along with conventional methods like soil survey and analysis,
PRA (Participatory Rural Appraisal) and socio-economic survey, etc. to assess and
evaluate sustainability of Watershed Development Programme (WDP). In all, fifty-
one sustainability indicators (SI) were constructed to assess the impact of WDP and
a methodology was developed to enable a quantitative evaluation of various aspects
of sustainability of agricultural production system, viz., agricultural productivity,
economic viability, livelihood security, environmental protection and social acceptability.
This publication covers a detailed account of methodology and results of case studies.
Application of GIS and remote sensing techniques has facilitated analysis of inter-
and intra- temporal variations in the impact of WDP across the selected watersheds.
The study was carried out under the ICAR National Fellow scheme awarded to the
first author in February 2005. Authors strongly feel that the evaluation methodology
described in this publication would be highly useful to the watershed project
implementation agencies for development of watersheds and undertaking corrective
measures as and when required. Further, funding and evaluating agencies will also
find this book very useful to undertake an objective evaluation of ongoing and
concluding projects.
February 2010
Authors
Acknowledgements
The authors are thankful to ICAR for award of National Fellowship and NAIP scheme
on Sustainable Rural Livelihoods (Component-3) for the financial support that
facilitated the undertaking of research work during 2005 - 2009. The encouragements
provided by DDG and ADG of NRM and Education Divisions of ICAR is gratefully
acknowledged. Special thanks are due to Dr. J. Venkateshwarlu, former Director
CAZRI and an expert in Dryland Agriculture for kindly consenting to review this book
and offer valuable suggestions for its’ improvement. Thanks are due to Dr. H.P. Singh
and Dr. Y.S. Ramakrishna (Former Directors, CRIDA); Drs. M. Vanaja, C. A. Rama
Rao, B.M.K. Raju and Sreenth Dixit (CRIDA); Drs. N.H. Rao and M.N. Reddy
(NAARM); Dr. N.K. Sanghi (WASSAN), Dr. S.P. Wani (ICRISAT), Drs. R.S. Dwivedi
and S. Seshasai (NRSC), Dr. N.C. Gautam (CLUMA) and Prof. S. Padmaja (Dept of
Geography, Osmania University) for their valuable input during this study.
The authors acknowledge the assistance provided by the project staff of National
Fellow Scheme - M. Gayatri (Research Associate), V. Bhaskar (Senior Research
Fellow) and P. Karthik Raj (Junior Research Fellow), A. Sravani (Steno) and former
project staff associated with the scheme – T. Srinivas, M. Shankar Rao, K.
Venkataravamma, G. Srinivas, Kusuma Grace, A. Jyoshna and Y. Sangeetha who
assisted in the work during 2006 – 2008. Their joint effort in undertaking the study
helped in achieving all the research objectives set for the ICAR National Fellow
project and NAIP scheme. This publication is the culmination of all those efforts.
February 2010
Authors
Table of Contents
Foreword
Acronyms / AbbreviationsAcknowledgements
1. Introduction: Watershed Development and Evaluation 1
2. Watershed Development Program (WDP) in India 2
3. About this Study 5
4. Study Area 7
5. Current situation in the study area 196. Methodology developed for Post-facto evaluation 30
7. Construction of Sustainability Indicators 38
8. Summary of Findings 57
9. Analysis of Performance Indicators 79
10. Weakness of WDP implemented in study area 79
11. Identification of critical indicators for sustainable development
at various spatial levels 83
12. Strengths and limitations of evaluation methodology 87
13. Focus for Sustainable Development through WDP 9014. Lessons learnt 92
15. Conclusions 93
References 94
Appendices
Acronyms/ Abbreviations
ADG Additional Director General
AER Agro Ecological Regions
AESR Agro Ecological Sub-Regions
Agri. Agriculture
AMC Agriculture Market Committee
B:C Benefit Cost ratio
BC Backward Caste
BVC Bivariate Correlation
CCT continuous contour trench
CD Check-Dam
CDE Centre for Development and Environment
CEC Cation Exchange Capacity
CESS Centre for Economic & Social Studies
CG-WDP Common Guidelines for Watershed Development Program
CLUMA Centre for Land Use Management
COSTED Committee on Science & Technology in Developing countries
CPR Common Pool Resources
CRIDA Central Research Institute for Dryland Agriculture
CSFD French for the French Scientific Committee on Desertification
CSO Central Statistical Organisation
CSWCRTI Central Soil & Water Conservation Research and Training Institute
CV Coefficient of Variance
DAC Department of Agriculture & Cooperation
DDG Deputy Director General
DDP Desert Development Program
Dept. Department
Dev. Development

DFID Department for International Development
DGPS Differential Global Positioning System
DHA Dehydrogenase Assay
DOLR Department of Land Resources
DOA Department of Agriculture
DPAP Drought Prone Area Development Program
DORD Dept. of Rural Development
DST Department of Science & Technology
DWACRA Development of Women & Children in Rural Areas
EAS Employment Assurance Scheme
EC Electrical Conductivity
FAO Food and Agriculture Organisation
FESLM Framework for Evaluation of Sustainable Land Management
FL Farm Level
FYM Farm Yard Manure
FYP Five Year Plan
GIS Geographical Information System
GOI Government of India
Govt. Government
GP Gram Panchayat
GPS Global Positioning System
GRF Gunegal Research Farm
ha Hectares
HH House Hold
HHL House Hold Level
HRF Hayathnagar Research Farm
IBN International Biosciences Network
ICAR Indian Council of Agricultural Research
ICRISAT International Crop Research Institute for Semi-Arid Tropics

ICSU International Council of Scientific Unions
ID Irrigated Dryland
IFPRI International Food Policy Research Institute
IIED International Institute for Environment & Development
IIPS International Institute for Population Sciences
INM Integrated Nutrient Management
IRDP Integrated Rural Development Programme
IRS Indian Remote Sensing Satellite
ISRO Indian Space Research Organisation
IVLP Institute Village Linkage Program
IWDP Integrated Watershed Development Project
IWG International Working Group
JRY Jawahar Rozgar Yojana
LADA Land Degradation Assessment in Drylands
LMP Land Management Practices
LPG Liquid Petroleum Gas
Mandal Mandal – an Administrative unit
MBC microbial biomass carbon
MDO Mandal Development Officer
MOA Ministry of Agriculture
MOEF Ministry of Environment & Forestry
MOF Ministry of Finance
MORD Ministry of Rural Development
MRO Mandal Revenue Officer
MWR Ministry of Water Resources
MWS-WDP Micro Watersheds - Watershed Development Program
Naala River-catchment
NAARM National Academy of Agricultural Research Management
NABARD National Bank for Agriculture and Rural Development

NBSS&LUP National Bureau of Soil Survey & Land Use Planning
NDVI Normalised Differential Vegetation Index
NGO Non Government Organisation
NRAA National Rainfed Area Authority
NNRMS National Natural Resource Management System
NRDMS Natural Resources Data Management System
NREGS National Rural Employment Guarantee Scheme
NRM Natural Resource Management
NRSC National Remote Sensing Centre
NWDP National Watershed Development Program
NWDPRA National Watershed Development Project for Rainfed Area
OC Organic Carbon
OC Other Caste
OM Organic Matter
PACS Poorest Areas Civil Society
PCA Principal Component Analysis
PDS Public Distribution System
PIA Project Implementing Agency
PRA Participatory Rural Appraisal
PROGRESS an NGO in Hyderabad
PSB Public Sector Banks
PSU Public Sector Undertaking
Pvt. Private
RRB Regional Rural Bank
RS Remote Sensing
S&WC Soil and Water Conservation
SAT Semi-Arid Tropics
SC Scheduled Caste
SHG Self Help Group

SI Sustainability Indicators
SMW Standard Meteorological Week
SOI Survey of India
SPSS Statistical Package for the Social Sciences
ST Scheduled Tribe
Tehsil Sub-district revenue division
TMW Treated Micro Watershed
TRYSEM Training of Rural Youth for Self-Employment
UNCCD United Nations Convention to Combat Desertification
UNESCO United Nations Educational Scientific & Cultural Organisation
USD U.S. Dollar
USLE Universal Soil Loss Equation
UTMW Untreated Micro Watershed
VAO Village Administrative Officer
WARASA Watershed Areas’ Rainfed Agricultural Systems Approach
WASSAN Watershed Support Services and Activities Network
WC Watershed Committee
WDF Watershed Development Fund
WDP Watershed Development Program
WDSCA Watershed Development in Shifting Cultivation Areas
WL Watershed Level
WOCAT World Overview of Conservation Approaches and Technologies
WPI Wholesale Price Index

1
1. Introduction: Watershed Development and Evaluation
Rainfed agro-ecological regions (AER) which encompass the semi-arid tropics (SAT)
and hot dry and moist sub-humid regions of India, extends over 76.74 million ha
(mha) out of a total geographical area of 90.4 mha in the states of Andhra Pradesh
(AP), Maharashtra, Karnataka and Tamilnadu in Peninsular India. Watershed-based
development has been an important component in the schemes for economic planning
for development in the region. In order to improve agricultural productivity, livelihood
security and rural lifestyle, improved land management practices (LMP) have been
propagated under watershed development program (WDP). According to Census of
India - 2001 conducted by Government of India (GOI), out of 288.34 million persons in
the four states, over 180.99 million lived in rural areas and were involved in agriculture
and allied activities. In 2009 it was estimated that the total population in the four
southern states would be 317.47 million persons with over 188.56 million living in
rural areas alone. In Andhra Pradesh an estimated 83.17 million persons were living
in rural areas with over 5.34 million persons in the two districts of Nalgonda and
Rangareddy alone. Hence watershed development projects have the potential to
benefit this large volume of population in the state and other parts of the country and
improve their livelihood status and protect the natural resource base in the region.
Rainfed AER encompassing Peninsular India receives an average annual rainfall of
500 mm (300-800 mm), which occur in 52 - 55 rainy days. Over 50 percent of this
rainfall occurs by way of thunderstorm that lasts for a few hours. Considering such a
rainfall pattern, it is essential to harvest, store and use rainwater for undertaking
agriculture and other allied activities for the rest of the year. Intensive rainfall events
induce severe soil erosion in bare or sparsely vegetated land that is common in the
region. Watershed Development Program (WDP) is undoubtedly, crucial not only for
increasing agricultural productivity from rainfed regions but also managing and
conserving the natural resource base of rainfed regions on which millions of small
and marginal farmers subsist. Soil and Water Conservation Structures (S&WC) viz.,
check-dam, stone weirs, contour bund, live bunds, vegetative cover, key-line plantation,
grass way, etc., were planned to provide impediments to overland - runoff which
induce soil erosion and depletion of nutrients from agricultural fields. Structures were

2
laid to guide runoff to designated farm ponds and tanks for water harvesting on the
surface, besides impounding water for facilitating deep percolation for groundwater
recharge. Thus, WDP was considered the most comprehensive program for achieving
agricultural and ecological sustainability in the rainfed regions in India. A hallmark of
WDP was the implementation of improved land management practices (LMP) for
each aspect of agriculture and rural life in the rainfed regions.
As India envisages sustaining an agricultural growth rate of 4.0 to 4.5 per cent in
order to reduce food insecurity and poverty, while increasing rural purchasing power,
benefit accrued from implementing improved LMP under WDP needs to be evaluated
so that necessary corrections or emphasis could be affected if essential.
2. Watershed Development Program (WDP) in India
Watershed Development and Management Program was initiated during 1980s to
address these limitations of the rainfed AER (Planning Commission, 2001). One of
the primary reasons, in favour of watershed-based development in rainfed AER, is
the enormous cost of major water projects like the under-construction Narmada river-
valley project. Hence, emphasis was shifted to augmenting water resources through
small and decentralized projects and the WDP for rainfed regions in rural India, have
remained the accepted strategy for rural transformation. The Watershed Projects
have been undertaken under six major national programs, viz., Drought-Prone Area
Program (DPAP), Desert Development Program (DDP), National Watershed
Development Project for Rain-fed Area (NWDPRA), Watershed Development in
Shifting Cultivation Areas (WDSCA), Integrated Watershed Development Project
(IWDP) and Employment Assurance Scheme (EAS) etc. by four Central Ministries of
Govt. of India namely, Ministry of Rural Development (MORD), Agriculture (MOA),
Environment & Forestry (MOEF) and Water Resources (MOWR). Significantly, 70
percent of funds for watershed development in India were spent under these six
major programs. There were also, a lot of commonality in the WDP undertaken by
these four ministries, in view of which, a inter-ministerial sub-committee was
constituted in 1999, to evolve a common approach and principles for undertaking of
WDP in India.

3
Government of India drew an ambitious 25-years Perspective Plan for an holistic and
integrated development of rainfed areas in the country on watershed -basis, for
covering an area of approximately 63 mha at an estimated cost of Rs. 76,000 crore
or USD 1520 m (Planning Commission, 2005). However, experts like – Dr. M.S.
Swaminathan(2001, 2005) and Dr. C.H. Hanumantha Rao (1994) besides others,
had expressed their reservation in the manner in which the project was being
implemented, although several modifications were implemented in the programme
since its inception in the year 1983. A Technical Committee Report submitted to the
Department of Land Resources (DOLR-MORD) in January 2006 (Parthasarathy,
2006), estimates that at current level of outlay, it may take 75 years to complete
watershed treatment in India. The Committee opined that if S&WC measures needed
to be completed by 2020, the Government must allocate Rs. 100,000 million (20
million USD) annually for the purpose, for the next 15 years.
Undoubtedly, WDP is essential for rainfed agriculture and since 1983 three generations
of watershed projects have been implemented in the country. The Ministry of Rural
Development (MORD) followed the Hanumantha Rao (1994) Committee
recommendations and implemented all WDP under those guidelines between 1994-
2001. In 2000, Ministry of Agriculture (MOA) revised its’ WDP guidelines and the
National Watershed Development Project for Rainfed Areas - NWDPRA Guidelines
came into being (MOA, 2001). These guidelines were intended to be common
guidelines to make WDP more participatory, sustainable and equitable (Information
Box 1). However, MORD revised its’ 1994 guidelines in 2001 and again in 2003, naming
it the Hariyali Guidelines for WDP (MORD, 2003).
Till the 8th Five – Year Plan (FYP), a total of 16.5 mha of land was treated with
watershed projects. From April 1995, MORD implemented the DDP, DPAP and IWDP
projects under the Common Guidelines as recommended by the Hanumantha Rao
(1994) Committee. Between 1995-96 and 2007-08, over 45,062 projects were
sanctioned under the above-mentioned three programs with a view to treat over 32.29
mha at a cost of 77386 million rupee (http://india.gov.in/sectors/agriculture/
watershed_development.php 2009). Besides these National Bank for Agriculture and
Rural Development (NABARD) established a Watershed Development Fund (WDF)
in 1999-2000 to enable the various states in the country to access credit for treatment
of land under the WDP.
4
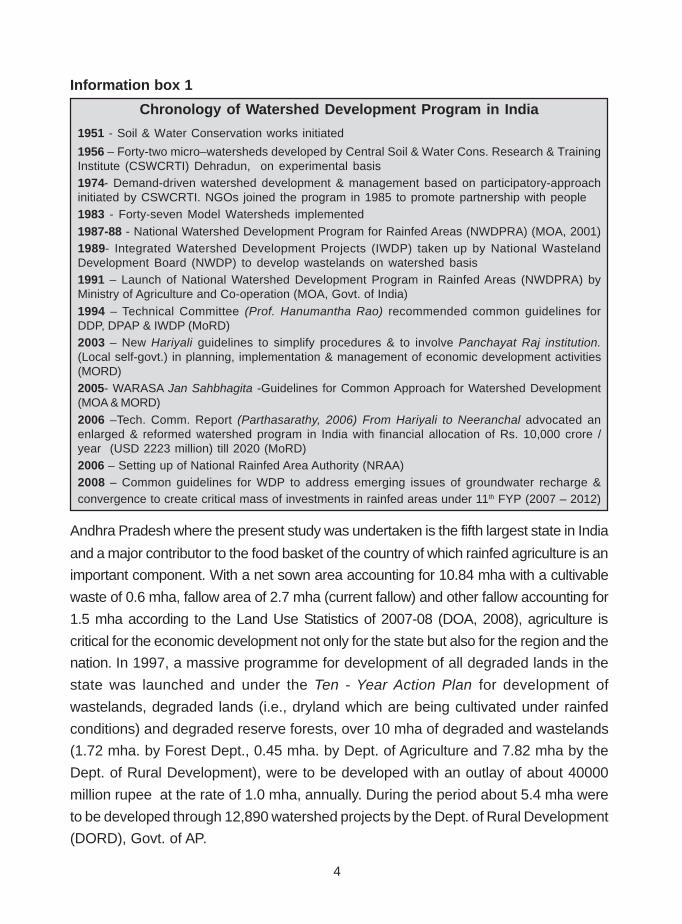
Information box 1
Chronology of Watershed Development Program in India
1951 - Soil & Water Conservation works initiated
1956 – Forty-two micro–watersheds developed by Central Soil & Water Cons. Research & TrainingInstitute (CSWCRTI) Dehradun, on experimental basis1974- Demand-driven watershed development & management based on participatory-approachinitiated by CSWCRTI. NGOs joined the program in 1985 to promote partnership with people1983 - Forty-seven Model Watersheds implemented1987-88 - National Watershed Development Program for Rainfed Areas (NWDPRA) (MOA, 2001)1989- Integrated Watershed Development Projects (IWDP) taken up by National WastelandDevelopment Board (NWDP) to develop wastelands on watershed basis1991 – Launch of National Watershed Development Program in Rainfed Areas (NWDPRA) byMinistry of Agriculture and Co-operation (MOA, Govt. of India)1994 – Technical Committee (Prof. Hanumantha Rao) recommended common guidelines forDDP, DPAP & IWDP (MoRD)2003 – New Hariyali guidelines to simplify procedures & to involve Panchayat Raj institution.(Local self-govt.) in planning, implementation & management of economic development activities(MORD)2005- WARASA Jan Sahbhagita -Guidelines for Common Approach for Watershed Development(MOA & MORD)2006 –Tech. Comm. Report (Parthasarathy, 2006) From Hariyali to Neeranchal advocated anenlarged & reformed watershed program in India with financial allocation of Rs. 10,000 crore /year (USD 2223 million) till 2020 (MoRD)2006 – Setting up of National Rainfed Area Authority (NRAA)2008 – Common guidelines for WDP to address emerging issues of groundwater recharge &convergence to create critical mass of investments in rainfed areas under 11th FYP (2007 – 2012)
Andhra Pradesh where the present study was undertaken is the fifth largest state in India
and a major contributor to the food basket of the country of which rainfed agriculture is an
important component. With a net sown area accounting for 10.84 mha with a cultivable
waste of 0.6 mha, fallow area of 2.7 mha (current fallow) and other fallow accounting for
1.5 mha according to the Land Use Statistics of 2007-08 (DOA, 2008), agriculture is
critical for the economic development not only for the state but also for the region and the
nation. In 1997, a massive programme for development of all degraded lands in the
state was launched and under the Ten - Year Action Plan for development of
wastelands, degraded lands (i.e., dryland which are being cultivated under rainfed
conditions) and degraded reserve forests, over 10 mha of degraded and wastelands
(1.72 mha. by Forest Dept., 0.45 mha. by Dept. of Agriculture and 7.82 mha by the
Dept. of Rural Development), were to be developed with an outlay of about 40000
million rupee at the rate of 1.0 mha, annually. During the period about 5.4 mha were
to be developed through 12,890 watershed projects by the Dept. of Rural Development
(DORD), Govt. of AP.
5
3. About this Study
The study was undertaken in four project villages where watersheds were developed
by various agencies in northern Telangana semi-arid and dry sub-humid tropics
identified as AESR 7.2 (Velayutham et al., 1999). For assessing or determining the
impact of WDP, the situation in four treated watersheds were compared with that of
four untreated watersheds located in the vicinity within each village taken as control
although not in a strict sense in view of the implementation of other developmental
activities in the village. The impact of sustainability of WDP was evaluated in each
watershed at three levels - household, field and watershed during 2005 to 2009 and
the outcome were compared annually with the situation prevalent during the preceding
year in the respective watersheds. For evaluation, valuation of economic returns
from a unit land area (ha) was estimated across the watersheds annually and the
results have been discussed at length in a later section of this publication.
Review of progress under WDP
Despite its’ importance to the agricultural sector in particular and the Indian economy
in general, progress under WDP till the 10th FYP was limited. A number of studies
undertaken in the last 25 years have indicated several flaws in the implementation of
the programme (Amita Shah et al., 2004, Planning Commission, 2001, 2005; Kerr &
Sanghi, 1992; Kerr et al., 2002; Hanumantha Rao, 2000; Joshi et al., 2005, Samra,
1997; Sreedevi et al., 2004; Samra & Eswaran, 2000, Venkateswarlu, 1999. Based
on all these studies, the Govt. of India in 2008, announced a comprehensive set of
guidelines for watershed development in the country that came into effect from 1st
April 2008 (Planning Commission 2008a, 2008b;Govt. of India, 2008) which supersedes
all earlier guidelines for WDP in the country, in view of the critical role that WDP could
play in conserving and enriching the natural resource base of rainfed regions in the
country.
Besides these studies, a few were undertaken to review the Policy on WDP in Andhra
Pradesh (Oliver Springate – Baginski et al., 2004), watershed development program
in India (Hanumantha Rao, 2000), sustaining rural livelihood (Ratna Reddy 2003;
Ratna Reddy et al., 2004) and a World Bank Review of Watershed Experience in
Andhra Pradesh (World Bank, 2001). Most of these evaluation studies were conducted

6
by independent consultants who evaluated the watershed projects using qualitative
information alone owing to non-availability of authentic baseline data provided by the
respective Project Implementing Agency (PIA). This proved to be a serious lacuna,
as most of these valuable studies could make only general recommendations rather
than provide concrete suggestions that could help the PIA to undertake effective
corrective measures to make the watershed projects sustainable. To address this
shortcoming, the present study was undertaken to demonstrate the use of Geo-
informatics tools to evaluate WDP in the country. Use of Information Technology
including Geo-informatics has helped to overcome the bottleneck of lack of quantifiable
baseline data, a general problem faced by all earlier projects in the country. Using
these tools, it was possible to construct sustainability indicators and develop a
methodology for quantitative evaluation that was applied to evaluate eight micro-
watersheds in four villages in Telengana region in Andhra Pradesh, as described in
this publication. The present study was undertaken to evaluate these watershed
projects that had been implemented under the 1994 guidelines of Hanumantha Rao
Committee and the NWDPRA guidelines of MOA (2001), in order to, identify critical
indicators of sustainable development in rainfed agriculture. The lessons learnt from
this study would presumably help in effective implementation of the Integrated
Watershed Development Projects (IWDP) under the new Common Guidelines for
Watershed Projects implemented by Govt. of India in April 2008.
Objectives
One of the main objective of the study was to develop a methodology for assessment
and evaluation of WDP based on performance indicators using tools of Geo-
informatics – GIS, remote sensing, Differential Global Positioning System (DGPS)
and Total Station along with conventional methods of study like soil analysis, PRA,
socio-economic survey, etc. Another objective was to identify essential aspects of
WDP through identification of critical indicators (Kaushalya et al., 2007, 2009). This
task was accomplished through application of two statistical techniques - Bivariate
Correlation technique and Principal Component Analysis. Critical indicators were
used as Minimum Data Sets for evaluation of WDP. Outcome of this study was
compared across the selected watershed villages, both spatially and temporally and
the results of this post-facto assessment and evaluation are presented here.

7
4. Study Area
As already mentioned, four villages were selected in AESR 7.2 to assess and evaluate
the watershed projects developed between 1999-2002 in the districts of Rangareddy
(RR) and Nalgonda of Telangana region in AP (Figure 1 & 2). The watershed projects
had been developed under NWDPRA guidelines by the Departments of Agriculture
(DOA) and of Rural Development (DORD), AP State Govt. besides an NGO called
PROGRESS. The four villages covered over 6000 ha of agricultural land and their
geographical location has been indicated in Table 1. About 440 farm households were
surveyed for socio-economic information each year. Five hundred and fifty soil samples
were analysed for 12 physico-chemical and biological properties. In each of the four
villages selected for the study, 7, 11, 13 and 19 micro-watersheds were delineated of
which one treated and one untreated micro-watersheds covering an area around
100 ha were selected for evaluation of impact of watershed projects on agricultural
sustainability.
Table 1 : Study Area
Selection of watersheds
Pamana village from which a micro-watershed was selected for the study is located
within Chevella watershed (7807’30"E & 17016’45"N). WDP was implemented under
DPAP program in 1999 (Table 1). The village area could be delineated into 16 micro-
watersheds (MWS - catchment of first-order stream). Under WDP, ten check-dams
were constructed in two of the sixteen micro-watersheds within Pamana in a planned
manner. For implementation of WDP, a watershed committee was formed consisting
of stakeholders (farmers belonging to the respective watersheds) and seed money

8
was sanctioned to the village administration (Gram Panchayat) for undertaking various
programs with the guidance of officials from the State Dept. of Agriculture. Villagers
constructed the soil and water conservation structures (S&WC) for which they were
paid wages from the DPAP fund.
Figure 1: Location of Study area
To assess and evaluate WDP in Pamana, GIS and remote sensing techniques were
used to supplement information generated from actual field survey, soil analysis and
socio-economic survey. Database were initially created in MS-Access and
subsequently developed into Dot net application. Thematic maps of the resources in
the respective watersheds were drawn using ArcGIS. Multi-spectral data from IRS
satellite were procured for pre-project period i.e., 1998 and post-project periods, i.e.,

9
2005, mapped and analysed for land use and land cover change. The imageries
were interpreted to derive various sustainability indicators and to understand the
processes of LULC change.
Figure 2: IRS satellite imagery indicating location of selected watershed villages
In Pamana, as in other cases, two micro-watersheds – one a treated micro-
watersheds (TMW) where S&WC measures were undertaken and another an
untreated micro-watersheds (UTMW) where WDP interventions were not implemented
although other activities may have been implemented, were selected for developing
an assessment and evaluation procedure for WDP. Watershed hierarchy was
delineated and micro-watersheds identified for the study. A watershed coding system
developed at CRIDA during 1996-1997 under the ICAR – Institute Village Linkage
Program (IVLP) was used (Information box 2). It is heartening to note that since then
this method of coding stream network has been accepted as a standard practice to
identify stream network hierarchy in the country and used by AIS& LUS (2002) to
prepare an atlas for the country. The stream codification methodology evolved is as

10
follows: for e.g., Pamana TMW is denoted as 4D1E8a4c which signifies the following
drainage hierarchy levels: 4 – Southern Water Region, D - Krishna River, 1 – Musa
River, E – Himayatsagar sub-catchment, 8 – Watershed No. (4th order stream
catchment), a - sub-watershed code (3rd order stream catchment), 4 - mini-watershed
(2nd order stream catchment) and c - micro-watershed (1st order stream catchment).
Information box 2
Socio-economic survey was conducted using structured questionnaire for measuring
the sustainability indicators. Soil sampling and analysis for 12 physico-chemical and
biological parameters were undertaken. Satellite data of IRS 1D LISS-III of 16 Nov.
1998 and IRS – P6 data of 4 Nov. 2005 were interpreted using ERDAS Imagine (Ver.
8.7) and land use land cover and degradation maps were prepared for developing
sustainability indicators. Finally, an assessment and evaluation methodology was
developed for undertaking an integrated evaluation of sustainability of WDP in all the
selected watersheds.

11
Pamana watershed
Pamana village is located towards southwest of Hyderabad Urban Agglomeration
(HUA) at approximately a distance of 70 km from the city centre. The village has 280
farm households who own over 1100 ha of farmland. In most of the cases landholding
size range between 1-2 ha and significantly, there are no landless persons in the
village. The village is located in the Himayatsagar catchment and Figure 3 indicates
the regional watershed hierarchy of the watershed.
Figure 3: Watershed hierarchy of Pamana village, Chevella mandal in Himayatsagar catchmentin Rangareddy district.

12
Watershed development program was initiated in the village in two phases. During
the implementation of first phase from 1994, ten check-dams were built in a micro-
watershed. In 2005, four concrete check-dam structures were built in a second micro-
watershed under DPAP scheme. A treated micro-watershed (TMW) of 133.52 ha
area and another untreated micro-watershed (UTMW) 101.8 ha were selected for
assessment and evaluation of sustainability of WDP. The second phase of WDP in
Pamana was implemented by a NGO called PROGRESS, which was active in the
region. The NGO painstakingly facilitated creation of social structures like Watershed
Committee (WC) that was entrusted with the task of overseeing maintenance and
construction of S&WC structures and bunds created under the WDP besides
formation of Watershed Association (WA) and Self-Help Group (SHG) where all
farmers were stakeholders and were involved in the decision-making process an
aspect vital for sustainability of WDP.
Chintapatla watershed
Chintapatla village is located in Yacharam mandal in the border of Rangareddy and
Nalgonda districts. It is drained by the Shaslervagu River (Figure 4) which is numbered
as 4D1F3a in the National Watershed Atlas (AIS & LUS, 1988). The area extent of the
village is 2237 ha that is owned by over 400 farm-households. Land holding sizes
ranged from 0.5 to 5 ha. The village has essentially red shallow gravelly soils (fine
mixed Typic Rhodustalfs) and most of the land belongs to LCC III e to VIII.
Major crops grown were paddy, sorghum, castor, horse gram and vegetables, which
included tomatoes. Although Kharif (June - Sept.) is the main cropping season, crops
were also grown during Rabi (Nov. - Feb.) and summer seasons wherever assured
water was available for irrigation. This trend of exploiting groundwater for growing
paddy and other vegetable crops for market was seen to have increased since 2004
when the Govt. declared free electric power supply to the farming sector. Livestock
was seen to be an important component of agriculture in the village as there were
over 250 buffaloes that were milked and the produce was sold to dairy federations in
the region. Poultry was however, restricted to backyards alone.
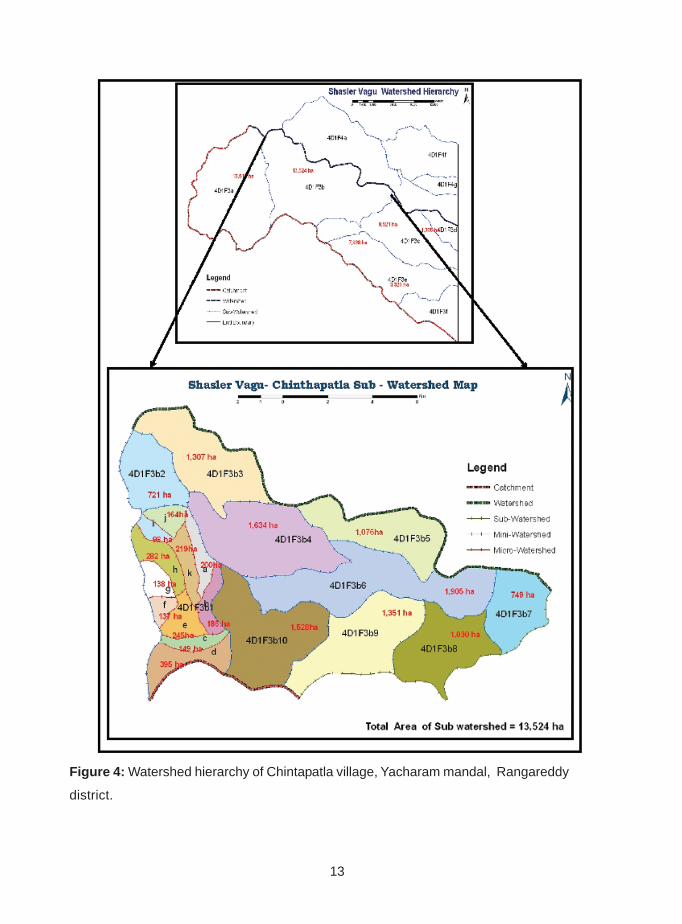
13
Figure 4: Watershed hierarchy of Chintapatla village, Yacharam mandal, Rangareddy
district.

14
WDP was initiated in the village in 1994 - 1995 under the DPAP program. Three
check-dams were built in the watershed along with small concrete structures and
large stone and mud structures. Continuous contour trenches (CCT) were also dug
around steep slopes to facilitate infiltration of water for groundwater recharge. Stone-
weir and rubble structures were constructed to impede overland flow of water and for
halting soil erosion.
The villagers in Dontanpalli realised the benefits of WDP as their crops grew well in
lower reaches of the check dam and their bore-wells did not fall defunct owing to fall
in groundwater table, as was usual prior to the launce of WDP in the village. After the
launch of the WDP, groundwater recharge was evident from the level of water - table
in the village besides halting of soil erosion and increase in crop yield. It was seen
that the paddy yield in particular, rose from 1500 to 2000 kg ha-1.
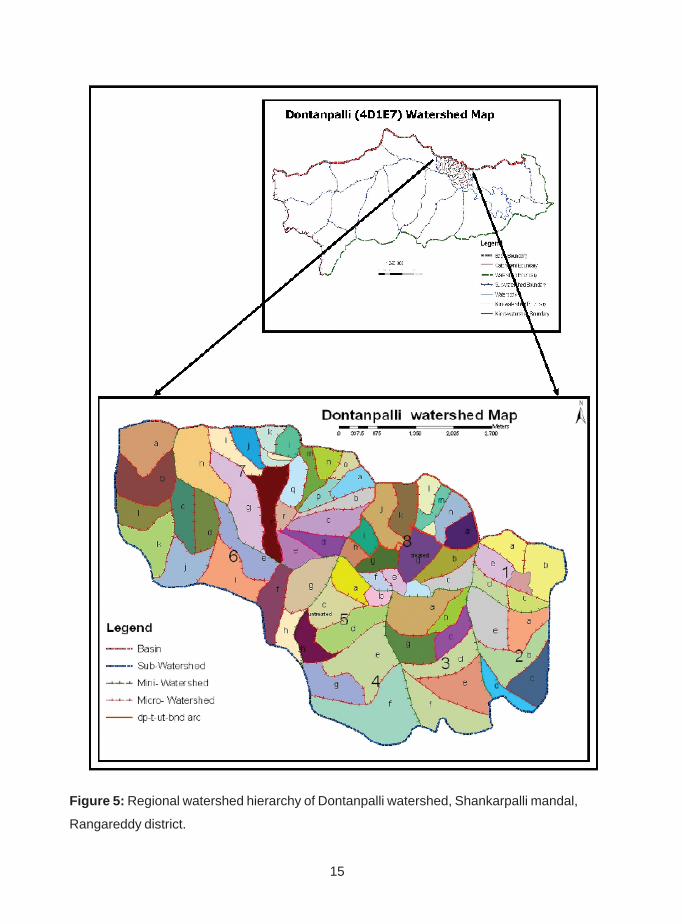
Dontanpalli watershed
This village is located in Shankarpalli mandal at the border of Rangareddy and Medak
districts at the junction of three mandals - Shankarpalli, Moinabad and Chevella. Thus,
geographically Dontanpalli is located in the peri-urban belt of Hyderabad where large-
scale land use and land cover changes are occurring. Agricultural land use was seen
to rapidly change as land was being converted into urban and industrial use and the
impact of these recent changes was clearly visible on the state of agriculture in the
village.
Dontanpalli watershed is located in the Osmansagar catchment and is denoted as
4D1E7 in the National Watershed Hierarchy Atlas (Figure 5). Dontanpalli village has a
total area of 696 ha encompassing the area under seven hamlets namely, Maharajpet,
Kakarlakunta, Pilligondla, Irrigutta Tanda, Dontanpalli, Ponnagutta Tanda and Goplaram.
While Dontanpalli is a revenue village, the seven hamlets have a combined Panchayat
(village council) located at Maharajpet. This decentralized administrative setup is a
factor that has been working against the interests of residents of Dontanpalli village.
There are 410 farm households in the seven hamlets and a majority of them belong
to marginal and small category of farmers.
15
Figure 5: Regional watershed hierarchy of Dontanpalli watershed, Shankarpalli mandal,
Rangareddy district.

16
The soil is essentially red shallow loam (fine mixed Typic Haplustalfs) and the land
predominantly belongs to LCC III e s. Dominant crops grown during Kharif season
were sorghum, paddy and vegetables while red gram, tomatoes and chillies were
grown during Rabi season. Since the last decade, floriculture had been developed in
the area, which was seen to be profitable owing to proximity to Hyderabad. During
the last decade several large plantation orchards were developed by non-residents
essentially city-dwellers who had bought land from the small and marginal farmers
and consolidated them into large holdings. The dispossessed farmers of the village
worked in these mango, guava and grapes orchards as labour. Department of
Agriculture, Govt. of Andhra Pradesh implemented WDP in the village under DPAP
scheme in 1995-96. Under the program six check-dams were constructed and several
CCT were dug to impend overland water flow to facilitate infiltration. The WDP was
officially concluded in 2001.
Gollapalli watershed
This village is located in Chintapalli mandal of Nalgonda district and is drained by
Peddavagu River. The Peddavagu Watershed has been denoted as 4D2B2 (Figure
6) in the National Watershed Atlas (AIS&LUS, 1988). Gollapalli was a part of Kurmed
village with a combined Panchayat located at the latter till a decade ago. The two
have been administratively bifurcated in the last decade although the state highway
connecting Hyderabad with Nagarjunasagar had physically divided the two earlier
when drainage lines got truncated owing to construction of state highway. Although
Gollapalli is now a separate revenue village its’ Panchayat is still located at Kurmed
and many farm households own and cultivate their land in either or both villages, that
makes the assessment and evaluation of development projects like WDP, challenging.
Gollapalli village extends over 509 ha which belongs to over two hundred and twenty-
five farm households. Although a majority of farmers are small and marginal, there
are a few who have large landholdings. Soils are essentially red gravelly loam soils
(loamy, skeletal, mixed Typic Rhodustalfs) and the land belongs to LCC III e s. Major
crops grown were cotton, paddy, maize, sorghum, castor, vegetables which included
tomato, carrot, onions, garlic, etc., and red gram. There are a few mango and orange

17
orchards belonging to large farmers who have consolidated their holdings by buying
a few landholdings belonging to small and marginal farmers in the village.
In 2007-08, the boom in real estate had boosted land price that induced several farmers
to sell their land for non-agricultural use instead of continuing to practice rainfed
agriculture. However, the subsequent economic slump in second-half of 2008 has
dampened the market price of land in the region and agriculture has seen resurgence.
Figure 6: Nested micro-watersheds of Gollapalli village, Chintapalli Mandal, Nalgonda District

18
Natural resource base
The region forms part of the Deccan plateau with craggy hillocks and stone outcrops
and ideally suited for WDP. The soils are predominantly Alfisols and associated mixed
red soils while Pamana has some Vertisols and Inceptisols. Climate is typically semi-
arid to dry sub-humid with rainfall ranging from 650-800 mm that is mainly received
during southwest monsoon (June – Sept.). The lithology is made up of igneous rocks
– granite with large fractures that have been used for tapping groundwater. The natural
vegetation is typically semi-arid deciduous and thorny scrub – babool (Acacia nilotica
and Acacia arabica), neem (Azadirachta indica), tamarind (Tamarindus indica), guava
(Psidium gujava), sapota (Achras zapota), palmyra palm (Borassus flabelliafera),
custard-apple (Annona squamosa), gooseberry (Emblica officinalis), ber (Ziziphus
mauritiana), agava, cactus and grasses (Sehima-Dichanthium).
Cropping system till the 1990s included rainfed cereal crops like sorghum (Sorghum
bicolor) and pearl millet or bajra (Pennisetum americanum), besides castor bean – a
non-edible oil crop (Ricinus communis) and pulses – pigeon pea (Cajanus cajan),
green-gram (Vigna radiata), black-gram (Vigna mungo), horse-gram (Macrotyloma
uniflorum), cluster-bean or guar (Cyamopsis tetragonoloba) and cowpea (Vigna
unguiculata). However, since 1990s and with implementation of WDP, there has been
a major shift in cropping systems. Irrigation through bore-wells resulted in large areas
being brought under paddy (Oryza sativa) cultivation. Other dominant crops include
maize (Zea mays), groundnut (Arachis hypogaea) and cotton (Gossypium hirsutum);
the last two preferred by farmers for its’ high value although low rainfall have often
caused crop failure. Cultivation of castor, pearl millet and cowpea are waning. Area
under oilseeds like sunflower (Helianthus annuus), sesame (Sesamum indicum) and
safflower (Carthamus tinctorius) is on the rise. Horticulture crops like mango
(Mangifera indica), grapefruit (Citrus paradisi), lime (Citrus aurantifolia), sweet orange
(Citrus sinensis) and grapes (Vitis vinifera) are gaining. Cultivation of vegetables
viz., tomato (Lycopersicon esculentum), chilli (Capsicum annuum), brinjal (Solanum
melongena), okra or bhindi (Abelmoschus esculentus), cucurbits and carrot (Daucus
carota) are preferred by farmers over other crops owing to market demand and easy
accessibility to Hyderabad. Fodder grass such as napier (Pennisetum parapareum)
and para grass (Panicum muticum) are in great demand.

19
5. Current situation in the study area
Since 2005 there have been many policy changes that have had a large impact on
the way rainfed agriculture is being carried out in the region. One of the major policy
issue that has positively impacted agriculture in the country especially in rainfed areas
is the implementation of National Rural Employment Guarantee Scheme (NREGS)
since 2007-2008. The scheme has provided livelihood security at household-level
and the much- needed cash for purchase of inputs like seeds and fertilizer to undertake
agricultural operations at field-level. This extraneous infusion of cash liquidity at the
village-level has had a positive impact on rural livelihood and rainfed agriculture as
noticed in the study area. During occurrence of drought in August 2009, dryland crops
like castor and sorghum wilted in the field for want of rain while farmers were able to
save paddy crop in the treated micro-watersheds through irrigation by tapping
groundwater sourced at a depth of 240 ft while shallow bore wells dried up. During
this period the NREGS brought relief to the farmers and helped minimize hardships
due to drought that continued till mid- September 2009. Presently NREGS
encompasses all villages in the study area (Photo 1 - 4). For instance in Pamana
village over 60 to 70 adults hold NREGS cards and earn Rs. 100 day-1 under the
scheme. The activities carried out are removing silt from check dams, land levelling,
and bunding across slope in farmer’s fields, clearing of bush, etc. However, farmers
have ignored cultivation of live bunds and reinforcement of bunds with vegetation
despite incentives and distribution of seeds by Govt.
To maintain check dams in Pamana village, the Golconda Grameena Bank has
granted one lakh rupees to a group of ten farmers. Besides this the Gram panchayat
has petitioned the Govt. for monetary support for constructing a kunta (small tank)
towards the southeast direction of the village for storing runoff and wastewater to
support agriculture as they village does not have any tank for this purpose. In Pamana,
social organisation is vibrant. At present over 26 SHG with 15 members each, is
functioning in the village. Besides this, there is one association for the handicapped,
six farmers’ associations and two watershed committees. Each household has at
least one person in any one of these structures.
20
Besides NREGS, the state Govt., has launched a housing scheme called Indiramma
Pathakam under which scores of houses have been constructed and distributed in
the villages. For instance, in Pamana over 192 houses were sanctioned at a cost of
50,000 rupees each of which 150 have been completed and the rest are under
construction. In addition to these, the pension scheme for old, handicapped and widow
have brought relief to people in the villages. Health and immunization program have
also been emphasised and mid-day meal and Anganwadi schemes have contributed
significantly.
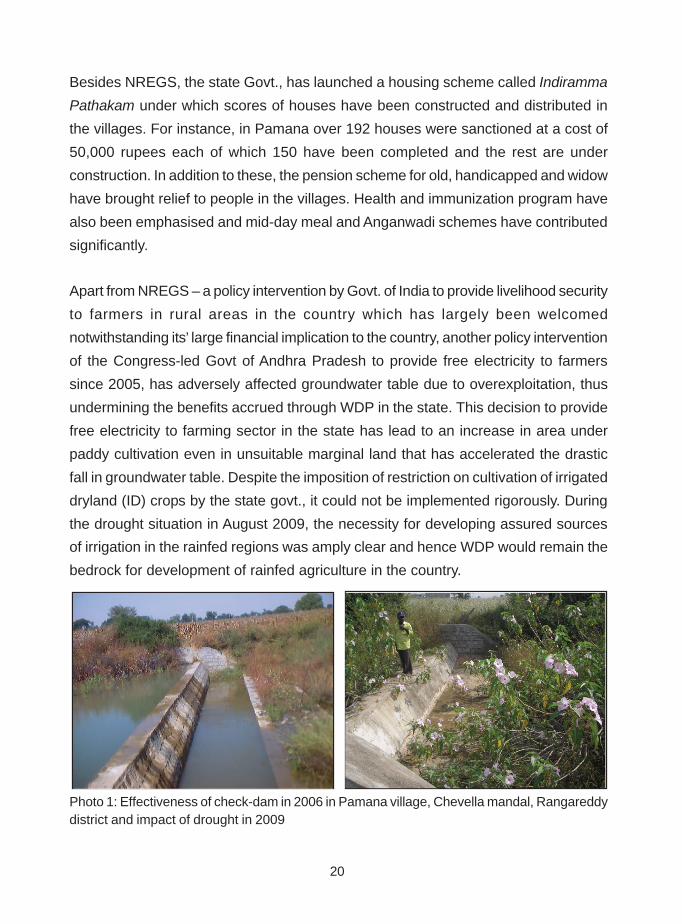
Apart from NREGS – a policy intervention by Govt. of India to provide livelihood security
to farmers in rural areas in the country which has largely been welcomed
notwithstanding its’ large financial implication to the country, another policy intervention
of the Congress-led Govt of Andhra Pradesh to provide free electricity to farmers
since 2005, has adversely affected groundwater table due to overexploitation, thus
undermining the benefits accrued through WDP in the state. This decision to provide
free electricity to farming sector in the state has lead to an increase in area under
paddy cultivation even in unsuitable marginal land that has accelerated the drastic
fall in groundwater table. Despite the imposition of restriction on cultivation of irrigated
dryland (ID) crops by the state govt., it could not be implemented rigorously. During
the drought situation in August 2009, the necessity for developing assured sources
of irrigation in the rainfed regions was amply clear and hence WDP would remain the
bedrock for development of rainfed agriculture in the country.
Photo 1: Effectiveness of check-dam in 2006 in Pamana village, Chevella mandal, Rangareddydistrict and impact of drought in 2009

21
Photo 2: Efficacy of WDP in Pamana as evident from stream flow
Photo 3: Visit to Chintapatla village toassess drought situation in August 2009
Photo 4: Tribal farmers in Chintapatlatreated watershed in March 2009
Climatic condition, change in land use, cropping pattern and status of water
resources in study area
Analysis of historical rainfall data in Andhra Pradesh indicates that 65% is received
during southwest monsoon while 24% precipitation occurs during northeast monsoon,
9% during summer and 2% in the winter season. The importance of southwest
monsoon rainfall to the Telangana region is evident from the fact that 76% of the
annual rainfall is received during this season while Coastal Andhra and Rayalaseema
regions receive 59 and 56% only. The northeast monsoon contributes only 13% in
case of Telengana while it accounts for 30% in case of Rayalaseema region and
29% in case of Coastal Andhra. Annual rainfall variability is high i.e., 30-40% in
Telangana region and in Rayalaseema and moderately lower (20-30%) in case of
Sept. 2006 Nov. 2009

22
Coastal Andhra (CRIDA, 2009). Analysis of rainfall data indicated that the amount of
rainfall is changing in Rangareddy affecting the production systems when compared
to Nalgonda. Although the minimum and maximum temperature is not varying in
Rangareddy, the minimum temperature in Nalgonda like the rest of eastern half of AP
is increasing which is impacting the production systems. The range of relative humidity
was seen to be low in Rangareddy when compared to Nalgonda district.
Analysis of rainfall data during 2005 indicated that the southwest monsoon set in on
Telengana region on June 25 and the total rainfall received in the region was higher
than the normal. For instance, in case of data obtained from CRIDA’s research farm
located at Hayathnagar, annual rainfall in 2005 was recorded as 1086 mm when
compared to the normal (1971 – 2000) of 742 mm. Sowing of the crops in this area
commenced during 26th Standard Meteorological Week (SMW) (June 25 – July 1)
and was fairly completed within the next two weeks; however, a few crops were
sown till the 29 SMW. The southwest monsoon withdrew from the region by the
October 31, 2005 (CRIDA, 2006).
In 2006, the southwest monsoon set in on June 10 over Hyderabad and Rangareddy
and the southwest monsoon rainfall received at HRF was 685 mm or 92% of the
normal for the station. Sowing of most of the crops commenced during the 24th
SMW while some of the crops were sown till the 30-31 SMW due to an intermittent
dry spell during 26-29 SMW. Soil moisture stress in the early establishment stage of
the crop resulted in stunted growth of sorghum. The southwest monsoon also withdrew
earlier by a period of 10 days from the normal date. In 2007 the southwest monsoon
set in on June 13, 2007 over Hyderabad and during the season, a total rainfall of 719
mm was recorded in HRF. Sowings of most crops commenced during the 23 SMW
week owing to good pre-monsoon rainfall and were completed during 24-26 week.
However, rainfall in the month of July was deficit by 82.2 % and the southwest monsoon
withdrew one week in advance. In 2008 the southwest monsoon set in on June 9 as
a very weak system resulting in light rainfall occurrence during 12 –13th June. By the
end of the season the annual rainfall received at HRF was 1088 mm and most of the
crops could be sown only during the 26 – 30th SMW owing to low monsoon activity.
The southwest monsoon also withdrew earlier by a week (CRIDA 2009, p 7). In 2009
the vigorous pre-monsoon activity lead to a weakening of southwest monsoon and
23
as a result the Kharif cropping season was lost. The revival of monsoon in September
has shored up the water deficit, but the loss of cropping season has endured.
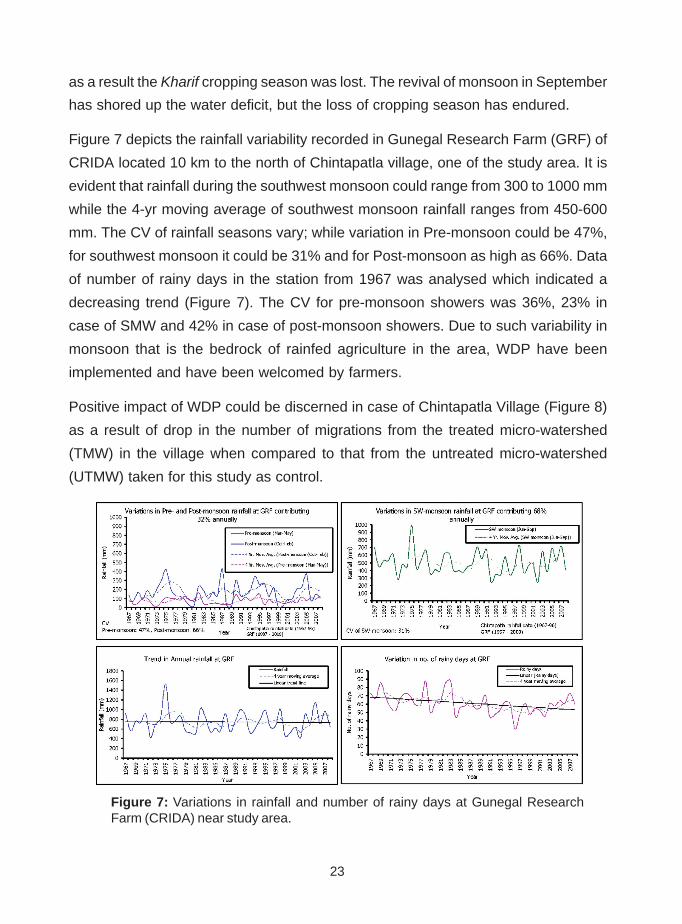
Figure 7 depicts the rainfall variability recorded in Gunegal Research Farm (GRF) of
CRIDA located 10 km to the north of Chintapatla village, one of the study area. It is
evident that rainfall during the southwest monsoon could range from 300 to 1000 mm
while the 4-yr moving average of southwest monsoon rainfall ranges from 450-600
mm. The CV of rainfall seasons vary; while variation in Pre-monsoon could be 47%,
for southwest monsoon it could be 31% and for Post-monsoon as high as 66%. Data
of number of rainy days in the station from 1967 was analysed which indicated a
decreasing trend (Figure 7). The CV for pre-monsoon showers was 36%, 23% in
case of SMW and 42% in case of post-monsoon showers. Due to such variability in
monsoon that is the bedrock of rainfed agriculture in the area, WDP have been
implemented and have been welcomed by farmers.
Positive impact of WDP could be discerned in case of Chintapatla Village (Figure 8)
as a result of drop in the number of migrations from the treated micro-watershed
(TMW) in the village when compared to that from the untreated micro-watershed
(UTMW) taken for this study as control.
Figure 7: Variations in rainfall and number of rainy days at Gunegal ResearchFarm (CRIDA) near study area.

24
Figure 8: Migration pattern in Chintapatla (2007) (Sample size in TMW and UTMW was 82and 58 households respectively)
Photo 5: Efficacy of WDP in Dontanpalli village, Shankarpalli mandal, Rangareddy district(Aug. 2008)

25
Photo 6: Efficacy of check-dam in Dontanpalli
2007 2008
Photo 7: Impact of WDP on land use pattern in Dontanpalli in March 2009
Since 2005, there has been a change in the composition of crop cafeteria in the
region through partial replacement of traditional crops like sorghum and castor with
paddy, vegetables – tomato, carrot, brinjal (egg-plant), cash crops like chilli and
coriander, besides fruits - grapes, guava, custard apple, gooseberry, etc. This is a
welcome trend as it increased economic returns from agriculture making it
economically viable and increasing livelihood security among farmers. Development
of forward linkages like setting up of food – processing units or development of faster
mode of freight transport and adequate storage facility etc., are essential for sustaining
this development (Photo 5 - 7).

26
Photo 8: Farm pond in Gollapalli village
July 2007 July 2008
Photo 9: Preparation of land for horticulturalplantation financed by Govt. of AP(Gollapalli - March 2009)
Photo 10: Output from dug well duringsummer in Gollapalli (March 2009)
Photo 11: Effect of drought in Gollapalli - August 2009

27
Figure 9: Land use intensity in selected micro-watersheds in study area (2006 -2008)

28
Area under agriculture had increased during 2008 in the selected watersheds as
compared to that in 2006 due to cultivation of land under long fallow category; in fact
in 2007 area under fallow shrunk due to favourable rainfall (Figure 9). In 2006, when
the present study was initiated, bore-wells predominated the area due to supply of
free electricity to farmers in the state. The number of bore-wells in Chintapatla was
400 in an area of 2226 ha in the village. In case of Pamana village there were 120
bore-wells in an area of 879 ha. In Dontanpalli the number of bore-wells were 300 in
an area of 576 ha, followed by 70 in case of Gollapalli in 2061 ha. Besides this, the
number of dug-wells in Chintapatla and Dontanpalli was over 100 in each village
followed by that in Pamana - 80 and least in case of Gollapalli, i.e., 50. With the
implementation of WDP it has been seen that the dug - wells have slowly increased
in number in these villages (Photo 8 –11).
In Chintapatla village, over 320 ha of land was irrigated through bore-wells while
tanks irrigated around 132 ha and dug-wells about 120 ha. In case of Dontanpalli,
one tank and numerous dug-wells and bore-wells provided critical irrigation. Water
output of dug-wells was good in the village as it is located near the Osmansagar
Reservoir. In case of Pamana, bore-wells were more popular that irrigated 120 ha of
agricultural land. In Gollapalli, despite its’ vast extent, there were fewer number of
bore-well and dug wells.
Figure 10a: Change in depth of water -table across watersheds (2006 - 2008)

29
Figure 10b: Change in depth of water -table seasonally across watersheds in 2008
During the study in 2006, it was seen that in treated micro-watersheds (TMW) across
the villages, the depth of water table ranged from 25.5 to 45 m with a minimum depth
recorded in Chintapatla and a maximum in Gollapalli. During 2007 depth of water
table ranged from 25.5 to 75 m across the villages and in 2008 it fell below 60 to 97.5
m. The fall was seen to be least in case of Chintapatla and most in case of Pamana
where a number of high-value cash crops like vegetables; oilseeds and cotton were
being cultivated using irrigation (Figure 10a & b). In untreated micro-watershed
(UTMW), the depth of water table during 2006 ranged from 30 to 60 m with a minimum
recorded in case of Dontanpalli and a maximum in case of Chintapatla. During 2007
the water table fell to 60 to 90 m across all the villages while in 2008 it fell further to 75
to 97.5 m. During 2008, minimum decline was recorded in case of Gollapalli and
maximum in case of Pamana. The difference in depth of water table in TMW and
UTMW indicates that WDP has helped in augmenting groundwater resource in treated
watersheds however, the withdrawal is more than the recharge which is resulting in
a general decline in water table. On the other hand in untreated watersheds,
groundwater draft is continuing unabated leading to a continuous fall in the water
table as seen in case of Chintapatla village (Figure 10a).

30
6. Methodology developed for Post-facto evaluation
The need for development of a comprehensive methodology for a Post-facto evaluation
of WDP in rainfed regions has been felt for a long time; more so since the mid-term
review of the 9th and 10th FYP in the country. The necessity to remove lacunae dogging
the WDP has been felt for long. However, as evaluation studies undertaken earlier
were unable to provide geo-referenced concrete solutions for implementation,
necessary corrections could not be affected by the implementing agencies that proved
detrimental to accruing economic returns in the short-run and ecological sustainability
in the long run. The present study was undertaken precisely to address these lacunae.
The primary objective of the study was thus, to use tools of Geo-informatics for making
WDP sustainable. These tools could help in generating geo-referenced baseline data
that could in turn support objective evaluation of WDP, a definite advantage over
previous evaluation studies.
The present publication illustrates how GIS and Remote Sensing techniques could
be used to generate baseline information for undertaking temporal monitoring of impact
of WDP (Figure 11). As WDP encompasses a number of multidisciplinary aspects,
a set of relevant sustainability indicators were identified for evaluation of each treated
/ developed watersheds in AESR 7.2 that encompasses Telangana region in AP. These
indicators were identified based on the natural resource base conditions prevalent in
the study area and the socio-economic condition of the farmers in the villages where
the WDP had been implemented.
A framework was constructed to facilitate a quantitative evaluation of WDP. The entire
process of Post-facto assessment and evaluation of WDP namely, identification of
core issues that are either retarding or propelling the process of agricultural and
economic development in a designated watershed, construction of relevant
sustainability indicators and identification of critical indicators for evaluation of
sustainability at various spatial - levels, namely, household, field and watershed -
levels, etc., was developed and applied for evaluating eight micro-watersheds in
Rangareddy and Nalgonda districts during 2005-2009 and the results of this work
has been presented in this publication. The Post-facto evaluation methodology evolved
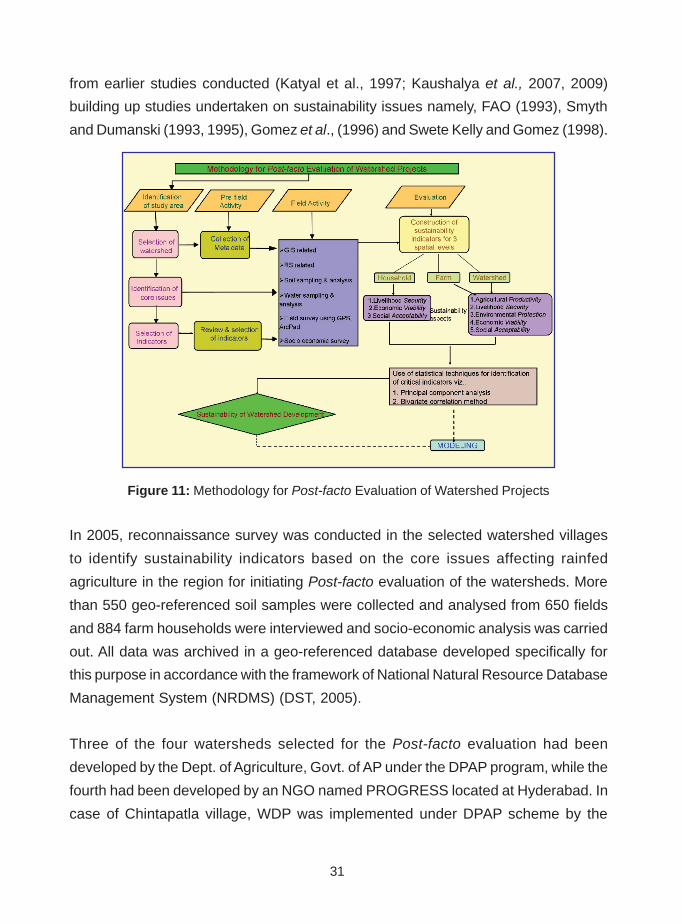
31
from earlier studies conducted (Katyal et al., 1997; Kaushalya et al., 2007, 2009)
building up studies undertaken on sustainability issues namely, FAO (1993), Smyth
and Dumanski (1993, 1995), Gomez et al., (1996) and Swete Kelly and Gomez (1998).
Figure 11: Methodology for Post-facto Evaluation of Watershed Projects
In 2005, reconnaissance survey was conducted in the selected watershed villages
to identify sustainability indicators based on the core issues affecting rainfed
agriculture in the region for initiating Post-facto evaluation of the watersheds. More
than 550 geo-referenced soil samples were collected and analysed from 650 fields
and 884 farm households were interviewed and socio-economic analysis was carried
out. All data was archived in a geo-referenced database developed specifically for
this purpose in accordance with the framework of National Natural Resource Database
Management System (NRDMS) (DST, 2005).
Three of the four watersheds selected for the Post-facto evaluation had been
developed by the Dept. of Agriculture, Govt. of AP under the DPAP program, while the
fourth had been developed by an NGO named PROGRESS located at Hyderabad. In
case of Chintapatla village, WDP was implemented under DPAP scheme by the

32
Dept. of Agri., Govt of Andhra Pradesh during the period 1994 – 1999. In Dontanpalli
village, Agri. Dept., implemented WDP under DPAP scheme during 1995 - 2001. In
Gollapalli, WDP was started in 1999 and concluded in 2004 while in Pamana village,
an NGO named PROGRESS had implemented the program between 1994/95 and
2001.
After identification of core-issues that affected sustainability of agriculture, a suite of
fifty-one indicators were developed out of which thirty –nine were used for evaluation
of sustainability at household-, field- and watershed- level. The remaining 12 indicators
would be used to undertake evaluation at village- and AESR- level. Sustainability
Indicators based on the performance and state of various agricultural resources
and production systems in the area, were constructed. In order to evaluate the impact
of WDP on agricultural development, five aspects of sustainability were assessed
namely, agricultural productivity, livelihood security, economic viability,
environmental protection and social acceptability (Smyth & Dumanski, 1995). Tools
of GIS and remote sensing were used to evaluate the Performance of indicators like
the Normalised Differential Vegetation Index (NDVI) and agricultural productivity besides
the State of indicators like slope and soil nutrient gradient, besides several others as
listed in Table 1. To this end, a matrix of indicators was developed in order to facilitate
an impartial quantitative evaluation of the treated watersheds for which a scorecard
was developed to quantify indicators that produced only qualitative information.
Development of this evaluation methodology and its application for assessing the
impact of WDP in eight treated and untreated micro-watersheds in Telengana region,
have been described in this publication.
As mentioned earlier, the study followed an integrated approach by using modern
tools of Geomatics, viz., GIS, GPS and Remote Sensing (RS) in addition to conventional
techniques, like field survey and transact walk, civil survey using Total Station and
topographical maps, soil sampling and analysis, socio-economic survey and
Participatory Rural Appraisal (PRA). Under the Geomatics module, cadastral maps,
topographical maps and satellite imagery of the selected watersheds were procured
from various agencies - AP State Revenue Department and Map Sales Office; Survey
of India (SOI) and National Remote Sensing Centre (NRSC), all of them located at

33
Hyderabad. Watershed hierarchy was identified and mapped using ArcGIS (Ver. 8.1).
Catchments of 1st - order streams were nested into that of 2nd - order stream
catchments which in turn, were nested into the 3rd - order stream catchments and so
on. As the National Watershed Atlas (AIS & LUS, 1988) provides nomenclature for
the five higher – orders of drainage network hierarchy in the country namely, Water
Resource Region, River Basin, Catchments, Sub-catchments and Watershed; it was
proposed by CRIDA in 1996 to further delineate the lower-end drainage network, viz.,
the 3rd, 2nd and 1st order streams and up-linking of them with the National Watershed
Hierarchy (Katyal et al., 1996; Kaushalya et al., 2001) under the ICAR funded project
- Institute Village Linkage Program (IVLP) in 1996. This method has since been
accepted as a standard practice in the country with the All India Soil Survey and Land
Use Planning adopting it for delineating the drainage network and micro-watersheds
of the entire country.
For the study, watersheds in each of the selected villages were delineated into micro-
watersheds. For instance in case of Pamana, micro-watersheds were delineated to
Figure 12: Digitization & delineation of watersheds using Arc GIS – Pamana Village, ChevellaMandal, Rangareddy Dist.

34
identify a treated or developed micro-watershed (TMW) where S&WC structures
were located and an untreated micro-watersheds (UTMW) to be used as control,
where no interventions were made. The nomenclature used to identify each of the
selected micro-watersheds has been explained in Section 4. Micro-watersheds were
delineated in a similar manner in other case of other villages also as illustrated earlier
in Figures 3 – 6.
Watershed resource survey and household socio-economic survey were conducted
using two structured questionnaires (Annexure 1 & 2) to measure the performance
and state of sustainability indicators. Two databases – one for watershed information
and another for household information - were created using MS-Access and linked
to the GIS platform. Soil and water sampling and analysis for twelve physico-chemical
and biological parameters were undertaken and the results were input into a Watershed
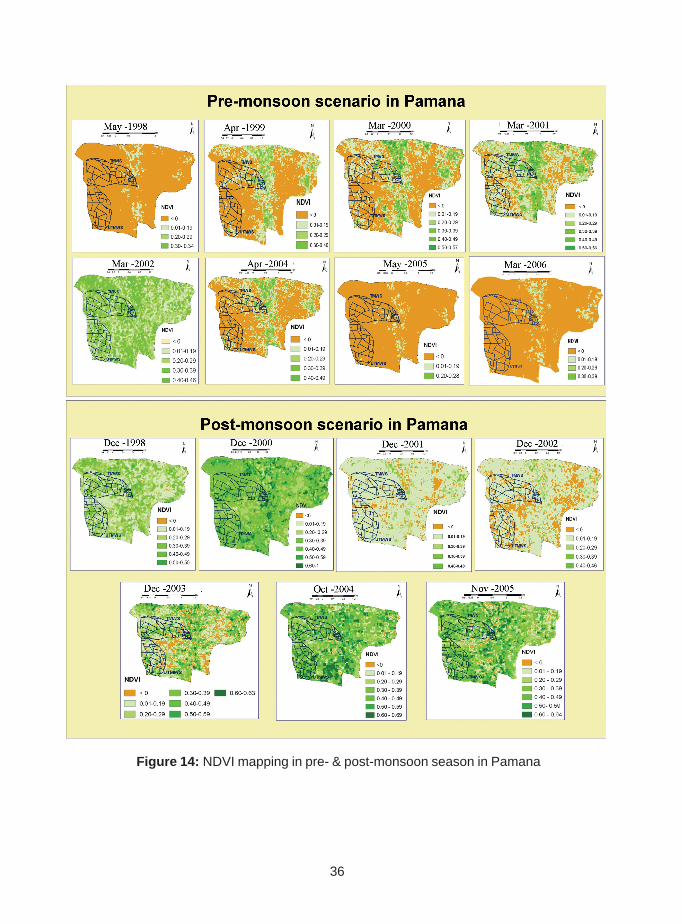
Database. Satellite imageries of IRS -1D LISS-3 of 16 Nov. 1998, 17 March 2001, 16
Oct. 2004 and IRS – P6 LISS - 3 data of 4 Nov. 2005 were digitally interpreted using
ERDAS Imagine (Ver. 8.7) (Figure 12) and land use, land cover and land degradation
(Figure 13), NDVI maps (Figure 14) and soil fertility status (Figure 15) were prepared
and the results were integrated for evaluation of the WDP in the selected villages and
presented in this publication.
Identification of core issues that affect agriculture in the villages
After completion of reconnaissance survey of selected watersheds and discussion
with key informants, core issues that impact agriculture in the selected watersheds
were identified. These issues were related to several aspects of rainfed agriculture in
the region viz.,
• Availability of water resource - water harvesting, utilization and safe disposal
• Soil fertility status – physical, chemical and biological characteristic
• Vegetative cover - forest area, scrubland, rangeland, CPR, environmental
integrity
• State of agriculture – area, production, productivity

35
• Social structure in the village – mobilization of people, water user’s group,
social fencing, awareness, enhancement of technical skills, empowerment,
food security, etc.
• Economic structure within the village – source of livelihood, gainful
employment, quality of life, dependence on government aid, etc.
• Institutional support – Government initiatives and support, economic policy,
macro- economics, socio-political conditions, etc.
Figure 13: Land use land cover & degradation of land cover in Pamana
36
Figure 14: NDVI mapping in pre- & post-monsoon season in Pamana

37
Figure 15: Soil fertility status at Pamana watersheds
38
Selection of indicators
In order to study the diverse aspects of rainfed agriculture and the impact of WDP on
the core issues impacting rainfed agriculture in the study area, sustainability indicators
were used. Although, initially this number was considered large, it was soon realised
that in order to avoid overlooking any crucial source of information during the evaluation
study, it was essential. After collection of all pertinent data, statistical analysis using
Bivariate Correlation (BVC) and Principal Component Analysis (PCA) were undertaken
to identify the critical indicators essential for carrying out a detailed study, thus solving
the problem of multiplicity of indicators, if any. After four years of evaluation studies, it
has been possible to identify a minimum dataset of relevant indicators for each
spatial-level – household (HH), Field (FL) and watershed (WL) that could be used to
evaluate and also to implement WDP projects for sustainable development, in future.
7. Construction of Sustainability Indicators
Sustainability is a vast subject, however, there is a consensus among researchers
that there are five pillars of sustainability, namely productivity, viability, security,
protection and acceptability (Smyth & Dumanski, 1995). Under the Framework for
Evaluation of Sustainable Land Management (FAO, 1993) developed by an
International Working Group (IWG), a procedure was recommended to evaluate
sustainability of current and alternative land-use systems. This was an extension of
the Framework for Land Evaluation put forth by FAO in 1976 except that evaluations
were based on indicators of performance over time, rather than land suitability as
indicated by FAO (1998). While initiating this study, the FESLM approach was found
suitable and hence it was adequately modified and adapted to the present study. The
adaptation required development of relevant indicators and a methodology to undertake
a quantitative evaluation of impact of WDP in the study area.
Construction of sustainability indicators was based on deductive analysis. For
instance, issues of natural resource availability viz., soil, water and vegetation affect
diversity and intensity of land use, and thus have an impact on the economic viability
of agricultural enterprise in the watershed or the village as a whole. Land quality and
land use practices of farmers’ impact the livelihood security of the farmers while
better awareness among farmers have a positive impact on the environmental
protection of the natural resources on which rainfed agriculture is based. Economic

39
viability of the agricultural operations could be understood by analysing the issues
that affect societal value of farmland besides impacting the risk-buffering capacity of
the community and equity among them. Rural livelihood options and human well -
being are vital for social acceptability of projects like the WDP without which
sustainable development is unthinkable. These issues guided the construction of the
fifty-one sustainability indicators used for this study.
Due to the multidisciplinary nature of evaluation procedure for WDP, a multitude of
performance and state indicators were constructed. Several of these could be
measured directly, viz., soil fertility level (N, P, K) or could be expressed quantitatively
like size of landholding, while others could be indicated only qualitatively viz., migration,
awareness among farmers, adoption of crop contingency plans, farm OM recycling,
etc. In order to analyse all these aspects that could influence sustainability of WDP,
thirty-nine indicators were used as listed in Table 2. A scorecard was developed to
quantify the qualitative data that lead to the development of a composite evaluation
procedure that was objective. Hence this methodology is considered an improvement
over all earlier evaluation procedures of WDP that was adopted or followed by various
authors and agencies in India.
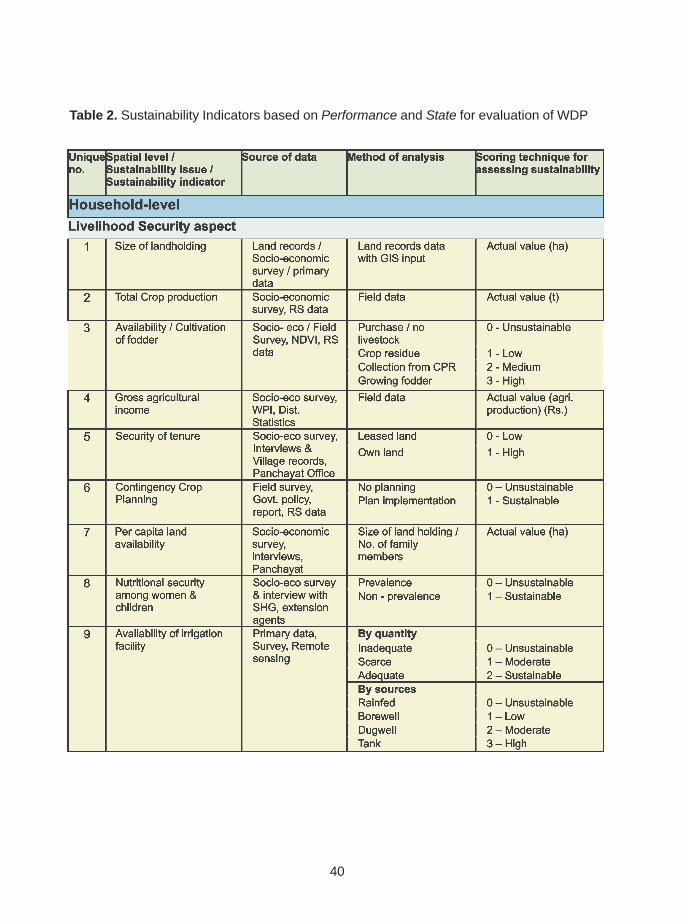
40
Table 2. Sustainability Indicators based on Performance and State for evaluation of WDP
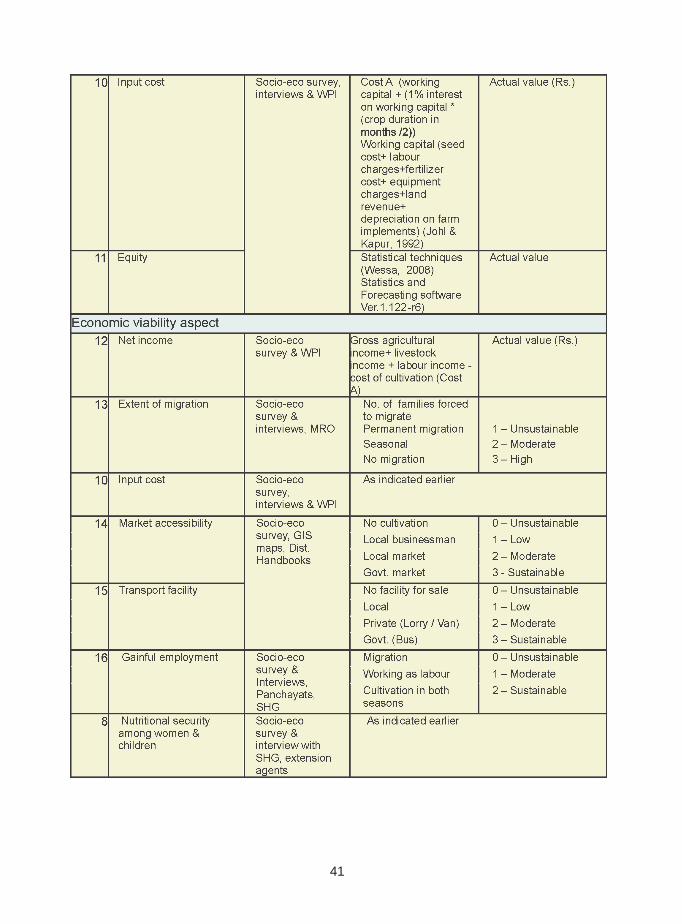
41
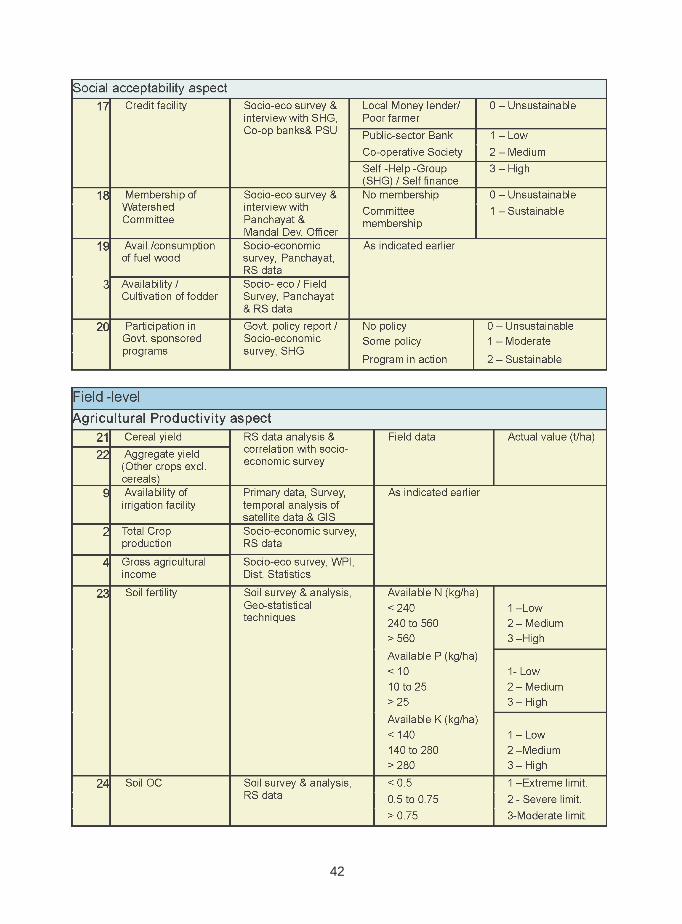
42

43

44

45

46
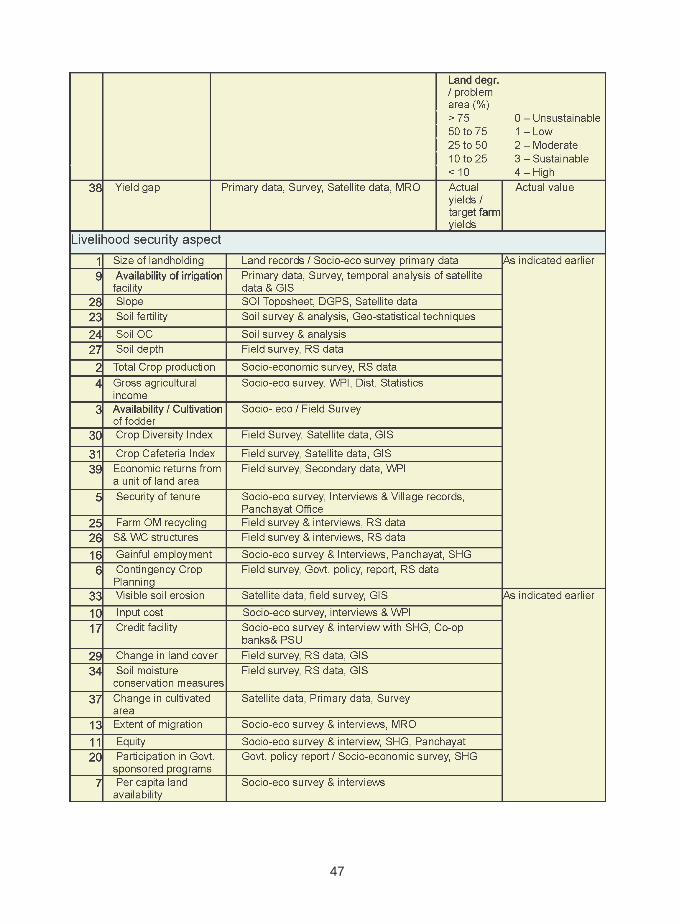
47

48

49

50
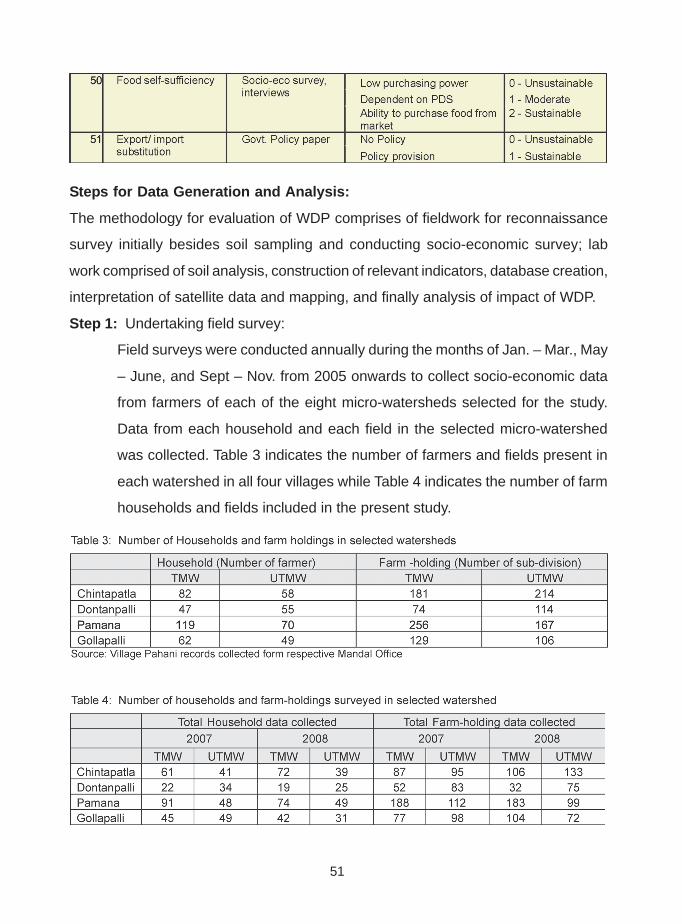
51
Steps for Data Generation and Analysis:
The methodology for evaluation of WDP comprises of fieldwork for reconnaissance
survey initially besides soil sampling and conducting socio-economic survey; lab
work comprised of soil analysis, construction of relevant indicators, database creation,
interpretation of satellite data and mapping, and finally analysis of impact of WDP.
Step 1: Undertaking field survey:
Field surveys were conducted annually during the months of Jan. – Mar., May
– June, and Sept – Nov. from 2005 onwards to collect socio-economic data
from farmers of each of the eight micro-watersheds selected for the study.
Data from each household and each field in the selected micro-watershed
was collected. Table 3 indicates the number of farmers and fields present in
each watershed in all four villages while Table 4 indicates the number of farm
households and fields included in the present study.

52
Step 2: Geo-referencing of soil sampling sites
Step 3: Geo-referencing of S&WC structures and updating field boundary.
Initiating Lab work:
Step 4: Preparation of database in MS-Access, to store data in the form of Tables. In
all, fourteen tables were prepared to store information pertaining WDP, For
e.g., in the database Table-II related to resource base in the watershed /
village; Table- III to landholding information, table-IV for land use, table-V for
household information; table-VI for recording farm assets, table-VII for
cropping pattern details; table-VIII for soil information; table-IX for agricultural
production, table-X for livestock data; table-XI for credit facility; table-XII for
market details, XIII for enumerating role of women, table-XIV for recording
farmer’s perception on risks information on cottage industry in the village,
and so on.
Step 5: Development of an application in Dot Net for entering data in database by
using Forms and Database as back-end of application besides undertaking
small calculations and assigning scores while entering data into the
database. If indicator contained quantitative values, for e.g., size of land
holding, agricultural production, etc., values were stored directly. For storing
qualitative data, programming was done to get the necessary result. For
indicator security of tenure programming was done using if condition; in the
Landholding Form, an input control named Land Ownership was set. Using
if condition, scores were assigned as follows:
For ‘Leased Land’ the score assigned was‘0’
For ‘Own land’ the score assigned was ‘1’
Step 6: Conversion of MS -Access Database Tables into MS-Excel for setting
indicators for initiating evaluation at three spatial levels as mentioned earlier,
namely - household, farm and watershed-levels and five aspects of
sustainability viz., Livelihood Security, Economic Viability, Agricultural
Productivity, Environmental Protection and Social Acceptability.
Steps 1 to 6 are common and are a prerequisite for screening for identifying critical
indicators.

53
Step 7: Screening for critical indicators using two statistical techniques – Bivariate
Correlation technique and Principal Component Analysis. These
methodologies have been explained in detail in Step 8 and 9.
Step 8: Methodology for identifying critical indicators using Bivariate Correlation (BVC)
technique
SPSS (Ver.16.0) was used to screen for critical indicators for the study and the
methodology followed was as follows. From the Main Menu of SPSS ver.16.0 for
Windows, the following items were chosen:
Analyze
Correlate
Bivariate
To start analysis, a minimum of two variables were selected for which the following
options are available:
Correlation Coefficients - For quantitative, normally distributed variables,
the Pearson’s Correlation Coefficient Technique was chosen. If data was not
normally distributed or had ordered categories, then one had to choose a
Kendall’s tau-b or a Spearman’s - rho, which measured the association
between the scores or the orders. While interpreting the results, care was
taken not to draw any cause-and-effect conclusion owing to any significant
correlation (SPSS 16.0 for Windows help).
Testing Significance - One could select a two-tailed or a one-tailed probability
method. If the direction of association was known in advance, one must select
a one-tailed method, otherwise a two-tailed method was found more suitable.
Significant correlations were flagged with asterisk.
For the present study, the following algorithm was used for identifying critical indicators.
Example: Algorithm for assessing impact of WDP on Agricultural Productivity at
field-level:
Step a: To assess sustainability of Agricultural Productivity at field-level, eleven
indicators were constructed. (See Table 2).

54
Step b: A Bivariate Correlation analysis was performed on the eleven indicators to
identify the most significantly - correlated indicators (p = 0.05) whose performance
was critical for achieving sustainable Agricultural Productivity.
Step c: The indicators with p= 0.05 significance were selected for further analysis.
Step 9: Methodology for screening of critical indicators using Principal Component
Analysis
A Principal Component Analysis technique was also used to screen critical
indicators on the same set of data as mentioned earlier and SPSS was used
for this purpose. The method adopted for the analysis was as follows:
Step a: Identifying relevant variables from database and storing them in MS- Excel
sheet.
Step b: Opening the data in SPSS Window.
Step c: Selecting following options from SPSS Main Menu
Analyze →→→→→ Data Reduction →→→→→ Factor; this step is indicated in Screenshot
1 below.
Screenshot 1
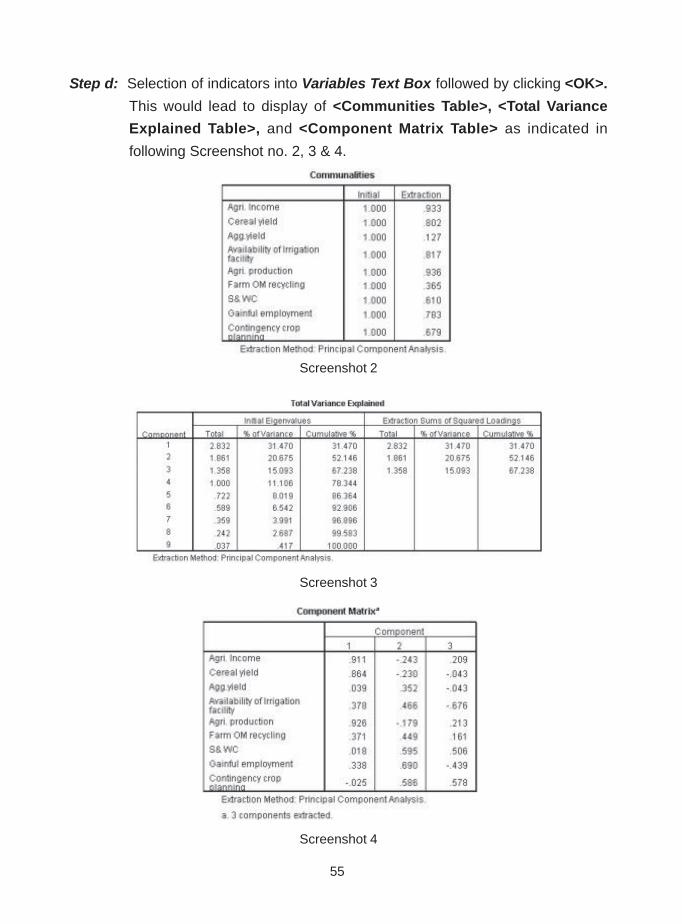
55
Step d: Selection of indicators into Variables Text Box followed by clicking <OK>.
This would lead to display of <Communities Table>, <Total Variance
Explained Table>, and <Component Matrix Table> as indicated in
following Screenshot no. 2, 3 & 4.
Screenshot 2
Screenshot 3
Screenshot 4

56
Step e: From the Table depicted in Screenshot 4, three components were extracted.
From the <Component Matrix > for each component, maximum value
was selected from which 10% was subtracted to arrive at a figure.
Step f: This was followed by selection of all indicators that fell within the range of
[(max value) to ( max value – 10% of max value)].
Step g: From the set of indicators identified under each component, critical indicators
were screened.
Step h: From this set of indicators, a correlation was established under each Principal
Component.
Step i: In each component, an indicator was identified which correlated most with
other indicators at 0.01 level of significance.
Step 10: This was followed by selection of common indicators identified under both
techniques employed in the study i.e., BVC and PCA for each aspect of
evaluation. These common indicators were considered as critical indicators
and used for further study.
Step 11: For critical indicators so far identified, threshold values were estimated
before commencement of analysis.
For e.g., where indicators elicited quantitative data, actual values were used
in the following manner: Threshold was derived as 20% over mean based
on community performance (Gomez et al., 1996).
Where qualitative data was available, scores were assigned and threshold
value was assumed as maximum score.
Step 12: After generating Threshold Value as indicated in Step 11, a ratio was
calculated between Actual and Threshold Values. An average value was
again calculated on the basis of all ratios generated pertaining to each
sample, viz., Farmer Id or Survey no. as the case may be. This final number
was deemed to determine if a sampled farmer or field was sustainable. If
this final value was found to be < 1 it denoted that the sample was
unsustainable. On the contrary, if this value was > 1 it denoted that the
sample was sustainable.
If the state or performance of an indicator was better than the average state or
performance of a community, it was considered both desirable and sustainable and
a score of > 1 were concluded sustainable. Performance lower than the Community

57
Performance as indicated by Threshold Value was assigned a score of < 1 and
termed unsustainable.
Step 13: From the critical indicators identified in Step 10, a PCA was performed to
assign weightage for each indicator according to its’ contribution towards
achieving sustainability. For e.g., for indicator Farm OM recycling which
was found to be critical under PC1 in 3 villages (Chintapatla, Dontanpalli &
Pamana) and PC3 in case of Gollapalli, an average weightage was calculated.
Similarly, weightage was estimated for 3 of the critical indicators identified
for household level and 12 critical indicators identified for field and watershed-
levels respectively. Finally, the relative contribution of each of the critical
indicators were estimated as a ratio for indicating its’ role or contribution
towards achieving sustainable development through WDP.
The contribution of each of the critical indicators identified has been presented in
Section 13.
8. Summary of Findings
Table 5 and 6 indicates the level of success achieved in collecting field -level data
considering the village-level constraints. While the Pahani (Village) records indicated
a number of land parcels (Survey number), where the records did not tally with the
ground reality, as there was more sub-divisions besides some amalgamations that
were not reflected in the village records. Table 6 to 9 indicated the sample size during
each year i.e., 2006, 2007 and 2008 in both types of watersheds in each village.
Utmost care was taken to sample and analyse a set of common farm households
during each year in each of the watersheds for undertaking trends in change reported.
For e.g. in case of Pamana village, 21 households were surveyed in the treated micro-
watershed who collectively cultivated an area of over 30.76 ha annually (Table 7). In
untreated micro-watershed in the same village, 6 farm households were evaluated
who cultivated a total area of 9.96 ha. In case of Chintapatla village, 7 households
were studied in the TMW who collectively cultivated 9.84 ha of land while in UTMW,
13 households who cultivated a total area of 16.48 ha, were assessed (Table 8). In
Table 9 and 10 the number of households surveyed in Dontanpalli and Gollapalli have
been listed.
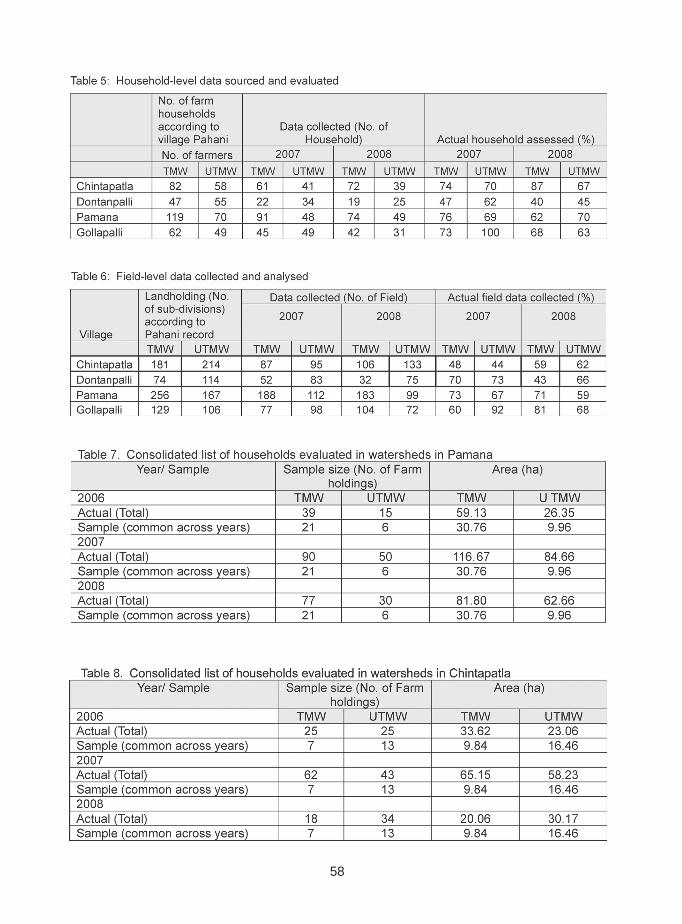
58

59
In Tables 11 – 13 details of field-level information collected across the villages during
2006, 2007 and 2008 have been indicated.

60
� Based on the evaluation of eight micro-watersheds selected for the study, it was
found that to evaluate sustainability at household-level, only 20 indicators were
found relevant from the list of indicators developed as assessment was applicable
for only three aspects of sustainability at the household–level namely, livelihood
security, economic viability and social acceptability. Of these 20 indicators,
only 3 indicators were found to be critical for sustainable development. They form
the minimum data set for the purpose of evaluation, namely - input cost, nutritional
security among women and children, and local availability or cultivation of fodder
by a household.
� For analysing impact of WDP on all five aspects of sustainability at field –level,
29 indicators were found relevant. Of these some indicators seemed more crucial
for sustained agricultural development than others as they could impact various
aspects of sustainability simultaneously at a given point of time. From these, a
minimum data set of 12 indicators was identified as critical for sustainable
development at the field – level. These are - soil moisture conservation measures,
effective S & WC structures, adopting Contingency Crop Planning, farm OM
recycling, availability of gainful employment options, gross agricultural income,
total crop production, local availability or cultivation of fodder, availability of irrigation
facility, Crop Diversity, security of tenure and enthusiastic extension workers.
� For analysing impact of WDP on all five aspects of sustainability at watershed –
level, 35 indicators were found relevant. A minimum data set of 12 critical indicators
was identified through statistical techniques. They were - efficacy of S & WC
structures, soil moisture conservation measures, farm OM recycling, gainful
employment, Contingency Crop Planning, Crop Diversity, security of tenure, gross
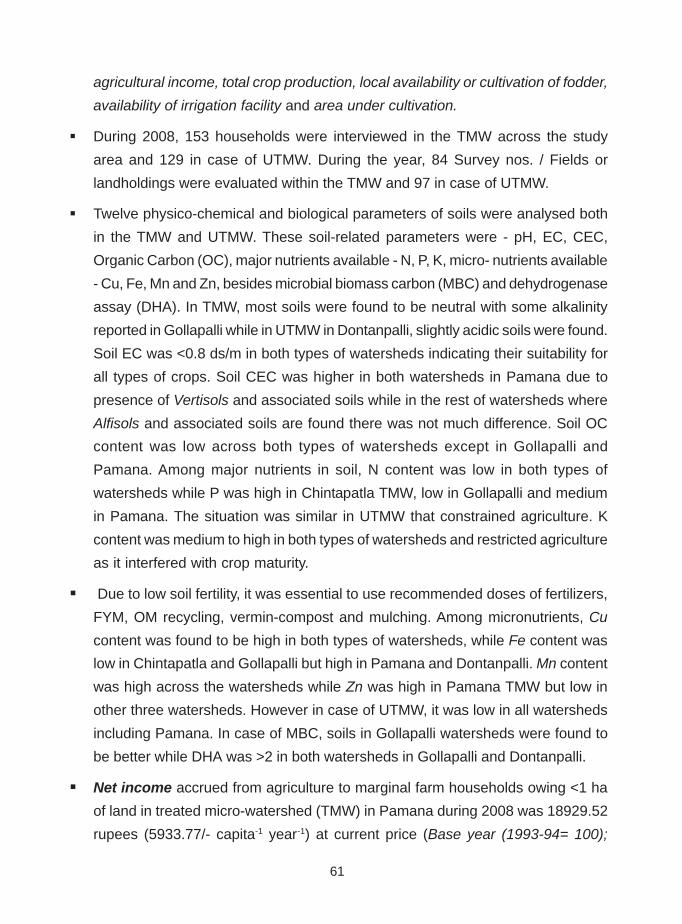
61
agricultural income, total crop production, local availability or cultivation of fodder,
availability of irrigation facility and area under cultivation.
� During 2008, 153 households were interviewed in the TMW across the study
area and 129 in case of UTMW. During the year, 84 Survey nos. / Fields or
landholdings were evaluated within the TMW and 97 in case of UTMW.
� Twelve physico-chemical and biological parameters of soils were analysed both
in the TMW and UTMW. These soil-related parameters were - pH, EC, CEC,
Organic Carbon (OC), major nutrients available - N, P, K, micro- nutrients available
- Cu, Fe, Mn and Zn, besides microbial biomass carbon (MBC) and dehydrogenase
assay (DHA). In TMW, most soils were found to be neutral with some alkalinity
reported in Gollapalli while in UTMW in Dontanpalli, slightly acidic soils were found.
Soil EC was <0.8 ds/m in both types of watersheds indicating their suitability for
all types of crops. Soil CEC was higher in both watersheds in Pamana due to
presence of Vertisols and associated soils while in the rest of watersheds where
Alfisols and associated soils are found there was not much difference. Soil OC
content was low across both types of watersheds except in Gollapalli and
Pamana. Among major nutrients in soil, N content was low in both types of
watersheds while P was high in Chintapatla TMW, low in Gollapalli and medium
in Pamana. The situation was similar in UTMW that constrained agriculture. K
content was medium to high in both types of watersheds and restricted agriculture
as it interfered with crop maturity.
� Due to low soil fertility, it was essential to use recommended doses of fertilizers,
FYM, OM recycling, vermin-compost and mulching. Among micronutrients, Cu
content was found to be high in both types of watersheds, while Fe content was
low in Chintapatla and Gollapalli but high in Pamana and Dontanpalli. Mn content
was high across the watersheds while Zn was high in Pamana TMW but low in
other three watersheds. However in case of UTMW, it was low in all watersheds
including Pamana. In case of MBC, soils in Gollapalli watersheds were found to
be better while DHA was >2 in both watersheds in Gollapalli and Dontanpalli.
� Net income accrued from agriculture to marginal farm households owing <1 ha
of land in treated micro-watershed (TMW) in Pamana during 2008 was 18929.52
rupees (5933.77/- capita-1 year-1) at current price (Base year (1993-94= 100);

62
WPI (2007) at 213.8; Source: CSO, Govt. of India 2008). In untreated micro-
watershed (UTMW) that was taken as control in the village, average income among
marginal households was 10843.50 rupees (4047.44/- capita-1 year-1) at current
price. The 74.5% increase in income among farm households in TMW in Pamana
was largely from wage earnings and a 10% increase from livestock husbandry. In
case of small farmers owing 1 – 2 ha of land in the TMW in the village, income
was calculated at 17654.92 rupees (4751.23/- capita-1 year-1) at current price
while among semi-medium farm households with 2- 4 ha of agricultural land,
income was estimated at 46895.16 rupees (14269.98/- capita-1 year-1) at current
price which was over 67.5% more than their counterparts in the UTMW in the
village. Analysis of income structure indicated that over half of it came from wages
and the rest from agriculture while livestock rearing contributed < 5%. In case of
medium-size farmers owning 4 – 10 ha of land, income accrued was 121607.45
rupees (Rs.20665.41/- capita-1 year-1) at current price that was 4.5 times higher
than the income accrued to their counterparts in the UTMW in the village (Figure
16). Most of this income came from cultivation of vegetables - tomatoes, carrot
and maize besides beetroot and cotton. Thus, it is evident that farmers owning <
4 ha land, both within treated as well as untreated micro-watersheds, depended
on labour-work for their income especially under NREGS in 2008, while the
medium- and large-size farmers with > 4 ha land, undertook cultivation of
vegetables in the TMW which increased their income and consequently their
livelihood security and economic viability of their agricultural enterprise.
� Comparison of net income accrued to farm households of various categories
across the villages, indicated that income among marginal farm households in
TMW was higher when compared to UTMW. This increase ranged from 12.7% in
Chintapatla TMW to 74.5% in case of Pamana TMW and a major reason for this
increase was the availability of wage-earning labour within the TMW apart from
the Govt. sponsored NREGS. Income from labour accounted for > 52.7% in TMW
among all categories of farmers compared to 33.2% in case of UTMW. In case of
medium category farmers, those in TMW in Pamana and Gollapalli fared better.
In Pamana agriculture, especially cultivation of cash crops gave higher returns
(46.7%) when compared to those in UTMW; in Gollapalli TMW, livestock rearing
provided 32% of income.

63
Figure 16: Average net income of farmers in 2008 in selected watersheds
� Operating-ratio or ratio of operating expenses to gross income was calculated
to assess the cost of cultivation. In Chintapatla TMW in 2006, Operating - ratio
was higher among marginal and semi-medium farmers, but in 2008 it fell to <0.25.
In UTMW, operating - ratio in small and semi-medium farmers was comparatively
lower and fell to 0.27 in 2008 (Figure 17a & b). In Dontanpalli, operating - ratio
was higher among marginal, small and semi-medium farmers in UTMW when
compared with those in TMW; it fell in 2008 compared to previous years. Operating-
ratio in Gollapalli TMW was slightly higher among semi-medium farmers and
remained consistent across the years. Operating- ratio was consistently high
among all categories of farmers in TMW when compared with those in UTMW.
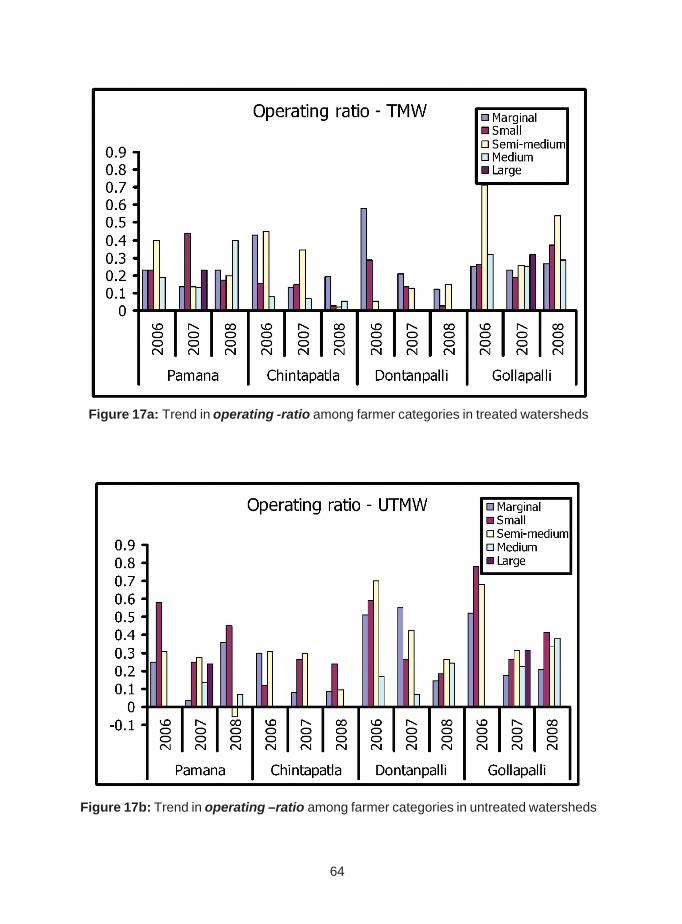
64
Figure 17a: Trend in operating -ratio among farmer categories in treated watersheds
Figure 17b: Trend in operating –ratio among farmer categories in untreated watersheds

65
� Gross -ratio is calculated as a ratio of total costs (cost of equipment, labour,
seed, fertilizer, depreciation on farm equipments, land revenue, interest on
borrowed capital etc.) from gross income. This ratio indicates input use-efficiency
while ensuring higher productivity or higher returns per unit of input utilized. It is
calculated as Cost A / Gross Income as indicated by Johl & Kapur (1992). In
case of Chintapatla TMW, gross-ratio among marginal and semi-medium farmers
was high and it was found to be higher in 2006 compared to 2008. The trend was
similar in UTMW although at a lower - level. In case of Dontanpalli, it was seen to
be higher among marginal farmers in TMW and semi-medium farmers in UTMW;
it fell in 2008 when compared to previous years. Gross-ratio was higher in TMW
in Gollapalli; it was found to be higher among semi-medium farmers. Comparison
across the villages indicated that It was higher among all categories of farmers in
TMW as indicated in Figure 18a & b.
Figure 18a: Trends in gross -ratio among farmer categories in treated watersheds
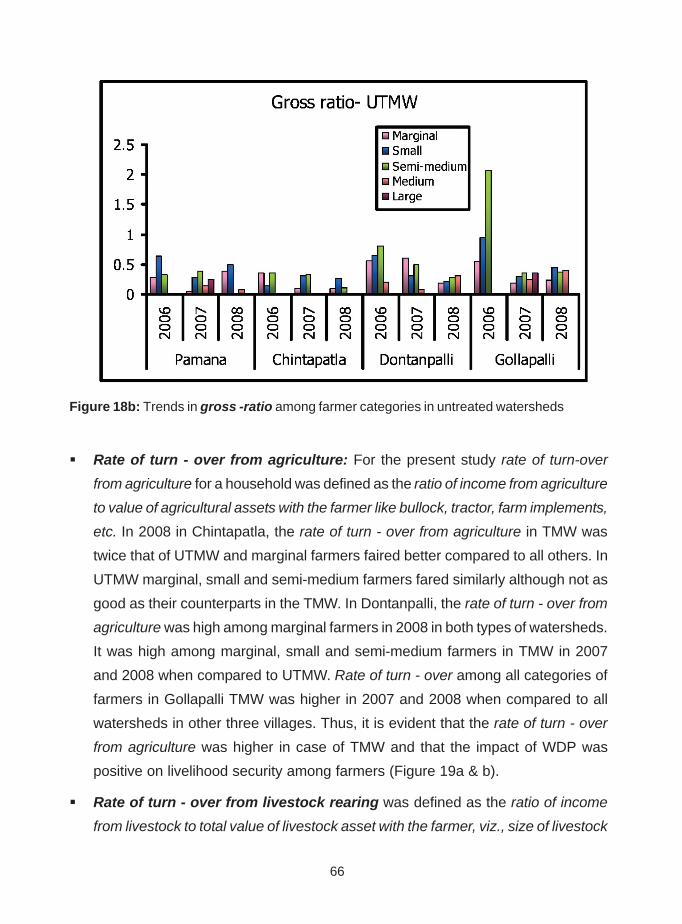
66
Figure 18b: Trends in gross -ratio among farmer categories in untreated watersheds
� Rate of turn - over from agriculture: For the present study rate of turn-over
from agriculture for a household was defined as the ratio of income from agriculture
to value of agricultural assets with the farmer like bullock, tractor, farm implements,
etc. In 2008 in Chintapatla, the rate of turn - over from agriculture in TMW was
twice that of UTMW and marginal farmers faired better compared to all others. In
UTMW marginal, small and semi-medium farmers fared similarly although not as
good as their counterparts in the TMW. In Dontanpalli, the rate of turn - over from
agriculture was high among marginal farmers in 2008 in both types of watersheds.
It was high among marginal, small and semi-medium farmers in TMW in 2007
and 2008 when compared to UTMW. Rate of turn - over among all categories of
farmers in Gollapalli TMW was higher in 2007 and 2008 when compared to all
watersheds in other three villages. Thus, it is evident that the rate of turn - over
from agriculture was higher in case of TMW and that the impact of WDP was
positive on livelihood security among farmers (Figure 19a & b).
� Rate of turn - over from livestock rearing was defined as the ratio of income
from livestock to total value of livestock asset with the farmer, viz., size of livestock

67
holding. During the study in 2008 it was seen that the rate of turn - over was
higher in case of TMW in Pamana and Chintapatla villages although the
contribution of income from livestock was lesser than that from agriculture. The
ratio was poor in TMW in Chintapatla in 2006 and 2007 except excluding the case
of marginal and medium farmers. On the other hand in UTMW the rate of turn -
over from livestock rearing was comparatively better. In Dontanpalli, small farmers
faired better in UTMW in 2008 although in TMW, marginal and semi-medium
farmers stood to gain more. The rate of turn - over was high among semi-medium
farmers in both types of watersheds in 2008 and higher in UTMW across all
categories of farmers in 2008. Evidently, positive impact of WDP on livestock
rearing as a source of assured income in the study area, has been limited (Figure
20a & b).
Figure 19a: Rate - of -turnover from agriculture among farmer categories in treated watersheds

68
Figure 19b: Rate - of -turnover from agriculture among farmer categories in untreated watersheds
Figure 20a: Trend in rate – of - turnover from livestock rearing among farmer categories intreated watersheds

69
Figure 20b: Trend in rate – of - turnover from livestock rearing among farmer categories inuntreated watersheds
� B: C ratio was found to be favourable amongst semi-medium and medium
categories of farmers owning 2 - 4 and 4 -10 ha of land respectively, in TMW
across the study area. The ratio ranged from 4.5 to 4.64. However, in case of
farmers from UTMW, the B: C ratio was found to be lower and generally same
among all categories of farmers (Figure 21a & b).
Figure 21a: B: C ratio among farmer categories in treated watersheds
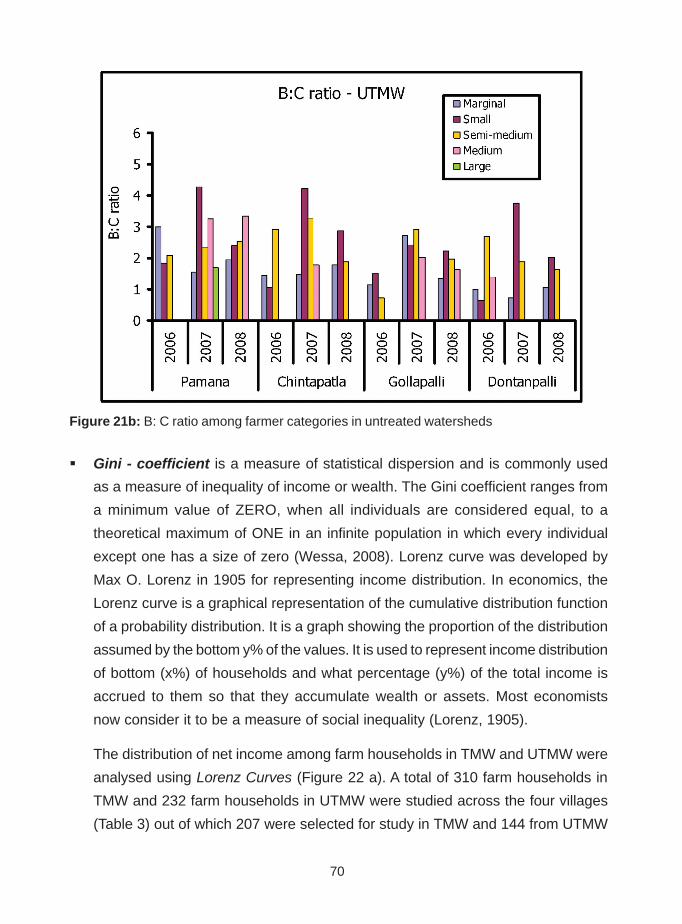
70
Figure 21b: B: C ratio among farmer categories in untreated watersheds
� Gini - coefficient is a measure of statistical dispersion and is commonly used
as a measure of inequality of income or wealth. The Gini coefficient ranges from
a minimum value of ZERO, when all individuals are considered equal, to a
theoretical maximum of ONE in an infinite population in which every individual
except one has a size of zero (Wessa, 2008). Lorenz curve was developed by
Max O. Lorenz in 1905 for representing income distribution. In economics, the
Lorenz curve is a graphical representation of the cumulative distribution function
of a probability distribution. It is a graph showing the proportion of the distribution
assumed by the bottom y% of the values. It is used to represent income distribution
of bottom (x%) of households and what percentage (y%) of the total income is
accrued to them so that they accumulate wealth or assets. Most economists
now consider it to be a measure of social inequality (Lorenz, 1905).
The distribution of net income among farm households in TMW and UTMW were
analysed using Lorenz Curves (Figure 22 a). A total of 310 farm households in
TMW and 232 farm households in UTMW were studied across the four villages
(Table 3) out of which 207 were selected for study in TMW and 144 from UTMW
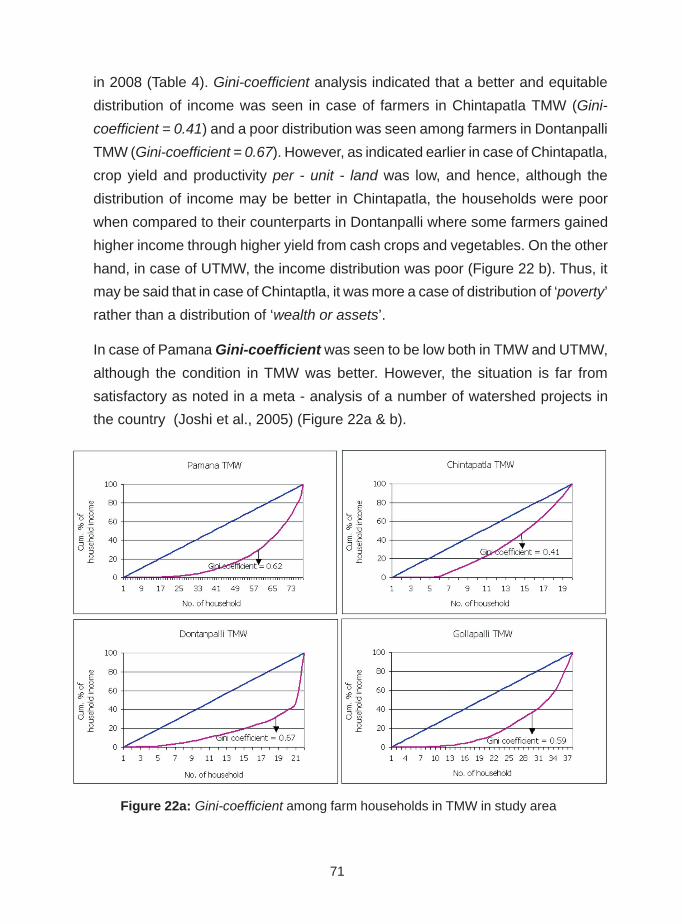
71
in 2008 (Table 4). Gini-coefficient analysis indicated that a better and equitable
distribution of income was seen in case of farmers in Chintapatla TMW (Gini-
coefficient = 0.41) and a poor distribution was seen among farmers in Dontanpalli
TMW (Gini-coefficient = 0.67). However, as indicated earlier in case of Chintapatla,
crop yield and productivity per - unit - land was low, and hence, although the
distribution of income may be better in Chintapatla, the households were poor
when compared to their counterparts in Dontanpalli where some farmers gained
higher income through higher yield from cash crops and vegetables. On the other
hand, in case of UTMW, the income distribution was poor (Figure 22 b). Thus, it
may be said that in case of Chintaptla, it was more a case of distribution of ‘poverty’
rather than a distribution of ‘wealth or assets’.
In case of Pamana Gini-coefficient was seen to be low both in TMW and UTMW,
although the condition in TMW was better. However, the situation is far from
satisfactory as noted in a meta - analysis of a number of watershed projects in
the country (Joshi et al., 2005) (Figure 22a & b).
Figure 22a: Gini-coefficient among farm households in TMW in study area
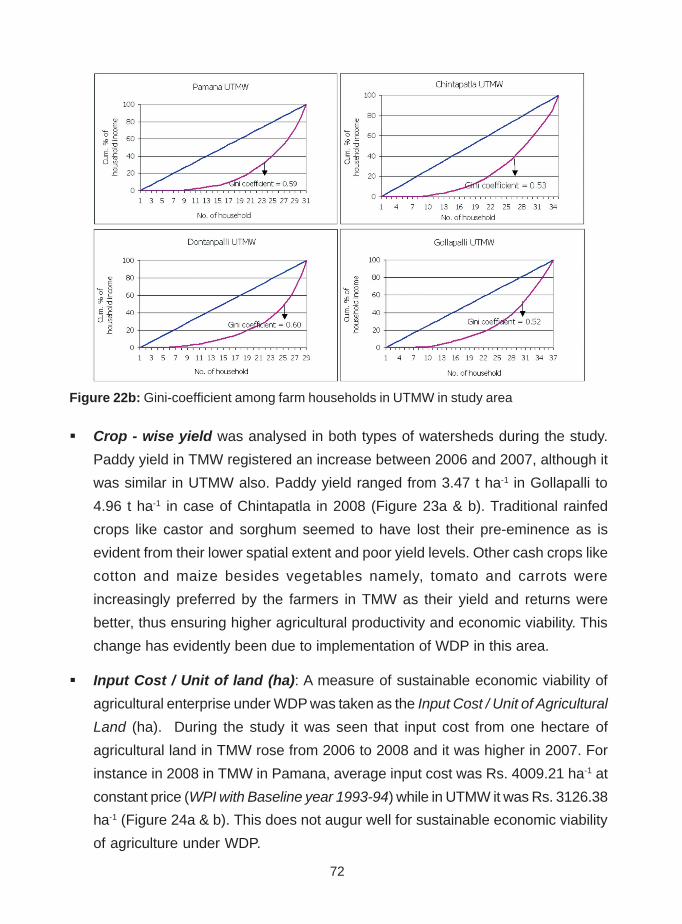
72
Figure 22b: Gini-coefficient among farm households in UTMW in study area
� Crop - wise yield was analysed in both types of watersheds during the study.
Paddy yield in TMW registered an increase between 2006 and 2007, although it
was similar in UTMW also. Paddy yield ranged from 3.47 t ha-1 in Gollapalli to
4.96 t ha-1 in case of Chintapatla in 2008 (Figure 23a & b). Traditional rainfed
crops like castor and sorghum seemed to have lost their pre-eminence as is
evident from their lower spatial extent and poor yield levels. Other cash crops like
cotton and maize besides vegetables namely, tomato and carrots were
increasingly preferred by the farmers in TMW as their yield and returns were
better, thus ensuring higher agricultural productivity and economic viability. This
change has evidently been due to implementation of WDP in this area.
� Input Cost / Unit of land (ha): A measure of sustainable economic viability of
agricultural enterprise under WDP was taken as the Input Cost / Unit of Agricultural
Land (ha). During the study it was seen that input cost from one hectare of
agricultural land in TMW rose from 2006 to 2008 and it was higher in 2007. For
instance in 2008 in TMW in Pamana, average input cost was Rs. 4009.21 ha-1 at
constant price (WPI with Baseline year 1993-94) while in UTMW it was Rs. 3126.38
ha-1 (Figure 24a & b). This does not augur well for sustainable economic viability
of agriculture under WDP.
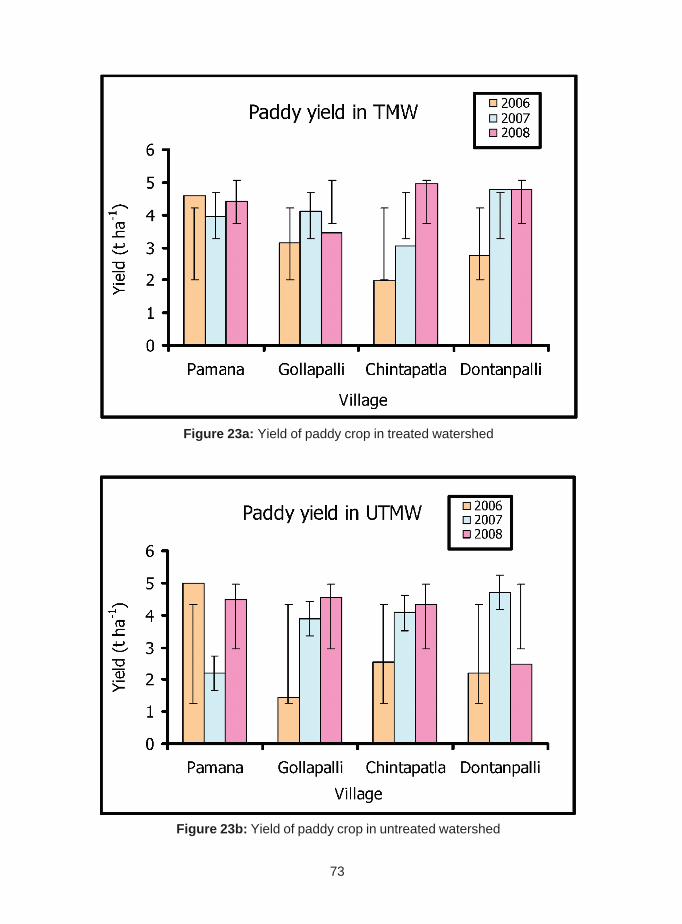
73
Figure 23a: Yield of paddy crop in treated watershed
Figure 23b: Yield of paddy crop in untreated watershed

74
Figure 24a: Input cost / Unit Land (Rs. ha-1) in TMW
Figure 24b: Input cost / Unit Land (Rs. ha-1) in UTMW
� Rice Equivalent Yield (t ha-1): As a measure to compare yield of various crops
during various years (2006-2008) at several locations within the study area, Rice
Equivalent Yield was calculated. Figure 25 indicates that yield level was marginally
better in case of TMW when compared to those in UTMW. For instance, in Pamana
TMW agricultural yield was better when compared to yield levels achieved in the
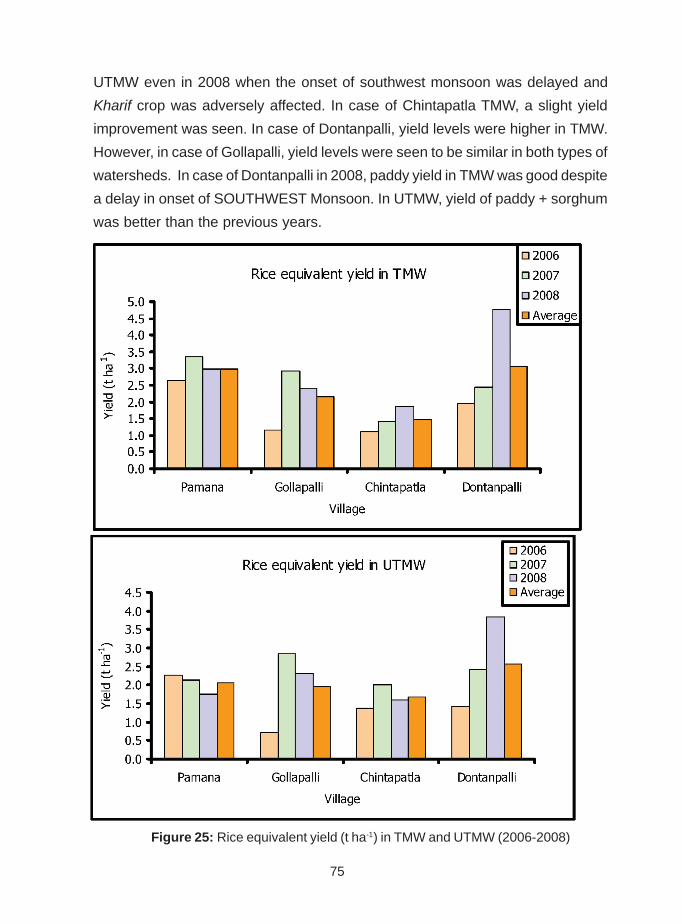
75
UTMW even in 2008 when the onset of southwest monsoon was delayed and
Kharif crop was adversely affected. In case of Chintapatla TMW, a slight yield
improvement was seen. In case of Dontanpalli, yield levels were higher in TMW.
However, in case of Gollapalli, yield levels were seen to be similar in both types of
watersheds. In case of Dontanpalli in 2008, paddy yield in TMW was good despite
a delay in onset of SOUTHWEST Monsoon. In UTMW, yield of paddy + sorghum
was better than the previous years.
Figure 25: Rice equivalent yield (t ha-1) in TMW and UTMW (2006-2008)

76
� Economic returns per unit of land: Economic returns accruing to a farmer is
an important indicator of livelihood security and economic viability. It was measured
as economic returns / hectare of agricultural land owned by him in rupee ha-1.
During the study it was seen that in TMW it was higher albeit only marginally. In
case of Dontanpalli TMW, it was estimated at Rs. 26400 ha-1 at current price
(2008) while in Pamana TMW it was calculated at Rs. 23778.99 ha-1. Economic
returns were seen to be least in case of Chintapatla TMW (Rs. 9872 ha-1). In
comparison, in the four UTMW, economic returns ranged from Rs. 6505.76 ha-1
in Gollapalli to a maximum of Rs. 21785 ha-1 in case of Chintapatla, where WDP
seemed to have fared poorly.
� Economic returns at current price were also analysed for various category of
farmers (Figure 26a & b). In Pamana, Dontanpalli and Gollapalli all categories of
farmers in TMW fared better than those in UTMW in the village. However in case
of Chintapatla all categories of farmers in UTMW fared better than their
counterparts in TMW. Analysis across all TMW indicated that marginal and medium
category of farmers in Pamana earned higher returns due to cultivation of vegetable
crops. On an average small and medium category farmers earned 23,800 rupees
from one ha of land in TMW. In Gollapalli TMW the economic returns from land
was similar across all categories of farmers.
� Analysis of trend of economic returns indicated an increase in TMW between
2006 and 2008, although the returns were higher in 2007. Highest intra-annual
increase during 2007 and 2008 in a TMW was noted in case of Dontanpalli (26%)
and least in case of Chintapatla (-59%). In UTMW, highest increase in economic
returns during 2008 was noted in Chintapatla (11%) and least in case of Pamana,
i.e., -23.7% (Figure 27a & b).
� Analysis of income among farmer category in 2008 indicated that NREGS had a
positive impact on WDP in Pamana, Gollapalli and Dontanpalli except Chintapatla.
Study indicated that 69% of all marginal, small and semi-medium farmers owing
< 4 ha of dryland were participating in NREGS scheme and earned 70% of their
livelihood from it.
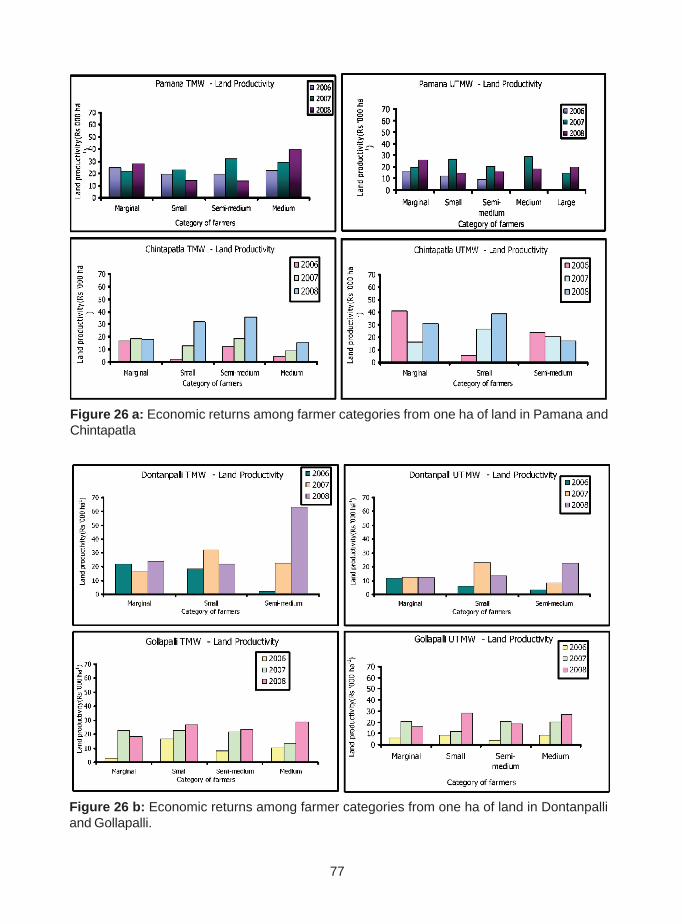
77
Figure 26 a: Economic returns among farmer categories from one ha of land in Pamana andChintapatla
Figure 26 b: Economic returns among farmer categories from one ha of land in Dontanpalliand Gollapalli.

78
Figure 27 (a): Economic returns per unit land in TMW (2006 – 2008)
Figure 27(b): Economic returns per unit land in UTMW (2006 – 2008)
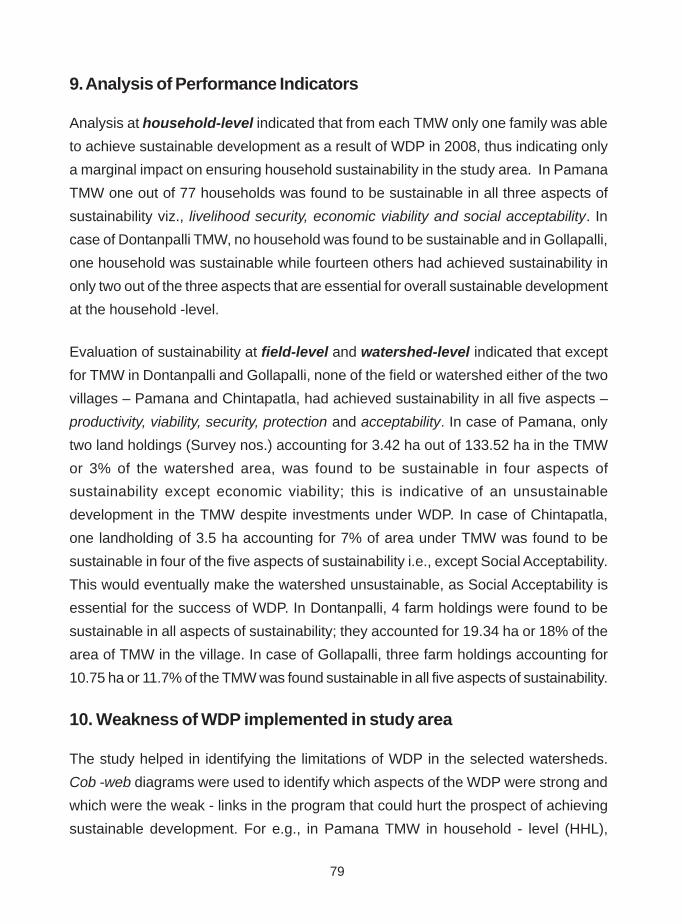
79
9. Analysis of Performance Indicators
Analysis at household-level indicated that from each TMW only one family was able
to achieve sustainable development as a result of WDP in 2008, thus indicating only
a marginal impact on ensuring household sustainability in the study area. In Pamana
TMW one out of 77 households was found to be sustainable in all three aspects of
sustainability viz., livelihood security, economic viability and social acceptability. In
case of Dontanpalli TMW, no household was found to be sustainable and in Gollapalli,
one household was sustainable while fourteen others had achieved sustainability in
only two out of the three aspects that are essential for overall sustainable development
at the household -level.
Evaluation of sustainability at field-level and watershed-level indicated that except
for TMW in Dontanpalli and Gollapalli, none of the field or watershed either of the two
villages – Pamana and Chintapatla, had achieved sustainability in all five aspects –
productivity, viability, security, protection and acceptability. In case of Pamana, only
two land holdings (Survey nos.) accounting for 3.42 ha out of 133.52 ha in the TMW
or 3% of the watershed area, was found to be sustainable in four aspects of
sustainability except economic viability; this is indicative of an unsustainable
development in the TMW despite investments under WDP. In case of Chintapatla,
one landholding of 3.5 ha accounting for 7% of area under TMW was found to be
sustainable in four of the five aspects of sustainability i.e., except Social Acceptability.
This would eventually make the watershed unsustainable, as Social Acceptability is
essential for the success of WDP. In Dontanpalli, 4 farm holdings were found to be
sustainable in all aspects of sustainability; they accounted for 19.34 ha or 18% of the
area of TMW in the village. In case of Gollapalli, three farm holdings accounting for
10.75 ha or 11.7% of the TMW was found sustainable in all five aspects of sustainability.
10. Weakness of WDP implemented in study area
The study helped in identifying the limitations of WDP in the selected watersheds.
Cob -web diagrams were used to identify which aspects of the WDP were strong and
which were the weak - links in the program that could hurt the prospect of achieving
sustainable development. For e.g., in Pamana TMW in household - level (HHL),

80
Livelihood Security was not achieved, as impact of WDP was marginal on account
of three critical indicators namely, size of land holding, gross agricultural income and
input cost (Figure 28). In case of Economic Viability, gains were low due to lack of
gainful employment options in villages leading to migration to urban centres, high
input cost, poor market acceptability and cost of transport to market. Social
acceptability was evidently not achieved in the TMW as farmers reported lack of
credit facility that resulted in a lack of enthusiasm among them for WDP and its’
tenets like increasing fodder production for self-reliance in livestock rearing and for
maintaining ground vegetative cover.
Figure 28: Evaluation of sustainability of livelihood securityat household-level in Pamana - 2008
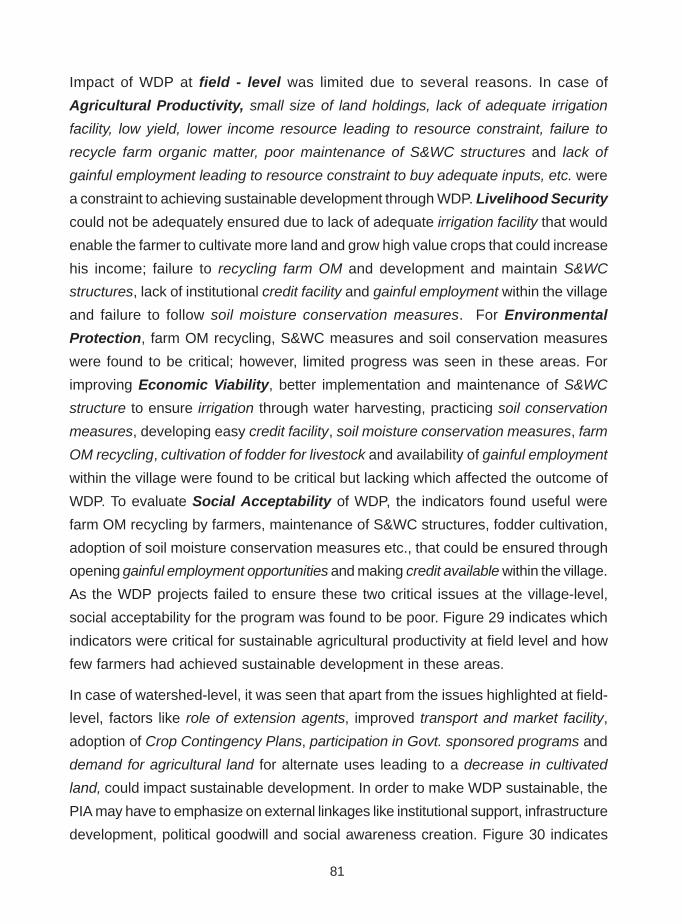
81
Impact of WDP at field - level was limited due to several reasons. In case of
Agricultural Productivity, small size of land holdings, lack of adequate irrigation
facility, low yield, lower income resource leading to resource constraint, failure to
recycle farm organic matter, poor maintenance of S&WC structures and lack of
gainful employment leading to resource constraint to buy adequate inputs, etc. were
a constraint to achieving sustainable development through WDP. Livelihood Security
could not be adequately ensured due to lack of adequate irrigation facility that would
enable the farmer to cultivate more land and grow high value crops that could increase
his income; failure to recycling farm OM and development and maintain S&WC
structures, lack of institutional credit facility and gainful employment within the village
and failure to follow soil moisture conservation measures. For Environmental
Protection, farm OM recycling, S&WC measures and soil conservation measures
were found to be critical; however, limited progress was seen in these areas. For
improving Economic Viability, better implementation and maintenance of S&WC
structure to ensure irrigation through water harvesting, practicing soil conservation
measures, developing easy credit facility, soil moisture conservation measures, farm
OM recycling, cultivation of fodder for livestock and availability of gainful employment
within the village were found to be critical but lacking which affected the outcome of
WDP. To evaluate Social Acceptability of WDP, the indicators found useful were
farm OM recycling by farmers, maintenance of S&WC structures, fodder cultivation,
adoption of soil moisture conservation measures etc., that could be ensured through
opening gainful employment opportunities and making credit available within the village.
As the WDP projects failed to ensure these two critical issues at the village-level,
social acceptability for the program was found to be poor. Figure 29 indicates which
indicators were critical for sustainable agricultural productivity at field level and how
few farmers had achieved sustainable development in these areas.
In case of watershed-level, it was seen that apart from the issues highlighted at field-
level, factors like role of extension agents, improved transport and market facility,
adoption of Crop Contingency Plans, participation in Govt. sponsored programs and
demand for agricultural land for alternate uses leading to a decrease in cultivated
land, could impact sustainable development. In order to make WDP sustainable, the
PIA may have to emphasize on external linkages like institutional support, infrastructure
development, political goodwill and social awareness creation. Figure 30 indicates

82
which indicators were critical for Environmental Protection on a sustainable basis
at watershed-level and how some farmers had fared in this area in the Pamana
village.
Figure 29: Evaluation of sustainability of Agriculture Productivity at field-level

83
Figure 30: Evaluation of sustainability of Environmental Protection at watershed-level
11. Identification of critical indicators for sustainable development atvarious spatial levels
Critical indicators at household-level (HH)
For assessing sustainability of Livelihood Security at household-level, the critical
indicators identified were gross agricultural income and total crop production. For
evaluation of Economic Viability, market accessibility and transport facility were seen
to be critical, while for Social Acceptability, participation in government funded poverty
reduction program and cultivation of fodder were found to be critical (Figure 31).
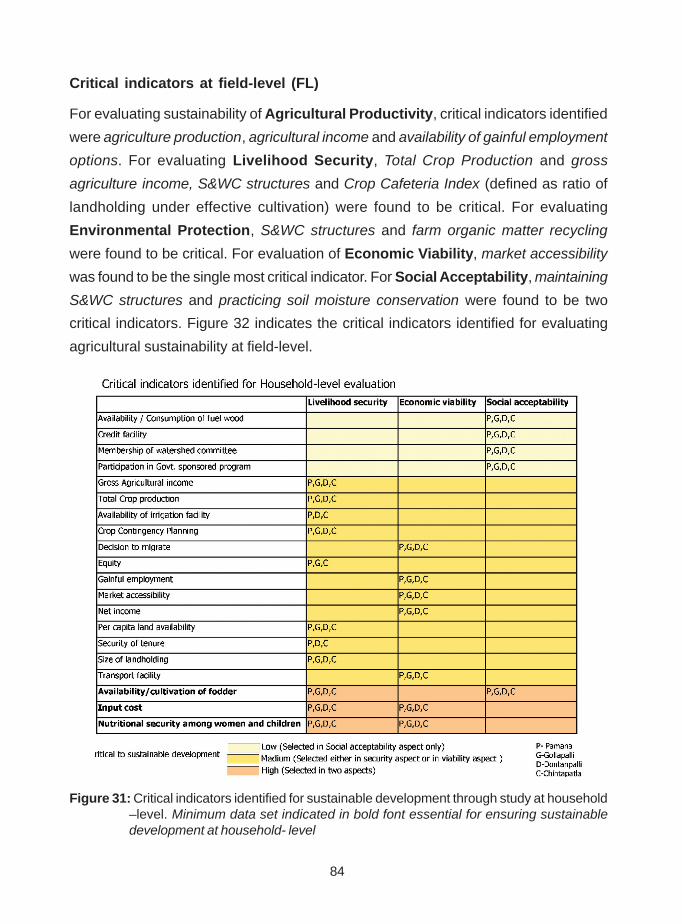
84
Critical indicators at field-level (FL)
For evaluating sustainability of Agricultural Productivity, critical indicators identified
were agriculture production, agricultural income and availability of gainful employment
options. For evaluating Livelihood Security, Total Crop Production and gross
agriculture income, S&WC structures and Crop Cafeteria Index (defined as ratio of
landholding under effective cultivation) were found to be critical. For evaluating
Environmental Protection, S&WC structures and farm organic matter recycling
were found to be critical. For evaluation of Economic Viability, market accessibility
was found to be the single most critical indicator. For Social Acceptability, maintaining
S&WC structures and practicing soil moisture conservation were found to be two
critical indicators. Figure 32 indicates the critical indicators identified for evaluating
agricultural sustainability at field-level.
Figure 31: Critical indicators identified for sustainable development through study at household–level. Minimum data set indicated in bold font essential for ensuring sustainabledevelopment at household- level

85
Figure 32: Critical indicators identified through study for field-level evaluation. Minimumdata set for undertaking sustainable development at field –level has been indicatedin bold font.
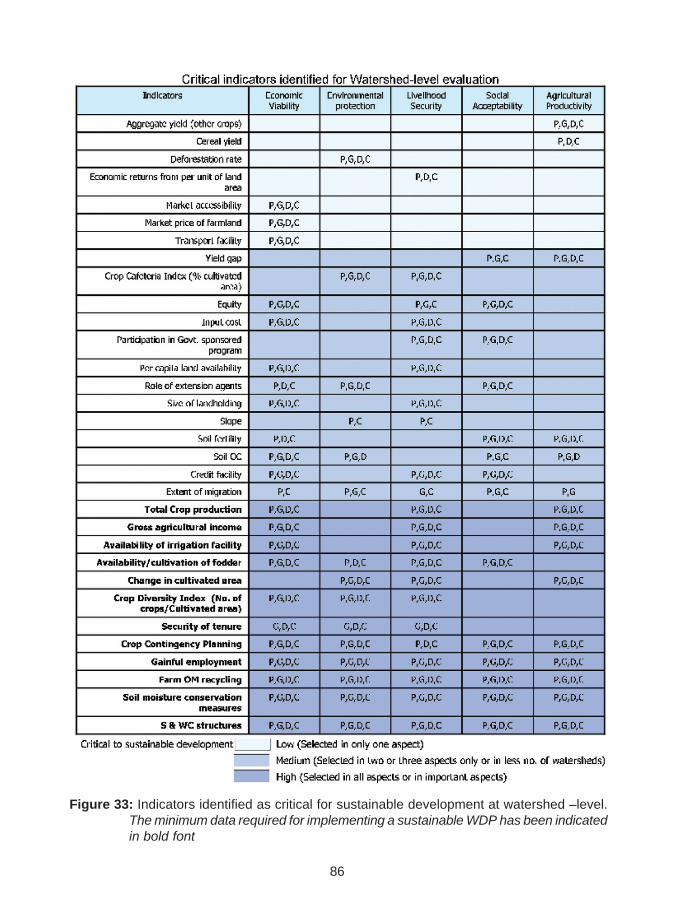
86
Figure 33: Indicators identified as critical for sustainable development at watershed –level.The minimum data required for implementing a sustainable WDP has been indicatedin bold font

87
Critical indicators at watershed-level (WL)
For evaluating sustainability of Agricultural Productivity, the critical indicators
identified were Total Crop Production and cereal yield. For evaluation of Livelihood
Security, availability of gainful employment options, efficacy of S&WC structures
and Crop Cafeteria Index were found to be critical. For evaluating Environmental
Protection, S&WC structures and farm organic matter recycling were found to be
critical. For evaluation of Economic Viability, S&WC structures, market accessibility
and transport facility were found to be critical indicators. For evaluating Social
Acceptability, maintaining S&WC structures and undertaking soil moisture
conservation measures were found to be critical indicators. Figure 33 indicates the
critical indicators identified for evaluating impact of WDP. It is obvious that indicators
found critical in case of farm-level studies were also found to be vital for sustainable
development at watershed-level.
12. Strengths and limitations of evaluation methodology
Undoubtedly, use of sustainability indicators to evaluate a rural development program
like the WDP, where multi-disciplinary evaluation procedures are required to be carried
out for an accurate assessment, this methodology holds great promise due to its
obvious strengths. The following are some of its strengths that would help in
undertaking corrective measures in the implemented projects while the findings of
this study can help in better implementation of future projects.
Use of Geo-informatics
As described in the publication, the methodology uses the tools of Geo-informatics in
tandem with conventional methods of study like soil analysis, socio-economic survey
and PRA. Use of GIS and Remote Sensing helped in delineation of watershed hierarchy
and nesting of catchments besides quantification of several indicators for the study.
Use of DGPS helped in geo-referencing sampling sites and greatly facilitated the
study.
Use of Sustainability Indicators
The indicators constructed for evaluation process can be monitored at any point of
time, i.e., during the project phase or the post-project period as the case may be. The

88
indicators are quantifiable, comparable and mappable which makes the evaluation
procedure relatively easy, objective and useful.
Evaluation provided specific information for undertaking corrective measures
The results of the evaluation process are specific and easily comprehendible and
useful for undertaking corrective measures as and when required. For instance, to
evaluate sustainability of agricultural productivity at field - level, the relevant indicators
constructed were – cereal yield, aggregate yield, availability of irrigation facility, Total
Crop Production, gross agriculture income, farm OM recycling, S&WC structure,
soil moisture conservation measures, gainful employment, Contingency Crop Planning
out of which 8 indicators namely Contingency Crop Planning, S&WC structure, gainful
employment, farm OM recycling, gross agriculture income, Total Crop Production,
availability of irrigation facility, soil moisture conservation measures, were found to
be critical indicators.
Use of multi-disciplinary input for evaluation
To evaluate the impact of soil health on agricultural productivity, the indicators used
were soil moisture conservation measures implemented, soil fertility status, soil OC
content and farm OM recycling practice. To measure efficacy of S&WC structures
developed under the WDP, rate of land degradation and deforestation expressed as
change in NDVI, was measured, as S&WC structures constructed under WDP were
meant for checking soil erosion in the first place. Wherever direct indicators were
unavailable for measuring such parameters, surrogate indicators were identified and
constructed for evaluation purpose.
Calibration of qualitative information for quantitative evaluation
Indicators that produced qualitative information only were numerically calibrated for
easy comprehension, comparison and removal of any ambiguity. For instance, to
study intensity and diversity of land use and impact of livestock management on
land, availability of fodder was taken as a criteria and an indicator was developed. As
the source of data for fodder availability was based on socio-economic survey through
which only qualitative data was generated, the data was converted into meaningful
score for undertaking analysis and integrating them with other sustainability indicators
that were measured quantitatively. A final scorecard was thus generated to evaluate
the impact of WDP on agricultural sustainability in the watershed.

89
Limitations of Evaluation Procedure
The study was carried out in understanding the impact of WDP in rainfed AESR 7.2
and provides a framework for quantifying the impact of such multidisciplinary
development projects. The limitations of evaluation procedure are as follows.
Problems associated with collection data in the field
At grass-root level, collection of primary data at household, field, watershed and village-
level posed its own problems. Even if process of delineation of micro-watersheds
using Survey of India topographical sheets and satellite data and subsequently up-
linking it to the National Hierarchy of Watersheds was a tedious but a manageable
task, use of village records for cadastral - level mapping and identifying the survey
numbers of land holdings and their respective owners was an intractable problem
that consumed a lot of project time. Most Survey Nos. or Land holdings had been
sub-divided beyond recognition and the village records called the Pahani are obsolete.
Also Govt. land has been redistributed among the landless, making the entire exercise
of identifying households and stakeholders extremely difficult. Hence several
assumptions had to be made before undertaking this study.
Necessity to generate baseline data
Lack of baseline data for post – WDP phase, was a daunting problem, as the PIA of
these projects had not used the GIS or GPS tools. To overcome this problem, satellite
data of previous years were procured from NRSC (ISRO) to generate baseline data.
For production, productivity and income – related data in the final year of project
implementation phase taken as base year for Post-facto evaluation, several
assumptions had to be made. For e.g., it was assumed that there would have been
at least a minimum of 20 % positive impact on the various parameters mentioned
earlier, over the average community performance during the final year of WDP. This
was used as the threshold level for comparing impact of WDP on various aspects
during the study period.
General nature of core-issues
Core issues indicated in the study, are actually the general problems facing rainfed
agriculture. However, the importance of these issues differs at different locations
necessitating the construction of different sets of relevant indicators for each location.
90
Large suite of Sustainability indicators
Large number of Sustainability Indicators was required to be sifted, which was possible
only through application of Bivariate Correlation technique and through PCA as it
enabled identification of the most significant and correlated indicators for evaluation
of WDP at various levels. Evaluation of sustainability of WDP was conducted
separately at various spatial levels – household, field and watershed - as each level
presents a different set of situation and requires a different set of activities or programs
to make it sustainable.
Despite the severe limitations faced at the time of investigation, that required several
assumptions to be made, the outcome of the study has not been compromised and
the results hold good. As mentioned earlier, a good geo-referenced database has
been established under this study, which could be used in future to revisit these
watersheds and undertake fresh evaluation without any loss of time. In fact the
database could be readily be used by other agencies aiming to initiate some work in
this region.
13. Strategy for achieving sustainable development through WDP
The study indicated that in order to achieve sustainable development through WDP,
the following strategies are required to be emphasised upon by the PIA. As mentioned
earlier in the methodology developed for undertaking assessment and evaluation of
WDP, a PCA analysis was performed on the critical indicators and their respective
contribution for achieving sustainable development was estimated. Weightage were
assigned to each of the indicators as indicated in Figure 34. For instance, at household
- level, it was found that there is a necessity to emphasise upon improving availability
of fodder through cultivation of fodder crop in order to ensure fodder availability for
livestock and the weightage for this indicator was estimated to be 50%. The second
critical strategy is the reduction of input cost that would ensure higher gross income
on one hand and a better B: C ratio that would improve the economic viability of the
agricultural production system followed by the farming household. A third critical
strategy would be improving the nutritional security in the household especially among
women and children that would ensure familial satisfaction and check out-migration
from the rural areas (Figure 34).

91
At field - level there is a necessity to lay emphasise on ensuring the adoption of
Contingency Crop Planning in the event of drought; improving farm OM recycling;
encouraging farmers to maintain the S&WC structures constructed during the WDP
implementation phase besides propagating large-scale use of improved soil moisture
conservation measures (Figures 32 & 33). In addition cultivation of fodder; improving
Crop Diversity; improving waters availability for irrigation; securing tenure; increasing
crop production and consequently improving gross income from agriculture are critical.
As rainfed agriculture keeps a farmer engaged only for a period of 4 to 6 months
annually, there is a need to develop other gainful employment opportunities within the
village or watershed itself like horticulture, silviculture and agro-forestry
(Venkateshwarlu, J., in Technical Manual on Watershed Management – I to V,1999)
including cultivation of medicinal and dye-yielding plants besides training the farm
households on backyard farming, post-processing techniques and other artisan skills.
Of these critical indicators maintaining S&WC measures and large-scale adoption of
soil moisture conservation measures contributed 35.2 % to sustainable development
at field level and 35.8 % at watershed level (Figure 34).
All the strategies identified as critical at field – level were also found to be critical for
the sustainable development at watershed – level, except for improving the extent of
cultivated area in case of watershed; at field-level, the active role of extension agents
for providing guidance to farmers, was found to be critical (Figure 34).
Thus, it is evident that WDP must be treated as one of the strategy for sustainable
development in rainfed agriculture as there is a great necessity to dovetail other
activities of agriculture and rural development like - KVK activities; banking and
infrastructure development and increasing the role of extension agents from the line
departments like agriculture and rural development. Some of these strategies may at
present, seem beyond the purview of the PIA, nonetheless they are critical for
sustainable development of rainfed agriculture through WDP.

92
Figure 34: Critical indicators and strategy for sustainable development throughWDP at various levels
14. Lessons learnt
Based on the work undertaken so far and the feedback obtained for this study, the
shortcomings of WDP implemented under earlier guidelines (MORD 2001, 2003;
MOA 2001) have been recognized and the critical indicators for achieving sustainable
development in rainfed agriculture identified. The apprehensions of being able to
undertake an objective evaluation of rural development project like WDP in India have
been laid to rest by the application of tools of Geo-informatics. The construction of a
suite of sustainability indicators to evaluate performance and state of WDP and its
impact on rainfed agriculture, is probably one of the most important contribution of
this study, to the body of literature on rainfed agriculture in India. The adaptation of the
concept of Five Pillars of Sustainable Development proposed by Smyth &
Dumanski (1993, 1995) FAO (1993, 1998), Gomez et al., (1996) and Swete Kelley &
Gomez (1998), to Indian context is a major step forward that would help in integrating
Indian studies on Best Practices for Land Management and Stakeholders Participation
for Combating Land Degradation and Desertification to the body of world literature on
Sustainable Land Management (WOCAT 2007a, 2007b; UNCCD 2008, 2009; CSFD
2009; FAO 2007).
93
One of the issue often raised in connection with the evaluation methodology, was the
multiplicity of sustainability indicators, not withstanding their requirement. In order to
overcome this handicap, two statistical techniques, Bivariate Correlation Technique
and PCA were used to identify critical indicators that were used to evaluate watershed
projects.
Another major advantage of the evaluation procedure was the use of Cob - web
diagrams to indicate the performance or state of an indicator at a certain spatial level
in a watershed. This helped in comparing the performance of WDP across various
locations besides helping in identification of weak -links in the program at various
sites. The study helped in highlighting the use of tools of Geo-informatics for
implementation and evaluation of WDP in addition to planning of the projects, as in
vogue.
The study brought out the lacunae in the existing system of land records, village-level
information and cadastral maps because of which much time and effort had to be
invested in the field to undertake corrective measures like use of DGPS to map land
parcels and conduct door-to-door survey to correct the existing village records.
The study helped in developing two questionnaires required for collecting relevant
information at watershed- and household – level after several attritions to satisfy data
requirements both in field and at the lab. These have been included in the appendices.
As the evaluation procedure required a large volume of geo-referenced data, it was
deemed fit to develop a Watershed Database adhering to the framework of NRDMS,
making it compatible to the national database. This is a significant contribution of this
study, as the geo-referenced database is readily available to other agencies;
academics and researchers who wish to undertake long-term sustainability studies
in future.
15. Conclusions
Although at present, WDP has been successful only to a limited extent in the study
area, its’ role in securing sustainable development in rainfed region is beyond doubt.
If improvements were to be made in the program as indicated in this study, sustainable
development could be possible at household-, field- and at watershed-level in the
rainfed regions. The critical issues as identified by the indicators at each spatial level
need to be strengthened first and foremost, so as to enable sustainable development

94
of rainfed agriculture. The new Common Guidelines of WDP - 2008 have taken
cognisance of several of the issues indicated in this study and hence the outcome of
the newer watershed projects may be better than those implemented earlier. The
evaluation methodology described in this publication could be readily used by the PIA
for development of a good plan for implementation and for undertaking corrective
measures to remove lacunae if any, besides funding and evaluating agencies, to
undertake an objective evaluation of on-going and concluded projects.
References
AIS & LUS, 1988: Watershed Atlas of India on 1:1 Million Scale, Dept. Agric. MOA.
Govt. of India, New Delhi, 64p.
AIS & LUS, 2002: Info-ailus, Dept. Agric. MOA. Govt. of India, New Delhi, 66p.
Amita Shah, Devlal, R., Joshi, H., Desai, J., Shenoy, R., 2004: Benchmark Survey for
Impact Assessment of Participatory Watershed Development Projects in
India. Report submitted by GIDR, Ahmedabad to Planning Commission,
Government of India, New Delhi, 117p.
Census of India, 2001: General Population Tables, Andhra Pradesh (Tables A-1 to A-
4), Directorate of Census Operations, Andhra Pradesh.
CG-WDP-2008: Guidelines for Watershed Development. Ministry of Rural
Development, Government of India, <http://dolr.nic.in/Guideline.html>
accessed on 8/13/2008, 29p.
CRIDA, 2006: Central Research Institute for Dryland Agriculture Annual report 2005 -
06, Hyderabad. 5p.
CRIDA , 2009 : Central Research Institute for Dryland Agriculture Annual report 2008
-09, Hyderabad. pp. 7-11.
CSFD, 2009: Desertification and land degradation trend indicators, French Scientific
Committee on Desertification, <www.csf-desertification.org>.
DoA - AP, 2008: Action Plan 2008-09. Dept. of Agriculture, Govt. of AP. Hyderabad.
pp.108-122.
DST, 2005: Natural Resources Data Management System, Dept. of Science and
Technology, Ministry of Science and Technology, Govt. of India, New Delhi,
<www.nrdms.gov.in> accessed on 3-12-08.
95
FAO, 1976: Framework for Land Evaluation. Soil bull 32, FAO, Rome.
FAO, 1993: FESLM - An International Framework for Evaluating Sustainable Land
Management. World soil resources, Report no.73, FAO, Rome.
FAO, 1998: Policy analysis for food and agricultural development- Basic data series
and their uses. Training Materials for Agricultural Planning. Pub.No.14(Eds),
Roger Norton, pp.29-32.
FAO, 2007: Land Degradation Assessment in Drylands (LADA), Food and Agriculture
Organization of the United Nations. <http://lada.virtualcentre.org>.
Gomez, A.A., Swete Kelly, D.E., Sayers, J. K. & K. J. Coughlan, 1996: Measuring
Sustainability of Agricultural Systems at the Farm–level. In: Methods for
Assessing Soil Quality, SSSA Special Publication No.49, Soil Science Society
of America, Madison, USA, pp. 401-409.
Govt. of India, 2008: Guidelines for Watershed Development. Ministry of Rural
Development, Government of India, <http://dolr.nic.in/Guideline.html>
accessed on 8/13/2008, 29p.
Hanumantha Rao, C.H., 1994: Guidelines for WDP, MORD, Govt. of India.
Hanumantha Rao, C.H., 2000: Watershed Development in India – Recent experience
and emerging issues. Economic & Political Weekly, Nov. 4, 2000, pp. 3943
– 3947.
IIPS, 2006: Census of India 2001, Population Projections for India and States 2001-
2026 (Revised December 2006), Office of the Registrar General & Census
Commissioner, India.
Johl, S.S., Kapur, T.R., 1992: Fundamentals of Farm Business Management Kalyani
Publishers Ludhiana New Delhi, 475p.
Joshi, P.K., Jha, A.K., Wani, S.P., Joshi, Laxmi. & R.L. Shiyani, 2005: Meta-analysis
to assess impact of watershed program and people’s participation.
Comprehensive Assessment Research Report 8 Colombo, Sri Lanka:
Comprehensive Assessment Secretariat.
Katyal, J.C., Kaushalya Ramachandran, Narayana Reddy, M., and C.A. Rama Rao,
1996: Indian Agriculture - Profile of land resources, crop performances and
prospects, in Regional Land Cover Changes, Sustainable Agriculture and
their Interactions with Global Change (with focus on South Asian countries)

96
Proc. of an International Workshop held in Chennai, India, 16 - 19 Dec. 1996
organized by COSTED - ICSU - UNESCO – IBN, pp. 16 - 34.
Katyal J.C., Kaushalya Ramachandran, Narayana Reddy, M., Mahipal and I. Ram
Mohan, 1997: Micro-watershed based development program for Nallavelli
village in RR District, AP in semi-arid part of India in Geographical Information
Systems and Remote Sensing Applications (ed.) I.V. Muralikrishna, Proc.
International Conference on Remote sensing and GIS (ICORG -97)
Hyderabad, 18 -21 June 1997, pp. 40 - 43.
Kaushalya Ramachandran, 2001: Using GIS for Watershed Development to augment
Water Harvesting in Semi-arid Telengana, AP, India. GIS India. Vol. 11(5): pp.
15-20.
Kaushalya Ramachandran, 2009: 4th Annual Report of ICAR National Fellow Scheme:
Assessment of sustainability of treated / developed watersheds in rainfed
agro-eco-sub-regions of peninsular India using GIS and Remote sensing.
Report submitted to ICAR in July 2009.
Kaushalya Ramachandran, Gayatri, M., Bhasker, V., Srinivas, G., Venkatravamma,
K., Srinivas, T. and M. Sankar Rao, 2007: Evaluating Livelihood Security of
Farm Household in Treated Watershed in Semi – arid Region. Indian J.
Dryland Agric. Res. & Dev., Vol. 22(1): pp.95-108.
Kaushalya Ramachandran, U.K. Mandal, K.L. Sharma, M. Gayatri, V. Baskar, K.
Venkatravamma and P. Kartik, 2009: Methodology for evaluating livelihood
security of farm households in treated watersheds. Indian Journal of Soil
Conservation, Vol. 37 (2): pp.151-163, 2009.
Kerr, J., Pangare, G., Pangare, V.L., 2002: Watershed Development Projects in India:
An Evaluation. Research Report 127, IFPRI, Washington D.C., USA. 90p.
Kerr, J., Sanghi, N.K., 1992: Indigenous Soil and Water Conservation in India’s Semi-
arid Tropics. Gatekeeper Series No. 34, Sustainable agriculture and rural
livelihood program, IIED, 28p.
Lorenz, M.O.,1905: Methods of measuring the concentration of walth. Publication of
the American Statistical Association 9: 209-219. Doi: 10.2307/2276207.
MOA, 2001: National Watershed Development Project for Rainfed Areas (NWDPRA),
Guidelines of NWDPRA. DAC, MOA, Govt. of India.

97
MORD, 2001: Guidelines for Watershed Development, 2001, DLR, MORD, Govt. of
India, (Revised – 2001), <http://dolr.nic.in/GuideWD.html> accessed on 8/
13/2008.23p.
MORD, 2003: Guidelines for Hariyali, 2003. Dept. of Land Resources. MORD, Govt.
of India, <mhtml:file://C:\DocumentsandSettings\Administrator\Desktop\
GUIDELINES FOR HARIYALI> accessed on 8/13/2008, 13p.
Oliver Springate – Baginski, Ratna Reddy, V., Gopinath Reddy, M. and S. Galab, 2004
: Watershed Development in AP – A Policy Review, Livelihood-Policy
Relationships in South Asia, Working Paper 5, CESS - Hyderabad or DFID -
R7604, 24p.
Parthasarathy, S., 2006: From Hariyali to Neeranchal. Report of the technical
committee on watershed program in India, submitted to DLR, MORD, Govt.
of India, New Delhi, 222p.
Planning Commission, 2001: Report of Working Group on Watershed Development,
Rainfed Farming and NRM for the Tenth FYP. 72p.
Planning Commission, 2005: Mid-term Appraisal of the 10th Five-year Plan (2002-
2007). Govt. of India, New Delhi, 236p.
Planning Commission, 2008a: Eleventh FYP (2007-2012); Inclusive Growth, Planning
Commission (Govt. of India), New Delhi. Vol. 1. 306p.
Planning Commission, 2008b: Eleventh FYP (2007-2012); Agriculture, Rural
Development, Industry, Services & Physical Infrastructure. Planning
Commission (Govt. of India), New Delhi. Vol. 3. 537p.
Ratna Reddy, V., 2003: Costs of Resource Degradation Externalities: A study of
Groundwater Depletion in AP. Working Paper no. 49, Centre for Economic
and Social Studies (CESS), Hyderabad, AP, India. 30p.
Ratna Reddy, V., Gopinath Reddy, M., Malla Reddy, Y.V., Sousson, J., 2004: Sustaining
Rural Livelihood in Fragile Environments. Resource endowments or policy
interventions? Working paper no.58, CESS, Hyderabad, India, 33p.
Samra, J.S., 1997: Status of Research on Watershed Management, CSWCRTI,
Dehradun. 44p.
Samra, J.S., and Hari Eswaran, 2000: Challenges in ecosystem management in a
watershed context in Asia. Lal, R. (ed) 2000. Integrated watershed

98
management in the global ecosystem. Soil & Water Conservation Society,
CRC Press. Washington DC. pp. 19 – 33.
Smyth, A.J., Dumanski, A., 1993: FESLM: An International Framework for Evaluating
Sustainable Land Management. World Soil Resources Report 73, FAO,
Rome, 74p.
Smyth, A.J., Dumanski, J., 1995: A framework for evaluating sustainable land
management. International board for research and management, In: Can,
J., Soil Science, 75p , pp. 401- 406.
Sreedevi, T.K, Shiferaw, B. and Wani S.P., 2004: Adarsha Watershed in Kothapally:
Understanding the Drivers of Higher Impact. Global Theme on Agro-
ecosystem Report no. 10, ICRISAT, Andhra Pradesh, India. pp. 1-19.
Swaminathan, M.S., 2001: Report of the working group on watershed development,
rainfed farming & Natural Resource Management for Tenth Five year Plan,
Govt. of India, Planning Commission, Sept. 2001. 72p.
Swaminathan, M.S. 2005: Mid-term Appraisal of Tenth Five year Plan (2002- 2007)
Govt. of India, Planning Commission, pp 1 – 21.
Swete Kelley, D.E, Gomez, A.A., 1998: Measuring erosion as a component of
sustainability. In: Soil Erosion at Multiple Scales. (Eds. Penning de Vries,
F.W.T., Agus, F. and Kerr, J). Cab International. pp. 133 – 148.
UNCCD, 2009: Benefits of sustainable land management, WOCAT (World Overview
of Conservation Approaches and Technologies), CDE (Centre for
Development and Environment), University of Berne. <www.unccd.int>.
UNCCD, 2008: The 10-year strategic plan and framework, to enhance the
implementation of the Convention, United Nations Convention to Combat
Desertification (UNCCD), Bonn, Germany.
Velayutham, M., Mandal, D.K., Mandal, C., Sehgal, J.L., 1999: Agro-ecological sub
regions of India for planning and development. National Bureau of Soil Survey
& Land Use Planning (NBSS&LUP) Publication no. 35, Nagpur, India, 372p.
Venkateswarlu, J., 1999: Arable Cropping Systems. Technical Manual on Watershed
Management - IV, MANAGE, Hyderabad, 72p.
Venkateswarlu, J., 1999: Non – Arable Farming Systems. Technical Manual on
Watershed Management - IV, MANAGE, Hyderabad, 115p.

99
Venkateswarlu, J., 1999: Non – Farming Systems & Watershed in retrospect. Technical
Manual on Watershed Management - V, MANAGE, Hyderabad, 64p.
Venkateswarlu, J., 1999: Resource Conservation. Technical Manual on
Watershedanagement - II, MANAGE, Hyderabad, 82p.
Venkateswarlu, J., 1999: Resource Inventorization. Technical Manual on Watershed
Management - I, MANAGE, Hyderabad, 56p.
Wessa, P., 2008: Free statistics, software, office for research development and
education, version 1.1.22-r6, <http://www.wessa.net/ >
WOCAT 2007a: Gudrun Schwilch, Felicitas Bchmann, Hanspeter Linger and Mark
Reed: Appraising and Selecting SLM Solutions, A methodology based on
stakeholder participation and global best practices, WOCAT.
<www.wocat.net>.
WOCAT 2007b: Liniger HP., Schwilch G., Gurtner M., Critchley W. and G. van Lynden:
Knowledge Management on SLM benefits, World Overview of Conservation
Approaches and Technologies (WOCAT). <www.wocat.net>.
World Bank, 2001: Learning from Experience in India’s Watersheds. Project Brief on
Rural Development.
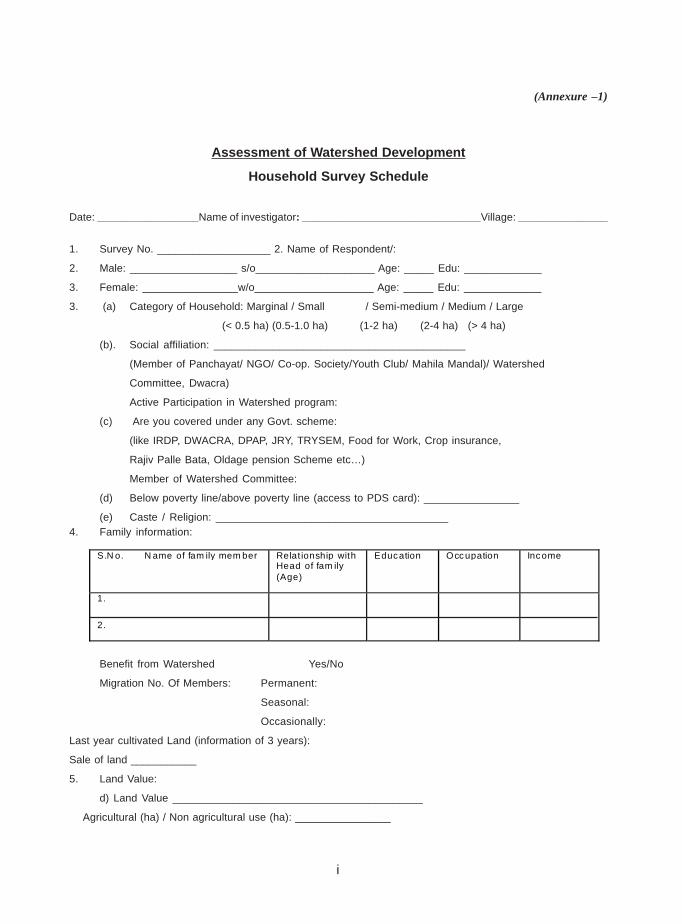
i
(Annexure –1)
Assessment of Watershed Development
Household Survey Schedule
Date: _________________Name of investigator: ______________________________Village: _______________
1. Survey No. ___________________ 2. Name of Respondent/:
2. Male: __________________ s/o____________________ Age: _____ Edu: _____________
3. Female: ________________w/o____________________ Age: _____ Edu: _____________
3. (a) Category of Household: Marginal / Small / Semi-medium / Medium / Large
(< 0.5 ha) (0.5-1.0 ha) (1-2 ha) (2-4 ha) (> 4 ha)
(b). Social affiliation: __________________________________________
(Member of Panchayat/ NGO/ Co-op. Society/Youth Club/ Mahila Mandal)/ Watershed
Committee, Dwacra)
Active Participation in Watershed program:
(c) Are you covered under any Govt. scheme:
(like IRDP, DWACRA, DPAP, JRY, TRYSEM, Food for Work, Crop insurance,
Rajiv Palle Bata, Oldage pension Scheme etc…)
Member of Watershed Committee:
(d) Below poverty line/above poverty line (access to PDS card): ________________
(e) Caste / Religion: _______________________________________4. Family information:
Benefit from Watershed Yes/No
Migration No. Of Members: Permanent:
Seasonal:
Occasionally:
Last year cultivated Land (information of 3 years):
Sale of land ___________
5. Land Value:
d) Land Value __________________________________________
Agricultural (ha) / Non agricultural use (ha): ________________
S.N o. N ame of fam ily mem ber Relat ionship with Head of fam ily (Age)
Education Occ upation Inc ome
1.
2.

ii
iii

iv

v
15. Problem soils and it’s effect on Land use pattern –
1. Soil erosion (% area)
2. (Seviarity – low / med / high)
3. (% of problem soil)
I. Are problem soils found in your area Yes/ No
If yes, give the causes for problem soilsa. Lack of drainage facilitiesb. Lack of adequate irrigation facilities / Water logged conditionc. Irrigating the crops with poor quality waterd. Formation of subsoil hardpan over long periods due to non-availability of suitable implements.e. Excess application of chemical fertilizers due to inadequate availability of organic manures.f. Monocroping practicesg. Other causes
Land soil type: Stony / Sandy / Hardpan / Slopy / Water-Logged
II Visual descriptors of soil in farm holding(1) Soil depth(2) Soil structure (arable, stony, hardpan, clods cracking)(3) Soil texture(4) Soil colour(5) Roots (presence)(6) Earth warm activityIII Soil moisture conservation practice followeda. Compartmental bunding (self / wsc)b. Contour bunding (self / wsc)c. Vegetative barrierd. Local practices (specify)e. CDf. Stony weirIV. Land management practicesa. Mulching (Ploughing)b. OM incorporationc. Vermi Compostd. FYMe. Agro forestryf. Based Fertilizerg. Broad bed and furrowh. Alley cropping i. Summer Ploughing
V. Suggestions for reducing the Fallows and Wastelands present in the village / watershed.
16. I. Opinion of the farmers about changes in the land use pattern in their respectiveFarms / village in the last 15 years and the reasons for it.
a. Introduction of agro forestry (Casuarinas, Neem, Acacia etc.)b. Cultivable waste area put under cultivation (Mention the crop)c. Changes in the area under miscellaneous tree cropsd. Changes from food crops to commercial crops and vice-versa (mention the crops)e. Increase / decrease in the area under fruit cropsf. Increase / decrease in the area under vegetable cropsg. Introduction of lower cropsh. Increase/ decrease in the area under fodder cropsi. Cultivation of export oriented crops (senns, Gherkin, Glariosa etc.)j. Cultivation of medicinal plants (Specify the crops)k. Increase / decrease in the area under pulses/ oil seedsl. Increase / decrease in the cultivated area others changes (specify)

i
(Annexure – 2)
General Information of the Village / Watershed Physical, Socio-economic survey proforma
1. Name of village :Block / Tahsil :District :State :Area of the village (ha) :Catchment of (Name the river/ distributory/ stream/nalla):
2. Date of Visit:
3. Name of the investigator:
4. Name of the farmers (group) interviewed & educational status:
5. Major Occupation of the Villagers:
a) Cultivator: Big (>4 ha): Medium (2-4 ha): Small (1-2 ha): Marginal (<ha):b) Non-agriculture: Artisan: Trader: Worker: Landless labour:c) Others (Specify)
6. Population in the Village: Total: Male: Female:
7. Cast-wise distribution of households
Caste No.of households No.of personsa) OCb) BCc) SCd) ST
8. Migrants from Village (No.)a) Regular basisb) Seasonal basis
9. Infrastructurea) Accessibility (distance from nearest public road)b) Road type (kacha/ pucca)c) Transport facility : Buses/ Trucks /Tempos/ Cartd) Electricity : No.of houses with electrical connection:e) Post office :f) Credit Resources :
ii
iii

iv

v
vi
Do you like to have a quantification of loss of water, soil & nutrient from your land ?Do you want any land treatment like bunding?Is mechanical bunding useful?If mechanical, what type is preferred?StoneEarthCombination of Stone and EarthDo you know live bunding?Is live bunding (vegetative barriers) useful?How? Do you think that best combination of mechanical and vegetative measures?Will be effective for control of erosion?Are you collecting runoff water and using it?Are you using waterways to divert water?Are gullies present in the waste landIf yes, do you need any control measures 1.
2.Existing and desired soil & water conservation measures:
Do you think growing trees and crops together will control erosion?Improve soil quality Yes/NoImprove income Yes/NoGenerate employment Yes/NoWill soil and moisture conservation practices useful for generallyExtra income-Soil improvement-Water quality improvement-Water quality improvement-Increase vegetation-Higher fertilizer use efficiency-For SWC measured do you know any external supplier from Govt.? Yes/NoIf Yes, for which types of measures or practices?If No, for which measures can you do on your own?
Who takes the decision for SWC measures Men/ Women/bothAre you willing to contribute a part of the cost of soil & water conservation measures? Yes/NoIf Yes, how much? 10%, 20%, 50%, moreIn what mode, labour/cast?Do you think that the degradation can be checked by intensive soil & water conservation measures(bothvegetative and mechanical)? Yes/NoIs the land production going up or down Up/ DownIf up, why?If down, why? And how to check it?Is there any Common Pool Resources (CPR) in the village : Yes/NoIf Yes:

vii
viii
c) Post-monsoon (October- November) AdequateNot adequated) Winter (December – February) AdequateNot adequateVegetative management:a) Do you need income generation through fodder raising and horticulture? Yes/No
a) Do you like to have intercrop with trees/bushes? Yes/No
a) Availability of fuel wood Adequate / Not adequate
Fallow and wasteland management ( for village):Do you have fallow and wasteland? Yes/NoReasons:Lack of resourcesFor creation of irrigation source/ water harvestingSalinity / acidity/alkalinity problemLivestock grazing (pastures)Recovering soil fertility for next cropLack of rainsLack of soil & moisture conservation activitiesIf yes, are you planning to make use of fallow and wasteland available with you? Yes/NoIf yes, how?Agriculture-food cropsAgriculture-commercial cropsHorticulture-fruit treesForestry-multiplication treesPasture-grass/legumesMedicinal and aromatic plantsAny otherIf not, why?Lack of resourcesNon-availability of planting materialInadequate market facilityNon-availability of labourAny other (specify)How are you going to protect & maintain the conservation measures Yes/NoIf yes, how?
Water resources managementWellType of well (1) No. of dug well (2) No. of bore well (3) No. of dug cum bore wellAt what depth water is available (m/ft) during
(1) Rainy season……… (2) Winter…………. (3)Summer season………….How many times the well dried up during the last 5 years : During which month:Under what circumstances the wells dry up:i) Water quality for agricultureGood/ Satisfactory/ Poorii) Water quality for drinking Good/ Satisfactory/ Pooriii) Constraints in water utilization/ useiv) Health hazardsmode of lifting water pumps/ othersif pump, what H.P……………time taken for employing the well (hrs)time taken for recuperating to the original level (hrs)
Option Existing Desired RemarksIn the fieldOn field boundaryOn field bundsIn waterwaysIn gulliesAny other
ix
Type of crops grown and area irrigated
Percolation tank/ pondNo. of percolation tankAverage dimensions of percolation tank Area ( in acres/ ha) ………. Average depth ( in m.)……………a) Depth of water retainedb) No. of days water is retainedc) No. of times it gets filled in a seasond) Is it getting silter up?e) Is it improving the ground water level?f) Does it dry fact after the filling by runoff?Dries in how many days:Are you using runoff water of percolation tank?Type of lifting/ irrigation:Type of crop grown:
Do you have water user association?If yes, provide details:
d) How to improve the water use?
Views and observation of the investigator and additional important information:
S.No. Crop Area(acres) Irrigation time(hrs)