evaluation of a caries risk assessment model in an adult ... · evaluation of a caries risk...
TRANSCRIPT
Evaluation of a Caries Risk Assessment Model in an Adult Population
by
Ferne Kraglund
A thesis submitted in conformity with the requirements for the degree of
Master of Science
Graduate Department of Dentistry (Dental Public Health)
University of Toronto
© Copyright by Ferne Kraglund (2009)
ii
Evaluation of a Caries Risk Assessment Model in an Adult Population
Ferne Kraglund Master of Science
Graduate Department of Dentistry (Dental Public Health) University of Toronto
2009 Abstract The purpose of this study was to evaluate a multifactorial caries risk assessment model by
comparing the risk factor scores with caries increment. Secondary data analysis included a chart
review of 434 dental patients in which basic caries risk scores, total risk score and caries
increment were collected. ANOVA and logistic regression were conducted to assess the
statistical significance of the difference between caries increments across categories of risk
factors. Mean tooth caries increments of the risk groups were 0.20±0.8 (low), 1.13±1.59
(moderate), 2.09±2.63 (high), which were statistically significant (p<0.001). Past and present
caries experience, carbohydrates, mucogingival bleeding index, and stimulated salivary flow
showed statistically significant associations with caries increment (p<0.05) but the total risk
score proved to be the most powerful predictor of future caries activity (p<0.001). The
multifactorial etiology of caries necessitates the use of a risk assessment model that includes
various factors that contribute to caries development.

iii
Acknowledgements I would like to express my sincere gratitude to a number of individuals who have contributed to the successful completion of this thesis. Firstly, I would like to thank my supervisor, Dr. Hardy Limeback, for his advice, encouragement, and mentorship. His humour and open door policy made the process one that was truly enjoyable. I would also like to thank Dr. David Locker and Dr. Laura Dempster for participating as supervisory committee members and providing valuable feedback and support. A special thank you must be given to Marika Banfi for helping me to learn the ins and outs of the dental software and for introducing me to various staff members; this reduced many nightmares during my data collection. I would like to thank my friends and the staff in the Department of Community Dentistry for making these last two years memorable- thank you for your listening ears and for making me laugh when I needed it most! This project would not have been possible without the love and support of my family and friends, both new and old. Most importantly, I need to thank my husband, James, for allowing me to uproot the family in order to pursue my dreams and goals. I am forever grateful for his unconditional support, his ability to keep me grounded, and for understanding the bigger picture. Lastly, I would like to thank my canine study buddy, Rigby, for providing snuggles and company during my study sessions.
iv
Table of Contents Abstract.................................................................................................................................. ii Acknowledgements................................................................................................................ iii Table of Contents................................................................................................................... iv List of Tables and Figures.......................................................................................................vi Literature Review...................................................................................................................1 Dental Caries.............................................................................................................. 1 Caries Distribution..................................................................................................... 2 Treatment of Dental Caries........................................................................................ 4 Modern Caries Management...................................................................................... 6 Caries Risk Assessment............................................................................................. 7 Risk Assessment Models........................................................................................... 10 Selection of Risk Assessment Instrument.................................................................. 13 Risk Factors............................................................................................................... 15 Streptococcus mutans and Lactobacillus....................................................... 16 Other Salivary Factors................................................................................... 18 Fluoride Exposure.......................................................................................... 19 Plaque............................................................................................................ 20 Fermentable Carbohydrates........................................................................... 21 Previous Caries Experience........................................................................... 23 Sociodemographic Indicators......................................................................... 23 Overall............................................................................................................25 Multifactorial Caries Risk Assessment Models......................................................... 26 Cariogram...................................................................................................... 27 ‘Caries Risk and Preventive Needs Assessment’ Instrument........................ 28 Statement of the Problem....................................................................................................... 30 Objectives.................................................................................................................. 30 Hypothesis................................................................................................................. 30 Methodology......................................................................................................................... 31 Study Design............................................................................................................. 31 Eligibility Criteria...................................................................................................... 31 Sample Size................................................................................................................ 31 Data Collection.......................................................................................................... 32 Data Analysis............................................................................................................. 34 Results.................................................................................................................................... 36 Discussion.............................................................................................................................. 44 Study Limitations....................................................................................................... 50

v
Research Implications................................................................................................ 51 Conclusion............................................................................................................................. 53 References.............................................................................................................................. 55 Appendix................................................................................................................................ 64

vi
LIST OF TABLES AND FIGURES Tables Table 1. Caries-related factors from the ‘Caries Risk and Preventive Needs Assessment’ form....................................................................................................................................... 33 Table 2. Caries risk frequencies, sample characteristics and mean caries increments ± standard deviation................................................................................................................. 36 Table 3. ANOVA analysis of various caries risk factors and ‘Total Risk Score’ versus mean caries increment............................................................................................................39 Table 4. Adjusted odds ratios (OR) for the various caries risk groups in the logistic regression model.................................................................................................................... 41 Table 5. Adjusted odds ratios (OR) for various factors when all independent variables except the ‘Total Risk Score’ were included in the logistic regression model...................... 42 Table 6. Comparison of sensitivity (Se), specificity (Sp), positive predictive (PPV) and negative predictive (NPV) values of the caries risk assessment model using two different cut-off points........................................................................................................... 43 Figure Figure 1. Caries incidence by risk classification as designated by the caries risk assessment form..................................................................................................................... 38

1
LITERATURE REVIEW Dental Caries Dental caries is a chronic, transmissible disease of multifactorial etiology. It has long been
accepted that there are a large number of factors involved in the process of caries development.
It is, however, the interaction of three principal factors: destructive microflora (plaque), host
susceptibility (teeth and saliva), and a substrate (cariogenic diet), as described by Keyes’ three-
circle diagram,1 that determine if the disease will occur.2 Demineralization of the tooth surface
results when the cariogenic biofilm exists in an oral environment that is more pathological than
protective.3 The specific manner in which etiological factors influence the disease process is
complex, including host and pathogen adaptations, and is not fully understood.4 A fourth factor,
time, was later incorporated into the diagram to account for the delay in the process of disease
development. Dental caries is a slowly-progressive disease; it is not the consequence of a
singular event but rather a sequel of processes occurring over a period of time.5
One of the current approaches to better understanding dental caries is the consideration of its
microbiological origin. Bacterial biofilms are ubiquitous in nature and have been found to be
involved in a wide variety of microbial infections in the body, including the formation of dental
plaque. A biofilm is a structured community of microorganisms encapsulated within a self-
developed polymeric matrix that adheres to a living or inert surface.6 It is a sophisticated
ecosystem with its own infrastructure, including metabolic and waste channels, and mechanisms
in which bacteria may share genetic material and communicate with one another.7

2
When the oral environment favours these bacteria, they shift from normal healthy microflora to
the acidogenic (acid-forming) and acidoduric (tolerate living in acidic environments)
microorganisms that are associated with dental caries. Bacteria in biofilms, such as dental
plaque, are better able to survive and exhibit stronger resistance to various environmental factors
as they are 1000 times more resistant to antibodies, antibiotics, and antimicrobial products.
These attributes lead to persistent bacterial infections that will undoubtedly represent a new
challenge in the treatment of dental caries.7
Caries Distribution
The prevalence of dental caries among children and adolescents living in industrialized nations
declined in the 1970’s and 1980’s.8,9 It was suggested by most experts that regular exposure to
fluoride was the most significant contribution to this decline in caries.10-12 The decline has since
stabilized in many countries; however, in some areas, there are reports that the prevalence of
caries is again on the rise.13 It was reported in Oral Health in America: A Report of the Surgeon
General that dental caries is the single most common chronic disease of childhood, with a
prevalence rate five times greater than that of asthma.14 Due to the universal nature of this
disease, management of dental caries, typically in the form of operative procedures, remains the
most routine practice in the dental office.15-17
The diminished pervasiveness and severity of dental caries in many developed countries, along
with an increasing number of dentate elderly retaining their teeth longer, have brought about a
noticeably skewed distribution of disease in the population.18,19 From the North Carolina risk
assessment studies, it was shown that the pattern of dental caries has changed such that the high
3
caries minority is suffering very different patterns of caries prevalence, risk, and activity than the
low caries majority that have no or few cavitated lesions.20-22 It has been estimated that
approximately 60-75% of the caries occurs in only 20-25% of the population. In addition,
findings from the National Preventive Dentistry Demonstration Program showed that most
severe disease was limited to only 5% of the children.23
With the earlier high prevalence of dental caries observed in western civilization between the
1950’s and 1980’s, most of society was categorized as having the disease.24 This led health
professionals to utilize a population-based approach in which its goal was to alter the distribution
of disease by controlling the underlying determinants of dental caries in the entire population.25-
27 Fluoridation of public water systems is an example of a population-based strategy that
provides preventive treatment for all members of society. Whereas water fluoridation has in the
past been shown to be a successful and cost-effective population-wide strategy,28 the
appropriateness of providing costly preventive measures (e.g. sealants) to whole populations has
been questioned.11
Consequently, the low prevalence and skewed distribution of disease have led some investigators
to argue for a high risk targeted approach to diagnosing and treating dental caries.23,29 Using the
high risk approach, the goal would be to identify highly susceptible persons and to use
efficacious individual-based preventive measures to diminish their risk.24 This method operates
to decrease the risk of a small number of highly vulnerable individuals to include them into the
majority of the population with no or few caries.22,30 In order to use a high risk approach, one
must have accurate and feasible measures for identifying those individuals that are exceedingly
4
prone to dental caries.31 A caries risk assessment may aid in the identification of etiological
factors so that suitable preventive treatment may be rendered for that particular individual.26
There is still much debate in the scientific community as to the appropriate way to approach the
diagnosis and treatment of dental caries. Batchelor and Sheiham have argued in favour of a
population approach as opposed to a high risk approach because the latter would fail to deal with
the majority of new carious lesions in the population.32 On the contrary, Axelsson et al. have
had much success using targeted approaches for prevention of dental diseases.33,34 Utilizing a
high risk strategy does not imply that the general population does not require preventive dental
care, but rather that the intensity of treatment should vary depending on the need. A joint
approach for caries prevention in which both strategies are used may maximize the advantages of
both methods by addressing those most in need, while acquiring smaller, but still significant,
changes in the population’s distribution of disease.19
Treatment of Dental Caries
Historically, it was thought that dental caries was a progressive disease that inevitably led to the
eventual loss of a tooth unless a dentist intervened surgically. The conventional method of
dealing with dental decay involved detection of the carious lesions, followed by drilling and
filling.9,15,35 Although treating dental caries by restorative means will offer relief from pain and
restore function to the tooth, it will likely not prevent the lifelong continuation of the disease
process and will undoubtedly allow recurrent decay necessitating further surgical
interventions.7,36 Restoration of the carious lesions removes areas of cariogenic microorganisms
but it does not alter the risk level of the patient. Research demonstrates that placing dental

5
restorations contributes very little to the management of the caries disease process as there is no
measurable effect on the cariogenic bacterial load in the mouth once restorative procedures are
completed.37-39
A great deal of dental work is focused on treating the symptoms of this bacterial infection rather
than focusing on the causative factors. Restorations, by themselves, are incapable of modifying
the etiological factors of dental caries in order to eradicate caries-forming bacteria.19,40 When
health professionals are dealing with other systemic diseases, measures to eradicate the causes of
the disease are utilized, such as immunizations and antibiotics. Dental professionals need to
consider dental caries in the same manner and treat the disease rather than just the clinical
manifestations of the disease. It is believed that our current understanding of the caries disease
process is strong enough to accomplish this.41
Numerous dental researchers have advocated following the medical model for dental caries.
This approach entails regarding dental caries as a disease process, to manage its etiological
factors, and to employ prevention strategies rather than simply repairing the damage caused by
the disease.42-44 Medical management of dental caries is not only possible, but it has been shown
to provide superior outcomes as compared to surgical intervention alone. It was demonstrated
that patients treated via a caries risk assessment and medical model approach had developed
significantly fewer new carious lesions than patients being treated solely with the conventional
surgical approach (i.e. drill and fill).7

6
Modern Caries Management
Modern caries management is based on evidence-based dentistry, with a more intense focus on
prevention. Comprehensive caries control involves focusing on the whole patient to manage the
individual risk factors of the patient to promote and maintain optimum oral health.3 Preventive
dentistry is thus characterized by risk factor management in which we hope to maximize the
protective factors while minimizing the pathological factors.40
Modern management of dental caries includes the following sequence of treatment:
1. Detection of carious lesions at an earlier stage (incipiencies, non cavitated lesions);
2. Diagnosis of the caries disease process;
3. Identification of the patient’s caries risk factors;
4. Treatment planning, including tooth restoration, risk factor modification/elimination, arresting
active lesions, and preventing future lesions; and
5. Monitoring the caries risk status of the patient.9,45
Measures of caries control involve identifying the disease process and the risk factors; this is
achieved by first performing a caries risk assessment for the patient in order to identify his/her
risk factors for caries development. Once the risk factors have been detected, the dental
professional provides preventive measures aimed at remineralizing incipient lesions, suppressing
microbial levels, and preventing the appearance of new lesions. The clinician uses a variety of
behavioural, chemical, and minimally-invasive surgical techniques to bring back a positive
balance between the pathologic and protective factors that favour a healthy oral environment.40,45
Caries control measures may include restorative treatment (with or without fluoride releasing
7
materials), sealants, oral hygiene instruction, patient education, dietary analysis and
modification, fluoride treatments (e.g. gel, varnish), xylitol chewing gum, and antimicrobial
therapies (e.g. chlorhexidine gluconate).45
With a better understanding of the caries process, there comes a change in operative dentistry
philosophy. Although there is considerable variability between dentists, there is more emphasis
on preventive dentistry than ever before.35 The shift in emphasis appears to be occurring in
dental schools in which curriculum and practical skills are focused more on caries risk
assessment, modern management of the caries disease (including minimally invasive dentistry),
and delayed restoration of teeth until the surfaces have become cavitated (or are likely to become
cavitated). Restorations are only placed after all practical efforts of prevention and
remineralization have been attempted.45,46
Caries Risk Assessment
Caries risk assessment (CRA) is the process of collecting data regarding various factors (e.g.
bacterial level) and indicators (e.g. previous caries experience) to predict caries activity in the
immediate future.47
Formal CRA has been described as a four-step process:
1. Identification of measurable risk factors;
2. Development of a multifactorial tool;
3. Risk assessment to determine a patient’s risk profile; and
4. Application of preventive measures tailored to the risk profile.24

8
For the past thirty years, researchers have focused on developing an instrument that is easy to
administer, simple, quick and accurate. The risk assessment tool should estimate caries risk,
identify the primary etiological factors, provide an inventory of the patient’s current preventive
practices, and serve as a guide for selecting specialized preventive care tailored to that
individual’s needs.2,48 It is likely that most dentists incorporate some informal CRA into their
practice based on their overall impression of the patient and previous caries experience.9
Research has shown that experienced clinicians are often able to assess caries risk very quickly
and accurately.49,50 Although determination of the overall risk level may be relatively easy,
pinpointing the specific factors associated with the disease process often proves to be more
difficult. For that reason, it is worthwhile for dental practitioners to conduct a formal CRA to
determine the precise factors involved in the patient’s disease progression.12
Performing a CRA assists practitioners to provide their patients appropriate levels of preventive
care and to eliminate wasteful use of resources.51,52 By matching the person’s risk level to
his/her proposed preventive therapy, the profession stands a greater chance of positively
impacting their patients’ oral health. If dental professionals were able to identify, in advance,
individuals at the greatest risk of developing dental caries, the cost of caries prevention
procedures could be markedly reduced and their efficiency greatly increased.22
Dental caries management by formal risk assessment represents a significant change in the
mindset of the profession and should be incorporated into daily practice as dictated by practices
of evidence-based standards of care. CRA should be routinely built into preliminary and recall
examinations as the findings help to guide the patient’s designated course of treatment. This is
9
especially important before extensive prosthodontic, restorative, and orthodontic treatment is
undertaken to ensure a favourable prognosis.5,37
CRA may be valuable in the clinical management of caries by helping dental clinicians to:
1. Categorize the level of the patient’s risk of developing caries to control the intensity of
treatment rendered.9,53
2. Pinpoint main etiological factors that contribute to the development of decay and thus
determine appropriate form of therapy.9,36
3. Assist in restorative treatment decisions (e.g. choice of restorative material).9,53
4. Improve prognosis of planned therapeutic care.9,54
5. Provide information on what additional diagnostic tests and screening are required.9,53,54
6. Educate and motivate patients to improve and maintain optimum oral health.9,12,37
7. Guide timing of subsequent recall appointments.12,53
CRA tools screen people based on risk factors and predictors and classify patients into one of
three risk categories- low, moderate, or high.9,54,55 Ordinarily, if new caries have developed
since the last examination, the patient is categorized as either moderate or high risk depending on
the interval since the last examination, and the number and severity of carious lesions. If,
however, the patient is caries-free since the last examination, his/her risk level would be
designated as low or moderate risk depending on his/her oral hygiene status, fluoride exposure,
and microbiological count.2

10
Reaching a consensus on the moderate risk group represents the greatest diagnostic challenge. It
can be rather simple to identify low risk, low caries and high risk, high caries patients. However,
it is much more complicated to recognize moderate risk individuals that may have exhibited little
or no disease for long periods of time followed by a sudden development of carious lesions. It is
for these patients, along with people who are at risk without any apparent signs or symptoms of
disease, that benefit the most from identification from CRA.36,37
Although dental caries has long been established to be a disease of multifactorial etiology, many
of the traditional caries prediction models have focused on individual factors associated with
high caries activity.23 More recently, the multifactorial etiology of caries points in the direction
of constructing a more promising risk assessment model that includes the various factors that
contribute to the development of caries as no single test can simultaneously measure the three
principal components of dental caries: host resistance, cariogenecity of the diet, and microbial
pathogens.2,26,56
Risk Assessment Models
Two types of variables can be used in the development of multivariable caries risk models: risk
factors and risk indicators or sometimes called etiologic and non-etiologic factors, respectively.52
A risk factor is an environmental, behavioural, biologic or lifestyle exposure or characteristic
that increases the probability of a disease occurring.27,57 They are part of the causal chain of
disease development because they satisfy the conditions of causality, such as strength of
association, temporal relationship, consistency of association, dose-response relationship, and

11
biological plausibility.4,58 Collection of information regarding true risk factors, such as
Streptococcus mutans, during risk assessment may help clinicians plan preventive therapy.52
A risk predictor, on the other hand, is normally a biologic marker that is indicative of the disease
process, but is not thought to be etiological for that disease. It is often used synonymously with
risk marker in the literature.57,59 Some risk indicators for caries, such a previous caries
experience, can be powerful predictors for future lesion development without being a direct
cause of the disease but offer little direction in prescribing preventive measures.52 Risk factors
and indicators are most commonly pathological in nature (i.e. associated with disease
occurrence); however, they may also be protective if they decrease an individual’s probability of
developing the disease (e.g. fluoride exposure).54
There are two frameworks that can be used for the development of CRA instruments: the risk
model and the prediction model. The risk model, or sometimes called the etiologic model, is
employed when you want to identify the risk factors for the disease to implement the most
effective prevention and treatment interventions. It contains only true risk factors and is
typically simple to use, but it is not intended to predict future caries risk. Because of its
simplicity and stability across different subgroups of the population, it is often used for screening
in public health domains.27,59
In contrast, a prediction model uses both risk factors and risk predictors to maximize its ability to
identify low and high risk individuals (i.e. maximize sensitivity and specificity). While risk
predictors (e.g. baseline caries) will not influence the incidence of disease, they can be strong

12
predictors that are inexpensively and easily obtained. Risk factors (e.g. Streptococcus mutans
counts) are often more costly to measure; however, they tend to be more reliable in caries
prediction.27,59
Often investigators want to use a combination risk and prediction model that encompasses both
risk factors and risk indicators. The variables directly involved in the caries process either as a
protective or risk factor include, but are not limited to, specific microorganisms, dental plaque,
type and frequency of carbohydrates and sugars in the diet, and fluoride exposure. Conversely,
risk indicators, such as previous dental experience, are often included in CRA tools as they are
indirectly related to the occurrence of dental caries without participating in the actual
development of carious lesions.26,27 There are some CRA instruments that support both types of
models. The Cariogram60 and the CRA form developed at the University of Toronto55 do just
that; they act as prediction models in that they can identify those who are high risk and they are
also risk models because they can identify the risk factors involved in order to facilitate
appropriate intervention planning.
Bratthall and Hänsel Petersson conducted an internet-based search for risk models. Although
they found numerous reports dealing with caries prediction-based models using one or a few risk
factors, there have been few attempts made in cariology to construct any practical and
comprehensive risk assessment instruments.61 It was concluded at the 2001 National Institutes of
Health conference that “caries is an etiologically complex disease process. It is likely that
numerous microbial, genetic, immunological, behavioural, and environmental contributors to
risk are at play in determining the occurrence and severity of clinical disease. Assessment tools

13
based on a single risk indicator are therefore unlikely to accurately discriminate between those at
high and low risk. Multiple indicators combined on an appropriate scale and accounting for
possible interactions, will certainly be required”.62 Caries risk analyses using a combination of
variables have shown superior results than single factors.23,59,63
Selection of Risk Assessment Instrument
The underlying principle of risk assessments is that individuals with elevated levels of risk
factors will receive more aggressive preventive interventions. Because of this, examiners must
be cautious in how they categorize patients in the various risk levels. One must decide at what
stage a risk factor changes from low to moderate to high risk categorization.54 This can prove to
be a difficult task as many etiological factors do not have a clear demarcation between absence
and presence, but normally range from excellent to poor (e.g. oral hygiene) or from low to high
(e.g. Lactobacillus counts).
Regrettably, no perfect risk factors are available for caries risk assessment; clinicians must be
willing to accept a certain proportion of errors in the prediction of future caries activity. This
remains true for medical conditions as well. For example, Hausen used data from the Kuopio
Ischaemic Heart Disease Risk Factor Study to construct a logistic risk function. He discovered
from the Receiver Operating Characteristic (ROC) curves, a summary of the predictive power of
a multiple level risk factor, that the individual risk assessments of acute myocardial infarction
and dental caries are equally inaccurate.31

14
In creating a CRA tool, a trade-off between sensitivity (percentage of truly diseased persons who
test positively) and specificity (percentage of persons without the disease who test negatively)
must be made.64 In doing so, a balance is struck between the number of false positives (i.e.
patients assumed to be high risk but do not develop caries) and false negatives (i.e. patients
assumed to be low risk but develop caries).31,54 It is imperative that the values of sensitivity and
specificity remain high to ensure that a patient labelled as high risk truly has the disease and the
threat of identifying low risk individuals as diseased should be minimal.5
Because it is impractical to believe that a diagnostic test would have sensitivity (Se) and
specificity (Sp) values of 100%, different criteria and cut-off points have been established by
researchers investigating caries risk. Wilson and Ashley suggested that Se and Sp values each be
set at 80% to be considered an acceptable test for caries risk.65 Alternatively, it has been
recommended by Fleiss and Kingman that the combined Se and Sp of a risk model should be at
least 160%, which has become the gold standard amongst many researchers.31,53,66
Unfortunately, this benchmark value has only been achieved by a small number of caries
prediction instruments.20,67,68
Caries risk prediction remains an inexact science despite the sizeable amount of research devoted
to the topic. Examiners must appreciate that a certain proportion of errors will be made and risk
misclassification may result in providing inappropriate management, including elements of over-
and undertreatment.19 When considering the cut-off points of Se and Sp and the trade-off
between them, one must weigh the consequences of having too many false positives or false
negatives.31

15
If the CRA tool is to be used at the public health level for mass screenings, it may be
advantageous to have a higher specificity. Public health administrators would want to avoid
false positives and as a result the overtreatment of individuals that do not necessarily require the
preventive services. This is especially crucial in environments where resources are scarce.
Avoiding false positives would also be desirable in situations where the recommended disease
management is invasive or costly to the patient.53,54
On the contrary, it may be more advantageous from an ethical and economical standpoint to
increase the sensitivity of the test in order to avoid false negatives. Failure to identify those at
risk for caries development may result in unnecessary treatment in the future that may be more
costly and painful to the patient due to the progression of undiagnosed disease. By raising the
sensitivity of the risk model, the number of false positives would increase. Although it may
result in overtreatment of some patients, if the clinician uses an appropriate preventive strategy,
this would result in little to no harm to the patient in that dental caries would not be permitted to
start or progress. The patient would, however, experience some economical loss for the cost of
the preventive therapy.53
Risk Factors
A multitude of caries risk factors and indicators have been identified over decades of research.
For example, in a systematic review of risk factors for dental caries in young children, Harris et
al. found that 106 risk factors were significantly related to the prevalence of dental caries.69
With so many factors, it can seem daunting to decide which variables should be chosen for
16
inclusion in the CRA instrument. The risk factors selected for research are typically dictated by
the purpose of the study as there are very few standardized CRA instruments available.70
The few CRA models currently in use are recent additions to the discipline and tend to focus on
the principal factors associated with caries development, namely diet, microbial pathogens, and
host susceptibility factors.70 The University of Toronto’s CRA model is congruent with these
instruments (e.g. Cariogram, CAMBRA- Caries Management by Risk Assessment71) in that it
maintains its focus on the basic caries risk elements that can easily be identified in the dental
clinic and modified through preventive care practices.
The most commonly used caries risk factors and indicators in multifactorial CRA models include
levels of cariogenic bacteria (i.e. Streptococcus mutans and Lactobacillus), salivary factors (e.g.
flow rate and buffering capacity), carbohydrate intake, oral hygiene, fluoride exposure, previous
caries experience, and socioeconomic characteristics.48,61,72 Each of these caries risk predictors
will be discussed in the following sections.
Streptococcus mutans and Lactobacillus
Dental caries is an infectious disease of microbial origin; the etiologic agents are regular
inhabitants of the oral cavity that cause demineralization of dental hard tissue when their
pathogenecity and proportions are altered in response to environmental conditions.71
Microorganisms such as Streptococcus mutans (SM) and Lactobacillus (LB) have acquired a
significant advantage over other oral acidogenic bacteria due to their acidoduric nature. Not only
are SM able to survive in an acidic environment, but they have also adapted the ability to
17
increase their rate of acid production, thus driving the pH in the oral cavity lower and forming a
cariogenic plaque.24
Whereas SM are the primary initiators of the formation of carious lesions,73 LB contribute
substantially to the propagation of the lesion due to their ability to survive at a lower pH than
SM. In addition, SM have evolved the capacity to store energy for occasions when fermentable
carbohydrates are scarce in the oral cavity. This incredible adaptation allows oral SM levels to
remain relatively constant regardless of dietary modifications. LB have yet to develop this
ability and thus LB counts are often used to determine a patient’s compliance to dietary
changes.45
Traditionally, SM and LB counts have been the principal biological factors used for prediction of
future caries experience.23,56,59,68,74-77 Studies have shown that not only are these microorganisms
related to the incidence of dental caries, but that children with high levels of these pathogens
develop a significantly greater number of carious lesions than children with low levels.78
Nevertheless, salivary levels of SM and LB have been more successful in identifying low risk
children than those at an elevated risk for developing dental caries.29,79
These salivary tests aid dental professionals in identifying the two extremes in a disease
susceptible population but are less effective in predicting caries in moderate risk groups. The
accuracy of tests for SM in predicting future caries in the whole population is less than 50%.2
Unfortunately, despite their prevalent use in CRA’s, the predictive power of microbiologic tests

18
remains uncertain at the individual level as well.29,72,79 With the exception of findings in young
children, salivary levels of SM have been disappointing with regard to risk assessment.48
Salivary tests for LB are even less sensitive than tests for caries prediction than SM. This is to
be expected as LB are not primarily responsible for the initiation of dental caries but they are
found in large quantities when a considerable amount of carbohydrates have been consumed.9
LB counts are commonly analyzed to reflect dietary changes and the test results can be useful to
motivate patients and to monitor changes in oral hygiene, diet, and microbial therapies.26,29,47
Other Salivary Factors
Saliva serves multiple protective functions against the initiation and progression of dental caries.
It assists to clear food particles and bacteria from the oral cavity and it buffers the acids produced
by microorganisms in dental plaque.2,9 The number of individuals suffering from a reduced
salivary flow rate is increasing, especially in the elderly population. Xerostomia (dry mouth)
may be the consequence of a variety of conditions including radiation therapy to the head and
neck region and medical ailments such as Sjögren’s syndrome, Parkinson’s disease, and
uncontrolled diabetes mellitus.29,80
Xerostomia, however, is most commonly attributed to the side effects of many frequently
prescribed medications including antihistamines, anticholinergics, and tricyclic antidepressants.
Although xerostomia has long been known to be a risk factor for individuals of any age, the
elderly are especially susceptible to salivary changes due to the large number of medications they
are often required to take.81 This can be especially problematic for this cohort as they are
19
generally retaining more teeth than they have previously but suffer from unfavourable salivary
conditions, which puts them at an even higher risk of developing dental caries.82,83
Individuals with chronically reduced salivary function have been found to have a significant
increase in caries activity. Many dentists rely on the patient’s complaint of xerostomia to
diagnose hyposalivation; however, this subjective complaint often does not correlate with
objective findings of reduced salivary flow. Testing an individual’s unstimulated salivary flow
rate can be accomplished easily in clinical practice and it has a strong predictive validity for
assessing caries risk. The stimulated flow rate, using paraffin wax, is also customarily measured
to conclude if preventive strategies based on salivary stimulation (e.g. chewing sugarless gum)
will benefit the patient.2,9
Fluoride Exposure
Topical and systemic fluoride exposure, oral hygiene habits, and diet are often not strong
predictive factors for caries development but they are often still included in CRA instruments
because they may be prescriptive for the preventive actions recommended. Determining a
problem in one or more of these areas will aid the dentist and patient to customize a care plan
using these elements to alter other caries risk variables, such as bacterial and salivary factors.63
In order to prevent dental caries, it has been recommended that a constant, low ambient level of
fluoride should be maintained in the oral environment.29,84 Although both pre-eruptive
(systemic) and post-eruptive (topical) mechanisms of action continue to be suggested, the
literature supports the latter.85

20
Fluoride works via three mechanisms:
1. Inhibition of demineralization- Fluoride becomes incorporated into the enamel hydroxyapatite
crystal and reduces enamel solubility in the presence of acids (pre- and post-eruptive);
2. Enhancement of remineralization- Low levels of fluoride available in the oral cavity enhance
remineralization during repeated cycles of demineralization and remineralization in the early
stages of the caries process (post-eruptive);
3. Inhibition of bacterial enzymes- Fluoride inhibits glycolysis, the process by which fermentable
carbohydrates are metabolized by cariogenic bacteria to produce acid (post-eruptive).86
The considerable reduction in the prevalence of dental caries from 1960 to 1990 was related
initially to the introduction of fluoride into the public water system and to the subsequent use of
topical fluoride through fluoridated toothpaste and professionally applied delivery systems.15.41
Its use has been shown to prevent and arrest carious lesions and its protective mechanism allows
for more conservative management strategies in the prevention and treatment of dental caries.9
When completing a CRA, the various sources of fluoride must be taken into account such as
fluoridated drinking water, food and drinks, fluoridated toothpaste and mouthrinse, and
professionally applied topical fluoride.
Plaque
Because dental caries is a microbiological disease, a prerequisite for caries development is the
presence of dental plaque on the teeth, and unless this biofilm is present caries will not occur,
regardless of any other risk factors.12 Researchers have failed to demonstrate a consistent
relationship between dental plaque scores and caries.80 Not all patients with poor plaque control

21
inevitably develop caries; however, those who clean their teeth infrequently or ineffectively may
be at higher risk for developing carious lesions.9,12 Furthermore, conditions that hinder long-
term maintenance of good oral hygiene, such as mental and physical disabilities and oral
appliances, are positively associated with a higher caries risk.62
The inconsistent relationship between oral hygiene and dental caries prevalence may be due to
the manner in which data is collected. Many risk assessment models use plaque indices that
were developed for the study of periodontal disease to record the oral hygiene status of patients.
This can be an inaccurate means of recording because they are often based on smooth surface
scores, whereas the majority of caries occurs in the pits and fissures or the interproximal surfaces
of teeth.2,48
Fermentable Carbohydrates
Consumption of sugar and carbohydrates is considered an important etiological factor in the
development of dental caries.15,87 The role of diet is primarily local in nature rather than
systemic as bacteria metabolize carbohydrates and sugar, producing acidic by-products that
cause the demineralization of the enamel surface. Whether this disease activity proceeds to a
carious lesion depends on various dietary elements, as well as the patient’s oral hygiene and
exposure to fluoride.88
There are several dietary elements that need to be addressed when assessing a patient’s caries
risk level. Whether or not a food is cariogenic depends on a number of factors specific to the
individual who eats it, namely the predominant oral bacteria in plaque, salivary flow rate and
22
buffering capacity, and fluoride availability in the oral cavity.89 The clinician must also take into
account the retentiveness of the food, protective elements in food (e.g. fluoride, calcium,
phosphate), the frequency of meals and snacks, sugar-containing non-foods (e.g. lozenges, gum,
medications), and patterns of consumption (e.g. sipping sugared drinks over a long period of
time).2,9 Patients are typically asked to fill out a 24-hour diet diary and may be requested to
complete an additional dietary record of up to a week if the practitioner believes the patient to be
at high risk for dental caries.
Assessing diet alone is usually inadequate at predicting caries. Studies in humans have not found
a consistent relationship between consumption of cariogenic foods and dental caries
experience.29,48 In a longitudinal study by Burt et al., the between meal sugar consumption was
found to be only marginally related to interproximal caries increment but not at all related to
caries in the pits and fissures.90
Dental caries is a multifactorial disease and thus caries risk is not always directly correlated to
fermentable carbohydrate consumption. For example, it was found that children developed very
few caries if they had good oral hygiene irrespective of their dietary intake but if oral hygiene
was poor, a high sugar intake revealed an increase in caries prevalence.91 It is thus more prudent
to consider dietary factors in association with other caries factors such as oral hygiene practices
and fluoride exposure.

23
Previous Caries Experience
Without a doubt, previous caries experience remains the most powerful single predictor of future
caries development.19,31,52 It is the most common risk indicator used by dentists in both clinical
practice and in CRA research as it provides the strongest predictive ability.26,47,51,59,75 Studies of
children and adolescents show that individuals developing carious lesions early in life tend to
develop more caries in the coming years.53,61,70,92,93 This tendency has also been demonstrated
with an increase in caries risk among children whose mothers have caries and adults are more
likely to develop root caries if they have existing coronal caries.9,94
Previous caries experience is often used in prediction models as it is fast, simple and inexpensive
to record. However, it cannot specify the particular risk factors that are causing the dental caries
and, therefore, it cannot be used alone to specify appropriate preventive strategies directed at
eliminating or modifying the patient’s risk for caries development.56,61 Documenting caries
experience over the past one to two years, and current disease activity, tends to be more
indicative of the patient’s true caries risk level. It has been shown that short-term predictions
(i.e. less than 2 years) are more reliable than long-term predictions of risk (i.e. more than 5
years). Dental caries develop under precise oral conditions and these circumstances are more
likely to change during studies of longer duration due to lifestyle or behavioural modifications.70
Sociodemographic Indicators
Some researchers take the patient’s age into account when assessing caries risk as teeth are
exposed to different levels of the oral environment at various stages throughout life. For
example, it has been shown that newly erupted teeth are more susceptible to development of
24
carious lesions due to their limited exposure to topical fluoride.2 Dental caries used to be
considered a disease of childhood. This belief arose when the prevalence of caries was much
higher and when few children reached adulthood caries-free. This is no longer the case and the
caries disease process is spread out more throughout life.81 Adults of all ages still develop
coronal caries and thus dental caries must now be considered a lifetime disease.76 Currently age,
as a risk indicator, is considered to be less critical in the prediction of caries. The interaction of
the principal risk factors (diet, bacteria, and host factors) takes precedence over an individual’s
age for appropriately categorizing caries risk level.2,19,70
Some investigators use other demographic risk indicators in their caries risk models, such as
gender. Women, in both childhood and adulthood, tend to present with higher DMF (Decayed,
Missing, Filled) scores than men. However, females generally tend to have superior oral hygiene
and fewer missing teeth than males. Therefore, it is unlikely that women have higher caries
susceptibility than men, but rather it is a combination of seeking out more dental care and/or
earlier tooth eruption in the case of children and adolescents.2,81
A person’s medical status is an indicator that incorporates some of the same elements as a few
other risk factors, such as bacterial load and salivary characteristics. Xerostomia and lack of
physical or cognitive abilities will alter the saliva and bacterial counts in an individual’s oral
cavity, especially in the elderly and special needs patients, and thus resulting in a higher risk for
caries activity. Medical status is not often formally assessed because it is indirectly considered
by its effect on stronger predicting etiologic risk factors such as salivary flow rate.12,83

25
Socioeconomic status (SES) is a broad measure of individual or family’s relative economic and
social ranking with regards to factors such as income, education, and occupation.81 A large
number of reports over the past few decades have demonstrated that social and behavioural
factors are associated with dental caries and some studies have specifically indicated that dental
caries can now be regarded as a disease of poverty.95-97 The sharpest decline in caries prevalence
has been in the upper SES groups, while reductions in disease rates in lower SES groups have
been much more modest.48
There is much discussion on whether or not to include socioeconomic variables in CRA
instruments. Certainly these indicators will often select for high risk individuals as they will be
more inclined to develop higher levels of tooth decay than people living under less extreme
conditions.98 But much like medical status, they do not indicate which risk factors are
responsible for the development of disease and they are often indirectly considered with stronger
etiological factors.61 There is little doubt that dietary and health practices are affected by
education, income and environment;29 however, bacterial levels and cariogenic diet are normally
already considered to be direct causes of caries and are regularly assessed. It, therefore, may be
redundant to assess both socioeconomic variables and biological factors in the same CRA model.
Overall
It was concluded at the risk assessment conference at the University of North Carolina that
clinical variables were stronger predictors of dental caries than non-clinical variables. Past
experience of caries activity was the most significant indicator of future caries development,
along with fluoride exposure, microbial agents, tooth morphology, and socioeconomic status.70
26
Given that dental caries is a multifactorial disease, it only makes sense to use multiple predictors
in order to accurately predict risk for the disease. It has been established that analyses applying a
combination of biological and social factors have shown better results than any single risk factor
studies.48 Work must be continued in this area to determine which caries risk factors and
indicators are most effective for defined populations.29
Multifactorial Caries Risk Assessment Models
It has been noted by a couple of researchers that the majority of CRA studies have been
conducted in children and adolescent populations.70,72 There are relatively few studies involving
adult subjects and those that do exist focus mainly on older adults (aged 50+ years) and the
development of root caries.68,76,99-104 We are only just beginning to see studies that investigate
general caries activity in populations that include younger adults.35,105-8 This is promising
because the younger adult population may express different disease factors due to lifestyle
changes they encounter early into adulthood, such as living away from home for the first time
and changes in dental care utilization and insurance patterns.109
The following are two examples of multifactorial caries risk assessment instruments. Firstly, the
Cariogram is a widely available tool that has been validated26 and has received much attention in
the discipline of cariology. It has been used extensively to identify caries risk factors for a
variety of populations globally.47,56,107,108,110-6 Secondly, the caries risk assessment form (Caries
Risk and Preventive Needs Assessment) from the Faculty of Dentistry at the University of
Toronto is a university-developed model utilized by the students in the dental school clinic.

27
Cariogram
The Cariogram, developed in 1996, was originally conceived as an educational model aiming to
demonstrate the multifactorial etiology of dental caries in a simple manner.60 It is a graphical
picture illustrating the interactions of caries-related factors and the overall risk profile of the
patient. In the beginning, the pie chart presentation included three components: diet, bacteria
and susceptibility. Based on this model, an interactive computer program was developed in 1997.
Changes made to the program included the addition of two more sections to the pie chart-
‘circumstances’ and ‘chance of avoiding caries’. The circumstances sector included factors that
did not participate directly in the development of caries but were risk predictors of dental caries,
such as past caries experience and systemic diseases.117
The program prompts the clinician to enter a weight (0 to 3, with ‘0’ representing a low risk and
‘3’ representing a high risk) for nine risk factors (caries experience, related general diseases,
dietary contents, dietary frequency, plaque amount, Streptococcus mutans, fluoride, saliva
secretion, and saliva buffering capacity) and a clinical judgement score.60 An algorithm was
constructed such that all the factors entered into the model could be weighed and the patient’s
chance of avoiding caries could be calculated. This was represented as the final pie piece in the
diagram. With this interactive program, it is possible to demonstrate to the patient how their
caries risk can change as a result of various actions. Additionally, the patient’s risk profile can
be saved or printed and the program offers recommendations for preventive measures that should
be adopted to avoid new caries activity.26

28
‘Caries Risk and Preventive Needs Assessment’ Instrument
The Faculty of Dentistry at the University of Toronto developed its own caries risk assessment
instrument (Caries Risk and Preventive Needs Assessment) and implemented it into their school-
based dental clinic in 1996 (Appendix). It was introduced to the undergraduate students as a
preventive dentistry assignment to help students focus their attention on their patients’ caries-
preventive needs. The CRA form was intended to provide a guide for students to consider the
various factors that may influence caries risk, as well as the preventive measures available to
reduce the risk of disease.55
There are five sections of the form:
1. Basic patient data- includes information regarding medical conditions, disabilities, and oral
appliances that may influence the patient’s overall caries risk.
2. Basic caries risk factors- eleven factors (e.g. past caries and oral hygiene) are assessed and
given a score (‘0’ for low, ‘1’ for moderate, or ‘2’ for high risk). A total risk score is calculated
by summing the scores of the eleven risk factors.
3. Caries preventive factors- provides an inventory of the preventive practices routinely used by
the patient.
4. Supplementary caries susceptibility tests- provides suggestions for additional diagnostic tests
and procedures that could be used to investigate the patient’s caries risk level.
5. Assessment summary- provides space to summarize the patient’s risk factors and to propose
preventive treatment.

29
The risk factors selected for assessment in this instrument were obtained from the literature.
Although this CRA tool has been used for more than a decade, it has never been evaluated. It is
unknown whether the instrument can accurately assess caries risk level and which risk factors
and/or indicators are the best predictors of caries activity in this population.

30
Statement of the Problem
Although dental caries has long been established to be a disease of multifactorial etiology, many
of the traditional caries prediction models have focused on individual factors associated with
high caries activity. More recently, the multifactorial etiology of caries points in the direction of
constructing a more promising risk assessment model that includes the various factors that
contribute to the development of caries as no single test can simultaneously measure the three
principal components (host, bacteria, and diet) of dental caries. The Faculty of Dentistry at the
University of Toronto has developed and implemented their own caries risk assessment form to
assess patients’ risk for development of caries and to determine their oral health preventive
needs. This multifactorial model, however, has never been evaluated to determine if it can
accurately predict caries risk levels or if the overall risk score predicts future dental caries more
accurately than any single factor measured.
Objectives
1. To determine if the caries risk assessment model (‘Caries Risk and Preventive Needs
Assessment’) could correctly assign the appropriate risk categorization to adult patients.
2. To determine if caries increment differed across various degrees of risk for each basic
caries risk factor and the overall risk score.
3. To determine which risk factors are the strongest predictors of future caries development.
Hypothesis
A caries risk assessment model that evaluates multiple factors simultaneously is able to predict
caries increment more accurately than a single factor.

31
Methodology
Study Design
This research paper was designed as a quality assurance study. It consisted of secondary data
analyses of measures collected from a chart audit of patient records from the Faculty of
Dentistry, University of Toronto. The purpose of the study was to examine disease activity and
risk factors for dental caries at baseline (i.e. when patients were first admitted to the Faculty’s
dental clinic) and subsequent dental caries experience at follow-up (i.e. during recall
appointments or after years of treatment). Study approval was obtained from the University of
Toronto’s Research Ethics Board.
Eligibility Criteria
To be eligible for study participation, the subject in the patient chart had to meet the following
criteria: 18 years of age or older at baseline, dentate, and have had a caries risk assessment
completed at the University of Toronto dental clinic. Subjects must also have returned to the
dental clinic for an oral health re-evaluation (e.g. recall or oral diagnosis examination) in which
dental caries was re-assessed.
Sample Size
Using a computer-generated sample size calculator (with a significance level of 0.05 and power
of 80%), it was determined that a sample size of 375 patients was required. A list of potential
candidates was derived from axiUm, a dental computer software program, using the dental recall
code (01202) to ensure that patients had returned to the clinic for a re-assessment of dental
caries. Any repetitions of names in the list (i.e. those patients that had returned for multiple recall

32
appointments) were removed from the list to equalize the opportunity for all patients in the list to
be randomly selected for the study. This produced a directory of nearly 5900 potential patients,
each with a unique number. A computer random integer generator was utilized to select the
patients. These patient files were inspected electronically via axiUm to ensure that a complete
exam (including a caries risk assessment) was performed and that a recall examination was
subsequently completed.
The final study population consisted of 434 individuals; however, only 186 of these comprised
data from complete caries risk assessment forms. The remainder of the sample included all the
necessary data except two of the caries risk factors, Streptococcus mutans and Lactobacillus
counts. Customarily, microbial tests are often not completed due to patient refusal and/or the
students are told (at the time of the assessment) that they do not have to do the bacterial tests on
each patient unless they consider the patient to be at high risk or that it would make a great
teaching tool to help improve the patient's home care.
Data Collection
Secondary data analysis included a chart review of active and inactive University of Toronto
adult dental patients. All information was previously recorded by dental students and was
extracted from the patient’s paper chart housed at the Faculty of Dentistry, University of Toronto
or from the patient’s electronic chart, accessed through axiUm. Scores from the eleven ‘Basic
Caries Risk Factors’ and the patient’s ‘Total Risk Score’ were extracted from the university-
developed caries risk assessment form, Caries Risk and Preventive Needs Assessment
(Appendix). The various caries risk factors are given an individual score according to

33
predetermined scales (‘0’ for low risk, ‘1’ for moderate risk, and ‘2’ for high risk). The manner
in which the student selects the appropriate level of risk is described for each factor in Table 1.
The overall caries risk score is obtained through the addition of the individual scores for each
variable. Depending on the ‘Total Risk Score’ of the eleven criteria, the patient’s caries risk falls
into one of three categories: low (0-3), moderate (4-6), or high (≥7) caries risk.
Table 1. Caries-related factors from the ‘Caries Risk and Preventive Needs Assessment’ form Factor Information and data collected Scorea
Caries Activity Present caries activity at baseline, including coronal, root and incipient caries; data from clinical examination and radiographs
0: None 1: One 2: Two or more
Past Caries (DMFS)
Past caries experience at baseline, including fillings and missing teeth due to caries; data from clinical examination and radiographs
0: None or pit and fissure only 1: Proximal 2: Free, smooth surface or lower anterior
Root Caries Index Number of teeth with carious roots (decayed or filled) divided by number of teeth with exposed roots
0: 0 1: Intermediate 2: ≥0.3
Usual Fluoride Exposure
Estimation of the number of fluoride sources to which the patient is exposed
0: ≥2/day 1: 1/day 2: <1/day
Carbohydrate Between Meals Frequency
Estimation of the number of carbohydrates consumed between meals
0: <1/day 1: 2/day 2: ≥3/day
Oral Hygiene Clinical estimation of oral hygiene by visual inspection only
0: Good 1: Fair 2: Poor
Modified Gingival Bleeding Index
Total score from all proximal sites that gave a response to Stimudent probing. 0=no symptoms; 1=inflammation and no bleeding; 2=inflammation and slight bleeding; 3=inflammation and profuse bleeding
0: 0-4 1: 5-8 2: ≥9
Stimulated Salivary Flow (mL/min)
Estimation of salivary secretion rate (paraffin-stimulated saliva)
0: ≥0.7 1: Intermediate 2: ≤0.5
Resting Salivary Estimation of salivary secretion rate at 0: ≥0.3

34
Flow (mL/min) rest 1: Intermediate 2: ≤0.1
Mutans streptococci (CFU/mL)
Estimation of levels of Mutans streptococci in saliva
0: ≤1×10⁵
1: Intermediate 2: ≥1×10⁶
Lactobacilli (CFU/mL)
Estimation of levels of lactobacilli in saliva
0: ≤1×10⁴
1: Intermediate 2: ≥1×10⁵
Total Risk Score Addition of all above scores 0-3: Low caries risk 4-6: Moderate caries risk ≥7: High caries risk
a A score of ‘0’ denotes a low risk for caries, ‘1’ for moderate risk, and ‘2’ for high risk
The patients’ caries increments, as identified from paper charts, electronic records, and
radiographs, were estimated for the time interval extending from the initial oral diagnosis
appointment to the recall examination. Only dentinal caries (i.e. radiolucency that has broken
through the dentin-enamel junction) were recorded as a carious lesion. In addition, the patient’s
age and gender were collected for the logistic regression analysis.
Data Analysis
Statistical analyses for associations between individual caries risk factors and the ‘Total Risk
Score’ and caries increment were performed. Statistical tests were two-tailed and the level of
significance was set at p<0.05. Data were analyzed using SPSS, version 17.0 (SPSS, Chicago,
IL, USA). Three levels of analyses included: 1) univarite description of variables using percent
frequencies for risk factors and mean ± standard deviation for caries increments; 2) bivariate
associations between the eleven ‘Basic Caries Risk Factors’ and the ‘Total Risk Score’ and
caries increment using one-way ANOVA analyses, with Tukey’s HSD post-hoc test; and 3)
multivariate analysis using logistic regression (Forward:Wald), in which all the significant

35
variables from the bivariate analysis, as well as gender and age, were entered into the model.
Age was divided into three groups (18-39; 40-59; 60+ years) for logistic regression. The low
risk group of each variable, the female gender and the 60+ age group were used as references in
the logistic regression analysis.
In addition, the sensitivity (Se), specificity (Sp), positive predictive value (PPV) and negative
predictive value (NPV) of the caries risk assessment tool were calculated using the ‘Total Risk
Score’ as the predictor variable for the development of caries. Because there were three risk
levels, Se, Sp, PPV, and NPV were calculated at two different cut-off points- one combined the
low and moderate risk groups, while the other combined the moderate and high risk groups.

36
Results
The frequency of subjects within the three caries risk categories, descriptive sample
characteristics (age, gender, recall interval), and caries increments (by tooth) are presented in
Table 2. Approximately one-fifth of the participants were classified as low risk for future
development of dental caries. The remainder of the subjects were fairly equally distributed in the
moderate (38.2%) and high (40.6%) risk groups. The sample population consisted of fewer males
(43.1%) than females and the mean age of the sample was 58.7±15.2 years of age, with the age
of participants ranging from 24 to 95 years. There was much consistency across these two
factors (i.e. age and gender) in the moderate and high risk groups. The recall period, which is
defined as the time from the initial caries risk assessment to the follow-up appointment at which
caries diagnosis was performed, was collected from a random sample of 60 charts. The recall
interval ranged from 24.80±6.38 to 27.95±5.26 months across the risk groups but the difference
was not statistically significant.
Table 2. Caries risk frequencies, sample characteristics and mean caries increments ± standard deviation (SD) Risk Classification Low Moderate High Total No. of individuals (%) 92 (21.2) 166 (38.2) 176 (40.6) 434 (100)
No. of males (%) 29 (31.5) 76 (45.8) 82 (46.6) 187 (43.1)
Mean age (years)±SD 62.3±13.1 57.4±14.7 58.2±16.3 58.7±15.2
Mean recall interval± SD (months)a 27.95±5.26 24.80±6.38 26.85±4.87 26.53±5.93
Mean caries increment±SD (tooth) 0.20±0.80 1.13±1.59 2.09±2.63 1.32±2.10 a Based on a random sample of 60 charts (20 from each caries risk group)

37
The number of carious teeth diagnosed at the recall appointment ranged from zero to 17 across
the sample. The mean caries increment noted from the time of the initial examination to the
recall visit was 1.32±2.10 for the total sample. A trend could be noted in which caries increment
increased with elevated risk classification (0.20±0.80 for low risk, 1.13±1.59 for moderate risk,
and 2.09±2.63 for high risk).
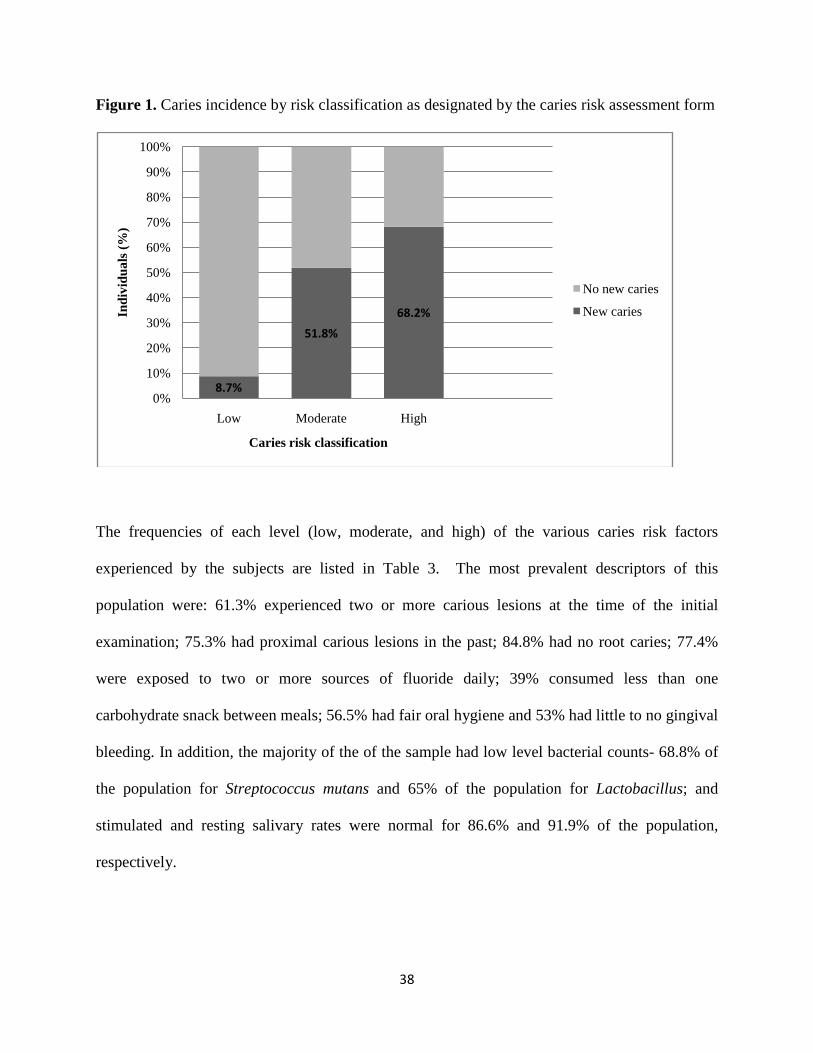
The participants’ caries experience, expressed as caries incidence from the initial examination to
subsequent follow-up examination, is displayed in Figure 1. Nearly half of the sample (49.3%)
had developed new carious lesions. Of the individuals deemed at a low risk for future caries
activity by the risk assessment form, only 8.7% had new caries. Caries experience increased
significantly in the other risk categories with 51.8% of moderate risk and 68.2% of high risk
participants presenting with new caries at their recall examination. The trend of increased caries
experience with elevated risk classification was statistically significant (p<0.001).
38
Figure 1. Caries incidence by risk classification as designated by the caries risk assessment form
The frequencies of each level (low, moderate, and high) of the various caries risk factors
experienced by the subjects are listed in Table 3. The most prevalent descriptors of this
population were: 61.3% experienced two or more carious lesions at the time of the initial
examination; 75.3% had proximal carious lesions in the past; 84.8% had no root caries; 77.4%
were exposed to two or more sources of fluoride daily; 39% consumed less than one
carbohydrate snack between meals; 56.5% had fair oral hygiene and 53% had little to no gingival
bleeding. In addition, the majority of the of the sample had low level bacterial counts- 68.8% of
the population for Streptococcus mutans and 65% of the population for Lactobacillus; and
stimulated and resting salivary rates were normal for 86.6% and 91.9% of the population,
respectively.
8.7%
51.8%
68.2%
0%
10%
20%
30%
40%
50%
60%
70%
80%
90%
100%
Low Moderate High
Indi
vidu
als (
%)
Caries risk classification
No new caries
New caries

39
Table 3. ANOVA analysis of various caries risk factors and ‘Total Risk Score’ versus mean caries increment
Factor (Score) Prevalence N (%)
Caries Increment
(tooth) ± SD
Significant Differencesa
Present Caries None (0) One (1) Two or more (2)
85 (19.6) 83 (19.1) 266 (61.3)
0.55±1.23 0.80±1.40 1.73±2.38
0 vs. 2; p<0.001 1 vs. 2; p=0.001
Past Caries None or pit and fissure only (0) Proximal (1) Free, smooth or lower anteriors (2)
29 (6.7)
327 (75.3) 78 (18.0)
0.31±0.60 1.24±1.83 2.05±3.08
0 vs. 2; p<0.001 1 vs. 2; p=0.005
Root Caries Index 0 (0) Intermediate (1) ≥0.3 (2)
368 (84.8) 52 (12.0) 14 (3.2)
1.17±1.76 2.04±2.84 2.50±4.83
0 vs. 1; p=0.014 0 vs. 2; p=0.050
Usual Fluoride Exposure ≥2/day (0) 1/day (1) <1/day (2)
336 (77.4) 77 (17.8) 21 (4.8)
1.19±1.80 1.64±2.70 2.19±3.49
No significant
differences between groups
Carbohydrate Between Meals Frequency <1/day (0) 2/day (1) ≥3/day (2)
169 (39.0) 133 (30.6) 132 (30.4)
1.07±1.78 1.15±1.84 1.82±2.59
0 vs. 2; p=0.005 1 vs. 2; p=0.025
Oral Hygiene Good (0) Fair (1) Poor (2)
113 (26.0) 245 (56.5) 76 (17.5)
0.65±1.26 1.44±2.20 1.92±2.51
0 vs. 1; p=0.002 0 vs. 2; p<0.001
Modified Gingival Bleeding Index 0-4 (0) 5-8 (1) >9 (2)
230 (53.0) 146 (33.6) 58 (13.4)
0.93±1.80 1.52±1.88 2.38±3.10
0 vs. 1; p=0.017 0 vs. 2; p<0.001 1 vs. 2; p=0.019
Stimulated Salivary Flow (mL/min) ≥0.7 (0) Intermediate (1) ≤0.5 (2)
376 (86.6) 42 (9.7) 16 (3.7)
1.17±1.76 2.43±3.26 2.00±4.02
0 vs. 1; p=0.001
Resting Salivary Flow (mL/min) ≥0.3 (0) Intermediate (1) ≤0.1 (2)
399 (91.9) 28 (6.5) 7 (1.6)
1.18±1.79 3.36±4.25 1.14±1.68
0 vs. 1; p<0.001 1 vs. 2; p=0.028
Mutans streptococci (CFU/mL) ≤1x10⁵ (0) Intermediate (1) ≥1x10⁶ (2)
128 (68.8) 39 (21.0) 19 (10.2)
1.20±1.82 2.13±3.21 3.42±4.35
0 vs. 2; p=0.001

40
Lactobacilli (CFU/mL) ≤1x10⁴ (0) Intermediate (1) ≥1x10⁵ (2)
121 (65.0) 20 (10.8) 45 (24.2)
1.12±1.63 2.45±3.98 2.60±3.51
0 vs. 2; p=0.003
Total Risk Score 0-3 (0) 4-6 (1) ≥7 (2)
92 (21.2) 166 (38.2) 176 (40.6)
0.20±0.80 1.13±1.59 2.09±2.63
0 vs. 1; p=0.001 0 vs. 2; p<0.001 1 vs. 2; p<0.001
a Significant statistical values after conducting post-hoc test (Tukey HSD) in the ANOVA analyses
Utilizing one-way ANOVA analyses, the mean caries increments of the risk categories were
compared across the eleven ‘Basic Caries Risk Factors’ and the ‘Total Risk Score’ recorded at
baseline. The results of this analysis are presented in Table 3. A post-hoc test, Tukey-HSD, was
conducted to determine between which groups statistically significant differences lied. All
factors except fluoride exposure displayed statistically significant results between at least two of
the caries risk classifications. The most common difference found was between those in the low
risk group as compared to the high risk group. All variables, with the exception of fluoride
exposure, stimulated and resting salivary flow, showed statistically significant differences
between the low and high risk categories. Only two factors, Modified Gingival Bleeding Index
(MGBI) and the ‘Total Risk Score’ exhibited differences between all risk groups.
The adjusted odds ratios for the three caries risk classifications are illustrated in Table 4. The
adjusted odds ratios were calculated twice. Because not all of the participants had Streptococcus
mutans and Lactobacillus counts done during their caries risk assessment appointment, there
were two possible scenarios. The first was the full sample (N=434) in which the microbial counts
were excluded from the analysis and the second was a partial sample (N=186) in which only

41
those individuals with complete caries risk assessments (i.e. obtained microbial counts) were
included in the analysis. Although the magnitude of the figures differed slightly, the trend of
increased odds of developing new caries with an elevated risk categorization persisted across
both samples. For example, in the full sample analysis, patients in the moderate risk group were
12 times more likely to develop caries than individuals in the low risk group. The high risk group
had 25 times greater risk of developing caries than the lowest risk group. All findings were
highly statistically significant.
Table 4. Adjusted odds ratios (OR) for the various caries risk groups in the logistic regression model
Full sample (N=434) Partial sample (N=186) Risk
Category Adjusted
OR 95% CIa p value Adjusted
OR 95% CIa p value
Low 1 (reference) - - 1 (reference) - -
Moderate 12.04 5.40-26.85 <0.001 11.74 1.45-95.37 0.021
High 25.44 10.87-59.53 <0.001 24.00 3.05-189.08 0.003
a 95% Confidence Interval
Logistic regression analysis was carried out to determine which variables were the strongest
predictors of caries activity when all factors were considered simultaneously. Age and gender
were also added to the model to ensure they were not confounding factors. The ‘Total Risk
Score’ (p<0.001) and between meals carbohydrate frequency (p=0.019) were the only significant
factors associated with the presence of caries. Because the overall risk score was by far the most
powerful predictor of future caries development, the model was run again, excluding the ‘Total
Risk Score’, to see what other variables were associated with caries activity. The results of this

42
logistic regression analysis are presented in Table 5. Other factors that proved to be significantly
associated (i.e. p<0.05) with caries increment included present caries activity, past caries
experience, carbohydrate frequency, MGBI, and stimulated salivary flow.
Table 5. Adjusted odds ratios (OR) for various factors when all independent variables except the ‘Total Risk Score’ were included in the logistic regression model
Risk Category Adjusted OR 95% CIa p value Present Caries None One Two or more
1 (reference)
2.42 3.42
-
1.19-4.90 1.88-6.23
-
0.014 <0.001
Past Caries None or pit and fissure only Free, smooth, or lower anterior
1 (reference)
5.93
-
2.07-16.98
-
0.001 Carbohydrate Between Meals Frequency <1/day ≥3/day
1 (reference)
1.76
-
1.05-2.94
-
0.032 Modified Gingival Bleeding Index 0-4 5-8 >9
1 (reference)
2.71 2.34
-
1.69-4.35 1.21-4.51
-
<0.001 0.011
Stimulated Salivary Flow (mL/min) ≥0.7 ≤0.7/ ≥0.5
1 (reference)
3.48
-
1.55-7.82
-
0.003 a 95% Confidence Interval
Sensitivity (Se), specificity (Sp), positive predictive value (PPV), and negative predictive value
(NPV) of the caries risk assessment tool were compared for two cut-off points in Table 6. When
the moderate risk group was combined with the high risk group rather than the low risk group, Se
and NPV both increased significantly (Se 56 to 96% and NPV 63.6 to 91.3%). Conversely, Sp
and PPV both decreased, 75 to 38% and 68.2 to 55.4%, respectively.

43
Table 6. Comparison of sensitivity (Se), specificity (Sp), positive predictive (PPV) and negative predictive (NPV) values of the caries risk assessment model using two different cut-off points
Criteria Caries No Caries Se (%) Sp (%) PPV (%)
NPV (%)
High vs. Moderate/Low
120 94
56 164 56 75 68.2 63.6
High/Moderate vs. Low
206 8
164 84 96 38 55.4 91.3
44
Discussion
The University of Toronto’s multifactorial caries risk assessment (CRA) tool was able to
accurately categorize an individual’s risk for future caries development, as demonstrated by two
trends that emerged from the data. Firstly, as the caries risk elevated, the number of teeth
affected by caries also increased. The number of carious teeth rose proportionately across the
risk groups (0.20 for low, 1.13 for moderate and 2.09 for high risk groups). Secondly, as the
caries risk rose, the number of individuals displaying caries at the follow-up exam also increased.
Approximately 9% of the low risk subjects presented with caries at the recall exam, while nearly
70% of the high risk group exhibited new carious lesions. Predicting caries in the moderate risk
group proved to be more challenging; just over half of the moderate risk group presented with
dental decay at the follow-up appointment.
Defining the appropriate criteria to select moderate risk individuals represents the utmost
diagnostic challenge as it is difficult to know where to set the cut-off point between risk
categorizations. Often it can be rather straightforward to identify low risk and high risk
individuals; however, it is much more complicated to recognize moderate risk individuals that
may have exhibited little or no dental disease for long periods of time followed by a sudden burst
of caries activity.36,37
All the risk factors, except usual fluoride exposure, were found to be significantly associated
with caries increment in the bivariate analysis. This was not surprising as dental caries is a
disease of multifactorial etiology and thus there were many elements related to the development
of caries in this population. It should be noted, however, that the majority of the differences

45
were found solely between the high and low risk groups. Again, this demonstrates the ease in
identifying low risk, low caries and high risk, high caries patients, while detecting a moderate
risk for caries development proves to be a more complex task.
Usual fluoride exposure was the only variable that was not significantly associated with dental
caries in this study. Typically, exposure to various sources of fluoride has been shown to be a
protective factor and helps to prevent the formation or progression of caries development.118
However, it is becoming increasingly difficult to distinguish between various levels of fluoride
exposure due to the “halo effect”, which is the impact of individuals indirectly benefitting from
the anti-carious effects of fluoride through the consumption of processed foods and beverages
that have been produced using fluoridated water.28
The effect of fluoride exposure is a preventive factor that is best identified at the population level
rather than at the individual level. An inverse relationship between caries experience and
fluoride exposure has been established at the population level.29 Individuals living an area with
fluoridated public water, such as Toronto, are all exposed to levels of fluoride that provide anti-
caries protection. Supplementary sources of fluoride (e.g. toothpaste, mouthrinses) may not
provide much additional benefit in the way of caries prevention if they consume fluoridated
water and foods and beverages manufactured with fluoridated water. Because individuals from
all risk groups may already be ingesting optimal caries-inhibitory levels of fluoride, no
differences were found between caries increments for the various levels of fluoride exposure in
this study.
46
The overall risk score from the CRA instrument, which is the summation of multiple risk factors,
was by far the strongest predictor of future caries activity. This supports the current literature
which suggests that due to the multifactorial etiology of dental caries, the identification of
several risk factors would increase the probability of formulating an accurate risk profile for our
patients.23,48,59,63 Multifactorial CRA tools are becoming more popular and their use more
prevalent as they present an overall picture of the interaction of the multitude of caries risk
factors.43,56,61
The dated method of relying on a single factor to dictate the development of a multifactorial
disease often would lead to inaccurate predictions. For example, while consumption of
fermentable sugars certainly plays a key role in the development of caries, reliance on this single
factor as a predictor for future development of caries would often be misleading. Many
individuals remain caries-free despite a high intake of sugar (high risk behaviour), likely due to
the interaction of several low risk behaviours, such as good oral hygiene habits and regular
exposure to fluoride.81
When all variables (except overall risk score) were considered in the logistic regression analysis,
caries experience (past and present), carbohydrate frequency, MGBI, and stimulated salivary
flow were significantly associated with caries activity. From the literature, it is clear that past
caries experience remains the most powerful single predictor of future caries development. It is
the most common risk indicator used in clinical practice and in research due to its strong
predictive ability.19,31,51,52,59,75 Although caries experience is a powerful indicator of caries
activity, it cannot specify the particular risk factors that are causing the dental caries and,

47
therefore, it cannot be used alone to specify appropriate preventive strategies directed at
eliminating or modifying the patient’s risk for caries development.37,56,61
Dental caries occurs as a result of the interaction of a dietary substrate, microbial pathogens, and
host factors. In this study, between meal carbohydrate frequency, which is a dietary indicator,
and MGBI and stimulated salivary flow rate, both indicators of host susceptibility, were all
significant factors in caries development. Contrarily, bacterial counts (i.e. Streptococcus mutans
and Lactobacillus) were not found to be significantly associated with caries in this population.
Historically, when studied in groups, caries experience has been found to be related to
Streptococcus mutans counts; however, bacterial counts by themselves are poor predictors of
caries activity at the individual level.81 In the current study, 51 patients had low levels of
Streptococcus mutans and Lactobacillus at baseline but still presented with dental caries at
follow-up. Similarly, ten patients had high counts of these microbial pathogens at their initial
examination but were caries-free at their recall appointment. This indicates that bacterial counts
alone cannot predict future caries experience very accurately and thus we must rely on the
overall risk score (i.e. the interaction of multiple factors) to assess risk level. Additionally, some
researchers have suggested that microbial tests are not cost-effective and contribute only
marginally to the prediction of future dental caries development if other clinical and
sociodemographic data are available.50,119
The reason for the lack of association between high salivary bacterial counts and future caries in
this study may also have been due to insufficient power. Of the 434 charts reviewed, only 186 of
the caries risk assessment forms had bacterial counts. The lack of bacterial counts is often due to
48
patient refusal (infrequent) or that students have chosen not do them. It is not a mandatory part
of the caries risk assessment and students may choose to do the procedure if they feel that their
patient is high risk or that it could be used as a teaching tool to help improve their patient’s home
care. Microbial counts can be an important element to consider when customizing a caries
management plan that corresponds to the patient’s individual needs (e.g. prescribing an
antimicrobial rinse such as chlorhexidine). This same issue has been observed in a U.S.
university dental clinic.35 Using the CAMBRA risk assessment tool, students were instructed
that bacterial assessments were indicated when a patient was classified as high risk. From an
overall sample of 1218 charts, only 46 patients had Streptococcus mutans and Lactobacillus
counts recorded. This was thought to be due to the extra charge incurred by patients for this
service.
The calculation of sensitivity, specificity, positive and negative predictive values is the preferred
method for evaluation of disease prediction models.39 Because the university’s risk assessment
instrument classifies caries risk into three categories, 2 different cut-off points were possible.
The moderate risk group was combined with either the low risk or high risk group. Intuitively, it
makes more sense to combine the moderate and high risk groups as they would encompass the
individuals requiring increased preventive care to avoid caries. When the moderate and high risk
groups were amalgamated, the sensitivity (96%) and negative predictive value (91.3%) of the
model were extremely high. This translates to a caries risk instrument that is able to detect
disease (i.e. caries) when is truly present in the majority of cases and that it will be correct most
of the time in predicting dental caries. Eriksen, in his review of multifactorial CRA’s, found that
several factors considered together produced a higher sensitivity than each factor alone.72

49
The combined sensitivity and specificity of the CRA (131 or 134) did not reach the gold standard
of 160 as proposed by Fleiss and Kingman but few do.31 When that recommendation was
originally made, it did not take into account the fact that errors relating to poor sensitivity have
consequences that are entirely different from those of poor specificity.120 There is always a
trade-off between sensitivity and specificity, and consequently positive and negative predictive
values, in prediction models. When considering suitable prediction values, one must consider
the disease in question as well as the consequence of misclassification of patients by the
instrument. If one was administering this caries risk assessment tool on a population-wide basis
(i.e. in public programs), a test providing higher specificity (i.e. fewer false positives) would be
favoured. This would avoid the treatment of individuals that do not require preventive services
and thus saving scarce resources for other needs.53,54
On the other hand, it may stand that the goal of the risk assessment instrument would be to
identify all those at risk for caries and thus the model would need to possess higher sensitivity,
such as is the case with the CRA under current investigation. The disadvantage of this is that the
number of false negatives would increase (i.e. those identified as high risk for caries but will not
actually develop the disease). This would result in overtreatment in which patients receive
preventive services that they do not necessarily need. For some procedures, patients may suffer
an economical loss; however, the harm of providing preventive care is minimal and is therefore
preferred to the threat of failing to identify those at risk for caries, ultimately resulting in
needless dental treatment in the longterm.53
50
Study Limitations
The majority of the limitations of the study relate to its design. The study sample included only
patients that attended the university dental clinic (i.e. sample of convenience); therefore, they
may not have been representative of the general population. Secondly, although the study was a
retrospective analysis of caries that developed over time (with a prospective component in its
design), it consisted of an analysis of secondary data collected from dental charts. Inherently,
secondary data analysis suffers from many potential weaknesses, such as unwanted and unknown
biases, the need to tailor research questions to fit the data, and the inability to manage the quality
of the data. There was no control over what and how the data were collected which led to
difficulties in finding a sufficient number of charts that possessed microbial counts. In addition,
there is no guarantee that all the students consistently evaluated all the caries factors or
diagnosed dental caries in the same fashion. This could only be overcome if the collection of
data had been completed by a small number of calibrated investigators. Due to time constraints,
data collection was not carried out in this manner.
In addition, the recall period varied for the patients. Due to the limited number of charts
available for review, it was not possible to narrow a recall frequency, therefore, this period
ranged from 6 months to 7 years. The recall period from a random sample of 60 charts (20 from
each risk group) was collected to determine if the discrepancy in the recall intervals may have
led to statistically significant differences between caries increments scores of the risk groups.
From this limited sample, no statistically significant difference was found between the recall
periods across the various caries risk groups. The interval ranged between 24.80±6.38 and

51
27.95±5.26 months, with an average of 26.53±5.93 months between the initial caries risk
assessment and the follow-up appointment.
To overcome these difficulties, an ideal study would have consisted of a team of calibrated
examiners collecting measurements of all the basic caries risk factors at baseline and an
assessment of dental caries within a specified period of time. The recall period would ideally be
two to three years after baseline factors were collected. This time period balances between two
principles- dental caries formation versus lifestyle change. Dental caries is a slowly progressing
disease that takes two years for an initial lesion to progress through the enamel and requires in
the region of three to four years to extend into the dentin.121,122 Documenting past and current
caries activity tends to be indicative of the patient’s true caries risk level. It has been shown that
short-term predictions (i.e. less than 2 years) are more reliable than long-term predictions of risk
(i.e. more than 5 years). Dental caries develop under precise oral conditions and these
circumstances are more likely to change during studies of longer duration due to lifestyle or
behavioural modifications.9,70
Research Implications
In addition to the aforementioned ideal study, other research relating to the topic of caries risk
assessment should be conducted. A study investigating what preventive care was administered
once patients’ risk for caries was assessed, as well as whether or not the provision of preventive
services decreased future caries experience. In general, more research regarding caries risk in
the adult population, but not limited to the elderly, needs to be conducted. The majority of
studies in this area have also restricted their analysis to the development of root caries in seniors.

52
While this research is certainly warranted, investigators need to branch out to look at caries risk
factors and indicators in younger adults, especially in the context of lifestyle changes. For
example, one could explore dental caries and the factors associated with young adults living
away from home for the first time. Young adults may move away from home to go to school or
work elsewhere which may lead to changes in dietary and oral hygiene habits, thus resulting in
possible shifts in risk levels and dental disease patterns.7,117

53
CONCLUSIONS
1. The caries risk assessment model (‘Caries Risk and Preventive Needs Assessment’)
appropriately categorizes an individual’s risk for future caries development as evidenced by
increased caries activity as the risk level rises.
2. All factors except fluoride exposure displayed statistically significant differences
between the caries increments of the various risk levels. The most common difference found
was between those in the low risk group as compared to the high risk group.
3. Past and present caries experience, carbohydrate between meal frequency, mucogingival
bleeding index, and stimulated salivary flow showed statistically significant associations with
caries increment (p<0.05) but the total risk score proved to be the most powerful predictor of
future caries activity (p<0.001).
This study has confirmed the hypothesis that while numerous risk factors were significantly
associated with caries development, the multifactorial caries risk assessment model (i.e. the
‘Total Risk Score’) was a stronger predictor of future dental caries experience than any single
caries risk factor. Utilization of a global risk score necessitates a “bigger picture” mentality and
allows for a more thorough assessment of the various elements involved in this multifactorial
disease. The University of Toronto’s caries risk assessment instrument has shown that it can aid
clinicians to assign patients to the appropriate risk level. This model is simple but yet
comprehensive as it incorporates elements of the three principal etiological factors of dental
caries, namely dietary substrate, microbial pathogens, and host susceptibility. The risk factors

54
can be easily measured in a clinical setting and are issues that can easily be attended to through
preventive care (e.g. dietary analysis, oral hygiene instruction). Finally, the caries risk
assessment model serves as an educational tool for both students and patients as it measures and
identifies risk factors that are pertinent to the individual patient’s oral health needs.

55
REFERENCES 1. Keyes PH. Recent advances in caries research. Bacteriology. Int Dent J. 1962;12:443-64. 2. Reich E, Lussi A, Newbrun E. Caries-risk assessment. Int Dent J. 1999 Feb;49(1):15-26. 3. Young DA, Featherstone JDB, Roth JR, Anderson M, Autio-Gold J, Christensen GJ, Fontana M, Kutsch VK, Peters MC, Simonsen RJ, Wolff MS. Caries management by risk assessment: implementation guidelines. J Calif Dent Assoc. 2007 Nov;35(11):799-805. 4. Brown JP. Developing clinical teaching methods for caries risk assessment: introduction to the topic and its history. J Dent Educ. 1995 Oct;59(10):928-931. 5. Angmar-Månsson BE, Al-Khateeb S. Caries diagnosis. J Dent Educ. 1998 Oct;62(10):771-80. 6. Merritt J, Anderson MH, Park NH, Shi W. Bacterial biofilms and dentistry. J Calif Dent Assoc. 2001 May;29(5):255-60. 7. Kutsch VK, Kutsch CL. Disease prevention: caries risk assessment. Dent Today. 2006 Oct;25(10):86, 88-9. 8. Marthaler TM, O'Mullane DM, Vrbic V. The prevalence of dental caries in Europe 1990-1995. ORCA Saturday afternoon symposium 1995. Caries Res. 1996;30(4):237-55. 9. Fontana M, Zero DT. Assessing patients’ caries risk. J Am Dent Assoc. 2006 Sep;137(9):1231-9. 10. Petersson GH, Bratthall D. The caries decline: a review of reviews. Euro J Oral Sci. 1996;104(4 (Pt 2)):436-43. 11. Burt BA. Prevention policies in the light of the changed distribution of dental caries. Acta Odontol Scand. 1998;56(3):179-86 12. Kidd EA. Caries management. Dent Clin of North Am. 1999 Oct;43(4):743-64. 13. Dye BA, Tan S, Smith V, Lewis BG, Barker LK, Thornton-Evans G, Eke PI, Beltrán-Aguilar ED, Horowitz AM, Li CH. Trends in oral health status: United States, 1988-1994 and 1999-2004. Vital Health Stat 11. 2007 Apr;(248):1-92. 14. U.S. National Institute of dental and Craniofacial Research. Oral health in America: a report of the surgeon general, executive summary. Rockville, Md.: U.S. National Institute of Dental and Craniofacial Research; 2000. 15. Evans RW, Pakdaman A, Dennison PJ, Howe ELC. The caries management system: an evidence-based preventive strategy for dental practitioners. Application for adults. Aust Dent J. 2008 Mar;53(1):83–92.
56
16. Tranæus S, Shi X-Q, Angmar-Månsson B. Caries risk assessment: methods available to clinicians for caries detection. Community Dent Oral Epidemiol. 2005Aug;33(4):265–73. 17. Daly B, Watt R, Batchelor P, Treasure E. Essential dental public health. New York: Oxford University Press; 2002. Sugars and caries prevention; p 183-96. 18. Hausen H, Kärkkäinen S, Seppä L. Application of the high-risk strategy to control dental caries. Community Dent Oral Epidemiol. 2000 Feb;28(1):26–34. 19. Pitts NB. Risk assessment and caries prediction. J Dent Educ. 1998 Oct;62(10):762-70. 20. Leverett DH, Proskin HM, Featherstone JD, Adair SM, Eisenberg AD, Mundorff-Shrestha SA, Shields CP, Shaffer CL, Billings RJ. Caries risk assessment in a longitudinal discrimination study. J Dent Res. 1993 Feb;72(2):538-43. 21. Stamm JW, Disney JA, Graves RC, Bohannan HM, Abernathy JR. The University of North Carolina caries risk assessment study, I: rationale and content. J Public Health Dent. 1988 Fall;48(4):225-32. 22. Stamm JW, Stewart PW, Bohannan HM, Disney JA, Graves RC, Abernathy JR. Risk assessment for oral diseases. Adv Dent Res. 1991 Dec;5:4-17. 23. Disney JA, Graves RC, Stamm JW, Bohannan HM, Abernathy JR, Zack DD. The University of North Carolina Caries Risk Assessment study: further developments in caries risk prediction. Community Dent Oral Epidemiol. 1992 Apr;20(2):64-75. 24. Moss ME, Zero DT. An overview of caries risk assessment and its potential utility. J Dent Educ. 1995 Oct;59(10):932-40. 25. Rose G. Sick individuals and sick populations. Int J Epidemiol. 2001 Jun;30(3):427-32. 26. Hänsel Petersson G. Assessing caries risk-using the Cariogram model. Swed Dent J Suppl. 2003;(158):1-65. 27. Beck JD. Risk revisited. Community Dent Oral Epidemiol. 1998 Aug;26(4):220-5. 28. Burt BA, Eklund SA. Dentitsry, dental practice, and the community. 5th ed. Philadelphia:W.B. Saunders Company; 1999. Fluoridation of drinking water; p 297-314. 29. FDI Working Group. Review of methods of identification of high caries risk groups and individuals. Fédération Dentaire Internationale Technical Report No. 31. Int Dent J. 1988 Sep;38(3):177-89. 30. Pitts NB. Diagnostic tools and measurements--impact on appropriate care. Community Dent Oral Epidemiol. 1997 Feb;25(1):24-35.

57
31. Hausen H. Caries prediction--state of the art. Community Dent Oral Epidemiol. 1997 Feb;25(1):87-96. 32. Batchelor B, Sheiham A. The limitations of a 'high-risk' approach for the prevention of dental caries. Community Dent Oral Epidemiol. 2002 Aug;30(4):302-12. 33. Axelsson P, Lindhe J, Nystrom B. On the prevention of caries and periodontal disease. Results of a 15-year longitudinal study in adults. J Clin Periodontol. 1991 Mar;18(3):182-9. 34. Axelsson P, Paulander J, Svardstrom G, Tollskog G, Nordensten S. Integrated caries prevention: effect of a needs-related preventive program on dental caries in children. County of Värmland, Sweden: results after 12 years. Caries Res. 1993;27 Suppl 1:83-94. 35. Doméjean-Orliaguet S, Gansky SA, Featherstone JD. Caries risk assessment in an educational environment. J Dent Educ. 2006 Dec;70(12):1346-54. 36. Kutsch VK, Milicich G, Domb W, Anderson M, Zinman E. How to integrate CAMBRA into private practice. J Calif Dent Assoc. 2007 Nov;35(11):778-85. 37. Jenson L, Budenz AW, Featherstone JDB, Ramos-Gomez FJ, Spolsky VW, Young DA. Clinical protocols for caries management by risk assessment. J Calif Dent Assoc. 2007 Oct;35(10):714-23. 38. Featherstone JD. The caries balance: contributing factors and early detection. J Calif Dent Assoc. 2003 Feb;31(2):129-33. 39. Wright JT, Cutter GR, Dasanayake AP, Stiles HM, Caulfield PW. Effect of conventional dental restorative treatment on bacteria in saliva. Community Dent Oral Epidemiol. 1992 Jun;20(3):138-43. 40. Young DA, Featherstone JDB, Roth JR. Curing the silent epidemic: caries management in the 21st century and beyond. J Calif Dent Assoc. 2007 Oct;35(10):681-5. 41. Featherstone JDB, Adair SM, Anderson MH, Berkowitz RJ, Bird WF, Crall JJ, Den Besten PK, Donly KJ, Glassman P, Milgrom P, Roth JR, Snow R, Stewart RE. Caries management by risk assessment: consensus statement, April 2002. J Calif Dent Assoc. 2003 Mar;31(3):257-69. 42. Newbrun E. Preventing dental caries: breaking the chain of transmission. J Am Dent Assoc. 1992 Jun;123(6):55-9. 43. Anderson MH, Bales DJ, Omnell KA. Modern management of dental caries: the cutting edge is not the dental bur. J Am Dent Assoc. 1993 Jun;124(6):37-44. 44. Edelstein BL. The medical management of dental caries. J Am Dent Assoc. 1994 Jan;125 Suppl:31S-9S.

58
45. Hildebrandt GH. Caries risk assessment and prevention for adults. J Dent Educ. 1995 Oct;59(10):972-9. 46. Anusavice KJ. Present and future approaches for the control of caries. J Dent Educ. 2005 May;69(5):538-54. 47. Hänsel Petersson G, Fure S, Bratthall D. Evaluation of a computer-based caries risk assessment program in an elderly group of individuals. Acta Odontol Scand. 2003 Jun;61(3):164-71. 48. Tinanoff N. Critique of evolving methods for caries risk assessment. J Dent Educ. 1995 Oct;59(10):980-5. 49. Carvalho JC, Thylstrup A, Ekstrand K. Results after 3 years non-operative occlusal caries treatment of erupting permanent molars. Community Dent Oral Epidemiol. 1992 Aug;20(4):187-92. 50. Isokangas P, Alanen P, Tiekso J. The clinician’s ability to identify caries risk subjects without saliva tests- a pilot study. Community Dent Oral Epidemiol. 1993 Feb;21(1):8-10. 51. Abernathy JR, Graves RC, Bohannan HM, Stamm JW, Greenberg BG, Disney JA. Development and application of a prediction model for dental caries. Community Dent Oral Epidemiol. 1987 Feb;15(1):24-8. 52. Powell LV. Caries risk assessment: relevance to the practitioner. J Am Dent Assoc. 1998 Mar;129(3):349-53. 53. Zero DT, Fontana M, Lennon ÁM. Clinical applications and outcomes using indicators of risk in caries management. J Dent Educ. 2001 Oct;65(10):1126-32. 54. Douglass CW. Risk assessment in dentistry. J Dent Educ. 1998 Oct;62(10):756-61. 55. Burgess RC. Assessment of caries risk factors and preventive practices. J Dent Educ. 1995 Oct;59(10):962-71. 56. Hänsel Petersson G, Twetman S, Bratthall D. Evaluation of a computer program for caries risk assessment in schoolchildren. Caries Res. 2002 Sep-Oct;36(5):327-40. 57. Last JM. A dictionary of epidemiology. 4th ed. New York: Oxford University Press:2001. p 196. 58. Burt BA, Eklund SA. Dentitsry, dental practice, and the community. 5th ed. Philadelphia:W.B. Saunders Company; 1999. Research designs in epidemiology; p 159-67. 59. Beck JD, Weintraub JA, Disney JA, Graves RC, Stamm JW, Kaste LM, Bohannan HM. University of North Carolina Caries Risk Assessment Study: comparisons of high risk
59
prediction, any risk prediction, and any risk etiologic models.Community Dent Oral Epidemiol. 1992 Dec;20(6):313-21. 60. Bratthall D, Hänsel Petersson G, Stjernswärd JR. Cariogram manual, Internet version 2.01. April 2, 2004. 61. Bratthall D, Hänsel Petersson G. Cariogram- a multifactorial risk assessment model for a multifactorial disease. Community Dent Oral Epidemiol. 2005 Aug;33(4):256-64. 62. NIH Consensus Development Conference on Diagnosis and Management of Dental Caries Throughout Life. Bethesda, MD, March 26-28, 2001. Conference Papers. J Dent Educ. 2001 Oct;65(10):935-1179. 63. Tinanoff N. Dental caries risk assessment and prevention. Dent Clin North Am. 1995 Oct;39(4):709-19. 64. Fletcher RW, Fletcher SW. Clinical epidemiology: the essentials. 4th ed. Baltimore: Lippincott Williams & Wilkins; 2005. Diagnosis; p 35-58. 65. Wilson RF, Ashley PP. Identification of caries risk in schoolchildren: salivary buffering capacity and bacterial counts, sugar intake and caries experience as predictors of 2-year and 3-year caries increment. Br Dent J. 1989 Aug 5;167(3):99-102. 66. Fleiss JL, Kingman A. Statistical management of data in clinical research. Crit Rev Oral Biol Med. 1990;1(1):55-66. 67. Steiner M, Helfenstein U, Marthaler TM. Dental predictors of high caries increment in children. J Dent Res. 1992 Dec;71(12):1926-33. 68. Scheinin A, Pienihäkkinen K, Tiesko J, Holmberg S. Multifactorial modeling for root caries prediction. Community Dent Oral Epidemiol. 1992 Feb;20(1):35-7. 69. Harris R, Nicoll AD, Adair PM, Pine CM. Risk factors for dental caries in young children: a systematic review of the literature. Community Dent Health. 2004 Mar;21(1 Suppl):71-85. 70. Powell LV. Caries prediction: a review of the literature. Community Dent Oral Epidemiol. 1998 Dec;26(6):361-71. 71. Featherstone JDB, Doméjean-Orliaguet S, Jenson L, Wolff M, Young DA. Caries risk assessment in practice for age 6 through adult. J Calif Dent Assoc. 2007 Oct;35(10):703-7, 710-3. 72. Eriksen HM, Bjertness E. Concepts of health and disease and caries prediction: a literature review. Scand J Dent Res. 1991 Dec;99(6):476-83.
60
73. Loesche WJ. Role of Streptococcus mutans in human dental decay. Microbiol Rev. 1986 Dec;50(4):353-80. 74. Krasse B. Biological factors as indicators of future caries. Int Dent J. 1988 Dec;38(4):219-25. 75. Pienihäkkinen K. Caries prediction through combined use of incipient caries lesions, salivary buffering capacity, lactobacilli and yeasts in Finland. Community Dent Oral Epidemiol. 1987 Dec;15(6):325-8. [correction appears in Community Dent Oral Epidemiol. 1988 Jun;16(3):192]. 76. Drake CW, Hunt RJ, Beck JD, Koch GG. Eighteen-month coronal caries incidence in North Carolina older adults. J Public Health Dent. 1994 Winter;54(1):24-30. 77. Demers M, Brodeur J-M, Mouton C, Simard PL, Trahan L, Veilleux G. Caries predictors suitable for mass-screenings in children: a literature review. Community Dent Health. 1990 Mar;7(1):11-21. 78. Zickert I, Emilson CG, Krasse B. Streptococcus mutans, lactobacilli and dental health in 13-14-year-old Swedish children. Community Dent Oral Epidemiol. 1982 Apr;10(2):77-81. 79. van Houte J. Microbiological predictors of caries risk. Adv Dent Res. 1993 Aug; 7(2); 87-96. 80. Hunter PB. Risk factors in dental caries. Int Dent J. 1988 Dec;38(4):211-7. 81. Burt BA, Eklund SA. Dentitsry, dental practice, and the community. 5th ed. Philadelphia:W.B. Saunders Company; 1999. Dental caries; p 212-36. 82. Petersen PE, Yamamoto T. Improving the oral health of older people: the approach of the WHO Global Oral Health Programme. Community Dent Oral Epidemiol. 2005 Apr;33(2):81-92. 83. Fure S. Five-year incidence of caries, salivary and microbial conditions in 60-, 70- and 80-year-old Swedish individuals. Caries Res. 1998;32(3):166-74. 84. Burt BA, Eklund SA. Dentitsry, dental practice, and the community. 5th ed. Philadelphia:W.B. Saunders Company; 1999. Fluoride: human health and caries prevention; p 279-96. 85. Groeneveld A, Van Eck AA, Backer Dirks O. Fluoride in caries prevention: is the effect pre- or post-eruptive? J Dent Res. 1990 Feb;69(Special Issue):751-5. 86. Featherstone JDB. Prevention and reversal of dental caries: role of low level fluoride. Community Dent Oral Epidemiol. 1999 Feb;27(1):31-40. 87. Zero D. Sugars: the arch criminal? Caries Res. 2004 May-Jun;38(3):277-85. 88. Burt BA, Pai S. Sugar Consumption and caries risk: a systematic review. J Dent Educ. 2001 Oct;65(10):1017-23.
61
89. Burt BA, Eklund SA. Dentitsry, dental practice, and the community. 5th ed. Philadelphia:W.B. Saunders Company; 1999. Diet and plaque control; p 347-57. 90. Burt BA, Eklund SA, Morgan KL, Larkin FE, Guire KE, Brown LO, Weintraub JA. The effects of sugar intake and frequency of ingestion on dental caries increment in a three-year longitudinal study. J Res Dent. 1988Nov;67(11):1422-9. 91. van Houte J. Role of micro-organisms in caries etiology. J Dent Res. 1994 Mar;73(3):672-81. 92. Helfenstein U, Steiner M, Marthaler TM. Caries prediction on the basis of past caries including precavity lesions. Caries Res. 1991;25(5):372-6. 93. Li Y. Wang W. Predicting caries in permanent teeth from caries in primary teeth: an eight-year cohort study. J Dent Res. 2002 Aug;81(8):561-6. 94. Locker D, Slade GD, Leake JL. Prevalence of and factors associated with root decay in older adults in Canada. J Dent Res. 1989 May;69(5):768-72. 95. Petersen PE. Sociobehavioural risk factors in dental caries - international perspectives. Community Dent Oral Epidemiol. 2005 Aug;33(4):274-9. 96. Graves RC, Bohannan HM, Disney JA, Stamm JW, Bader JD, Abernathy JR. Recent dental caries and treatment dental patterns in US children. J Public Health Dent. 1986 Winter;46 (1):23-9. 97. Palmer JD, Pitter AF. Differences in dental caries levels between 8-year-old children in Bath from different socio-economic groups. Community Dent Health. 1988 Dec;5(4):363-7. 98. Hobdell MH, Oliveira ER, Bautista R, Myburgh NG, Lalloo R, Narendran S, Johnson NW. Oral diseases and socio-economic status (SES). Br Dent J. 2003 Jan;194(2):91-6. 99. Ravald N, Birkhed D. Prediction of root caries in periodontally treated patients maintained with different fluoride programmes. Caries Res. 1992;26(6):450-8. 100. Ravlad N, Birkhed D, Hamp SE. Root caries susceptibility in periodontally treated patients. J Clin Periodontol. 1993 Feb;20(2):124-9. 101. Joshi A, Papas AS, Giunta J. Root caries incidence and associated risk factors in middle-aged and older adults. Gerondotology. 1993 Dec;10(2):83-9. 102. Locker D. Incidence of root caries in an older Canadian population. Community Dent Oral Epidemiol. 1996 Dec;24(6):403-7. 103. Beck JD, Kohout F, Hunt RJ. Identification of high caries in adults: attitudes, social factors and diseases. Int Dent J. 1988 Dec;38(4):231-8.
62
104. Powell LV, Mancl LA, Senft GD. Exploration of prediction models for caries risk assessment of the geriatric population. Community Dent Oral Epidemiol. 1991 Oct;19(5):291-5. 105. Bader JD, Perrin NA, Maupomé G, Rindal B, Rush WA. Validation of a simple approach to caries risk assessment. J Public Health Dent. 2005 Spring;65(2):76-81. 106. Sayegh A, Shehabi A, Hilow H. Multifactorial modelling for caries prediction in Jordanian university students. Community Dent Health. 1997 Jun;14(2):97-101. 107. Sonbul H, Al-Otaibi M, Birkhed D. Risk profile of adults with several dental restorations using the Cariogram model. Acta Odontol Scand. 2008;66(6):351-7. 108. Ruiz Miravet A, Montiel Company JM, Almerich Silla JM. Evaluation of caries risk in a young adult population. Med Oral Patol Oral Cir Bucal. 2007 Sep 1;12(5):E412-8. 109. Axelsson P. Diagnosis and risk prediction. Illinois: Quintessence Publishing Co. Inc; 2000. External modifying factors involved in dental caries; p 91-150. 110. Campus G, Cagetti MG, Sacco G, Benedetti G, Strohmenger L, Lingstrom P. Caries risk profiles in Sardinian schoolchildren using Cariogram. Acta Odontol Scand. 2009 Feb 27:1-7. 111. Al Mulla AH, Kharsa SA, Kjellberg H, Birkhed D. Caries risk profiles in orthodontic patients at follow-up using cariogram. Angle Orthod. 2009 Mar;79(2):323-30. 112. Holgerson PL, Twetman S, Stecksèn-Blicks C. Validation of an age-modified caries risk assessment program (Cariogram) in preschool children. Acta Odontol Scand. 2009;67(2):106-12. 113. Zukanović A, Kobaslija S, Ganibegović M. Caries risk assessment in Bosnian children using Cariogram computer model. Int Dent J. 2007 Jun;57(3):177-83. 114. Tayanin GL, Petersson GH, Bratthall D. Caries risk profiles of 12-13-year-old children in Laos and Sweden. Oral Health Prev Dent. 2005;3(1):15-23. 115. Twetman S, Petersson GH, Bratthall D. Caries risk assessment as a predictor of metabolic control in young Type 1 diabetics. Diabet Med. 2005 Mar;22(3):312-5 116. Stecksén-Blicks C, Holgerson PL, Twetman S. Caries risk profiles in two-year-old children from northern Sweden. Oral Health Prev Dent. 2007;5(3):215-21. 117. Axelsson P. Diagnosis and risk prediction. Illinois: Quintessence Publishing Co. Inc; 2000. Prediction of caries and risk profiles; p 151-78. 118. Marinho VC, Higgins JP, Logan S, Sheiham A. Topical fluoride (toothpastes, mouthrinses, gels or varnishes) for preventing dental caries in children and adolescents. Cochrane Database Syst Rev. 2003;(4):CD002782.

63
119. Alanen P, Hurskainen K, Isokangas P, Pietilä I, Levänen J, Saarni UM, Tiekso J. Clinician's ability to identify caries risk subjects. Community Dent Oral Epidemiol. 1994 Apr;22(2):86-9.
120. Axelsson P. Diagnosis and risk prediction. Illinois: Quintessence Publishing Co. Inc; 2000. Etiologic factors involved in dental caries; p 1-42.
121. Benn DK. Radiographic caries diagnosis and monitoring. Dentomaxillofac Radiol. 1994 May;23(2):69-72.
122. Mejare I, Kallestal C, Stenlund H, Johnasson H. Caries development from 11 to 22 years of age: a prospective radiographic study. Caries Res. 1998;32(1):10-16.

64
Appendix

65

66

67