evaluation of a disintegration technique for increased...
TRANSCRIPT

Evaluation of a disintegration technique for increased biogas
production from excess activated sludge
Utvärdering av teknik för disintegration av överskottsslam för ökad biogasproduktion
Anna Åkerlund, AP/Sveriges Lantbruksuniversitet R nr 3, april 2008


UPTEC W08 008
Examensarbete 30 hpApril 2008
Evaluation of a disintegration technique for increased biogas production from excess activated sludge Utvärdering av teknik för disintegration
av överskottslam för ökad biogasproduktion
Anna Åkerlund

I
ABSTRACT Evaluation of a disintegration technique for increased biogas production from excess activated sludge Anna Åkerlund Stockholm Water is participating in the project Biogasmax. The main goal for the project is to decrease the use of fossil fuels for transports in Europe by increasing the use and production of biogas. As a part of the work within the project, Stockholm Water evaluated a technique for disintegration of excess activated sludge (EAS) at Henriksdal wastewater treatment plant (WWTP). The disintegration principle was mechanical with rotating knifes connected to an EAS thickening centrifuge. With this technique, Stockholm Water was hoping that the pumpability of the EAS would improve. The centrifuges for dewatering of EAS could then be optimized and the total sludge flow to the digesters would consequently be reduced. A reduction of the sludge volume would allow the WWTP to increase the biogas production, either by taking in external organic material or allow the organic material to a higher degree be degraded by increasing the hydraulic retention time. Also, the organic material might due to the disintegration become more easily degradable leading to an increased specific methane production from EAS in the digesters at Henriksdal. The aim of this Master thesis was to evaluate the disintegrating centrifuge by its benefits and disadvantages. The rate of sludge disintegration and the effect in specific methane potential and viscosity for EAS were determined. Finally, an energy balance was performed to illustrate the benefits and disadvantages with the technique applied at Henriksdal WWTP. The results showed that the disintegration rate for a centrifuge equipped with a disintegrating device, at Henriksdal WWTP, in average was 1.6 % for thickened EAS with TS contents of 6-7 %. The rate of sludge disintegration by the centrifuge itself was in average 0.4 %. The disintegration device showed to have a positive effect on the viscosity and the pumpability for EAS. If optimizing the centrifuges, the total sludge flow (EAS, primary sludge and external organic material) to the digesters was calculated to be reduced by 5 %. Furthermore, the results showed that there was no increase in the specific methane potential for disintegrated EAS, but that the degradation rate for EAS was somewhat affected. However, in the case of a full-scale application of the technique at Henriksdal WWTP, the biogas production from EAS in the digesters was considered to only marginally be affected. Despite that, the energy balance showed that the possible energy outputs due to using the disintegration method at Henriksdal WWTP were higher than the energy input needed. This was because the decrease in the need of heating sludge was larger than the increase in energy consumption for the centrifuges. Key words: excess activated sludge, disintegration, biogas production, specific methane production, viscosity Department of Microbiology, Swedish University of Agricultural Sciences, Box 7025, SE-750 07 Uppsala, SWEDEN ISSN 1401-5765

II
SAMMANFATTNING Utvärdering av teknik för disintegration av överskottslam för ökad biogasproduktion Anna Åkerlund Stockholm Vatten deltar i projektet Biogasmax vars huvudsakliga mål är att minska användningen av fossilt bränsle för transporter i Europa genom att öka användningen och produktionen av biogas. Som ett led i arbetet inom projektet utvärderade Stockholm Vatten en teknik för disintegrering av överskottslam vid Henriksdals reningsverk. Principen för behandlingen var mekanisk med knivar som roterade med en centrifug för slamavvattning och sönderdelade det förtjockade överskottslammet. Med denna teknik hade Stockholm Vatten bland annat förhoppningen att pumpbarheten av överskottslammet skulle förbättras. En förbättrad pumpbarhet skulle medföra en optimering av slamavvattningen och därmed skulle det totala volymslamflödet till rötkamrarna kunna minska. Detta skulle öppna upp för möjligheter som att öka kapaciteten för behandling av externt organiskt material i rötkammarna eller att förlänga den hydrauliska uppehållstiden för en ökad metanproduktion. Eftersom överskottslammet eventuellt skulle komma att bli mer lättnedbrytbart tack vare behandlingen, förväntades även en acceleration av nedbrytningen samt en ökning av den specifika metanproduktionen från överskottslam i rötkamrarna på Henriksdal. Syftet med examensarbetet var att utvärdera den aktuella tekniken med avseende på dess fördelar och nackdelar. Graden av sönderdelning och effekten på den specifika metanpotentialen och viskositeten för överskottslam undersöktes. Slutligen beräknades en energibalans för att belysa metodens för- och nackdelar om den skulle appliceras på Henriksdals reningsverk. Resultaten visade att graden av disintegration för en centrifug utrustad med disintegrerande knivar i medel var 1,6 % för förtjockat överskottslam från Henriksdals reningsverk med torrsubstanshalter mellan 6-7 procent. Graden av disintegration från en centrifug utan disintegreringsutrustning var i medel 0,4 %. Behandlingen hade en positiv inverkan på viskositeten och pumpbarheten för överskottslammet. Om centrifugerna för slamavvattning optimeras till följd av detta skulle det totala slamflödet (överskottslam, primärslam och externt organiskt material) till rötkamrarna kunna reduceras med 5 procent. Det behandlade överskottslammet visade ingen ökning i specifik metanpotential, dock påverkades nedbrytningshastigheten av överskottslammet något. Effekten på biogasproduktionen från slammet i rötkamrarna vid Henriksdals reningsverk bedömdes bli marginell ifall den testade tekniken skulle användas i full skala. Den framtagna energibalansen visade att de möjliga vinsterna i energi som kan erhållas om tekniken appliceras på Henriksdals reningsverk är större än den energi som behöver sättas till eftersom värmebehovet minskar mer än vad elanvändningen ökar. Nyckelord: överskottslam, disintegration, biogasproduktion, specifik metanpotential, viskositet Institutionen för mikrobiologi, Sveriges lantbruksuniverstitet, Box 7025, SE-750 07 Uppsala ISSN 1401-5765

III
PREFACE This master thesis was done for Stockholm Water as a part of the project Biogasmax in cooperation with ITT Water and WasteWater and the Swedish Institute for Agricultural and Environmental Engineering (JTI). The master thesis is part of the M.Sc. in Aquatic and Environmental Engineering Programme at Uppsala University, and the thesis covers 20 Swedish academic credits, 30 ECTS. My supervisor at Stockholm Water was Ph. D. Daniel Hellström, Head of Development & Investment Wastewater Treatment Dept. The thesis has been reviewed by Ass. Prof. Anna Schnürer, Department of Microbiology at the Swedish University of Agricultural Sciences. I would like to thank Daniel Hellström for a well performed supervising and also Lena Jonsson and Eva Hagland at Stockholm Water for support regarding sampling, analyses at Henriksdal, current measurements and for taking the time to answer my questions. Thanks also to Johnny Ascue Contreras and Mikael Hansson at JTI for supervising and help regarding the batch laboratory tests, to Richard Holm for well performed viscosity measurements and valuable comments on my report, to Lysatec for permission to publish pictures from their homepage and Anna Schnürer for support in planning the practical part of the master thesis and for valuable comments on the report. I also want to thank Ronja Beijer for friendly support and company during the performance of the master thesis. Finally I would like to thank Stockholm Water for making it possible for me to perform this master thesis! Uppsala, April 2008 Anna Åkerlund Copyright © Anna Åkerlund and Department of Microbiology, Swedish University of Agricultural Sciences. UPTEC W 08 008, ISSN 1401-5765 Printed at the Department of Earth Sciences, Geotryckeriet, Uppsala University, Uppsala, 2008.

IV
POPULÄRVETENSKAPLIG SAMMANFATTNING Utvärdering av teknik för disintegration av överskottslam för ökad biogasproduktion Anna Åkerlund Stockholm Vatten deltar i projektet Biogasmax vars huvudsakliga mål är att minska användningen av fossilt bränsle för transporter i Europa genom att öka användningen och produktionen av biogas. Som ett led i arbetet inom projektet utvärderade Stockholm Vatten en teknik för sönderdelning av överskottslam vid Henriksdals reningsverk. Principen för behandlingen var mekanisk med knivar som roterade med en centrifug för slamavvattning och sönderdelade det förtjockade överskottslammet. Reningsprocessen vid Henriksdals reningsverk består av tre steg. Dessa steg utgörs av mekanisk, kemisk och biologisk rening. Det mekaniska reningssteget tar bort fasta partiklar från avloppsvattnet genom galler och sandfång. Järnsulfat används som fällningskemikalie i det kemiska steget och renar främst vattnet från fosforföreningar. Fällningen som bildas sedimeterar till botten i en så kallad försedimenteringsbassäng tillsammans med annat löst material som hinner sedimentera. Dekantet från försedimenteringen leds sedan in till den biologiska reningssteget där mikroorganismer renar vattnet från organiskt material och kväve. Mikroorganismerna tillväxer, samlas till klumpar och bildar ett så kallat aktivt slam som sedan sedimenterar till botten i en efterföljande bassäng. Innan vattnet från det biologiska reningssteget släpps ut i miljön passerar det genom ett filter av keramiskt grus och sand. Slammet som bildas i försedimenteringen kallas primärslam. Det mesta av det aktiva slammet från sedimenteringsbassängen återförs till det biologiska reningssteget för att behålla en hög halt av mikroorganismer i bassängen. Det som blir över kallas överskottslam och avvattnas i centrifuger innan det pumpas till rötkamrarna tillsammans med primärslammet. I rötkamrarna bearbetas det inkommande blandslammet i en syrefri miljö av mikroorganismer som omsätter det organiska materialet i slammet till biogas. I rötkamrarna vid Henriksdals reningsverk behandlas även en del organiskt avfall som tas in utifrån. Hur stor andel av det organiska materialet i slammet som bryts ner i rötkammaren beror på processparametrar som till exempel processtemperatur och karaktären av inkommande slam. Eftersom överskottslammet till stor del består av mikroorganismer är detta slam relativt svårnedbrytbart. Flertalet tekniker för sönderdelning av överskottslam har utvecklats för att göra överskott-slammet mer lättillgängligt för mikroorganismerna i rötkammaren, som i en syrefri miljö bryter ned slammet. På så sätt kan biogasproduktionen från överskottslammet öka och mängden slam som avfallsprodukt minskar. För närvarande finns mekaniska, termiska, kemiska, biologiska eller kombinerade metoder för sönderdelning av överskottslam. Med en mekanisk utrustning för sönderdelning av överskottslam kopplad till centrifugerna för slamavvattning hade Stockholm Vatten bland annat förhoppningen att pumpbarheten för det förtjockade överskottslammet skulle förbättras. Svårigheter med att pumpa slammet har tidigare satt gränser för till vilken grad slammet har kunnat förtjockas. Om pumbarheten förbättras, kan centrifugerna för slamavvattning optimeras och det totala slamflödet till rötkamrarna minskas. I och med detta frigörs volym i rötkamrarna som till exempel skulle kunna användas till att behandla en större mängd externt organiskt avfall för att öka produktionen av biogas. Eftersom överskottslammet eventuellt skulle komma att bli mer lättnedbrytbart tack vare behandlingen, förväntades även en ökning av biogasproduktionen från det behandlade överskottslammet i rötkamrarna vid Henriksdals reningsverk.

V
Syftet med examensarbetet var att utvärdera den aktuella tekniken med avseende på dess fördelar och nackdelar. Effekten på pumpbarhet och biogasproduktion för behandlat överskottslam undersöktes således. En energibalans beräknades därefter fram för att belysa metodens för- och nackdelar om den skulle appliceras på Henriksdals reningsverk. Resultaten visade att behandlingen hade en positiv inverkan på pumpbarheten för överskott-slam. Om centrifugerna för avvattning av överskottslam optimeras som en följd av detta skulle det totala slamflödet till rötkamrarna kunna reduceras med 5 % och volym frigöras i rötkamrarna. Vinster i form av ökad biogasproduktion skulle således kunna erhållas genom att en ökad mängd externt organiskt avfall kan behandlas i rötkamrarna. Resultaten visade dock även att behandlingen endast marginellt skulle kunna öka biogasproduktionen från överskottslam i rötkamrarna vid Henriksdals reningsverk. Den beräknade energibalansen visade ändå att de möjliga vinsterna i energi som kan erhållas om tekniken appliceras på Henriksdals reningsverk är större än den energi som behöver sättas till.

VI
GLOSSARY Batch digestion test substrate is added at the start of such a
test and the gas production from the substrate is followed over time. A batch test can give the specific gas potential for a substrate
Colloidal fraction of EAS particles between 0.45 and 4.4 µm Decanter centrifuge a centrifuge separating solids from
liquids by the principle of gravitational settling, but the process is accelerated by centrifugal forces
Degree of separation of suspended solids the degree of suspended solids
separated from the liquid phase by for example a decanter centrifuge
Differential speed the difference in speed between the
inner scroll conveyer, which transports the solids trough the centrifuge, and the speed of the drum. Consequently, the differential speed determines the residence time for the solids in the centrifuge and therefore also the degree of sludge dewatering
Disintegration split up/solubilisation Dissolved fraction of EAS particles less than 0.45 µm Activated sludge the biomass of microorganisms in the
biological treatment Extracellular polymeric substances substances actively secreted by bacteria
and organic and inorganic debris from the sewage sludge
Hydraulic retention time the average length of time for the
digester reactor volume to be fully exchanged, i.e. the average length of time that the sludge remains in the digester
Hydrolysis the first step in the biogas process chain
where complex substrates are broken down to more simple substrates by the action of different extracellular enzymes

VII
Inoculum digested sludge containing bacterial culture for anaerobic digestion
Laminar flow when a fluid flows in parallel layers.
Also known as streamline flow Lysis death of a cell by breaking the cellular
membrane Normal cubic meter unit for a gas volume at 0 oC and
atmospheric pressure Primary sludge precipitation from the primary
sedimentation tanks Reference centrifuge centrifuge without disintegrating device
for comparison Sludge age the average length of time that a sludge
particle remains in the bio tanks Specific gas production gas production in relation to one mass
unit of the substrate Turbulent flow random flow, the opposite of laminar
flow, often at high velocity flow Volatile solids organic material LIST OF ABBREVIATIONS COD chemical oxygen demand DOC dissolved organic content DR disintegration rate DRcol colloidal disintegration rate EAS excess activated sludge EPS extracellular polymeric substances JTI Swedish Institute for Agricultural and Environmental Engineering Nm3 Normal cubic meter NT non-thickened excess activated sludge RW reject water SGP specific gas production SS suspended solids TD thickened disintegrated excess activated sludge TOC total organic content TR thickened reference excess activated sludge TS total solids VS volatile solids WWTP waste water treatment plant

VIII
TABLE OF CONTENTS 1. INTRODUCTION................................................................................................................ 1
1.1. BACKGROUND......................................................................................................................................... 1 1.2. AIM AND DELIMITATIONS.................................................................................................................... 2
2. HENRIKSDAL WASTE WATER TREATMENT PLANT .......... .................................. 3
2.1. GENERAL DESCRIPTION OF THE PLANT AND DIGESTERS........................................................... 3 2.2. PROCESS DESCRIPTION......................................................................................................................... 3
2.2.1. The waste water treatment process ...................................................................................................... 3 2.2.2. The EAS thickening centrifuges.......................................................................................................... 4
3. THEORY............................................................................................................................... 6
3.1. MICROBIOLOGY IN EXCESS ACTIVATED SLUDGE AND IN AN ANAEROBIC DIGESTER....... 6 3.1.1. Excess activated sludge character........................................................................................................ 6 3.1.2. Bacterial cell lysis................................................................................................................................ 7 3.1.3. The biogas process............................................................................................................................... 8
3.2. ANALYSES FOR EVALUATION OF DISINTEGRATION TREATMENT EFFICIENCY ................... 9 3.2.1. Disintegrating performance ................................................................................................................. 9 3.2.2. Batch digestion tests .......................................................................................................................... 10 3.2.3. Indication of bacterial cell lysis ......................................................................................................... 10 3.2.4. Sludge viscosity................................................................................................................................. 11 3.2.5. Energy consumption .......................................................................................................................... 11
4. METHODS FOR EAS DISINTEGRATION................................................................... 12
4.1. MECHANICAL ........................................................................................................................................ 12 4.1.1. High pressure homogenizers.............................................................................................................. 12 4.1.2. Ultrasound ......................................................................................................................................... 12 4.1.3. Stirred ball mill .................................................................................................................................. 13 4.1.4. Disintegrating centrifuge ................................................................................................................... 13
4.2. THERMAL ............................................................................................................................................... 14 4.3. CHEMICAL.............................................................................................................................................. 14
4.3.1. Mineral acid/alkali addition............................................................................................................... 14 4.3.2. Ozone................................................................................................................................................. 14
4.4. BIOLOGICAL ..........................................................................................................................................15 4.5. COMBINED DISINTEGRATION METHODS....................................................................................... 15 4.6. BENEFITS AND DISADVANTAGES WITH EAS DISINTEGRATION METHODS.......................... 15
5. MATERIALS AND METHODS....................................................................................... 17
5.1. DISINTEGRATING EQUIPMENT ......................................................................................................... 17 5.2. PERFORMANCE OF DISINTEGRATING AND REFERENCE CENTRIFUGES................................ 18 5.3. DISINTEGRATING PERFORMANCE ................................................................................................... 18 5.4. ANALYTICAL METHODS AND SAMPLING ...................................................................................... 19
5.4.1. Chemical and physical analyses ........................................................................................................ 19 5.4.2. Batch laboratory digestion test .......................................................................................................... 20 5.4.3. Microscope study............................................................................................................................... 22 5.4.4. Viscosity............................................................................................................................................ 23

IX
6. RESULTS AND DISCUSSION......................................................................................... 24
6.1. PERFORMANCE OF DISINTEGRATING AND REFERENCE CENTRIFUGES................................ 24 6.2. DISINTEGRATING PERFORMANCE ................................................................................................... 25
6.2.1. Disintegration rate ............................................................................................................................. 25 6.2.2. Disintegration rate as a function of EAS retention time in disintegrating device.............................. 27
6.3. SPECIFIC GAS POTENTIAL.................................................................................................................. 27 6.3.1. Background biogas production .......................................................................................................... 27 6.3.2. Biogas production from disintegrated and reference EAS................................................................. 28 6.3.3. Disintegrated and reference EAS in mixture with primary sludge .................................................... 29
6.4. MICROSCOPE STUDY ........................................................................................................................... 30 6.4.1. Floc shape and size ............................................................................................................................ 30 6.4.2. Filament length.................................................................................................................................. 30 6.4.3. Floc compaction ................................................................................................................................ 31
6.5. VISCOSITY.............................................................................................................................................. 32 7. ENERGY BALANCE ........................................................................................................ 33
7.1. ENERGY CONSUMPTION..................................................................................................................... 33 7.2. EFFECT ON THICKENING AND ON TOTAL SLUDGE FLOW ......................................................... 34
7.2.1. Alt. 1: Increased capacity to treat external organic material.............................................................. 35 7.2.2. Alt. 2: Extension of the retention time in digesters ........................................................................... 36
7.3. LESS AMOUNT OF SLUDGE TO PUMP .............................................................................................. 37 7.4. ENERGY BALANCE SUMMARIZE ...................................................................................................... 37
8. CONCLUSIONS................................................................................................................. 39
REFERENCES....................................................................................................................... 40
APPENDIX 1. STOCKHOLM WATER LABORATORY ANALYSES ........................................................... 43
APPENDIX 2. RESULTS FROM COD ANALYSES ........................................................................................ 45
APPENDIX 3. CALCULATION OF BIOGAS VOLUME FROM PRESSURE MEASUREMENTS............... 46
APPENDIX 4. METHOD FOR METHANE ANALYSES ................................................................................. 48
APPENDIX 5. BIOGAS AND METHANE PRODUCTION IN THE BATCH DIGESTION TESTS .............. 49
APPENDIX 7. ON-LINE CURRENT MEASUREMENT .................................................................................. 53

1
1. INTRODUCTION
1.1. BACKGROUND Stockholm Water is participating in the project Biogasmax, partly financed by EU, which is run by seven city regions in Europe; Lille, Stockholm, Gothenburg, Rome, Berne, Torun and Zielona Góra. The main goal of the project is to decrease the use of fossil fuels for transports in Europe by an increase in the production and the use of biogas. In Stockholm, the demand of bio methane as a fuel is increasing and the supply of gas has become a limiting factor. The Biogasmax project aims at minimising problem correlated to a limited gas supply by giving opportunities for an increased production of bio methane and by expanding the numbers of gas filling stations (Biogasmax, 2008). In this project, one role for Stockholm Water is to develop strategies for an increased biogas production at the Stockholm Water wastewater treatment plant (WWTP) in Henriksdal. The aim is to show that the biogas production at Henriksdal WWTP can increase with 10 %. This increase will be achieved by process optimization, use of innovative methods or by adding external organic material to the digester (Vallin et al., 2008). As a step in this direction, Stockholm Water evaluated a technique for disintegration of excess activated sludge (EAS) at Henriksdal WWTP. Activated sludge is a sludge that forms in the biological treatment step in the wastewater treatment process and to some extent is difficult to degrade. Therefore, in recent years a wide range of disintegration techniques for EAS have been developed. In general, a disintegration treatment makes the sludge more easily accessible for degradation by microorganisms in the preceding anaerobic digestion process. This increase in degradation degree increases the biogas production in the digester and also reduces the final waste sludge mass. There are presently mechanical, thermal, chemical, biological or combined disintegration methods available. The disintegrating device evaluated by Stockholm Water was developed and produced by Lysatec, a company in the Czech Republic. This treatment principle is mechanical with knifes that are rotating with an EAS thickening centrifuge disintegrating the sludge. The equipment was tested on one of the thickening centrifuges at Henriksdal during an evaluation period of six months. With this technique, Stockholm Water was hoping that:
� The EAS viscosity would decrease and thereby the pumpability of the sludge would also be improved. In late 1999 Stockholm Water installed five centrifuges for dewatering EAS. The sludge going in to the centrifuges has a total solid (TS) content of approximately 0.5-1 %. Theoretically, the centrifuges have a capacity of dewatering the sludge to a TS content of 8 % at a load of 350 kg TS/h. However, Stockholm Water experienced great problems to reach this TS content of 8 %. This was likely due to the high viscosity of the sludge, which made it difficult to pump. The TS content in the dewatered EAS only reached in average 4.6 % during 2000-20051 (Vallin et al., 2008). By connecting the centrifuges with a disintegrating device, Stockholm Water hoped to increase the TS content of thickened EAS to 6-8 %. This would reduce the total sludge flow and increase the capacity to treat external organic material in the digesters resulting in an increased biogas production. A reduced sludge volume could alternatively be used for an extension
1 The registered TS content can be underestimated because of the daily samples were probably taken when the TS content in thickened EAS was as lowest.

2
of the hydraulic retention time in the digesters. This would allow more biogas to be produced from the substrates and reduce the amount of energy needed for heating the sludge.
� The specific methane production from the EAS in the digesters at Henriksdal WWTP would increase as the organic material would be more easily degradable. The hypothesis was that the biggest influence would be on the rate of degradation and not on the specific methane potential for the EAS.
� Problems with foam in the digesters would be prohibited. This was not the main reason for implementing the technique, but it was a benefit that might come when using this method. From time to time, Henriksdal WWTP has problems with foam in the digesters. This type of problem is not uncommon in anaerobic digesters treating EAS. It is caused by growth of the filamentous forming bacteria Microthrix parvicellae that floats up to the surface and form foam. These problematic bacteria grow in the activated sludge process especially at times when the sludge age is high. Therefore, EAS is likely the source to problems with foam in anaerobic digesters at WWTPs (Vallin et al., 2008). If the EAS passed through disintegrating knives, it was likely that the filaments would be affected.
This master thesis evaluated the above mentioned disintegration technique, in a partly full-scale study, by its benefits and disadvantages for treatment of EAS. The work was done for Stockholm Water as a part of the project Biogasmax in cooperation with ITT Water and WasteWater and the Swedish Institute for Agricultural and Environmental Engineering (JTI).
1.2. AIM AND DELIMITATIONS The aim was to evaluate the Lysatec disintegration technique by answering the following questions:
� What is the rate of sludge disintegration?
� How is the viscosity of EAS affected by the disintegration treatment? What will the effect be in the total sludge flow if the dewatering centrifuges for EAS are optimized?
� How is the specific gas production from EAS affected by the disintegration treatment? Will the disintegration of EAS affect the anaerobic degradation of primary sludge?
� How does the treatment affect the components in EAS, like flocs and bacterial cells?
� What energy balance will be obtained, if the disintegration technique is implemented full-scale at Henriksdal WWTP, considering energy input and output?
To be able to perform a comparable analysis, a literature study was performed to examine other available disintegration methods and their performance in full-scale applications.

3
2. HENRIKSDAL WASTE WATER TREATMENT PLANT
2.1. GENERAL DESCRIPTION OF THE PLANT AND DIGESTERS Henriksdal WWTP is located in Stockholm and is run by Stockholm Water. The main parts of the WWTP are situated in rock. Henriksdal WWTP is the biggest waste water treatment plant in Stockholm city and treats waste water from slightly less than 800 000 person equivalents. The mean flow rate at the plant is about 240 000 m3/day. Waste water from the central and southern parts of Stockholm and also from the municipalities Nacka, Tyresö, Haninge and Huddinge is treated at the plant. There are in total seven anaerobic digesters at Henriksdal WWTP with a total volume of 39 000 m3. Five of the digesters have a volume of 5000 m3 and two of them have a volume of 7000 m3, treating mainly primary sludge and EAS. The digesters are all under ground level and are continuously supplied with substrate from the bottom of the tanks. Digested material is then brimming over at the top. The hydraulic retention time in the digesters is approximately 20 days (Stockholm Water, 2008; Vallin et al, 2008).
2.2. PROCESS DESCRIPTION
2.2.1. The waste water treatment process There are mainly three steps in the wastewater treatment process at Henriksdal. The steps are mechanical, chemical and biological (Fig. 1). The process description in this chapter is based on the Biogasmax report by Vallin et al. (2008).
Figure 1. An overview of the process at Henriksdal WWTP (Vallin et al, 2008). The mechanical step removes firm pollutions from the incoming waste water by screens and a grit chamber. The screens remove the biggest pollutions, like for example rags. The following grit chamber removes particles with a diameter greater than 0.15 mm, which represents pollutions like sand, seeds and coffee grounds.

4
Ferrous sulphate, used for chemical precipitation, is added in the pre aeration tanks. By this step mainly phosphorus compounds are removed from the water. Also, some suspended and organic materials precipitate and sediment with the flocs in the primary sedimentation tanks (Fig. 1). The precipitation that accumulates at the bottom, called primary sludge, is pumped into the anaerobic digesters. In the biological step, organic material and nitrogen are removed from the incoming water with the help of microorganisms in the bio tanks. The biomass of these organisms form a sludge called activated sludge. In the secondary sedimentation tank the activated sludge is allowed to sediment to the bottom. Most of the sludge is then pumped back into the bio tanks to keep a high amount of microorganisms. The excess activated sludge (EAS) is dewatered in centrifuges and pumped into the anaerobic digesters. Before the water from the biological step is let out in the recipient, the water passes through a filter filled with ceramic gravel and sand. In the digesters, primary sludge, excess activated sludge and also some external organic material are treated. During the year of 2005, 66 % of the total volatile solids, i.e. organic material, in the digester originated from primary sludge, 20 % from EAS and 14 % from externally added organic material. The digested sludge from the digester is dewatered by centrifuges and with polymer addition. The dewatered sludge is then used as deposit cover and as soil conditioner. The produced biogas is mainly upgraded to vehicle gas and sold, but is also used as fuel for the WWTPs central heating furnace and electricity production.
2.2.2. The EAS thickening centrifuges The EAS flow from the bio basins is equally divided over five decanter centrifuges (Alfa Laval NX 4500; Fig. 2).
Figure 2. Process schedule over EAS thickening centrifuges. EOM: external organic material. Each centrifuge has a capacity of dewatering EAS to a TS content of 8 % at a load of 350 kg TS/h. The input EAS flow to each centrifuge is approximately 30 m3/h, the rotating speed of the centrifuges is 2900 rpm and the level of thickening is adjusted by varying the differential speed for the centrifuges. The differential speed is the difference in speed between the inner

5
scroll conveyer, which transports the solids trough the centrifuge, and the speed of the drum. Consequently, the differential speed determines the residence time for the solids in the centrifuge and therefore also the degree of dewatering. The disintegrating equipment investigated in this study was mounted on thickening centrifuge number one (disintegrating centrifuge). Centrifuge number two was used as a comparable reference (reference centrifuge).

6
3. THEORY
3.1. MICROBIOLOGY IN EXCESS ACTIVATED SLUDGE AND IN AN ANAEROBIC DIGESTER
3.1.1. Excess activated sludge character Excess activated sludge consists to a large extent of microorganisms. The suspended substances, coming from the pre sedimentation step, are assimilated and metabolised by microorganisms in the activated sludge process (Vallin et al., 2008). In this step, the microorganisms accumulate and form flocs. A floc, filament and bacteria in EAS, are illustrated in the microscope picture below (Fig. 3).
Figure 3. Microscopic view of EAS from Henriksdal WWTP. Photo: the author. A single bacterium is too small to be seen in detail in a microscope picture like the one above. A bacterium can be 0.3 µm as smallest (Juhlin, 2008), and is therefore only seen as a small dot in the microscope. However, by studying EAS through a microscope, it is possible to observe flocs, filaments and microorganisms. The flocs consist of components like bacteria aggregates, single bacteria, filamentous forming bacteria, cell debris, organic fibres and inorganic particles (Wawrzynczyk, 2007). The filaments are acting as a skeleton in the floc structure (Juhlin, 2008). Microthrix parvicellae is a common filamentous forming bacterium in WWTP. It has a diameter of 0.5 µm and a normal length of 200-400 µm (Bogh, 2002). The components in the floc are held together by extracellular polymeric substances (EPS) in cooperation with multivalent cations, hydrophobic interaction and hydrogen bonds. The EPS are built up by active secretions of bacteria and by organic and inorganic debris from the sewage sludge (Wawrzynczyk, 2007). EPS consist mainly of complex carbohydrates, proteins and long chain hydrocarbons (Gary et al., 2007). Because of the cellular structure and the presence of EPS in the sludge, the EAS is relatively difficult to degrade. As a consequence, the biogas production from EAS is relatively low. In

7
comparison, primary sludge is easier to bio-degrade, as it typically consists of more easily digestible carbohydrates and fats (Gary et al., 2007).
3.1.2. Bacterial cell lysis According to earlier studies, the disintegration of EAS by a disintegrating centrifuge causes floc destruction and reduction of particle size. This reduction in particle size gives comparable larger surface areas in relation to the particle volume. Therefore, the hydrolysis of the sludge in the preceding anaerobic digestion process is enhanced. This leads to an accelerated degradation of the EAS (Zábranská et al., 2006). Also, previous studies suggest that the disintegrating centrifuge, besides breaking of flocs, causes lysis of bacterial cells (Dohányos et al., 2000; Zábranská et al., 2006). Also the ultrasound disintegration technique has shown to cause bacterial cell lysis (Zhang et al., 2007; Wang et al., 2006). In general, a high energy input is needed for disruption of bacterial cell walls, while a lower energy input only gives reduction in the sludge floc size (Hultman & Levlin, 2003). When the content of bacterial cells is released to the fluid phase in the EAS, the bacterial material becomes much more easily degradable in the preceding anaerobic digestion. In addition, enzymes are released to the fluid phase and may act as a catalyser for the degradation process in the anaerobic digestion process (Dohányos et al., 2000). Enzymes are used by the bacteria for their degradation of substrates and are proteinaceous molecules with the ability of catalyzing different biochemical reactions. There are two groups of enzymes involved in the degradation process; endoenzymes and exoenzymes (Gerardi, 2003).
Figure 4. Enzymes in a bacterial cell (Gerardi, 2003). Endoenzymes are produced within the cell and degrade soluble substrates that have entered the cell. Exoenzymes are also produced within the cell but are then excreted out through the exocellular slime to meet the insoluble substrate that is attached to the slime on the outside of the cell (Fig. 4). When the exoenzymes get in contact with the substrate, it solubilizes the substrate, which then can be taken up by the cell and fully degraded by endoenzymes (Gerardi, 2003). When the content of bacterial cells is released due to cell disruption, it contains enzymes with still some remaining activity (Dohányos et al., 2000).

8
3.1.3. The biogas process The substrates that are fed in to the anaerobic digester are degraded in several steps by different groups of microorganisms (Fig. 5). The final product in the process is biogas, consisting of mainly methane and carbon dioxide. Different substrates can give different methane content in the biogas. A high content of methane is desirable as this is the energy rich compound in biogas. The amount of substrates degraded in a biogas process depends on process parameters such as hydraulic retention time, organic loading rate and temperature but also on the character of ingoing organic material. The hydraulic retention time represent the average length of time for the digester reactor volume to be fully exchanged, i.e. the average length of time that the sludge remains in the digester (Gerardi, 2003). At Henriksdal WWTP approximately 50 % of the volatile solids, i.e. the organic material, fed in to the digesters are degraded and converted to biogas (Vallin et al., 2008).
Figure 5. The anaerobic digestion steps (Gerardi, 2003). In the first step of the anaerobic degradation complex substrates such as proteins, carbohydrates and lipids are broken down to more simple substrates like amino acids, sugars and fatty acids. During hydrolysis, different compounds are cleaved into smaller units by the action of exoenzymes, excreted by hydrolytic bacteria. When the in-going material contains a high fraction of cellulose, the hydrolysis is the most rate-limited step for the degradation process chain. Some proteins are also degraded rather slowly in this step (Gerardi, 2003). The

9
degradation of complex EAS is also, due to this first step in the degradation chain, very slow (Pérez-Elvira et al., 2006). The products from the hydrolysis step are in the next reaction step degraded by a large variety of different bacteria through different fermentation processes. These reactions results in the main products carbon dioxide, hydrogen gas, different organic acids and alcohols (Gerardi, 2003). Acetate, hydrogen gas and carbon dioxide produced during the fermentation step can be directly transformed to methane, while other acids and alcohols first must undergo a further degradation step, the so called anaerobic oxidation. This step is performed by specific bacteria specialized for this degradations. The anaerobic oxidation results in the main products acetate, hydrogen gas and carbon dioxide. The anaerobic oxidation will only take place if the hydrogen gas pressure in kept low in the process. The hydrogen gas pressure will be low due to the methanogens, consuming hydrogen gas while producing methane. This cooperation between the two groups of microorganisms is called syntrofi, and is crucial for the degradation process to proceed. If the methanogens activity is disturbed, the hydrogen gas pressure will increase and the anaerobic oxidation reactions will not proceed. As a consequence accumulation of organic acids will occur and the pH in the process will finally decrease, which will inhibit the methanogens even more. In the worst case, the whole anaerobic degradation process will stop (Jarvis, 2004). The last step in the biogas process is the methanogenesis. Methane is here produced from mainly acetate, carbon dioxide and hydrogen gas. There are two main groups of methane forming microorganisms. One group is called the hydrogenotrophic methanogens and converts hydrogen gas and carbon dioxide to methane. The other group is called the acetotrophic methanogens and splits acetate to methane and carbon dioxide. (Gerardi, 2003) In general, the methanogens are a very sensitive group of microorganisms. They are sensitive to low pH levels, heavy metals, organic pollutants, ammonia and even small amounts of oxygen. The methanogens grow very slowly and in order to avoid wash out of these organisms the hydraulic retention time must not be to short (Jarvis, 2004). To avoid disturbances and obtain optimal degradation efficiency, as well as biogas production, conditions allowing all microorganisms to grow must be fulfilled (Jarvis, 2004).
3.2. ANALYSES FOR EVALUATION OF DISINTEGRATION TREA TMENT EFFICIENCY
3.2.1. Disintegrating performance The chemical oxygen demand (COD) method can be used to measure the organic content of sludge or a waste water sample and is widely used for the determination of disintegration rates for different disintegration methods. The method measures the amount of oxygen necessary for a complete oxidation of the organic material in the sample. A so called chemical oxidizer is used for the analysis and the COD is expressed as mg O2/L (Borggren, 2007). The disintegration rate is expressed as the increase of organic material in the dissolved phase of EAS due to treatment, in relation to overall organic material in the sludge. The disintegration rate is consequently the grade of solubilisation of organic matter. Equation 1 describes the calculation of the disintegration rate after treatment of EAS.
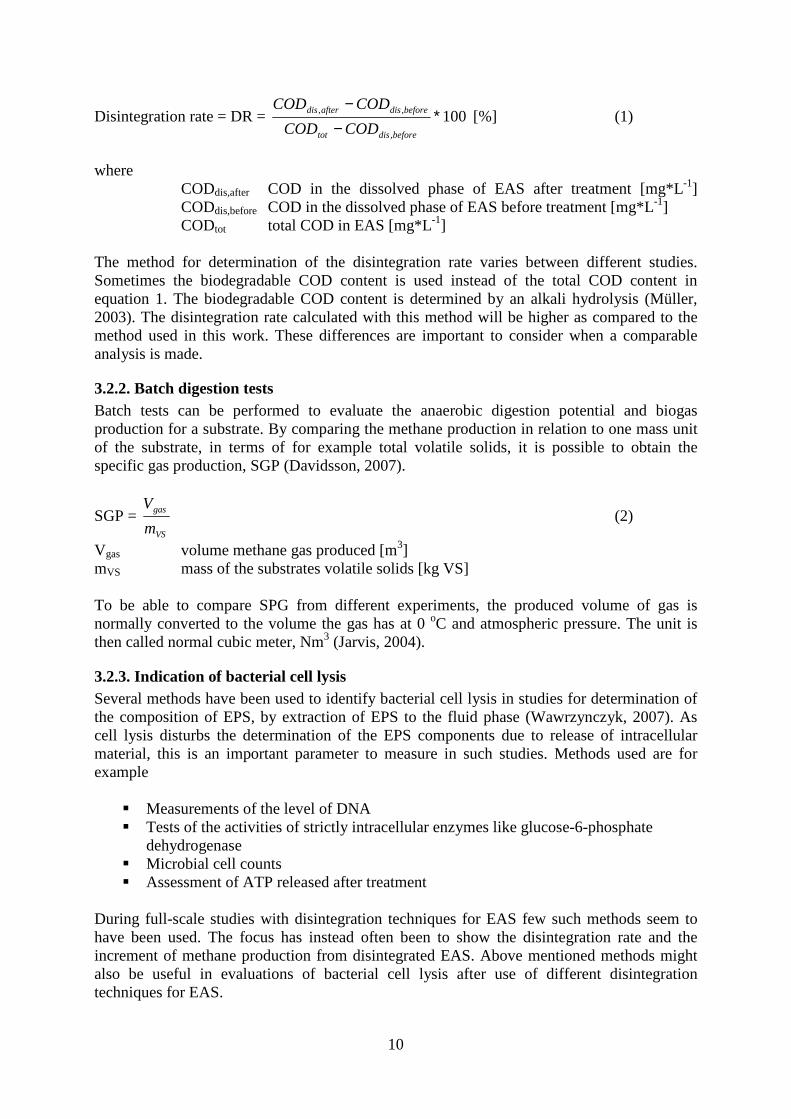
10
Disintegration rate = DR = 100,
,, ∗−
−
beforedistot
beforedisafterdis
CODCOD
CODCOD [%] (1)
where
CODdis,after COD in the dissolved phase of EAS after treatment [mg*L-1] CODdis,before COD in the dissolved phase of EAS before treatment [mg*L -1] CODtot total COD in EAS [mg*L-1]
The method for determination of the disintegration rate varies between different studies. Sometimes the biodegradable COD content is used instead of the total COD content in equation 1. The biodegradable COD content is determined by an alkali hydrolysis (Müller, 2003). The disintegration rate calculated with this method will be higher as compared to the method used in this work. These differences are important to consider when a comparable analysis is made.
3.2.2. Batch digestion tests Batch tests can be performed to evaluate the anaerobic digestion potential and biogas production for a substrate. By comparing the methane production in relation to one mass unit of the substrate, in terms of for example total volatile solids, it is possible to obtain the specific gas production, SGP (Davidsson, 2007).
SGP = VS
gas
m
V (2)
Vgas volume methane gas produced [m3] mVS mass of the substrates volatile solids [kg VS] To be able to compare SPG from different experiments, the produced volume of gas is normally converted to the volume the gas has at 0 oC and atmospheric pressure. The unit is then called normal cubic meter, Nm3 (Jarvis, 2004).
3.2.3. Indication of bacterial cell lysis Several methods have been used to identify bacterial cell lysis in studies for determination of the composition of EPS, by extraction of EPS to the fluid phase (Wawrzynczyk, 2007). As cell lysis disturbs the determination of the EPS components due to release of intracellular material, this is an important parameter to measure in such studies. Methods used are for example
� Measurements of the level of DNA � Tests of the activities of strictly intracellular enzymes like glucose-6-phosphate
dehydrogenase � Microbial cell counts � Assessment of ATP released after treatment
During full-scale studies with disintegration techniques for EAS few such methods seem to have been used. The focus has instead often been to show the disintegration rate and the increment of methane production from disintegrated EAS. Above mentioned methods might also be useful in evaluations of bacterial cell lysis after use of different disintegration techniques for EAS.

11
However, in recent years some studies have been done to evaluate the effect of ultrasound treatment on bacterial cells in the sludge (Zhang et al., 2007; Wang et al., 2006). Analyses of DNA concentration and protein content in laboratory studies have shown that concentration of both compounds increased significantly after an ultrasound treatment. These results indicated that bacterial cell lysis had occurred. Studies of the appearance of bacterial cell lysis in full-scale applications of disintegration techniques have, to my knowledge, not been performed. In this work, because of limited time, an analysis of the disintegrating centrifuges ability to cause bacterial cell lysis was not performed.
3.2.4. Sludge viscosity As disintegration causes changes in the structure of EAS, the sludge viscosity will be affected. Therefore, measurements of sludge viscosity are often one way of evaluating the efficiency of a disintegration technique. A decrease in viscosity is desirable as the pumpability of EAS consequently will be improved. In the context of EAS viscosity, the fundamental concept of rheology is central. Rheology is the study of the deformation and flow of matter under the influence of an applied stress, which might be for exampel shear stress. Rheology dealing with shear stress is called shear rheology (Dr. Richard Holm, private communication, 2008). The theory for rheological characterization of EAS is further described by Holm (2008).
3.2.5. Energy consumption Electrical consumption is an important parameter to measure in a disintegration technique evaluation. In the case of a disintegrating centrifuge, the kinetic energy provided by the centrifuge is used for its operation. The friction of the sludge against the rotating knives causes higher total energy consumption for the centrifuge and its operation. In chapter 4 the energy consumption for different disintegration techniques in full-scale applications are presented.

12
4. METHODS FOR EAS DISINTEGRATION Due to the environmental and economical consequences that follow the handling of waste sludge from WWTP, there have been several techniques developed for reduction of the final waste sludge mass. The target can be reached by interference in one of three different stages in the waste water treatment process; in the water line, in the sludge line or in the final waste line (Pérez-Elvira et al., 2006). In this work the second strategy is the one of most interest: methods in the sludge line. The present disintegration techniques for EAS are mechanical, thermal, chemical, biological or combined and will be described more closely in this chapter. Although reduction of the final waste sludge mass is a direct consequent of the treatments, it is not always the main purpose for implementing them. The purposes are often to further increase the biogas production or improve the ability to pump EAS etc. In the following summary, some results from full-scale applications are presented.
4.1. MECHANICAL
4.1.1. High pressure homogenizers High pressure homogenizers have units that consist of a multistep high-pressure pump together with a homogenizing valve. The pump compress the EAS with pressures of several hundreds of bar. When the EAS passes trough the homogenizing valve, the pressure drop drastically and high turbulence, shear forces and acceleration occur. The cavitation bubbles formed implode and induces temperatures of several hundreds degrees of celcius. These factors together cause disintegration of the cells in the EAS (Pérez-Elvira et al., 2006). The method has shown very promising results in lab scale. However, the method has not been used with satisfactory results in full-scale applications and long term operational conditions (Hultman and Levlin, 2003). Käppala WWTP in Sweden has tried a pressure homogenizer in a full-scale application for treatment of EAS, for an increased biogas production and to prohibit problems with foam in the digester. The pressure for compression of the EAS was relative low, 10-12 bar, and the specific energy input was 3 kWh/m3 sludge, i.e. 0.08-0.21 kWh/kg TS. The treatment increased the content of organic material in the dissolved phase by 10-130 % and the rate of EAS degradation was found to be accelerated in a batch laboratory test. However, the achieved effect on the gas production from EAS and reduction in length of problematic Microthrix bacteria due to the disintegration device was not as good as expected. The full-scale digester was foaming despite the fact that the filaments were shortened by the treatment (Sundin, 2006). Another option is to use the high pressure homogenizers in combination with a chemical treatment, see chapter 4.5.
4.1.2. Ultrasound Ultrasound treatment is a well-known method that is based on ultrasound waves that causes periodic compression and attenuation of the medium. The ultrasound wave’s frequencies range from 20 kHz and higher. Cavitation gas bubbles formed are growing and collapse in a few microseconds. The collapse causes strongly hydromechanical shear forces in the medium around the bubble. The shear forces disrupt the substrates in the surroundings of the bubble and causes disintegration of the sludge. The cavitation bubbles receive temperatures and pressures of up to 5000 K and hundreds of atmospheres (Tiehm et al., 2001). A lot of studies have been done to evaluate the ultra sound disintegration technique. Several WWTP around Europe have implemented the method in their process (Wolff et al., 2007). Full-scale studies have been done for example in WWTPs in Sweden and Germany (Dåverhög & Balmér, 2008; Wolff et al. 2007).

13
The results from the ultrasound full-scale applications vary. The study in Sweden suggests that the increase in biogas production and in sludge reduction due to the ultrasound treatment of EAS was marginal. An energy input of 0.3-0.5 kWh/kg TS gave a disintegration rate of approximately 3 % at one WWTP. An energy input of 0.04-0.07 kWh/kg TS at another WWTP gave a disintegration rate of approximately 1 %. The investment and operational costs were found to be high. Therefore, the method was found to be cost effective only if the sludge disposal costs are very high. However, during the evaluation period the ultrasound technique showed a positive effect in prohibiting foam in a full-scale digester, at a plant that normally has such problems (Dåverhög & Balmér, 2008). On the other hand, some studies show very promising result for the ultrasound technique considering biogas production. Wolff et al. (2007) considered the ultrasound treatment technique for EAS to be cost effective even though the disposal costs in the actual case were low. The pay back time for the equipment was calculated to be approximately three years. The energy input was 0.044 kWh/kg TS. Since the volatile solid degree of degradation increased from 34 % to 45 %, the improvement in digester performance was 32 %. For the studies in Sweden and Germany (Dåverhög & Balmér, 2008; Wolff et al. 2007), the energy input was approximately the same. Possibly, the construction performance of the ultrasound equipment has influence of the disintegrating performance.
4.1.3. Stirred ball mill Stirred ball mills disintegrate the EAS mainly by shear forces. The equipment consists of a cylindrical chamber which is packed with several grinding beads. The grinding beads are forced into a circular movement by a rotor (Pérez-Elvira et al., 2006). Full-scale studies have been done in Germany. The result at one German WWTP showed a high rate of disintegration for the stirred ball mill, approximately 23 %2 (Müller et al., 2004). The energy input in this study was approximately 21 kWh/m3 EAS. At another German WWTP, the biogas production and the degree of degradation increased by approximately 20 % (Winter, 2002). However, in both studies, the disintegration method was considered to be cost effective only if the waste sludge disposal costs are high.
4.1.4. Disintegrating centrifuge The disintegrating centrifuge disrupt the thickened EAS by knifes rotating with the thickening centrifuge. The equipment will be further described in chapter 5.1. Full-scale studies have been done at WWTPs in Czech Republic and in Germany (Zábranska et al., 2006; Dohanyos et al., 2004; Müller et al., 2004). The results from the full-scale studies varied. In one German WWTP, a disintegration rate for EAS of approximately 5 %3 was achieved. The energy input was here approximately 12 kWh/m3 EAS (Müller et al., 2004). Results from three other WWTPs showed higher disintegration rates for EAS, between 9 and 17.9 %. At these three WWTPs and one further, the biogas production was also evaluated in full-scale digesters. The results showed an increase in the total specific biogas production between 7.5 and 26 % (Dohanyos et al., 2004; Zábranska et al., 2006).
2 The increase of dissolved COD is related to the biodegradable COD content of EAS determined by an alkali hydrolysis (see chapter 3.2.1). 3 See footnote 2 above.

14
In an earlier stage, EAS from Henriksdal was disintegrated and the specific gas potential was analyzed in a laboratory study (Lysatec, 2004). EAS was disintegrated with a laboratory disintegrator giving a disintegration rate of 8.1 %. Laboratory digestion tests were then performed with EAS (treated and untreated) and with EAS mixed with primary sludge. The primary sludge was also collected from Henriksdal WWTP. The specific biogas production from EAS was found to increase with 10.5 % after the disintegration. The increase from the mixture of EAS and primary sludge was 12.3 %. Thus, the disintegrated EAS seemed to have a stimulating effect on the degradation of primary sludge at Henriksdal WWTP. A benefit from using the disintegrating centrifuge technique is that the investment cost is relative low compared to other methods, assumed that the thickening centrifuge already is in place (Müller et al., 2004).
4.2. THERMAL Thermal hydrolysis destroys the cell walls and releases intracellular substances so that it becomes easily accessible for degradation. For optimal results the temperature should lie somewhere in between 160 and 180 oC. Above this temperature, formations of non-biodegradable compounds occur (Pérez-Elvira et al., 2006). Full-scale studies have been made in Denmark, Norway and the United Kingdom (Kepp & Solheim, 2001; Weisz et al., 2000). The method has shown to cause high rate of EAS disintegration, between 20-50 % depending on the temperature (Kepp & Solheim, 2001). Thermal treatment is considered to be the best method for sludge disinfection and it reduces the final waste sludge mass considerably (Pérez-Elvira et al., 2006). Therefore, this method is suitable in countries with strong regulations concerning the hygienic status of the sludge and concerning disposal costs. The method has also proven to be economic in many situations (Weisz et al., 2000).
4.3. CHEMICAL
4.3.1. Mineral acid/alkali addition Addition of strong mineral acids or alkali to the sludge can be used for disintegration of organic compounds and for solubilisation of microbial cells. The use of alkaline addition is more common than the use of acids. In the alkaline treatment process, the pH is increased to about 12 and kept at this high pH level for approximately 24 hours. Lipids, hydrocarbons and proteins are at this pH hydrolyzed to smaller soluble compounds. The alkaline process shows a high rate of disintegration, but it should be noted that not all of the soluble compounds formed are possible to degrade (Pérez-Elvira et al., 2006). A full-scale study has been done in combination with the high pressure homogenizer technique (Gary et al. 2007; se also chapter 4.5.).
4.3.2. Ozone Ozone treatment oxidizes and hydrolyzes organic matter. The ozone reacts with hardly degradable compounds and oxidizes them in to smaller compounds that are easier to degrade (Pérez-Elvira et al., 2006). A full scale study showed that the disintegration rate for EAS was very high, approximately 35 %4. The energy input was approximately 49 kWh/m3 EAS and the treatment was found to be cost effective only if the disposal costs are high (Müller et al., 2004).
4 The increase of dissolved COD is related to the biodegradable COD content of EAS determined by an alkali hydrolysis (see chapter 3.2.1).

15
4.4. BIOLOGICAL The method is based on enzyme activity that is catalyzing the degradation of sludge. The enzymes are either produced internally by autolysis or externally (Pérez-Elvira et al., 2006). Research concerning enzymatic treatment of wastewater sludge is presently ongoing by Wawrzynczyk (2007). At the time of writing, this method is also examined in lab scale at Henriksdal WWTP within the project Biogasmax (Beijer, 2008).
4.5. COMBINED DISINTEGRATION METHODS The biological disintegration method can successfully be used in combination with physical disintegration methods that increase the surface area in proportion to the particle volume. It then gives the enzymes better accessibility to the substrate. A laboratory study shows that a combination of ultra sound and enzymatic treatment resulted in higher the amounts of methane produced as compared to the summary of gas produced from the separated treatments (Davidsson, 2007). The MicroSludge process is a patented disintegration process that combines the alkaline and high pressure homogenizer techniques. A full scale study with this method was done in Los Angeles County by Gary et al. (2007). In this study, the disintegration resulted in a reduction of the viscosity of EAS by approximately 90 %. Furthermore, as the concentration of dissolved COD was 100 times higher in treated EAS compared to unprocessed EAS, the rate of disintegration was high. The degree of degradation in a full scale digester also improved with 6 %. Despite that, the amount of gas produced showed no increase during the test period. The energy input was 36 kWh/m3 EAS and the method at the actual WWTP was considered cost ineffective due to the high energy input needed and high investment and operational costs. A microscope study showed that filamentous organisms were broken into smaller fragments due to the treatment. However, as shown by Sundin (2006) this does not necessarily reduce problems with foam in digesters.
4.6. BENEFITS AND DISADVANTAGES WITH EAS DISINTEGRA TION METHODS The disintegration methods for EAS in full-scale applications have shown positive effects in the degree of degradation, biogas production, reduction of the final waste sludge mass and in EAS viscosity. Results also show that mechanical disintegration techniques shorten problematic filamentous bacteria in the EAS, but it is unclear if this observation is sufficient for judging if problems with foam in digesters can be prevented. To prevent the filaments from, after the treatment, growing large again the filaments likely not only need to be shortened but also lysed. Cost factors when implementing the disintegration techniques are: the energy input, operation and investment. In general, the effect of a mechanical disintegration technique is improved at higher energy inputs (Hultman and Levlin, 2003). Often also the disintegration techniques have been considered to be cost effective only if the disposal costs are high. The concentration of COD, phosphorus and nitrogen compounds in the sludge fluid suspension increases due to the enhanced degradation of biosolids. Such an increase might cause high unwanted concentrations of nitrogen and phosphorus in the reject water from the dewatering of the digested sludge. The increment of COD in the reject water is relatively small as compared to the total load of COD on the plant and can therefore be neglected. If the phosphorus and nitrogen polluted water is returned to the inlet of the waste water treatment process, the load on the process will be higher. However, in most of the studies that have been

16
performed, only very small increments of phosphorus compounds have been found. In a full-scale study the ammonia concentration in the reject water increased with 5-16 %, depending on disintegration method used (Müller et al., 2004). Due to the increased number of small particles caused by the disintegration of the EAS, a higher polymer demand at the dewatering centrifuges for digested sludge is needed. This is because the total surface area of the sludge particles has increased. Therefore, more polymers are needed to neutralize the surface charge (Zábranská et al., 2006). On the other hand, due to an improved degradation process, less sludge mass needs to be treated with polymer. In a full-scale study the increase in polymer demand was between 6 and 28 %, depending on pre-treatment method (Müller et al, 2004).

17
5. MATERIALS AND METHODS
5.1. DISINTEGRATING EQUIPMENT The disintegrating device is assembled at the end of the centrifuge and the sludge that passes through the equipment becomes thickened by the centrifuge. The device consists of one stationary part and four rotating parts (Fig. 6). The stationary part is a chamber with destructive prisms, making a labyrinth for the passing EAS during the disintegration. The chamber, made of stainless steel and partially of Hardox 500, is constructed to capture the whole production of thickened sludge. The rotating parts hold one 96 mm long knife each, i.e. there are four knives, which are placed with 90 degrees intervals between each other and are rotating inside the chamber. The knives are made of tool steel and fixed in a special socket. The sockets with the knives are mounted onto the outlet section of the centrifuge. All sensitive parts in the disintegration device are hard top protected. The sludge retention time in the disintegration equipment can be adjusted at the time of installation, but a higher retention time also means higher energy consumption (Kutil Josef, private communication, 2008).
Figure 6. Principal figure of the disintegrating device, mounted on a thickening centrifuge. The picture was obtained from Lysatec homepage and published with permission from Lysatec.
Figure 7. The disintegrating equipment partly mounted on centrifuge number 1 at Henriksdal WWTP. Photo: Stockholm Water.
Stationary part: chamber with prisms
Rotating part: special socket with knife

18
5.2. PERFORMANCE OF DISINTEGRATING AND REFERENCE CE NTRIFUGES To ensure that the disintegrating and reference centrifuges performed equally, reject water samples were taken from both centrifuges. As the disintegrating device was assembled at the end of the centrifuge, where the sludge already was dewatered, the reject water quality was not affected. In order to compare the performance of the two centrifuges, the degree of separation of suspended solids was calculated. Analyses of suspended solids were performed on both centrifuge reject water and of the TS content of thickened EAS. In the calculations, suspended solids in thickened EAS were approximated to equal the TS content. The analysis data is presented in appendix 1.
5.3. DISINTEGRATING PERFORMANCE To get information about the actual performance of the disintegrating centrifuge, different fractions in the sludge was analysed. The CODtot content in the sludge was divided into three fractions based on particle size. These fractions were suspended COD (CODss), colloidal COD (CODcol) and CODdis. The fractions had the following divisions, based on particle size (Elmitwalli et al, 2000) CODss > 4.4 µm (3) 0.45 µm < CODcol < 4.4 µm (4) CODdis < 0.45 µm (5) For most disintegration methods, the concentration of CODtot after treatment equals CODtot before. However, this is not the case for a disintegrating centrifuge that also simultaneously dewaters the sludge. Therefore, the disintegration rates for the disintegrating and reference centrifuges were calculated with CODtot measured in thickened EAS (Equation 1, page 9). In addition to the calculation of the disintegration rate based on the increase of dissolved COD, also the same calculation was made based on the increase of colloidal COD (Equation 7-8).
Colloidal disintegration rate = DRcol = 100,,
,, ∗−−
beforecolaftertot
beforecolaftercol
CODCOD
CODCOD [%] (7)
CODcol = CODf - CODdis (8) CODf was the result of a COD analysis of sludge filtered trough a filter with a poor size of 4.4 µm. Methods for COD analyses and sampling are described in the following chapter (5.4.). By comparing the disintegration rates for a disintegrating and a reference centrifuge, information was obtained concerning the disintegrating performance of the treatment equipment.

19
5.4. ANALYTICAL METHODS AND SAMPLING
5.4.1. Chemical and physical analyses Laboratory analyses were performed by the author, at Henriksdal WWTP, and by personal at Stockholm Water Laboratory. For the evaluation of the disintegrating performance, samples were taken at 9 occasions in the period between 17th October and 13th November 2007 (Table 2). During this period, the operational parameters for the disintegrating and reference centrifuge were kept equal and constant (speed: 2900 rpm, differential speed: 10 rpm). Samples were taken of non-thickened, thickened disintegrated and reference EAS. At five of the sampling occasions, also reject water samples from the two centrifuges were taken and analysed as daily mean values. Table 2. Samples taken and parameters analysed at the different sampling occasions. NT: non-thickened EAS, TD: thickened disintegrated EAS, TR: thickened reference EAS. RW: reject water. COD: chemical oxygen demand, TOC: total organic carbon, DOC: dissolved organic carbon, TS: total solid content, VS: volatile solid content, SS: suspended solids. SW lab: Stockholm Water laboratory Date Time Samples Parameters analysed Analysis by 2007-10-17 09:15 AM NT, TD, TR COD, TS The author
2007-10-22 08:15 AM NT, TD, TR COD, TS The author
2007-10-22 01:45 PM NT, TD, TR COD, TS The author
NT, TD, TR COD, TOC, DOC, TS, VS
2007-10-23 08:15 AM
RW SS, TOC, DOC
SW lab
2007-10-25 09:15 AM NT, TD, TR COD, TS The author
NT, TD, TR COD, TOC, DOC, TS, VS
2007-11-05 08:30 AM
RW SS, TOC, DOC
SW lab
NT, TD, TR COD, TOC, DOC, TS, VS
2007-11-05 01:00 PM
RW SS, TOC, DOC
SW lab
NT, TD, TR COD, TOC, DOC, TS, VS
2007-11-13 08:00 AM
RW SS, TOC, DOC
SW lab
NT, TD, TR COD, TOC, DOC, TS, VS
2007-11-13 01:00 PM
RW SS, TOC, DOC
SW lab
The COD and DOC/TOC were determined in the sludge samples according to table 3 below. The COD analyses at Henriksdal WWTP were determined with Lange COD cuvette tests (Table 4). TS content was determined by drying of the samples at 105 oC oven over night. After cooling of the samples in an excicator the samples were weighted and material still left after drying were considered as TS. Table 5 shows the parameters analysed by Stockholm Water laboratory and the analysis methods used.

20
Table 3. The different sludge samples and the sludge fractions analysed for each sludge by means of COD and DOC/TOC. Sludge sample Particle size fraction EAS
Disintegrated thickened EAS
Reference thickened EAS
total
colloidal
0.45 µm – 4.4 µm
dissolved < 0.45 µm
Table 4. Lange COD cuvettes used for the COD analyses at Henriksdal. Order number Measurement range LCK 314 15-150 mg O2/L LCK 514 100-2000 mg O2/L LCK 014 1000-10000 mg O2/L Table 5. Parameters analysed by Stockholm Water Laboratory. Analysis Unit Standard method TS % SS028113-1 VS % of TS SS028113-1 COD Mg/L SS028142-2 mod DOC Mg/L SS-EN 1484-1 TOC Mg/L SS-EN 1484-1 SS Mg/L SSEN872-1 The colloidal and dissolved COD fractions in the sludge fluid phase were prepared by filtration. The filtration was performed at site directly after the sampling. The sludge samples were filtered trough 4.4 µm (Schleicher & Schuell 595 ½) and 0.45 µm (Schleicher & Schuell ME 25) pore size filter papers. The COD analyses at Henriksdal were made instantly after the filtration. For the determination of total COD in thickened and non-thickened sludge, the sludge was diluted 50 respectively 10 times. This was done in order to reach the measurement range for the Dr. Lange Cyvettes. All COD analyses were done in triplicates. The sludge and filtrate samples for analysis by Stockholm Water Laboratory were kept cold until reaching the laboratory (1-2 days). The disintegration rate based on COD was calculated for both the disintegrating and the reference thickening centrifuge. In addition to the nine sampling occasions when the operational parameters for the centrifuges were kept constant, some complementary samples were also taken when the operational parameters were varied. This sampling was performed in order to receive a wide spectrum of TS content in thickened EAS and thereby be able to determine the disintegration rates for both centrifuges as a function of TS content. These samples were analysed for both TS content and COD with method as described above.
5.4.2. Batch laboratory digestion test In this work, the specific gas production was determined and used for an evaluation of the disintegrated sludge as a substrate for biogas production. Batch laboratory digestion tests for analysis of specific methane production potential were therefore performed, in cooperation

21
with JTI, both with thickened disintegrated and reference EAS. Tests were also performed for both types of EAS but mixed with primary sludge. The mixture of EAS and primary sludge were made approximately according to the relationship between these two sludge in the real large-scale digester at Henriksdal WWTP. The sludge and inoculum for the batch laboratory digestion test was both collected at Henriksdal WWTP on the 26th October 2007. The inoculum was taken from the outlet from one of the digesters and used as bacterial culture for degradation of the substrates in the digestion tests. 25 L inoculum, 5 L disintegrated thickened EAS, 5 L reference thickened EAS and 5 L primary sludge was collected and transported directly to JTI in Uppsala. In Uppsala, the sludge was placed in a cold room of +4 °C for 4 days before the test was started. The inoculum was during these 4 days incubated at +37 °C in a constant room in order to degrade endogenous organic material in the sludge. Not degraded material in the sludge can lead to high background production of methane in the batch test, making them more difficult to evaluate. Both the different sludge’s and the inoculum were analysed for TS and VS content (Table 6). Table 6. TS and VS for the sludge and inoculum used in the methane production batch tests.
Sludge TS [%] VS [%] Inoculum 2.31 1.33 Disintegrated EAS 5.53 3.59 Reference EAS 5.24 3.52 Primary sludge 2.45 1.99 The batch laboratory digestion test was performed in triplicate glass bottles (1 L) and the set-up is shown in figure 8. In total, fifteen bottles were filled with inoculum to reach a total volume of 600 ml for inoculum and substrate. Three bottles were used as controls for background methane production and to the rest of the bottles, substrate was added to a corresponding load of 3 g VS/ L, i.e. 1.8 g VS of substrate was added to each bottle. The mixture of EAS and primary sludge were made in a proportion of 1:3 (Table 7). After addition of inoculum and substrate, the bottles were flushed with nitrogen to exchange the atmosphere. The bottles were then closed with rubber stoppers and aluminium caps.

22
Figure 8. The set-up of the batch laboratory digestion test. Table 7. The amount of inoculum and substrate added to the bottles in the batch laboratory digestion test.
Trial Sludge added [g]
1. Inoculum
2. Disintegrated
EAS
3. Reference
EAS
4. Disintegrated
EAS and primary sludge
5. Reference EAS and primary sludge
Inoculum 600 549.58 549.58 522.29 522.04 Primary sludge 0 0 0 60.91 60.91 Disintegrated EAS 0 50.42 0 16.8 0
Reference EAS 0 0 50.42 0 17.05 The prepared bottles were incubated at +37 °C in a temperate room. The measurements during the test period were then made in this room. The gas and pressure development was followed by measuring the pressure with a digital pressure meter (GMH 3110) equipped with a pressure sensor (GMSD 2BR; -1000 to 2000 mbar). The method for calculation of gas production from pressure is described in appendix 3. After measuring the pressure, a gas sample of 1 mL was taken from the headspace of the bottles and transferred to 30 ml serum vials. The gas in these vials were later analysed (within 1 week) with a gas chromatograph. For the last four measurements another gas chromatograph was used, but this should not have affected the results. The method for methane analysis and specification of gas chromatographs used are described in appendix 4. After the gas sampling the pressure in the bottles was levelled out to atmospheric pressure. The test was finalized after 49 days, when the gas production rate had ceased off. During the test period, the bottles were shaken by hand one or two times a day except for the weekends when there was no shaking.
5.4.3. Microscope study The disintegrating efficiency was also evaluated by microscopy. A digital camera was connected to the microscope for documentation. The floc size and shape, filament length and floc compaction were compared in disintegrated and reference EAS. To be able to separate the flocs, the samples were diluted with distilled water 15 times before microscopy. The study

23
was made with 100 times of magnification. To ensure a representative and fair comparison, several drop samples were studied. Representative fields of vision were photographed. Samples, for microscopy studies, of thickened disintegrated and reference EAS were collected on the 12th December 2007. At that time the TS content in the sludge were 5.7 and 5.9 % respectively. The sludge was kept cold until two days later when the sludge was studied in microscope.
5.4.4. Viscosity Viscosity measurements of disintegrated and reference EAS were performed by ITT Water and WasteWater during the evaluation period for the disintegrating centrifuge5. The outcome of these viscosity measurements was used as to evaluate the possibility of an improved EAS thickening while still having remaining pumpability. During the viscosity measurements, the shear rheology of disintegrated and reference EAS was examined by means of pipe pressure loss measurements and rotational rheometer tests. By changing the flow rate respectivly the rotational speed, the characteristics of the EAS was obtained. The flow may either be laminar or turbulent, and there are rheological models presented for both laminar and turbulent flow conditions (Dr. Richard Holm, private communication, 2008). The model used in this study refers to the power law model and was applied for laminar region data. This model is a two parameter model in which fluid consistency and fluid behavior index is determined. In the case of sludge, this index indicates a so called shear thinning behavior. In this study, the difference in rheology characteristics of disintegrated and reference EAS was studied for EAS with different TS contents. The range of TS contents in this study was between 3.5-6.5 % (Holm, 2008).
5 The measurements performed by ITT Water and WasteWater concerned mainly pumpability of disintegrated and reference EAS on the pressure side of the pump, for different flow conditions and TS contents. Therefore, these measurements only gave restricted information of the disintegration effect on the EAS performance in the suction side of the pump, i.e. the ability of initial startup of pumping. At Henriksdal WWTP, also the startup procedure for EAS pumping has been a problem.

24
6. RESULTS AND DISCUSSION
6.1. PERFORMANCE OF DISINTEGRATING AND REFERENCE CE NTRIFUGES For all sampling occasions, during the period of disintegrating performance evaluation, the TS content in thickened disintegrated EAS was equal or lower than the TS content in reference EAS (Fig. 9). These results indicated that the two centrifuges had slightly different performance.
4.0
5.0
6.0
7.0
8.0
0 2 4 6 8 10
Sampling occasion
TS
[%]
Disintegrating centrifuge Reference centrifuge
Figure 9. TS content in thickened disintegrated EAS and reference EAS at different sampling occasions. The centrifuges were kept with identical operational parameters for all sampling points. The spread in TS content in thickened EAS between the sampling occasions was likely caused by a daily variation of TS content in EAS. In general, the TS content of incoming non-thickened EAS to the centrifuges was lower in the morning than in the afternoon, depending on the waste water flow in to the plant. Measurements showed that the TS content of thickened sludge was correlated to the TS content of incoming non-thickened EAS (Fig. 10).
5
5.5
6
6.5
7
0.5 0.6 0.7 0.8 0.9 1.0
TS non-thickened EAS [%]
TS
thic
kene
d
EA
S [%
]
Figure 10. The TS content of thickened EAS correlated to the TS content of incoming non-thickened EAS. The data was from one day of measurements, with sampling in the morning side of the day and in the after noon. The thickened EAS was sampled from the disintegrating centrifuge (differential speed: 10).

25
Both centrifuges showed very good performance with respect to the degree of separation of suspended solids (97-99 %). This indicated that none of the centrifuges were overloaded during the test period. However, even though both centrifuges obtained the same load, the speed of the centrifuges at the different sampling occasions was somewhat different (Table 8). The disintegrating centrifuge showed significantly lower speed than the reference centrifuge. This lower speed was likely due to friction, caused by the contact between the knives against the sludge, acting as a brake on the centrifuge. The disintegrating centrifuge reached the correct differential speed, but the overall speed was affected (Table 8). This difference in speed might explain the difference in thickened TS content obtained with the two centrifuges. Table 8. Speed and differential speed for the disintegrating (Dis) and reference (Ref) centrifuge at different sampling occasions.
Date Time Speed [rpm] Diff.speed [rpm] Dis Ref Dis Ref 2007-10-17 09:15 2890 2900 10 10 2007-10-22 13:45 2890 2900 10 10 2007-10-23 08:15 2900 2910 10 10 2007-10-25 09:15 2900 2910 10 10 2007-11-05 08:30 2890 2900 10 10 2007-11-05 13:00 2890 2910 10 10 2007-11-13 08:00 2900 2910 10 10 2007-11-13 13:00 2890 2910 10 10
6.2. DISINTEGRATING PERFORMANCE
6.2.1. Disintegration rate The disintegration rates for the disintegrating and reference thickening centrifuges are shown in table 9. The calculations were based on the result from the COD analyses. The standard deviation for the COD analyses ranged between 0.079 and up to 15 %.

26
Table 9. Disintegration rates at several sampling points for the disintegrating and reference thickening centrifuges. TS: total solid content. DR: the increase of dissolved COD due to disintegration related to total COD. DRcol: the increase of colloidal COD due to disintegration related to total COD.
Non-thickened
EAS Disintegrating
centrifuge Reference centrifuge
Date Time TS
[%] TS [%]
DR [%]
DRcol [%]
TS [%]
DR [%]
DRcol [%]
2007-10-17 09:15 AM 0.74 5.7 1.6 - 6.3 0.39 - 2007-10-22 08:15 AM 0.51 5.7 1.4 0.77 6.0 0.35 0.69 2007-10-22 01:45 PM 0.81 6.7 1.6 0.50 7.4 0.42 0.58 2007-10-23 08:15 AM 0.71 5.9 1.6 0.66 6.0 0.36 0.68 2007-10-25 09:15 AM 0.73 5.9 1.4 0.66 6.7 0.41 0.77 2007-11-05 08:30 AM 0.61 5.6 1.5 - 5.6 0.28 - 2007-11-05 01:00 PM 0.90 6.4 1.5 - 7.2 0.45 - 2007-11-13 08:00 AM 0.89 6.3 1.7 - 7.1 0.45 - 2007-11-13 01:00 PM 1.00 7.0 1.9 - 7.3 0.52 - The disintegration rates for the disintegrating centrifuge varied between 1.4 and 1.9 % with a mean value of 1.6 %. The performed corresponding disintegration rates of the reference centrifuge were between 0.28 and 0.52 %, with a mean value of 0.40 %. From theses results it was clear that the disintegrating device increased the amount of organic material in the dissolved phase of the EAS. However, the increase in dissolved COD was relatively low in relation to the total COD content in the EAS. The colloidal disintegration rate, based on four measurements, for the disintegrating centrifuges were between 0.50 and 0.77 % with a mean value of 0.65 %. For the reference centrifuge these values varied between 0.58 and 0.77 % with a mean value of 0.68 %. Based on these results, the disintegrating device did not seem to have affected the colloidal phase in the EAS. Compared to other studies the disintegration rate of 1.6 % achieved in this study at Henriksdal WWTP was low. Results from other full-scale studies with disintegrating centrifuges show disintegration rates between 56 and up to 17.9 % (Dohanyos et al., 2004; Müller et al., 2004; Zábranska et al., 2006). However, there are several factors affecting the rate of sludge disintegration making it difficult to directly compare different studies. For example, the speed of the centrifuge and the degree of sludge dewatering affects the disintegration rate. As shown in the next chapter (6.2.2.), the disintegration rate improves at higher TS content in thickened EAS. Also, the sludge age might affect the rate of sludge disintegration. Sludge with a high age is very stable. The substrate has under long time been assimilated and metabolised in to cell structures of microorganisms and the flocs have grown large. Possibly a high sludge age make the sludge more difficult to disintegrate. Henriksdal WWTP has biological nitrogen removal as a part of the waste water treatment process. Therefore, the sludge age in the activated sludge process is higher than sludge ages at WWTP without nitrogen removal. The sludge age for the samples in this study was between 13 and 18 days, which was considered relatively high.
6 The increase of dissolved COD is related to the biodegradable COD content of EAS determined by an alkali hydrolysis (see chapter 3.2.1).

27
The low disintegration rate obtained in this study suggests that the cell walls of bacteria were not broken by the rotating knives. Disruption of bacterial cell would have induced higher COD content in the dissolved phase. Possibly the energy input was to low for breakage of the cell wall. That no bacterial cells were broken is also supported by the fact that the disintegrating device did not influence the colloidal phase in the sludge. Likely there was no increase in the number of free-swimming bacteria in the fluid phase of the EAS. The influence of the disintegration centrifuge on floc size and shape is further discussed in chapter 6.4. When comparing the results it is important to consider that the reference thickening centrifuge show slightly higher TS content in the thickened EAS compared to the disintegrating centrifuge. In the following chapter the importance of the TS content of thickened EAS for the disintegrating rate is further discussed.
6.2.2. Disintegration rate as a function of EAS retention time in disintegrating device The retention time for the EAS in the disintegrating equipment depends on the degree of dewatering in the centrifuge. The result from this study showed that the disintegration rate improved at higher TS contents in thickened disintegrated EAS (Fig. 10). Furthermore, the reference centrifuge also showed slightly increased disintegration rates at higher level of dewatering (Fig. 10). However, the increase was larger for the disintegrating centrifuge than for the reference, likely caused by the effect of different retention times for the sludge in the disintegrating equipment.
0
0.5
1
1.5
2
3.0 4.0 5.0 6.0 7.0 8.0
TS in thickened EAS [%]
Dis
inte
grat
ion
rate
[%]
Disintegratingcentrifuge
Referencecentrifuge
Figure 10. The disintegration rates as a function of TS content in thickened EAS for the disintegrating and reference thickening centrifuges.
6.3. SPECIFIC GAS POTENTIAL
6.3.1. Background biogas production The three control bottles with only inoculum produced methane gas despite the incubation in 37 °C during 4 days before the test. As a consequence of the inhomogeneous inoculum being difficult to divide, the standard deviations in methane production at the different measurement occasions varied between 2.3 and 33 %. The gas production from the control bottles with only inoculum at the measurements occasions was high in relation to the gas production from the test bottles with also substrate added (37-86 % when compared to bottles with reference

28
EAS). Therefore, the inhomogeneous inoculum likely made the evaluation of the different substrates more difficult. Furthermore, at two of the measurement occasions, one of the inoculum bottles showed approximately zero in pressure. The measurement data from this bottle at these occasions was therefore not taken into account in the calculations. The bottle with a deviating methane production was one out of two bottles having a different kind of cap. The other bottle with this kind of cap also showed a lower methane production. Therefore, the likely explanation for the low production was leakage.
6.3.2. Biogas production from disintegrated and reference EAS The results from the batch tests with disintegrated and reference EAS showed that there was no significant increase in the specific methane potential for disintegrated EAS. The uncertainty in the test at the end of the test period was larger than the average increase in specific methane potential (Fig. 11). However, the specific methane production in the parallel bottles was clearly separated until day 13 (Fig. 11). These results showed that the degradation rate of EAS was initially slightly accelerated due to the disintegration. However, this initial acceleration was considered to only marginally affect the specific methane production from EAS in the digesters at Henriksdal WWTP. The small differences between disintegrated and reference EAS and the uncertainty in the test made the data difficult to evaluate. However, considering the low disintegration rate obtained in this study, these results were not surprising. The data for biogas and methane production in the batch tests are presented in appendix 5.
0
0.05
0.1
0.15
0.2
0.25
0 10 20 30 40 50
Time [days]
Acc
um. m
etha
ne p
rod.
[NL
/g V
S]
Disintegrated EAS
Reference EAS
Figure 11. Methane production over time in the batch laboratory digestion test. The dots show disintegrated and reference EAS. The error bars show minimum and maximum values obtained. The calculations of specific methane potential from disintegrated EAS were based only on two bottles. This was due to the fact that one of the three parallel bottles in the test produced significant lower biogas as compared to the other two. The deviation in biogas production at the end of the test was approximately 16 % between the deviating bottle and the average of

29
the other two. The other two bottles showed very good correspondence with each other (Fig. 11). The bottle with a deviating methane production was one out of the two bottles having a different kind of cap. The other bottle with this kind of stopper also showed a lower methane production. Therefore, the likely explanation as earlier mentioned for the low production was leakage.
6.3.3. Disintegrated and reference EAS in mixture with primary sludge The result from the batch tests suggests that the disintegrated EAS did not have a stimulating effect on the degradation of primary sludge. The disintegrated EAS in mixture with primary sludge showed specific methane potential of 0.33 NL/g VS after 49 days of incubation (Fig. 12). For reference EAS in mixture with primary sludge the specific methane potential was determined to 0.34 NL/g VS. The samples with disintegrated EAS showed slightly lower specific methane potential than the samples with reference EAS. However, the uncertainty in the test was higher than this small difference in specific methane potential (Fig. 12).
0
0.1
0.2
0.3
0.4
0 10 20 30 40 50
Time [days]
Acc
um. m
etha
ne p
rod.
[NL
/g V
S]
Disintegrated EAS andprimary sludgeReference EAS andprimary sludge
Figure 12. Methane production over time in the batch laboratory digestion test for disintegrated and reference EAS mixed with primary sludge. The error bars show minimum and maximum values obtained. The small effect in methane potential for disintegrated EAS (Fig. 11) observed could not be seen in the test with EAS mixed with primary sludge (Fig. 12). However, as EAS in the mixture was only one third of the substrate and generally gives less biogas than primary sludge, this result was not surprising. Important to note is that the methane curves in figure 11 and 12 suggests that after 49 days, when the test was finished, degradation still occurred as the plateau in accumulated methane production was not yet reached. Therefore, the specific methane potential for the substrates in the tests was possibly underestimated. The laboratory batch digestion tests could with advantage have continued for further a week or longer.

30
6.4. MICROSCOPE STUDY The camera zoom function was used to make it possible to display the microscope object in full screen. All pictures below show the same magnification. The scale is approximate.
6.4.1. Floc shape and size The disintegrated EAS flocs were more regular in shape and size as compared to the flocs in the reference EAS (Fig. 13). Also, in general, the disintegrated flocs were smaller. In the reference EAS flocs, dark parts representing thicker/bigger sections, were often present (Fig. 13). These dark parts were significant less represented in the disintegrated EAS flocs.
Figure 13. Microscopic view of reference EAS (left) and disintegrated EAS (right).
6.4.2. Filament length In the reference EAS, the filaments were easy to identify (Fig. 14). They were more seldom seen in the disintegrated EAS, which was a sign of filaments being disrupted by the treatment. In general, the filaments seen in the disintegrated EAS was shorter compared to the filaments in the reference EAS (Fig. 14). However, as shown by Sundin (2006) this do not necessarily imply that the disintegrating equipment is suitable for preventing problems with foam in digesters. Likely the filamentous bacteria were only shortened and not lysed.
Figure 14. Microscopic view of reference EAS (left) and disintegrated EAS (right).

31
6.4.3. Floc compaction The flocs in the disintegrated sludge were more compact, seen from a two dimensional view, than the flocs in the reference EAS (Fig. 15). The filamentous floc structure of the reference EAS contained a lot of cavity due to the filamentous structure present. This cavity was not present in the disintegrated EAS, likely due to the filamentous structure was affected by the treatment.
Figure 15. Microscopic view of reference EAS (left) and disintegrated EAS (right). The microscope study showed that the disintegrating centrifuge technique reduces the size of flocs in EAS, giving comparable larger surface areas in relation to particle volume. This is beneficial as the hydrolysis step in the anaerobic degradation process chain is made easier and the degradation can be accelerated. However, as shown in chapter 6.3.2., the biogas production from EAS was only marginally affected by the disintegration. Also, the reduction in floc size might affect the EAS viscosity and this is further discussed in the next chapter (6.5). Beside the reduction in floc size, the microscope study also showed that the disintegrating knives shortens filaments in the EAS and makes the flocs more compact. However, as the filamentous bacteria were likely not lysed by the treatment, the disintegrating centrifuge technique might not be suitable for preventing problems with foam in digesters.

32
6.5. VISCOSITY The concluding results in the report by Holm (2008) showed a moderate difference between disintegrated and reference EAS in the rheology characterization in turbulent flow. In laminar flow a difference was observed in the case of TS contents above 5 %, with an improved pumpability for disintegrated EAS. The results showed that the TS content of EAS can be increased with 1-2 % and, due to disintegration, still have remaining pumpability. This change in EAS viscosity caused by the disintegration was likely was due to structural changes in EAS such as floc disruption. However, the shear thinning behaviour was constant for disintegrated and reference EAS and also for different TS contents. This indicated a stable suspension without influence of bacterial cell lysing in the sludge disintegration. This result coincide with the low disintegration rate obtained during the evaluation period for the disintegrating centrifuge, that also indicated that bacterial cells in EAS was not affected by the treatment. Finally, the transition from laminar to turbulent flow condition of EAS showed clearly an influence of the TS content and EAS (disintegrated and reference). As the thickened EAS flow at Henriksdal WWTP is laminar7, an improved pumpability can be expected for disintegrated EAS with TS contents above 5 %. Based on the results from the viscosity measurements, the TS content of thickened EAS at Henriksdal WWTP was assumed to be able to improve from the earlier average of 4.6 % to approximately 6 % and, due to disintegration, still have remaining pumpability.
7 The thickened EAS flow at Henriksdal WWTP was during 2005-2008 on average 20 m3/h (process database WASTE). The study by Holm (2008) indicated that this flow was in the laminar region.

33
7. ENERGY BALANCE
7.1. ENERGY CONSUMPTION The supplier (Lysatec) suggested that the increase in energy consumption for a centrifuge equipped with a disintegrating device at Henriksdal WWTP is approximately 30 %, based on measurements on site. During the evaluation period, the current consumption was also measured at some occasions by personal at Henriksdal WWTP. At these occasions, the increase in energy consumption for the centrifuge due to the disintegrating device was found to be higher than 30 % (Table 10). The annual energy consumption for the five centrifuges at Henriksdal WWTP without disintegration devices was assumed to be 650 MWh (Medoc, 2005). The effective power in table 10 was calculated from the current measurement result according to equation 9 (three phase system).
)cos(3 ϕ⋅⋅⋅= IUP (9) where
P effective power [W] U voltage (= 400 V) [V] I measured current [A]
)cos(ϕ power factor (=0.86) Table 10. Measured energy consumption, calculated power requirement and expected increase in energy consumption, due to the disintegrating device, for the five centrifuges. The annual energy consumption for the five centrifuges without disintegrating devices was assumed to be 650 MWh (Medoc, 2005). Dis: disintegrating centrifuge, Ref: reference centrifuge, *on-line measurement where the zero calibration set point was probably displaced
Measured energy
consumption
Effective power
Increase in current/energy consumption
[Ampere] [kW] [%] [MWh/year]
Date
Dis Ref Dis Ref
6th February, 2008 47 32 28 19 47 310 6-14th February, 2008 76* 50* - - 52 340 13th Mars, 2008 57 33 34 20 73 480 The on-line measurement from 6-14th February showed that the energy consumption for the centrifuges was independent of the daily variation in the total solid load in to the centrifuges. Notably is that in this on-line measurement, likely the zero calibration set point was displaced (appendix 6). If the flow to the centrifuges is 30 m3/h and the TS content of incoming sludge is 0.5-1 %, the specific energy consumption for the disintegration of EAS (not thickening) solely was calculated to be 0.03-0.06 kWh/kg TS or 0.05-0.09 kWh/kg TS depending on the increase in energy consumption for centrifuges (47 % or 73 %; Table 10). The disintegrating equipment was mounted on the centrifuge number one in October 2007. Possibly the energy consumption increases when the parts of the disintegrating equipment get worn with time.

34
Therefore, the increase in energy consumption during the first months of the evaluation period was possibly lower than 47 %, which also Lysatec has shown.
7.2. EFFECT ON THICKENING AND ON TOTAL SLUDGE FLOW One of the objectives in this study was to evaluate the possibility of an improved EAS thickening while still having remaining pumpability. An improved EAS thickening reduces the EAS flow to the digesters. The calculation of possible reduction in total sludge flow was made with background data from 2000-2005 (Table 11). Table 11. Flow of different sludge suspensions to the anaerobic digesters. Presented values are mean values for the period of 2000-2005 (Vallin et al., 2008). Sludge Flow to digesters [m3/day] Primary sludge 1 450 EAS 390 External organic material 66.8 Total 1 910 The mean TS content of EAS during 2000-2005 was 4.6 % (Vallin et al., 2008). From the EAS flow (Table 11) and the mean value in TS content, the EAS mass flow to the digesters was calculated to 17 940 kg TS/day. If the TS content of EAS can be increased, the EAS flow to the digesters, i.e. the total sludge flow, will be reduced (Fig. 16).
0
4
8
12
4.0 6.0 8.0 10.0
TS content in thickened EAS with disintegration [%]
Tot
al s
ludg
e flo
w r
educ
tion
[%]
Figure 16. Total sludge flow reduction, in relation to TS content in thickened EAS, reached due to using the disintegration technique. As the results from the viscosity measurements indicated that the TS content of thickened EAS at Henriksdal WWTP can be improved from 4.6 to 6 % and still have remaining pumpability, the total sludge flow to the digesters can be reduced with 5 %, i.e. 91 m3/day (Fig. 16).

35
The mean value in TS content for thickened EAS of 4.6 % in the period 2000-2005, used in the calculations, was for two reasons questioned after the evaluation period. The mean value of 4.6 % was based on daily EAS samples, taken mostly in the mornings. The first doubt was due to the fact that there seemed to be a daily variation in TS content of non-thickened and consequently also of thickened EAS. This made it unlikely that one sample was fully representative for the overall day. The second doubt, the main concern, was due to the discovery that a low incoming EAS TS content (~ 0.5 %) caused a significant drop in the TS content of thickened EAS (Fig. 17).
0
1
2
3
4
5
6
7
00:00 04:48 09:36 14:24 19:12 00:00
Time
TS
con
tent
[%]
Non-thickened EAS, day 1
Thickened EAS, day 1
Non-thickened EAS, day 2
Thickened EAS, day 2
Figure 17. TS measurements from two different days. During day 1, the incoming EAS had a low TS content in the morning. The differential speed of the centrifuge was 12 rpm during the measurements. This suggested that the centrifuge performance below a certain TS content of incoming EAS was very inefficient. Unfortunately, this drop in TS content of thickened EAS often occurred around 8 AM when the TS content in incoming EAS was low. This was approximately the same time as the daily sample for TS analysis during 2000-2005 was taken. Therefore, the measured TS contents of thickened EAS during 2000-2005 were possibly underestimated. The EAS flow from the bio basins had, under the evaluation period and in the past, been set to a constant flow al day. To enable a stable and high TS content of EAS al day, the EAS flow from the bio basins can with advantage be adjusted to the incoming load of the plant, which often has a daily variation. Also, to further optimize the TS content of thickened EAS, a control system where the differential speed of the centrifuges is adjusted to the incoming TS content might be beneficial. If these measures are made, probably a polymer dosage to receive a thick sludge all day will not be needed.
7.2.1. Alt. 1: Increased capacity to treat external organic material If the EAS can be further thickened, from 4.6 to 6 % in TS content, there will annually be 33 000 m3 less EAS to feed the digesters. Consequently further 33 000 m3 external organic material can be treated in the digesters annually. The possible increase in methane production due to this was estimated. External organic material topical for this increase in capacity will be recycled organic waste from restaurants and business activities (Table 12). Presently the main source of external organic material at Henriksdal WWTP is energy rich separated-fat sludge.

36
Table 12. Background data for topical external organic material to be further treated at Henriksdal WWTP (Stockholm Water & Sweco VBB VIAK, 2002). Degree of degradation [%] 65 TS content [%] 10 VS content [% of TS] 85 Specific methane production [Nm3/kg VS reduced] 0.52 Based on the data presented in table 12, the possible annual methane production from 33 000 m3 the topical external organic material was calculated to 940 000 Nm3. If the energy value for methane is 9.8 kWh/Nm3 (Jarvis, 2004), the annual energy output (methane gas) obtained from the external organic material was calculated to be 9 200 MWh.
7.2.2. Alt. 2: Extension of the retention time in digesters As a consequence of a reduction in the total sludge flow, the retention time in the digesters will be extended (if no additional external organic material is treated). With an extended retention time, the substrates will be further degraded and the biogas production will increase. A calculation was made to determine the effect on retention time if the total sludge flow was reduced with 91 m3/day (Equation 10).
The retention time [days] = out
digester
Q
V (10)
Where Vdigester volume of digester [m3] = 39 000 m3 at Henriksdal WWTP Qout volume flow out from digester [m3*day-1] Table 13. Background data for calculation of retention time in digesters at Henriksdal WWTP (Vallin et al., 2008). Sludge Flow to
digester [m3/day]
TS [%]
VS [% of TS]
Total solid flow to
digesters [kg TS/day]
Volatile solid flow to
digesters [kg VS/day]
Primary sludge 1 450 3.6 74.4 52 200 38 800 EAS 390 4.6 62.2 17 900 11 100 External organic material 66,8 9.9 94.6 6 610 6 260 Total 1 910 76 700 56 200 The degree of degradation of the substrates in the digesters was set to 50 % in the calculation (Vallin et al., 2008). Based on data presented in table 13, the amount of volatile solids reduced in the digesters was calculated to be 28 100 kg/day. Therefore, the flow out of the digesters during 2000-2005 was in average 1880 m3/day, giving a retention time in the digester of approximately 21 days. If the total sludge flow can be reduced by 91 m3/day, the retention time will be extended to 22 days.

37
The calculation procedure for determining the effect of different retention time’s on the gas production are presented in appendix 5. The result from this calculation showed that the methane production can increase with 0.75 %. The specific methane production during 2000-2005 was 0.31 Nm3/ kg VS (Vallin et al., 2008), giving an annual methane production during this period of 6 400 000 Nm3. If the methane production would increase with 0.75 % and the energy value for methane is 9.8 kWh/Nm3 (Jarvis, 2004), the annual energy winning was calculated to 470 MWh. Less water to be heated in digesters The alternative of extending the retention time in digesters, and thereby further obtain degradation of the substrates, also brings the benefit that less water need to be heated in the digesters. The energy needed for heating the 33 000 m3 of water, that annually could be reduced, was calculated (Equation 11). E = Tmc ∆⋅⋅ (11) where E energy [J] c specific heat capacity [J*kg-1*K -1] (water: 4190 J*kg-1*K -1) m mass [kg] T temperature [K] The set point for the temperature in the digesters was presently 37 oC (Vallin et al., 2008). The mean temperature of the in going primary sludge, during 2001-2007, was 15.5 oC and the mean temperature of in going thickened EAS was 16.4 oC (process database WASTE at Stockholm Water). The temperature for the sludge fed in to the digesters was, in the calculations, approximated to 16 oC. Based on these background data, the annual energy saving was calculated to be 810 MWh.
7.3. LESS AMOUNT OF SLUDGE TO PUMP If the EAS can be further thickened, from 4.6 to 6 % in TS content, there will annually be 33 000 m3 less EAS to pump. The energy consumption for pumping thickened EAS was during the third quarter of 2007 in average 0.29 kWh/m3 (process database WASTE at Stockholm Water). Assuming that the energy consumption per cubic meter thickened EAS will be the same despite lower EAS suspension flow through the pump, the annual energy pump savings was calculated to 9.6 MWh.
7.4. ENERGY BALANCE SUMMARIZE Table 11 shows the results from the calculations of possible energy input and outputs when implementing the disintegrating centrifuge technique at Henriksdal WWTP. As different energy sources have different quality and cost, this was considered in the presentation of the energy balance (Table 11). The energy balance presented was calculated assuming that the TS content in thickened EAS can increase from 4.6 to 6 %. Based on the results from the batch tests, the disintegrating centrifuge technique was assumed to not affect the specific methane production from EAS in the anaerobic digesters.

38
Table 11. Possible energy input and outputs when implementing the disintegrating centrifuge technique at Henriksdal WWTP, calculated over a year. Electricity
[MWh] Methane
gas [MWh]
District heating [MWh]
Energy input
Increase in centrifuge energy consumption (47 / 52 / 73 %)
310 / 340 / 480
Energy outputs
Reduction of total sludge flow giving rise to two opportunities:
Alt. 1: Increased capacity to treat external organic material in the digesters
9 200
Alt. 2: Extension of the retention time in digesters to further degrade the substrates
470
Less amount of water to be heated in the digesters
810
Less amount of sludge to pump due to improved dewatering
9.6
Increased specific methane production from EAS due to the fact that the substrate will be more easily degradable
0
The calculations in the energy balance showed that the possible energy outputs due to using the disintegration method were higher than the energy input needed. Important to note is that the cost for energy from electricity is higher than for methane gas and district heating. However, the decrease in the need of heating sludge with district heating is evidently larger than the increase in energy consumption for the centrifuges. The calculations also suggested that an increase in the amount of external organic material treated in the digester is more beneficial than the alternative of extending the retention time. However, a further cost analysis must be done to evaluate if the disintegrating equipment is cost effective at Henriksdal WWTP. Investment and operational cost must also be considered. Important to note is that the TS content of thickened EAS during 2001-2005 was possibly underestimated. Therefore, the energy outputs presented in the energy balance might consequently be overestimated.

39
8. CONCLUSIONS The disintegration rate for a centrifuge equipped with a disintegrating device, at Henriksdal WWTP, was in average 1.6 % for thickened EAS with TS contents of 6-7 %. The rate of sludge disintegration by the centrifuge it self was in average 0.4 %. The disintegration rate has shown to improve at higher TS content in thickened disintegrated EAS, likely due to increasing retention time in disintegrating equipment. In this study, the increase of organic material in the dissolved phase due to the treatment was small in relation to the overall organic material in EAS. The low disintegration rate obtained suggested that the cell walls of bacteria were not broken by the rotating knives. Disruption of bacterial cell would have induced higher COD content in the dissolved phase of the EAS. Possibly the energy input was to low for breakage of cell wall. That no bacterial cells were broken was also supported by the fact that the disintegrating device did not influence the colloidal phase in the sludge. The results from the batch tests showed that there was no increase in the specific methane potential for disintegrated EAS, but that the degradation rate of EAS was initially accelerated. However, this initial acceleration was small and in the case of a full-scale application of the technique at Henriksdal WWTP, the biogas production from EAS in the digesters was considered to be only marginally affected. Also, considering the low disintegration rate obtained in this study, an effect in methane production could not be expected. The results from the batch tests with a mixture of EAS and primary sludge showed that the disintegrated EAS did not have a stimulating effect on the degradation of primary sludge. The results from the viscosity measurements showed that the pumpability, for EAS with TS contents above 5 %, improved due to the disintegration. An indication was found, that the TS content of EAS can be increased with 1-2 % and, due to disintegration, still have remaining pumpability. The TS content of thickened EAS at Henriksdal WWTP was, based on these results, assumed to be able to improve from the earlier average of 4.6 to approximately 6 % and still have remaining pumpability. This would reduce the total sludge flow to the digesters by 5 %, i.e. 91 m3/day. The calculations in the energy balance showed that the possible energy outputs obtained by using the disintegration centrifuge technique at Henriksdal WWTP were higher than the energy input needed. As the total sludge flow can be reduced, due to using the disintegrating centrifuge technique, further 91 m3/day external organic material can be treated in the digesters or the hydraulic retention time can be extended by one day. For an increased biogas production, the calculations suggested that an increase in the amount of external organic material treated in the digesters was more beneficial than the alternative of extending the retention time. Also, energy savings can be made as there will be less sludge to pump and less water to heat in the digester. However, a cost analysis must be done to evaluate if the disintegrating equipment is cost effective at Henriksdal WWTP. Investment and operational cost must be further considered. This study suggests that the main influences by the disintegration device were in the reduction of floc size and the disruption of filamentous forming bacteria. The viscosity measurements showed that the change in sludge structure had a positive effect on the viscosity and consequently the pumpability for EAS. As the disintegrating centrifuge technique only shortens filamentous forming bacteria in the EAS and do not lyse them, it is unclear if the technique can prevent problems with foam in digesters.

40
REFERENCES Beijer R., (2008), Enzymatic treatment of wastewater sludge in presence of a cation binding agent - improved solubilisation and increased methane production, master thesis 30 ECTS in Engineering Biology, Linköping University, LITH-IFM-A-EX-08/1930-SE, 56 pp Biogasmax, (2008), http://www.biogasmax.com/the-project/a-european-project-for-sustainable-development/, http://www.biogasmax.com/the-project/role-of-biogasmax-partners/, http://www.biogasmax.com/stockholm/issues-and-choices/, 2008-01-16 Bogh A.M., (2002), ”Trådformiga bakterier och slamflockens uppbyggnad”, Vattenspegeln, 2002(3):9-12 Borggren C., (2007), Mätning av metanpotentialen hos slam på Henriksdal och Bromma - Metodutveckling och utvärdering av labutrustningen ” BCS-CH4 Biogas”, master thesis 30 ECTS, Industrial Ecology, The Royal Institute of Technology, Trita-IM 1402-7615 2007:46, 57 pp Davidsson Å., (2007), Increase of biogas production at wastewater treatment plants – Addition of urban organic waste and pre-treatment of sludge, PhD-thesis, Water and Environmental Engineering Department of Chemical Engineering Lund University, ISBN 978-91-7422-143-5 Dohányos M., Zábranská J., Jenícek P., Stepová J., Kutil V. & Horejs J., (2000), “The intensification of sludge digestion by the disintegration of activated sludge and the thermal conditioning of digested sludge”, Water Science and Technology, 42(9):57-64 Dohányos M., Zábranská J., Kutil V. & Jenícek P., (2004), “Improvement of anaerobic digestion of sludge”, Water Science and Technology, 49(10):89-96 Dåverhög M. & Balmér P., (2008), Ultraljudsbehandling, en kostnadseffektiv metod för att öka gasproduktionen och minska mängden slam?, Swedish Water Developement, Report Nb 2008-02 Elmitwalli T.A., van Dun M., Bruning H., Zeeman G. & Lettinga G., (2000), “The role of filter media in removing suspended and colloidal particles in an anaerobic reactor treating domestic sewage”, Bioresource Technology, 2000(72):235-242 Gerardi M.H., (2003), The Microbiology of Anaerobic Digesters, John Wiley & Sons, ISBN 0-471-20693-8 Gary D., Morton R., Tang C. & Horvath R., (2007), The effect of the Microsludge treatment process on anaerobic digestion performance, Water Environment Federation´s Annual Technical Exhibition and conference, San Diego, USA, 13-17 October 2007 Holm R., ITT Water and WasteWater, (2008), Rheological characterization of centrifuged thickened waste activated sludge (WAS): a study of a disintegration effect on the sludge pumpability, Stockholm Water Report, under preparation

41
Hultman B. & Levlin E., (2003), Minskning av skumningsproblem och slammängd i rötkammare, Department of Land and Water Resources Engineering, The Royal Institute of Technology, ISBN 91-7283-634-2 Jarvis Å., (2004), Biogas Förnybar energi från organiskt avfall, brochure, Swedish Biogas Association Juhlin A., (2008), Årstidsvariationer i vattenreningen på Bravikens pappersbruk, master thesis 30 ECTS in Aquatic and Environmental Engineering, Uppsala University, UPTEC W08 004, 57 pp Kepp U. & Solheim O.E., (2001), Meeting increased demands on sludge quality – experience with full scale plant for thermal disintegration, 9th World Congress Anaerobic Digestion, Antwerpen, Belgium, September 2-6, 2001 Lysatec, (2004), Final report on the results of sludge analyses and biogas production tests carried out at Institute of Chemical Technology in Prague with sludge from Henriksdals WWTP, report by Lysatec Medoc M., (2005), Energibalans Henriksdals reningsverk, energy balance report, Henriksdal WWTP, Stockholm Water Müller J.A., (2003), “Conditioning, Thickening, and Dewatering of Mechanically Disintegrated Excess Sludge”, Separation Science and Technology, 38(4):889-901 Müller J.A., Winter A. & Strünkmann G., (2004), “Investigation and assessment of sludge pre-treatment processes”, Water Science and Technology, 49(10):97-104 Pérez-Elvira S.I., Nieto Diez P. & Fdz-Polanco F., (2006), “Sludge minimization technologies”, Environmental Science and Bio/Technology, 2006(5):375-398 Stockholm Water, (2008), http://www.stockholmvatten.se/Stockholmvatten/Vattnets-vag/Avloppsvatten/Reningsverk/Henriksdal-reningsverk/, 2008-02-05 Stockholm Water & Sweco VBB VIAK, (2002), Henriksdals reningsverk - Rötning av externt organiskt material, appendix in Stockholm Water final report R No 03 February 2002 Sundin A.M., (2006), Mer gas, mindre slam och mindre skum? Erfarenheter från Käppalaverket på Lidingö, Envisys Seminar, Lund, Sweden, November 2006 Tiehm A., Nickel K., Zellhorn M. & Neis U., (2001), “Ultrasonic waste activated sludge disintegration for improving anaerobic stabilization”, Wat. Res., 35(8):2003–2009 Zábranská J., Dohányos M., Jenícek P & Kutil V., (2006), “Disintegration of excess activated sludge – evaluation and experience of full-scale applications”, Water Science and Technology, 53(12):229-236 Zhang P., Zhang G. & Wang W., (2007), “Ultrasonic treatment of biological sludge: Floc disintegration, cell lysis and inactivation”, Bioresource Technology, 2007(98):207–210
42
Vallin L., Hellström D. & Jonsson L., (2008), D2.1.2. Real life case in Henriksdal waste water treatment plant in Stockholm, Sweden, Integrated Project No 019795, Biogasmax, under preparation Wang F., Lu S. & Ji M., (2006), “Components of released liquid from ultra sonic waste activated sludge disintegration”, Ultrasonics Sonochemistry, 2006(13):334–338 Wawrzynczyk J., (2007), Enzymatic treatment of wastewater sludge - Sludge solubilisation, improvement of anaerobic digestion and extraction of extracellular polymeric substances, PhD-thesis, Division of Pure and applied Biochemistry Lund University, ISBN 978-91-628-7246-5 Weisz N., Kepp U., Norli M., Panter K & Solheim O.E., (2000), Sludge disintegration with thermal hydrolysis – cases from Norway, Denmark and United Kingdom, 1. World Water Congress IWA, Paris, France, 3-7 July 2000 Winter A., (2002), “Minimisation of costs by using disintegration at a full-scale anaerobic digestion plant”, Water Science and Technology, 46(4-5):405-412 Wolff H.J., Nickel K., Houy A., Lunden A. & Neis U., (2007), Two years of experience on a large German STP with acoustic disintegration of waste activated sludge for improved anaerobic digestion, 11th IWA World Congress on Anaerobic Digestion, Brisbane, Australia, 23-27 September 2007 PRIVATE COMMUNICATION Dr. Richard Holm, ITT Water and WasteWater, 2nd April 2008 Kutil Josef, Lysatec, 22nd January 2008
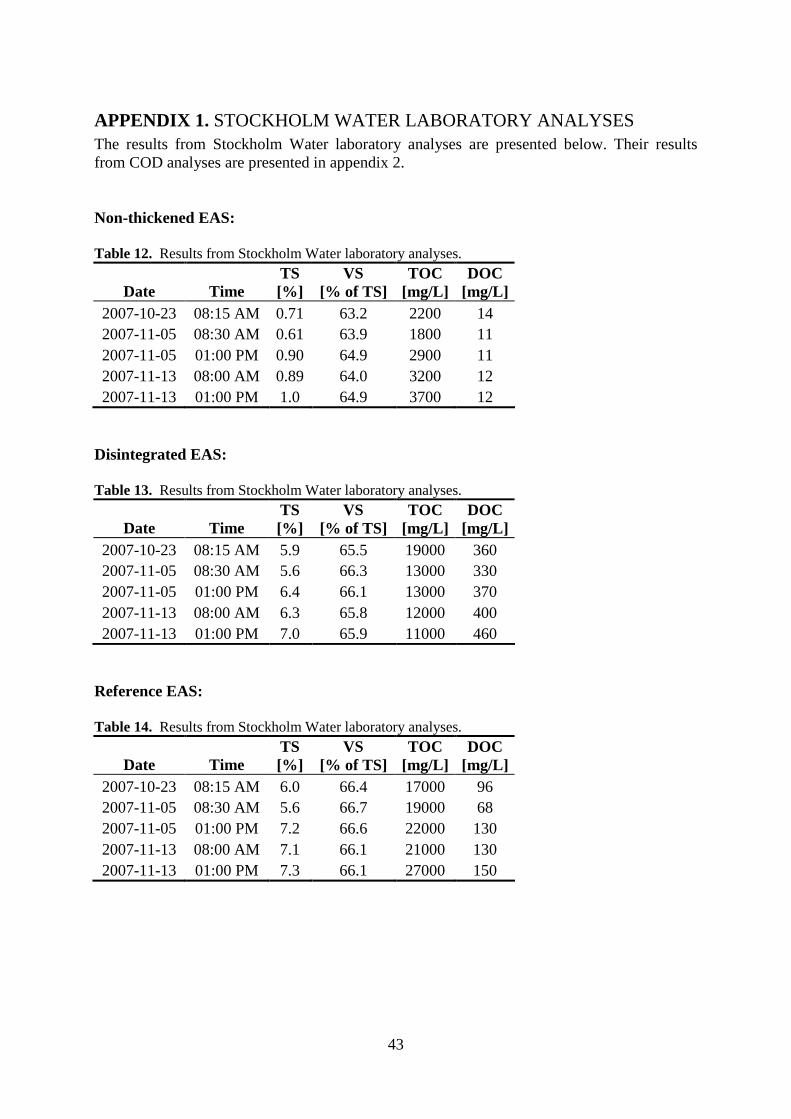
43
APPENDIX 1. STOCKHOLM WATER LABORATORY ANALYSES The results from Stockholm Water laboratory analyses are presented below. Their results from COD analyses are presented in appendix 2. Non-thickened EAS: Table 12. Results from Stockholm Water laboratory analyses.
Date Time TS [%]
VS [% of TS]
TOC [mg/L]
DOC [mg/L]
2007-10-23 08:15 AM 0.71 63.2 2200 14 2007-11-05 08:30 AM 0.61 63.9 1800 11 2007-11-05 01:00 PM 0.90 64.9 2900 11 2007-11-13 08:00 AM 0.89 64.0 3200 12 2007-11-13 01:00 PM 1.0 64.9 3700 12
Disintegrated EAS: Table 13. Results from Stockholm Water laboratory analyses.
Date Time TS [%]
VS [% of TS]
TOC [mg/L]
DOC [mg/L]
2007-10-23 08:15 AM 5.9 65.5 19000 360 2007-11-05 08:30 AM 5.6 66.3 13000 330 2007-11-05 01:00 PM 6.4 66.1 13000 370 2007-11-13 08:00 AM 6.3 65.8 12000 400 2007-11-13 01:00 PM 7.0 65.9 11000 460
Reference EAS: Table 14. Results from Stockholm Water laboratory analyses.
Date Time TS [%]
VS [% of TS]
TOC [mg/L]
DOC [mg/L]
2007-10-23 08:15 AM 6.0 66.4 17000 96 2007-11-05 08:30 AM 5.6 66.7 19000 68 2007-11-05 01:00 PM 7.2 66.6 22000 130 2007-11-13 08:00 AM 7.1 66.1 21000 130 2007-11-13 01:00 PM 7.3 66.1 27000 150

44
Reject water from disintegrating centrifuge: Table 15. Results from Stockholm Water laboratory analyses on reject water from disintegrating centrifuge.
Date Time SS [mg/L] TOC [mg/L] DOC [mg/L] 2007-10-23 08:15 AM 360 62 24
2007-11-05 08:30 AM and 01:00 PM,
mixed sample 980 130 23
2007-11-13 08:00 AM and 01:00 PM,
mixed sample 1700 230 28 Reject water from reference centrifuge: Table 16. Results from Stockholm Water laboratory analyses on reject water from reference centrifuge.
Date Time SS [mg/L] TOC [mg/L] DOC [mg/L] 2007-10-23 08:15 AM 480 160 22
2007-11-05 08:30 AM and 01:00 PM,
mixed sample 1300 210 23
2007-11-13 08:00 AM and 01:00 PM,
mixed sample 2200 310 28

45
APPENDIX 2. RESULTS FROM COD ANALYSES
Table 17. Results from COD analyses. Analyses performed both at Henriksdal and at Stockholm Water laboratory.
EAS before centrifugation Disintegrated thickened EAS Reference thickened EAS Date Time CODtot [mg/l] CODcol [mg/l] CODdis [mg/l] CODtot [mg/l] CODcol [mg/l] CODdis [mg/l] CODtot [mg/l] CODcol [mg/l] CODdis [mg/l]
2007-10-17 09:15 AM 7473 - 34.1 48550 - 797 45150 - 212 2007-10-22 08:15 AM 4717 0.7 44.9 55033 426 835 54400 378 236 2007-10-22 01:45 PM 7187 8.3 37.9 65067 332 1059 70050 413 331 2007-10-23 08:15 AM 6600 10 54 59000 400 1000 57000 400 260 2007-10-25 09:15 AM 5727 5.6 37.1 57217 383 829 63133 489 297 2007-11-05 08:30 AM 5200 - 32 56000 - 850 56000 - 190 2007-11-05 01:00 PM 7800 - 35 63000 - 1000 70000 - 350 2007-11-13 08:00 AM 8600 - 35 61000 - 1100 70000 - 350 2007-11-13 01:00 PM 10000 - 38 68000 - 1300 73000 - 420

46
APPENDIX 3. CALCULATION OF BIOGAS VOLUME FROM PRESSURE MEASUREMENTS The calculation of biogas volume based on pressure measurements are shown below. The ideal gas law was used for the recalculation of pressure increment to biogas volume produced:
nRTpV = (12) where
p pressure [bar] V volume that the gas occupies [L] n amount of substance [mole] R gas constant [bar*L*K-1*mole-1] T temperature [K] For calculation of the produced biogas amount of substance, nbiogas, the following equations were used:
1
111 TR
Vpn
⋅⋅
= (13)
2
222 TR
Vpn
⋅⋅
= (14)
12 nnnbiogas −= (15)
where
n1 amount of substance at atmospheric pressure p1 the pressure at start and after each measurement (is assumed to be
1 atm) V: headspace (the volume of bottle above fluid suspension phase) T1 the temperature at start and at each measurement n2 amount of substance at time of measurement p2 the total pressure at time of measurement (measured pressure plus
atmospheric pressure) V2 headspace (the volume of bottle above fluid suspension phase,
same as V1) T2 the temperature at each measurement
The produced volume biogas, Vbiogas, was calculated according the ideal gas law as follows
biogas
biogasbiogasbiogas p
TRnV
⋅⋅= (16)
where
pbiogas is the pressure of the biogas (pbiogas = p2) Tbiogas is the temperature of the produced biogas (Tbiogas = T2)

47
The produced biogas was recalculated to normal pressure and temperature (0 oC and atmosphere pressure) according to equation 17
normal
normalbiogasnormalbiogas p
TRnV
⋅⋅=, (17)
where
Tnormal = 273.15 K pnormal = 1 atmosphere = 1.013 bar

48
APPENDIX 4. METHOD FOR METHANE ANALYSES Gas samples of 1 ml was taken from the bottles in the batch digestion test at each measurement and transferred to a 30 ml glass vial. When the samples were analysed with the gas chromatograph, three samples of 0.3 ml each were taken from the glass vials. The samples were manually injected to the gas chromatograph one by one (Chrompack CP 9001, column Hayesep-R 2.5 m x 1/8, FID-detector, carrier gas: He, flow 18 mL/min, temp injector: 125ºC). Mean values of three top areas from a sample were compared with top areas for known standards, achieved in corresponding way. The standards were prepared by diluting pure methane to known concentrations. The methane contents expressed in percent were achieved. For the last four measurements, a gas chromatograph with automatic injection was used (PerkinElmer ARNEL, Clarus 500, column: 7’ HayeSep N 60/80, 1/8” SF; FID detector 250 °C; carrier gas: Helium, flow 31 mL/min; temp injector: 60 °C. Headspace, sampler Turbo Matrix 110). Figure 18 below show an example of a calibration diagram which was prepared with known standards (10, 25, 50 and 100 %) and linear regression.
y = 813240.47x + 846127.75
0
20000000
40000000
60000000
80000000
100000000
0 20 40 60 80 100 120
Methane content [%]
Top
are
a
Figure 18. Calibration diagram prepared with known standards and linear regression.
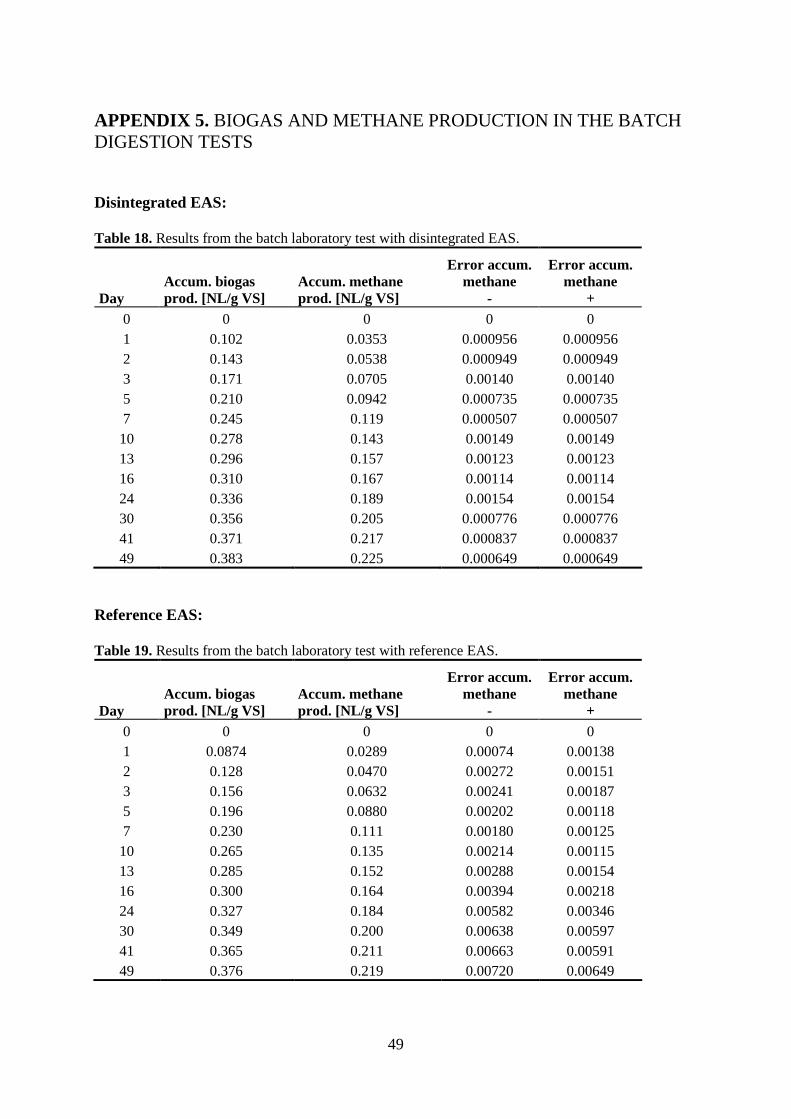
49
APPENDIX 5. BIOGAS AND METHANE PRODUCTION IN THE BATCH DIGESTION TESTS Disintegrated EAS: Table 18. Results from the batch laboratory test with disintegrated EAS.
Day Accum. biogas prod. [NL/g VS]
Accum. methane prod. [NL/g VS]
Error accum. methane
-
Error accum. methane
+ 0 0 0 0 0 1 0.102 0.0353 0.000956 0.000956 2 0.143 0.0538 0.000949 0.000949 3 0.171 0.0705 0.00140 0.00140 5 0.210 0.0942 0.000735 0.000735 7 0.245 0.119 0.000507 0.000507 10 0.278 0.143 0.00149 0.00149 13 0.296 0.157 0.00123 0.00123 16 0.310 0.167 0.00114 0.00114 24 0.336 0.189 0.00154 0.00154 30 0.356 0.205 0.000776 0.000776 41 0.371 0.217 0.000837 0.000837 49 0.383 0.225 0.000649 0.000649
Reference EAS: Table 19. Results from the batch laboratory test with reference EAS.
Day Accum. biogas prod. [NL/g VS]
Accum. methane prod. [NL/g VS]
Error accum. methane
-
Error accum. methane
+ 0 0 0 0 0 1 0.0874 0.0289 0.00074 0.00138 2 0.128 0.0470 0.00272 0.00151 3 0.156 0.0632 0.00241 0.00187 5 0.196 0.0880 0.00202 0.00118 7 0.230 0.111 0.00180 0.00125 10 0.265 0.135 0.00214 0.00115 13 0.285 0.152 0.00288 0.00154 16 0.300 0.164 0.00394 0.00218 24 0.327 0.184 0.00582 0.00346 30 0.349 0.200 0.00638 0.00597 41 0.365 0.211 0.00663 0.00591 49 0.376 0.219 0.00720 0.00649

50
Disintegrated EAS and primary sludge mixed: Table 20. Results from the batch laboratory test with disintegrated EAS mixed with primary sludge.
Day Accum. biogas prod. [NL/g VS]
Accum. methane prod. [NL/g VS]
Error accum. methane
-
Error accum. methane
+ 0 0 0 0 0 1 0.133 0.0475 0.00377 0.00297 2 0.237 0.0966 0.00312 0.00271 3 0.298 0.133 0.00351 0.00611 5 0.363 0.174 0.00442 0.00623 7 0.414 0.207 0.00544 0.00851 10 0.461 0.237 0.00704 0.0116 13 0.487 0.256 0.00796 0.0131 16 0.505 0.269 0.00930 0.0162 24 0.534 0.292 0.0113 0.0212 30 0.560 0.312 0.0125 0.0248 41 0.580 0.326 0.0150 0.0238 49 0.590 0.332 0.0158 0.0249
Reference EAS and primary sludge mixed: Table 21. Results from the batch laboratory test with reference EAS mixed with primary sludge.
Day Accum. biogas prod. [NL/g VS]
Accum. methane prod. [NL/g VS]
Error accum. methane
-
Error accum. methane
+ 0 0 0 0 0 1 0.139 0.0461 0.00716 0.00601 2 0.242 0.0930 0.00601 0.00571 3 0.310 0.133 0.00340 0.00493 5 0.378 0.177 0.00271 0.00355 7 0.429 0.209 0.00351 0.00539 10 0.474 0.239 0.00288 0.00539 13 0.503 0.259 0.00419 0.00596 16 0.522 0.274 0.00546 0.00573 24 0.552 0.296 0.00734 0.00508 30 0.576 0.316 0.0113 0.00743 41 0.599 0.331 0.0142 0.0142 49 0.614 0.338 0.0163 0.0174

51
APPENDIX 6. CALCULATION PROCEDURE FOR DETERMINING DIFFERENT RETENTION TIMES EFFECT ON THE GAS PRODUCTION IN DIGESTER The calculation was based on data from the batch laboratory digestion test with reference EAS mixed with primary sludge. The substrate composition in this test was considered similar to the composition of the substrates in the real digesters at Henriksdal WWTP. The batch digestion test gave the substrate potential for methane production. However, it only gave limited information of the substrate actual performance in a continuous totally mixed process with a limited hydraulic retention time. Therefore, the degree of degradation in a continuous totally mixed process was theoretically calculated based on the result from the batch test. Calculations were performed using different hydraulic retention times. The theory for calculation of the degree of degradation in a continuous totally mixed process, based on data from a batch digestion test, is described in step 1-6 below. The theory was provided by Ph. D. Daniel Hellström, Head of Development & Investment Wastewater Treatment Dept.
1. The degree of degradation was assumed to follow the gas production in the batch digestion test. The total gas production after 49 days was assumed to be the maximum possible gas production. Therefore, the maximal degree of degradation was assumed to be reached after 49 days. The maximum degree of degradation (DDmax) was determined out of the result from the batch digestion test.
DDmax = 0COD
CODmethane (18)
where CODmethane g COD transformed to methane gas in the batch digestion test COD0 g COD added at the start of the batch digestion test
2. The share of maximum degree of degradation reached after t days was expressed as
DDshare of max(t) = max
)(
DD
tDD =
max
)(
G
tG (19)
where DD(t) degree of degradation after t days G(t) gas production after t days Gmax maximum gas production
3. The digester was assumed to be totally mixed. A given amount of inert substance
added at time t = 0 days was then washed out from digester according to
Concentration = C(t) = C0 e(-t/θ) (20)

52
where C0 = start concentration θ = mean retention time = Volume/mean flow = V/Q
4. Therefore, the amount of substrate that have passed the digester after t days was
defined by
M(t) = ∫ ⋅ )(tCQ dt = ∫ ⋅ )(tCV
θ dt (21)
The amount of substrate that have passed the digester after t days expressed as a share of one volume unit in the digester, S(t), was [assumed watersubstrate ρρ = , ρ : density]
S(t) = ∫ ⋅ )(1
tCθ
dt
3
3
m
m (22)
5. The share of maximum degree of degradation reached, for the total amount of
substrate after passed through the digester, was calculated according to
DDshare of max, total = ∫ ⋅)(tS DDshare of max(t) dt when t goes to infinity (23)
6. The degree of degradation for the total amount of substrate, DDtotal, was calculated
according to:
DDtotal = DDshare of max, total * DDmax (24)
Missing values for days in between the measuring points from the batch test were estimated by linear interpolation. The laboratory digestion test was performed without continuously mixing. However, Borggren (2007) showed that the degradation in a batch laboratory test was approximately twice as fast with continuously mixing compared to tests without mixing. Therefore, since the real digesters are totally mixed, calculations were performed with values corresponding to the assumption that the degradation should been twice as fast in the real digesters as in the batch test. The calculations were performed in Excel.

53
APPENDIX 7. ON-LINE CURRENT MEASUREMENT