evaluation of a proposal for reliable low-cost grid power ... · evaluation of a proposal for...
TRANSCRIPT
Evaluation of a proposal for reliable low-cost gridpower with 100% wind, water, and solarChristopher T. M. Clacka,b,1,2, Staffan A. Qvistc, Jay Aptd,e, Morgan Bazilianf, Adam R. Brandtg, Ken Caldeirah,Steven J. Davisi, Victor Diakovj, Mark A. Handschyb,k, Paul D. H. Hinesl, Paulina Jaramillod, Daniel M. Kammenm,n,o,Jane C. S. Longp,3, M. Granger Morgand, Adam Reedq, Varun Sivaramr, James Sweeneys,t, George R. Tynanu,David G. Victorv,w, John P. Weyants,t, and Jay F. Whitacred
aEarth System Research Laboratory, National Oceanic and Atmospheric Administration, Boulder, CO 80305; bCooperative Institute for Research inEnvironmental Sciences, University of Colorado, Boulder, CO 80305; cDepartment of Physics and Astronomy, Uppsala University, 752 37 Uppsala, Sweden;dDepartment of Engineering and Public Policy, Carnegie Mellon University, Pittsburgh, PA 15213; eTepper School of Business, Carnegie Mellon University,Pittsburgh, PA 15213; fCenter for Global Energy Policy, Columbia University, New York, NY 10027; gDepartment of Energy Resources Engineering, StanfordUniversity, Stanford, CA 94305; hDepartment of Global Ecology, Carnegie Institution for Science, Stanford, CA 94305; iDepartment of Earth System Science,University of California, Irvine, CA 92697; jOmni Optimum, Evergreen, CO 80437; kEnduring Energy, LLC, Boulder, CO 80303; lElectrical Engineering andComplex Systems Center, University of Vermont, Burlington, VT 05405; mEnergy and Resources Group, University of California, Berkeley, CA 94720;nGoldman School of Public Policy, University of California, Berkeley, CA 94720; oRenewable and Appropriate Energy Laboratory, University of California,Berkeley, CA 94720-3050; pLawrence Livermore National Laboratory, Livermore, CA 94550; qRenewable and Sustainable Energy Institute, University ofColorado, Boulder, CO 80305; rCouncil on Foreign Relations, New York, NY 10065; sPrecourt Energy Efficiency Center, Stanford University, Stanford, CA94305-4206; tManagement Science and Engineering Department, Huang Engineering Center, Stanford University, Stanford, CA 94305; uDepartment ofMechanical and Aerospace Engineering, Jacobs School of Engineering, University of California, San Diego, La Jolla, CA 92093; vSchool of Global Policyand Strategy, University of California, San Diego, La Jolla, CA 92093; and wBrookings Institution, Washington, DC 20036
Edited by B. L. Turner, Arizona State University, Tempe, AZ, and approved February 24, 2017 (received for review June 26, 2016)
A number of analyses, meta-analyses, and assessments, includingthose performed by the Intergovernmental Panel on ClimateChange, the National Oceanic and Atmospheric Administration,the National Renewable Energy Laboratory, and the InternationalEnergy Agency, have concluded that deployment of a diverseportfolio of clean energy technologies makes a transition toa low-carbon-emission energy system both more feasible andless costly than other pathways. In contrast, Jacobson et al.[Jacobson MZ, Delucchi MA, Cameron MA, Frew BA (2015) ProcNatl Acad Sci USA 112(49):15060–15065] argue that it is feasibleto provide “low-cost solutions to the grid reliability problem with100% penetration of WWS [wind, water and solar power] acrossall energy sectors in the continental United States between 2050and 2055”, with only electricity and hydrogen as energy carriers.In this paper, we evaluate that study and find significant short-comings in the analysis. In particular, we point out that this workused invalid modeling tools, contained modeling errors, and madeimplausible and inadequately supported assumptions. Policy mak-ers should treat with caution any visions of a rapid, reliable, andlow-cost transition to entire energy systems that relies almostexclusively on wind, solar, and hydroelectric power.
energy systems modeling | climate change | renewable energy |energy costs | grid stability
Anumber of studies, including a study by one of us, have con-cluded that an 80% decarbonization of the US electric grid
could be achieved at reasonable cost (1, 2). The high level ofdecarbonization is facilitated by an optimally configured con-tinental high-voltage transmission network. There seems to besome consensus that substantial amounts of greenhouse gas(GHG) emissions could be avoided with widespread deploymentof solar and wind electric generation technologies along withsupporting infrastructure.
Furthermore, it is not in question that it would be theoret-ically possible to build a reliable energy system excluding allbioenergy, nuclear energy, and fossil fuel sources. Given unlim-ited resources to build variable energy production facilities, whileexpanding the transmission grid and accompanying energy stor-age capacity enormously, one would eventually be able to meetany conceivable load. However, in developing a strategy to effec-tively mitigate global energy-related CO2 emissions, it is criticalthat the scope of the challenge to achieve this in the real world isaccurately defined and clearly communicated.
Wind and solar are variable energy sources, and some waymust be found to address the issue of how to provide energy iftheir immediate output cannot continuously meet instantaneousdemand. The main options are to (i) curtail load (i.e., modify orfail to satisfy demand) at times when energy is not available, (ii)deploy very large amounts of energy storage, or (iii) provide sup-plemental energy sources that can be dispatched when needed. Itis not yet clear how much it is possible to curtail loads, especiallyover long durations, without incurring large economic costs.There are no electric storage systems available today that can
Author contributions: C.T.M.C. and K.C. designed research; C.T.M.C. and S.A.Q. per-formed research; C.T.M.C., S.A.Q., and K.C. analyzed data; and C.T.M.C., S.A.Q., J.A.,M.B., A.R.B., K.C., S.J.D., V.D., M.A.H., P.D.H.H., P.J., D.M.K., J.C.S.L., M.G.M., A.R., V.S.,J.S., G.R.T., D.G.V., J.P.W., and J.F.W. wrote the paper.
Conflict of interest statement: The authors declare no conflict of interest, and with theexception of S.A.Q., none received support from sources other than normal salary fromtheir employers for work on the preparation of this paper. With the exception of M.B.and J.C.S.L., all of the authors have recently received outside support for more generalresearch on energy systems and renewable energy. C.T.M.C. received support in the pastfrom NOAA. S.A.Q. was supported for analysis that supported this paper by the RodelFoundation of Delaware and has received more general faculty funding from UppsalaUniversity. J.A. and M.G.M. have received support from the National Science Foundation(NSF), EPRI, the Doris Duke Charitable Foundation, and members of the Carnegie MellonElectricity Industry Center. A.R.B. has received support from the California Air ResourcesBoard, the Carnegie Endowment for International Peace, Argonne National Laboratory,Sandia National Laboratory, NREL, Ford Motor Company, and Saudi Aramco. K.C. hasreceived support from the Carnegie Institution for Science endowment and the Fund forInnovative Climate and Energy Research. S.J.D. has received support from the NSF. V.D.has received support from NREL. M.A.H. has received support from the NSF and DOE.P.D.H.H. has received support from the NSF and DOE. P.J. has received support from theNSF, EPA, and NOAA. D.M.K. has received support from the NSF and the Zaffaroni andKarsten Family Foundations. A.R. has received support from the NSF. V.S. has receivedsupport from the Sloan Foundation. J.S. has received funding from Jay Precourt, BloomEnergy, EPA, ExxonMobil Corporation, California Energy Commission, and DOE. G.R.T. hasreceived support from DOE and the University of California, San Diego (UC San Diego)Deep Decarbonization Initiative. D.G.V. has received support from EPRI, the UC San DiegoDeep Decarbonization Initiative, and the Brookings Institution. J.P.W. has received sup-port from DOE, EPA, and industry affiliates of the Energy Modeling Forum. J.F.W. hasreceived support from the NSF, DOE, DOD, Toyota, and Aquion Energy.
This article is a PNAS Direct Submission.
Freely available online through the PNAS open access option.
1To whom correspondence should be addressed. Email: [email protected].
2Present address: Vibrant Clean Energy, LLC, Erie, CO 80516.3Retired.
This article contains supporting information online at www.pnas.org/lookup/suppl/doi:10.1073/pnas.1610381114/-/DCSupplemental.
6722–6727 | PNAS | June 27, 2017 | vol. 114 | no. 26 www.pnas.org/cgi/doi/10.1073/pnas.1610381114
SUST
AIN
ABI
LITY
SCIE
NCE
ENV
IRO
NM
ENTA
LSC
IEN
CES
Significance
Previous analyses have found that the most feasible routeto a low-carbon energy future is one that adopts a diverseportfolio of technologies. In contrast, Jacobson et al. (2015)consider whether the future primary energy sources for theUnited States could be narrowed to almost exclusively wind,solar, and hydroelectric power and suggest that this can bedone at “low-cost” in a way that supplies all power witha probability of loss of load “that exceeds electric-utility-industry standards for reliability”. We find that their analy-sis involves errors, inappropriate methods, and implausibleassumptions. Their study does not provide credible evidencefor rejecting the conclusions of previous analyses that point tothe benefits of considering a broad portfolio of energy systemoptions. A policy prescription that overpromises on the bene-fits of relying on a narrower portfolio of technologies optionscould be counterproductive, seriously impeding the move to acost effective decarbonized energy system.
affordably and dependably store the vast amounts of energyneeded over weeks to reliably satisfy demand using expandedwind and solar power generation alone. These facts have led manyUS and global energy system analyses (1–10) to recognize theimportance of a broad portfolio of electricity generation technolo-gies, including sources that can be dispatched when needed.
Faults with the Jacobson et al. AnalysesJacobson et al. (11) along with additional colleagues in a com-panion article (12) attempt to show the feasibility of supplyingall energy end uses (in the continental United States) with almostexclusively wind, water, and solar (WWS) power (no coal, naturalgas, bioenergy, or nuclear power), while meeting all loads, at rea-sonable cost. Ref. 11 does include 1.5% generation from geother-mal, tidal, and wave energy. Throughout the remainder of thepaper, we denote the scenarios in ref. 11 as 100% wind, solar,and hydroelectric power for simplicity. Such a scenario may bea useful way to explore the hypothesis that it is possible to meetthe challenges associated with reliably supplying energy acrossall sectors almost exclusively with large quantities of a narrowrange of variable energy resources. However, there is a differ-ence between presenting such visions as thought experiments andasserting, as the authors do, that rapid and complete conversionto an almost 100% wind, solar, and hydroelectric power systemis feasible with little downside (12). It is important to understandthe distinction between physical possibility and feasibility in thereal world. To be clear, the specific aim of the work by Jacobsonet al. (11) is to provide “low-cost solutions to the grid reliabilityproblem with 100% penetration of WWS [wind, water and solarpower] across all energy sectors in the continental United Statesbetween 2050 and 2055.”
Relying on 100% wind, solar, and hydroelectric power couldmake climate mitigation more difficult and more expensive thanit needs to be. For example, the analyses by Jacobson et al. (11,12) exclude from consideration several commercially availabletechnologies, such as nuclear and bioenergy, that could poten-tially contribute to decarbonization of the global energy system,while also helping assure high levels of reliability in the powergrid. Furthermore, Jacobson et al. (11, 12) exclude carbon cap-ture and storage technologies for fossil fuel generation. An addi-tional option not considered in the 100% wind, solar, and hydro-electric studies is bioenergy coupled with carbon capture andstorage to create negative emissions within the system, whichcould help with emissions targets. With all available technologiesat our disposal, achieving an 80% reduction in GHG emissionsfrom the electricity sector at reasonable costs is extremely chal-lenging, even using a new continental-scale high-voltage trans-
mission grid. Decarbonizing the last 20% of the electricity sec-tor as well as decarbonizing the rest of the economy that is diffi-cult to electrify (e.g., cement manufacture and aviation) are evenmore challenging. These challenges are deepened by placing con-straints on technological options.
In our view, to show that a proposed energy system is tech-nically and economically feasible, a study must, at a minimum,show, through transparent inputs, outputs, analysis, and validatedmodeling (13), that the required technologies have been com-mercially proven at scale at a cost comparable with alternatives;that the technologies can, at scale, provide adequate and reliableenergy; that the deployment rate required of such technologiesand their associated infrastructure is plausible and commensuratewith other historical examples in the energy sector; and that thedeployment and operation of the technologies do not violate envi-ronmental regulations. We show that refs. 11 and 12 do not meetthese criteria and, accordingly, do not show the technical, prac-tical, or economic feasibility of a 100% wind, solar, and hydro-electric energy vision. As we detail below and in SI Appendix,ref. 11 contains modeling errors; incorrect, implausible, and/orinadequately supported assumptions; and the application ofmethods inappropriate to the task. In short, the analysis per-formed in ref. 11 does not support the claim that such a systemwould perform at reasonable cost and provide reliable power.
The vision proposed by the studies in refs. 11 and 12 nar-rows generation options but includes a wide range of currentlyuncosted innovations that would have to be deployed at largescale (e.g., replacement of our current aviation system with yet-to-be-developed hydrogen-powered planes). The system in ref.11 assumes the availability of multiweek energy storage systemsthat are not yet proven at scale and deploys them at a capac-ity twice that of the entire United States’ generating and stor-age capacity today. There would be underground thermal energystorage (UTES) systems deployed in nearly every community toprovide services for every home, business, office building, hospi-tal, school, and factory in the United States. However, the anal-ysis does not include an accounting of the costs of the physicalinfrastructure (pipes and distribution lines) to support these sys-tems. An analysis of district heating (14) showed that havingexisting infrastructure is key to effective deployment, because thehigh upfront costs of the infrastructure are prohibitive.
It is not difficult to match instantaneous energy demands forall purposes with variable electricity generation sources in realtime as needed to assure reliable power supply if one assumes,as the authors of the ref. 11 do, that there exists a nationallyintegrated grid, that most loads can be flexibly shifted in time,that large amounts of multiweek and seasonal energy storagewill be readily available at low cost, and that the entire econ-omy can easily be electrified or made to use hydrogen. How-ever, adequate support for the validity of these assumptions islacking. Furthermore, the conclusions in ref. 11 rely heavily onfree, nonmodeled hydroelectric capacity expansion (adding tur-bines that are unlikely to be feasible without major reconstruc-tion of existing facilities) at current reservoirs without consid-eration of hydrological constraints or the need for additionalsupporting infrastructure (penstocks, tunnels, and space); mas-sive scale-up of hydrogen production and use; unconstrained,nonmodeled transmission expansion with only rough cost esti-mates; and free time-shifting of loads at large scale in response tovariable energy provision. None of these are going to be achievedwithout cost. Some assumed expansions, such as the hydroelec-tric power output, imply operating facilities way beyond exist-ing constraints that have been established for important environ-mental reasons. Without these elements, the costs of the energysystem in ref. 11 would be substantially higher than claimed.
In evaluating the 100% wind, solar, and hydroelectric powersystem (11), we focus on four major issues that are explored in
Clack et al. PNAS | June 27, 2017 | vol. 114 | no. 26 | 6723

more detail below and in SI Appendix. (i) We note several mod-eling errors presented in ref. 11 that invalidate the results in thestudies, particularly with respect to the amount of hydropoweravailable and the demand response of flexible loads (SI Appendix,section S1). (ii) We examine poorly documented and implausibleassumptions, including the cost and scalability of storage tech-nologies, the use of hydrogen fuels, lifecycle assessments of tech-nologies, cost of capital and capacity factors of existing technolo-gies, and land use (SI Appendix, section S2). (iii) We discuss thestudies’ lack of electric power system modeling of transmission,reserve margins, and frequency response, despite claims of sys-tem reliability (SI Appendix, section S3). (iv) Finally, we arguethat the climate/weather model used for estimates of wind andsolar energy production has not shown the ability to accuratelysimulate wind speeds or solar insolation at the scales neededto assure the technical reliability of an energy system relying soheavily on intermittent energy sources (SI Appendix, section S4).
Modeling ErrorsAs we detail in SI Appendix, section S1, ref. 11 includes severalmodeling mistakes that call into question the conclusions of thestudy. For example, the numbers given in the supporting infor-mation of ref. 11 imply that maximum output from hydroelectricfacilities cannot exceed 145.26 GW (SI Appendix, section S1.1),about 50% more than exists in the United States today (15), butfigure 4B of ref. 11 (Fig. 1) shows hydroelectric output exceeding1,300 GW. Similarly, as detailed in SI Appendix, section S1.2, thetotal amount of load labeled as flexible in the figures of ref. 11 ismuch greater than the amount of flexible load represented in theirsupporting tabular data. In fact, the flexible load used by LOAD-MATCH is more than double the maximum possible value fromtable 1 of ref. 11. The maximum possible from table 1 of ref. 11 isgiven as 1,064.16 GW, whereas figure 3 of ref. 11 shows that flexi-ble load (in green) used up to 1,944 GW (on day 912.6). Indeed, inall of the figures in ref. 11 that show flexible load, the restrictionsenumerated in table 1 of ref. 11 are not satisfied.
In the analysis in ref. 11, the flexible loads can be accumu-lated in 8-h blocks, which raises a serious issue of extreme excessindustrial/commercial/residential capacity to use the high powerfor short periods of time. Under these assumptions, there wouldneed to be oversized facilities on both the demand and gen-eration sides to compensate for their respective variabilities.These errors are critical, because the conclusions reached in ref.11 depend on the availability of large amounts of dispatchableenergy and a large degree of flexibility in demand. Ref. 11 alsoincludes a scenario where zero demand response is allowed, andit shows that there is almost no cost changes and that the grid isstill stable. Thus, there can be no cost associated with demandresponse (on either the supply or the consumption side); other-wise, there would be substantial changes in final costs caused bythe complete reconfiguring of the US economy schedule.
Implausible AssumptionsThe conclusions contained in ref. 11 rely on a number ofunproven technologies and poorly substantiated assumptions as
Fig. 1. This figure (figure 4B from ref. 11) shows hydropower supply ratespeaking at nearly 1,300 GW, despite the fact that the proposal calls for lessthan 150 GW hydropower capacity. This discrepancy indicates a major errorin their analysis. Modified from ref. 11.
detailed in SI Appendix, section S2. In summary, the reliabil-ity of the proposed 100% wind, solar, and hydroelectric powersystem depends centrally on a large installed capacity of sev-eral different energy storage systems (11), collectively allowingtheir model to flexibly reshape energy demand to match theoutput of variable electricity generation technologies. The study(11) assumes a total of 2,604 GW4 of storage charging capac-ity, more than double the entire current capacity of all powerplants in the United States (16). The energy storage capacity con-sists almost entirely of two technologies that remain unprovenat any scale: 514.6 TWh of UTES (the largest UTES facilitytoday is 0.0041 TWh) (additional discussion is in SI Appendix,section S2.1) and 13.26 TWh of phase change materials (PCMs;effectively in research and demonstration phase) (additional dis-cussion is in SI Appendix, section S2.2) coupled to concentrat-ing solar thermal power (CSP). To give an idea of scale, the100% wind, solar, and hydroelectric power system proposed inref. 11 envisions UTES systems deployed in nearly every com-munity for nearly every home, business, office building, hospital,school, and factory in the United States, although only a handfulexist today.
Although both PCM and UTES are promising resources, nei-ther technology has reached the level of technological maturityto be confidently used as the main underpinning technology ina study aiming to show the technical reliability and feasibility ofan energy system. The relative immaturity of these technologiescannot be reconciled with the authors’ assertion that the solu-tions proposed in ref. 11 and companion papers are ready to beimplemented today at scale at low cost and that there are no tech-nological or economical hurdles to the proposed system.5
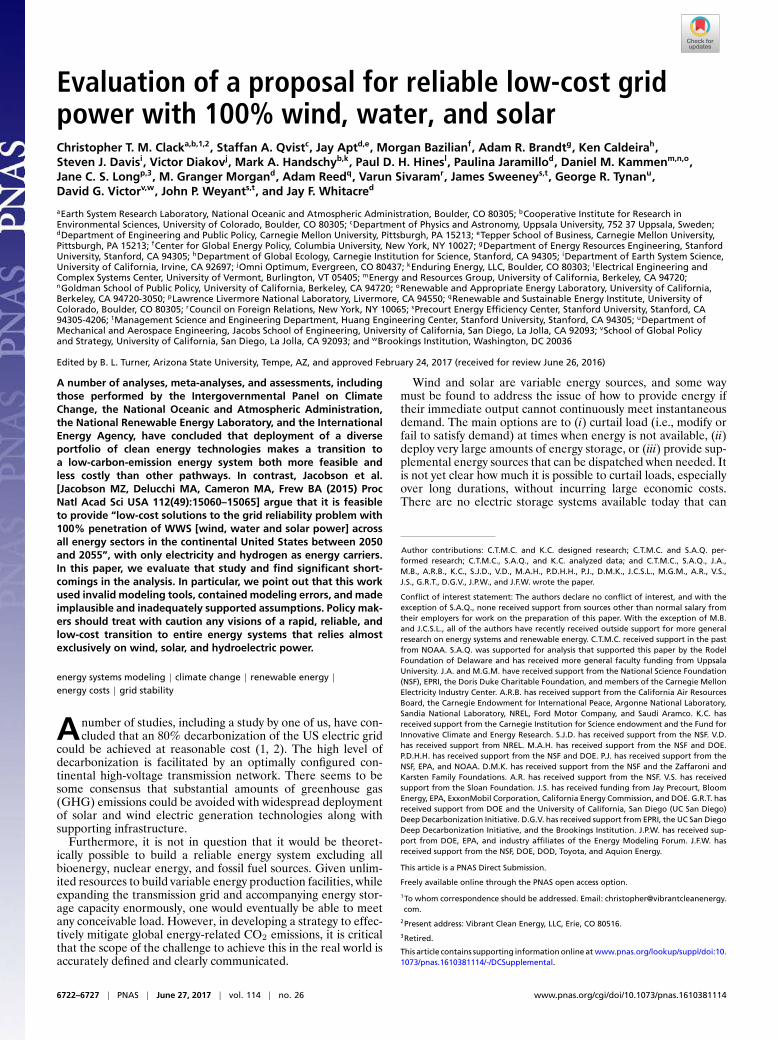
The 100% wind, solar, and hydroelectric power system study(11) also makes unsupported assumptions about widespreadadoption of hydrogen as an energy carrier, including the con-version of the aviation and steel industries to hydrogen and theability to store in hydrogen an amount of energy equivalent tomore than 1 month of current US electricity consumption. Fur-thermore, in figure S6 of ref. 11, hydrogen is being produced at apeak rate consuming nearly 2,000 GW of electricity, nearly twicethe current US electricity-generating capacity. As detailed in SIAppendix, section S2.3, the costs and feasibility of this transitionto a hydrogen economy are not appropriately accounted for byref. 11. To show the scale of the additional capacities that aredemanded in refs. 11 and 12, we plot them along with the elec-tricity generation capacity in 2015 in Fig. 2. The data used forFig. 2 can be found in Datasets S1 and S2.
Refs. 11 and 12 cite each other about the values of capacity.For example, ref. 12, which supposedly includes information forall 50 states, reports table S2 in ref. 11 as the source of the num-bers. Then, ref. 11, which only includes information for the ca-pacity in the 48 contiguous states, cites table 2 in ref. 12 as thesource of the values. The values in the two papers do not agree,presumably because of the difference in the number of statesincluded, and therefore, it is unclear how each reference can bethe source of the values for the other one. Additionally, ref. 11assumes that 63% of all energy-intensive industrial demand is
4Table S1 in ref. 11 shows non-UTES storage of 1,065 GW, UTES electric storage of 1,072GW, and UTES thermal storage of 467 GW. In ref. 11, there is no description of howLOADMATCH differentiates energy types.
5In ref. 12, the authors state that “100% conversions [to WWS energy systems] are tech-nically and economically feasible with little downside . . . Numerous low-cost solutionsare found, suggesting that maintaining grid reliability upon 100% conversion to WWSis economically feasible and not a barrier to the conversion [to a 100% WWS system] . . .We do not believe a technical or economic barrier exists to ramping up production ofWWS technologies. Based on the scientific results presented, current barriers to imple-menting the [100% WWS] roadmaps are neither technical nor economic.” In January of2016, Jacobson (16) said that “[o]ur goal is to get to 80% by 2030 and 100% by 2050. Itis certainly technically and economically practical.”
6724 | www.pnas.org/cgi/doi/10.1073/pnas.1610381114 Clack et al.
SUST
AIN
ABI
LITY
SCIE
NCE
ENV
IRO
NM
ENTA
LSC
IEN
CES
101 74 14
980
0 23
1,1921,300
2,449
3,797
55
2,000
2,604
12,205
0
500
1000
1500
2000
2500
3000
3500
4000
Hydroelectric Wind Solar Other Hydrogen Production
Storage Total Capacity
Inst
alle
d C
ap
aci
ty (G
W)
13x
33x
271x
18x
inf.
113x
10x
Fig. 2. Installed capacity values for 2015 (left column in each pair) andthose used in the studies in refs. 11 and 12 (right column in each pair). These100% wind, solar, and hydroelectric studies propose installing technologiesat a scale equivalent to (or substantially greater than) the entire capacity ofthe existing electricity generation infrastructure. The other category includescoal, natural gas, and nuclear, all of which are removed by 2050.
flexible: able to reschedule all energy inputs within an 8-h win-dow. As discussed in SI Appendix, section S2.4, and the NationalResearch Council’s “Real Prospects for Energy Efficiency in theUnited States,” (17) it is infeasible for many industrial energydemands to be rapidly curtailed.
Similarly, ref. 11 assumes that the capacity factor (i.e., actualelectricity generation divided by the theoretically maximumpotential generation obtained by operating continuously at fullnameplate capacity) for existing energy technologies will increasedramatically in the future. As described in SI Appendix, sectionS2.5, the authors of ref. 11 anticipate that individual hydropowerfacilities will increase generation by over 30%. They explain this bysaying, “[i]ncreasing the capacity factor is feasible because exist-ing dams currently provide much less than their maximum capac-ity, primarily due to an oversupply of energy available from fossilfuel sources, resulting in less demand for hydroelectricity” (12).From ref. 12, it is stated that hydroelectric and geothermal capac-ity factors increase, because “[f]or geothermal and hydropower,which are less variable on short time scales than wind and solar,the capacity-factor multipliers in our analysis are slightly greaterthan 100% on account of these being used more steadily in a 100%WWS system than in the base year.” In addition to being incon-sistent with their statement that hydropower is “used only as alast resort” (11), this explanation shows a fundamental misunder-standing of the operation of electricity markets and the factorsdetermining hydroelectric supply. With near-zero marginal costs(free “fuel”), hydroelectric generators will essentially run when-ever they are available; in those instances where they participatein merchant markets, they underbid fossil generators that must atleast recover their coal or natural gas costs. The primary factorlimiting hydroelectric capacity factor is water supply and environ-mental constraints, not lack of demand. Furthermore, there seemsto be a mistake with the hydroelectric capacity factor adjustment:from EIA, it should only go up to 42%, not 52.5%.6
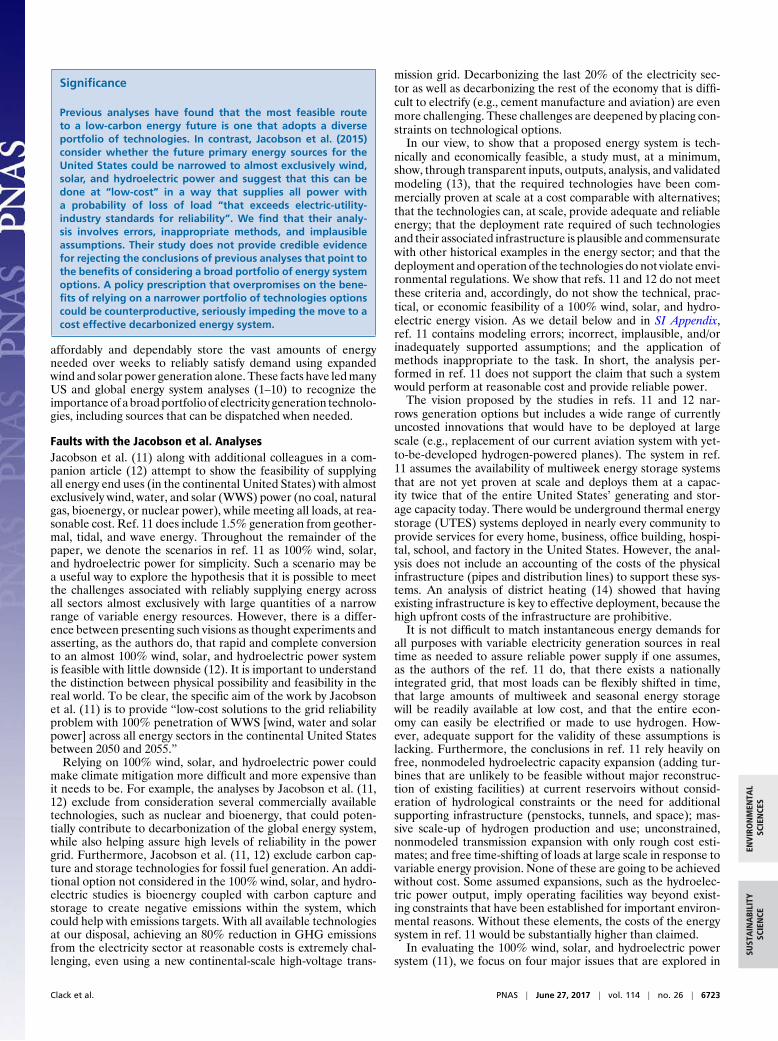
To illustrate the implausibility of the assumed increase inhydroelectric net generation (dispatched from the plants to theelectricity grid) in the face of limited water supply, we plot inFig. 3 the last 25 y of generation from hydropower in the UnitedStates along with the average for the studies in refs. 11 and 12.The data used for Fig. 3 can be found in Datasets S1 and S2.Average future generation assumed by refs. 11 and 12 is 13%higher than the highest peak year in the last 25 y and 85% higherthan the minimum year in the last 25 y. Therefore, in additionto needing 1,300 GW of peak power from 150 GW of capacity,there also needs to be an extra 120 TWh of hydroelectric gener-
6Excel spreadsheets from refs. 11 and 12, Tab EIA capacity factors 2011–2075 are atweb.stanford.edu/group/efmh/jacobson/Articles/I/USStates.xlsx.
ation on top of the 280 TWh available. Additional difficulties inraising hydropower capacity factors are described in SI Appendix,section S2.5.
Most of the technologies considered in ref. 11 have high cap-ital costs but relatively low operating costs. As a result, the costof capital is a primary cost driver in the vision contained in ref.11. As discussed in SI Appendix, section S2.7, the baseline valuefor cost of capital in ref. 11 is one-half to one-third of that usedby most other studies. The 100% wind, solar, and hydroelectricenergy system studies (11, 12) provide little evidence that the lowcost of capital assumed in their study could be obtained by realinvestors in the capital markets. Using more realistic discountrates of 6–9% per year instead of the 3–4.5% used in ref. 11 coulddouble the estimate of a cost of 11 cents/kWh of electricity to22 cents/kWh, even before adding in the unaccounted for capitalcosts described above. One possible explanation of the lower dis-count rates used could be that they forecast lower (or negative)growth in domestic product. In the case of lower growth, therewould likely be lower interest rates; however, that lower growthmay also lead to lower energy demand and investment.
One of the global leaders of solar PV and wind energy instal-lation in recent years is Germany, which through its “Energie-wende,” is attempting to shift toward an 80% renewables energysystem. Germany, therefore, presents a suitable example againstwhich to benchmark the feasibility of the plan set out in ref. 11for the United States. In SI Appendix, section S2.8, we describehow ref. 11 assumes that the United States will build out newsolar, wind, and hydroelectric facilities at a sustained rate that,on a per-unit gross domestic product basis, is 16 times greaterthan the average deployment rate in Germany’s Energiewendeinitiative during the years 2007–2014 and over 6 times greaterthan Germany achieved in the peak year of 2011 (SI Appendix,Fig. S4).
In Fig. 4, we display another metric on the scale of expan-sion. It shows the rate of installation as watts per year per capita.Using this metric, we can compare the scale of capacity expan-sion in ref. 11 with historical data. Fig. 4 shows that the plansproposed in refs. 11 and 12 would require a sustained installa-tion rate that is over 14 times the US average over the last 55 yand over 6 times the peak rate. For the sake of comparison, Fig.4 includes the estimated rate for a solution that decarbonizesthe US electric grid by 78% by 2030 (1), historical Germandata, and historical Chinese data. We note that ref. 1 consid-ered large-scale storage but excluded it based on preliminaryresults showing that it was not cost-effective compared with anational transmission system. The data used for Fig. 4 can befound in Datasets S1 and S2. Sustaining public support for thisscale of investment (and this scale of deployment of new windturbines, power lines, etc.) could prove challenging. One of thereasons that this buildout may prove difficult is that the 100%
200
225
250
275
300
325
350
375
400
425
1990 1995 2000 2005 2010 2015 2020 2025 2030 2035 2040 2045 2050
Ann
ual U
S H
ydro
elec
tric
Gen
era
tion
(TW
h)
Average over 25 years = 280.9 TWh
Jacobson et al. proposed average = 402.2 TWh
356.5 TWh
217.0 TWh
Increase of ~43%
Increase of ~85%
Increase of ~13%
Fig. 3. Historical and proposed hydroelectric generation per year. The his-torical data (www.eia.gov/todayinenergy/detail.php?id=2650) show gener-ation averaging 280.9 TWh/yr; generation proposed in ref. 11 is 402.2 TWh,13% higher than the 25-y historical maximum of 356.5 TWh (1997) and 85%higher than the historical minimum of 217 TWh (2001).
Clack et al. PNAS | June 27, 2017 | vol. 114 | no. 26 | 6725

0
200
400
600
800
1,000
1,200
1960 1965 1970 1975 1980 1985 1990 1995 2000 2005 2010 2015 2020 2025 2030 2035 2040 2045 2050
Ca
pa
city
Ad
diti
ons (
W /
y /
Ca
pita
)Historical (US)
100% wind, solar and hydroelectric (US)
Historical (Germany)
80% electricity (US)
Historical (China)
> 6x increase over US historical
maximum
> 14x increase over US
historical average
196% 15%
Coal and NuclearPeak
2nd NuclearPeak Natural Gas
Peak
Germany Solar PV Peak
Germany Wind Peak
Fig. 4. The historical rates of installed electric-generating capacity percapita (watts per year per capita) for China (blue), Germany (gray), andthe United States (black) are shown with the estimated values for the USproposals from the works by Jacobson et al. (11, 12) (red) and MacDonaldet al. (1) (green). It shows that the 100% wind, solar, and hydropower powerplan requires installation of new capacity at a rate more than an order ofmagnitude greater than that previously recorded in China, Germany, or theUnited States. The rate would have to be continued indefinitely because ofreplacing generation as it aged.
wind, solar, and hydroelectric system relies on energy sourceswith relatively low areal power density (additional details are inSI Appendix, section S2.9). According to NREL, average powerdensity achieved in land-based wind farms is about 3 W/m2, witha range of 1–11.2 W/m2 (although at larger deployment scales,power densities would likely be lower) (18). At the average powerdensities, the scale of wind power envisioned in ref. 11 wouldrequire nearly 500,000 km2 (134,000–1,500,000 km2), which isroughly 6% of the continental United States and >1,500 m2 ofland for wind turbines for each American. Much of this landcould be dual use, but the challenges associated with this level ofscale-up should not be underestimated. The proposed transitionin ref. 11 requires unprecedented rates of technology deploy-ment. For example, increased pressure on materials, elevatedcommodity prices, and high demand for wind power installationsproduced elevated prices for wind power deployment between2002 and 2008 (19, 20).
The rejection of many potential sources of low-carbon emissionenergy is based on an analysis presented by Jacobson in ref. 21. Afull discussion of that paper is beyond the scope of our evaluation.However, one flaw is its failure to use other numbers already pub-lished in detailed studies on lifecycle GHG emissions, land userequirements, and human mortality of energy production tech-nologies. Rather than using the results of the many detailed stud-ies available from large international bodies, such as those sur-veyed by the Intergovernmental Panel on Climate Change, ref.20 presents assessments that, in many cases, differ in method andgranularity to produce results that differ markedly from thosegenerally accepted in scientific and technical communities.
Selective assessments of lifecycle emissions can be used tofavor or disfavor specific technologies. As an example, the life-cycle GHG emissions for nuclear power generation in ref. 21include the emissions of the background fossil-based power sys-tem during an assumed planning and construction period for upto 19 y per nuclear plant.7 Added to these emissions, the effectsof a nuclear war, which is assumed to periodically reoccur on a30-y cycle, are included in the analysis of emissions and mortal-ity of civilian nuclear power.8 In contrast, those same authorsdo not consider emissions for the fossil-based power systemassociated with construction and permitting delays for offshore
7The five sources cited in ref. 12 give construction time estimates of 5–8 y.8In the almost 60 y of civilian nuclear power (two of the assumed war cycles), there have
been no nuclear exchanges. The existence of nuclear weapons does not depend on civilpower production from uranium.
wind farms (or the transmission infrastructure needed to connectthese farms), which have already been a challenge in the develop-ment of US offshore wind resources. Although there is extensiveexperience outside of the United States with developing offshorewind resources, very few offshore wind facilities have been per-mitted in US territorial waters. The 100% wind, solar, and hydro-electric power system (11) envisions more than 150,000 5-MWturbines permitted and built offshore without delays.
Insufficient Power System ModelingThe study of a 100% wind, solar, and hydroelectric power sys-tem (11) purports to report the results of a “grid integrationmodel.” It is important to understand the limitations of the studywith regard to what is usually meant by grid integration. Reli-able operation of the grid involves myriad challenges beyond justmatching total generation to total load. Its role in cascading fail-ures and blackouts illustrates the important role of the transmis-sion system (22). Reliable grid operation is further complicatedby its ac nature, with real and reactive power flows and the needto closely maintain a constant frequency (23). Margins for gener-ator failures must be provided through operational and planningreserves (24). The solution proposed by refs. 11 and 12 involvesfundamental shifts in aspects of grid architecture that are criticalto reliable operation. Wind generation, largely located far fromload centers, will require new transmission. Solar generation andonsite storage connected to the distribution grid replace capabil-ity currently connected to the more centralized transmission grid.Rotating machines with substantial inertia that is critical for fre-quency stability are supplanted by asynchronous wind and solargenerators.
Although a grid integration study is detailed and complex,the grid model of ref. 11 is spatially 0D; all loads, genera-tion (sited before the LOADMATCH runs and placed preciselywhere existing generation resides), and storage are summed ina single place. Therefore, those authors do not perform anymodeling or analysis of transmission. As a result, their analy-sis ignores transmission capacity expansion, power flow, and thelogistics of transmission constraints (SI Appendix, section S2.6).Similarly, those authors do not account for operating reserves,a fundamental constraint necessary for the electric grid. Indeed,LOADMATCH used in ref. 11 is a simplified representation ofelectric power system operations that does not capture require-ments for frequency regulation to ensure operating reliability(additional details are in SI Appendix, section S3).
Furthermore, the model is fully deterministic, implying perfectforesight about the electricity demand and the variability of windand solar energy resources and neglecting the effect of forecasterrors on reserve requirements (25). In a system where variablerenewable resources make up over 95% of the US energy supply,renewable energy forecast errors would be a significant sourceof uncertainty in the daily operation of power systems. TheLOADMATCH model does not show the technical ability of theproposed system from ref. 11 to operate reliably given the mag-nitude of the architectural changes to the grid and the degree ofuncertainty imposed by renewable resources.
Inadequate Scrutiny of Input Climate ModelThe climate model used to generate weather data in the workin ref. 11 has never been adequately evaluated. For example,results from this model have not been made available to theClimate Model Intercomparison Project (26) or opened to pub-lic inspection in ways similar to the results of major reanalysisprojects (27). As detailed in SI Appendix, section S4, the frag-mentary results that have been made available show poor corre-lation with reality in terms of resolution and accuracy. Becausethe conclusions from ref. 11 depend on the weather data used,their conclusions cannot be considered to be adequate withoutan appropriate evaluation of the weather data used.
6726 | www.pnas.org/cgi/doi/10.1073/pnas.1610381114 Clack et al.

SUST
AIN
ABI
LITY
SCIE
NCE
ENV
IRO
NM
ENTA
LSC
IEN
CES
ConclusionsMany previous studies of deep decarbonization of electric powerillustrate that much can be done with wind and solar power butthat it is extremely difficult to achieve complete decarbonizationof the energy system, even when using every current technologyand tool available, including energy efficiency and wind, hydro-electric, and solar energy as well as carbon capture and storage,bioenergy, and nuclear energy (1–6, 8–10). In contrast, ref. 11asserts that it is cost-effective to fully decarbonize the US energysystem primarily using just three inherently variable generatingtechnologies: solar PV, solar CSP, and wind, to supply more than95% of total energy in the proposal presented in ref. 11. Suchan extraordinarily constrained conclusion demands a standard ofproof that ref. 11 does not meet.
The scenarios of ref. 11 can, at best, be described as a poorlyexecuted exploration of an interesting hypothesis. The study’snumerous shortcomings and errors render it unreliable as a guideabout the likely cost, technical reliability, or feasibility of a 100%wind, solar, and hydroelectric power system. It is one thing toexplore the potential use of technologies in a clearly caveatedhypothetical analysis; it is quite another to claim that a modelusing these technologies at an unprecedented scale conclusivelyshows the feasibility and reliability of the modeled energy systemimplemented by midcentury.
From the information given by ref. 11, it is clear that bothhydroelectric power and flexible load have been modeled in erro-neous ways and that these errors alone invalidate the study andits results. The study of 100% wind, solar, and hydroelectricpower systems (11) extrapolates from a few small-scale instal-lations of relatively immature energy storage technologies toassume ubiquitous adoption of high-temperature PCMs for stor-age at concentrating solar power plants; UTES for heating, cool-ing, and refrigeration for almost every building in the UnitedStates; and widespread use of hydrogen to fuel airplanes, rail,shipping, and most energy-intensive industrial processes. For thecritical variable characteristics of wind and solar resources, thestudy in ref. 11 relies on a climate model that has not been inde-pendently scrutinized.
The authors of ref. 11 claim to have shown that their pro-posed system would be low cost and that there are no economicbarriers to the implementation of their vision (12). However,the modeling errors described above, the speculative nature ofthe terawatt-scale storage technologies envisioned, the theoret-ical nature of the solutions proposed to handle critical stabilityaspects of the system, and a number of unsupported assump-tions, including a cost of capital that is one-third to one-halflower than that used in practice in the real world, undermine thatclaim. Their LOADMATCH model does not consider aspects oftransmission power flow, operating reserves, or frequency regu-lation that would typically be represented in a grid model aimedat assessing reliability. Furthermore, as detailed above and in SIAppendix, a large number of costs and barriers have not beenconsidered in ref. 11.
Many researchers have been examining energy system transi-tions for a long time. Previous detailed studies have generallyfound that energy system transitions are extremely difficult andthat a broad portfolio of technological options eases that transi-tion. If one reaches a new conclusion by not addressing factorsconsidered by others, making a large set of unsupported assump-tions, using simpler models that do not consider important fea-tures, and then performing an analysis that contains critical mis-takes, the anomalous conclusion cannot be heralded as a newdiscovery. The conclusions reached by the study contained in ref.11 about the performance and cost of a system of “100% pene-tration of intermittent wind, water and solar for all purposes” arenot supported by adequate and realistic analysis and do not pro-vide a reliable guide to whether and at what cost such a transitionmight be achieved. In contrast, the weight of the evidence sug-gests that a broad portfolio of energy options will help facilitatean affordable transition to a near-zero emission energy system.
SI AppendixSI Appendix contains the details of this evaluation. Datasets S1and S2 contain data and calculations used to produce the fig-ures. Within the spreadsheet are the data sources and collationof data.
1. MacDonald AE, Clack CTM, Alexander A, Dunbar A, Wilczak J, Xie Y (2016) Futurecost-competitive electricity systems and their impact on US CO2 emissions. Nat ClimChang 6:526–531.
2. NREL (2012) Renewable Electricity Futures Study (National Renewable Energy Labo-ratory, Golden, CO), Tech Rep NREL/TP-6A20-52409.
3. Deep Decarbonization Pathways Project (2015) Pathways to Deep Decarbonization(Sustainable Development Solutions Network and Institute for Sustainable Develop-ment and International Relations, Paris).
4. Fawcett AA, Clarke LE, Weyant JP, eds, The EMF24 study on U.S. technology andclimate policy strategies. The Energy Journal. Available at https://web.stanford.edu/group/emf-research/docs/emf24/EMF 24.pdf. Accessed June 1, 2017.
5. Krey V, Luderer G, Clarke L, Kriegler E (2014) Getting from here to there – energy tech-nology transformation pathways in the EMF27 scenarios. Clim Change 123:369–382.
6. Williams JH, et al. (2012) The technology path to deep greenhouse gas emissions cutsby 2050: The pivotal role of electricity. Science 335:53–59.
7. Mileva A, Johnston J, Nelson JH, Kammen DM (2016) Power system balancing fordeep decarbonization of the electricity sector. Appl Energy 162:1001–1009.
8. IEA (2015) Energy Technology Perspectives 2015: Mobilising innovation to accelerateclimate action (International Energy Agency, Paris).
9. Energy and Research Partnership (2015) Managing Flexibility Whilst Decarbonisingthe GB Electricity System (Energy Research Partnership, London).
10. IPCC (2014) Climate Change 2014: Synthesis Report. Contribution of Working GroupsI, II and III to the Fifth Assessment Report of the Intergovernmental Panel on ClimateChange, eds Pachauri RK, Meyer LA (IPCC, Geneva).
11. Jacobson MZ, Delucchi MA, Cameron MA, Frew BA (2015) Low-cost solution to thegrid reliability problem with 100% penetration of intermittent wind, water, and solarfor all purposes. Proc Natl Acad Sci USA 112:15060–15065.
12. Jacobson MZ, et al. (2015) 100% clean and renewable wind, water, and sunlight(WWS) all-sector energy roadmaps for the 50 United States. Energy Environ Sci8:2093–2117.
13. Pfenninger S, DeCarolis J, Hirth L, Quoilin S, Staffell I (2017) The importance of opendata and software: Is energy research lagging behind? Energ Policy 101:211–215.
14. Reed A, McCartney JS (2015) The sun also rises: Prospects for solar district heating inthe United States. Albany Law J Sci Technol 25:165–211.
15. EIA (2014) Electric Power Annual (US Energy Information Administration, Washing-ton, DC), Table 4.3.
16. Blackwell R (2016) Can the world convert to total renewable energy by 2050?The Globe and Mail. Available at https://www.theglobeandmail.com/report-on-business/industry-news/energy-and-resources/can-the-world-convert-to-total-renewable-energy-by-2050/article27989205/. Accessed June 1, 2017.
17. National Academy of Sciences, National Academy of Engineering, and NationalResearch Council (2010) Real Prospects for Energy Efficiency in the United States(National Academies Press, Washington, DC).
18. Denholm P, Hand M, Jackson M, Ong S (2009) Land-Use Requirements of ModernWind Power Plants in the United States (National Renewable Energy Laboratory,Golden, CO), Tech Rep NREL/TP-6A2-45834.
19. Blanco MI (2009) The economics of wind energy. Renew Sustain Energ Rev 13:1372–1382.
20. Bolinger M, Wiser R (2011) Understanding Trends in Wind Turbine Prices Over thePast Decade (Lawrence Berkeley National Laboratory, Berkeley, CA), Rep LBNL-5119E.
21. Jacobson MZ (2009) Review of solutions to global warming, air pollution, and energysecurity. Energy Environ Sci 2:148–173.
22. Dobson I, Carreras BA, Lynch VE, Newman DE (2007) Complex systems analysis ofseries of blackouts: Cascading failure, critical points, and self-organization. Chaos17:026103.
23. Backhaus S, Chertkov M (2013) Getting a grip on the electrical grid. Phys Today 66:42–48.
24. Hirst E, Kirby B (1996) Electric-Power Ancillary Services (Oak Ridge National Labora-tory, Oak Ridge, TN), Tech Rep ORNL/CON-426.
25. Mauch B, Apt J, Carvalho PMS, Jaramillo P (2013) What day-ahead reserves areneeded in electric grids with high levels of wind power?. Environ Res Lett 8:034013.
26. Taylor KE, Stouffer RJ, Meehl GA (2012) An Overview of CMIP5 and the experimentdesign. Bull Am Meteorol Soc 93:485–498.
27. Dee D, Fasullo J, Shea D, Walsh J, NCAR Staff (2016) The Climate Data Guide: Atmo-spheric Reanalysis: Overview & Comparison Tables (National Center for AtmosphericResearch, Boulder, CO). Available at https://climatedataguide.ucar.edu/climate-data/atmospheric-reanalysis-overview-comparison-tables. Accessed June 1, 2017.
Clack et al. PNAS | June 27, 2017 | vol. 114 | no. 26 | 6727